Article

Viable and Agile Model for Improving the Quality Area in an Automotive Company in Mexico

by
Blanca Alhely Ceballos Chávez
1,
José Guillermo Takeo Nava
1,
Jesús Jaime Moreno Escobar
2,* and
Oswaldo Morales Matamoros
2
1
Escuela Superior de Ingeniería Mecánica y Eléctrica, Unidad Zacatenco, Instituto Politécnico Nacional, Ciudad de México 07738, Mexico
2
Centro de Investigación en Computación, Instituto Politécnico Nacional, Ciudad de México 07700, Mexico
*
Author to whom correspondence should be addressed.
Systems 2025, 13(5), 343; https://doi.org/10.3390/systems13050343
Submission received: 24 February 2025 / Revised: 8 April 2025 / Accepted: 23 April 2025 / Published: 2 May 2025

Abstract

:
The automotive industry is a key driver of global economic growth. However, traditional management approaches, relying on statistical tools and continuous improvement methodologies from the 1990s, lack the agility needed to address today’s complex challenges. This study proposes the Agile Viable Model (AVM), which integrates Viable System Model (VSM), Soft Systems Methodology (SSM), and Agile Methodologies to enhance responsiveness, resilience, and strategic decision-making in quality management. Applied to the Problem Resolution Process in Quality Control, the study identified low network connectivity, confirming that the system operates under a Supercritical Regime, limiting efficiency. Analyst involved and his leader emerged as critical nodes, with 68% of interactions being conflictual, revealing the need for improved communication and collaboration. To address these challenges, agile tools such as virtual boards, product logs, and daily meetings were integrated, optimizing process flexibility. CATWOE analysis facilitated the development of conceptual models aligned with organizational objectives. The Problem Resolution Process is vital both pre- and post-sale, influencing customer satisfaction and warranty costs. Strengthening connectivity and collaboration will lead to faster problem resolution, reduced costs, and enhanced reputation. The AVM offers a structured yet adaptive solution, improving operational efficiency and decision-making in automotive quality management.

1. Introduction

Globalization, driven by advances in science and technology, has a significant impact on socioeconomic development. A key sector for the global economy is the automotive industry. According to the Mexican Automotive Industry Association [1], in 2023 this sector played a crucial role in generating foreign exchange and fostering innovation through Foreign Direct Investment, representing 20% of every 100 dollars invested. This underscores the global relevance of the automotive industry.
After more than a century of evolution, the global automotive industry is a vast entity with multiple interrelated components [2]. It faces several challenges, such as fluctuations in vehicle demand, government regulations in developed countries, and technological advancements. Additionally, it confronts potential drastic changes and reinventions, yet it still retains characteristics from its founders, who have consistently focused on quality over time. The perception of quality is fundamental to the success of automobile manufacturers today, covering various dimensions [3]. Given market demands, achieving a level of excellence has become increasingly complex. According to Klink in [4], industry exerts a significant influence on various economic dimensions, such as the generation of public revenues, economic growth, human development and technological innovation. Therefore, it is essential to work with the systems involved.
The automotive industry is made up of an endless number of elements, linked together. It is a system that constantly evolves under the influence of various external factors, which is why it is considered a complex system, in addition to having different interactions of multiple components. A system is complex due to the existence of numerous subsystems and multiple non-linear interactions among its actors [5]. Its result cannot be predicted, since it adjusts and develops over time, influenced by its components and the changing environments in which it operates.
Given the circumstances of the selected system to be studied, the decision has been made to analyze it from a Systems Thinking perspective. According to Jackson in [5], the system can be considered complex as it is a transnational Original Equipment Manufacturer (OEM) with multiple interactions between actors from different countries. A complex system is one whose elements interact in a nonlinear way [6,7]. Following [5], the system under study can also be considered pluralistic, since the pluralistic approach tolerates and integrates multiple worldviews, and in our chosen system there is an integration of different individuals in different parts of the world who, although they have different perspectives and objectives, share a common purpose [8]. The pluralistic model is based on the assumption that there is an underlying common reality, albeit partial, that we all share as individuals; in other words, it is like a large and complex puzzle where each piece represents a part of the system and all must fit together, but at the same time, each piece has its own characteristics and particularities [9].
This manuscript is organized into five main sections that support the development of a Viable and Agile Model (AVM) to improve the Quality area in a Mexican automotive company. The introduction highlights the industry’s complexity and the need for more adaptive methodologies. The literature review presents key concepts from Systems Thinking, the Viable System Model (VSM), Soft Systems Methodology (SSM), and Agile approaches, justifying their integration to address organizational complexity.
The methodology section outlines a nine-step meta-methodology that combines VSM, SSM, and Agile elements. This integration enhances structural clarity, stakeholder participation, and operational flexibility. The results section describes the application of this approach, using qualitative and quantitative analyses to reveal a system operating under a supercritical regime with poor connectivity and high conflict rates. Relevant systems are defined using CATWOE, conceptual models are developed, and a tailored agile taxonomy with 54 elements is applied to strengthen responsiveness. The final section discusses how the meta-methodology improves decision-making, communication, and adaptability in the Quality department, while reducing costs and enhancing efficiency. It concludes with recommendations for refining and extending the model to similar organizational contexts.

1.1. Systems Thinking

The basic principle of a system is that it is considered more than the sum of its parts, as stated by Meadows in [10]. Several authors have undertaken the task of analyzing systems from different perspectives, such as Whitchurch and Constantine in [11], who argue that contemporary systems theorists seek to explain the behavior of complex and organized systems of all kinds, from thermostats to missile guidance computers, and from amoebas to families. The starting point of systems theory lies in General Systems Theory, which, from an interdisciplinary perspective, analyzes systems and seeks principles applicable to any level of reality, as highlighted by Bertalanffy in [12]. As observed, both Meadows in [10] and Whitchurch and Constantine in [11], from different perspectives, point to the same central idea: the complexity and behavior of systems cannot be reduced to the mere sum of their components.
Systems thinking involves a synthesis of deep analysis, discerning judgment, and a comprehensive understanding of systems as interconnected wholes [13]. After analyzing several definitions from different perspectives, Arnold and Wade in [14] define systems thinking as a set of synergistic analytical skills necessary to enhance the ability to identify and understand systems, in order to predict their behavior and design modifications to them to produce desired effects. Systems thinking is a critical skill for engineers in leadership roles in highly complex projects and to highlight its importance [15]. Systems thinking is a fundamental skill for engineers who occupy leadership roles in highly complex projects and to highlight its importance [15]. Those who excel in managing complex situations operate from an intuitive realm that our educational theories have not yet fully explored, highlighting the intuitive nature of systems thinking [16]. Despite extensive research in fields such as administration and urban planning, studies on design and systems thinking are relatively scarce and point out that analysis of the design process in industries such as automotive has allowed us to define an integral approach to systems design [17]. System thinking is considered a fundamental tool capable of addressing complex problems and making informed decisions in various areas [18].
Today, systems are becoming a common approach in fields as varied as engineering, reflecting a general tendency to analyze problems in a comprehensive manner [19]. Furthermore, systems thinking is essential for understanding the multilevel factors that underlie the complexity of phenomena in a wide range of disciplines [20].
According to the above, system thinking can be considered a powerful tool for the automotive industry, providing a deeper understanding of complex systems, leading to improved decision making, fosters innovation, and facilitates problem solving. Through the adoption of this approach, automotive companies can develop higher-quality, more efficient and more competitive products, and for this, we are going to analyze our system through the three steps of systems thinking mentioned [21]:
  • Our object of study will be conceptualized not as an isolated entity, but as part of a larger system or set.
  • A global perspective of the system under study is sought.
  • The system is understood from its relationship to other systems.

1.2. Literature Review

As a core component of this research, a literature review was conducted to understand how three methodological approaches have been applied in the automotive industry: systems thinking, agile methodologies and the Viable System Model (VSM). This review enabled the identification of practical applications, the benefits achieved and the key challenges associated with implementing these approaches in a sector characterized by high complexity, advanced technology, and an increasing need for organizational adaptability.
Systems thinking has been widely adopted in the industry to promote a more holistic understanding of production, strategic, and innovation processes. Notable applications include its integration with lean principles to improve manufacturing systems [22], as well as its use to support environmental decision-making from an integrative perspective [23]. It has also proven valuable in the analysis of the resilience of supply chain and network structures, highlighting how systemic interdependence affects efficiency and response to disruptions [24]. In the case of China, it has been instrumental in shaping long-term sustainability strategies in the automotive sector [25]. Moreover, it has been combined with tools such as the Design Structure Matrix (DSM) and foresight methods to anticipate technological disruptions [26], and has contributed to strengthening strategic management and sustainable logistics [27,28], as well as supporting innovation in R&D and cybersecurity modeling [29,30].
In parallel, the literature reveals a growing interest in agile methodologies as a response to the evolving challenges of the automotive environment. These methodologies have been adapted for software development and vehicle design, helping to address the increasing complexity of modern technical systems [31]. However, successful implementation often requires significant organizational transformation and cultural changes, particularly when agile scaling across large corporate structures [32,33]. Despite these challenges, studies have shown positive results in manufacturing performance [34], waste reduction [35], agile assembly strategies [36], smart manufacturing integration [37], and adaptive systems for battery production [38]. Further research has linked agility to sustainability [39], electric mobility initiatives [40], efficient technical planning [41], and improved cyber-resilience in supply chains [42]. Although some studies report strong technological adoption of agile principles, they also note a lower acceptance of organizational changes [43]. However, many agile practices are considered easily implementable and effective in keeping complexity manageable [44].
The Viable System Model (VSM), in turn, has been applied to diagnose, redesign, and enhance organizational viability within automotive companies, especially in contexts with multilayered structures, the need for decentralized autonomy, and cross-functional coordination [45]. By identifying key systemic functions: operations, coordination, control, monitoring, and strategic direction, researchers have discovered bottlenecks, communication breakdowns, and structural weaknesses, leading to more coherent and adaptable organizational designs. The model has been implemented in areas such as quality management, process engineering, manufacturing, logistics, and innovation, and is particularly useful to align organizational capabilities with goals related to digital transformation and sustainability. However, its application is not without challenges, particularly in terms of its level of abstraction and the need for specialized training. Still, when combined with participatory approaches or visual modeling tools, VSM becomes a powerful bridge between systems theory and organizational practice [46].
Overall, the reviewed literature suggests that combining systems thinking, agile methodologies, and the Viable System Model is not only feasible but increasingly essential to meet the complex challenges facing the automotive industry today. Each approach offers distinct yet complementary tools that, when integrated, improve an organization’s ability to adapt, innovate, and operate sustainably.

1.3. Case Study Company

Having described certain characteristics and challenges of the automotive industry, we proceed to describe the company under study. For the design of the expected model, we conducted an analysis of a world-leading automaker with a wide range of brands and an international presence. This company occupies a strategic position within the industry, employing approximately 270,000 people worldwide, including more than 15,000 employees in Mexico. The company operates around 100 industrial facilities in more than 30 countries, with manufacturing plants located in North America, Europe, South America, Africa, and Asia. In Mexico, the organization manages three vehicle assembly plants, two powertrain facilities (engines and transmissions), and a technical engineering center focused on product development, validation, and quality. These facilities produce a variety of vehicles, including SUVs, pickups, and compact cars, many of which are exported to global markets.
The company is deeply committed to innovation, quality, organizational agility, and sustainability. Using methodologies such as Industry 4.0, Six Sigma, APQP, and agile frameworks, we leverage continuous improvement and cross-functional collaboration. With robust talent development programs and strong partnerships with academic institutions, the organization has earned recognition for its operational excellence, environmental responsibility, and inclusive practices. Due to confidentiality agreements with the participating company, specific details that could lead to its identification cannot be disclosed. The information provided has been anonymized and is presented in a generalized manner to protect organizational privacy and comply with ethical research standards.
As mentioned above, the selected company has an engineering center in Mexico, consisting of three areas:
  • Vehicle Issue Resolution (VIR): In this division, the team manages issues arising from two sources: presale production issues and customer complaints (post-sale). Its main responsibilities are to analyze the problem and manage activities with different Stellantis areas worldwide, which can help identify the root cause of the problem.
  • Incident Program and Resolution Management (QPM): In this division, the team manages issues through a problem platform and manages the corresponding activities for closure.
  • Quality System Management (QMS): This division is responsible for managing the quality certification system. Its administration is carried out jointly with different areas of the company in Mexico. For this research, we will focus on the Issue Resolution area, the process of which is described in detail below:
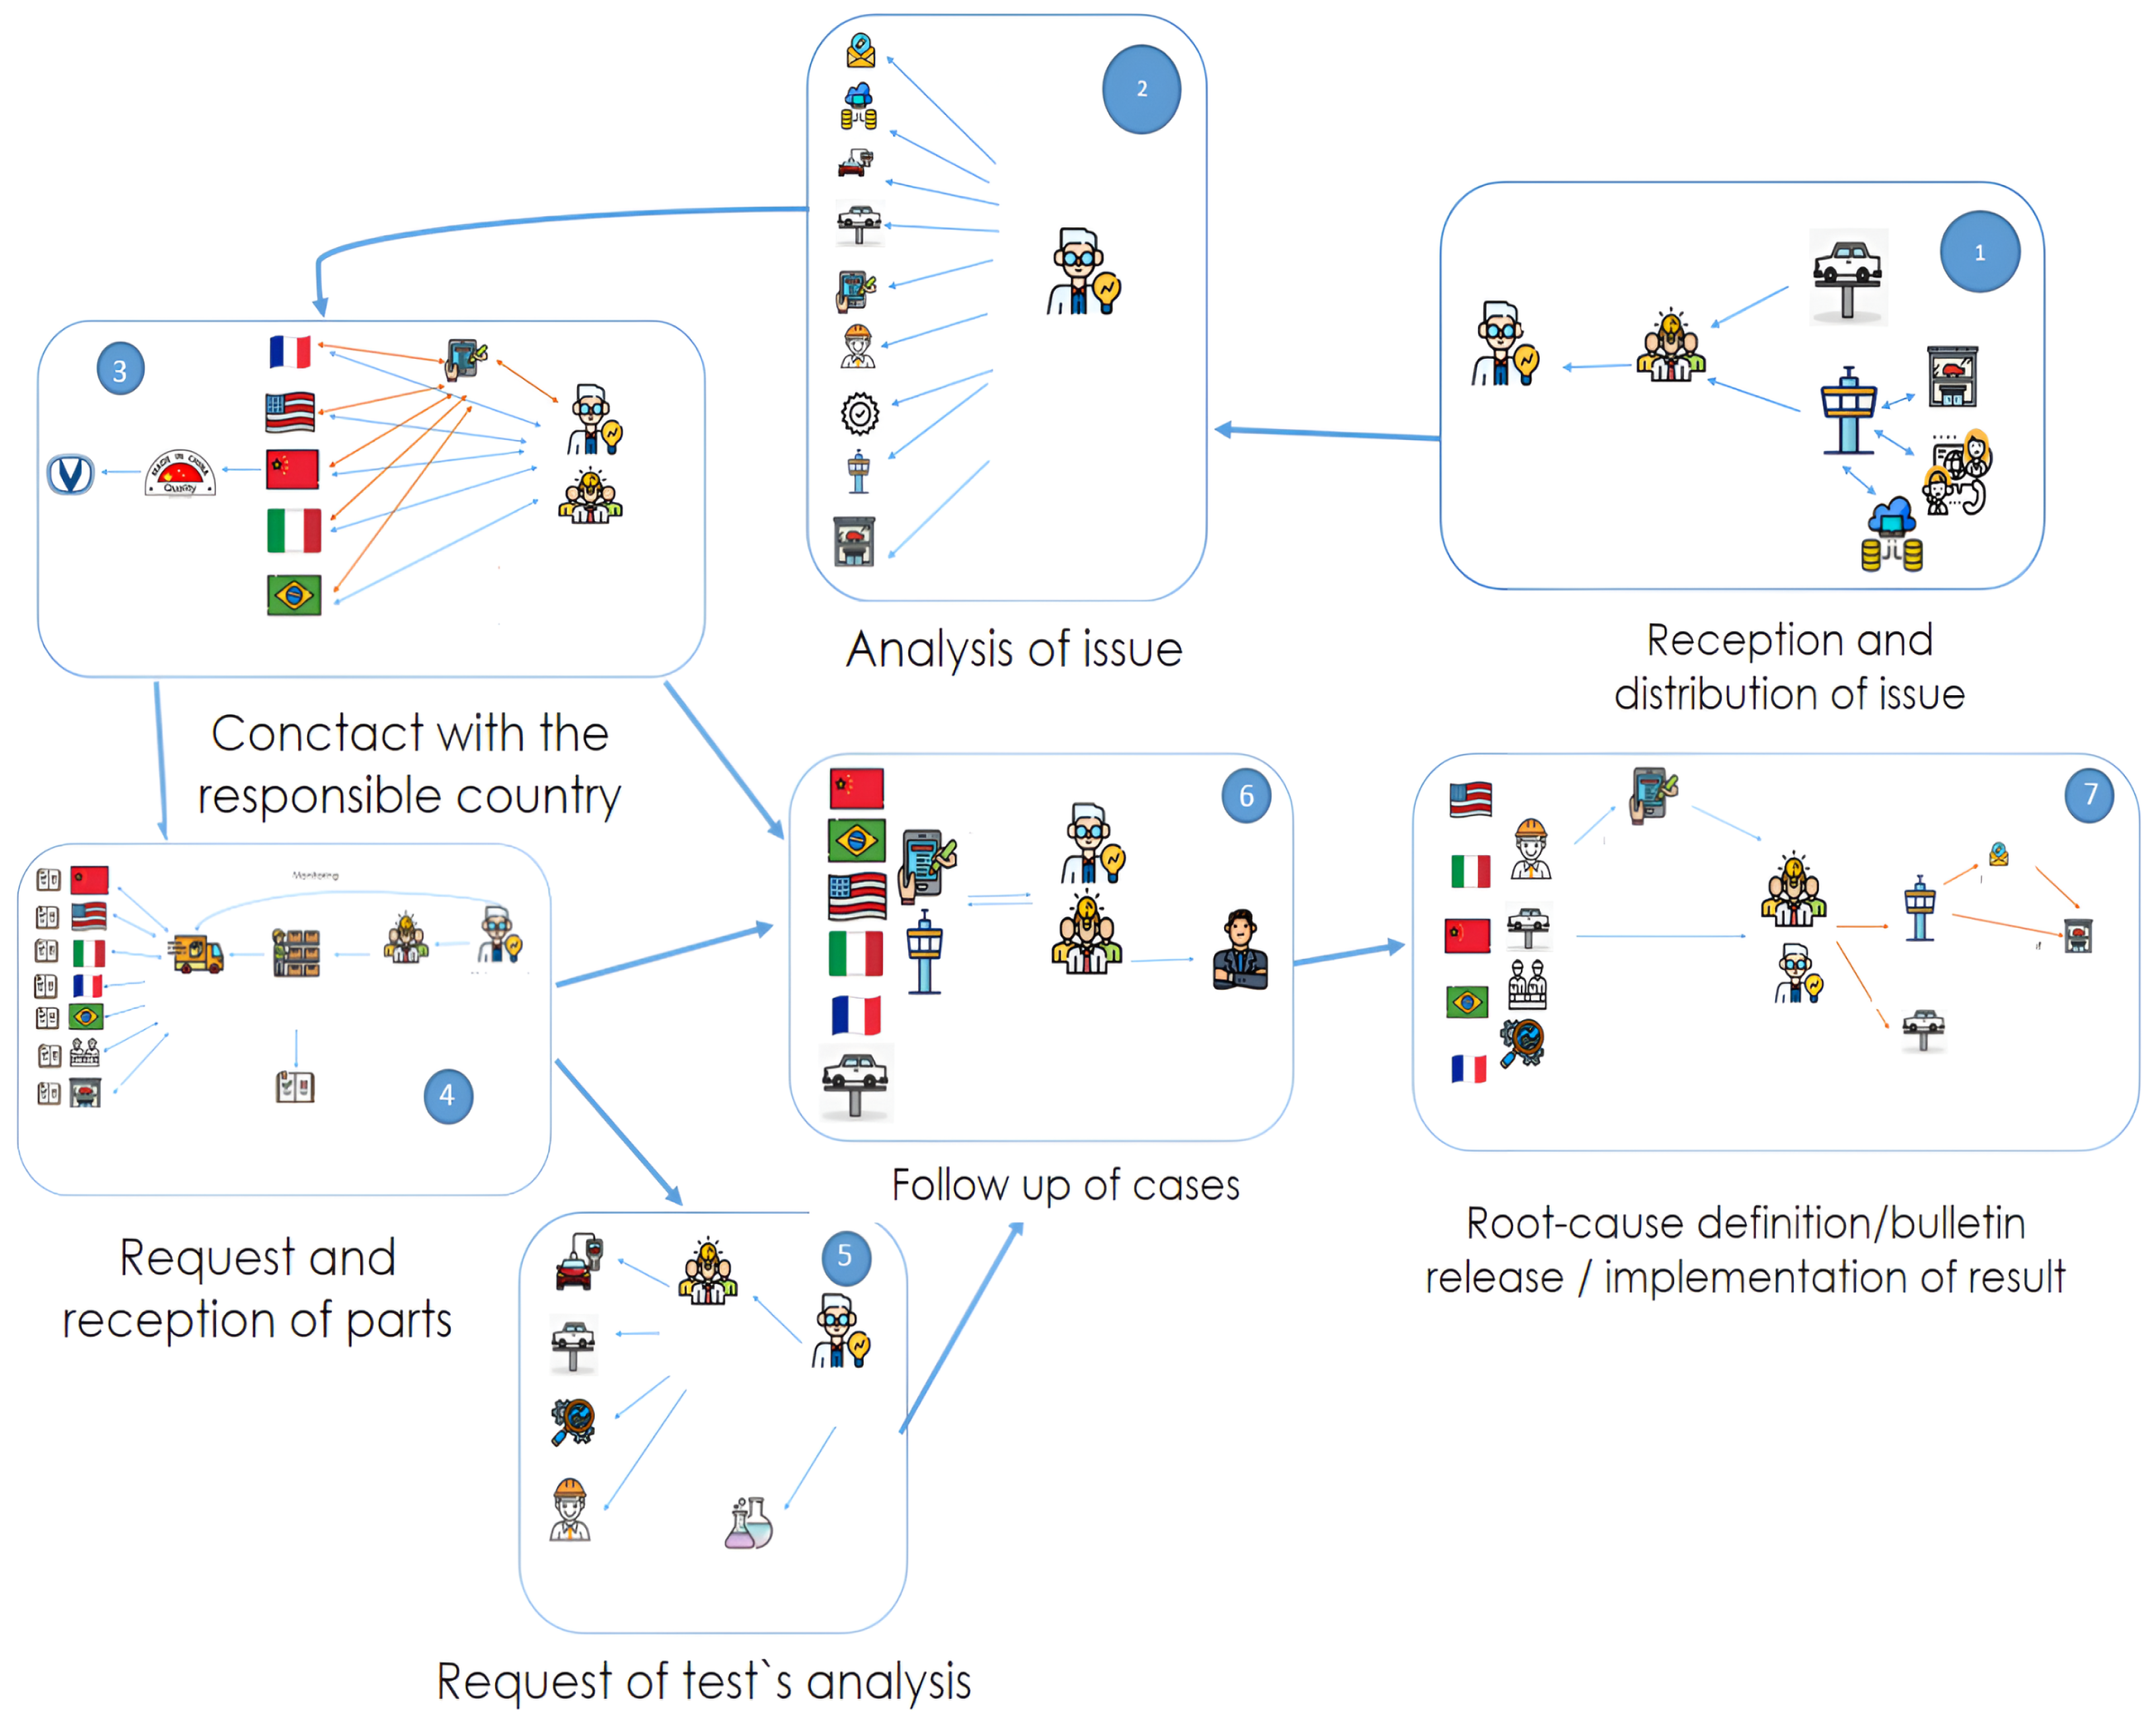
    • Initial Detection and Documentation. The first crucial step in this process is the identification of defects. These defects can arise from two sources: defects present in vehicles before sale or defects found in vehicles that have already been sold and are in use by the customer. Once a defect has been identified, detailed documentation begins. This information is essential for analysts to fully understand the problem and take the appropriate actions.
    • In-depth Analysis and Global Communication. Subsequently, the Analysts delve into a thorough investigation of each defect. By gathering and analyzing relevant data, they aim to understand the underlying causes of the problem. In many cases, collaboration with experts in other countries is necessary to gain a global perspective and access specialized resources. Effective communication among the various teams involved is essential to ensure the efficiency of the process.
    • Obtaining and Analyzing Physical Evidence. To support the conclusions of the analysis, it is often necessary to physically examine the affected parts or components. Through laboratory tests or field tests, engineers can identify failure patterns and determine the root cause of the problem. The logistics of obtaining the required parts is a significant aspect to consider and is carried out in coordination with warehouses and transportation companies.
    • Monitoring and Final Resolution. Throughout the process, rigorous monitoring of each case is performed. Analysts, supported by their leaders and representatives from the countries involved, monitor the progress of the investigations and ensure that deadlines are met. Once the root cause of a defect has been identified, the results are communicated to stakeholders, and the necessary corrective actions are implemented. In the case of products already on the market, informative bulletins are issued to inform customers about the implemented solutions.
To date, the Quality Department has not achieved satisfactory results. To collect the necessary information, a mixed methods research strategy was used, combining both qualitative and quantitative approaches. Semi-structured interviews were conducted with key personnel in the area under analysis, activity mapping was carried out through direct observation, and experimental tests were designed to measure operational response times under various scenarios. Data collection was carried out over several sessions that included site observation, controlled simulations, and documented process analysis. The data were then analyzed using a triangulation approach, allowing qualitative insights to be cross-referenced with quantitative evidence, which ultimately led to a comprehensive diagnosis of the system under study. Through data collection, the following information was obtained from the Problem Resolution area:
  • The time taken to resolve issues is excessively long.
  • There are numerous intermediaries through whom communication must pass to obtain any type of response.
  • There is poor management from the Project Leader with their Analysts, as the Leader himself lacks knowledge on how to improve the process.
  • Post-sales expenses: These arise from excessive warranty payments as, in the absence of effective solutions, parts are simply replaced with new ones due to the urgency of the customer. Additional costs may also arise from potential customer lawsuits, which could harm the reputation of the brands.
  • Pre-sales expenses: These are generated by poor design and delays in vehicle production due to the time required to obtain solutions from the corresponding country.
  • Furthermore, there is inadequate identification of the interacting elements within the system and their integration.
As can be observed, we are working with a complex and pluralistic system, and given its nature, it is imperative to adopt a methodology capable of adapting to the inherent dynamics and diversity of such systems. In this context, we propose an agile and viable model that facilitates the clarification of activity structures to optimize problem resolution processes through a nine-step meta-methodology: (1) Identification of problematic situations, (2) Delineation of the system under scrutiny, (3) Execution of structural diagnostics and network analysis, (4) Definition of relevant systems, (5) Creation of conceptual models, (6) Selection of agile taxonomy, (7) Comparative analysis of conceptual models, (8) Systemic modifications, and (9) Integration of improvements.
This meta-methodology integrates elements from the Soft Systems Methodology, the Viable System Model, and agile methodologies as essential components to promote organizational resilience. Step nine emphasizes the application of systemic improvements through the attenuators and amplifiers formed by structuring each step of the proposed model.
Agile methodologies have emerged to accelerate development in companies that require urgent systems, based on continuous iteration in product development and testing [47]. Despite their origins in software development, agile methodologies have evolved to become a fundamental aspect of project management in a wide range of fields [48]. Teams that follow agile methodologies have the autonomy to make decisions and organize themselves, which results in greater commitment and efficiency in their work [49]. Today, agility (provided by agile methodologies) to adapt to change is crucial in the dynamic business world, as it allows companies to stand out from the competition [50]. One of the benefits of agile methodologies is the continuous involvement of the client, which ensures that the final product meets the client’s needs and expectations [51]. This collaborative approach not only enhances the quality of the product, but also strengthens the relationships with stakeholders. These methodologies are especially useful when the final product is not clearly defined [52], and for this reason they have been selected for the development of this research to complement our model and, above all, to keep it working as designed.
These results underscore the need for a structured yet adaptable framework capable of addressing the complexities identified within quality management processes. To achieve such flexibility and systemic coherence, it is essential to integrate methodologies that can both dissect intricate organizational dynamics and promote iterative improvements. This leads to the development of a meta-methodology that synthesizes established systems thinking frameworks with agile practices, ensuring that both the structural integrity and responsiveness of the system are maintained.

2. Materials and Methods

For the development of this research, a complementary methodology was employed, combining two systems thinking approaches with agile methodologies, as detailed below:
  • Soft Systems Methodology (SSM): Developed by Peter Checkland, SSM is an approach used to address complex and poorly structured problems within organizations and other social systems. It is particularly useful in ambiguous and conflicting situations where the problems are not clearly defined and may be perceived differently by the various stakeholders involved [53].
  • Viable System Model (VSM): Developed by Stafford Beer, the VSM is a theory and tool for organizational management and design based on cybernetic principles. The model focuses on how complex systems, such as organizations, can remain viable and adapt to changing environments through self-management and self-regulation [54].
  • Agile Methodologies: Agile methodologies focus on iterative value delivery, flexibility, and continuous improvement in uncertain and dynamic contexts [55].
The integration of these models forms a metamethodology designed to operate in dynamic environments characterized by diverse stakeholders and high contextual variability. The decision to combine these methodologies arises from the observation of their individual limitations and deficiencies, as well as the potential benefits of integrating them into a unified framework. The following section outlines the main constraints of each methodology mentioned:

2.1. Constraints of Each Methodology

Although the selected methodologies were chosen for their individual strengths, they were also intentionally integrated due to the inherent limitations each presents when applied alone. By combining them, it becomes possible to compensate for their respective weaknesses, creating a synergistic and complementary approach that enhances the overall effectiveness of the methodological framework. The primary limitations of each methodology are described below:
The Viable System Model [45], while effective in assessing the ability of a system to maintain viability in the face of external complexity, can be perceived as highly abstract or technically demanding in its application and does not explicitly incorporate participatory mechanisms for system stakeholders [46].
The Soft Systems Methodology [53], while offering practical tools for exploring ill-structured problems by incorporating multiple perspectives and encouraging stakeholder participation, often places such strong emphasis on learning and the co-construction of meaning that it tends to lack focus on formal organizational structures and viable implementation frameworks.
Agile methodologies such as Scrum and Kanban, despite their effectiveness in project management and fostering team collaboration, tend to fail in systemic organizational design or long-term structural governance.
By combining these three perspectives, their individual limitations are mitigated, while their unique strengths are amplified:
  • VSM contributes a systemic structural foundation and logic to achieve organizational viability.
  • SSM enriches the process by incorporating stakeholder perspectives and addressing ambiguity in complex human systems.
  • Agile introduces operational agility and practical mechanisms for iterative improvement and rapid adaptation.
This form of theoretical integration aligns with the ideas of Jackson in [56], who advocates for creative holism as a guiding principle to blend different methodological paradigms based on the specific nature of the problem being addressed. Therefore, this research uses methodological complementarity to develop an approach that is simultaneously adaptive, participatory, and structurally grounded, enabling a more comprehensive response to organizational complexity.

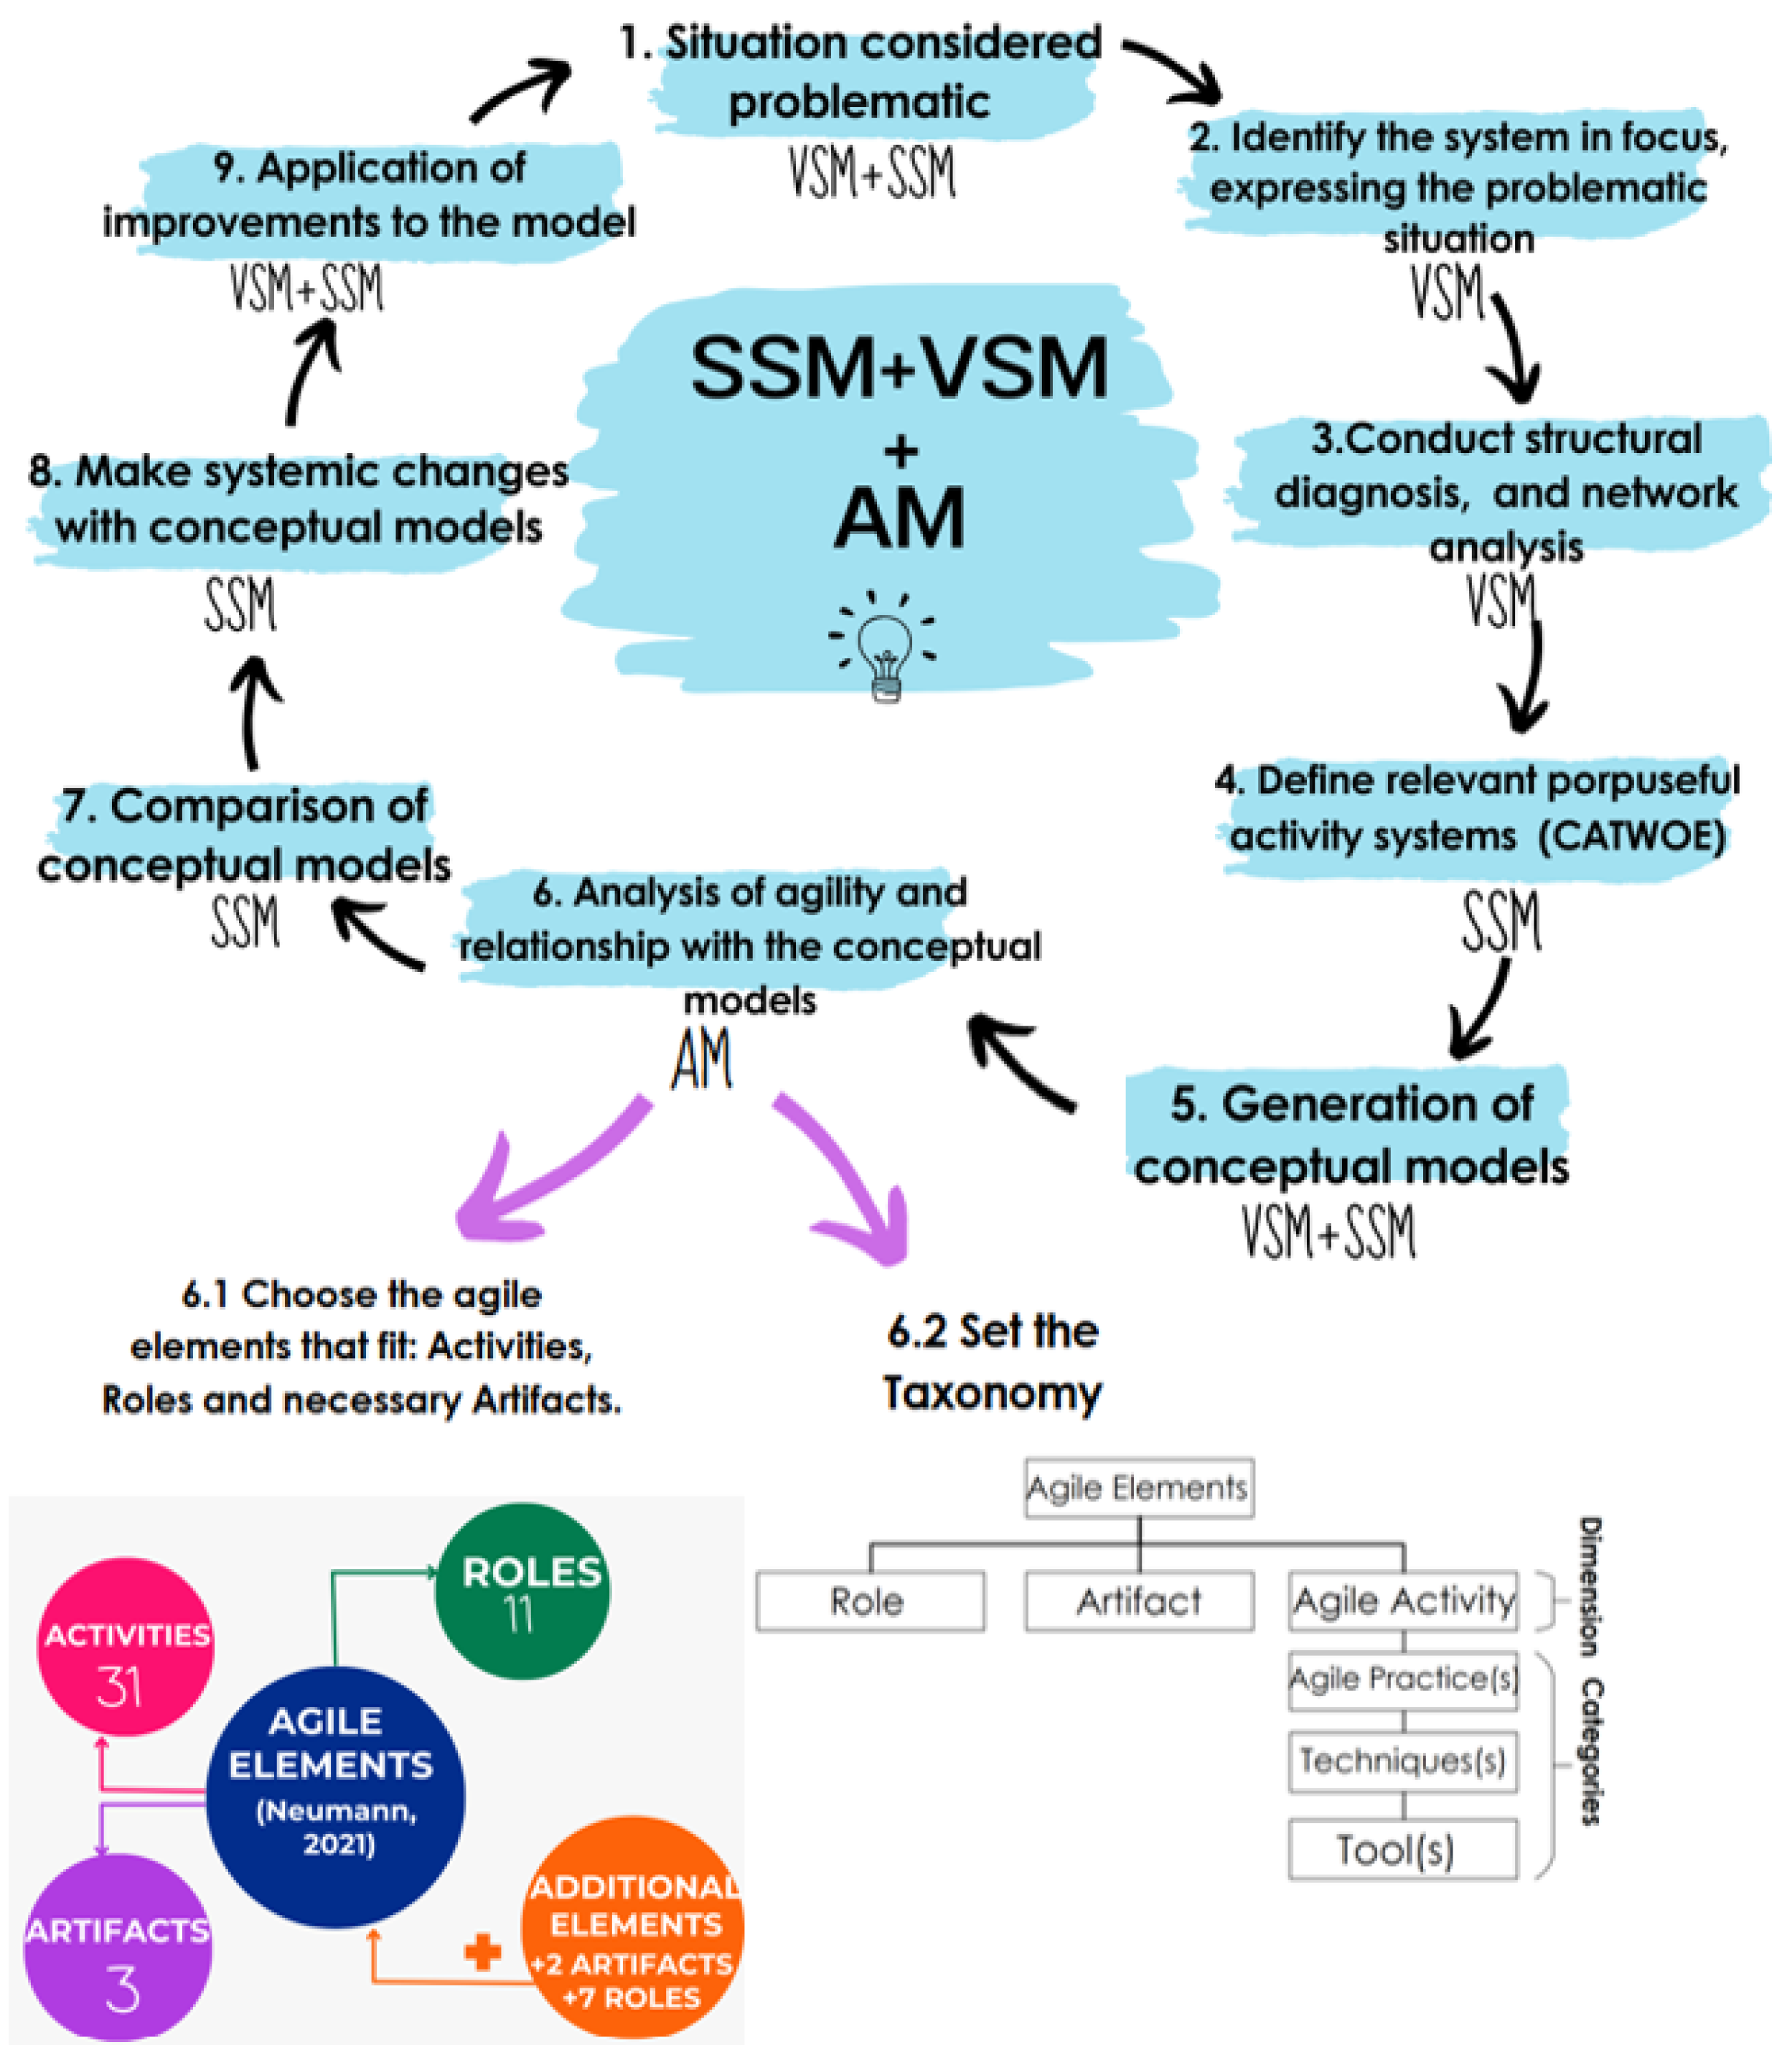
2.2. Complementarity of Methodologies

Various investigations have jointly employed the SSM and VSM methodologies to address problems in various fields [57,58,59,60]. However, despite these efforts, a consensus has yet to be reached on how to effectively integrate these two tools or on the specific benefits of such a combination. Furthermore, there is a dearth of studies exploring this integration in the context of the automotive sector. One reason for this situation is the misinterpretation of VSM as a static and prescriptive model, when in reality its function is to complement and operationalize the conceptual models of SSM [61].
Checkland in [53] suggests that SSM is adaptable to the researcher’s vision and needs, highlighting the flexibility of the methodology. This allows researchers to select the most relevant steps and tailor them to the specific context of their research. VSM, on the other hand, has been interpreted in various ways [62,63,64,65]. There is a need to integrate VSM with other methodologies to understand the organizational context [66]. For the development of this research, we take into account the approaches of Espinosa and Walker in [63] and Espejo et al. in [62], as their interpretation, and the steps suggested from the stages of SSM. Consequently, our research proposes a complementarity generated between SSM and VSM and it is enriched by incorporating elements from agile methodologies (AM) to enhance our pursuit of generating a viable agile model for improving quality in an automotive company.
Furthermore, in the third step of the composite meta-methodology, it is suggested to perform a network analysis. This integration is derived from the fact that Pósfai and Barabási in [67] applied network science for a better understanding of the initial state of the system with which one is going to work and with this it is possible to understand in detail with quantitative results the existing complexity among its actors and the links they generate for a better understanding of the system in focus.
Regarding the agile methodologies applied to the model, they consist of a set of principles and practices for project management and software development, which prioritize flexibility, collaboration, and the rapid and continuous delivery of functional products [55]. These methodologies consist of a set of principles and practices for project management and software development, which prioritize flexibility, collaboration, and the rapid and continuous delivery of functional products [55]. Finally, the complementarity of the steps to follow to obtain the desired result is developed in the cycle of the proposed meta-methodology, which we call: “VSM + SSM + AM” (Figure 1). The development of each step mentioned is explained below.

2.3. Stage 1: Situation Considered Problematic

At this stage, it is essential to clearly and exhaustively define the situation that is taken as a starting point for the development of the application of the model, trying to clarify the limits of the problem by applying the first-order model of Norbert Wiener. This Cybernetic Model is a fundamental concept in the field of cybernetics, an interdisciplinary discipline that studies control and communication systems in machines and living organisms [68]. Wiener formulated this model to describe how systems can self-regulate through feedback and thus maintain a state of equilibrium. Its main objective is its conceptualization of a system and, in order to build it, the following elements must be identified:
  • Input: This refers to everything that enters the system to be processed, such as data, materials, instructions, or signals. Essentially, it serves as the starting point that triggers the process [68].
  • Process: At this stage, transformation occurs. The information or material received is analyzed and processed according to predefined rules to produce something useful or necessary [69].
  • Output: This represents the result of the process, whether it is a product, a solution to a problem, or processed information ready for use. The quality of the output depends on both the input and the way it has been processed [70].
  • Feedback: To ensure continuous improvement, the system reviews its results and reintegrates them as new input. This allows for adjustments and optimization, ensuring stability and control [71].
Expected Results: Clear delimitation of the problem, including the identification of inputs, processes, outputs, and feedback mechanisms.
From Phase 1 to Phase 2: The data generated in Phase 1 is used in Phase 2 to define the focus system specifically, to determine which part of the system will be analyzed in greater depth, who the key participants are, and which relationships constitute the relevant system.

2.4. Stage 2: Identify the System in Focus, Expressing the Problematic Situation

In this stage, the elements that make up the organization and contribute to its functioning are identified. Through the process of unfolding complexity, which operates through a cascading development, it becomes evident that a primary activity is embedded within another, which contains more than one main activity [46]. This approach allows for the identification of elements and the gradual unfolding of each primary activity, thereby enabling the identification and selection of the system to be worked on. The unfolding of complexity is a method to analyze complex systems [45], it involves breaking down a system into its most basic parts to study how they interact with each other and thus be able to understand and control the entire system.
Expected Results: Identification and analysis of the key elements of the system, taking into account both conflicting and non-conflicting relationships, with the goal of precisely defining the system to be studied.
From Phase 2 to Phase 3: The information collected in Phase 2 on key system elements, conflicting and non-conflicting relationships, and structural delimitation is used in Phase 3 to carry out the structural diagnosis and network analysis.

2.5. Stage 3: Conduct Structural Diagnosis and Network Analysis

To understand the current situation of the system under study, it is proposed to perform a qualitative and a quantitative analysis.

2.5.1. Qualitative Analysis

The qualitative analysis is conducted using the rich-view approach that in VSM encourages a holistic understanding of an organization and its environment, considering both formal and informal aspects [45,56]. According to Beer in [54], the key to the viability of a system lies in its ability to respond to the complexity of its environment. This involves adopting a broad perspective that encompasses operational and control processes, as well as informal dynamics, organizational culture, and the diverse viewpoints of the actors involved. To construct a rich vision, Beer proposes the following steps.
  • Analysis of Environmental Complexity: Identify and understand the external variables that can affect the system, such as economic, technological, social, and political factors.
  • Mapping of VSM Subsystems: Understand how the different subsystems interact and how each contributes to the overall viability of the system.
  • Consideration of Human and Cultural Factors: Integrate informal dynamics, organizational culture, shared values, and internal politics into the analysis, as these elements are crucial for a complete understanding of the system.
  • Evaluation of Adaptive Capacity: Identify and analyze the feedback mechanisms that allow the system to adapt and respond to changes in its environment (homeostasis).
  • Analysis of Synergy between Subsystems and Environment: Assess how the organization relates to and interacts with its environment, beyond internal interactions among subsystems.
Through the development of the rich vision, it is possible to identify the number of conflicting and non-conflicting relationships at any level of recurrence. The level of detail will depend on the observer’s perspective [72].

2.5.2. Quatitative Analysis

Quantitative analysis aims to define the complexity of the system in focus through network analysis. To achieve this, it is recommended to use the Ucinet© software [73], where as a first step, adjacency matrices must be created. An adjacency matrix is a table that shows the connections among different elements, where each cell indicates whether two elements are linked [74]. The adjacency matrix is made up of the values 0 and 1, where 0 indicates that there is no interaction (when the same actors cross, the value will always be 0) while 1 indicates that there is a relationship, as shown in Table 1.
Once the adjacency matrix is built, it is entered into the UCINET software [73] to generate the network and the quantitative calculations, so we will focus on parameters such as centrality, proximity and centralization, and finally we will analyze the behavior of the network through its degree distribution and determine the network regime to understand how it works and evaluate its efficiency. It is important to note that most of the equations refer to Albert-László Barabási, who is widely recognized as an authority in the study of complex networks and a key reference for the definition of centrality parameters. His contribution to the development of the scale-free network model and the principle of preferential attachment has been fundamental to understanding why certain nodes acquire greater structural importance within a network [75]. These theoretical foundations have directly influenced the formulation and application of metrics such as degree centrality, closeness, betweenness, and eigenvector centrality. Specifically, in his work Network Science, ref. [67] provides a rigorous but accessible exposition of these metrics, establishing himself as a key source for researchers and practitioners in network analysis. Moreover, his approach combines theory with empirical application, reinforcing the robustness of his proposals and their relevance across various types of networks, including organizational ones. More details of the necessary calculations are provided below.
  • Centrality parameters. These parameters in a network allow for the identification of the importance and role of each node within a connection structure. they provided a means to measure the extent to which the network structure contributes to the importance or status of a node within a network. Over the years, many different centrality metrics have been defined [76]. The Centrality Parameters are described in Table 2, including certain features such as variable, definition, equation, and parameters.
  • Random Networks. The Table 3 describes the properties of Random Networks including certain elements such as variable, definition, equation, and parameters.
  • G(N,L) model: N-labeled nodes are connected with L randomly placed edges.
  • G(N,p) model: Each pair of N-labeled nodes is related with a probability p.
Taking into account the previous equations, we can conclude that a random network is defined by two parameters, N and k . The higher k , the denser the network will be. Given the limitations of the network (determined by N), the average degree of a node will be between the values of 0 k N 1 . Therefore, the degree distribution that defines a random network can be represented as a binomial distribution, where the probability that a network has exactly L links is k .
Since a random network is characterized by the number of nodes N and the average degree k , it is essential to understand how these structural properties can be modeled using probabilistic distributions. In this context, the binomial distribution emerges as a key tool to describe the probability that a node has a specific number of connections. This distribution allows for quantifying the variability in the number of links per node, providing a solid mathematical foundation for analyzing random networks.
The binomial distribution points out the probability that a node has a specific number of links within a random network (Table 4). This probability holds paramount importance in comprehending the diverse regimes of a random network and furnishes the mathematical foundation for analyzing and categorizing these regimes based on their structural attributes, as detailed in the following discussion.
Pósfai and Barabási in [67] describe four types of regime (Table 5). In general, systems with extreme values of the parameter p tend to be in a frozen state, whereas networks with lower values of p tend to exhibit chaotic regimes [77].
After having carried out both the qualitative and quantitative analysis, it is possible to obtain precise information on the current state of the system in focus, and with this we will now proceed to identify the relevant systems, to subsequently form the desired system.
Table 2. Centrality Parameters (Adapted from [67,78,79,80]).
VariableDefinitionEquationParameters
Degree (k)Represents the number of links a node has with other nodes [67].
k i = k i in + k i out
k in : in-degree, k out : out-degree.
Links (L)Total number of interactions [67].For an undirected network:
L = 1 2 i = 1 N k i
For a directed network:
L = i = 1 N k i
N is the number of nodes.
Maximum Links ( L max )Represents the maximum number of possible interactions in the network [67].
L max = N ( N 1 ) 2
N is the number of nodes.
Average Degree ( k )The average number of links per node in the network [67].For undirected networks:
k = 2 L N
For directed networks:
k = L N
N: number of nodes, L: number of links.
Density (D)Determines how dense or sparse the network is [67].
D = L L max
L: number of links, L max : maximum number of links.
Clustering Coefficient ( C i )Quantifies how well the neighbors of a vertex are connected [78,79].
C = 1 N i = 1 N C i
And for individual nodes:
C i = 2 e i k i ( k i 1 )
e i : number of edges between neighbors of node
i, k i : degree of node i.
Betweenness and Closeness ( B ( v ) )Measures how often a node is part of the shortest path (Betweenness). Closeness indicates how close a node is to all other nodes in the network [80].
B ( v ) = s v t σ s t ( v ) σ s t
σ s t : total number of shortest paths between s and t, σ s t ( v ) : number of shortest paths passing through v.
Table 3. Properties of Random Networks (Adapted from [67]).
VariableDefinitionEquationParameters
Probability of a random network to have L links ( p L )The probability of a random network to have L links is related to the probability of successfully linking L ( p L ) and the maximum number of possible links in the network ( L max ).
p L = L max L p L ( 1 p ) L max L
L: number of links
L max : maximum number of links
Expected number of links L Average number of connections expected to be found in the network.
L = L = 0 N ( N 1 ) 2 L p L = p N ( N 1 ) 2
p L : Probability of a random network to have L links
N: number of nodes
L: number of links
p: probability
Average degree of a random network k Average number of connections (edges) that each node in the network has.
k = 2 L N = p ( N 1 )
p L = k
N: number of nodes
L: number of links
p: probability
Expected Results: Development of a comprehensive view of the system through qualitative and quantitative outcomes. The qualitative outcome involves identifying the conflicting relationships and the key elements that make up the system. The quantitative outcome includes the use of network metrics such as centrality, density, and regime, identifying nodes (actors) and links (relationships) and constructing graphs that allow the calculation of these metrics.
From Phase 3 to Phase 4: The results of the network analysis conducted in Phase 3 are used in Phase 4 to define the relevant systems using the CATWOE technique. The combined analysis of qualitative and quantitative results allows for the discrimination and selection of only those actors and elements that are essential to the system’s functioning. This step requires a clear understanding of who the customers, actors, and owners are, as well as their interactions with the environment.
Table 4. Binomial Distribution (Adapted from [67,81]).
VariableDefinitionEquationParameters
Binomial DistributionIn a random network, the probability that the node (i) has exactly k links [67].
p k = N 1 k p k ( 1 p ) N 1 k
p k : The probability that a node has exactly k links [67].
N 1 k : The binomial coefficient, representing the number of ways to choose k links from N 1 possible nodes.
N: The total number of nodes in the network.
k: The number of links or connections.
p: The probability of a link existing between any two nodes. This value is constant in a random network.
( 1 p ) N 1 k : The probability that the node does not connect to the remaining N 1 k nodes.
Poisson DistributionA special case of the binomial distribution where the probability p gradually decreases towards zero ( p 0 ) while the exponent k increases indefinitely ( k ) [81].
p k = e k k k k !
p k : The probability that a node has exactly k links (connections).
e: The base of the natural logarithm (approximately 2.71828), representing continuous growth in probabilistic models.
k : The average degree of the network.
k: Number of links or connections.
k ! : Factorial of k, which normalizes the distribution to ensure the total probability equals 1.
Table 5. Network Regimes (Adapted from [67]).
RegimeEquationDefinition
Subcritical
0 < k < 1 p < 1 N
In this phase, the network consists of numerous small components, and it is impossible to distinguish any particularly large group.
Critical
k = 1 p = 1 N
At this stage, the regime is separated into one where there is still no giant component and another where one exists; however, the nodes are distributed among numerous components, without a single giant component identified.
Supercritical
k > 1 p > 1 N
This is considered the most relevant regime for real systems, as it is the first time a giant component similar to a network is present.
Connected
k ln N p > ln N N
For sufficiently large p, the giant component absorbs all nodes and components, resulting in N G N . There are no isolated nodes, so the network is fully connected.

2.6. Stage 4: Define Relevant Purposeful Activity Systems (CATWOE)

In this phase, relevant systems are defined as structured sets of activities and processes that help stakeholders better understand and address a specific problem. This concept comes from Soft Systems Methodology (SSM), which emphasizes that a system does not necessarily exist in reality but is rather a mental model that represents how people perceive and interpret a situation [56]. In other words, a relevant system is not a fixed entity, but a tool that allows organizations to analyze issues and develop solutions based on different perspectives. These systems serve several key functions: they help define the scope of a problem [53], bring together multiple points of view [56], support systemic modeling [82], and foster continuous learning within organizations [16].
To identify relevant systems, the first step is to determine the root definition, which expresses the main purpose of a system and what it is meant to achieve [53]. This is typically framed as a statement explaining how goal X can be achieved through process Y to ultimately achieve result Z, ensuring that transformation processes align with the long-term objectives of the organization. Once the root definition is established, the CATWOE technique is applied to further clarify the elements of the system. Following Bergvall-Kreborn et al. in [83] recommendations, CATWOE is used to break down and define key components, making it easier to analyze complex systems. Previous studies, such as those of Marttunen et al. in [84], have demonstrated that CATWOE is an effective method for conducting a thorough evaluation of the structure and functionality of a system [85], with the following nomenclature:
  • C = “Customers”—the beneficiaries or victims of the transformation process.
  • A = ‘Actors’, those who carry out the transformation process.
  • T = ‘Transformation’—the conversion of input into output.
  • W = ‘World vision’—the world vision that makes this transformation meaningful.
  • O = ‘Owners’, those who could stop the transformation.
  • E = ‘Environmental constraints’, elements outside the system that are taken for granted.
CATWOE is used to analyze the root definition of the elements that make up a system.
The relevant systems were initially determined; however, adjustments were made taking into account their participation within the viable system model.
Expected Results: Definition of relevant systems through the application of the CATWOE technique.
From Phase 4 to Phase 5: In Phase 5, the relevant systems identified in Phase 4 are used to develop conceptual models based on the Viable System Model (VSM). This includes defining systems 1 through 5, the relationships between them, and the necessary communication channels.

2.7. Stage 5: Generation of Conceptual Models

At this stage, the model is developed by integrating the organizational adjustments necessary to implement the organizational strategy. Using the VSM and supported by the SSM, this conceptual model can be transformed into an operational model. This approach not only improves the operational efficiency of conceptual models, but also employs a cybernetic approach to optimize the control of goal-oriented activity models [60].
The expected conceptual models have the bases developed by Stafford Beer, in his theory and tool focused on management and organizational design, based on the principles of cybernetics, called the Viable System Model, which focuses on how complex systems, such as organizations, can maintain their viability and adapt to dynamic environments through self-management and self-regulation [54]. The VSM is made up of five systems (structural components) and also channels that support communication and interaction among these systems [86] as follows.
  • System 1
The parts that make up System 1 must have the necessary freedom to deal with their environments, so they must be designed according to the VSM with their own five elements, and information systems [87]. This system consists of the different parts of the organization that are responsible for the implementation, that is, for performing tasks directly related to the purpose of the organization [56].
  • System 2
System 2 is responsible for maintaining harmony among the various components of System 1, acting as a mediator in instances of disagreement or unexpected circumstances [5]. A System 2 exists to serve as a buffer against these fluctuations and to coordinate common services to achieve coherence and efficiency [88].
  • System 3
System 3 acts as a supervisor, enhancing the efficiency of System 1 through operational management [5]. In addition, this system serves as a bridge between System 1 and the regulatory framework, optimizing resource allocation, promoting transparency, and ensuring compliance with all legal requirements [89].
  • System 3*
System 3* operates as a server for System 3 and fulfills the crucial role of ensuring adherence to the objectives articulated within System 3, as well as to the rules and regulations enacted by System 2. This function is analogous to an audit [56]. The primary function of System 3 is to supervise the operations of System 1 [90].
  • System 4
System 4 combines information from the environment and the system to provide managers with an overview that facilitates their decision-making [5]. This System 4 in conjunction with System 3 creates an environment within the organization that allows for strategic consideration of how to maintain current operations while responding to demands for change [91].
  • System 5
System 5 refers to policy and has the responsibility of integrating the identity of the entire organization with the wider environment, ensuring effective management, and working hand in hand with System 1, which is in charge of implementing decisions and policies [5]. This system facilitates interaction between System 3 and System 4, thus creating a self-regulation mechanism that encourages adaptability and ensures sound decision making [92].
The fundamental principle of the VSM lies in recursion, which implies that organizations replicate themselves at different scales, similar to a fractal [93]. The systems that will make up our viable agile system have already been explained, but first we are going to identify the relevant systems, which will serve as a guide. This model provides a promising structure to optimize and mitigate the obstacles created by conflicting internal dynamics within a system; however, it faces challenges to address diverse perspectives and prevent the exclusion of certain groups within organizations [94].
Expected Results: Development of viable conceptual models following the structure of the Viable System Model (VSM), incorporating Systems 1 through 5, along with their respective functions and communication channels.
From Phase 5 to Phase 6: The conceptual models developed in Phase 5 provide the foundation in Phase 6 for analyzing organizational agility. This involves identifying variety attenuators and amplifiers and contextually selecting appropriate elements to ensure the modeled system operates effectively over the long term.

2.8. Stage 6: Analysis of Agility and Relationship with Conceptual Models

This phase focuses on applying agile methodologies to make the model adaptable to change, thus creating a more resilient strategy, and is divided into three subphases:
  • Identification of attenuators and amplifiers
    Once the model is formed, an analysis of the attenuators and amplifiers is carried out in each of the identified systems. Attenuators and Amplifiers are tools for managing complexity used in VSM to achieve a balance between the variety of the environment and the responsiveness of the organization [95]. These are defined as follows:
    • Attenuators: These are mechanisms whose purpose is to reduce the complexity of the environment by filtering and selecting the aspects that are relevant to the organization.
    • Amplifiers: In contrast, amplifiers increase the organization’s capacity to cope with complexity.
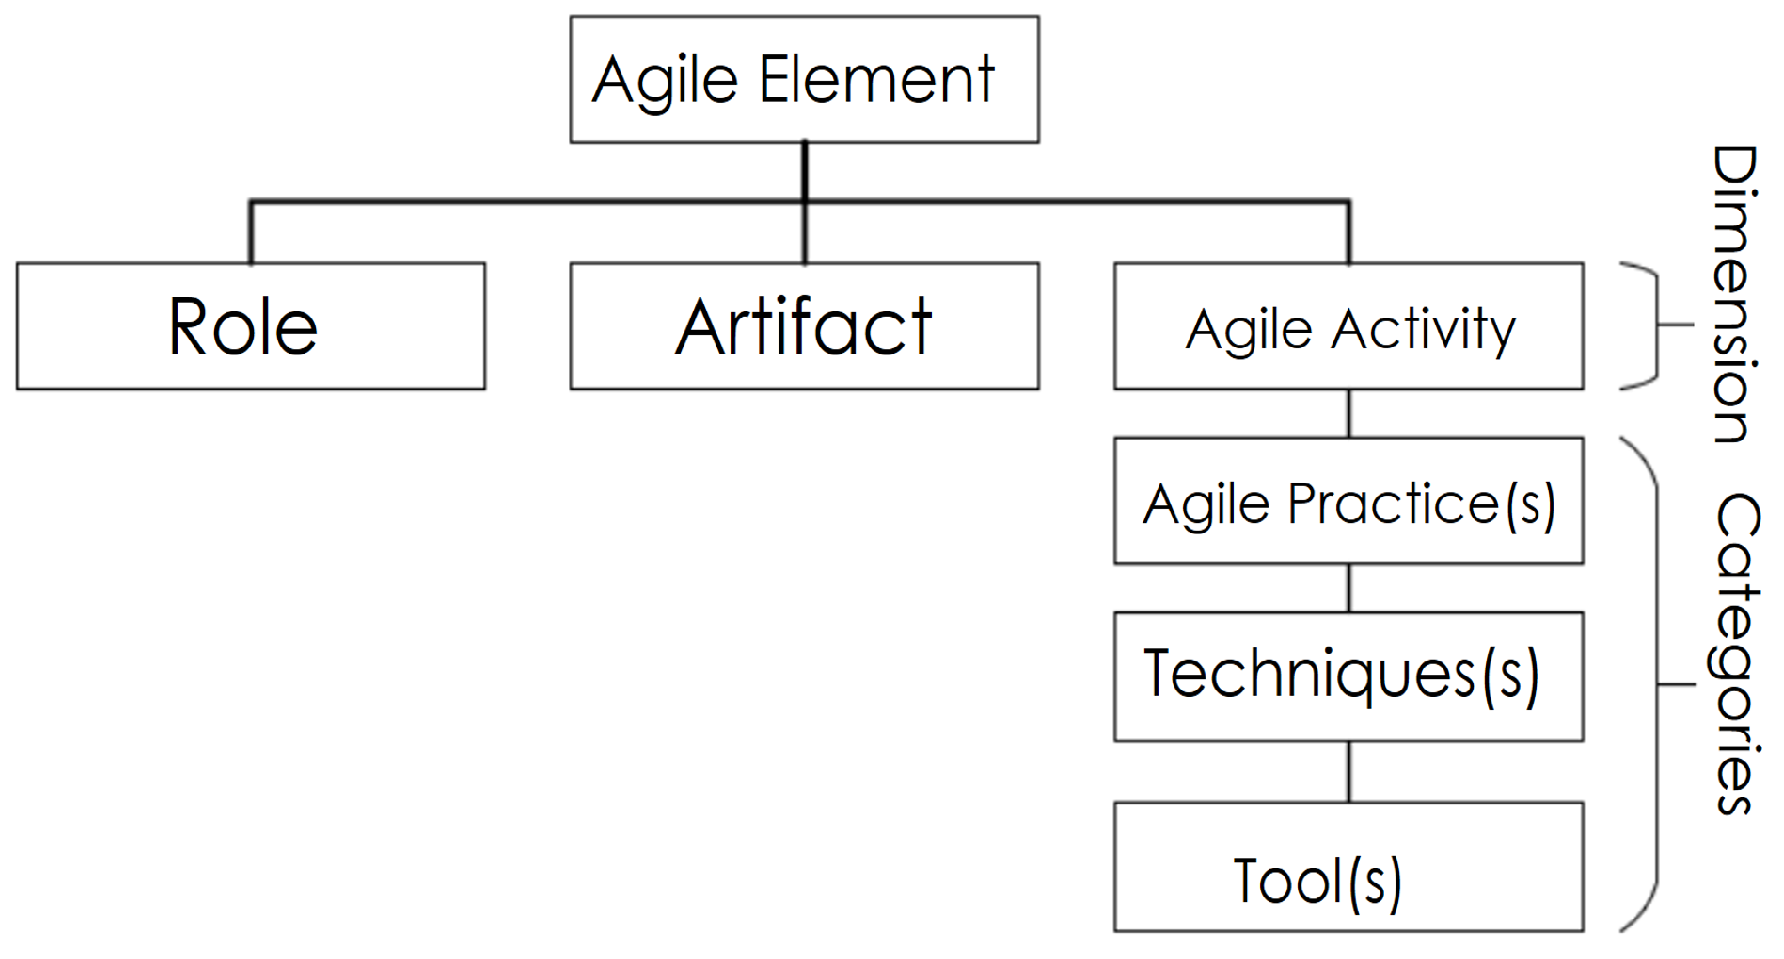
    These tools are derived from the Ashby’s Law. It establishes that: “only variety can absorb variety, “where variety is a measure of complexity: “the number of possible states of the system” [96]. This law takes into account both internal and external complexity. When a system is complex, it exhibits a high degree of diversity [97]. In contrast, when it is simple, the diversity is limited.
    To achieve a balance in varieties, it is necessary to increase variety in management and reduce variety in operations, and the most effective way to allow units and individuals to self-manage (self-organization and self-control) involves providing adequate training and ensuring appropriate information flows within the organization [87].
  • Agile Elements Identification
    Agile elements are a set of principles and practices for project management and software development that prioritize flexibility, collaboration, and rapid, continuous delivery of functional products [55]. To select the elements that will function as attenuators or amplifiers, a selection is made from a list of 45 elements, which in turn are divided into three dimensions: activities, roles, and artifacts, created by Neumann in [98]. Additionally, 9 elements have been added Table 6, which will help complement the existing list.
    To enhance the adaptability and comprehensiveness of the proposed model, 9 additional agile elements were incorporated into the original list of 45 elements. These additions stem primarily from Scrum, a widely recognized agile framework that emphasizes flexibility, collaboration, and continuous improvement in project management and product development [77]. The inclusion of these elements aims to better align the model with real-world practices, particularly in complex, multinational environments like the automotive industry. Regarding the agile elements added: Virtual Boards and Physical Boards promote transparency and continuous task tracking [99,100].
    The Team Lead adapts agile leadership to hierarchical environments [101], while the Project Sponsor ensures strategic alignment and resource allocation [102]. The Team Member reinforces self-management within cross-functional teams [77], and the Subject Matter Expert provides specialized knowledge for complex projects [103]. The Finance Partner ensures financial decisions are aligned with agile project goals [104]. Finally, the Service Request Manager and Service Delivery Manager integrate agile principles into service management [105]. These additions reflect the evolving nature of agile methodologies, adapting core principles to the specific needs of the automotive industry’s Quality Management processes.
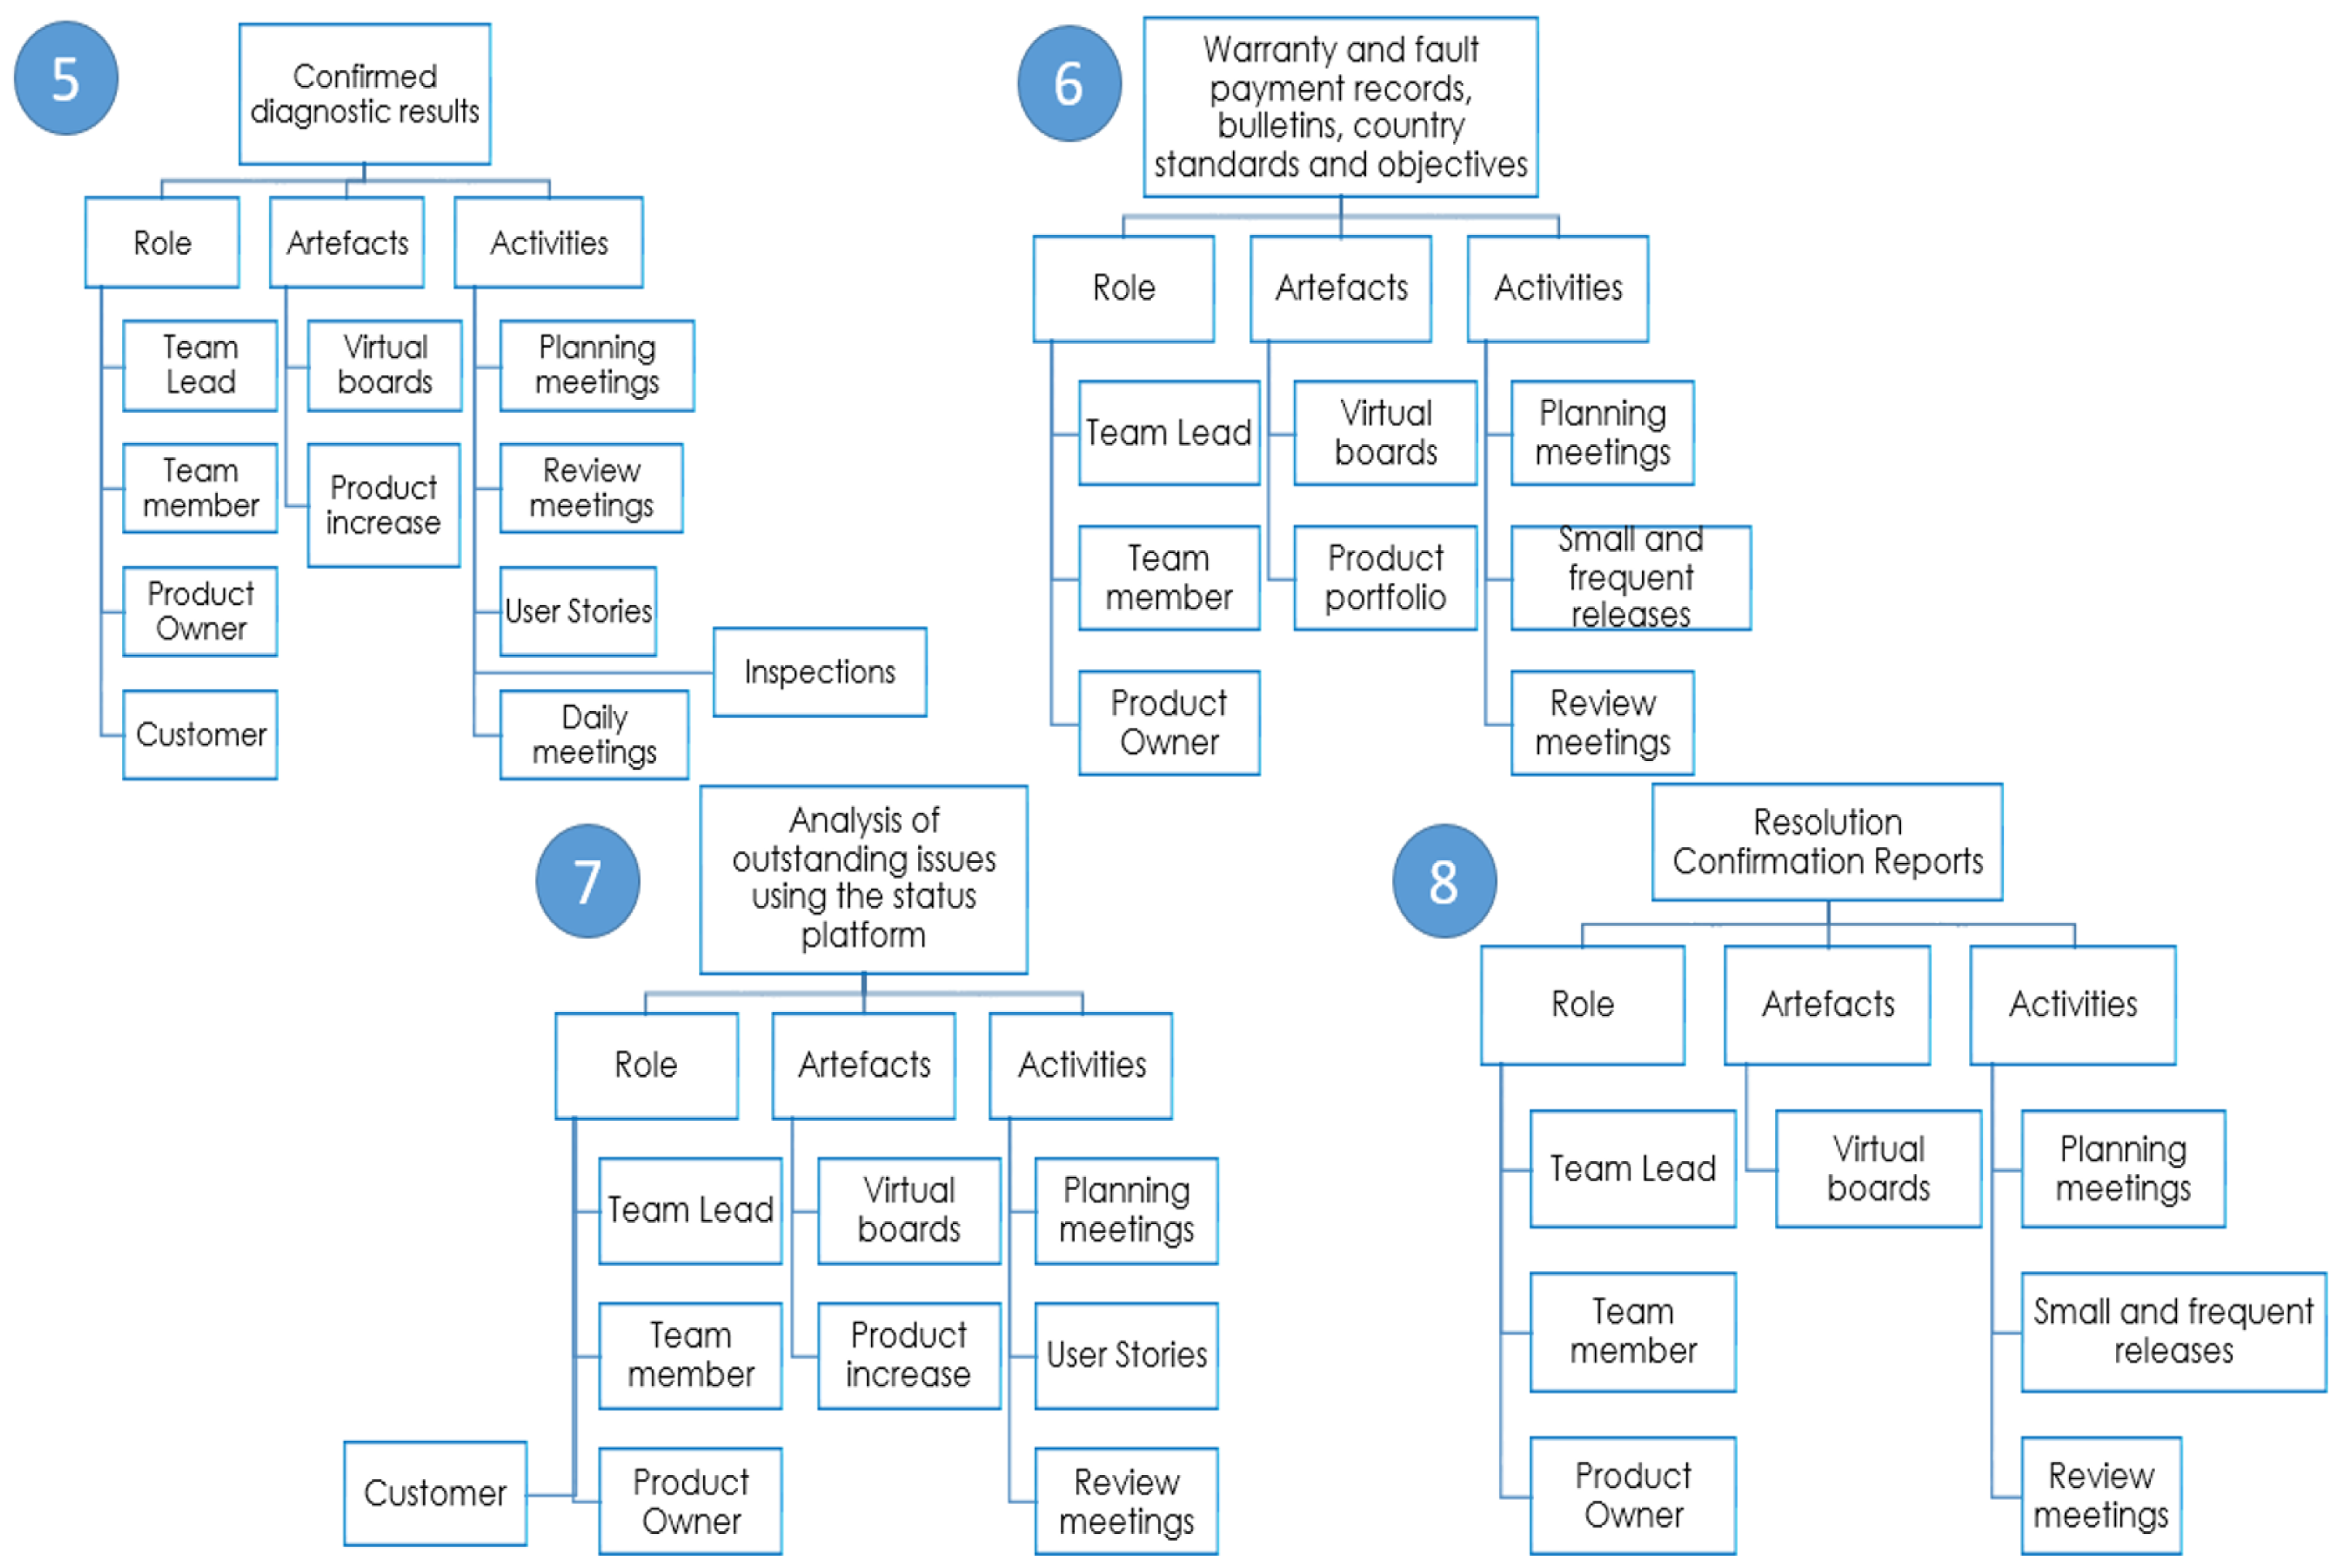
  • Agile taxonomy formation
    In this stage, the selected elements for each previously chosen attenuator or amplifier are classified, each subsystem must have at least one element of each classification: roles, activities and artifacts, whose function is to ensure that the new structure generated during the creation of the model (done in the previous stage) works properly (Figure 2). To evaluate their impact in detail on the formed taxonomy, these selected elements can be related to the cultural values defined by Hofstede in [106], as well as the competitive value framework of Quinn and Rohrbaugh in [107], through the MoCA model [98]; however, on this occasion it will only be limited to the formation of the taxonomy.
Expected Results: Identification of attenuators and amplifiers within each system to support the selection of the most appropriate agile elements (roles, activities, and artifacts) and the creation of a context-adapted agile taxonomy.
From Phase 6 to Phase 7: In Phase 7, the agility-enriched conceptual models (from Phase 6) are compared against the current state of the organization (from Phase 3). This comparison enables the identification of structural gaps, functional inconsistencies, and organizational pathologies.

2.9. Stage 7: Comparison of Conceptual Models

The generated conceptual models are compared with the current situation of the organization with the aim of identifying differences between what is described in the conceptual models and what exists, which we refer to as organizational pathologies.
Expected Results: Identification of organizational gaps and dysfunctions by comparing the conceptual models designed with the actual situation of the organization.
From Phase 7 to Phase 8: Based on the gap analysis conducted in Phase 7, Phase 8 focuses on defining the necessary systemic changes by adjusting structures, functions, or control mechanisms to enhance the viability of the system under analysis.

2.10. Stage 8: Systemic Changes with Conceptual Models

Taking inspiration from the comparison performed in stage 7, this phase aims to identify the relevant systemic changes to move forward to the next stage.
Expected Results: Definition of the necessary changes based on the comparison, to redesign the system in a structured and coherent manner.
From Phase 8 to Phase 9: Finally, in Phase 9, the proposed changes from Phase 8 are implemented to improve the system. Their impact is monitored in the real environment and, if necessary, the cycle is restarted to iterate once again within the continuous improvement process.

2.11. Stage 9: Implementation of Improvements to the Model

In this stage, the results of the conceptual model comparison are used to develop methods that will standardize the improvement (if the desired result has been achieved). Through the comparison of the conceptual models, it is possible to apply improvements and potentially repeat the cycle to gather new data and reevaluate the intervention (if the collected data are insufficient or circumstances have changed); or abandon the project and start a new from stage 1 (if the actions taken have not led to effective improvements).
Expected Results: Implementation of improvements, evaluation of their effectiveness through feedback, and repetition of the cycle if necessary, or restarting the process if the expected results are not achieved.

3. Results

3.1. Stage 1: Situation Considered Problematic

The automotive industry is a system characterized by its complexity and is composed of many processes. For this stage, we focus on the most disruptive issue within the Issue Resolution area, which involves the delayed process of solving generated problems. This issue will be conceptualized through Norbert Wiener’s First-Order Cybernetic Model, applied to the problem resolution subprocess following in which the elements are observed:
  • Input (Complaint, Claim, Evidence): This is the starting point of the system, where a complaint, claim, or evidence is received indicating that something is not working correctly. From a technical perspective, this input serves as a signal that alerts the system to a deviation or issue within the process.
  • Diagnosis and Solution Process: Once the issue has been identified, an analysis is performed to determine the best solution. At this stage, the received information is examined, the relevant data is filtered, and the most appropriate course of action is defined to resolve the situation.
  • Output (Solution to the Problem): The outcome of the entire process is the implementation of the identified solution. In terms of quality control or management systems, this output aims to correct the detected issue and minimize any errors or negative impacts.
  • Feedback (Evaluation and Adjustment): After the solution is implemented, it is essential to assess whether it effectively resolved the problem. If the response was not sufficient, the system receives this feedback and adjusts its approach to improve future outcomes. This feedback mechanism ensures that the process is continuously refined, allowing for ongoing adjustments and improvements.

3.2. Stage 2: Identify the System in Focus, Expressing the Problemnatic Situation

This second stage involves identifying the System in Focus, which can be accomplished through the decomposition of complexity. This system is illustrated in Figure 3.
With the help of rich vision to describe the organizational structure, activities, and their interrelations, anomalies within the system, it can be detected and related to the problem under study. Figure 4 represent the current situation of the problem under study. Additionally, in Figure 5 the current existing relationships can be observed, which are categorized by their recurrence levels (red lines: conflicting, blue lines: non-conflicting), generated within the Issue Resolution area, with a total of 63 relationships, of which 68% are conflicting relationships and only 32% are non-conflicting relationships. The analysis reveals that most of the conflicting relationships are associated with Analyst 1, who is responsible for performing the relevant work activities. The absence of necessary relationships or their lack complicates Analyst 1’s ability to achieve the objectives, and, in turn, hinders the work of the Lead Analyst.

3.3. Stage 3: Conduct Structural Diagnosis and Network Analysis

3.3.1. Qualitative Analysis

To develop this analysis, a “rich vision” of the Issue Resolution area will be created. In Figure 4 the process carried out within the issue resolution system is depicted, while Figure 5 illustrates the levels of recurrence and their interactions. The analysis reveals a total of 63 relationships. A significant majority (68%) are characterized by conflict while only 32% are considered non-conflictive. Most of the conflicting relationships involve Analyst 1. Due to corporate confidentiality, it is not possible to disclose the specific nature of each relationship in detail. However, Table A1 presents the actors involved in conflicting interactions, with the possibility of multiple conflicts associated with each actor, it can be observed that a critical point is that Analyst 1 is involved in most conflicts, suggesting that Figure 5 plays a key role in problem management but faces challenges related to communication or workload. The table details the different actors involved in the system: Analysts, Control Tower, Dealers and After-sales, Engineering and Logistics Departments, Quality and Environmental Certification Entities, and International Counterparts: Coordinate problem resolution across global markets.
This analysis helps us understand how information flows within the system, identifying bottlenecks and areas for improvement. If communication conflicts are reduced and coordination between actors improves, the system will become more efficient and agile, ultimately benefiting the entire production and after-sales chain.
Based on the information obtained, the following actors are identified:
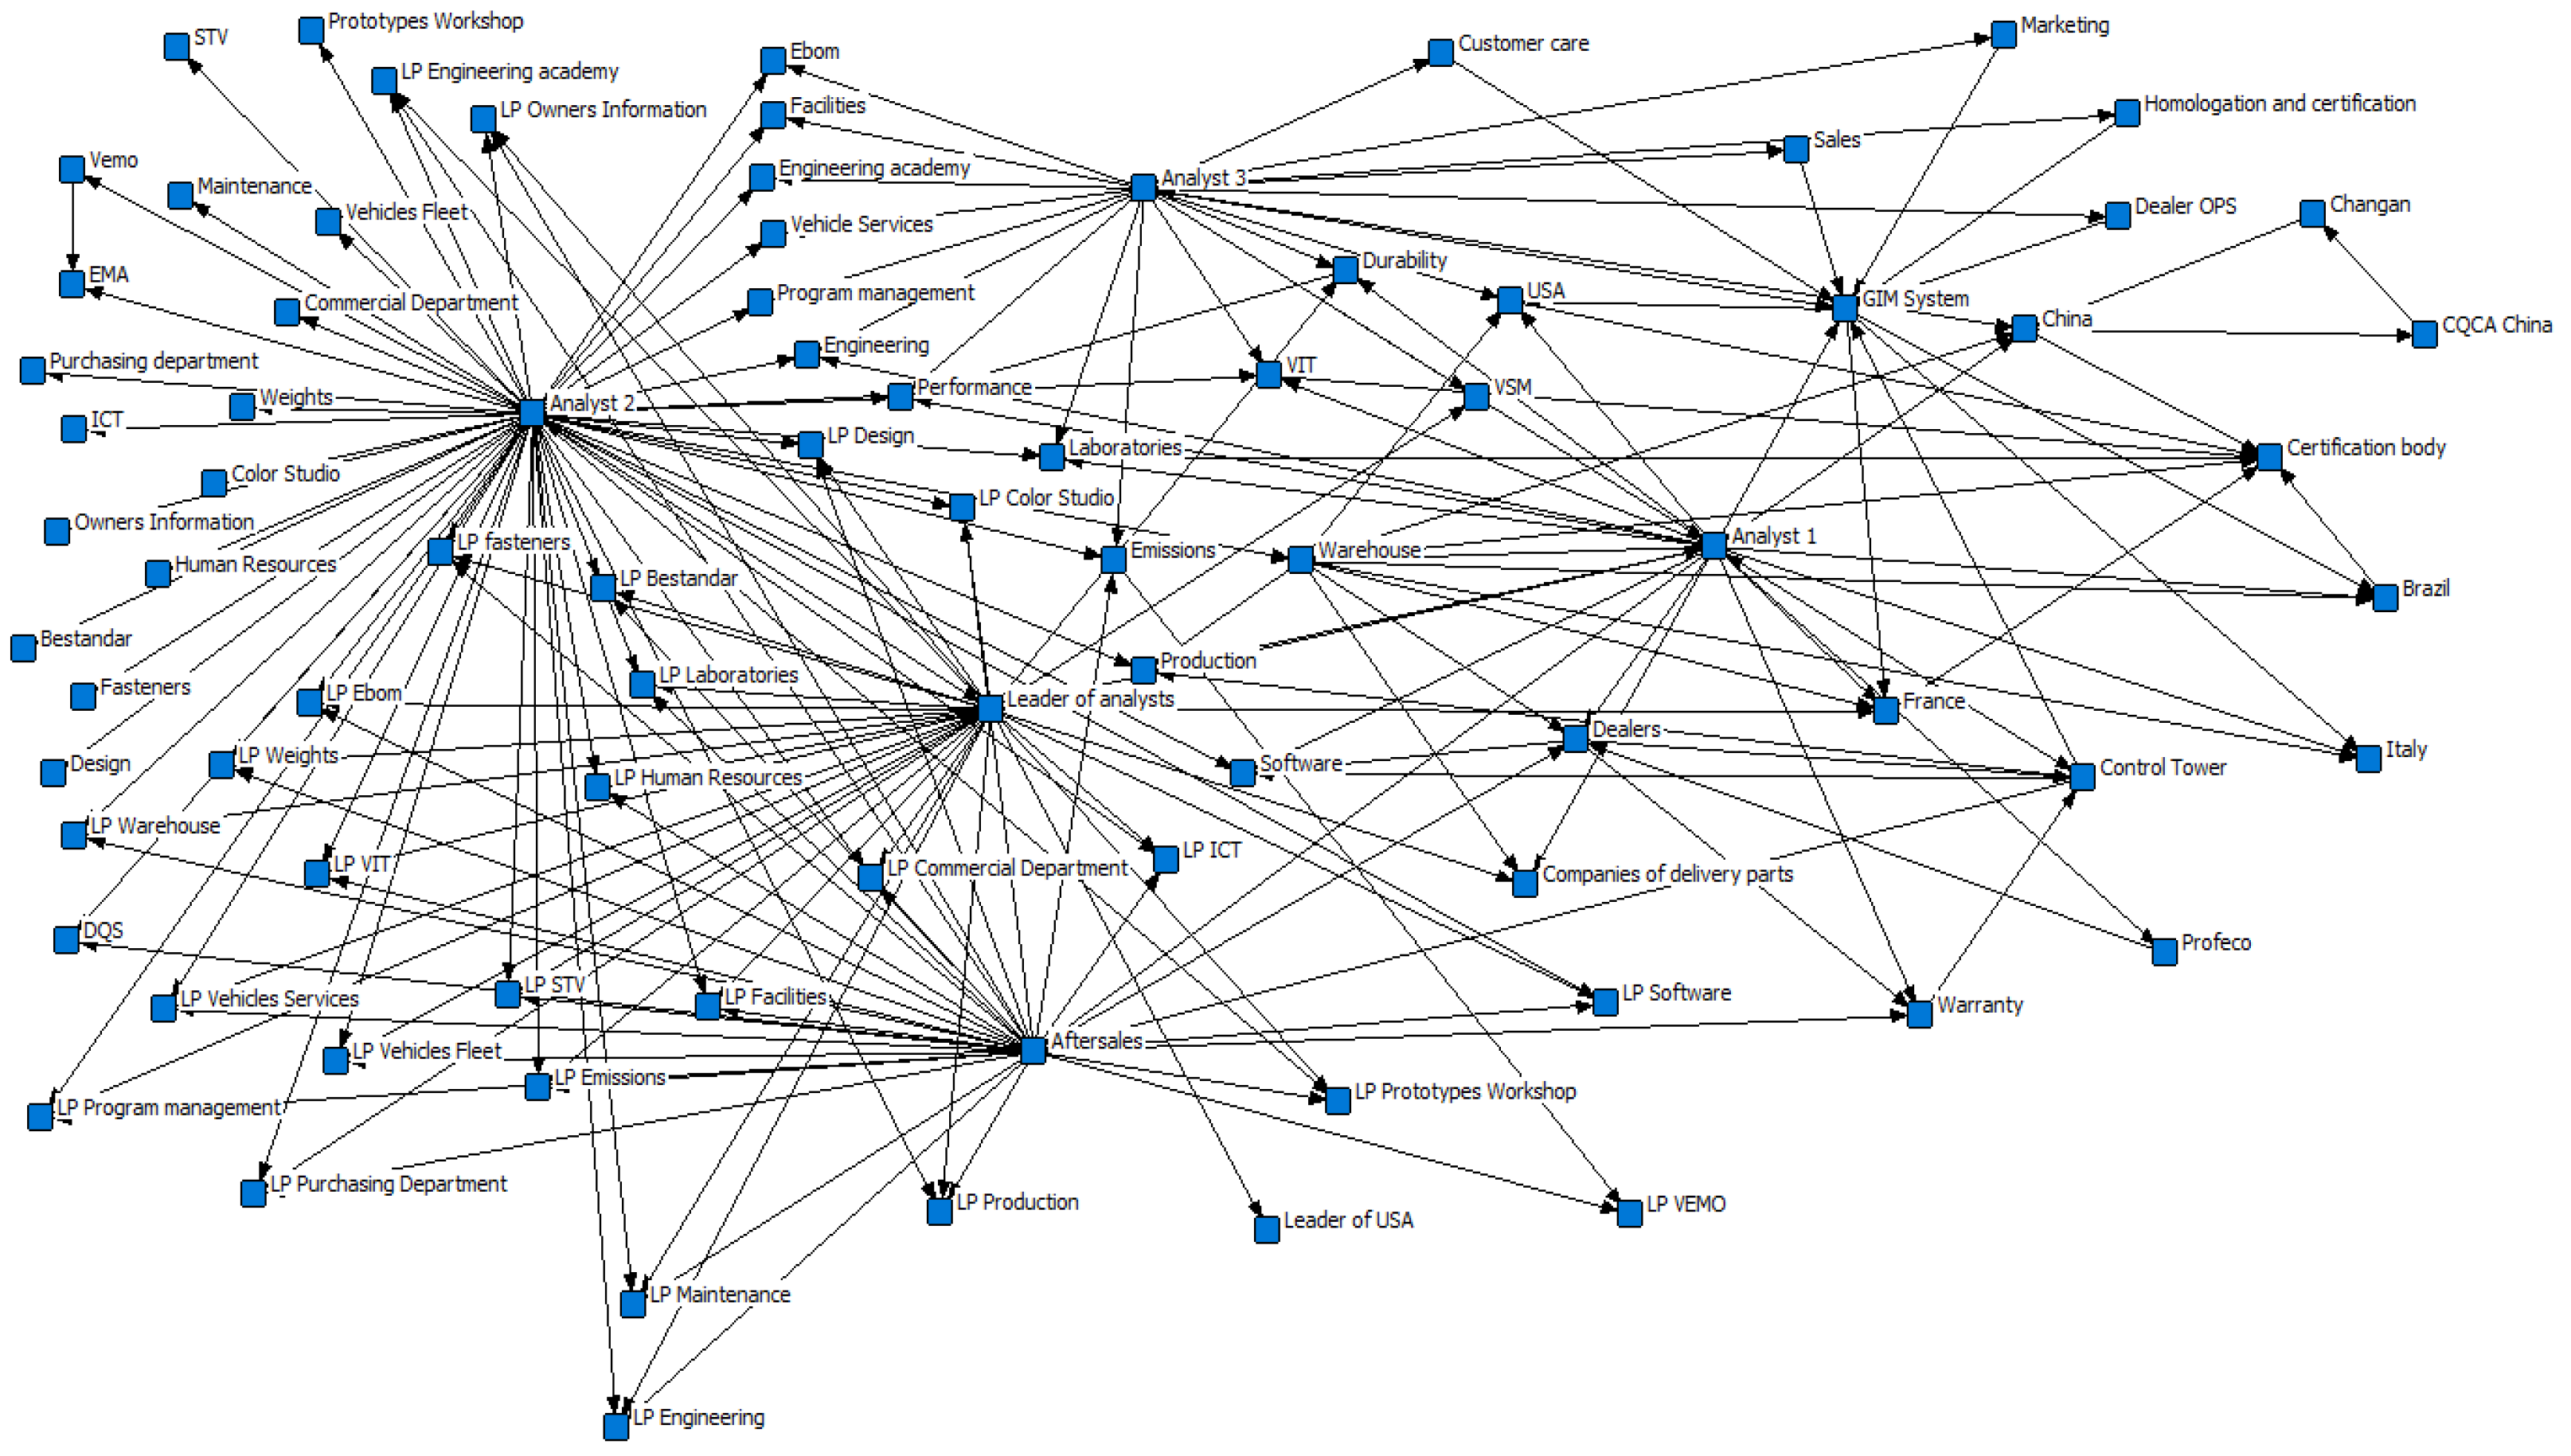
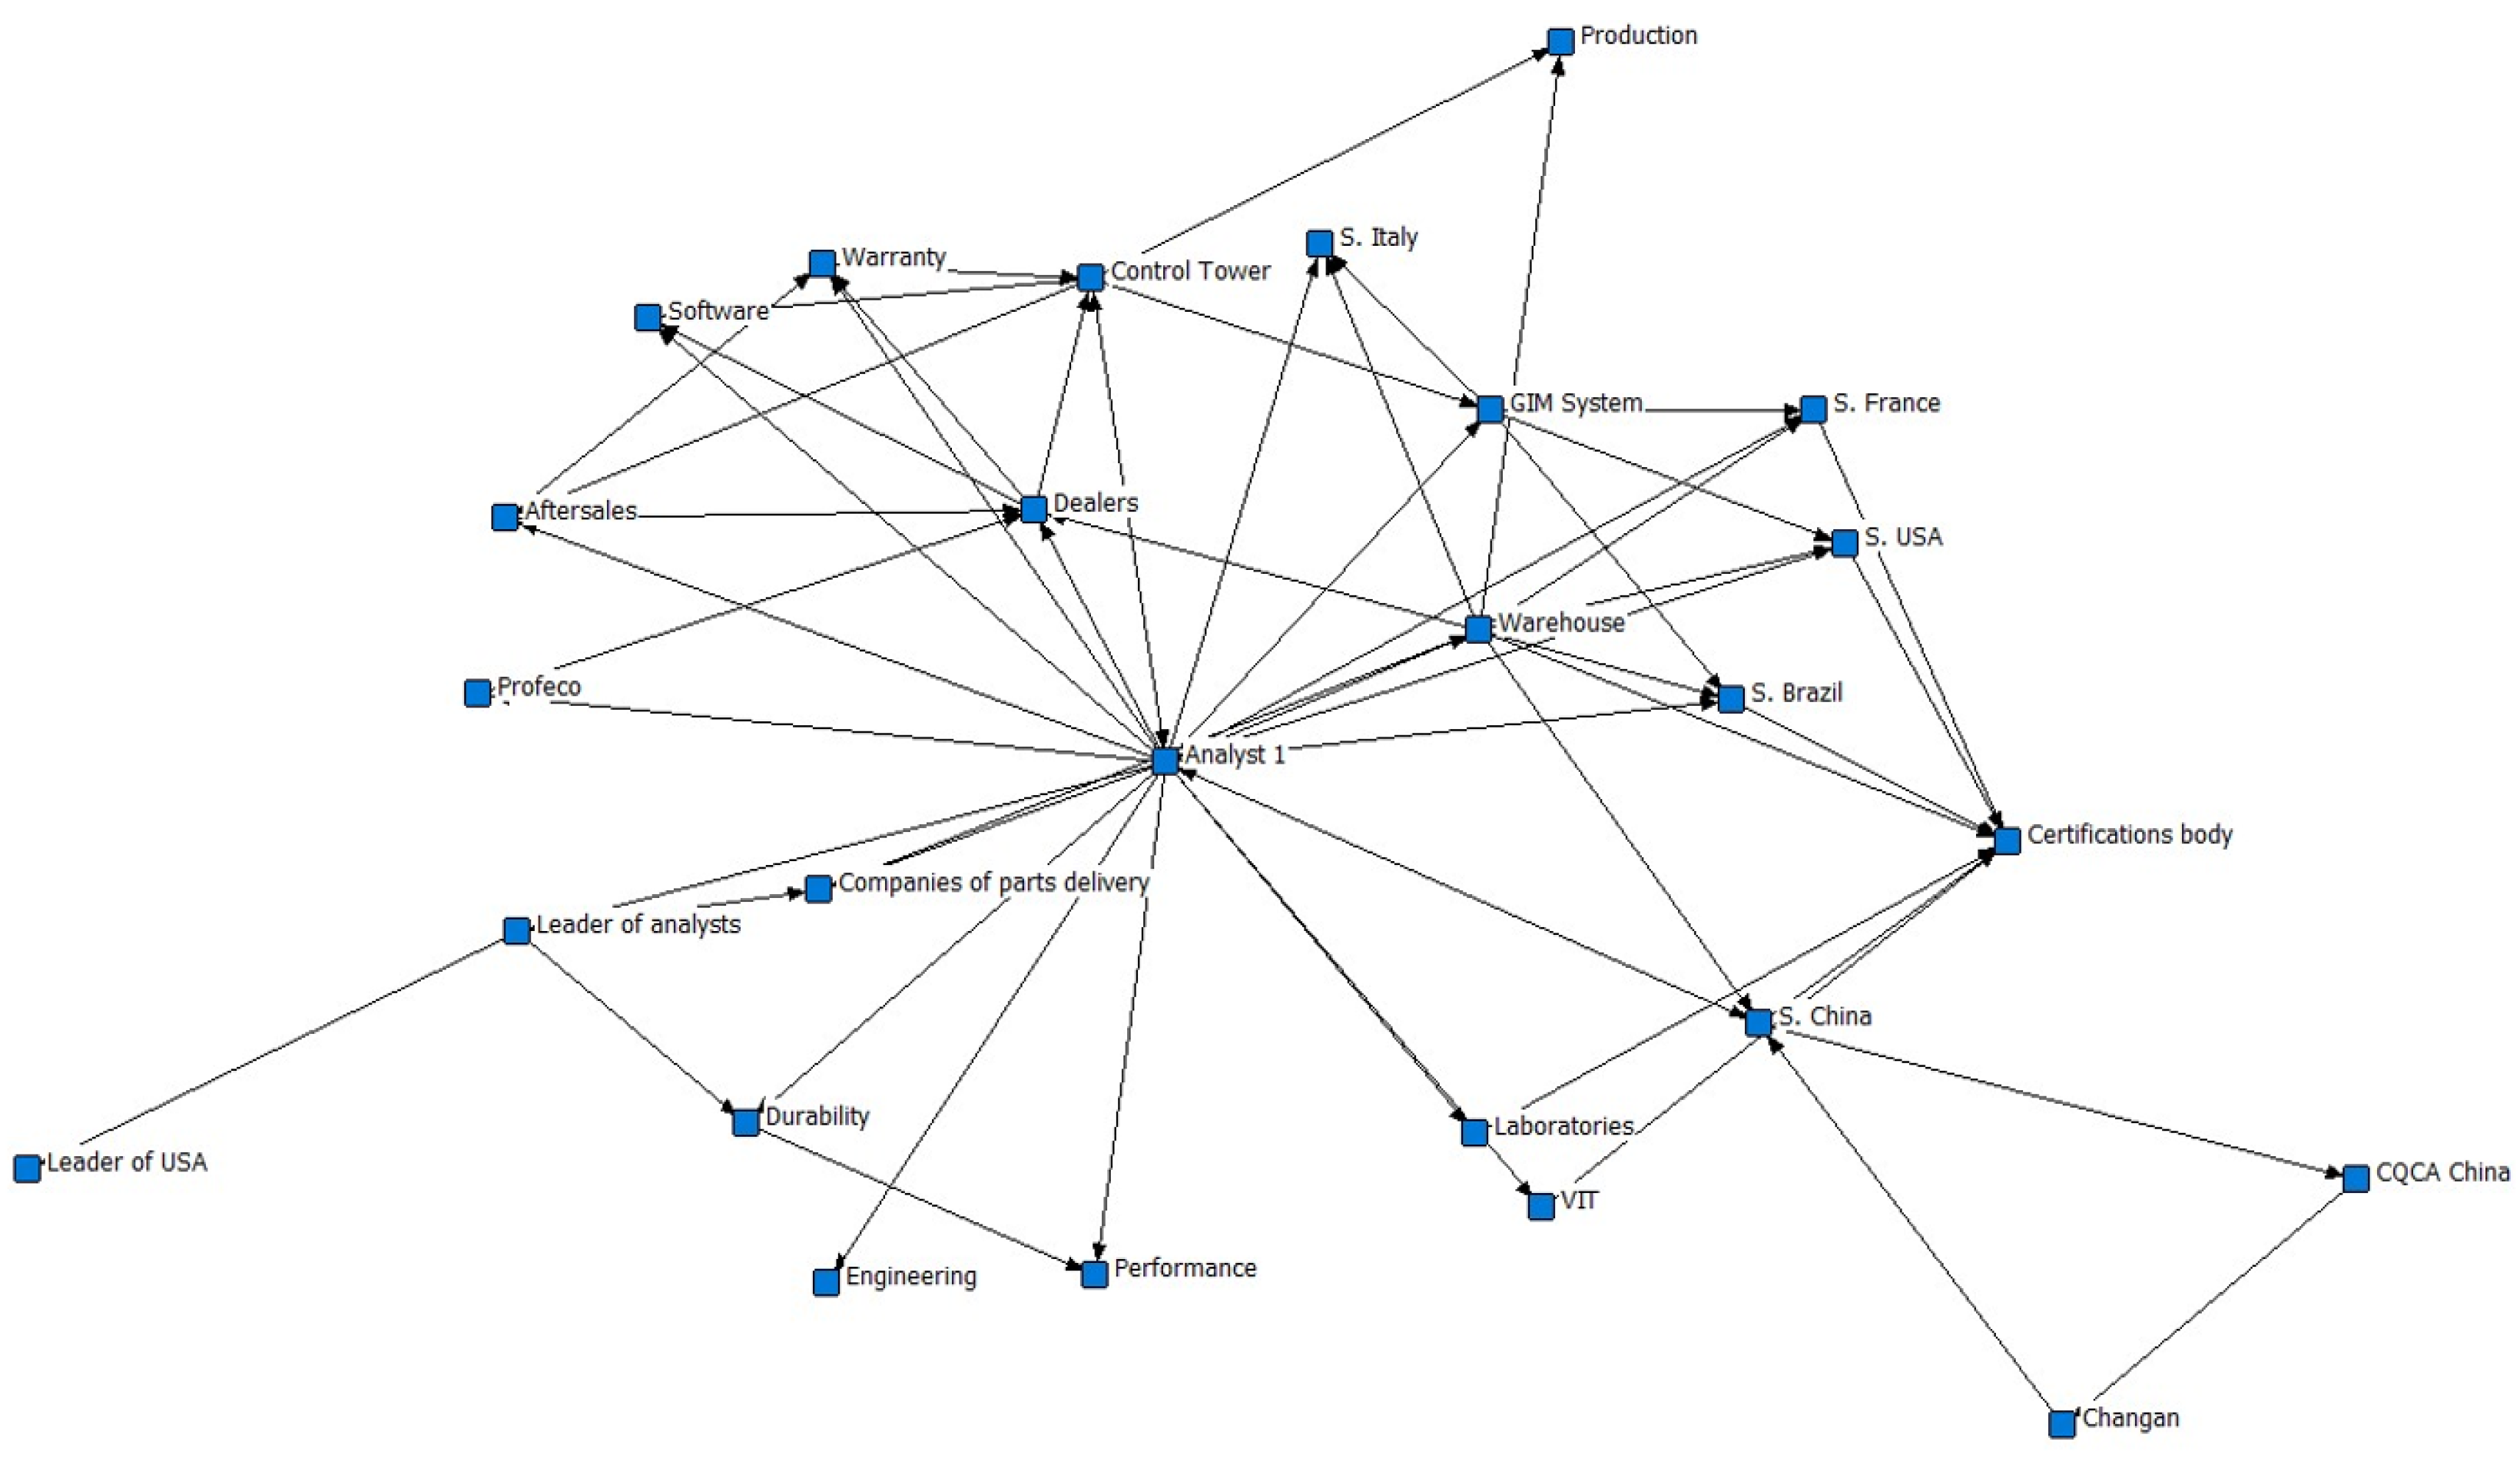
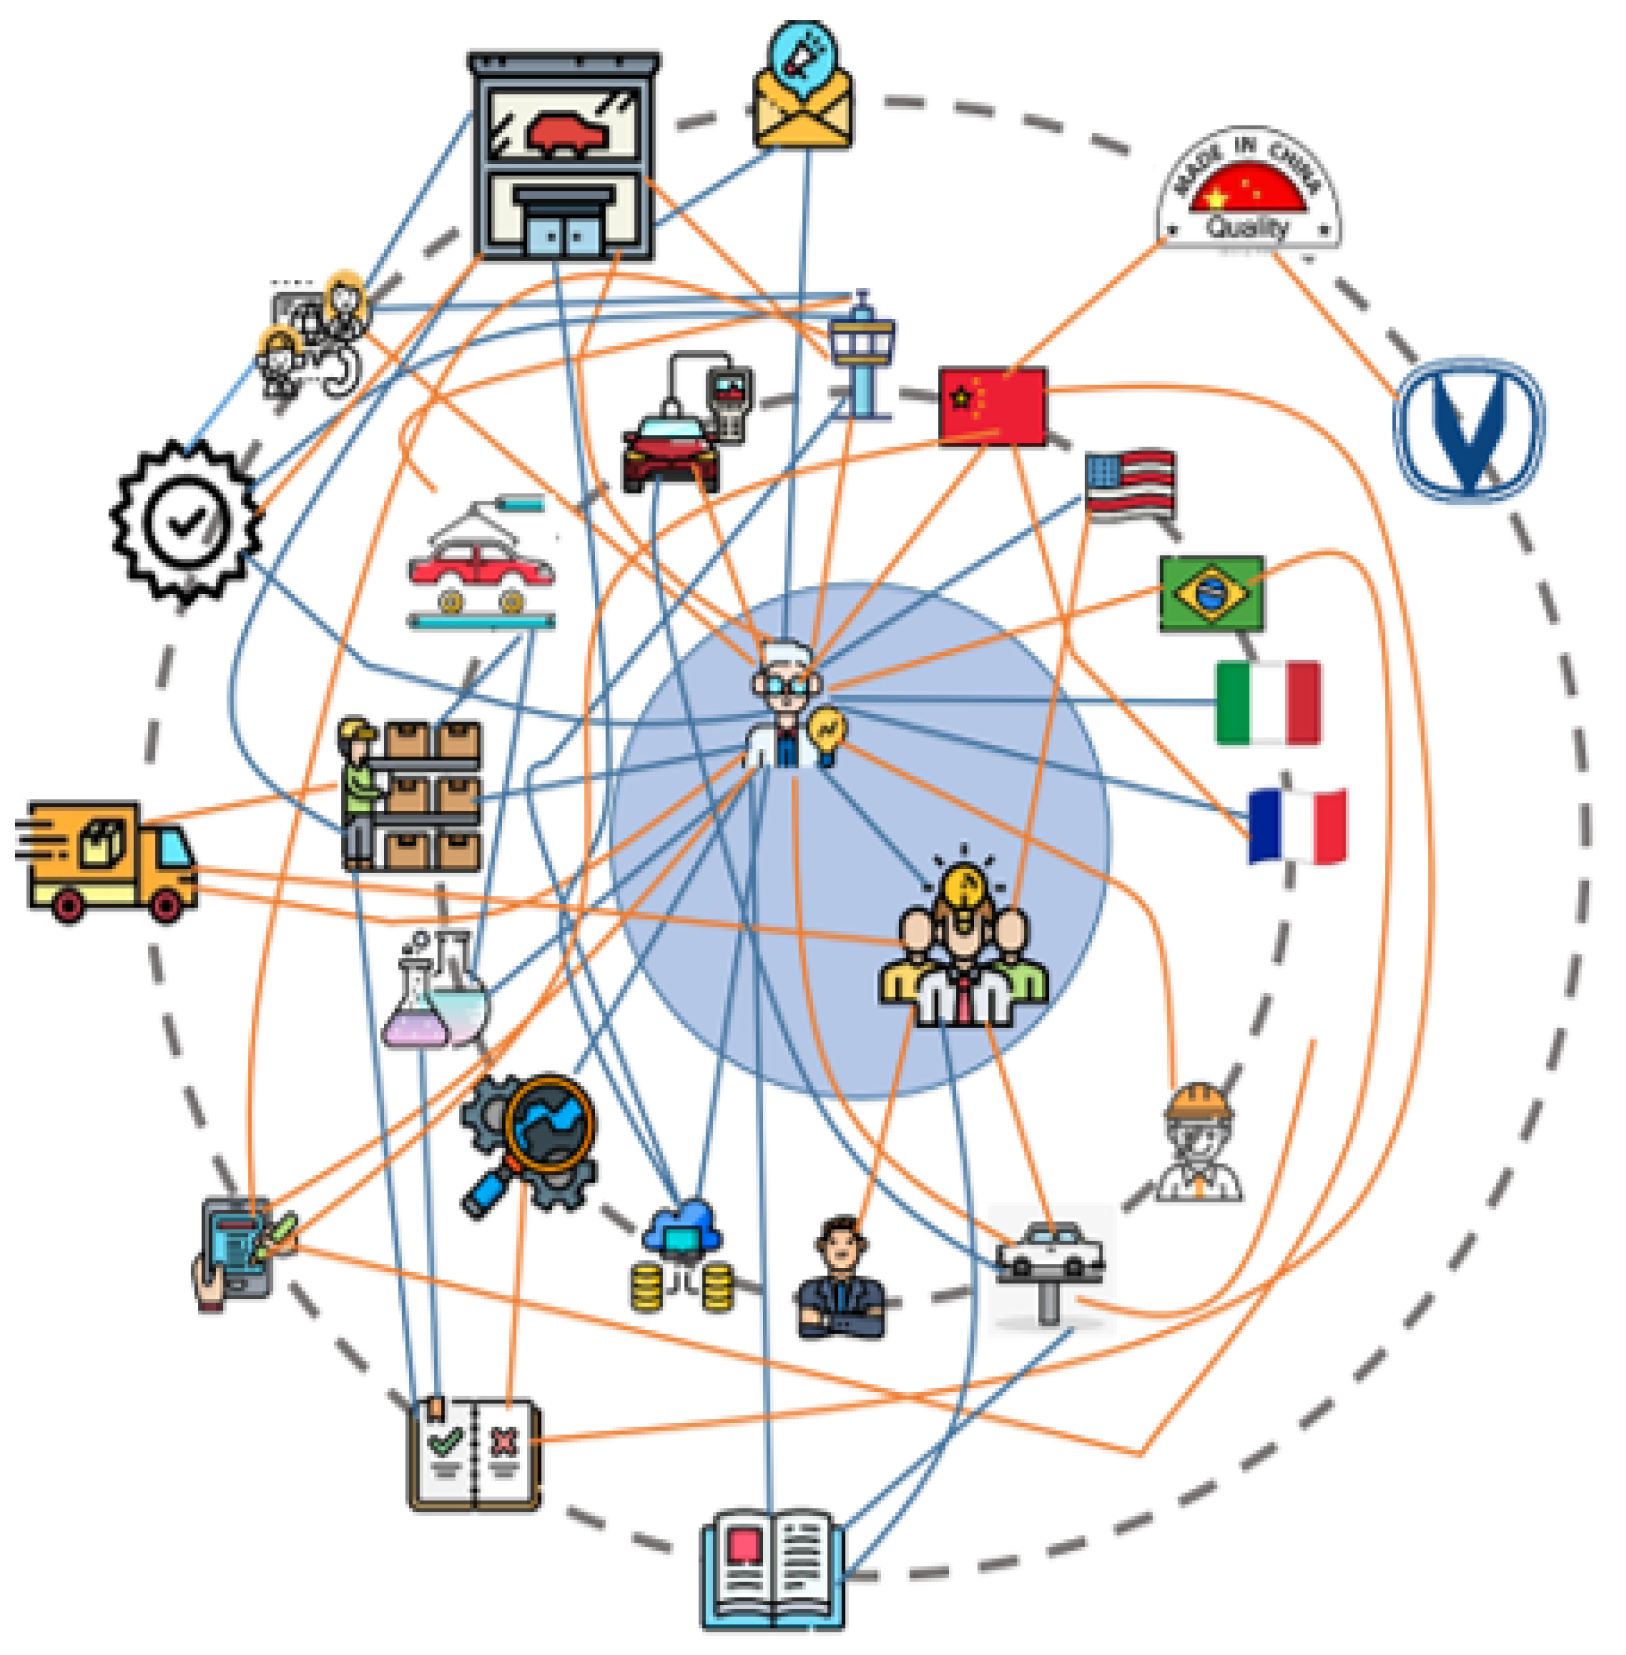
  • The members of the Issue Resolution subsystem are only two: Analyst 1 and the Analyst Leader, who perform the necessary activities to achieve the subsystem’s objectives.
  • The areas that interact with the Issue Resolution subsystem members, as it is crucial for the main actors to interact with other systems to achieve the objective.

3.3.2. Quantitative Analysis

To build the network topology, we create adjacency matrices. Once obtained, we used the UCINET© software [73]. For this research, the general matrix network of the quality process was initially created with its three subsystems (Figure A1). Later, the matrix for the Issue Resolution subsystem was obtained (Figure A2). The following results were obtained Table 7 and Table 8.
  • Identification of a Network Model Representing Issue Resolution Area
To identify a representative model of the actual degree distribution in the Quality System matrix network, a theoretical model distribution was conducted, comparing it with a random network following a Poisson distribution (Figure A3b). The same procedure was applied to our focus system, Issue Resolution subsystem, using the Poisson distribution (Figure A3d).
Comparison of both the Quality Area Network and the Issue Resolution Subsystem Networks (Figure A3) indicates that the random network model better describes the topology of the constructed network in terms of degree distribution. Therefore, both networks align more closely with the random network model.
To perform the calculations for the random networks under study, it is necessary to characterize and classify the point of evolution of the network (Table 9).
As observed in Table 9, the analyzed networks exhibit supercritical regimes, indicating that they are poorly connected. This lack of connections and links makes these networks more complex, complicating the Analysts’ and the Analyst Leader’s ability to monitor and address issues reported in light commercial vehicles by dealership clients.

3.4. Stage 4: Define Relevant Activity Systems (CATWOE)

Once the rich vision of the system has been developed and conflict relationships have been detected, the relevant systems must be established, that is, the human activity systems essential for the functioning of the system. In order to define them, the CATWOE mnemonic (for its acronym in English: Client, Actor, Transformation, Weltanschauung, Owner, Environment) is applied.
  • Root Definition of the Issue Resolution System Based on the above and supported by the phenomenological methodology, the root definition of the Issue Resolution System is proposed as follows. The Issue Resolution System is a company-owned system that promotes systemic value generation through the resolution of problems in sold products, which, if unresolved, could lead to severe consequences for customers and, in turn, create a negative reputation that could directly impact the business and its objectives.
  • Relevant Systems Based on the root definition, the relevant systems are derived and framed by the CATWOE. Each relevant system is presented with its own root definition, reflecting an iterative process for the relevant Issue Resolution System.
    Client: The customer is the area that requests support for problem resolution, and two divisions have been identified. Before the sale: The international counterparts (China, Brazil, USA, France, Italy) and the internal areas of the organization that interact in the problem resolution process before the vehicles are marketed.
    After the Sale: The final customers who purchased vehicles, agencies and the warranty department as they are directly affected by the quality of the product and the efficiency in problem resolution.
    Actors: In the Issue Resolution System, the following are included:
    Before the Sale: Engineering warehouse, laboratories, information platforms, control tower, design engineering, parts development, Analysts and Analyst Leader.
    After the Sale: Post-sale, Dealers, Warranty department, PROFECO (Federal Consumer Protection Agency by its acronym in Spanish), Parts shipping companies, and analysis and diagnosis personnel, Analysts, and Analyst Leader.
    Pre-sales transformation: Converting design and production problems into effective solutions before vehicles reach the market.
    After-sales transformation: Resolving problems detected in vehicles already sold, improving customer satisfaction, and reducing the costs associated with warranties and claims.
    Worldview (Weltanschauung): In the Issue Resolution System, the worldview perceives that, by generating systemic value in the Issue Resolution, the warranty costs generated by faults detected in light vehicles will be reduced to a minimum and this can be measured through customer satisfaction, since it is not only key for retention, but also influences market perception and future sales.
    Owner: The General Management of the organization and the operational management areas (System 3 and System 5), which establish the policies, strategies, and resources necessary for the operation of the Issue Resolution System.
    Environment: National and international regulations, international treaties, response times of foreign counterparts, client expectations, budget limitations, and the technological capacity available for analysis and diagnosis.

3.5. Stage 5: Generation of Conceptual Models

The following describes each of the subsystems that make up the model, as well as their root definition.
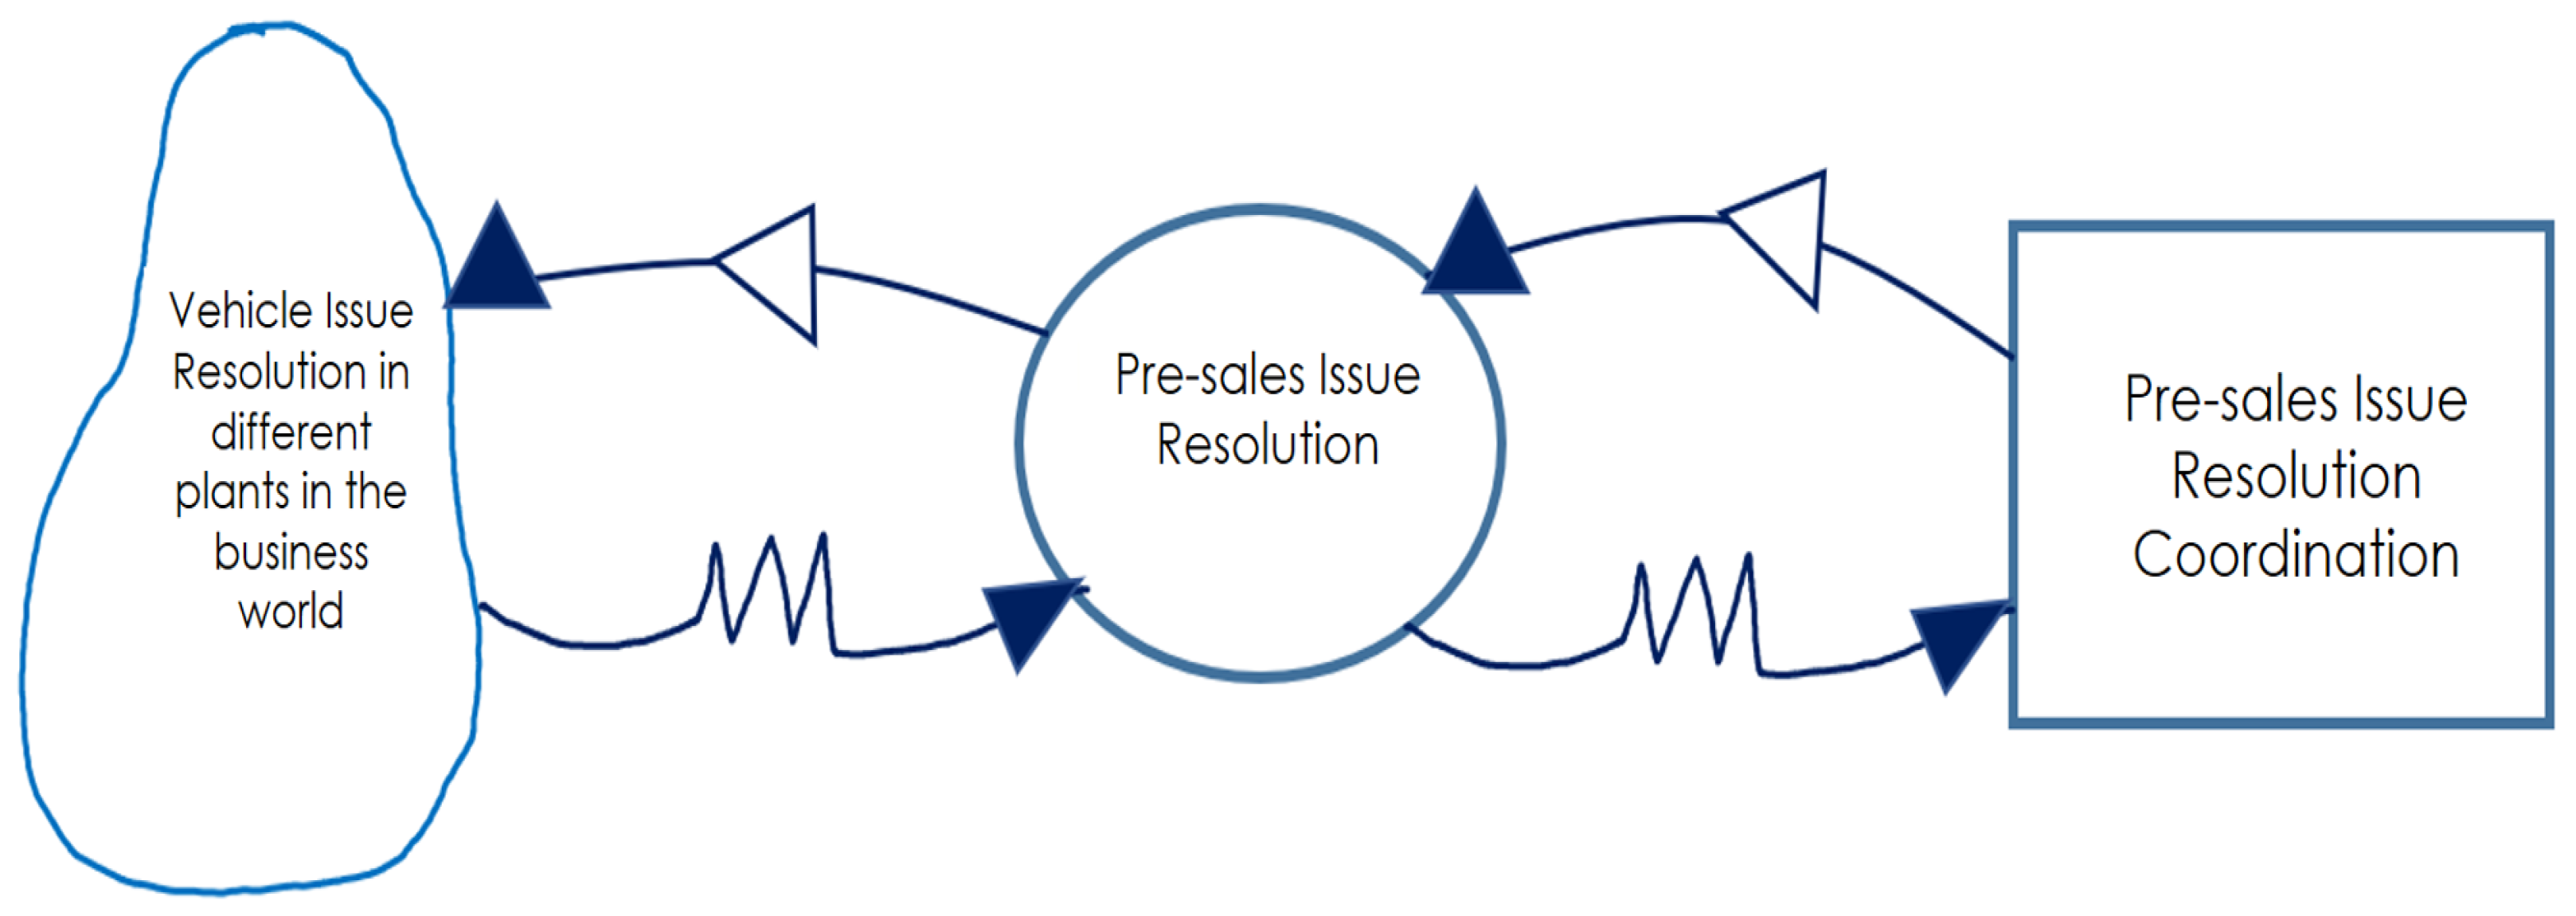
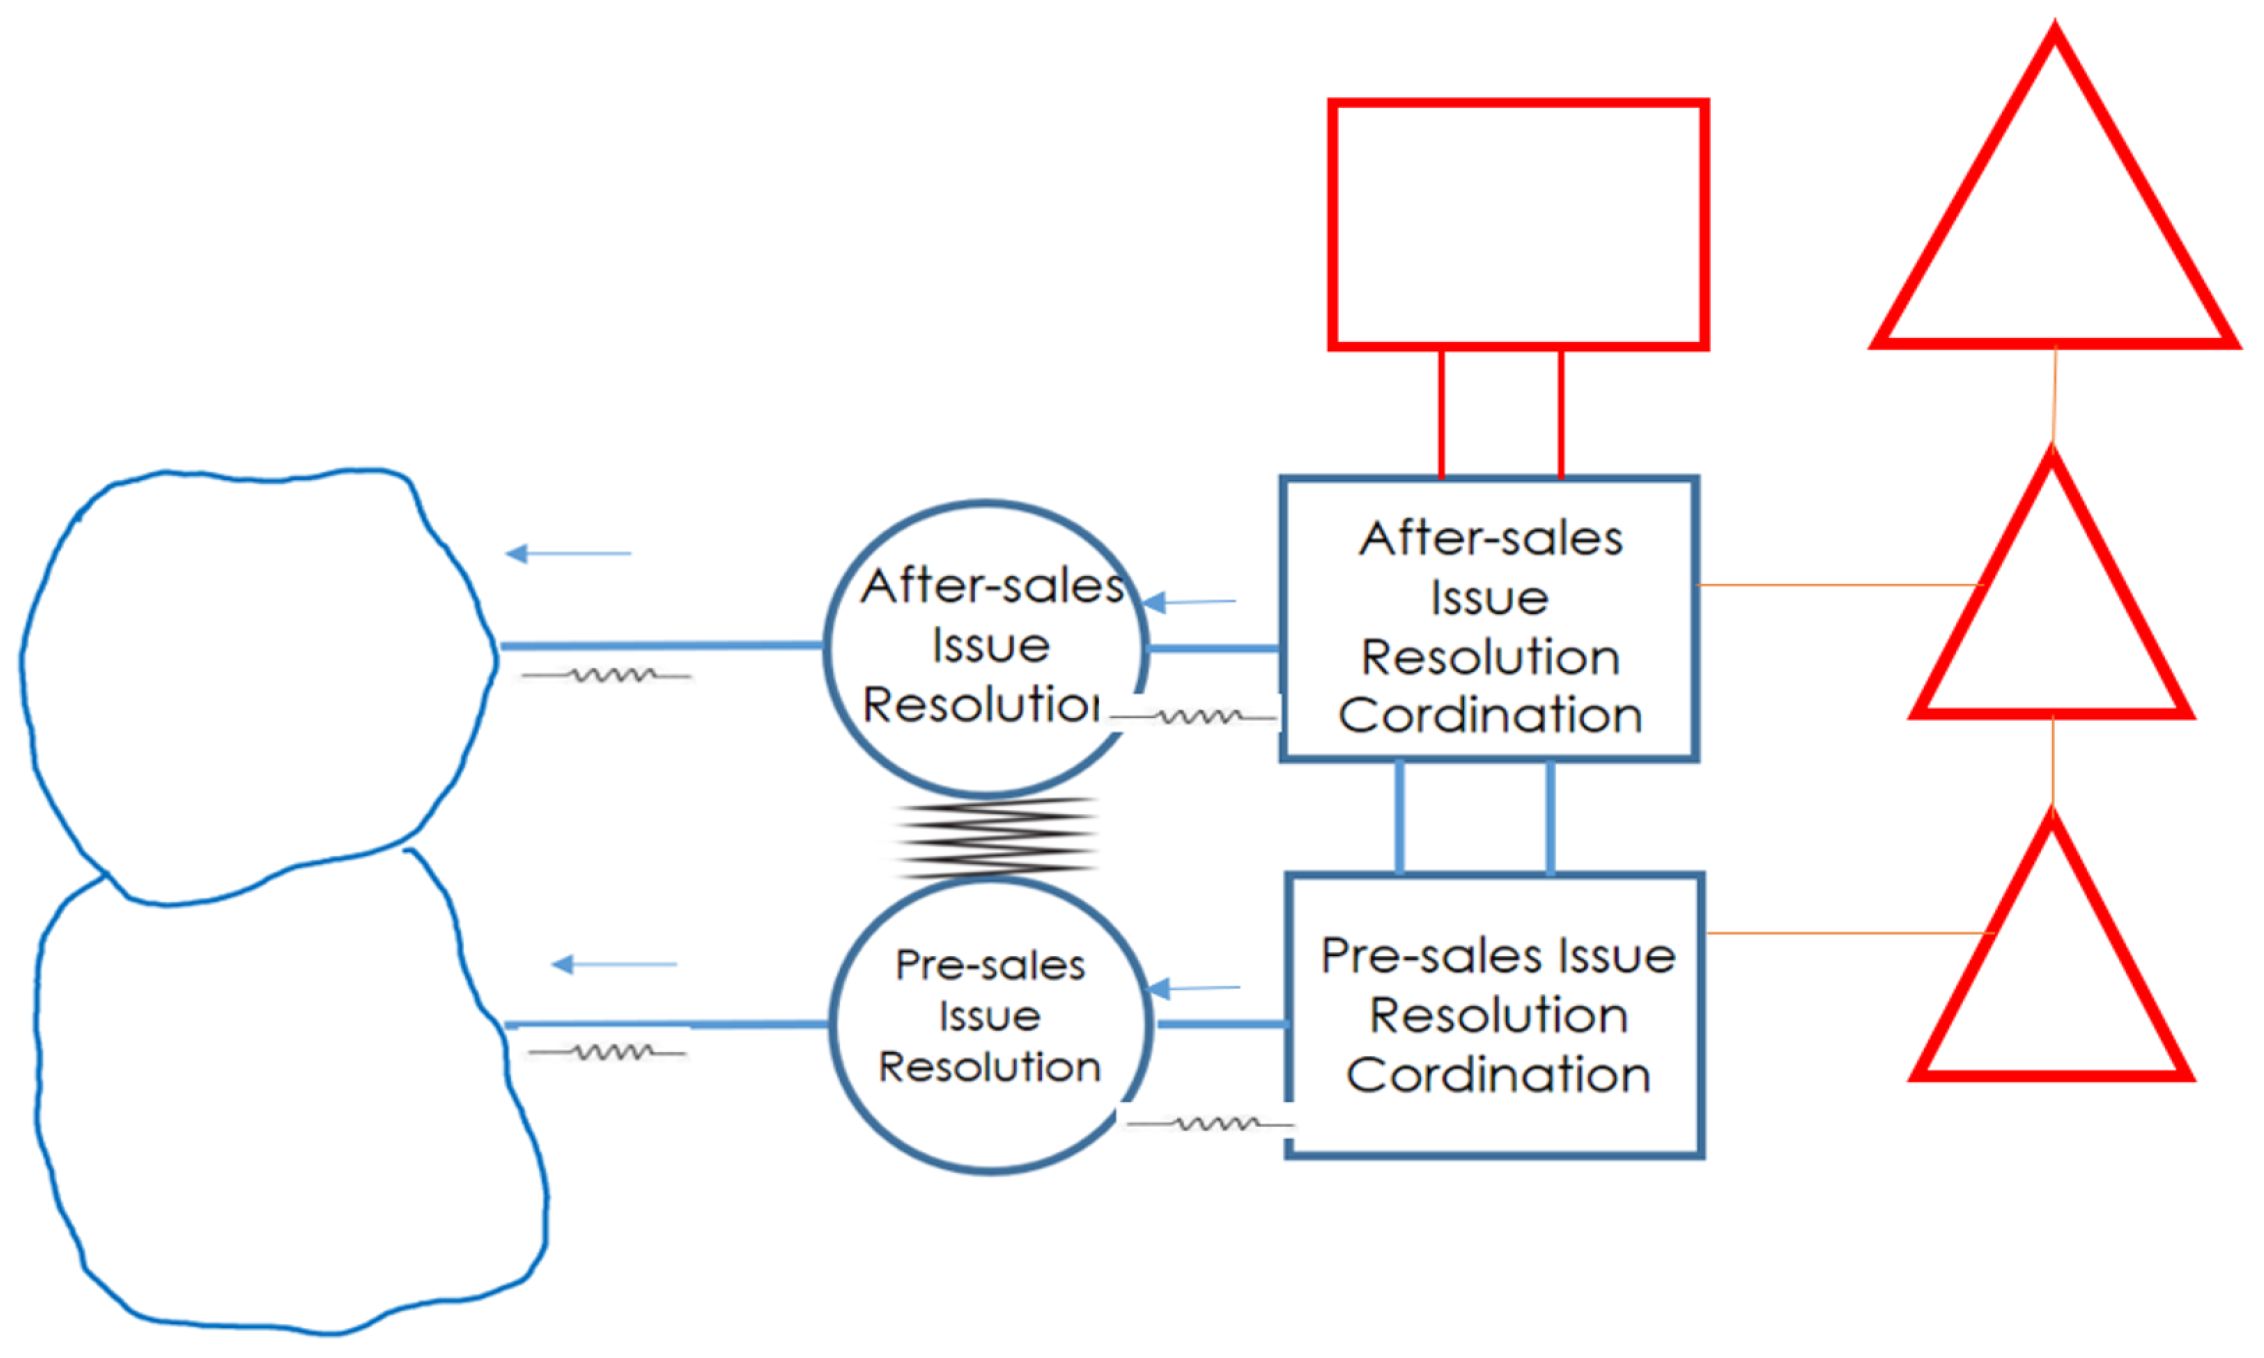
  • System 1: Given the type of activities involved in the Problem Resolution area, System 1 consists of two subsystems that support its operation. These subsystems are: (1) Problem resolution before mass production, (2) Problem resolution after mass production (Figure 6).
Since each of the systems at their recursive levels must be viable by itself, in a particular way each of them has its own environment, operations, coordination, and management unit, so as a root definition they provide information on the operation and problems presented in the operating units to the General Management Systems of the Organization. The two operating subsystems are detailed below.
Figure 6. Subsystem 1 of the Issue Resolution System. Source: Author’s own elaboration.
Systems 13 00343 g006
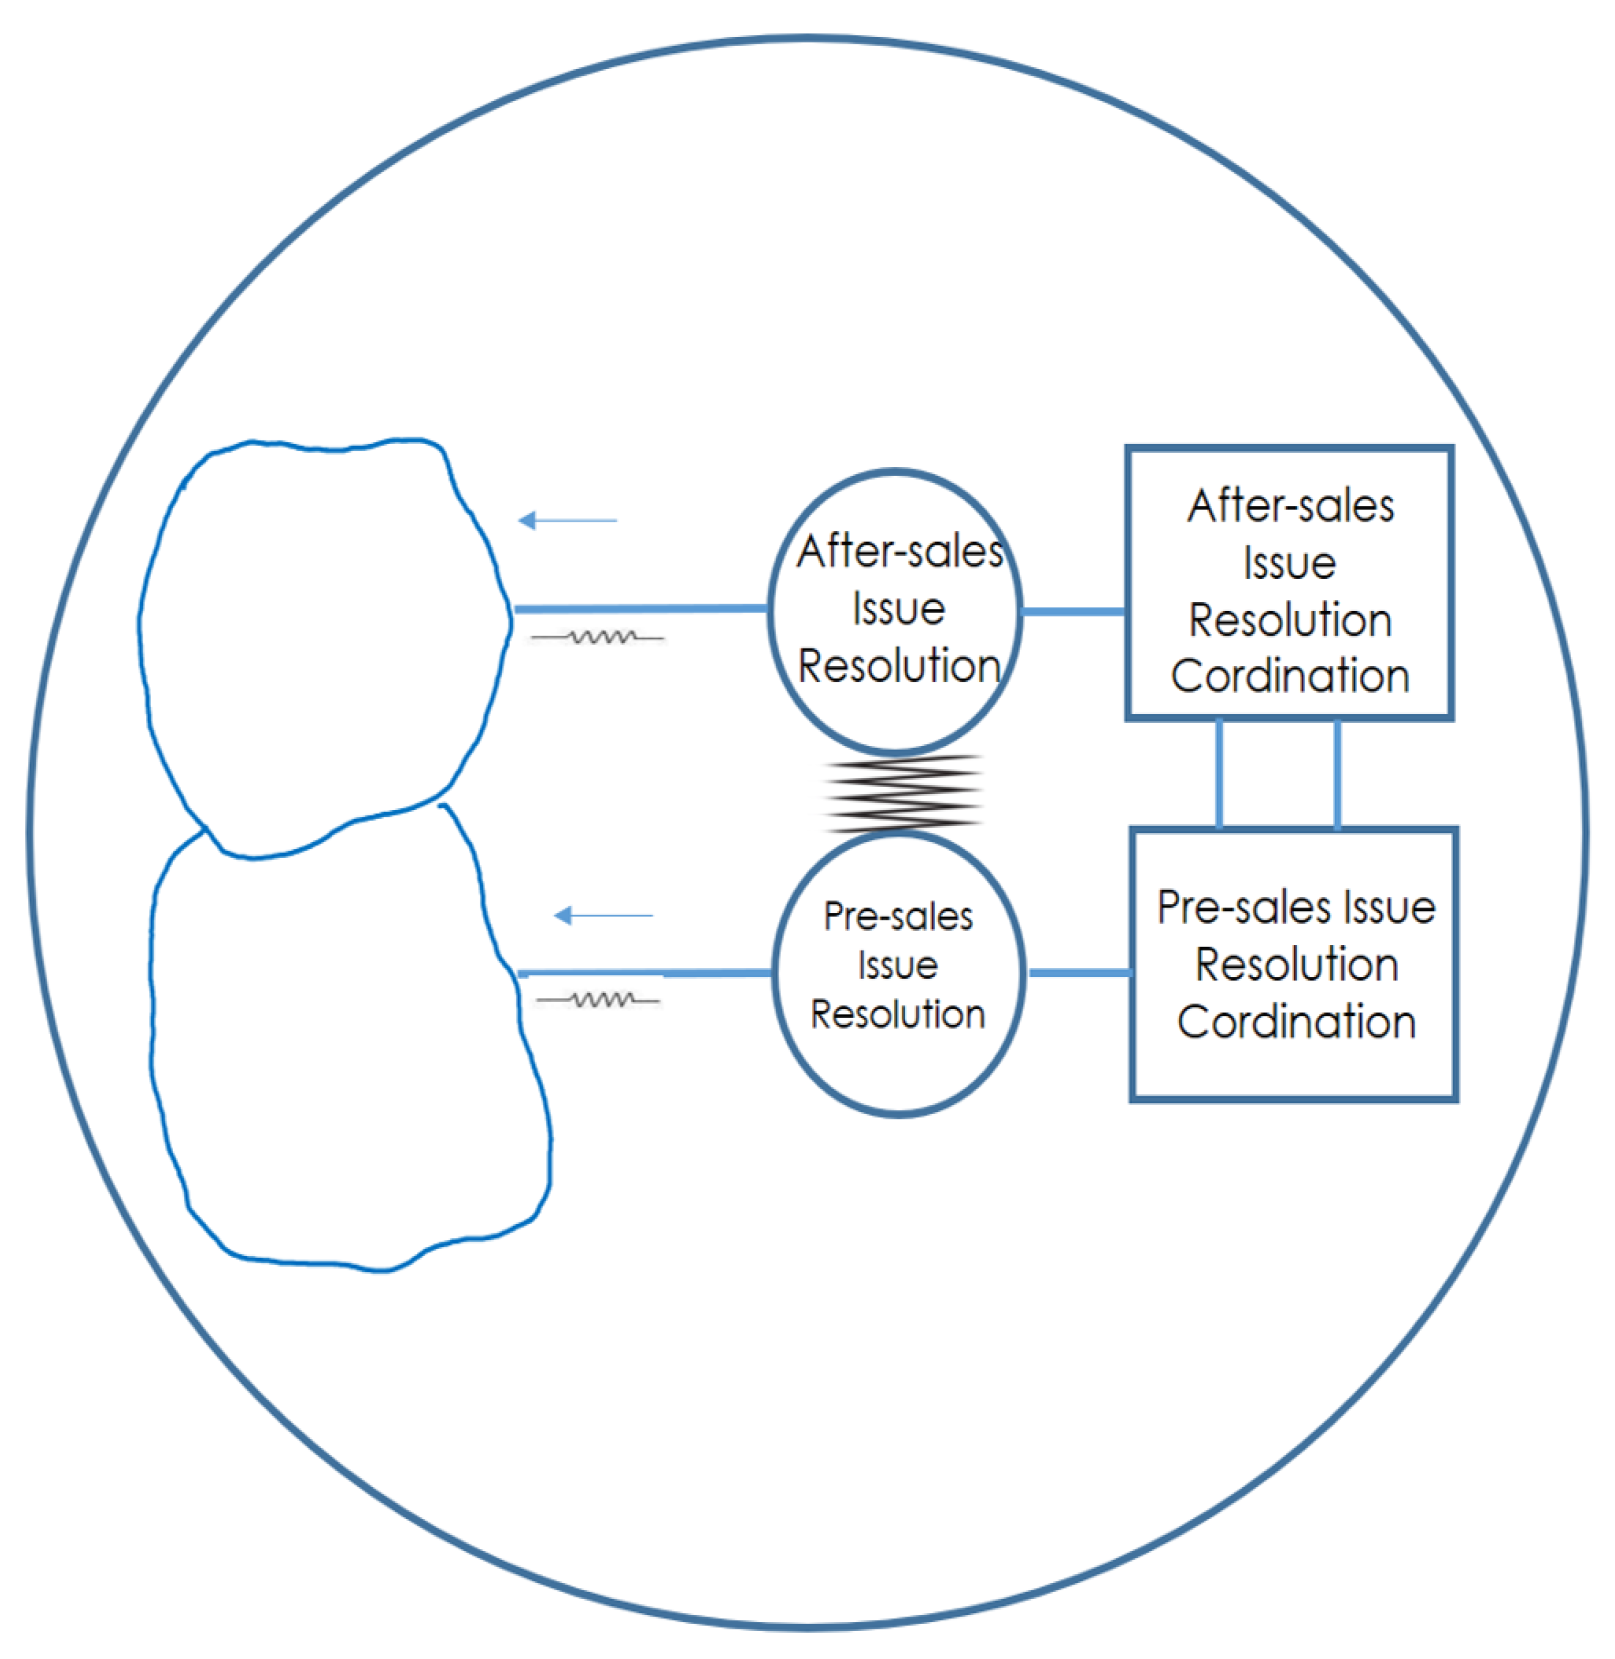
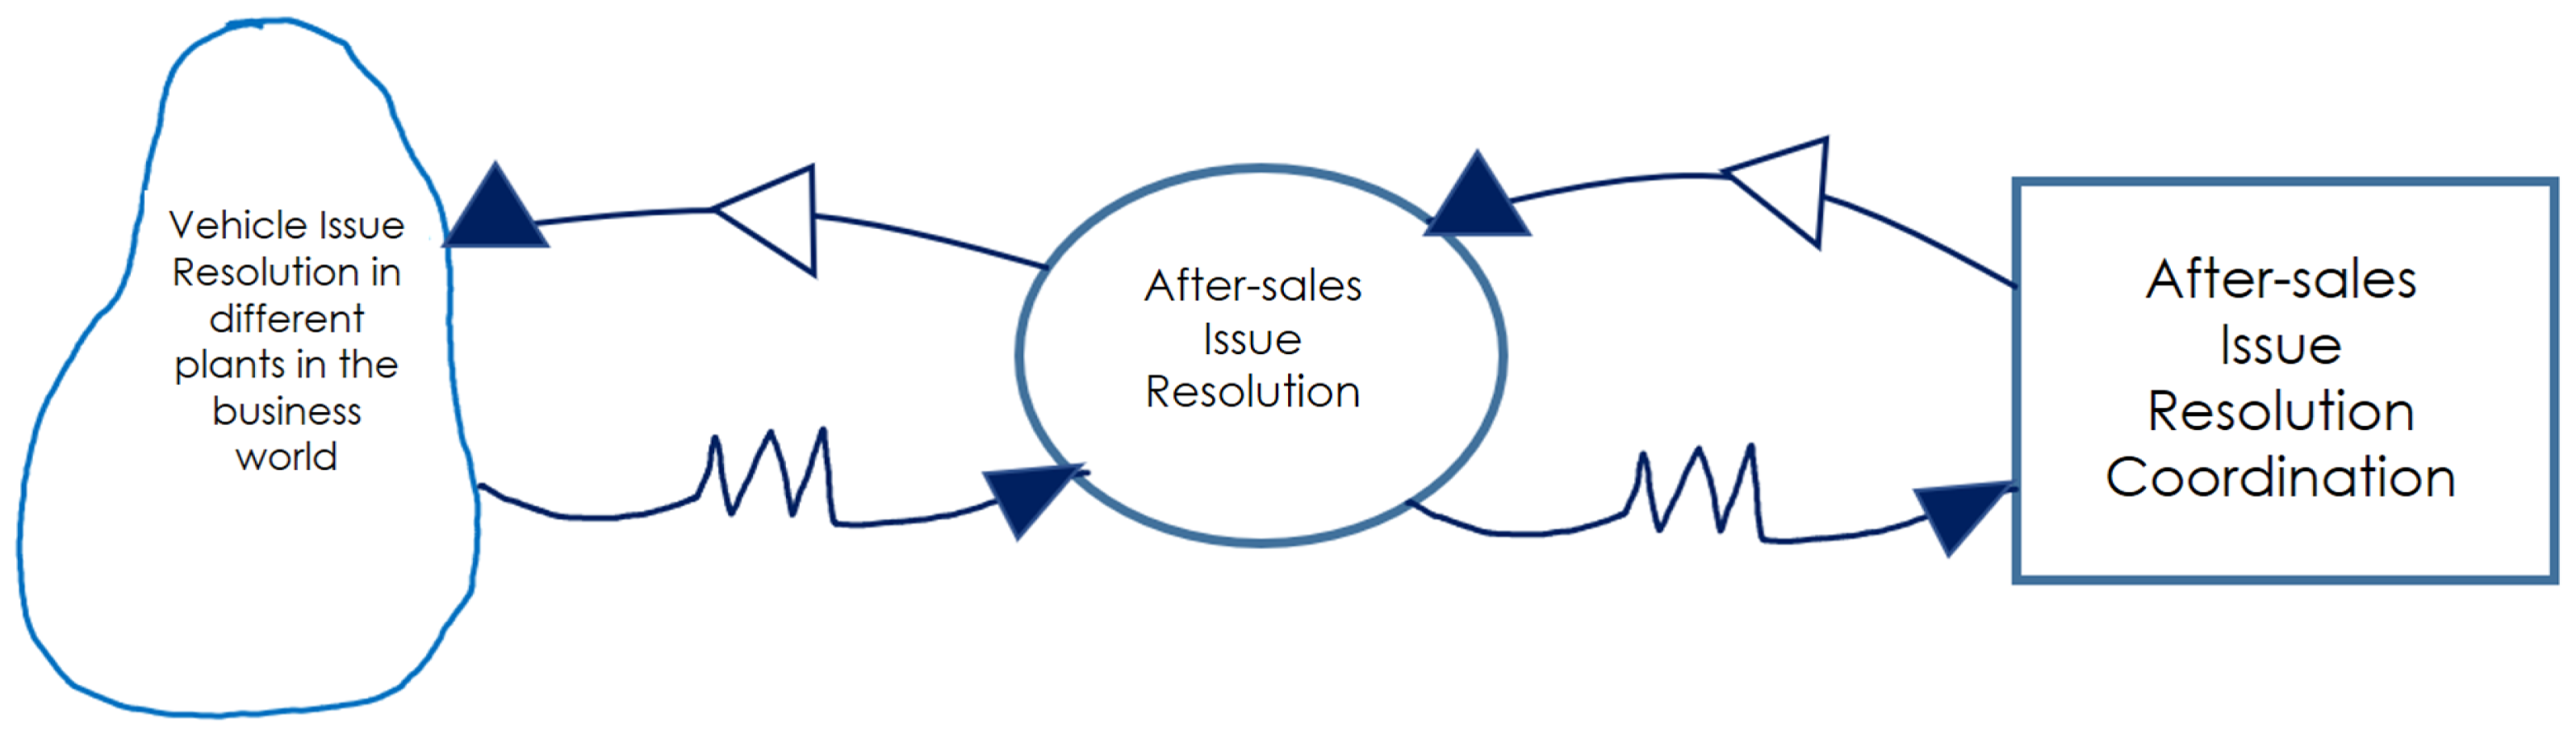
  • Pre-sale Issue Resolution Subsystem Root definition: The pre-sales problem resolution system is the system in charge of receiving the problem, gathering information, managing interactions among countries, analyzing information, detecting root causes, and generating problem solutions, which it provides to the countries of origin where the vehicle to be sold is produced, through synergy with the areas that interact with it, belonging to the same organization, whether national or international. As its root definition indicates, this subsystem presented in Figure 7 is in charge of resolving problems that arise before vehicles go on sale. In order to carry out this activity, the subsystem works with actors such as: Engineering Warehouse, laboratories, company information platforms, control tower, VIT area, engineering (Design and development of parts and components), parts shipping company, durability, performance, counterparts in China, counterparts in Brazil, counterparts in the United States, counterparts in France, counterparts in Italy, the Analyst Leader and the Issues Reception Platform. The operational areas have mechanisms that facilitate adequate interaction with the environment, known as amplifiers. These amplifiers increase the organization’s capacity to transmit information to the outside, or enhance the ability of managers to interact effectively within the same organization. In the Issue Resolution System model, amplifiers and attenuators are defined in the stage of choosing agile elements.
  • After-sales Issue Resolution Subsystem Root definition: In the case of the after-sale problem resolution system, it is the system in charge of receiving the problem, gathering information, managing interactions among countries, analyzing information, detecting root causes, generating problem solutions, which is provided to the countries of origin, where the vehicle to be sold was produced, through synergy with the areas that interact, belonging to the same organization, whether national or international. As its root definition indicates, this subsystem presented in Figure 8 is in charge of resolving problems that arise after the vehicles have gone on sale and have been used by the customer. In order to carry out this activity, the subsystem works with actors such as: Engineering Warehouse, laboratories, Own company information platforms, control tower, VIT area, after-sales, agencies, Warranty Department, engineering (design and development of parts and components), PROFECO, parts shipping company, durability, performance, counterparts in China, counterparts in Brazil, counterparts in the United States, counterparts in France, counterparts in Italy, the Analyst Leader and the Issues Reception Platform. The operational areas have mechanisms that facilitate adequate interaction with the environment, known as amplifiers. These amplifiers increase the organization’s capacity to transmit information to the outside, or enhance the ability of managers to interact effectively within the same organization. In the Issue Resolution System model, amplifiers and attenuators are defined in the stage of choosing agile elements.
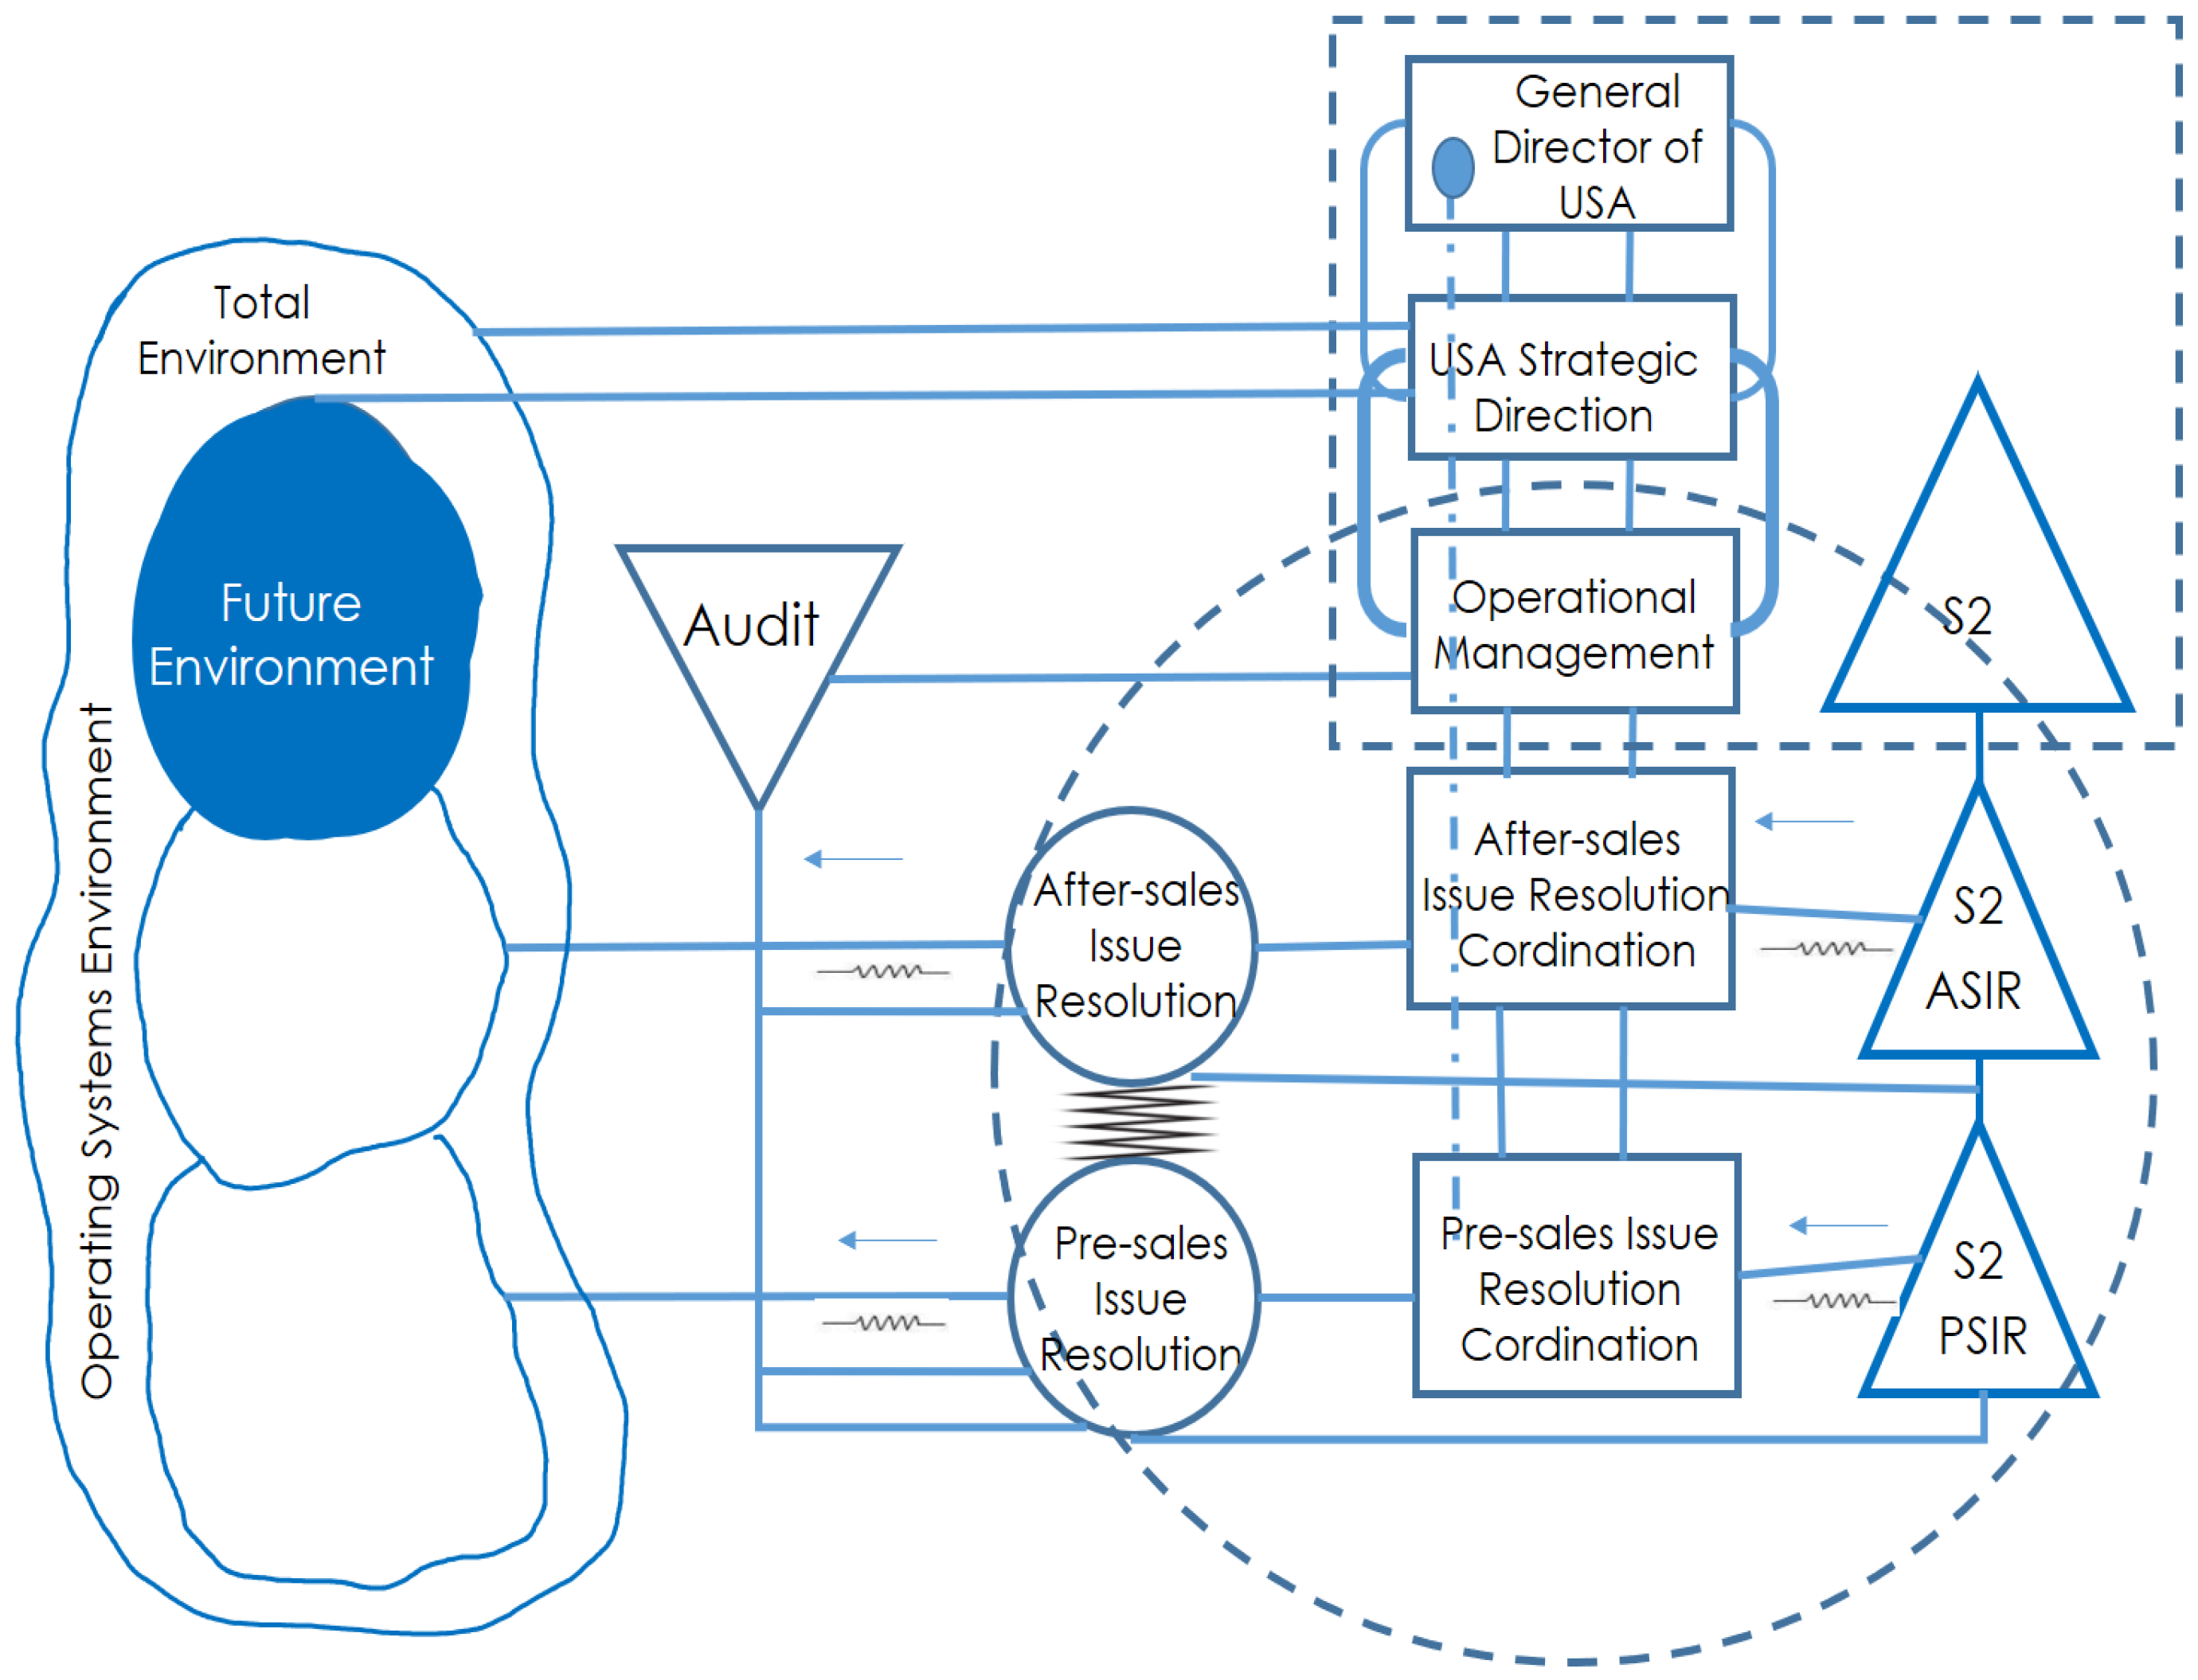
  • System 2: This system is responsible for coordinating the proper functioning of the operating units (S1), for which it receives information from the local systems of each of them. The design of this system is carried out jointly by the heads of the operating departments of each unit, with the support of System 3. System 2 (Figure 9) includes information systems, production scheduling, task scheduling, coordination teams, procedures, national and international regulations, and international treaties. These activities, particularly information systems, act as amplifiers and attenuators among operating departments, their coordination unit, and the general coordinating unit of the system.
    Subsystem 2 acts as a system that prevents oscillations. This system operates outside the chain of command and is defined as a support system.
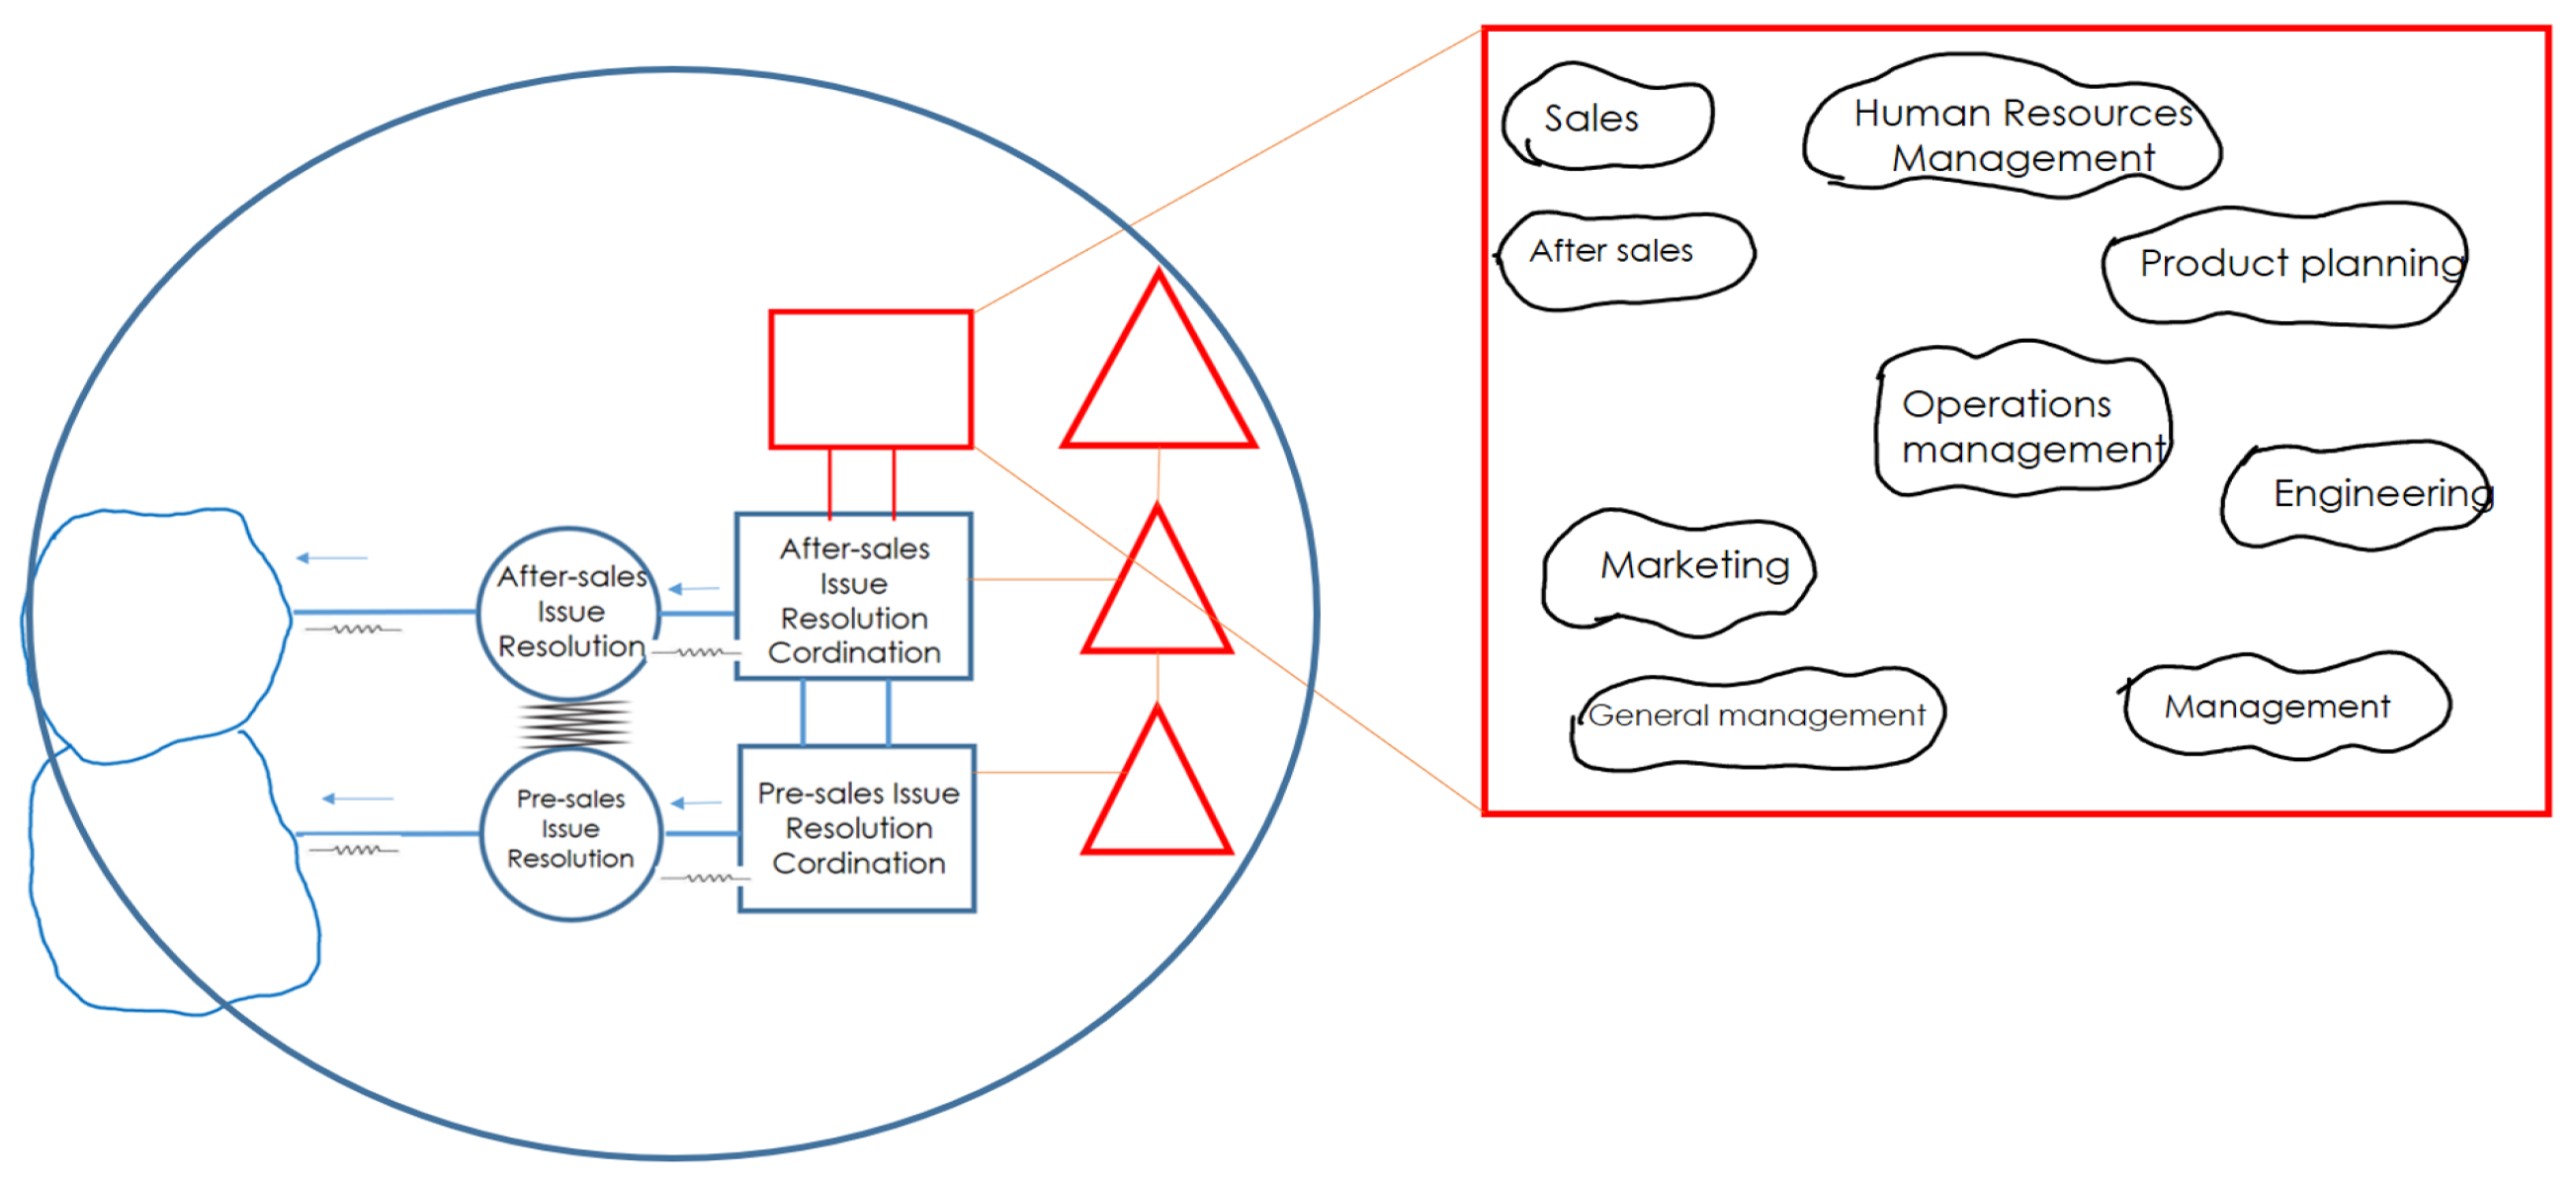
  • System 3: It is considered the central axis of the entire system, or the key system for the functioning of the organization. Its responsibility is the present of the organization. This system covers both operational and management activities. In operational activities, it is responsible for ensuring the good performance of the operating units, with a comprehensive view of System 1, from which it receives information on the performance of operations and the fulfillment of objectives. In addition, it distributes financial, material, and human resources to each unit and communicates the instructions and objectives provided by System 4 or System 5. Regarding management activities, Subsystem 3 collaborates with System 4 to implement the necessary changes in System 1, thus ensuring the correct functioning of the organization. In general, this system includes sales activities, human resources management, administration, after sales, product planning, general management, operations management, marketing, and engineering (Figure 10).
    Subsystem 3 is supported by a mechanism called Homeostases, which acts as a regulatory channel between System 3 and System 4. Through this channel, internal and external information is managed in the past, present, and future, to facilitate decision-making and ensure that the necessary changes to System 1 are implemented in a timely and appropriate manner.
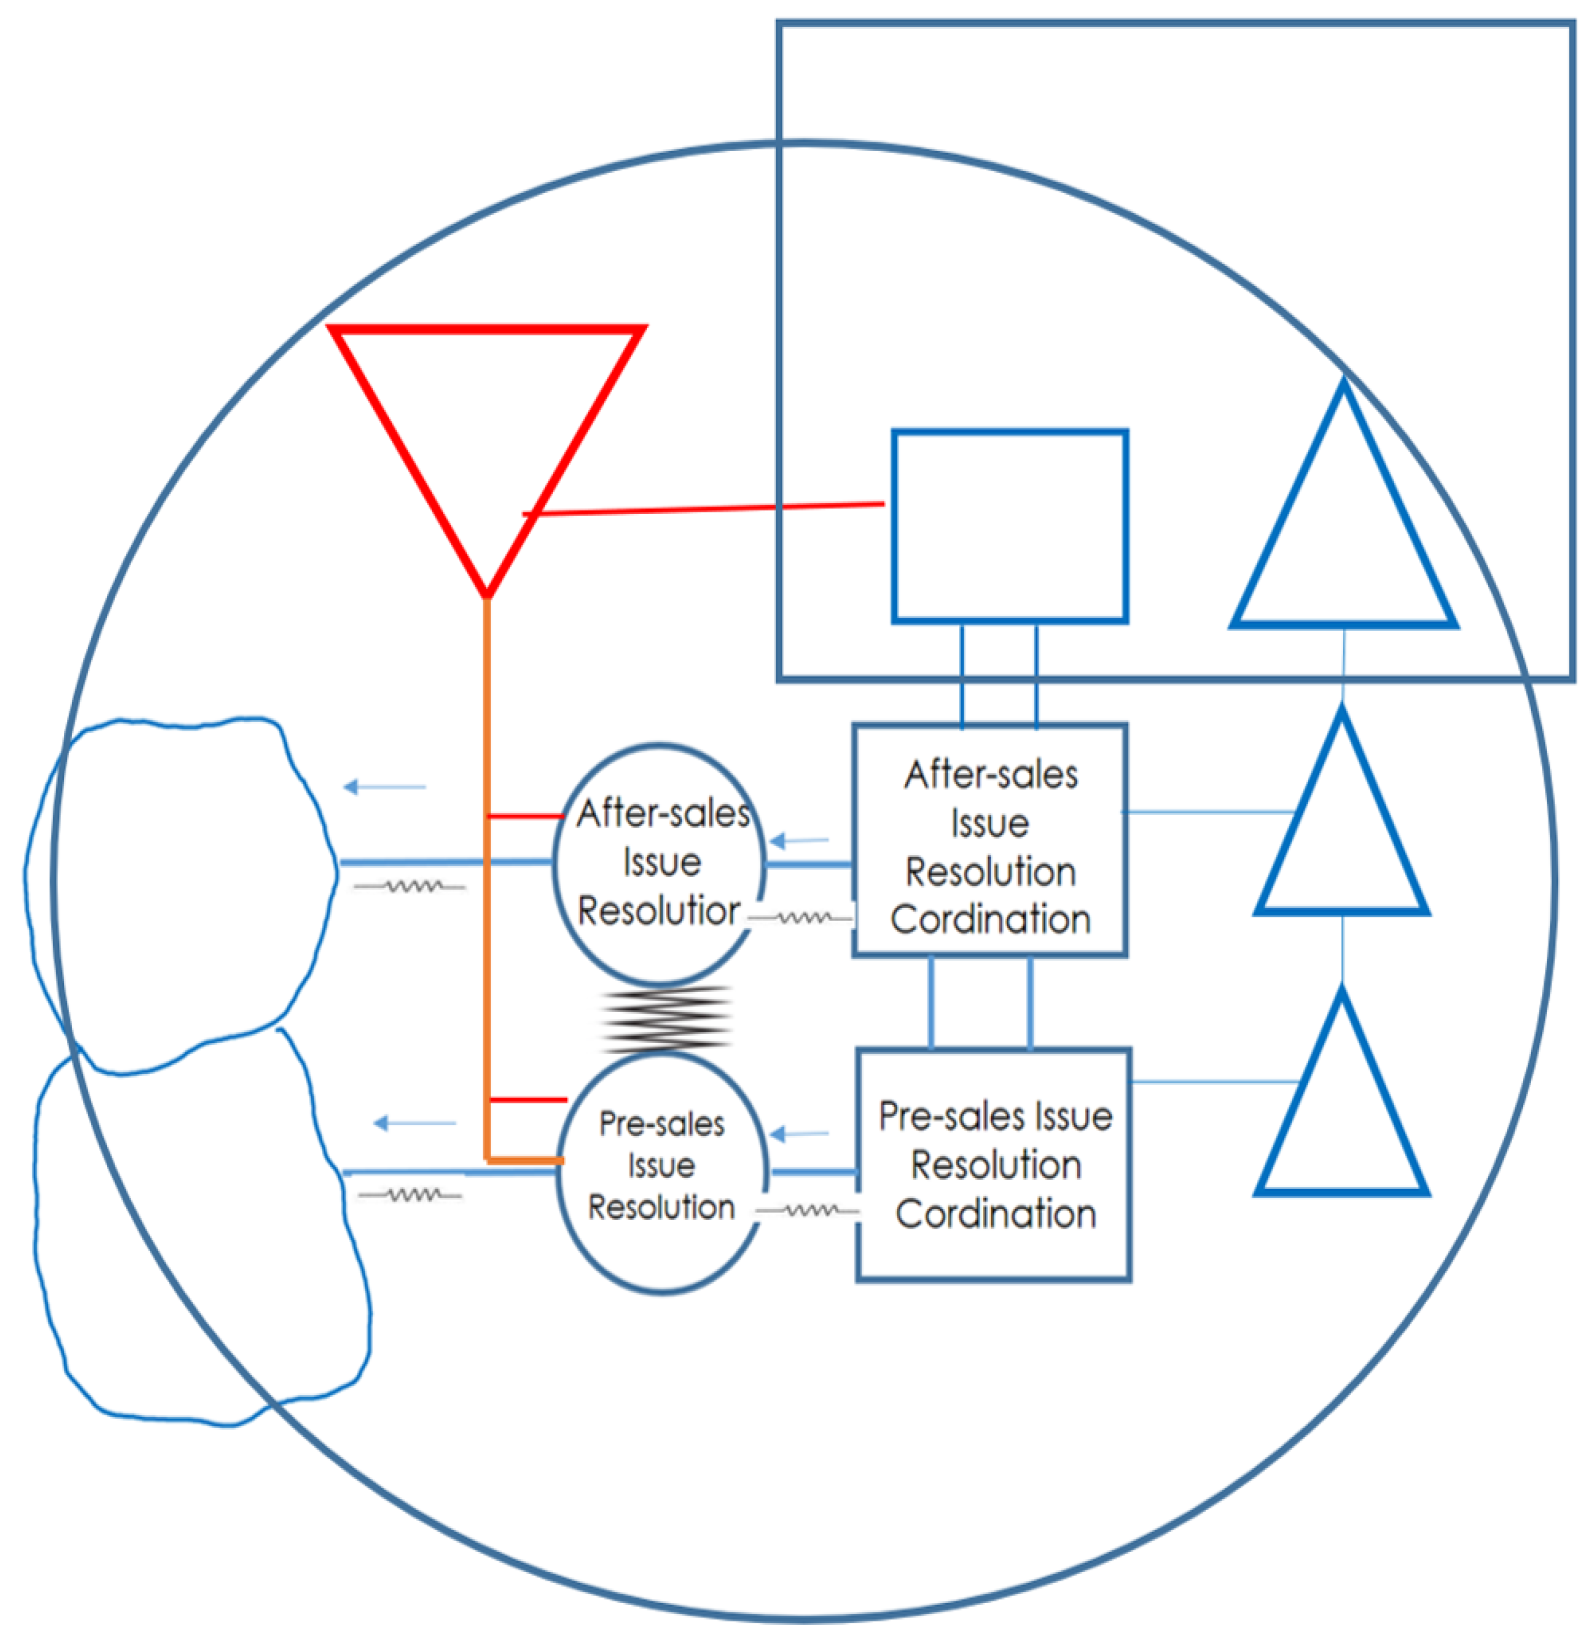
  • System 3*: Figure 11 shows how to collect and process information that cannot be transmitted through System 2 or System 3, but which is crucial to the functioning of the Total System. System 3* must ensure the collection of accurate and complete information flowing from System 1 to System 3. This is done through internal and external audits, competitiveness analysis, environmental impact studies, international certifications, global assessments, comparisons of customer satisfaction results, as well as informal data collection mechanisms such as surveys, interviews, and polls.
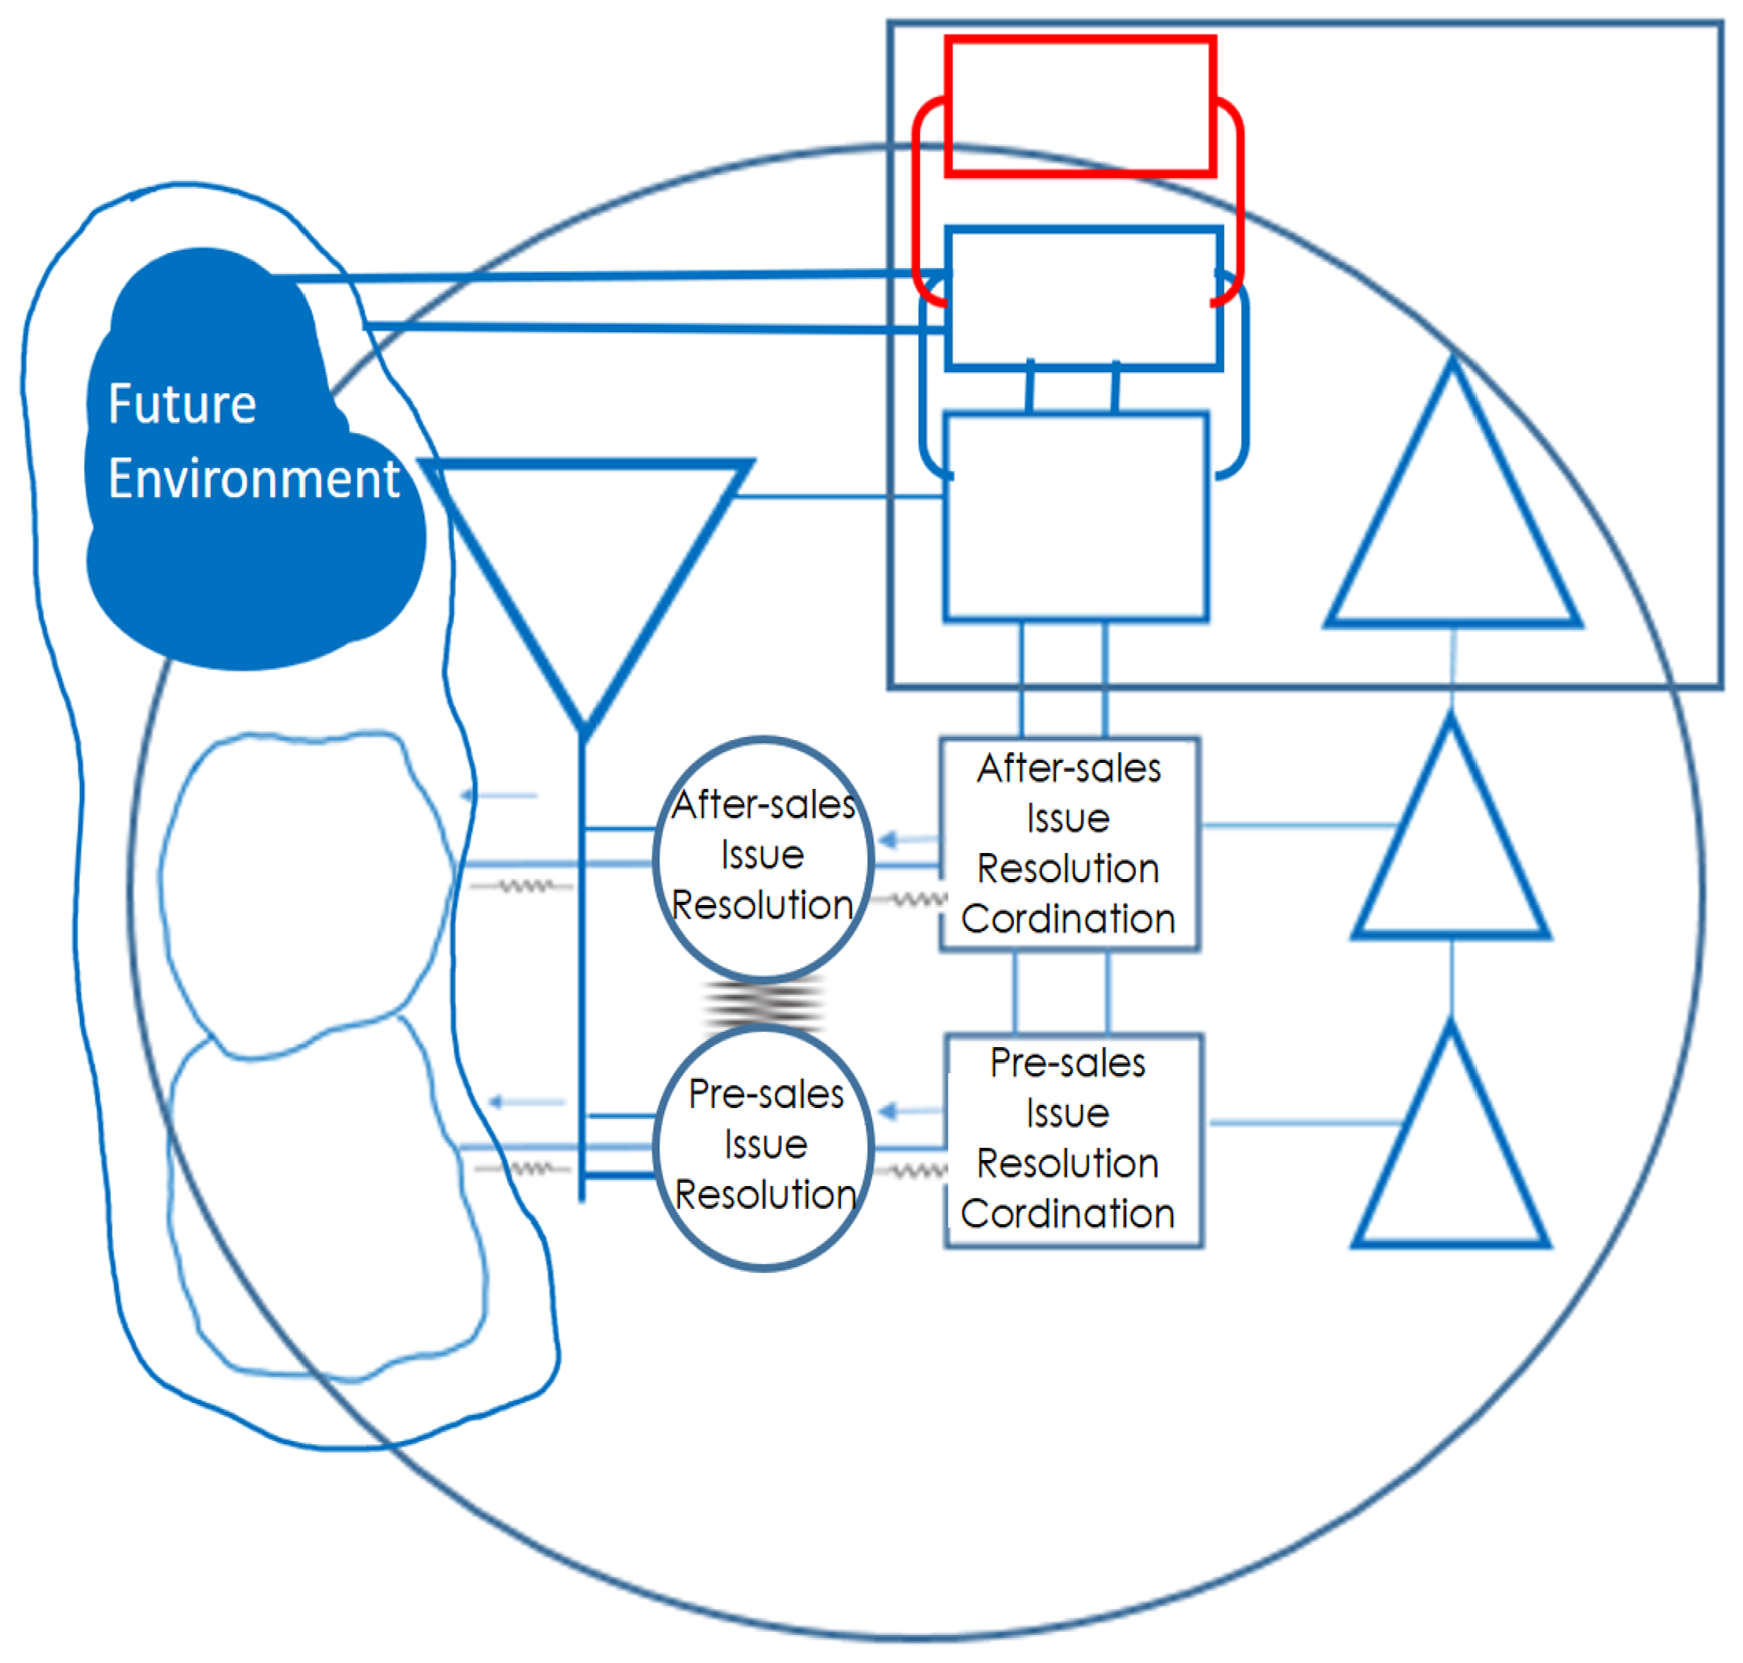
  • System 4: This subsystem (Figure 12) provides the organization with relevant information on the current and future environment. Its function is to provide a strategic direction. The information collected must be transformed into executable actions through strategies that are developed in conjunction with System 3, aimed at System 1, and aligned with the mission, vision, and objectives established by System 5. Information collection is carried out through sensors that monitor the main variables of the environment that impact the system. The functions of this system include market research, incident analysis at both the international and national level, payment monitoring, development and innovation, and strategic planning.
    As indicated previously, this system maintains a continuous interaction with System 3 through homeostasis, with the purpose of developing strategies that align with the objectives of the Total System, which are presented to System 5 for decision-making.
  • System 5: This system (Figure 13) brings decision makers together within the Issue Resolution framework. For this system to operate effectively, it is essential to define the mission, vision, goals, strategic objectives, indicators, values, policies, communication channels, clients, and segments of clients, which will guide and align performance.
Finally, the Algedonic Channel is considered a mechanism for monitoring critical variables in environmental information. This is achieved through sensors installed in the environment, which capture data classified as important by Subsystems 1 and 3. This channel filters the information according to its urgency level and transmits it rapidly. These sensors can measure variables such as customer satisfaction levels, social and cultural impacts, monitoring and control of warranty claims, tracking the number of incidents, accidents, and losses, as well as statistical information. The complete model can be seen in Figure 14.

3.6. Stage 6: Analysis of Agility and Relationship with Conceptual Models

For this stage, it is necessary to identify the attenuators and amplifiers of each system, which was formed in the previous stage, to later identify the agile elements that will help its function to be optimal.
  • Selecting Attenuators and Amplifiers As a first step, the attenuators and amplifiers for the previously formed system are selected.
    For the Pre-sale problem resolution system, the following were identified:
    The Operation attenuator to deal with the variety of the environment is the ‘Analysis of pending problems using the status platform’ Result of confirmed diagnoses’ where a filter of the most urgent problems is made, to later make a prioritization of the identified problems.
    The variety amplifier from Operations to the Environment is “The result of confirmed diagnoses”, which presents a list of all the issues identified during the analysis and testing of various types of prototype vehicles.
    The Management attenuator to deal with the variety of Operation is the ‘Resolution confirmation reports’ where the root cause of the problem is given, along with all the information supporting it. The variety amplifier of the Management towards the Operation is: ’The defect book issued by the coordination, where you can obtain more information on the reported problems, the standards under which one must work in each country of origin, as well as the objectives under which one must work, where time, budget, among others, are specified (Figure 15).
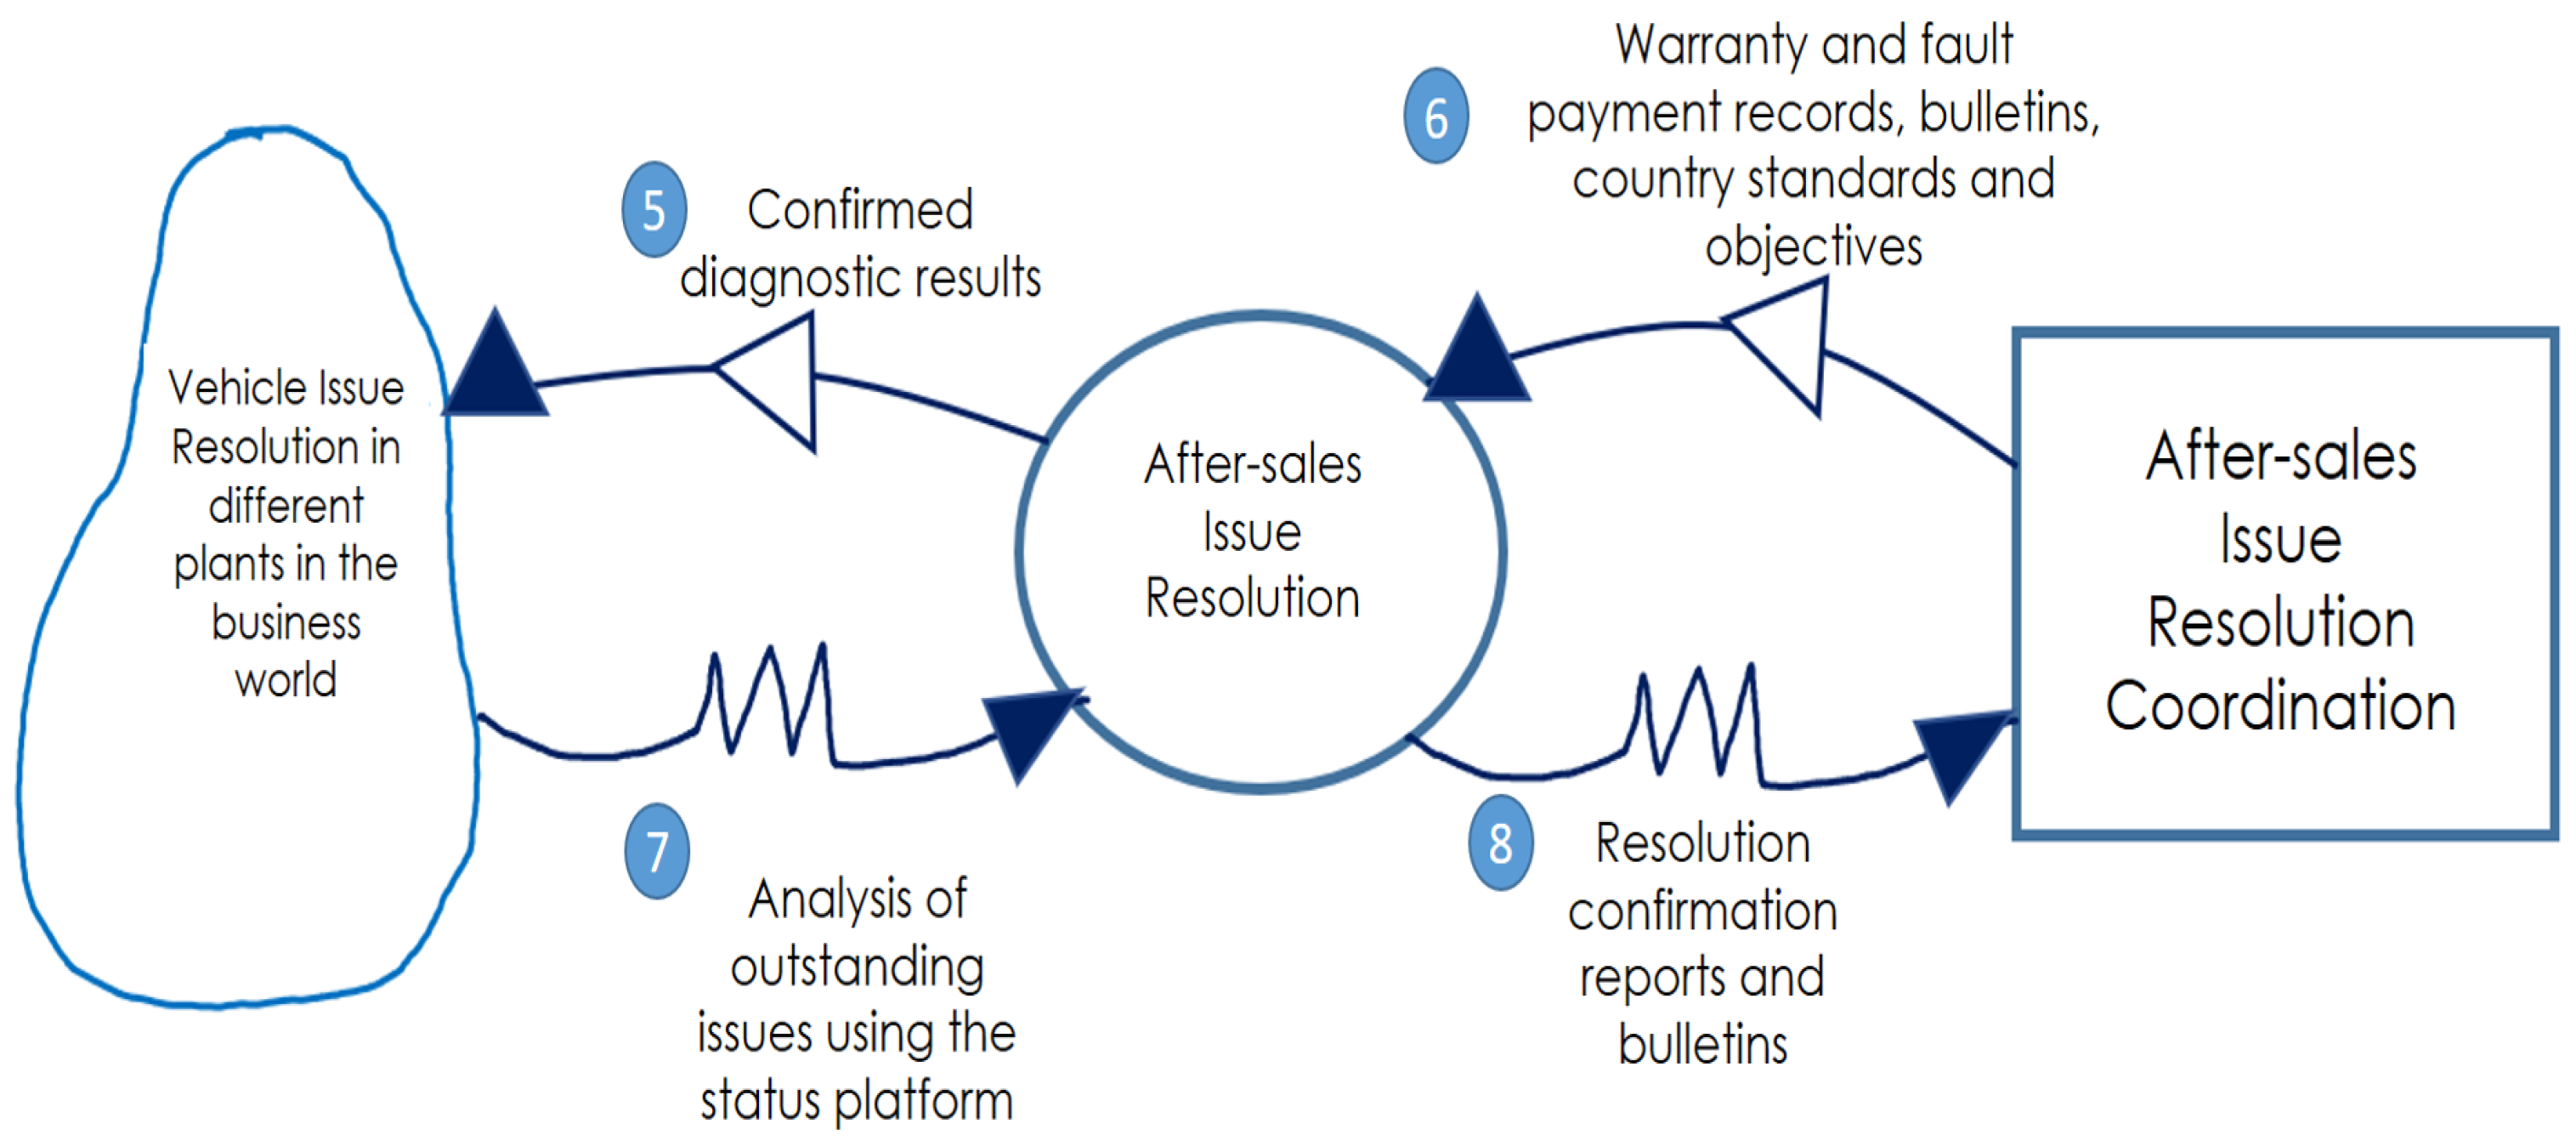
    Regarding the After-Sale problem resolution system, the following are available:
    The Operation attenuator to deal with the variety of the environment is the ‘Analysis of pending problems using the status platform’ Result of confirmed diagnoses’ where a filter is made of the most urgent problems, to later make a prioritization of the identified problems.
    The variety amplifier from Operations to the environment is *“The result of confirmed diagnostics”*, which provides a comprehensive list of all issues identified during the analysis and testing of various prototype vehicles.
    The variety attenuator from Management to handle Operational variety consists of *“Resolution confirmation reports and bulletins”*, which detail the root cause of each issue, along with all supporting information. This consolidated data is then used to alert agencies through official bulletins.
    The variety amplifier from Management to Operations includes *“Warranty records, failure payments, bulletins, country standards, and objectives”*, offering detailed information on reported issues, financial data related to warranty payments, the frequency of such payments, the affected components, and additional customer-related information. The standards under which one must work in each country of origin, as well as the objectives under which one must work, where time, budget, among others, are specified (Figure 16).
    The term “agile practice” lacks a standard definition and is not used consistently. Agile methodology guidelines describe various agile practices that differ in their specific implementations. These agile elements were created to be integrated into the process. Such practices must evolve as the environment and circumstances change.
    Roles define the responsibilities each individual must assume within the system, artifacts are the tools that facilitate the understanding of processes within the systems, and activities are the tasks that guide the team towards an agile level, ensuring that the planned strategy is sustainable. In this case, the elements were selected based on the specific conditions of each context and the roles that each participant is expected to fulfill. The selected elements can be observed in the taxonomy formed, as shown in Figure 17 and Figure 18.
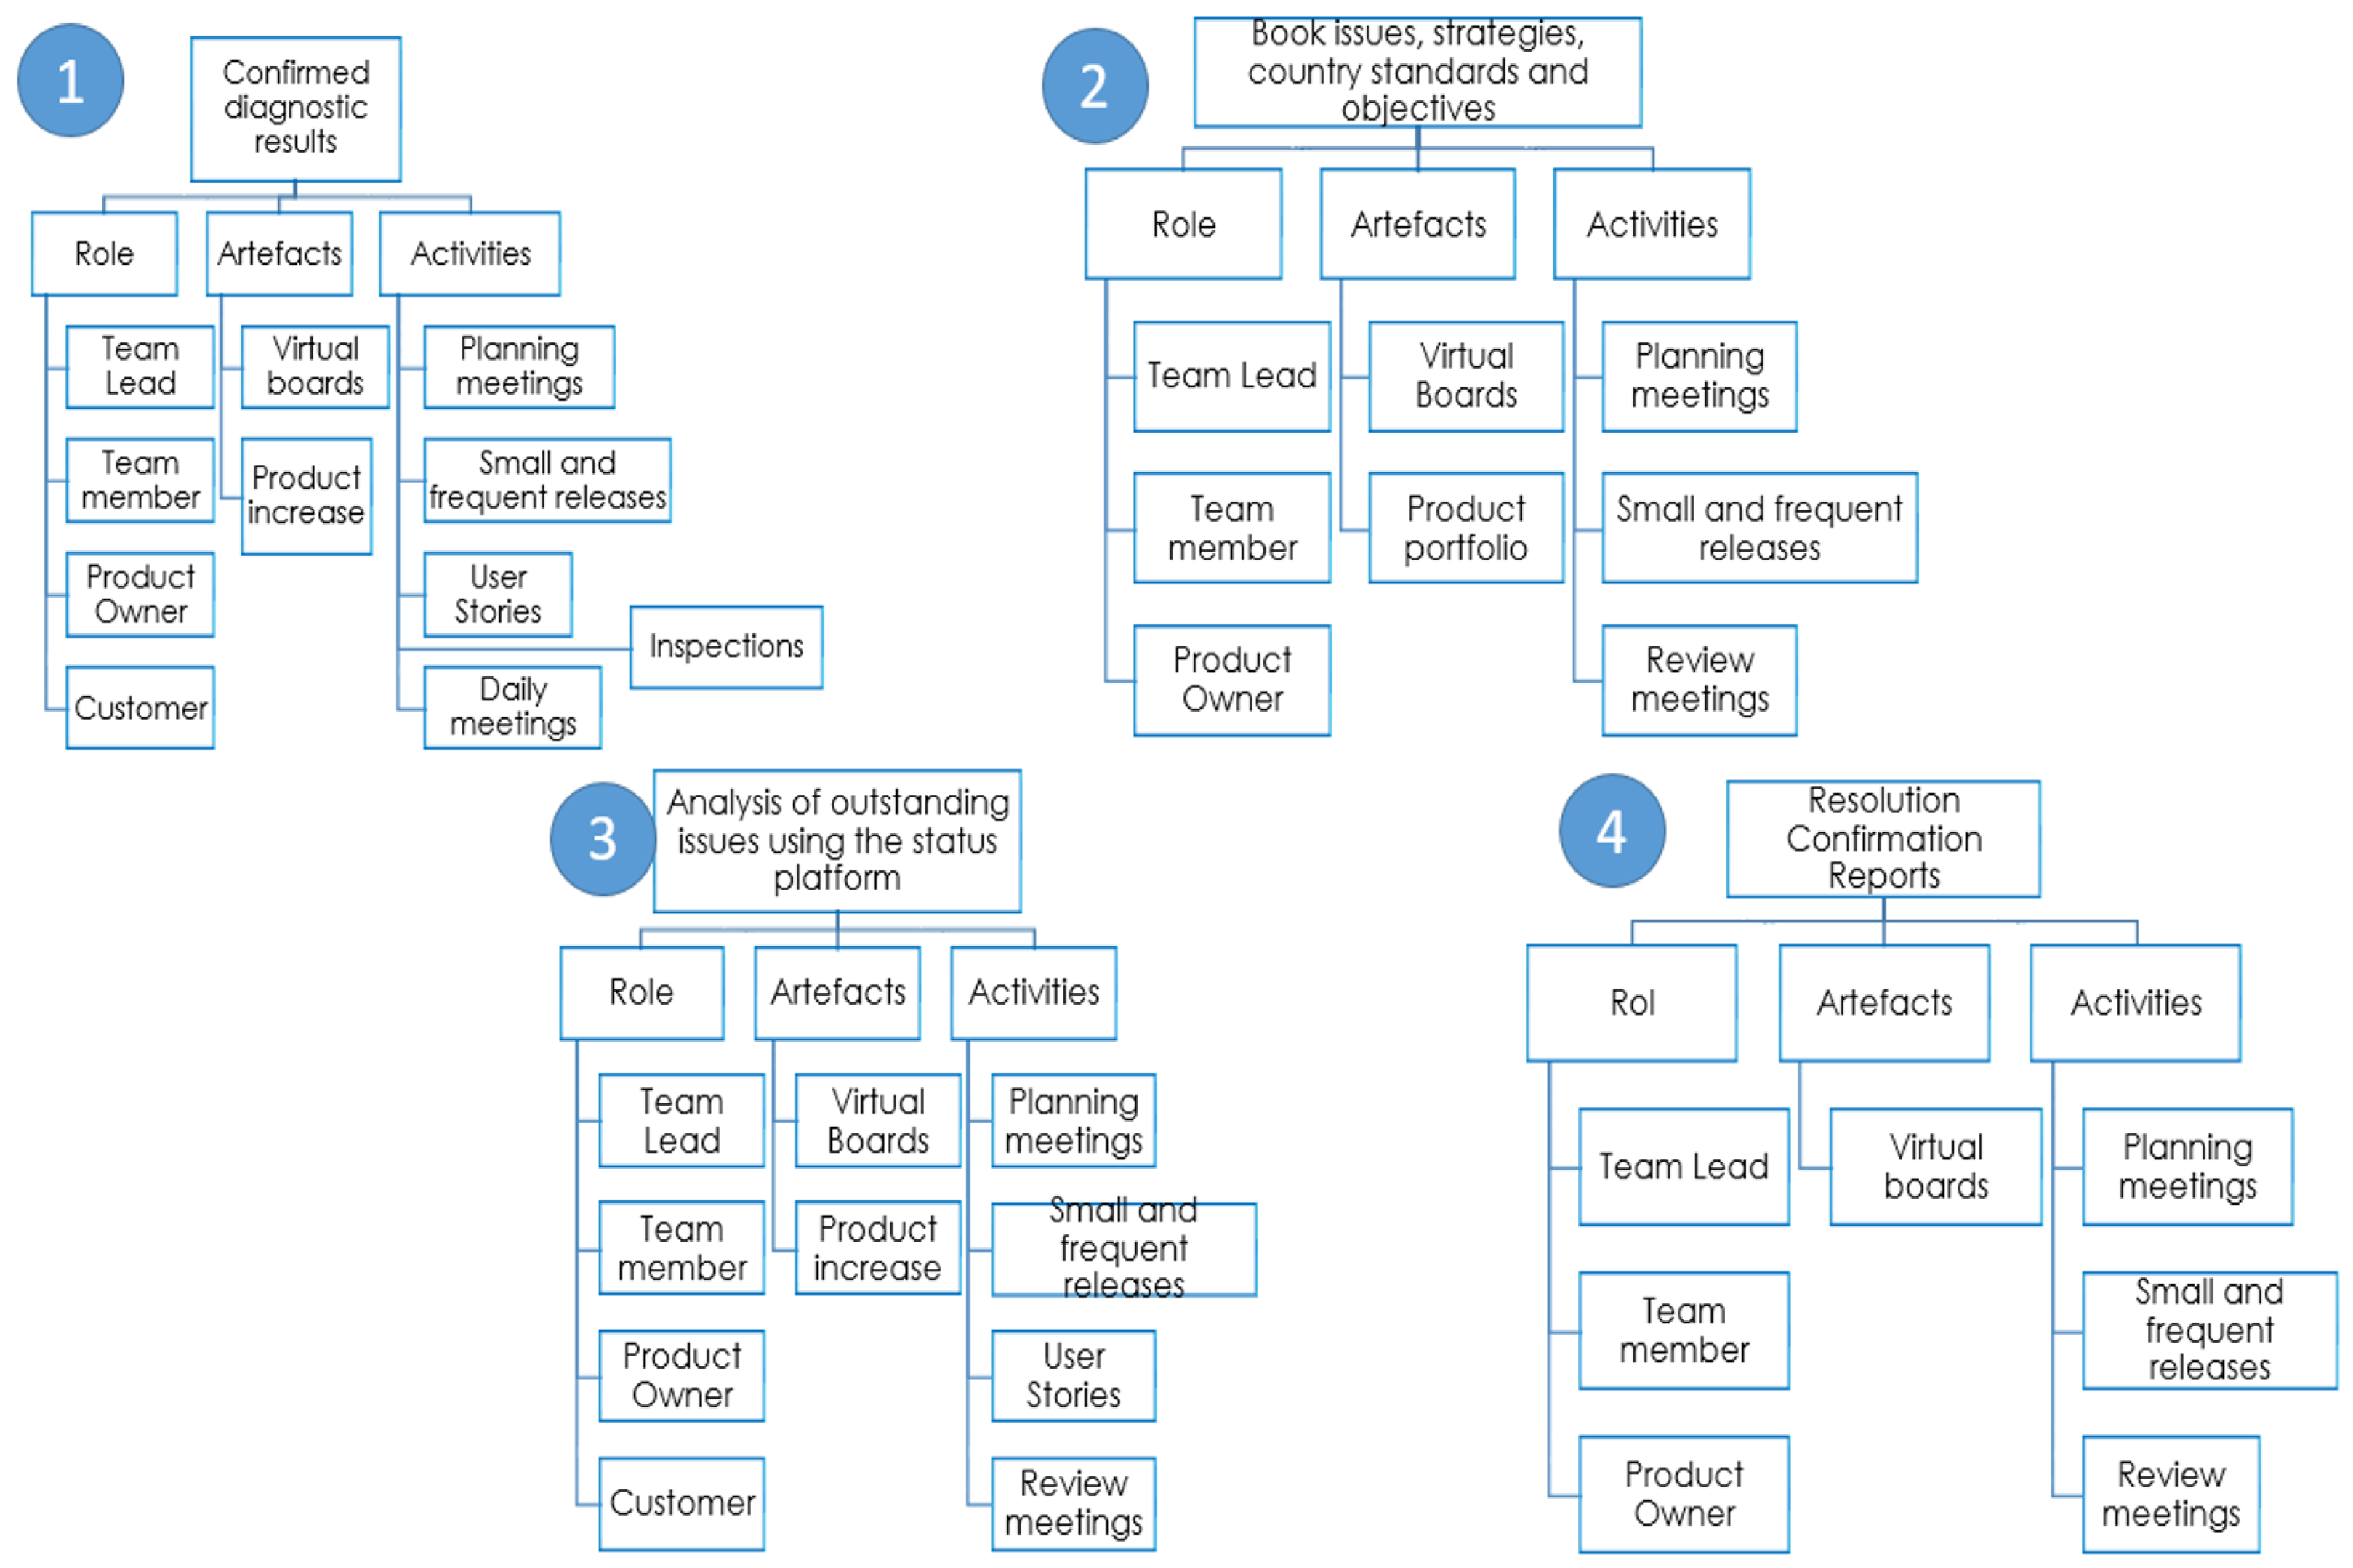
  • Forming the taxonomy
    Figure 17 and Figure 18 show the selection of agile elements for each attenuator or amplifier. The selection of each element was made on the basis of the context from which each system is derived. In taxonomy 1, 2, 3, 4, 5, 6, 7 and 8, it can be seen that the roles chosen were ‘Team member’, ‘Team Leader’, as well as ‘Product owner’. In all cases, Analysts will perform the ‘Team member’ role, while the Analyst Leader will perform the ‘Team Leader’ role. The role of ‘Product Owner’ will be played by the person responsible for each process, and this is found in all the taxonomies formed because their participation in the process must always be taken into account, to know their needs and, in case this requires any adjustment, having them close to the process represents making them part of the process in each movement made.
    Regarding the selected artifacts, it can be observed that Virtual Boards are present across all taxonomies. This is because, given that the selected company is a multinational, in-person meetings are not always feasible, and virtual boards facilitate this communication. It is also important to note that virtual boards must display all necessary information for everyone involved in the process and should be accessible to all stakeholders whenever they wish to consult them. There is no specific platform defined for this purpose; the selection can be adapted to the company’s resources and needs. The only requirement is that these boards must clearly present the most relevant project information.
    Another selected artifact was the Product Increment, which refers to the sum of activities previously planned and completed during the last review period. This involves analyzing the agreed-upon activities, identifying which were carried out and which were not, and discussing which will be undertaken in the next session.
    Additionally, the Product Portfolio was selected, an element that allows for the interactive selection of proposed projects that offer the greatest business value.
Finally, the activities where ‘planning and review’ meetings were chosen in almost all cases since these various important points will be reviewed, such as objectives, times, etc. In some cases, “User Stories” were chosen with the objective of focusing the work on the user, prioritizing it, improving its quality, keeping the team motivated, and increasing the value for the client. As for ‘Small and frequent releases’, it refers to the performance of small releases instead of large releases and consists of dividing the agile development cycle into numerous phases. On the other hand, there are the ‘Inspections’ which will allow continuous improvement of processes and product, by detecting undesirable variations and making adjustments, and finally the ‘Daily Meetings’ which will allow for progress to be made, to monitor how the project is progressing and whether it is on the right path to achieve the goal.
In order for agility to be understood, it is first necessary to make the staff aware of what agility is and how it works. Although it is known that there are immutable processes in the automotive sector, this can begin to evolve with the presence of these elements.

4. Discussion

In this case study, we developed an Agile Viable Model (AVM) Figure 14 aimed at optimizing processes within the Issue Resolution area of the Quality Department in an automotive company. While the general network of the Quality Department was considered, the primary focus was on Issue Resolution, as this subsystem serves as the operational core of the department. Its importance lies in its direct impact on the profitability of the Quality System, since the decisions and actions implemented in this area can result in significant gains or substantial losses for the organization. The first three stages were crucial for conducting a quantitative and qualitative diagnosis of the system of interest. In particular, in the third step, the use of Network Science allowed us to gain a more detailed understanding of the system, its actors, and their interrelationships. The approach used is appropriate, since Systems Thinking and Issue Resolution must be prioritized over the mere application of computational Issue Resolution methods, which is the primary objective of the Issue Resolution field [108]. This approach was designed to adapt and improve itself successfully by addressing the need to design, control, and operate process systems holistically [109].
In the first two steps, we were able to outline the system in question and, through the decomposition of complexity, observe the systems within which it was nested, thereby identifying the dimensions of the systems involved. The data collected revealed that the structure and sequence of these steps, as well as their origins, significantly influenced the results. This provided comprehensive information, enriched with both qualitative and quantitative analyzes, offering precise insights into key areas for improvement in the desired company process.

4.1. Qualitative Diagnosis

In Step 3, we performed qualitative analysis, where with the help of the enriched perspectives Figure 5, we were able to detect relationships that needed improvement, as well as those that did not exist. The results revealed that in the Issue Resolution area there are a total of 63 relationships, where 68% are conflictual, while only 32% are considered non-conflictive, and Analyst 1 is involved in most of the conflictual relationships Table A1. These identified connections provide crucial points for the establishment of a connected network. Granovetter in [110] emphasized the importance of weak links in the transfer of information on potential new job opportunities between people who are more distantly connected.

4.2. Quantitative Diagnosis

Regarding the quantitative analysis, through network analysis Figure A1 and Figure A2, it was revealed that the quality system interacts with 80 actors Table 7, with an average degree of connectivity of 2.5 links, a total of 210 links generated, and a density of 0.030. This indicates a dispersed network with less than 1% of the possible connections used, where Analyst 1 and the Lead Analyst stand out for their diverse interactions with support areas essential to their activities. Regarding the network architecture, it is observed that in all obtained networks, the Lead Analyst and the three Analysts are the hubs, necessitating a relevant system for these nodes.
In the Quality area network, the three analysts are observed: (i) Analyst 1, who performs activities in the Issue Resolution process, (ii) Analyst 2, who handles activities in QMS (Quality Management System), and (iii) Analyst 3, who is involved in QPM (Quality Program Manager), along with the Analyst Leader. The system interacts with 80 actors. In the Issue Resolution network, Analyst 1 and the Analyst Leader are noted for their various interactions with supporting areas essential for their activities.
The total number of actors (including elements from the Quality area and the interacting areas) was 84, with an average connectivity degree of 2.5 links, a total of 210 generated links and a density of 0.030 Table 7. This indicates, according to [67], a sparse network with less than 1% of the possible connections utilized. For Issue Resolution, the total number of actors was 26, with an average degree of connectivity of 2.269 links, a total of 59 links generated, and a density of 0.091, also reflecting a sparse network with less than 1% of possible connections utilized. These results are summarized in Table 7.
Regarding the centrality parameters, which are consolidated in Table 8, the clustering coefficient was analyzed, which measures the probability that adjacent nodes are also connected to the graph under study; a higher coefficient indicates that a node is part of a greater number of triangles [111]. Analysis of the Quality System network reveals the presence of many triangles, but in the Issue Resolution Subsystem this value is below 1. This suggests that most nodes in the process are not connected to the nodes involved in the developed processes, implying a more complex network.
Concerning the betweenness, both the Quality System network and the Issue Resolution network show a high betweenness Table 8. This indicates the presence of nodes with critical importance within the process; in both cases, these nodes were the Analysts and the Analyst Leader. If these nodes were removed, both networks could collapse, resulting in unmonitored and unattended light vehicle issues.
The average degree ⟨k⟩ (number of links per node) is less than 3, while the maximum number of links ( L max ) (that each node could potentially reach) is 325, indicating very low connectivity in these networks. The probability distribution of k (degree of the node) in the Issue Resolution network corresponds to a binomial distribution with performance similar to Poisson, meaning that the behavior of the network (the system under study) is random.
Regarding the results of the centrality parameters, consolidated in Table 8, it can be seen that the centrality of the relationship between the dispute resolution network is 16.5, indicating the degree to which a node acts as a bridge between other nodes of the network. This value is considered high, and a node with high centrality typically has access to critical information and can effectively coordinate different actors. This suggests that certain nodes play a relevant role as intermediaries, affecting the efficiency and effectiveness of the Issue Resolution process.
Considering that the average number of links per node is less than 3, we can infer that our actors are not even at 50% of the network connectivity, which translates into the main issue of not achieving the objectives in the area analyzed. The clustering coefficient was also analyzed, which measures the likelihood that adjacent nodes are also connected within the studied graph; a higher coefficient indicates that a node is part of a greater number of triangles [111]. The analysis of the Quality System network reveals the presence of many triangles, but in the Issue Resolution Subsystem, this value is below 1. This suggests that most nodes involved in the process are not connected to those engaged in the developed processes, which implies a more complex network.
Regarding the results of the regime to which our network belongs, the Quality network and the Issue Resolution network fall under a Super Critical Regime, indicating a lack of connectivity between nodes. This insufficient interconnection hinders the proper execution of expected processes, leading to inefficient outcomes. Insufficient connectivity between nodes increases the likelihood of incomplete or unfinished processes, ultimately compromising the effectiveness of the system. Once the comparison of both the Quality Department network and the Issue Resolution subsystem has been carried out (Figure A3), it is confirmed that the random network model accurately describes the network obtained in terms of degree distribution. Consequently, both networks are best characterized by the random network model.

4.3. Relevant Systems

With respect to the application of CATWOE, it was possible to visualize the relevant systems that are instrumental in intervening and identifying the most prominent problems requiring transformation [112]. These relevant systems serve as the foundation for the formation of conceptual models, being those that have a direct impact on the problem to be solved. The identified relevant systems (client, actors, transformation, worldview, owner, environment) provide a comprehensive view of the problem.
The Issue Resolution System in the automotive industry is a crucial element in ensuring product quality and customer satisfaction. This system covers everything from preventing problems in the initial design and production stages to resolving those that may arise in vehicles already sold. The effectiveness of the system lies in the collaboration between various actors, both internal and external to the company, and in the ability to transform problems into solutions that generate value for all stakeholders. The world view that guides this system is clear: reducing warranty costs and increasing customer satisfaction are key elements for the long-term success of the company, as they directly impact customer retention and future sales.
However, the system operates in a complex and dynamic environment, where factors such as regulations, trade agreements, customer expectations, budget constraints, and technological capabilities can influence its performance. Therefore, it is essential that the General Management and operational areas responsible for the system carefully consider these factors when designing and implementing strategies and policies.
Ultimately, the success of the Issue Resolution System will depend on the company’s ability to adapt to changes in the environment, learn from mistakes, and continuously improve its processes. Only in this way can high-quality products be guaranteed that meet the needs and expectations of customers and contribute to the growth and profitability of the company.

4.4. Generation of Conceptual Models

Regarding the generation of conceptual models, the subsystems that make up the Issue Resolution model are described, both before and after the sale of vehicles, including: Pre-sales subsystem: Focused on receiving and analyzing problems before vehicles enter the market. Post-sales subsystem: Focused on solving problems that arise after customers have sold and used vehicles.
As for recursive systems (S1 to S5) based on the Viable System Model, we have Figure 14:
System 1: Pre-sales (Laboratories, Engineering, Information platforms, Control Tower, VIT, Engineering warehouse), Post-sales ( After-sales service, Dealerships, Warranty department, PROFECO, Parts shipping, Analysis, and Diagnostics) International counterparts: China, Brazil, United States, France, Italy.
System 2: Information systems, Production and task planning, Coordination teams, National and international regulations, and international treaties.
System 3: Includes Sales, Human Resources, Administration, After-sales, Product planning, General Management, Operations Management, Marketing, and Engineering. In addition, it manages communication and resource allocation between System 1 and the higher strategic levels.
System 4: Market research, Innovation, Strategic planning, International incident analysis, Technology monitoring, Payment and risk monitoring. Works in collaboration with System 3 to ensure that the organization is aligned with global trends.
System 5: Executive Management and General Management, Quality Area Leadership, Corporate Policy Definition, Regulation, and Compliance.

4.5. Systems Approach

The systemic approach serves as a cornerstone of this research, shaping both its conceptual foundation and methodological execution. As [10] asserts, a system is more than the sum of its parts—an idea particularly relevant in the automotive industry, where actors, processes, and technologies interact across multiple organizational and geographical levels.
The decision to integrate the Viable System Model (VSM), the Soft Systems Methodology (SSM), and Agile Methodologies into a single meta-methodology allowed for the mapping not only of formal organizational structures but also of the informal, cultural, and political dynamics that influence the performance of human activity systems. This integration, inspired by foundational authors such as [5,53,54], enabled a more comprehensive understanding of the organizational context and supported the development of adaptive solutions for the structural complexity of the studied system.
Specifically, systems thinking guided key research tasks such as defining the system in focus, constructing enriched views, identifying both conflicting and non-conflicting relationships, and applying network analysis based on the principles of [67]. This analysis made it possible to quantify connectivity, identify critical nodes, and characterize the system’s operational regime as supercritical—revealing significant limitations in terms of collaboration and operational efficiency.
Among the most relevant theoretical benefits of systems thinking are:
The integration of multiple perspectives, which is essential when addressing complex and pluralistic systems such as the one studied here. The promotion of organizational learning, by revealing information flows, structural tensions, and opportunities for improvement. A strong orientation toward adaptability and viability, core principles of the VSM that enhance resilience in dynamic and challenging environments.
However, despite these advantages, it is equally important to acknowledge certain inherent limitations of the adopted approach. While the systems frameworks provide a robust analytical structure and valuable reflective lens, they may appear overly complex or unfamiliar to some organizational actors, especially those focused on day-to-day operational tasks. The level of abstraction required in phases such as defining relevant systems or constructing conceptual models may create a disconnect with practical experience or fail to fully capture the informal dynamics that also shape the system.
Therefore, the effective implementation of the systemic approach calls for complementary strategies—such as targeted communication, training, and facilitation—that help translate theoretical concepts into concrete, actionable steps understood at all organizational levels. Even with these limitations, the systemic approach has contributed significantly to identifying organizational patterns, strengthening decision-making, and designing a viable, context-sensitive improvement proposal.
This reflection reinforces the alignment between the study’s systemic orientation and the core mission of Systems journal: to advance the understanding, modeling, and redesign of complex systems through integrative, participatory, and action-oriented frameworks.
Moreover, while these approaches are highly effective for diagnosis and design, they do not always provide a concrete roadmap to implement change, which can pose challenges in practice unless complemented by more adaptive and action-oriented methodologies such as Agile. Finally, it is important to recognize that this type of analysis assumes certain conditions of openness and participation that may not naturally exist in all organizational contexts, particularly in environments with rigid hierarchical structures or cultures resistant to change.

4.6. Agility Analysis

Amplifiers and attenuators were identified to optimize the subsystems Figure 17 and Figure 18. For example, a “defect log” acts as an amplifier, while “confirmation reports” act as an attenuator. Subsequently, the necessary agile elements were selected to create an environment of organizational resilience and adaptation to environmental changes. These elements help manage the variety of the environment and improve operational efficiency, where some artifacts such as:
Roles: Team Leader, team member, product owner.
Artifacts: Virtual boards, product backlog, product increments.
Activities: Planning and review meetings, inspections, and daily presentations.
Finally, the subsequent stages will be carried out after obtaining the results of the application of the proposed model, through evaluation and identification of necessary improvements and adjustments. However, because of the time elapsed, it will not be possible to have the results in this research, but they will be published in future research. It is important to mention that the application of the following steps will be carried out once the model has been applied and the results have been obtained; due to the limited time available, this research focuses only on the formation of the desired model.

5. Conclusions

This study introduced an Agile Viable Model (AVM) as a tool to improve processes within the Issue Resolution area of the Quality Department in an automotive company. Through an approach based on Systems Thinking and agile methodologies, a detailed diagnosis of the network was carried out, identifying key challenges and opportunities for improvement. The results indicate that the combination of qualitative and quantitative analyses with Network Science enables a deeper understanding of organizational processes and facilitates strategic decision making, with the following key findings:
  • Network Structure and Connectivity: The Issue Resolution network exhibits low connectivity, indicating that many key relationships within the system are not well established. The analysis confirmed that this network operates under a Super Critical Regime, meaning that the lack of interconnectivity among actors prevents processes from flowing efficiently.
  • Critical Nodes and Systemic Weaknesses: Analyst 1 and the Analyst Leader were identified as central actors (hubs) within the network. If either of them were removed, the system could collapse, leaving critical vehicle quality issues unresolved. Furthermore, 68% of the relationships within the system were found to be conflictual, highlighting the need to improve communication and collaboration among stakeholders.
  • Process Optimization Through Agile Approaches: The study proposed integrating agile tools, such as virtual boards, product backlogs, and daily meetings, to improve the flexibility and efficiency of the system. The use of CATWOE analysis helped to better understand the relevant systems within the organization, facilitating the development of conceptual models aligned with the company’s strategic goals.
  • Strategic Importance of Issue Resolution in Quality Management: The Issue Resolution process is crucial before and after sales, as its effectiveness directly influences customer satisfaction and warranty costs. Improving connectivity and collaboration within this system will allow for faster and more effective resolution of quality issues, reducing costs, and strengthening company reputation.

5.1. Theoretical Implications

  • Innovative methodological integration: This study contributes to the academic literature by introducing an integrated metamethodology that combines the Viable System Model (VSM), the Soft Systems Methodology (SSM), and the Agile Methodologies (AM). This combination addresses the individual limitations of each framework and aligns with [56] concept of creative holism as a strategy to tackle complex systems.
  • Expansion of systemic thinking: The research reinforces the value of systemic thinking as a theoretical tool to diagnose complex organizational structures, incorporating both structural and interpretive dimensions.
  • Complementarity of Conceptual Frameworks: The proposed model empirically validates the feasibility of combining organizational cybernetics, stakeholder participation in decision making, and operational agility, thus contributing to the evolution of organizational design and complexity management theories.
  • Incorporation of network analysis: Theoretically, the study introduces the use of network science and complexity metrics within a systemic framework, enabling a more precise measurement of the viability, interconnectivity, and structural dynamics of the system.

5.2. Practical Implications

  • Improvement in quality management: On an operational level, the implementation of the Agile Viable Model (AVM) led to shorter response times in problem solving within the quality department, with a direct impact on customer satisfaction and a reduction in warranty-related costs.
  • Optimization of organizational communication: The analysis revealed that 68% of the relationships between actors were conflictual and that key nodes, such as the analyst and their team leader, were poorly connected. The introduction of agile tools such as virtual boards, product logs, and daily stand-up meetings significantly improved collaboration and process transparency.
  • Real-world applicability: The model was successfully implemented in a multinational automotive company in Mexico, demonstrating its practical viability and adaptability to complex environments, including distributed manufacturing systems, multicultural teams, and high contextual variability.
  • Replicable Toolkit: The research provides a structured step-by-step implementation process that can be replicated in other organizations facing similar challenges in quality management, decision making, and organizational adaptability.
  • Development of internal capabilities: The model fosters a culture of continuous learning, self-management, and cross-functional collaboration, aligning human development with a larger organizational strategy.

Study Limitations

  • While the proposed meta-methodology—based on the integration of the Viable System Model (VSM), Soft Systems Methodology (SSM), and Agile Methodologies—offers a robust framework for diagnosing and improving complex organizational systems, several limitations must be acknowledged regarding its scope and applicability.
  • Limited scope of application: The model was implemented within a single automotive company in Mexico, specifically in the Quality Engineering department. Although the results were promising, the generalizability of the model to other departments, organizations, or industries has not yet been tested. Consequently, its conclusions may not be directly transferable to other settings.
  • Contextual dependency: The effectiveness of the methodology is heavily influenced by the socio-cultural and economic environment in which it is applied. This study was conducted in a context characterized by hierarchical organizational structures, centralized decision-making, and the strong role of interpersonal relationships—typical of the Mexican corporate environment. These cultural factors significantly influence communication dynamics, collaboration practices, and team adaptability. Additionally, socio-economic factors such as resource constraints, technological availability, and regulatory frameworks shape how systemic and agile methodologies are implemented and perceived.
  • Dependence on organizational culture: The success of the meta-methodology relies substantially on an organization’s openness to change, its collaborative mindset, and stakeholder willingness to participate in iterative and participatory processes. These conditions may not be present in more rigid or traditionally structured environments, limiting the effectiveness of the model.
  • Training and knowledge requirements: Implementing the model requires a solid understanding of systems thinking, network analysis, and agile tools. Organizations lacking prior exposure or trained personnel in these areas may face significant barriers to effective implementation.
  • Complexity of integration: Although the combination of VSM, SSM, and Agile methodologies enhances theoretical robustness, it also increases operational complexity. Teams unfamiliar with one or more of these approaches may struggle without dedicated training or expert facilitation.
  • Perceived abstraction of the VSM: Certain components of the Viable System Model may be seen as overly abstract or theoretical by operational teams, potentially limiting their engagement or understanding unless supported by appropriate contextualization and facilitation.
  • Lack of longitudinal evaluation: The outcomes presented reflect a specific moment in time. This study did not include a long-term evaluation of the model’s impact or the sustainability of the improvements introduced. Future research should consider longitudinal assessments to better understand the model’s long-term value.
  • Cultural and Economic Transferability: Due to the unique characteristics of the Mexican context, direct application of the model in other cultural or economic settings (e.g., Northern Europe or East Asia) would require thoughtful adaptation. Variations in autonomy, stakeholder involvement, and resistance to change may significantly affect the model’s applicability and outcomes.
  • Future studies are encouraged to conduct cross-cultural and cross-sector comparisons to assess how cultural and economic variables influence the model’s effectiveness and adaptability. Such efforts will contribute to the development of a more generalized and context-sensitive framework for organizational transformation.

5.3. Future Directions

For future research, it is recommended to implement and validate the proposed model in real-world industrial scenarios. Measure the long-term impact of agile methodologies on Quality Issue Resolution. Develop additional strategies to strengthen interconnectivity among key actors, fostering better collaboration and knowledge management.
In conclusion, this study highlights the importance of combining System Thinking, Network Science, and Agile Methodologies to address the challenges of the automotive industry. By improving connectivity, reducing organizational silos, and fostering a culture of continuous improvement, companies can optimize their processes, improve product quality, and maintain competitiveness in an evolving market.

Author Contributions

Conceptualization, B.A.C.C. and O.M.M.; formal analysis, B.A.C.C. and O.M.M.; investigation and resources, J.J.M.E. and J.G.T.N.; data acquisition, B.A.C.C. and J.G.T.N.; writing original draft preparation, B.A.C.C., O.M.M. and J.J.M.E. All authors have read and agreed to the published version of the manuscript.

Funding

This article is supported by National Polytechnic Institute (Instituto Politécnico Nacional) of Mexico by projects granted by Secretariat of Research and Postgraduate (Secretería de Investigación y Posgrado), Secretaría de Ciencia, Humanidades, Tecnología e Innovación (SECIHTI).

Data Availability Statement

Data are contained within the article.

Acknowledgments

The research described in this work was carried out at Centro de Investigación en Computación (CIC) along with Escuela Superior de Ingeniería Mecánica y Eléctrica (ESIME) both from the Instituto Politécnico Nacional, Campus Zacatenco.

Conflicts of Interest

The authors declare no conflict of interest.

Appendix A

The appendix includes supporting materials that complement the main body of the manuscript but are not essential for understanding the core argument. These materials provide additional details. Specifically, our appendix contains the following information:
Table A1. Actors who have conflictive relationships among them.
Actor AActor B
AnalystsControl Tower, After-sales, Dealers, Engineering (Design and Development of Parts and Components), Parts Shipping Company, Durability, Performance, Counterpart in China, Counterpart in Brazil, Counterpart in the United States, Issues Reception Platform, Dealers, Manufacturing, Chinese Quality Automotive, Construction, External manufacturer in China and U.S. Leader
Control TowerManufacturing, Analysts, Issues Reception Platform
Engineering WarehouseCounterpart in China, Counterpart in Brazil, Counterpart in the United States, Counterpart in Italy, Counterpart in France and Manufacturing
DealersWarranty Department and Control Tower
Counterpart in ChinaQuality and Environmental Standards Certifying Bodies and Chinese Quality Automotive Construction
Counterpart in the United StatesQuality and Environmental Standards Certifying Bodies
Counterpart in ItalyQuality and Environmental Standards Certifying Bodies
Counterpart in FranceQuality and Environmental Standards Certifying Bodies
Counterpart in BrazilQuality and Environmental Standards Certifying Bodies
Issues Reception PlatformCounterpart in China, Counterpart in Brazil, Counterpart in the United States, Counterpart in France and Counterpart in Italy
Lead AnalystParts Shipping Company, Counterpart in the United States, External manufacturer in China and U.S. Leader
Vehicle Specialization AreaQuality and Environmental Standards Certifying Bodies
After-salesDealers
Chinese Quality Automotive ConstructionExternal manufacturer in China
External Manufacturer in ChinaCounterpart in China
Source: Author’s own elaboration.
Figure A1. Systems networks: Quality Department. Source: Author’s own elaboration using UCINET software [73].
Systems 13 00343 g0a1
Figure A2. Systems networks: Issue Resolution area. Source: Author’s own elaboration using UCINET software [73].
Systems 13 00343 g0a2
Figure A3. (a) Probability distribution of degree of the Quality area matrix, (b) Poisson probability distribution with 〈k〉 = 2.269, (c) Probability distribution of degree of Issue resolution, and (d) Poisson probability distribution with 〈k〉 = 2.500. Source: Author’s own elaboration using UCINET software [73].
Systems 13 00343 g0a3

References

  1. AMIA. Importancia de la Industria Automotriz. Available online: https://www.amia.com.mx/publicaciones/industria_automotriz/ (accessed on 4 February 2025).
  2. Niewenhuis, P.; Wells, P. The Automotive Industry and the Environment; Woodhead: Sawston, UK, 2003; pp. 3–4. [Google Scholar]
  3. Stylidis, K.; Wickman, C.; Söderberg, R. Defining perceived quality in the automotive industry: An engineering approach. Procedia CIRP 2015, 36, 165–170. [Google Scholar] [CrossRef]
  4. Klink, G. Contribution of the automobile industry to technology and value creation. Auto Tech Rev. 2014, 3, 18–23. [Google Scholar] [CrossRef]
  5. Jackson, M.C. Critical Systems Thinking and the Management of Complexity; John Wiley & Sons: Hoboken, NJ, USA, 2019. [Google Scholar]
  6. Balankin, A.S.; Susarrey, O.; Márquez Gonzáles, J. Scaling properties of pinned interfaces in fractal media. Phys. Rev. Lett. 2003, 90, 096101. [Google Scholar] [CrossRef] [PubMed]
  7. Lina, I.R.; Troya, T.I.C.; Matamoros, O.M.; Escobar, J.J.M.; Padilla, R.T. Fractal Characterization of Stochastic Series Fluctuations of Children with Reading Disorders. Nonlinear Dyn. Psychol. Life Sci. 2020, 24, 159. [Google Scholar] [CrossRef]
  8. Rotmans, J.; van Asselt, M.B. Uncertainty management in integrated assessment modeling: Towards a pluralistic approach. Environ. Monit. Assess. 2001, 69, 101–130. [Google Scholar] [CrossRef]
  9. Helbing, D. Pluralistic modeling of complex systems. Sci. Cult. 2010, 76, 315–329. [Google Scholar] [CrossRef]
  10. Meadows, D.H. Thinking in Systems: A Primer; Chelsea Green Publishing: Chelsea, VT, USA, 2008. [Google Scholar]
  11. Whitchurch, G.G.; Constantine, L.L. Systems theory. In Sourcebook of Family Theories and Methods: A Contextual Approach; Springer: Berlin/Heidelberg, Germany, 1993; pp. 325–355. [Google Scholar] [CrossRef]
  12. Bertalanffy, L.V. General system theory: Foundations, development, applications. JAMA 1969, 208, 870. [Google Scholar] [CrossRef]
  13. Hartman, R.; Kvasnička, R.; Čejka, M.; Pilař, L. Design Thinking in Innovation Processes: A Market Segmentation Tool in Social Networks Research. Systems 2024, 12, 444. [Google Scholar] [CrossRef]
  14. Arnold, R.D.; Wade, J.P. A definition of systems thinking: A systems approach. Procedia Comput. Sci. 2015, 44, 669–678. [Google Scholar] [CrossRef]
  15. Frank, M.; Zwikael, O.; Boasson, M. Jobs requiring a capacity for engineering systems thinking (CEST): Selection using an interest inventory. Proj. Manag. J. 2007, 38, 36–44. [Google Scholar] [CrossRef]
  16. Senge, P.M. The Fifth Discipline: The Art and Practice of the Learning Organization; Broadway Business: New York, NY, USA, 2006; p. 445. [Google Scholar]
  17. Charnley, F.; Lemon, M.; Evans, S. Exploring the process of whole system design. Des. Stud. 2011, 32, 156–179. [Google Scholar] [CrossRef]
  18. Cabrera, D.; Cabrera, L. What is systems thinking? In Learning, Design, and Technology: An International Compendium of Theory, Research, Practice, and Policy; Springer: Berlin/Heidelberg, Germany, 2023; pp. 1495–1522. [Google Scholar] [CrossRef]
  19. Leischow, S.J.; Best, A.; Trochim, W.M.; Clark, P.I.; Gallagher, R.S.; Marcus, S.E.; Matthews, E. Systems thinking to improve the public’s health. Am. J. Prev. Med. 2008, 35, S196–S203. [Google Scholar] [CrossRef] [PubMed]
  20. Bureš, V. A method for simplification of complex group causal loop diagrams based on endogenisation, encapsulation and order-oriented reduction. Systems 2017, 5, 46. [Google Scholar] [CrossRef]
  21. Ackoff, R.L. The future of operational research is past. J. Oper. Res. Soc. 1979, 30, 93–104. [Google Scholar] [CrossRef]
  22. Hofmann, P.; Powell, D. The combination of lean thinking and systems thinking in the design of manufacturing systems. In Proceedings of the 2012 IEEE International Conference on Industrial Engineering and Engineering Management, Hong Kong, China, 10–13 December 2012; pp. 56–60. [Google Scholar] [CrossRef]
  23. Nunes, B.; Betz, F.; Bennett, D.; Shaw, D. A systems approach to analysing environmental decisions in the automotive industry. In Proceedings of the 2011 Proceedings of PICMET ’11: Technology Management in the Energy Smart World (PICMET), Portland, OR, USA, 31 July–4 August 2011. [Google Scholar] [CrossRef]
  24. Fessina, M.; Zaccaria, A.; Cimini, G.; Squartini, T. Pattern-detection in the global automotive industry: A manufacturer-supplier-product network analysis. Chaos Solitons Fractals 2024, 181, 114630. [Google Scholar] [CrossRef]
  25. Laimon, M.; Yusaf, T.; Mai, T.; Goh, S.; Alrefae, W. A systems thinking approach to address sustainability challenges to the energy sector. Int. J. Thermofluids 2022, 15, 100161. [Google Scholar] [CrossRef]
  26. Kim, S.; Connerton, T.P.; Park, C. Exploring the impact of technological disruptions in the automotive retail: A futures studies and systems thinking approach based on causal layered analysis and causal loop diagram. Technol. Forecast. Soc. Change 2021, 172, 121024. [Google Scholar] [CrossRef]
  27. Dima, I.C. Systemic Approaches to Strategic Management: Examples from the Automotive Industry; IGI Global: New York, NY, USA, 2014. [Google Scholar] [CrossRef]
  28. Holman, D.; Wicher, P.; Lenort, R.; Dolejšová, V.; Staš, D.; Giurgiu, I. Sustainable logistics management in the 21st century requires wholeness systems thinking. Sustainability 2018, 10, 4392. [Google Scholar] [CrossRef]
  29. Graessler, I.; Grewe, B. Stages of systems engineering: An analysis and characterization of systems engineering approaches. Systems 2025, 13, 53. [Google Scholar] [CrossRef]
  30. Khan, S.K.; Shiwakoti, N.; Stasinopoulos, P.; Warren, M. Cybersecurity regulations for automated vehicles: A conceptual model demonstrating the “tragedy of the commons”. Transp. Res. Procedia 2025, 82, 3729–3751. [Google Scholar] [CrossRef]
  31. Rocha, J.M.S.; Rocha, J.M.S. Applying agile practices in automotive engineering: A lean approach for software development and vehicle design. Int. J. Automot. Technol. Manag. 2011, 11, 227–246. [Google Scholar] [CrossRef]
  32. Ågren, S.M.; Heldal, R.; Knauss, E.; Pelliccione, P. Agile beyond teams and feedback beyond software in automotive systems. IEEE Trans. Eng. Manag. 2022, 69, 3459–3475. [Google Scholar] [CrossRef]
  33. Kasauli, R.; Knauss, E.; Horkoff, J.; Liebel, G.; de Oliveira Neto, F.G. Requirements engineering challenges and practices in large-scale agile system development. J. Syst. Softw. 2021, 172, 110851. [Google Scholar] [CrossRef]
  34. Kumar, R.; Singh, K.; Jain, S.K. Assessment of agile manufacturing impact on business performance of Indian manufacturing industry: A PLS-SEM approach. Sustain. Manuf. Serv. Econ. 2022, 1, 100001. [Google Scholar] [CrossRef]
  35. Alahyari, H.; Gorschek, T.; Svensson, R.B. An exploratory study of waste in software development organizations using agile or lean approaches: A multiple case study at 14 organizations. Inf. Softw. Technol. 2019, 105, 78–94. [Google Scholar] [CrossRef]
  36. Burggräf, P.; Dannapfel, M.; Adlon, T.; Kahmann, H.; Schukat, E.; Keens, J. Capability-based assembly design: An approach for planning an agile assembly system in automotive industry. Procedia CIRP 2020, 93, 1206–1211. [Google Scholar] [CrossRef]
  37. Jadoon, G.; Ud Din, I.; Almogren, A.; Almajed, H. Smart and agile manufacturing framework: A case study for automotive industry. Energies 2020, 13, 5766. [Google Scholar] [CrossRef]
  38. Henschel, S.; Hubalek, K.; Neub, N.; Kößler, F.; Fleischer, J. Implementation of an agile manufacturing system for the lithium-ion-cell production based on individual microenvironments. Procedia CIRP 2024, 130, 619–624. [Google Scholar] [CrossRef]
  39. El-Khalil, R.; Mezher, M.A. The mediating impact of sustainability on the relationship between agility and operational performance. Oper. Res. Perspect. 2020, 7, 100171. [Google Scholar] [CrossRef]
  40. Fleischer, J.; Fraider, F.; Kößler, F.; Mayer, D.; Wirth, F. Agile production systems for electric mobility. Procedia CIRP 2022, 107, 1251–1256. [Google Scholar] [CrossRef]
  41. Brandl, F.J.; Roider, N.; Hehl, M.; Reinhart, G. Selecting practices in complex technical planning projects: A pathway for tailoring agile project management into the manufacturing industry. CIRP J. Manuf. Sci. Technol. 2021, 33, 293–305. [Google Scholar] [CrossRef]
  42. Sadeghi, K.; Ojha, D.; Kaur, P.; Mahto, R.V.; Dhir, A. Explainable artificial intelligence and agile decision-making in supply chain cyber resilience. Decis. Support Syst. 2024, 180, 114194. [Google Scholar] [CrossRef]
  43. Cimini, C.; Lagorio, A.; Cavalieri, S. Development and application of a maturity model for industrial agile working. Comput. Ind. Eng. 2024, 188, 109877. [Google Scholar] [CrossRef]
  44. Hilt, M.J.; Wagner, D.; Osterlehner, V.; Kampker, A. Agile predevelopment of production technologies for electric energy storage systems: A case study in the automotive industry. Procedia CIRP 2016, 50, 88–93. [Google Scholar] [CrossRef]
  45. Beer, S. Brain of the Firm, 2nd ed.; John Wiley & Sons: Chichester, UK, 1995. [Google Scholar]
  46. Espejo, R.; Reyes, A. Organizational Systems: Managing Complexity with the Viable System Model; Springer Science & Business Media: Berlin, Germany, 2011; pp. 230–256. [Google Scholar]
  47. Sánchez, R.N.; Vizhñay, C.V. Analysis of the productivity of pair programming versus solo programming in a university classroom. In Communication, Smart Technologies and Innovation for Society: Proceedings of CITIS 2021; Springer: Singapore, 2022; pp. 733–743. [Google Scholar] [CrossRef]
  48. Daraojimba, E.C.; Nwasike, C.N.; Adegbite, A.O.; Ezeigweneme, C.A.; Gidiagba, J.O. Comprehensive review of agile methodologies in project management. Comput. Sci. IT Res. J. 2024, 5, 190–218. [Google Scholar] [CrossRef]
  49. Wafa, R.; Khan, M.Q.; Malik, F.; Abdusalomov, A.B.; Cho, Y.I.; Odarchenko, R. The impact of agile methodology on project success, with a moderating role of Person’s job fit in the IT industry of Pakistan. Appl. Sci. 2022, 12, 10698. [Google Scholar] [CrossRef]
  50. Zasornova, I.; Lisenko, S.; Zasornov, O. Choosing scrum or kanban methodology for project management in it companies. Comput. Syst. Inf. Technol. 2022, 4, 6–12. [Google Scholar] [CrossRef]
  51. Iqbal, J.; Omar, M.; Yasin, A. The effects of agile methodologies on software project management in pakistani software companies. Turk. J. Comput. Math. Educ. (TURCOMAT) 2021, 12, 1717–1727. [Google Scholar] [CrossRef]
  52. Yadav, N.S.; Goar, V.K.; Kuri, M. Agile Methodology-a Perfect Sdlc Model with Some Improvements. J. Crit. Rev. 2020, 7, 2511–2514. [Google Scholar] [CrossRef]
  53. Checkland, P. Systems Thinking, Systems Practice; John Wiley & Sons: Hoboken, NJ, USA, 1981; pp. 13–312. [Google Scholar]
  54. Beer, S. Brain of the Firm: The Managerial Cybernetics of Organization; Wiley: Hoboken, NJ, USA, 1972; pp. 113–315. [Google Scholar]
  55. Beck, K.; Beedle, M.; van Bennekum, A.; Cockburn, A.; Cunningham, W.; Fowler, M.; Thomas, D. Manifesto for Agile Software Development. 2001. Available online: https://agilemanifesto.org/ (accessed on 16 January 2025).
  56. Jackson, M.C. Systems Thinking: Creative Holism for Managers; Citeseer; John Wiley & Sons, Ltd.: Chichester, UK, 2016; pp. 116–216. [Google Scholar]
  57. Hildbrand, S.; Bodhanya, S. Exploring the complexity of sugarcane supply chains via systemic approaches. Kybernetes 2017, 46, 310–329. [Google Scholar] [CrossRef]
  58. Donaires, O.S. Aplicação de abordagem sistêmica na resolução de conflito no desenvolvimento de produtos inovadores. In Proceedings of the Anais do Congresso Brasileiro de Sistemas, Bonito, Spain, 9–11 November 2010. [Google Scholar]
  59. Kinloch, P.; Francis, H.; Francis, M.; Taylor, M. Supporting crime detection and operational planning with soft systems methodology and viable systems model. Syst. Res. Behav. Sci. Off. J. Int. Fed. Syst. Res. 2009, 26, 3–14. [Google Scholar] [CrossRef]
  60. Bustard, D.W.; Sterritt, R.; Taleb-Bendiab, A.; Laws, A. Autonomic system design based on the integrated use of SSM and VSM. Artif. Intell. Rev. 2006, 25, 313–327. [Google Scholar] [CrossRef]
  61. Beer, S. Recursion zero: Metamanagement. Syst. Pract. 1990, 3, 315–326. [Google Scholar] [CrossRef]
  62. Espejo, R.; Bowling, D.; Hoverstadt, P. The viable system model and the Viplan software. Kybernetes 1999, 28, 661–678. [Google Scholar] [CrossRef]
  63. Espinosa, A.; Walker, J. Complexity management in practice: A Viable System Model intervention in an Irish eco-community. Eur. J. Oper. Res. 2013, 225, 118–129. [Google Scholar] [CrossRef]
  64. Perez, J. Disseño y Diagnóstico de Organizaciones Viables: Un Enfoque Sistemico; Universidad de Valladolid: Valladolid, Spain, 2008. [Google Scholar]
  65. Schwaninger, M. Theories of viability: A comparison. Syst. Res. Behav. Sci. Off. J. Int. Fed. Syst. Res. 2006, 23, 337–347. [Google Scholar] [CrossRef]
  66. Harwood, S.A. A question of interpretation: The viable system model (VSM). Eur. J. Oper. Res. 2019, 274, 1198–1201. [Google Scholar] [CrossRef]
  67. Pósfai, M.; Barabási, A.L. Network Science; Cambridge University Press: Cambridge, UK, 2016; pp. 18–451. [Google Scholar]
  68. Wiener, N. Cybernetics: Or Control and Communication in the Animal and the Machine; MIT Press: Cambridge, MA, USA, 1948; pp. 16–103. [Google Scholar]
  69. Forrester, J.W. Industrial Dynamics; MIT Press: Cambridge, MA, USA, 1961; pp. 25–39. [Google Scholar] [CrossRef]
  70. Sterman, J.D. Business Dynamics: Systems Thinking and Modeling for a Complex World; McGraw-Hill: Boston, MA, USA, 2000; pp. 20–26. [Google Scholar]
  71. Deming, W.E. Out of the Crisis; MIT Press: Cambridge, MA, USA, 1986; pp. 89–91. [Google Scholar] [CrossRef]
  72. Checkland, P. Systems Thinking, Systems Practice: Includes a 30-Year Retrospective; John Wiley & Sons: Chichester, UK, 2001; p. 416. [Google Scholar]
  73. Borgatti, S.P.; Everett, M.G.; Freeman, L.C. UCINET for Windows: Software for Social Network Analysis; Analytic Technologies: Lexington, KY, USA, 2002; pp. 56–98. [Google Scholar] [CrossRef]
  74. Cormen, T.H.; Leiserson, C.E.; Rivest, R.L.; Stein, C. Introduction to Algorithms, 3rd ed.; MIT Press: Cambridge, MA, USA, 2009; pp. 746–764. [Google Scholar]
  75. Barabási, A.L.; Albert, R. Emergence of scaling in random networks. Science 1999, 286, 509–512. [Google Scholar] [CrossRef]
  76. Ghosh, R.; Lerman, K. Parameterized centrality metric for network analysis. Phys. Rev. E—Stat. Nonlinear Soft Matter Phys. 2011, 83, 4–6. [Google Scholar] [CrossRef]
  77. Schwab, J.D.; Kühlwein, S.D.; Ikonomi, N.; Kühl, M.; Kestler, H.A. Concepts in Boolean network modeling: What do they all mean? Comput. Struct. Biotechnol. J. 2020, 18, 571–582. [Google Scholar] [CrossRef]
  78. Soffer, S.N.; Vazquez, A. Network clustering coefficient without degree-correlation biases. Phys. Rev. E 2005, 71, 057101. [Google Scholar] [CrossRef] [PubMed]
  79. Zhang, P.; Wang, J.; Li, X.; Li, M.; Di, Z.; Fan, Y. Clustering coefficient and community structure of bipartite networks. Phys. A Stat. Mech. Appl. 2008, 387, 6869–6875. [Google Scholar] [CrossRef]
  80. Lewis, T.G. Network Science: Theory and Applications; John Wiley & Sons: Hoboken, NJ, USA, 2011; p. 512. [Google Scholar]
  81. Jolicoeur, P.; Jolicoeur, P. The Poisson distribution. In Introduction to Biometry; Springer: Boston, MA, USA, 1999; pp. 124–133. [Google Scholar]
  82. Flood, R.L. Solving Problem Solving: A Potent Force for Effective Management; John Wiley & Sons: Chichester, UK, 1995; p. 248. [Google Scholar]
  83. Bergvall-Kåreborn, B.; Mirijamdotter, A.; Basden, A. Basic principles of SSM modeling: An examination of CATWOE from a soft perspective. Syst. Pract. Action Res. 2004, 17, 55–73. [Google Scholar] [CrossRef]
  84. Marttunen, M.; Lienert, J.; Belton, V. Structuring problems for Multi-Criteria Decision Analysis in practice: A literature review of method combinations. Eur. J. Oper. Res. 2017, 263, 1–17. [Google Scholar] [CrossRef]
  85. Salner, M. Beyond Checkland & Scholes: Improving SSM. In Proceedings of the International Conference of the System Dynamics Society, Wellington, New Zealand, 20–23 July 1999. [Google Scholar]
  86. Rezaee, Z.; Azar, A.; Erz, A.M.B.; Nayeri, M.D. Application of viable system model in diagnosis of organizational structure. Syst. Pract. Action Res. 2019, 32, 273–295. [Google Scholar] [CrossRef]
  87. Azadeh, A.; Darivandi, K.; Fathi, E. Diagnosing, simulating and improving business process using cybernetic laws and the viable system model: The case of a purchasing process. Syst. Res. Behav. Sci. 2012, 29, 66–86. [Google Scholar] [CrossRef]
  88. Leonard, A. The viable system model and its application to complex organizations. Syst. Pract. Action Res. 2009, 22, 223–233. [Google Scholar] [CrossRef]
  89. Espinosa, A.; Walker, J. Complexity Approach to Sustainability, A: Theory and Application; World Scientific: Singapore, 2017; Volume 5. [Google Scholar] [CrossRef]
  90. Hilder, T. Stafford Beer’s Viable System Model: An Interpretation; Cavendish Software Ltd.: Trowbridge, UK, 1995. [Google Scholar]
  91. Hayward, P. Facilitating foresight: Where the foresight function is placed in organisations. Foresight 2004, 6, 19–30. [Google Scholar] [CrossRef]
  92. Sydelko, P.; Espinosa, A.; Midgley, G. Designing interagency responses to wicked problems: A viable system model board game. Eur. J. Oper. Res. 2024, 312, 746–764. [Google Scholar] [CrossRef]
  93. Hoverstadt, P. The Fractal Organization: Creating Sustainable Organizations with the Viable System Model; John Wiley & Sons: Hoboken, NJ, USA, 2011. [Google Scholar] [CrossRef]
  94. Clark, A.; Brocklesby, J.; Elias, A. Enhancing collaborative advantage through critical systems thinking: An augmented viable system model intervention in a cross-sector partnership social policy context. Syst. Res. Behav. Sci. 2024, 42, 142–156. [Google Scholar] [CrossRef]
  95. Pérez, R.J. Design and Diagnosis for Sustainable Organizations: The Viable System Method; Springer Science & Business Media: Berlin/Heidelberg, Germany, 2012. [Google Scholar] [CrossRef]
  96. Ashby, W.R. An Introduction to Cybernetics; Chapman & Hall: London, UK, 1956; p. 295. [Google Scholar]
  97. Christopher, W.F. Holistic Management: Managing What Matters for Company Success; John Wiley & Sons: Hoboken, NJ, USA, 2007; p. 288. [Google Scholar] [CrossRef]
  98. Neumann, M. Towards a taxonomy of agile methods: The tree of agile elements. In Proceedings of the 2021 9th International Conference in Software Engineering Research and Innovation (CONISOFT), San Diego, CA, USA, 25–29 October 2021; pp. 79–87. [Google Scholar] [CrossRef]
  99. Kniberg, H.; Skarin, M. Kanban and Scrum-Making the Most of Both; Lulu Press: Morrisville, NC, USA, 2010. [Google Scholar]
  100. Mahnic, V. Scrum in software engineering courses: An overview. IEEE Trans. Educ. 2015, 58, 253–258. [Google Scholar] [CrossRef]
  101. Moe, N.B.; Smite, D.I.K.; Ågerfalk, P.J.; Jørgensen, M. Understanding the dynamics in distributed agile teams. In Proceedings of the 2012 International Conference on Agile Software Development, Malmö, Sweden, 21–25 May 2012; pp. 105–119. [Google Scholar] [CrossRef]
  102. Hobbs, B.; Petit, Y. Agile methods on large projects in large organizations. Proj. Manag. J. 2017, 48, 3–19. [Google Scholar] [CrossRef]
  103. Highsmith, J. Agile Project Management: Creating Innovative Products; Pearson Education: London, UK, 2009. [Google Scholar] [CrossRef]
  104. Stettina, C.J.; Hörz, J. Agile portfolio management: An empirical perspective on the practice in use. Int. J. Proj. Manag. 2015, 33, 140–152. [Google Scholar] [CrossRef]
  105. Ahmad, M.O.; Markkula, J.; Oivo, M. Kanban in software development: A systematic literature review. In Proceedings of the 2013 39th Euromicro Conference on Software Engineering and Advanced Applications, Santander, Spain, 4–6 September 2013; pp. 9–16. [Google Scholar] [CrossRef]
  106. Hofstede, G. Culture’s Consequences: Comparing Values, Behaviors, Institutions and Organizations Across Nations; Sage: Thousand Oaks, CA, USA, 2001. [Google Scholar]
  107. Quinn, R.E.; Rohrbaugh, J. A spatial model of effectiveness criteria: Towards a competing values approach to organizational analysis. Manag. Sci. 1983, 29, 363–377. [Google Scholar] [CrossRef]
  108. Klatt, K.U.; Marquardt, W. Perspectives for process systems engineering—Personal views from academia and industry. Comput. Chem. Eng. 2009, 33, 536–550. [Google Scholar] [CrossRef]
  109. Klir, G.J. Architecture of Systems Problem Solving; Springer Science & Business Media: Berlin/Heidelberg, Germany, 2013. [Google Scholar] [CrossRef]
  110. Granovetter, M.S. The strength of weak ties. Am. J. Sociol. 1973, 78, 1360–1380. [Google Scholar] [CrossRef]
  111. Agneessens, F.; Borgatti, S.P.; Everett, M.G. Geodesic based centrality: Unifying the local and the global. Soc. Netw. 2017, 49, 12–26. [Google Scholar] [CrossRef]
  112. Espinosa, E.O.C.; Mendoza, J.R.R.; Padilla, R.T. Evaluación de programas educativos desde la perspectiva de los sistemas suaves: Propuesta metodológica. Rev. Univ. EAFIT 2009, 45, 30–44. [Google Scholar]
Figure 1. Metamethodology based on: SSM + VSM + AM. Source: Author’s own elaboration.
Systems 13 00343 g001
Figure 2. Taxonomy of agile elements [98].
Systems 13 00343 g002
Figure 3. Unfolding of complexity. Source: Author’s own elaboration.
Systems 13 00343 g003
Figure 4. Enriched vision of the Issue Resolution area. Source: Author’s own elaboration.
Systems 13 00343 g004
Figure 5. Enriched view of the vehicle Issue Resolution Quality area. Source: Author’s own elaboration.
Systems 13 00343 g005
Figure 7. Operating Subsystem Pre-sale Issue Resolution. Source: Author’s own elaboration.
Systems 13 00343 g007
Figure 8. Operating Subsystem After-sale Issue Resolution. Source: Author’s own elaboration.
Systems 13 00343 g008
Figure 9. Subsystem 2 “Coordination”. Source: Author’s own elaboration.
Systems 13 00343 g009
Figure 10. Subsystem 3 “Operational Management”. Source: Author’s own elaboration.
Systems 13 00343 g010
Figure 11. Subsystem 3*. Source: Author’s own elaboration.
Systems 13 00343 g011
Figure 12. Subsystem 4 “Strategic Direction”. Source: Author’s own elaboration.
Systems 13 00343 g012
Figure 13. Subsystem 5. Source: Author’s own elaboration.
Systems 13 00343 g013
Figure 14. Viable System Model for Issue Resolution System. Source: Author’s own elaboration.
Systems 13 00343 g014
Figure 15. Issue Resolution System Attenuators and Amplifiers Before-Sales. Source: Author’s own elaboration.
Systems 13 00343 g015
Figure 16. Issue Resolution System Attenuators and Amplifiers After-Sales. Source: Author’s own elaboration.
Systems 13 00343 g016
Figure 17. Taxonomy of Issue Resolution System Attenuators and Amplifiers After-Sales. Source: Author’s own elaboration.
Systems 13 00343 g017
Figure 18. Taxonomy of Issue Resolution System Attenuators and Amplifiers Before-Sales. Source: Author’s own elaboration.
Systems 13 00343 g018
Table 1. Example of Adjacency Matrix.
Actor AActor BActor C
Actor A011
Actor B101
Actor C110
Source: Author’s own elaboration.
Table 6. Additional agile elements by dimension.
IDDescriptionDimension
46Virtual boardsActivity
47Physical BoardsActivity
48Team LeadRole
49Project SponsorRole
50team memberRole
51Subject Master ExpertRole
52Finance PartnerRole
53Service Request ManagerRole
54Service Delivery ManagerRole
Source: Author’s own elaboration.
Table 7. Network metrics, comparison for Quality Department and Issue Resolution area.
QualityIR
Total actors8426
k o (output degrees)21059
k i (input degrees)21059
L21059
L max 3486325
Density0.030.091
K Average grade2.52.231
Source: Author’s own elaboration using UCINET software version 6.772 [73].
Table 8. Centrality parameters, comparison for Quality Department and Issue Resolution area.
Centrality Parameters
ParametersQualityIssue Resolution
Clustering coefficient715.3710.286
Weighted clustering coefficient14.2550.143
Average distance3.1782.619
Betweenness39.07116.5
Source: Author’s own elaboration using UCINET software version 6.772 [73].
Table 9. Network Parameters.
QualityIssue Resolution
N8426
k 2.52.231
ln N 4.433.258
Result k > 1 k > 1
RegimeSuper CriticalSuper Critical
Source: Author’s own elaboration using UCINET software [73].
Disclaimer/Publisher’s Note: The statements, opinions and data contained in all publications are solely those of the individual author(s) and contributor(s) and not of MDPI and/or the editor(s). MDPI and/or the editor(s) disclaim responsibility for any injury to people or property resulting from any ideas, methods, instructions or products referred to in the content.

