1. Introduction
The increasing number of electric vehicles (EVs) is already exposing issues caused by traffic structure changes, which include shifts in local and long-haul freight transport, seasonal passenger travel patterns, as well as gradual adoption of alternatively fueled vehicles. Given this development, the lack of charging infrastructure presents an obstacle for EV adoption and also requires a different understanding of charging behavior as opposed to refueling. Various technological and organizational solutions may mitigate these issues to a degree; however, the still-developing infrastructure can present a serious issue to future traffic flows. Furthermore, the lack of available infrastructure may hinder the EV adoption rate. With most research focused on urban planning and pricing policies to accommodate the increasing EV requirements, the field of infrastructure planning along transit routes also requires a deeper insight.
Selecting proper locations for the charging infrastructure can depend on various factors, such as accessible geography, land property rights, flooding areas or other hazards, environmental protection zones, etc. For example, while available land may initially appear suitable, its utility may be limited if grid access is lacking or if it lies within an environmental protection zone. Similarly, locations near existing substations may reduce infrastructure costs but may not align with traffic flow needs. The requirement for charging hubs to be available along motorways at every 60 km for cars and every 120 km for trucks and buses as per EU regulations should also be taken into consideration [
1].
While the current EV adoption may be relatively low, the expected development requires careful planning of future requirements [
2]. Setting up electrical and other infrastructure can require substantial investments, which is why providing sufficient capacities for future demand can prevent the need for costly adaptations later. Motorway charging in particular requires understanding different charging behavior as opposed to urban charging. Highly directional and seasonally variable traffic patterns on motorways do not allow the same approach as in urban planning. As the aforementioned traffic structure on motorways includes a significant number of commercial vehicles, infrastructure planning needs to anticipate their distinct energy needs and schedules in order to ensure smooth traffic flows.
This paper addresses the issue of motorway charging by proposing a hybrid simulation model for planning and analyzing EV fast-charging on motorways. The hybrid model combines a decision model to predict the charging demand based on traffic flow and a discrete-event model to simulate the charging operations. While the main parameter was traffic volume, which was estimated as a forecast based on historical traffic development, the model also incorporated battery and charger characteristics, temperature effects on battery efficiency, and estimated EV adoption rate. In this research, the presented model was used to analyze the operations of a charging hub in order to anticipate its power demands in peak hours, explore utilization rates of the charging hub under different traffic loads, and predict and or prevent bottlenecks that influence local traffic flow and user satisfaction.
The model was used with data from a traffic counter on Slovenian motorways [
3], which, due to its geographical location, provided a mixed traffic structure of predominantly not local but international commercial vehicles hauling freight [
4]. On the other hand, cars presented mostly domestic traffic, with the biggest volume being work trips between the largest Slovenian cities, with the exception of the tourist season and certain holidays, when foreign (as well as domestic) car volume drastically increases on the motorways. The main premise here is that transit traffic will rely on motorway AC fast charging capacities [
5], and alternatives will be available to domestic users. Although pricing policies and scheduling options can affect the charging service selection and can also influence the traffic flow [
6], the bulk of international transport will have no other option than to charge at motorway services.
While some individual charging stations are available along the Slovenian motorways, the expected shift to EV in the coming years requires adaptation to greater demand. While sparsely positioned chargers may distribute the demand over a larger area, providing access through charging hubs capable of serving a multitude of vehicles also addresses the problem of providing electricity to distant locations, as the location of a charging hub also requires the construction of a suitable substation. The results of the presented model will provide the basis for planning the required substation output power levels, charging hub configuration, and layout requirements.
2. Related Work
2.1. EV Charging Behavior and User Preferences
Understanding EV user behavior is essential for estimating demand profiles and infrastructure performance. In [
7], the state of charge (SoC) and energy storage distribution are modeled based on real-world data from Denmark, providing insight into battery utilization and the potential for vehicle-to-grid (V2G) services. Similarly, ref. [
8] analyzes plug-in EV charging behavior and finds that over half of users charge exclusively at home, with only 5% relying on public charging—primarily to reduce range anxiety. Charging preferences are also explored in [
9], where the authors identify influencing factors across transport, vehicle, and power system domains. The study notes that most users prefer overnight charging and avoid deep discharges, contributing to evening peak loads and battery preservation behaviors.
Workplace and flexible charging patterns are examined in [
10], which presents an algorithm for optimizing charger flexibility and peak demand reduction. The study considers charger types, SoC variability, and historical consumption, and while focused on workplace environments, its insights are transferable to motorway settings, particularly for managing high-traffic periods.
A comprehensive review of factors influencing electric vehicle (EV) range prediction, categorizing them into vehicle design, driver behavior, and environmental conditions is given in [
11]. They highlight the complexity of accurately forecasting EV range due to the interplay of these diverse factors. While their work offers a broad overview, it underscores the necessity for models that integrate real-time traffic dynamics, charging behavior, and infrastructure constraints, particularly in the context of long-distance highway travel.
In [
12], a novel adaptive stated choice experiment to investigate range anxiety and charging decisions during long-distance EV travel is presented. This study captures how drivers dynamically weigh the SoC, detours, waiting times, and charger availability over the course of a journey. A mixed logit model reveals that the decision to charge is influenced not only by the remaining range but also by sociodemographic factors, including age and vehicle brand. The authors observe that some segments, such as Tesla drivers and younger users, are less susceptible to range anxiety.
2.2. Commercial EV Charging and Freight Transport
Commercial EVs, especially heavy-duty trucks, introduce distinct charging demands and infrastructure requirements. In [
13], the authors compare on-route and return-to-base charging strategies for medium- and heavy-duty trucks, highlighting challenges such as regulatory constraints and charger location planning. This work also addresses commercial V2G integration and the specific design needs of freight vehicles.
Long-haul electric trucking is explored in [
5], comparing two fast-charging network scenarios: one with 100 km spacing and another with 50 km. Using 2030 projections and a 15% truck electrification rate, the study shows that denser networks reduce wait times but require significantly higher investment.
The regulatory framework surrounding truck charging infrastructure is discussed in [
14], which outlines EU targets for fast-charging stations on the TEN-T network. The paper emphasizes gaps in public charging for freight, particularly in countries like Poland, and argues for a structured, law-based methodology to guide charger deployment at megawatt-scale power levels.
Several studies address the spatial distribution and sizing of EV charging stations. In [
2], the authors identify infrastructure gaps along EU highways, particularly the TEN-T network, where fast chargers are concentrated in Western Europe. The EU’s plan for 3 million chargers by 2030, including requirements for high-power hubs at fuel stations, underscores the urgency of strategic planning—an issue also tackled by our model.
Traffic-based demand modeling is used in [
15], where different timeframes and charger configurations are evaluated. The study highlights the importance of range anxiety as a design constraint and promotes adaptive charger placement along major corridors. In [
16], a multi-criteria methodology avoids co-locating chargers at petrol stations, favoring locations near population centers, logistics hubs, and high-traffic routes.
Urban optimization strategies also contribute useful insights. Reference [
17] applies particle swarm optimization to balance station loads and reduce bottlenecks caused by an uneven distribution. Although focused on urban settings, such approaches inform macro-level infrastructure layout for regional networks.
2.3. Simulation and Load Modeling Approaches
Simulation methods are commonly used to estimate power demand and charging dynamics. In [
18], a microscopic traffic simulation shows that high-demand charging stations can create local congestion and trigger detours, increasing pressure on nearby routes. Similarly, ref. [
19] compares random and coordinated charging strategies using Monte Carlo methods, concluding that coordinated charging shifts loads away from peak hours and improves grid efficiency.
A discrete event simulation (DES) model with survey data to simulate EV charging behavior under varying conditions of charger availability and user preferences is presented in [
20]. The findings support strategies like charging frequency reduction and promoting home charging to spread demand more evenly. A broad review of infrastructure modeling strategies is provided in [
21], which classifies node-based, path-based, and tour-based methods. The authors note that hybrid approaches are often more effective and stress the need for incrementally scalable, strategically located infrastructure along transit corridors.
An agent-based simulation framework to estimate EV charging loads based on aggregated user behavior, spatial constraints, and temporal usage patterns is presented in [
22]. Their model incorporates driver preferences, SoC thresholds, charger availability, and probabilistic arrival times to simulate realistic, urban charging dynamics. While their focus is on urban environments and behavior-driven modeling, the study shares common ground with our approach in simulating charging demand using system-level variables.
Another agent-based simulation is proposed in [
23] with a high-resolution agent-based simulation (ABS) framework to evaluate the layout of electric vehicle charging infrastructure (EVCI) in urban environments. Their model integrates GPS trajectory data of electric taxis in Shenzhen with a geographic information system (GIS) road network, enabling dynamic routing and real-time decision making by agents based on queuing conditions and traffic states. Key contributions include direct behavior extraction from GPS data, rule-based charger selection, and a multi-objective Pareto optimization to balance station utilization and driver satisfaction.
A recent contribution is provided by [
24], where the authors propose a hybrid method combining p-median location optimization, a genetic algorithm, and discrete-event simulation to identify optimal locations and determine capacities for EV charging stations. Their work emphasizes demand-driven infrastructure development, incorporating market penetration forecasts, station queuing performance, and charging module type differentiation (fast vs. normal).
A comprehensive review of EV charging infrastructure planning methodologies is presented in [
25], which examines integrated approaches that consider both transportation and power systems. Their work classifies existing models based on spatial, temporal, and technological scope, and highlights the growing importance of
co-optimization techniques that simultaneously address vehicle routing, grid constraints, and charging station operations. They emphasize that realistic planning requires not only demand estimation but also grid-aware simulation and iterative design methods.
3. Materials and Methods
With the currently underdeveloped infrastructure for future requirements, this paper does not focus on exploring the EV charging network along TEN-T but instead focuses on finding the requirements for setting up an EV charging hub capable of serving a multitude of vehicles at any location along the motorway which fulfil basic conditions of having suitable geographical features, resolved land ownership and also proximity to the existing electrical grid. Without an existing developed grid, this first location can serve as a pivot point for setting up surrounding charging hubs along the motorway and plan the required infrastructure accordingly.
As planning infrastructure is a long-term investment, it is necessary to consider future development of multiple factors with the focus on:
- 1.
Future traffic volume;
- 2.
EV adoption into the traffic structure;
- 3.
Technological advances.
Future traffic volumes can be estimated based on historical data. There are multiple factors to consider, such as future economic development, policy changes, global crises such as pandemics, or even new technological advances that could thwart accurate prediction. Still, historical data can provide a reliable way of predicting the trend of future traffic.
EV adoption rate can be estimated in a similar way. With the expected turn to non-fossil engines in the EU until 2035 [
1], alternative solutions are not only EVs, but also synthetic fuel and hydrogen, which may impact the structure of future fleets. It is also important to consider that these vehicles will only gradually replace existing internal combustion engine (ICE) vehicles.
Both EV battery efficiency as well as charging times have improved over time, and it can be assumed that this trend will continue. That means that the current charging patterns will probably change in the future. Whether charging times will come near those of classical car refueling or not, it will be necessary to provide the necessary power for charging EV masses or instead expect queues and delays.
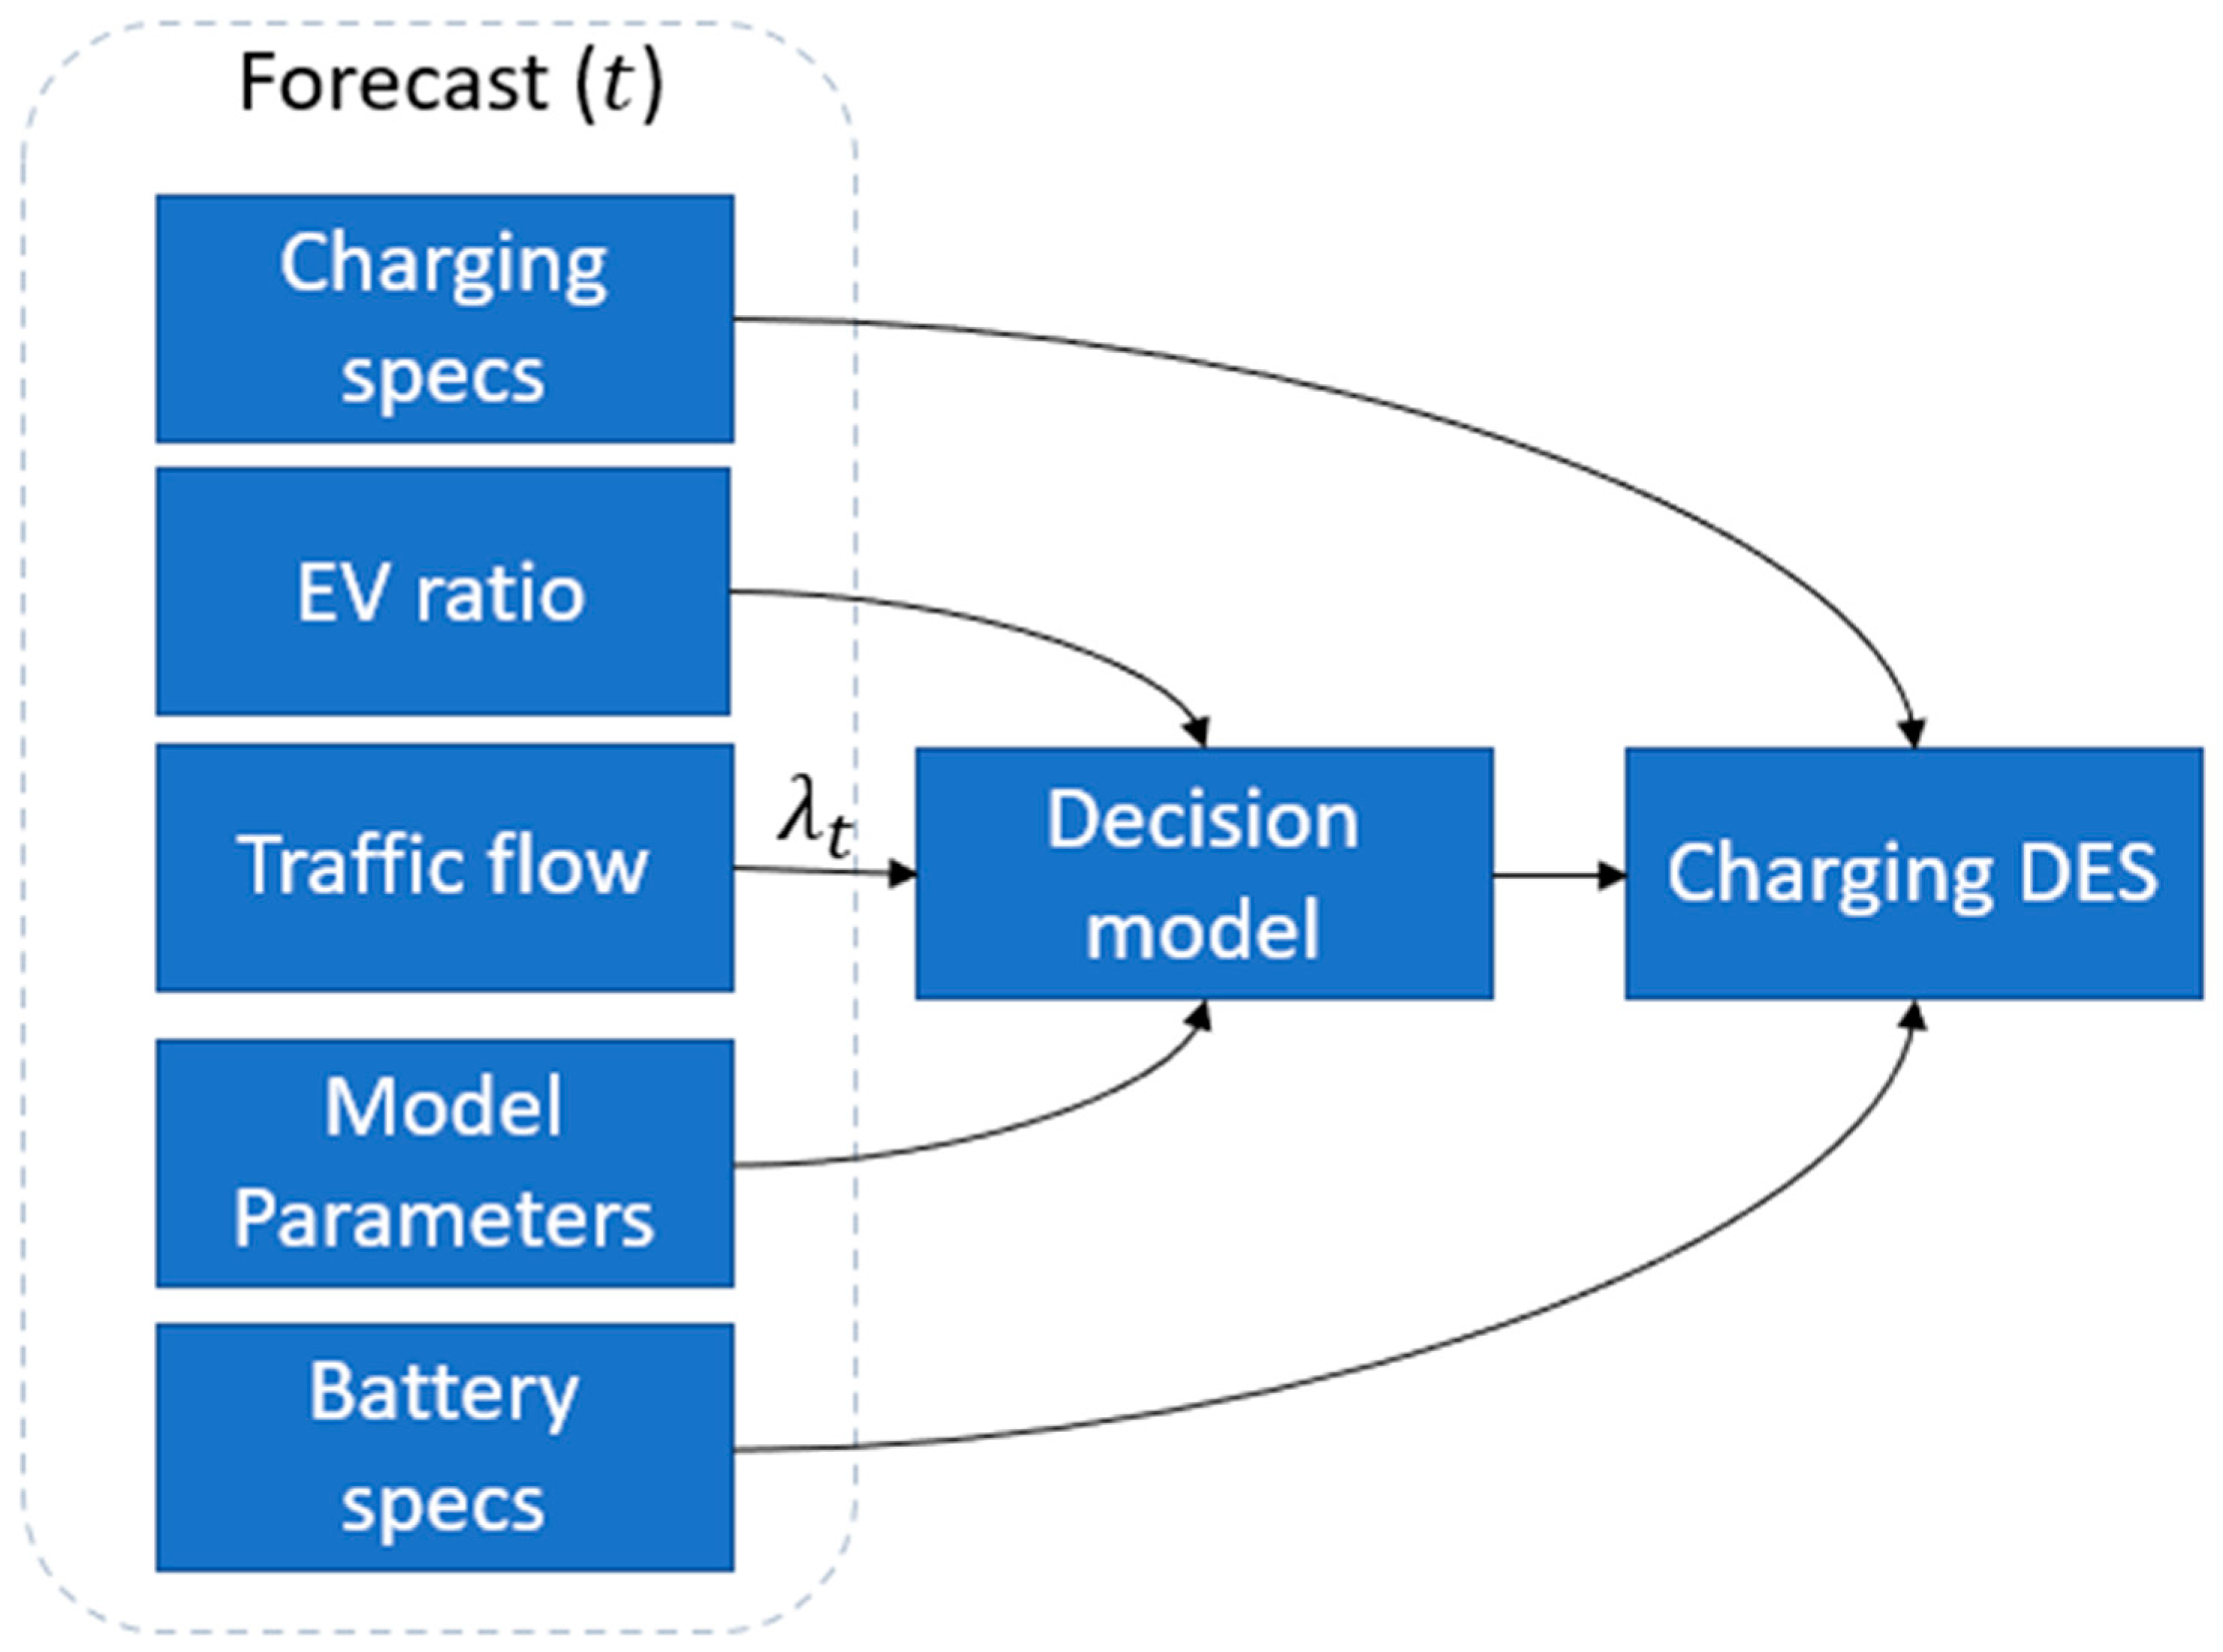
The method presented in this paper focuses on a single charging hub consisting of multiple DC charging points for both cars and trucks. The traffic flow structure at any given time presents an input for a decision model, which then relays the EV load to a discrete event simulation (DES) model of the charging hub, resulting in a calculation of the power consumption at that time (
Figure 1).
The inputs of both the decision model as well as the latter charging simulation are estimates that can be adjusted for exploring the requirements under different EV development scenarios. The parameters used in this method are listed in
Table 1.
3.1. Traffic Flow
The simulation clock advances based on the occurrence of discrete events and does not progress in fixed time steps. The timestamp of each event—such as vehicle arrival or charger availability—is either precomputed at the start of the simulation or dynamically generated in response to prior events. Although the input data provides traffic volumes at hourly intervals, the simulation clock is not limited to hourly steps, but can take on any fractional value within that interval. This allows the analysis to be conducted at a high level of precision, thus accurately capturing event dynamics and enabling precise tracking of system state changes over time.
With
representing the number of vehicles passing a traffic count within 1 h at
t, this value was used to model the exact arrival of each individual vehicle using the Poisson process [
26], which can be applied for modelling traffic flow distributions. While, according to [
27], highway traffic does not necessarily follow the Poisson process, it can be applied in cases where vehicle arrival does not appear in bursts. As the available data was sampled at an hourly rate, which was not precise enough to reveal such bursts, we assumed that the Poisson process was fitting to describe the given arrival rate. Equation (1) was used to generate exponentially distributed inter-arrival times on the assumption of a Poisson arrival process, where
λ(
t) presents the average arrival intensity at a given time.
where
presents the arrival time of each vehicle from
passing the charging hub,
is the target hourly vehicle count, and
is a randomly generated value in
, uniformly distributed. As
was updated when the simulation clock passed an hour, we followed a non-homogenous Poisson process, which adapted to the available data.
3.2. EV Charging Decision Model
In order to estimate the number of vehicles that are likely to require charging, the fleet composition needed to be provided with further detail to augment each
with additional information. Along with vehicle parameters, it is also important to consider weather conditions that can influence the range of EV batteries and traffic patterns that depend on time such as the difference between workdays and weekdays or commute hours. Each of the parameters for the decision model (
Table 1) was set stochastically based on forecasted estimates at time
.
Depending on the fleet composition, the vehicles passing the charging hub can be either cars, light trucks, medium or heavy trucks, or buses. The initial parameter defines the vehicle type-based ratio between each type forecasted at time
(Equation (2)):
With the selection of the vehicle type, the next step is to set the engine type of
, which is either EV or not (Equation (4)). This requires a forecast of the number of EVs that also depends on vehicle types, as there is a higher adoption rate of cars compared to that of trucks, for example.
where
presents the ratio of EVs of the whole traffic volume for each vehicle type. This part presents the first selection of potential candidates for charging, as only EVs are eligible for stopping at the charging hub, eliminating any others. For further analysis, the range of the vehicles was calculated based on battery capacity, which was retrieved from the forecast of battery development.
where
is the minimal expected battery capacity for a specific vehicle type at time
,
is the upper bound, and
is a function generating a random value between the lower and upper bound. As vehicles of different manufactures have different battery properties, their capacities should adhere to that as well.
Assessing the SoC requires information about traffic flows that cannot be retrieved solely from traffic count data. Further research is planned in order to augment the data with origin–destination analysis in order to provide a more accurate representation of charging requirements across the charging grid. For the purpose of this research, the SoC was modelled using as a Beta distribution (Equation (6)).
the Beta distribution was set assuming that vehicles needed to travel a certain distance in order to reach the charging hub, irrelevant on the origin, therefore, a SoC above 0.9 was unlikely. As the projected charging hub was located along the motorway, cars originating from nearby motorway entrances near populated areas was a probable source of such SoCs, otherwise, the highest expected SoC should be from cars that have been charging at previous charging hubs along the route that are expected to be 60 km apart.
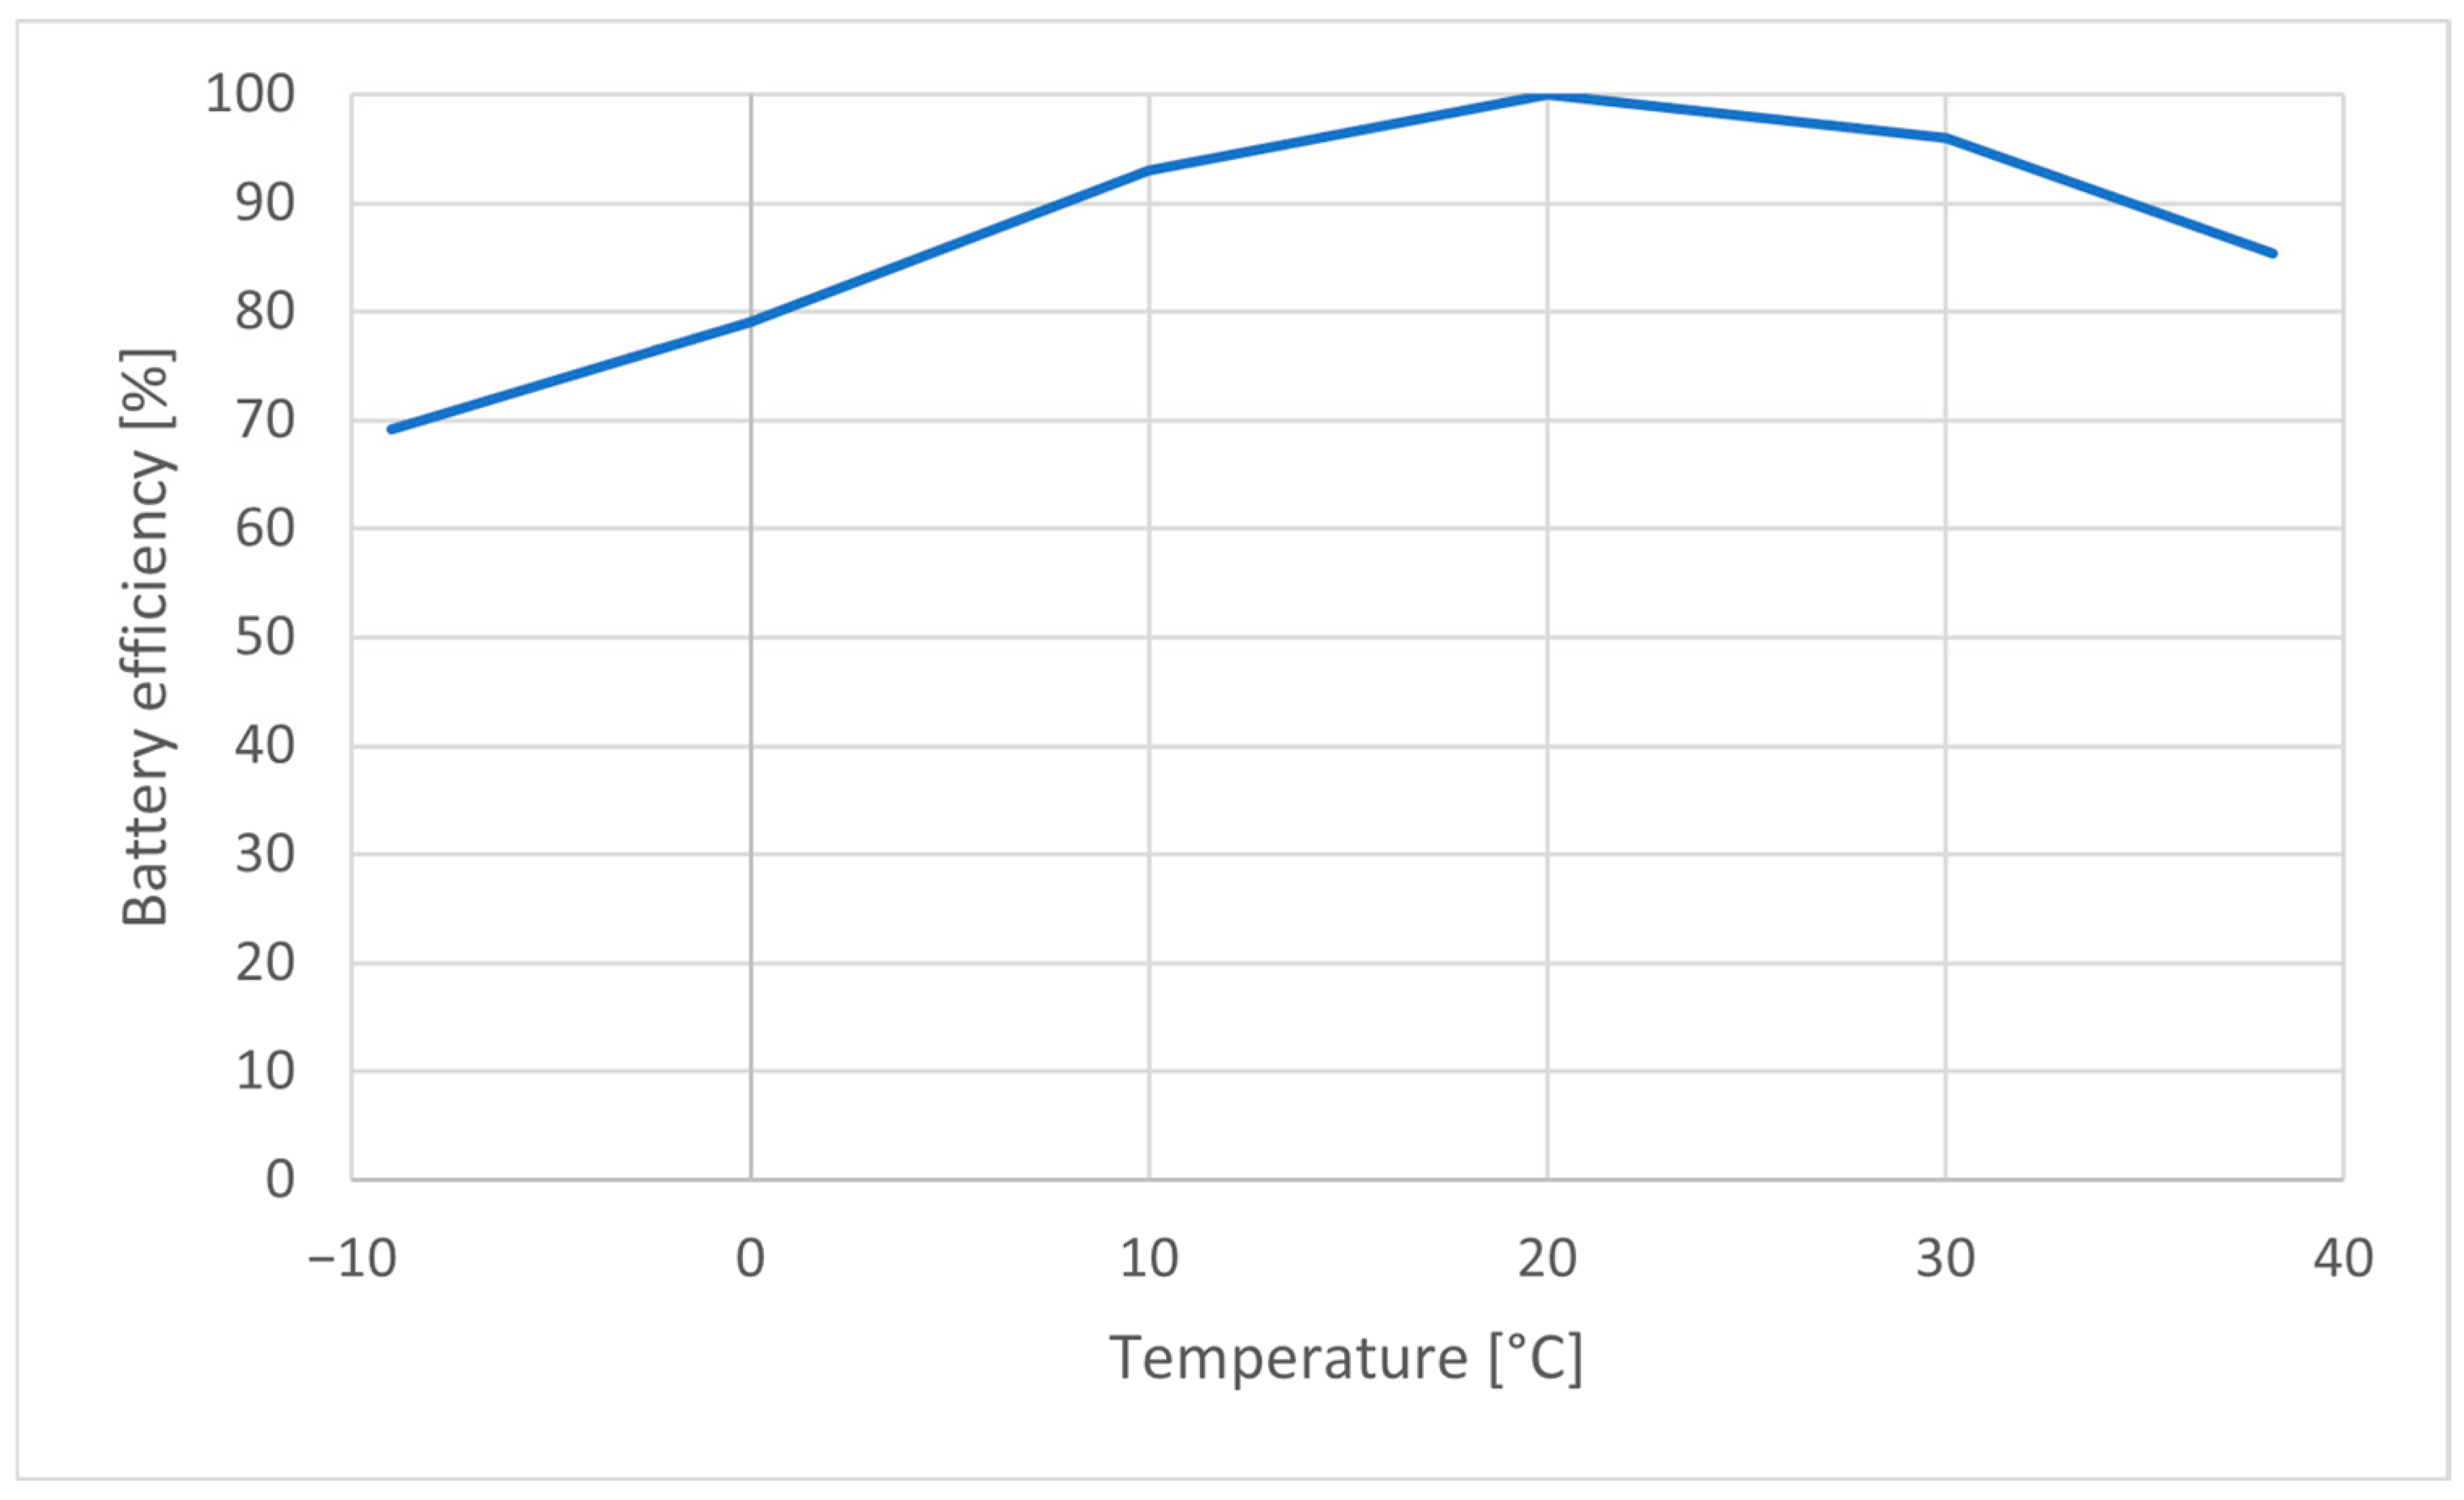
The battery capacity and SoC were used to estimate the range of the vehicle, which also depended on the vehicle type and temperature. The battery efficiency based on temperature used in this is model is displayed in
Figure 2, which depicts an approximation based on [
28].
The remaining range of each
was then calculated using Equation (7), depending on the remaining charge,
is presented as distance/charge ratio for each individual vehicle type, and battery efficiency at the temperature forecast at
.
Calculating the range provided the base for the first decision option. Any vehicle with a range lower than that required to reach the next charging option would be redirected to the current charging hub; however, there are also other traffic patterns that need to be included in this consideration.
Local and transit traffic differ in their charging behavior, with local traffic relying on local charging options at their destination. International transport is that which will predominately be using the motorway charging hubs. The charging decision for local traffic was thus further reduced, while no such penalties were applied to transit traffic. The locality flag for the vehicles was set as follows (Equation (8)):
where
presents the ratio of local to transit traffic. Local traffic will not seek service at the charging hub unless the battery charge is critically low.
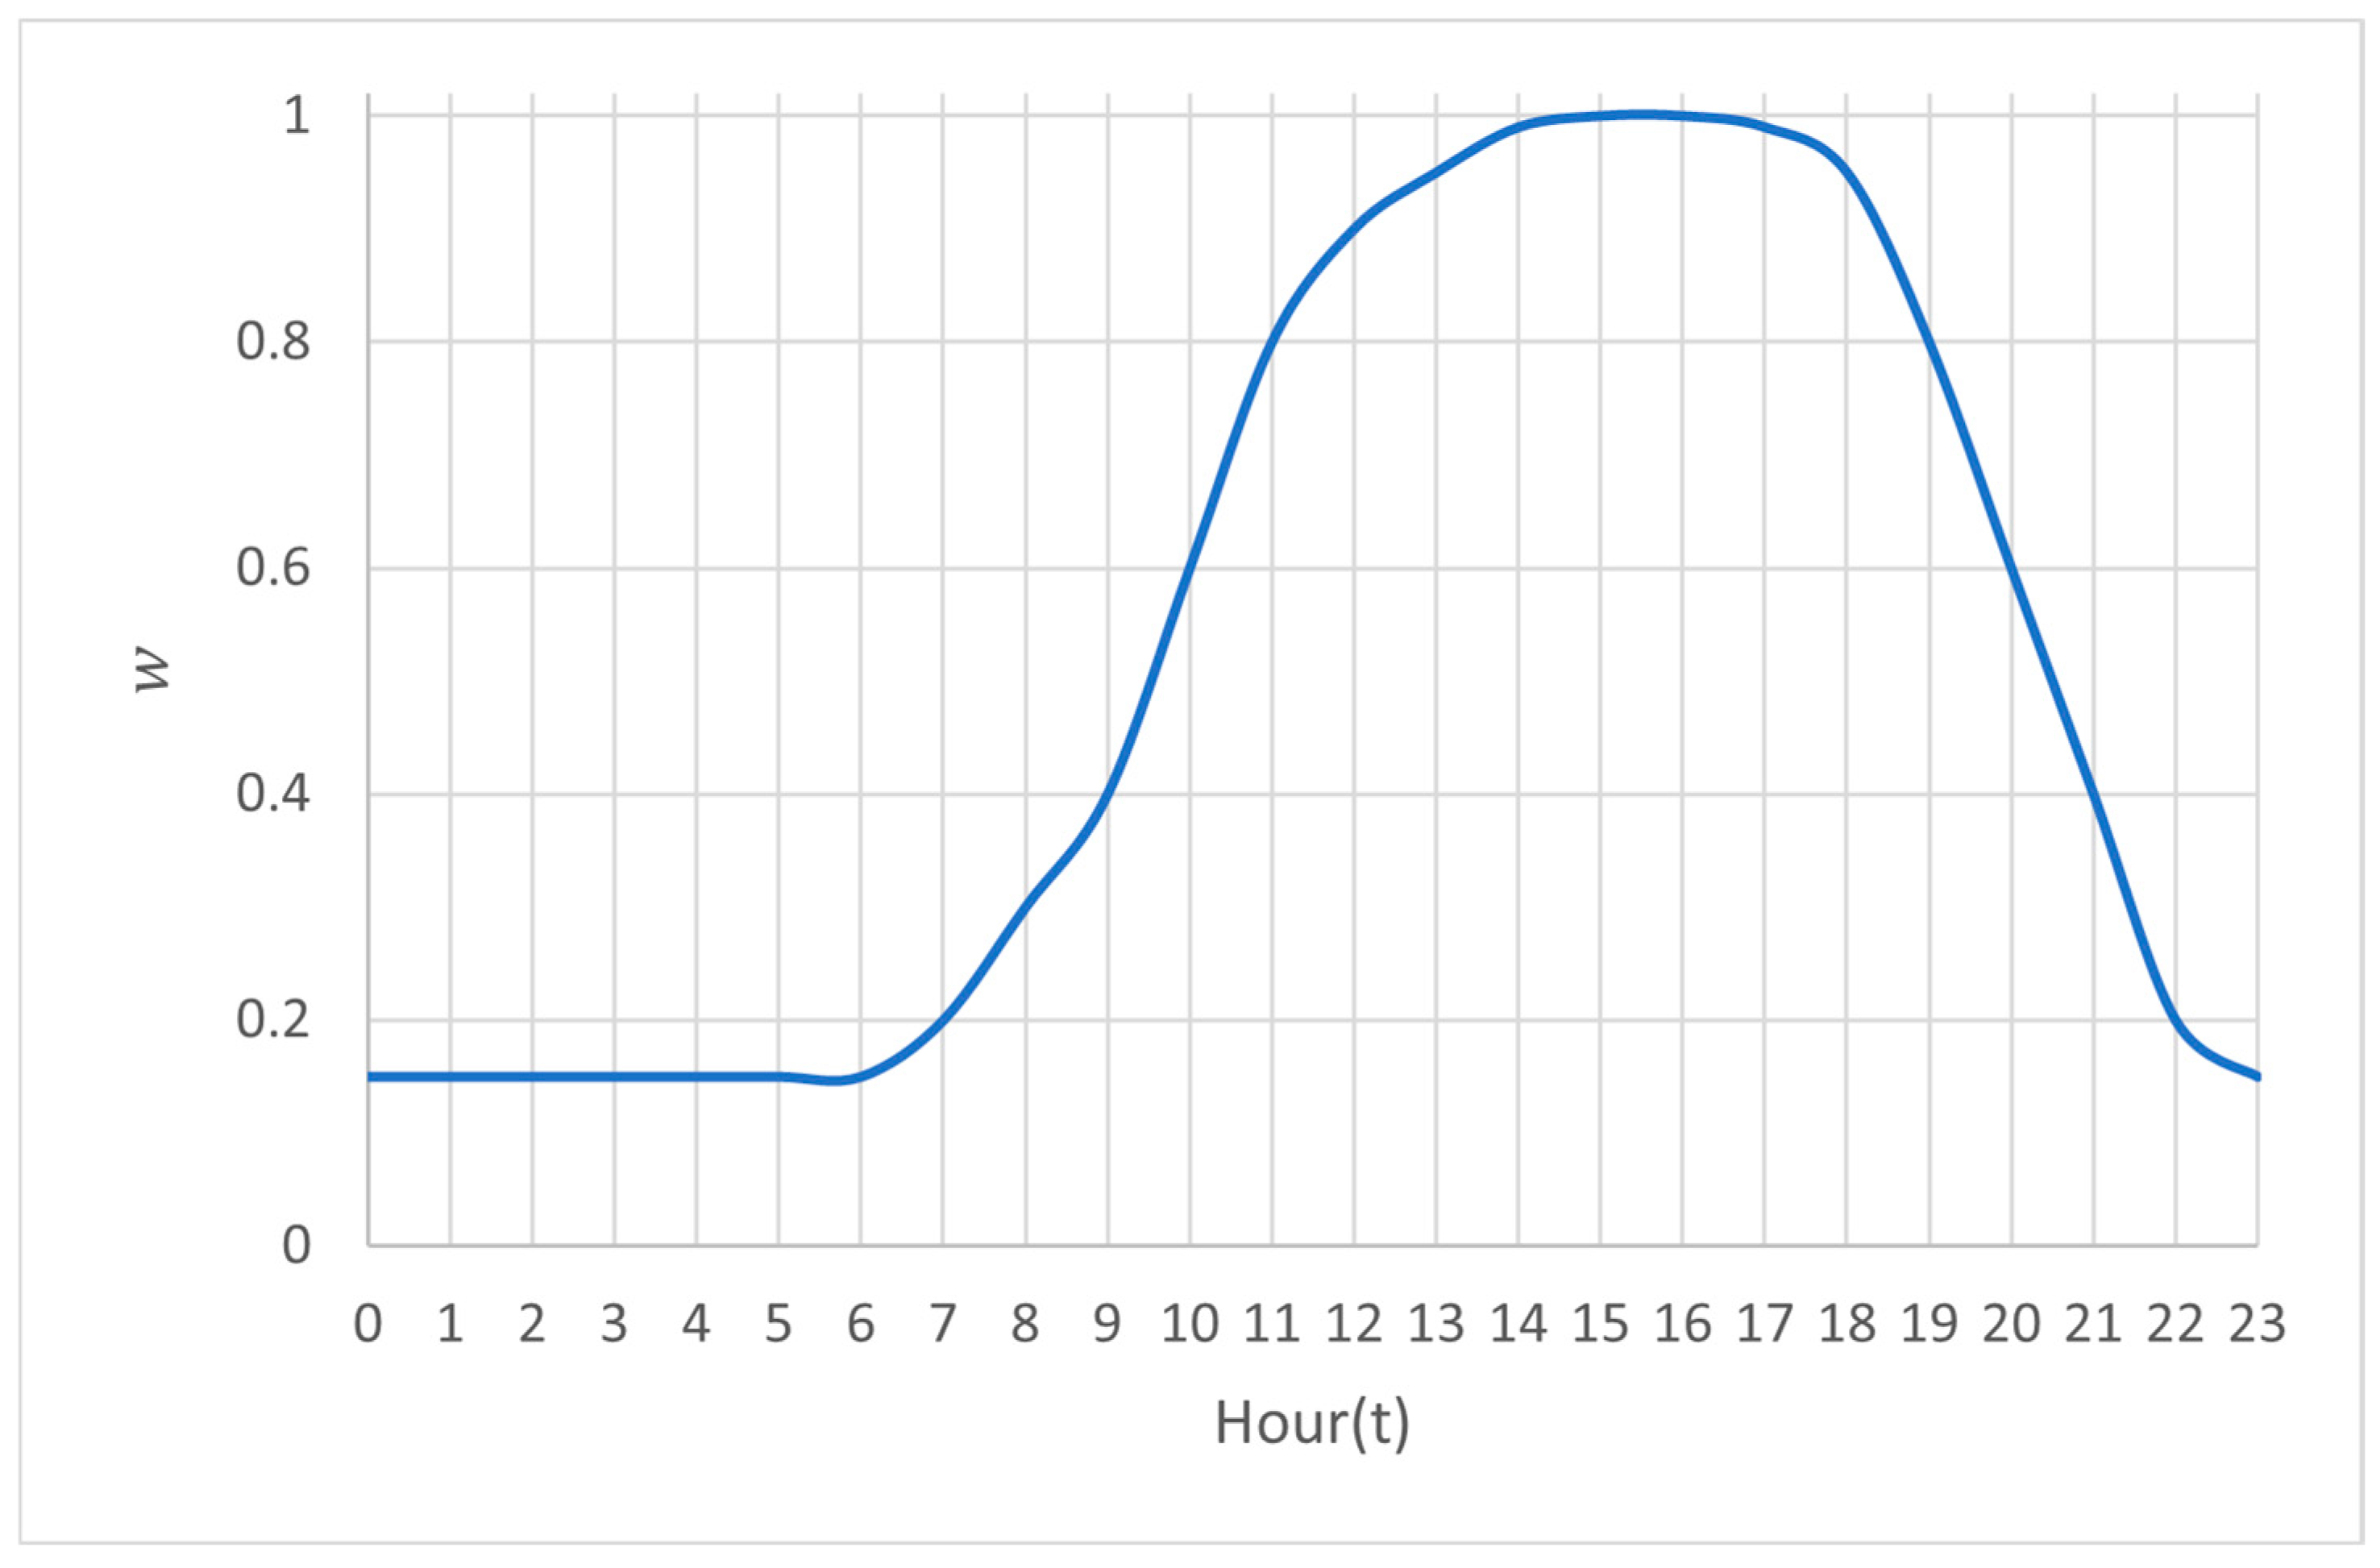
The final parameters influencing the charging decision were time of day and time of year. Cars and trucks alike are unlikely to engage in charging during morning hours, as this time usually represents morning commute where cars have probably been already charged at home. Similarly, transit traffic trucks will have been charged at truck stops on slow DC chargers during the night. It can also be assumed that trucks appearing during the night will seek slow DC charging options that have smaller power outputs. Furthermore, truck drivers are obligated to take 45 min breaks during their travel after 4.5 h, during which they may choose to use the breaks for AC charging.
A probability weight
was defined for each vehicle type that reduces the number of vehicles requiring charging at improbable hours (
Figure 3).
While hauling presents a significant portion of traffic throughout the year, it is also necessary to give attention to passenger transport, where tourist seasons see a drastic increase in both domestic as well as foreign cars. The latter will especially be prone to seeking charging services along the motorways, thus representing an atypical power demand for cars compared to that in the rest of the year.
The decision model calculated the charging probability for each individual vehicle from the inbound vehicle stream. As the simulation was intended for the initial charging hub, it was implicit that the next charging hub along the motorway will be no further than 60 km away. The calculated range based on the SoC and battery capacity allowed calculating the requirement for each vehicle to charge at the current center or continue their travel. If the vehicle’s estimated range falls below 90 km—comprising 60 km of remaining distance and a 30 km safety buffer to account for range anxiety—or if the state of charge (SoC) is expected to drop below 0.2 before reaching the next charging hub, the charging probability
is set at 0.95, leaving a small probability for exceptions. A current SoC below 0.2 forced the car to charge regardless of other parameters, assuming that no other charging options were reachable. The locality index reduced the charging probability further by a factor of 4, which was a conjectured value based on the assumption that local vehicles would avoid charging on motorways. The charging probability was then multiplied by the time-of-day weight
(see pseudocode in
Table 2).
3.3. Charging Hub DES Model
The charging hub model consisted of an inbound source of EVs, a waiting queue, and two separate arrays of servers (chargers), one for cars and light trucks, and the other for medium and heavy trucks and buses (
Figure 4). The charging process itself requires information about the current each vehicle’s battery capacity, SoC, and maximal charging power.
The queue presents a parking space or waiting line for the chargers for service using a FIFO strategy. As chargers provide different charging output powers, the queue is responsible for relaying the vehicles to the most appropriate charger that fits the maximal allowed charging power of the EVs battery. In order to find the maximum expected power load of the charging hub, the number of chargers was unlimited for the initial simulation run. However, in order to find a feasible configuration of the charging hub, the number of chargers should adapt to arrival intensity. For this purpose, the queue also needed limited capacity and maximal waiting times of vehicles. The EVs were waiting in the queue until a suitable charger was available. Vehicles would not enter the queue if its capacity was full or the average waiting time exceeded a tolerance value.
The service rate of the chargers was calculated based on the vehicles’ maximal battery charging power
, current charge
(which equals
and the charger’s output power
, and the randomly generated target charge
, as some batteries allow for charging to full capacity, while others’ recommended capacity is at 80%. As battery charging is not linear, the times were calculated separately depending on the initial
for each of the charging phases where the charging power adapted to randomly selected values from ranges in
Table 3. The values were loosely estimated based on [
29,
30], with most charging curves behaving in a similar manner.
where
is the charging efficiency at the given SoC and started form its initial value to the SoC ranges in
Table 3. The total charging time was calculated by summing all partial times. The charging power adapted to either to the maximal battery power or the charger output power.
Table 4 shows the pseudocode for the presented charging simulation.
3.4. Input Data and Parameters
The focus of this research was on the rapid DC charging simulation, omitting the slow charging requirements that were assumed to take place outside the motorway grid. Planning infrastructure requires anticipating the EV charging demands of future development, and the projected year provides a turning point on EV adoption for all newly sold vehicles. To demonstrate the charging DES, 2040 was the selected forecasted period, when a significant portion of EVs of all types can be expected.
The traffic data was retrieved from the traffic count records provided by the Slovenian Motorway Company [
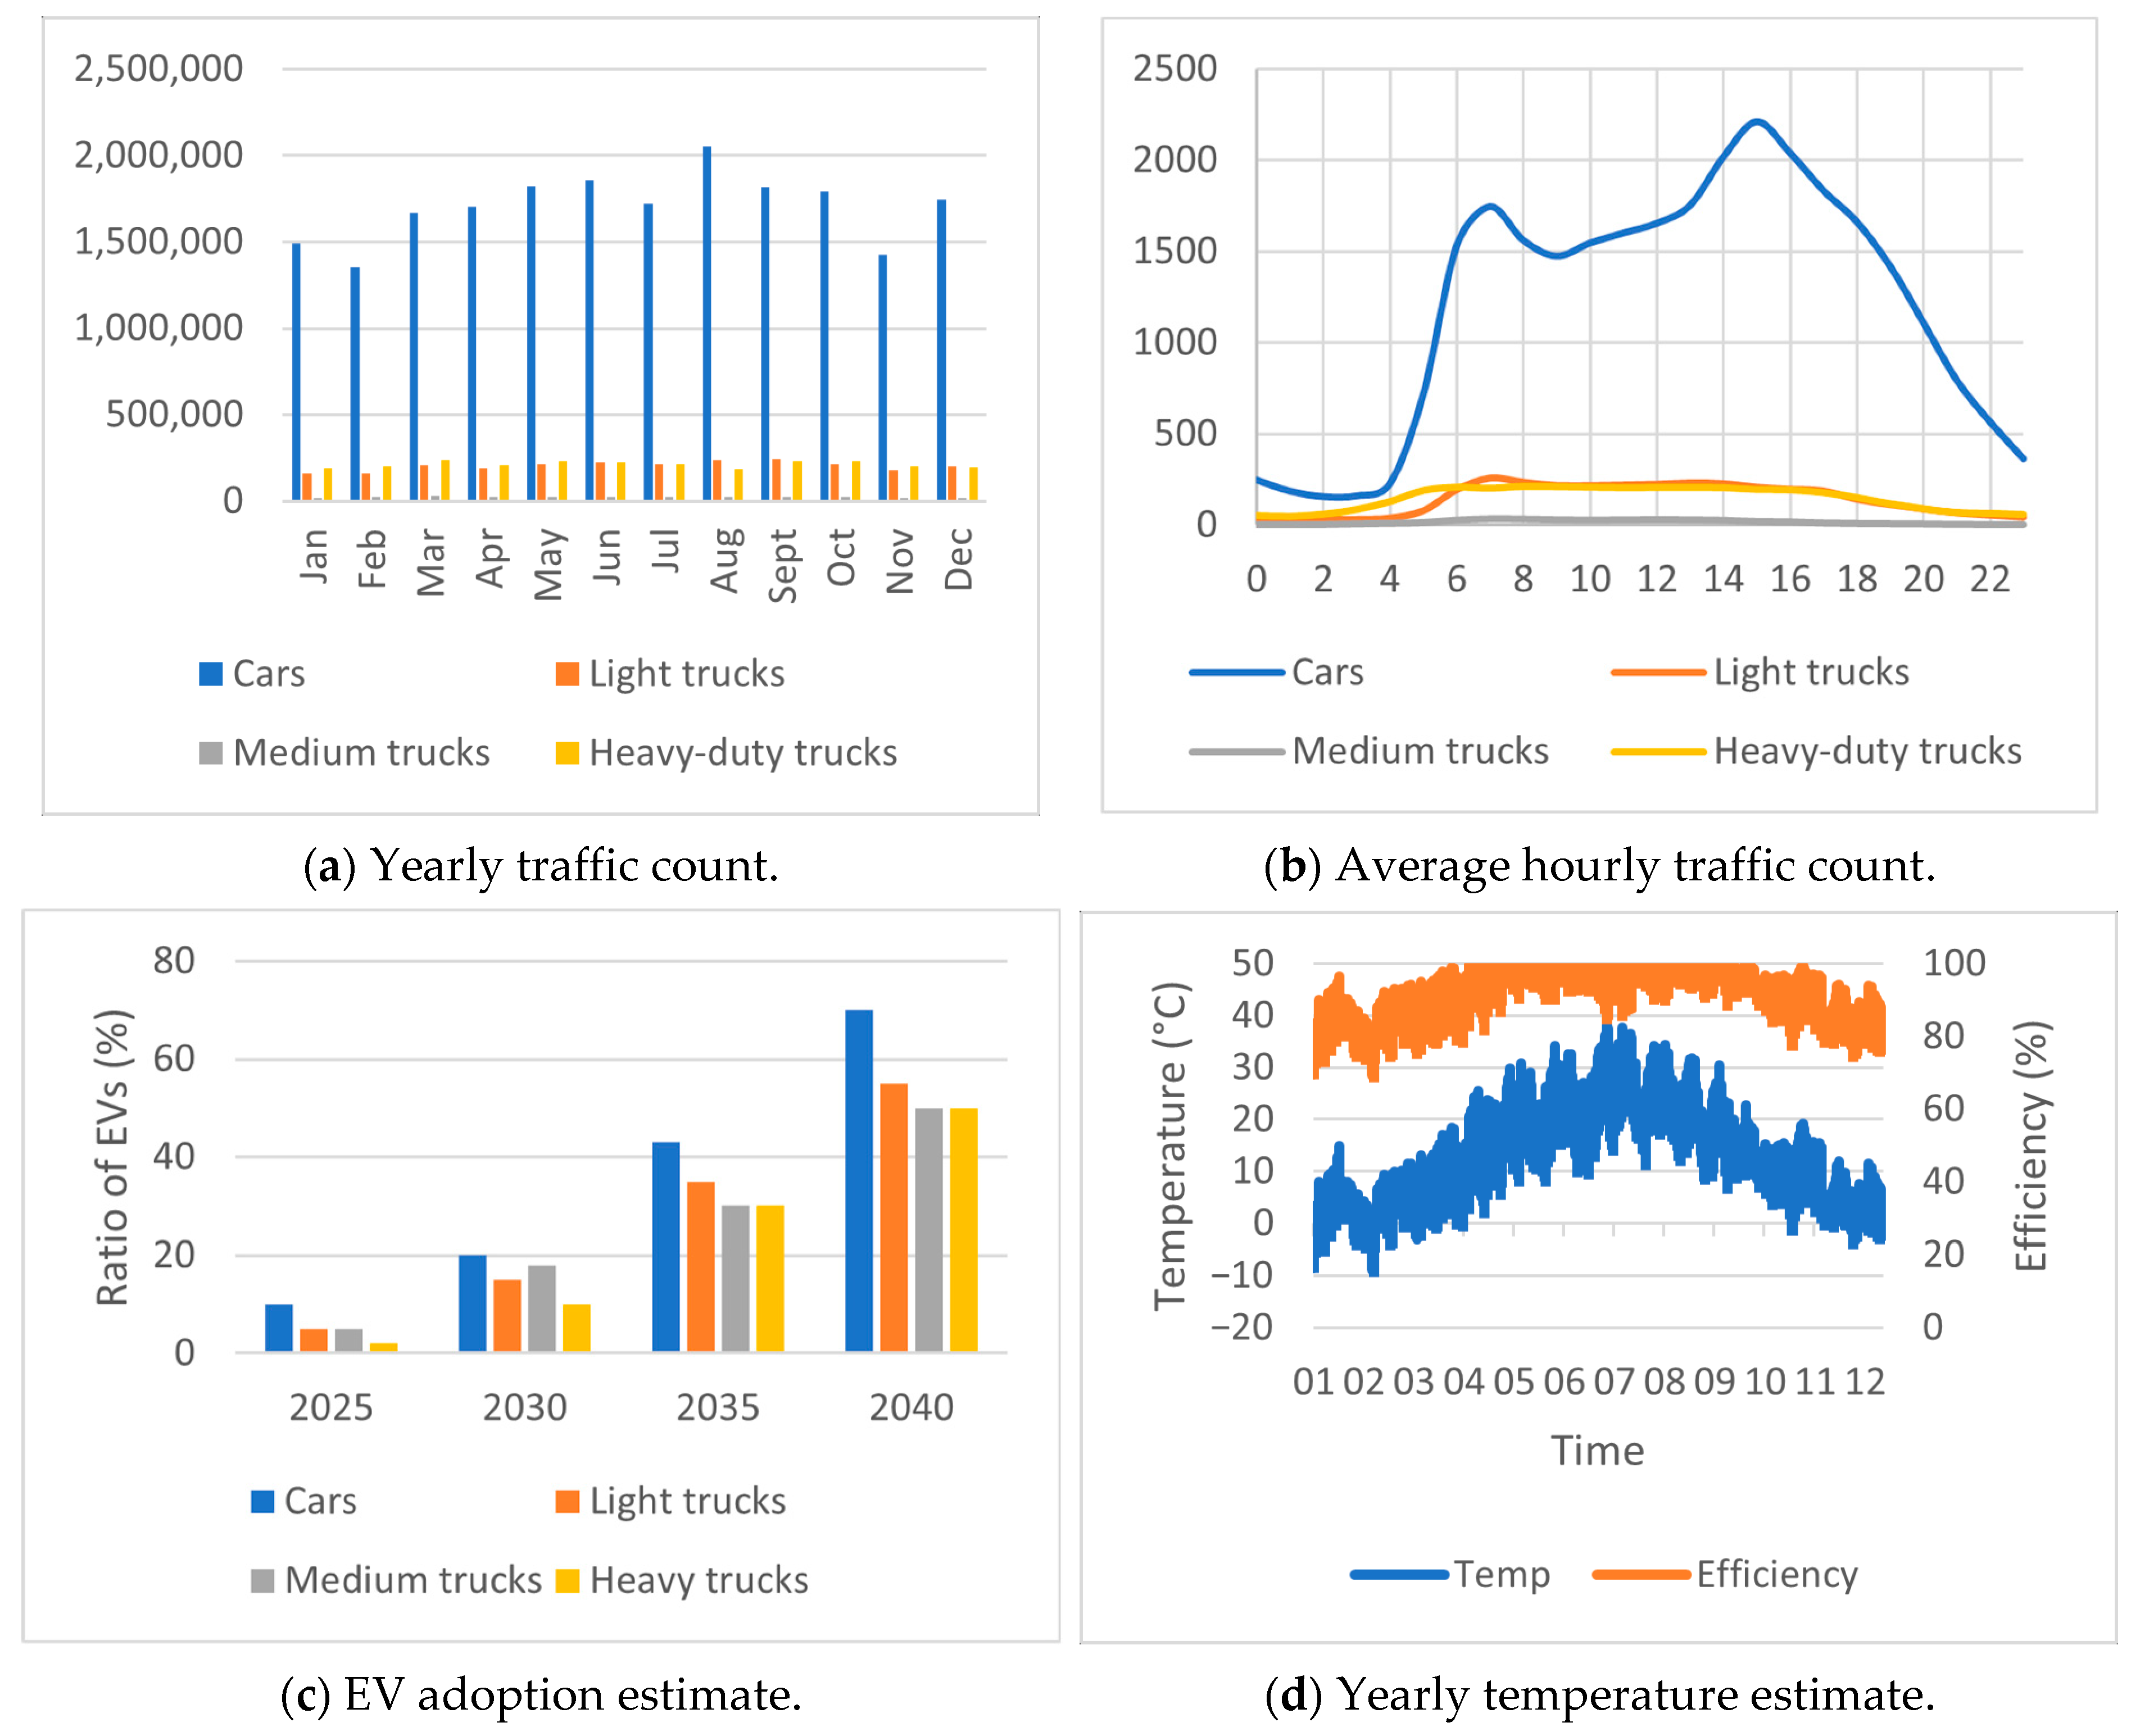
3]. These provided details about vehicle type and count passing at monitored motorway sections at an hourly rate. The forecast for future traffic flows, EV ratio and battery specifications were done using a rudimentary approximation of future traffic flows, battery and charging specifications, temperature, and EV ratio. The forecast was done based available traffic counter data from 2021–2022, excluding previous periods due to the influence of the pandemic. To provide a sample forecast for 2040, the trend in the last 4 years was estimated and projected onto the available data from 2022.
Figure 5 displays traffic flow changes throughout the year, where (a) shows a peak in the tourist season for passenger cars and a relatively low flow of tucks, while (b) provides a detailed flow of vehicles during a busy workday. The ratio of EVs (c) provides the expected number of EVs as candidates for charging from (a), while the projected battery efficiency (d) was assumed based on the hourly temperature forecast for 2040.
These inputs present reference values, which can be adapted to explore any scenario of traffic flow, EV adoption (adapted based on [
31]), climate, or technological development. As such, the simulation could observe the influence of any parameter on the power demand, charging times, and waiting queues. While we have performed multiple simulations, we have selected two sample scenarios with different charging hub configurations presented in
Table 5 in order to demonstrate the application of the method.
4. Results
The simulation results are provided by sampling the waiting queue, individual charger utilization, and output at a 1 min interval. The discrete-event simulation provided exact times of any event that included arrival at the queue, start of charging, and end of charging. As such, the number of events depended mostly on the number of available chargers, when arrival intensity neared the charging hub service rate. The 1 min sampling interval was short enough to cover most state changes and provide the main performance indicators. A shorter interval would not have provided any significant precision improvements but would have required more computation.
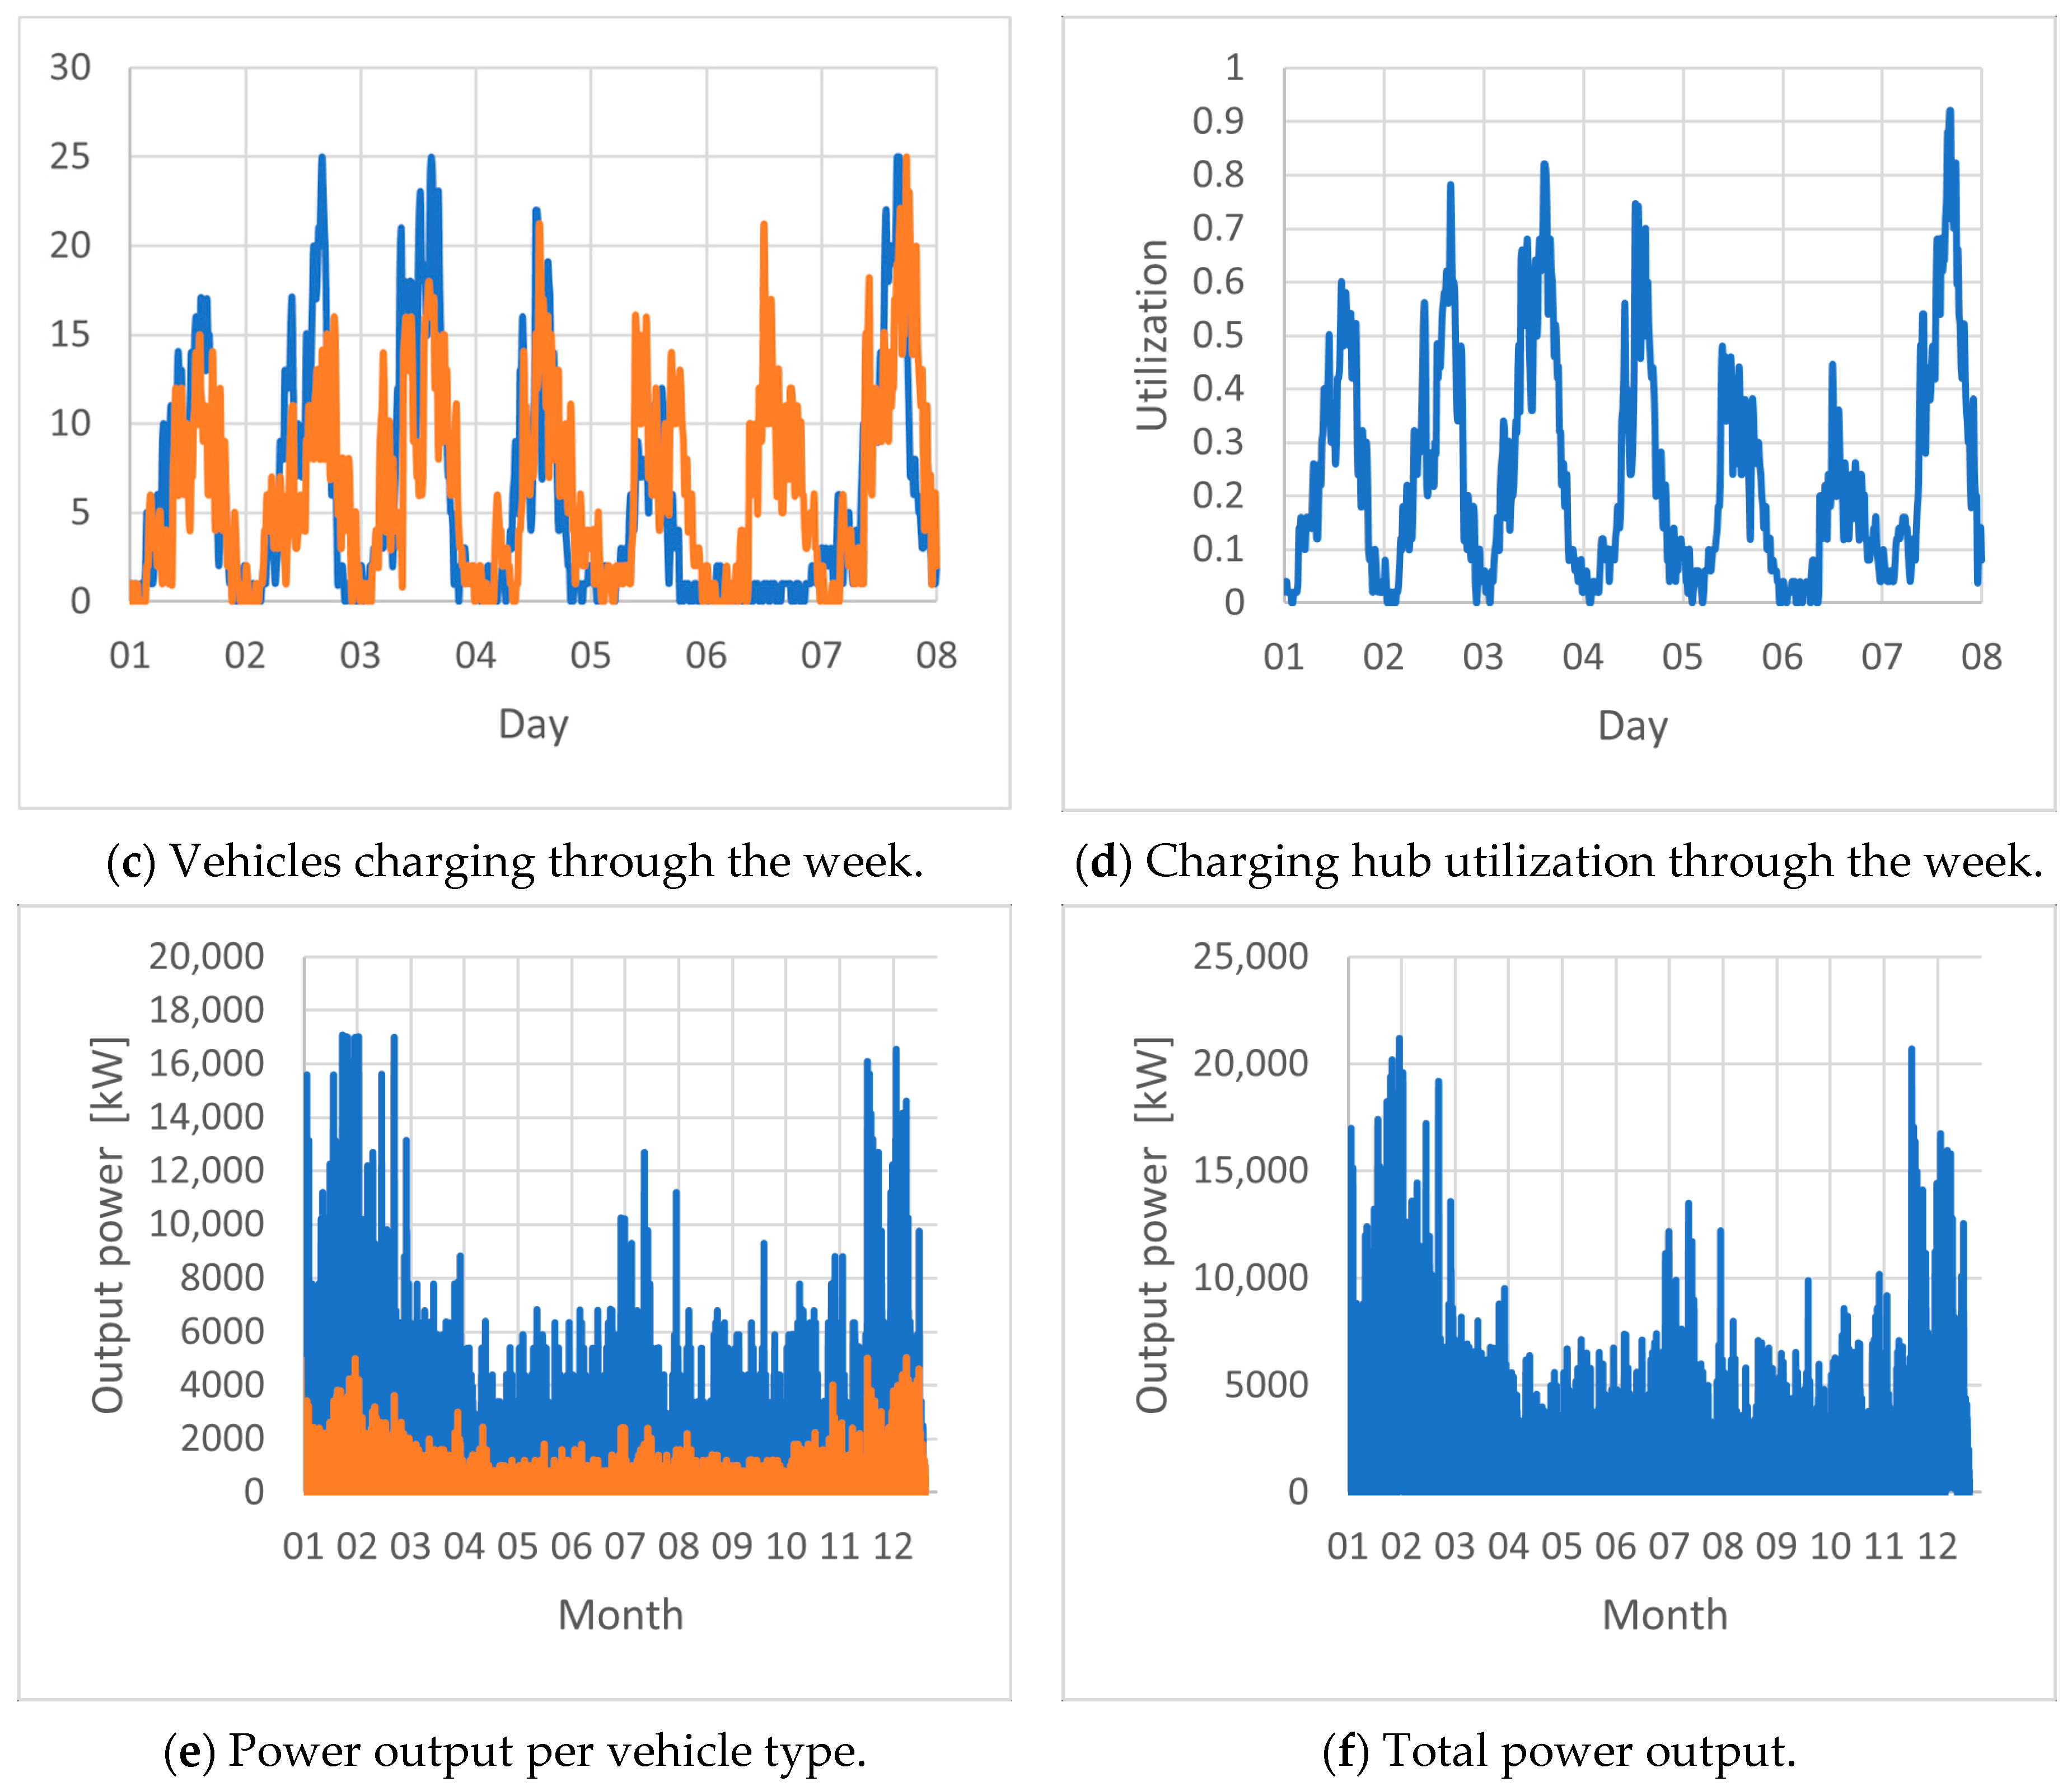
The simulation was performed for the duration of one year, to observe seasonal trends and overall infrastructure demands. Along with the year-round overview, the presented results also displayed more detailed charging operations during a busy winter week. The simulation results for a weekly overview of the charging hub utilization are displayed in
Figure 6. The presented scenarios displayed the behavior of the charging hub with a configuration of sufficient chargers to avoid any queues (S1) and a scenario that allowed vehicle build-ups during peak hours (S2).
The yearly overview revealed the influence of temperature on battery efficiency and charging, where the frequency of charging was drastically increased in the cold months compared to that during warm ones. The effect was even visible during summer months where a drastic increase in car traffic had a much lesser effect on charging demand than the reduced battery range during the winter period. In scenario S1, there were only occasional minimal queues and waiting times, so fully available service at practically any time was provided for the projected traffic volume. Occasionally, either cars or trucks filled the capacity of the hub, but at this configuration, they never fully occupied every charger simultaneously. Total power output exceeded 20 MW, where the majority was required for charging commercial vehicles. Substation planning should consider this as a reference value for the necessary output. Lesser output capabilities would reduce charger efficiency, lengthen the charging times, and induce waiting queues for charging services during the peak hours and season.
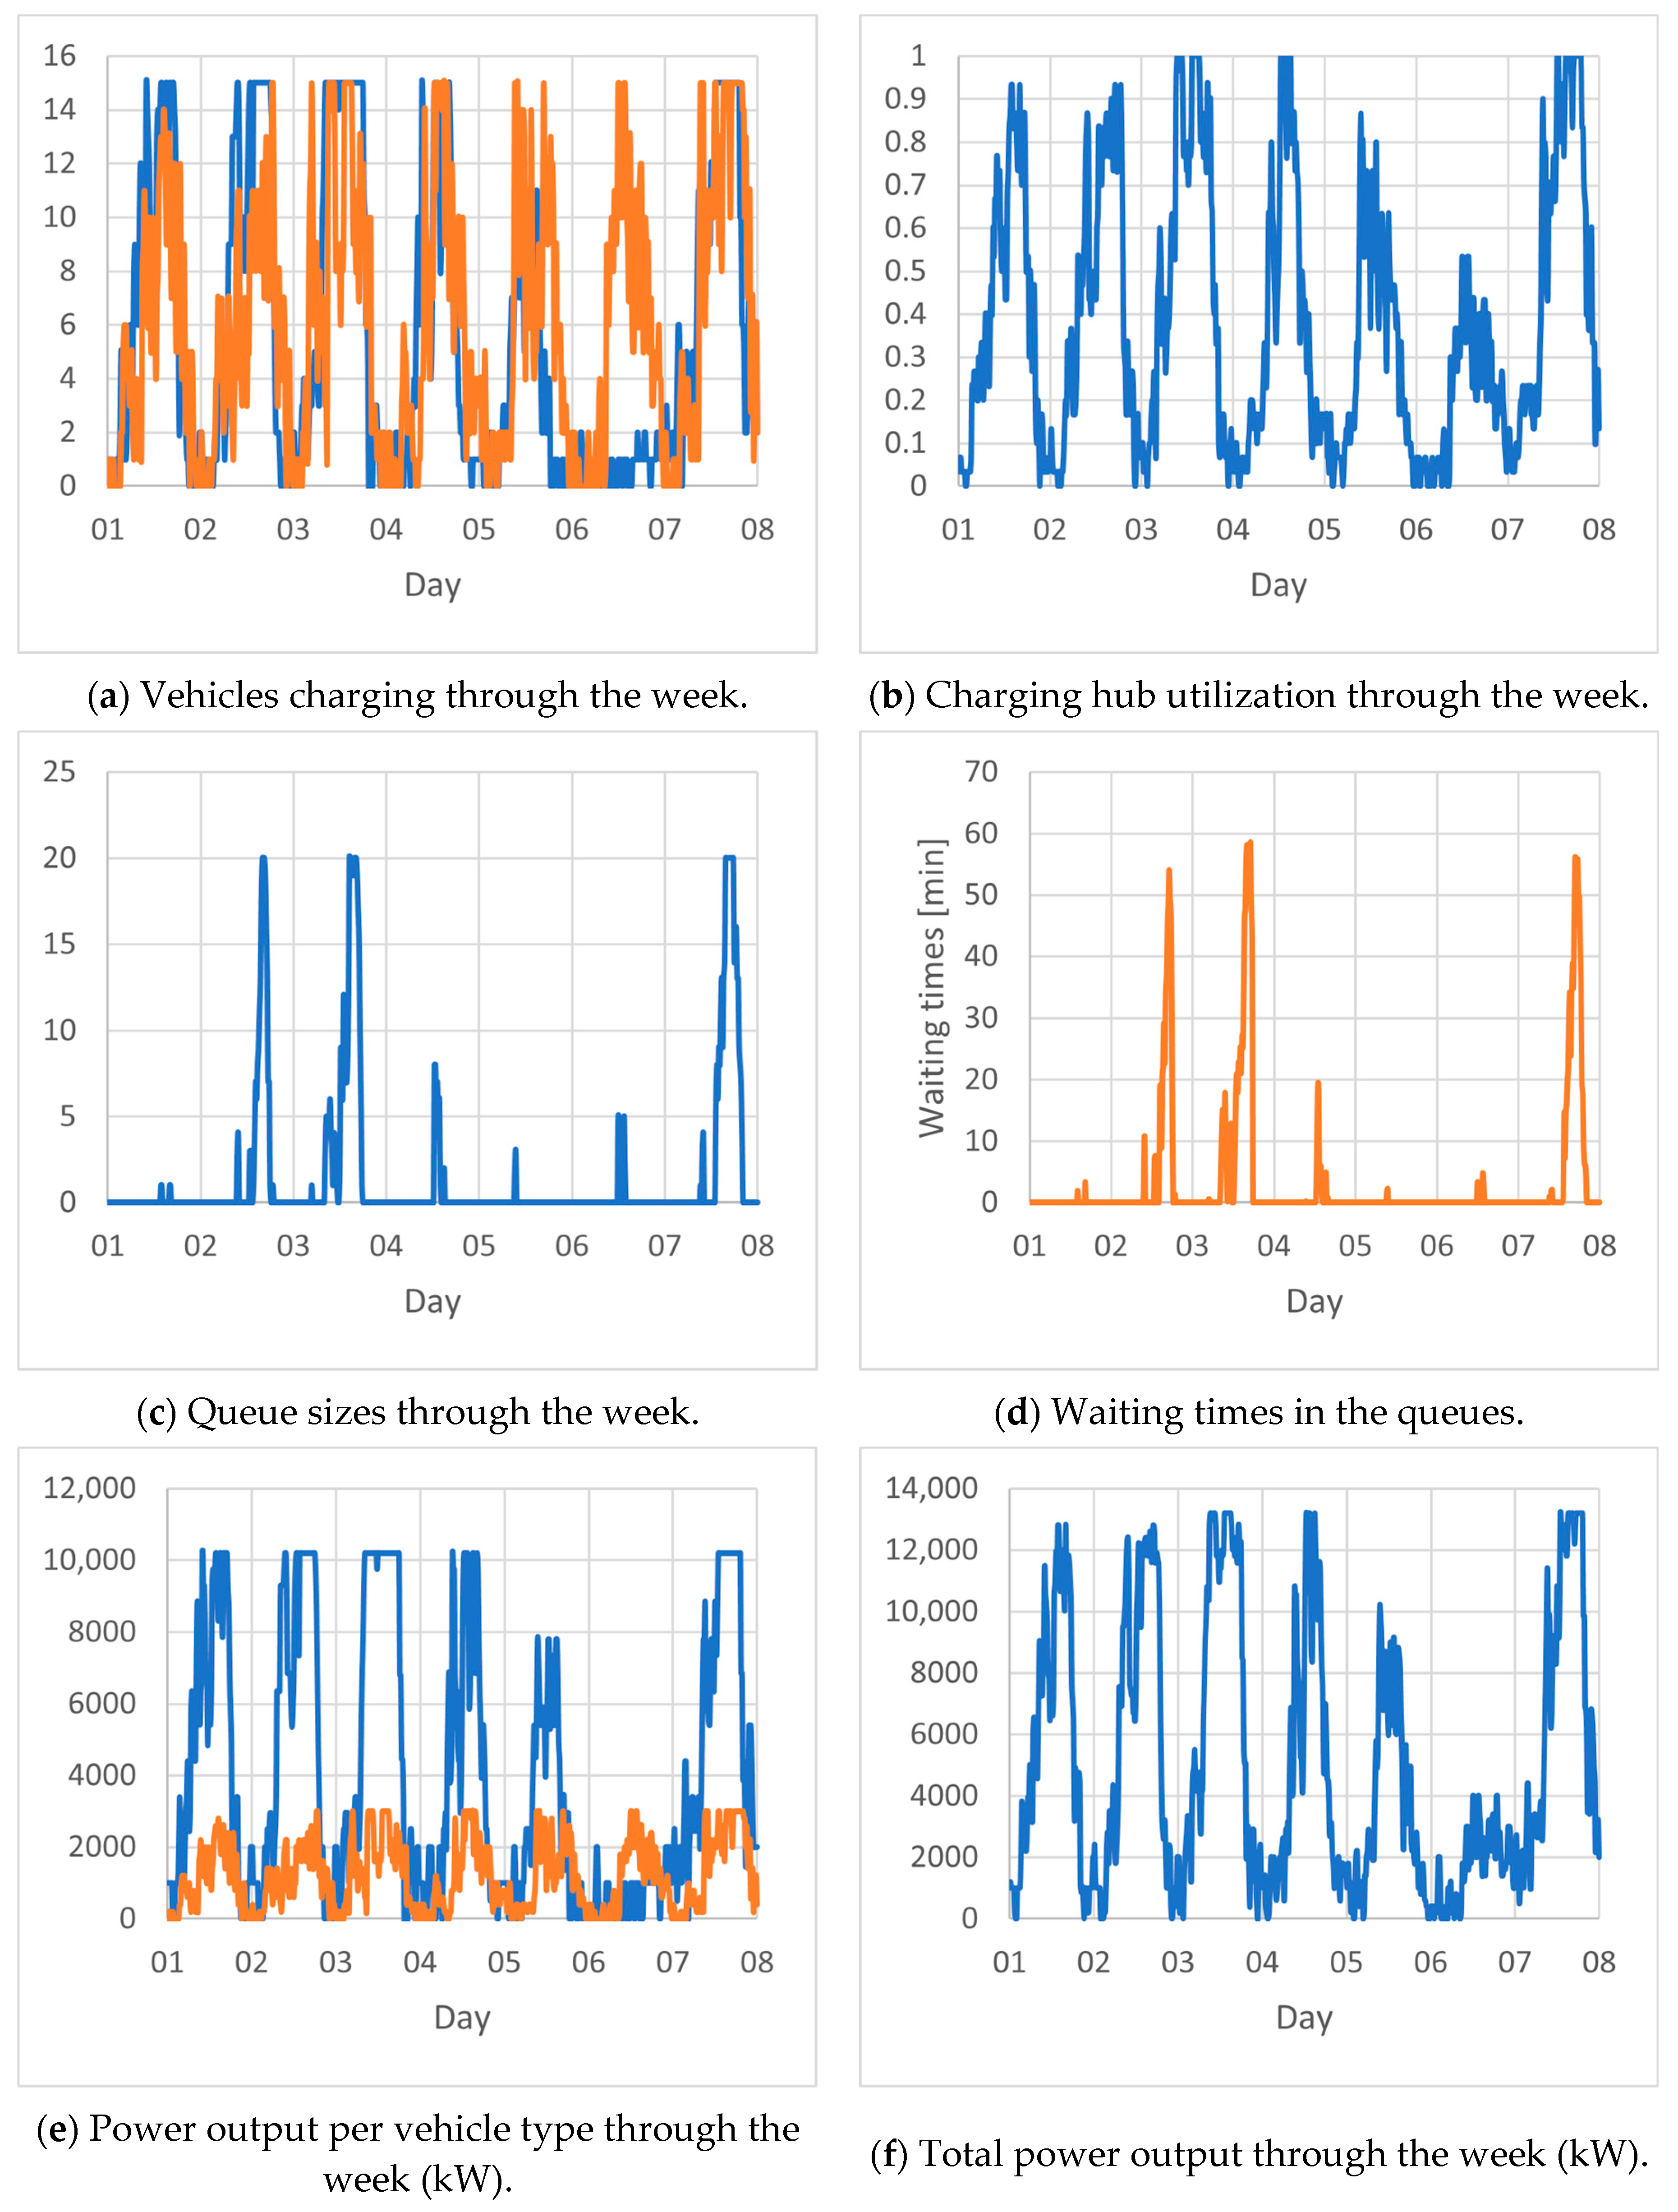
S1 presents a smoothly running scenario with negligible influence on traffic and waiting times; however, the utilization of the charging hub was relatively low in the off-season. Given that most of the time the hub was not fully utilized, the number of chargers could be reduced; however, these warrants exploring the effects that a lower number of chargers has on traffic. Scenario S2 (
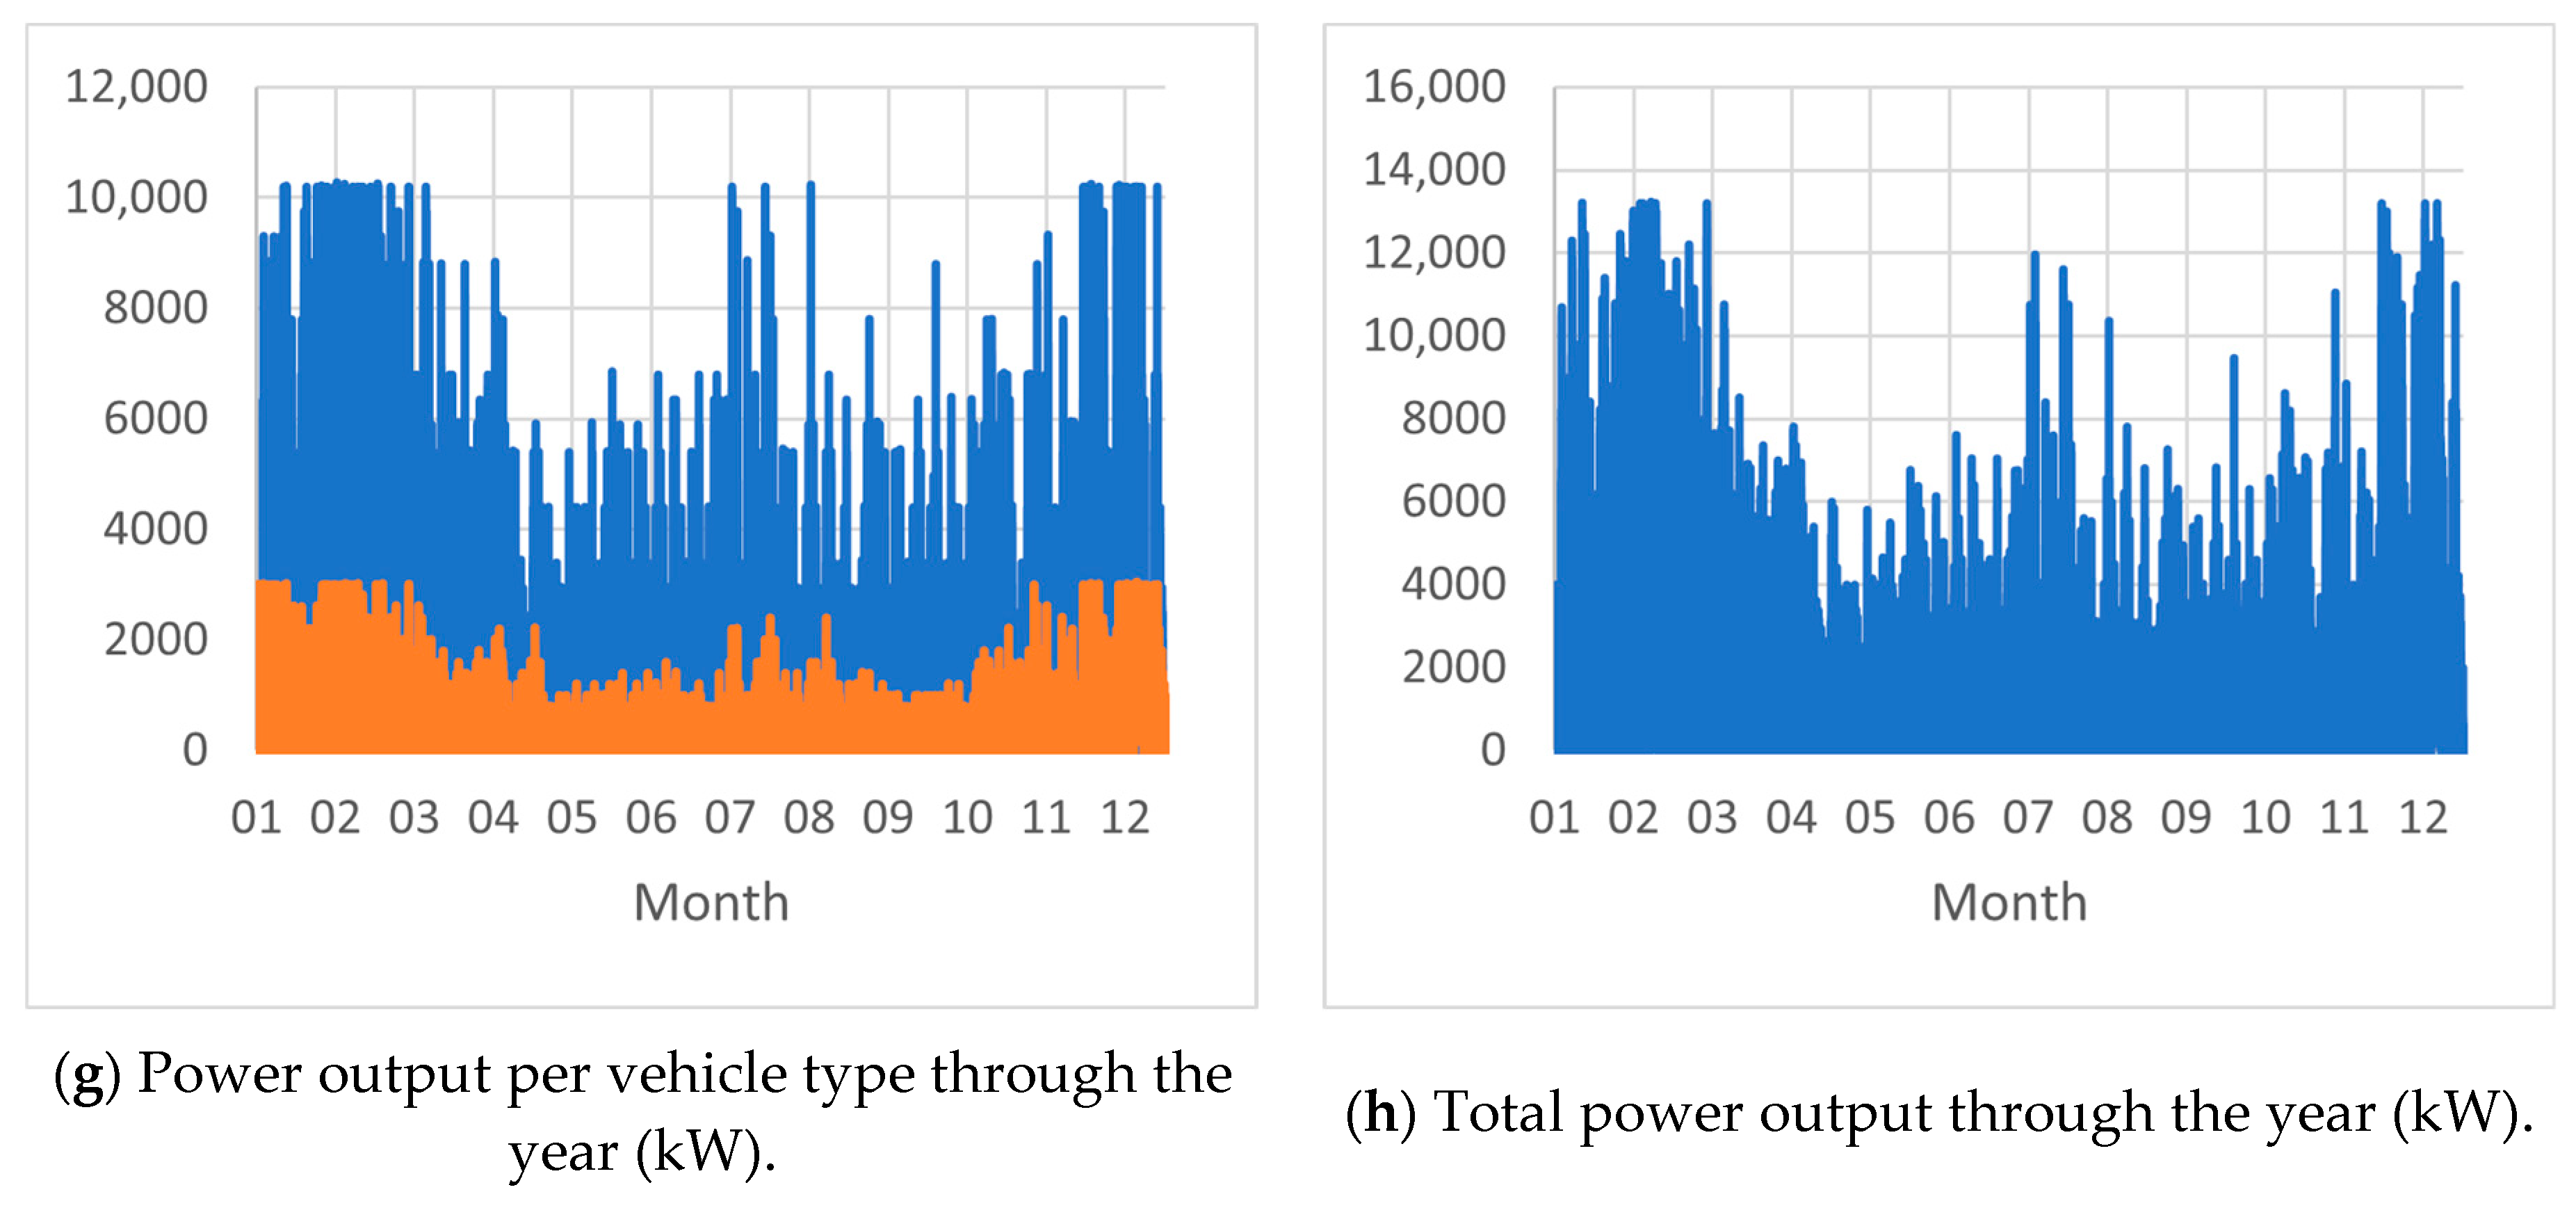
Figure 7) simulates the same traffic volume as that in S1, with only 30 available charging stations.
The reduced number of chargers in S2 naturally reduced the maximal output of the charging hub. Without the necessary capacities, waiting queues for the chargers appeared for as much as 20 vehicles, where trucks dominated. This value provides insight into designing the parking area from which the charging area is accessed. The maximum waiting times for this configuration got near 1 h, while the same traffic volume produced no queues in S1. While it may appear that this time should be higher because of queue size, the high number of chargers ensured a high frequency of releasing them for the next customers. The substation output requirements for this scenario were lower, and the overall utilization of the hub reached 100% on several occasions. While it is possible to reduce the infrastructure costs with a less powerful substation and fewer chargers with higher utilization, it is necessary to consider the effects on traffic delays as well as customer satisfaction. While providing additional charging stations does not require difficult modifications, upgrading a substation to higher output levels, however, might present a more substantial investment, which should be avoided by planning with a buffer of expected power demands.
5. Discussion
Providing proper electrical infrastructure is a necessity in order to ensure that EV traffic flow is fluent. While it may be expected that due to technological developments EV charging may eventually resemble classical fueling from the customers point of view, it is necessary to consider other stakeholders, which include traffic management, charging service providers, and transmission and distribution system operators. From the individual stakeholder view, they may have different objectives that are not necessarily aligned.
As charging generates revenue, charging providers should seek the maximal utilization of the individual fast chargers, which varies throughout the day (and night) as well as through different seasonal traffic intensities. The cost of installing chargers warrants suitable utilization through their life cycle. Too many underutilized chargers can reduce the return on the investment, implying that predicting future EV traffic requirements is essential for planning.
On the other hand, maximizing the utilization of chargers can reduce the throughput of the charging hub, creating queues and increasing waiting times, displeasing drivers as well as increasing chances of congestions. While installing transmission and distribution lines is mostly limited by geographical issues mentioned in the introduction, substation capacities need to be planned with reference to the expected power loads. As substation costs increase with higher outputs, the number of charging stations and simultaneous utilization provides that estimate for power requirements for fast charging, and it is additionally necessary to consider other requirements such as for other commercial facilities at the charging hub. Thoughtful planning is needed here to consider not only the requirements in the near future but anticipate the demands in the long term.
It is necessary to consider the implications that both location as well as configuration of the charging hub will have on traffic flows. If the charging and grid infrastructure will not adjust to the adoption of EVs, this may lead to increased traffic on secondary roads along the highway. On the other hand, dynamic pricing or time-slot reservations might influence the behavior of the traffic flow itself, leading to a potentially lesser traffic peaks, although this topic requires further research. Possible extensions of the hybrid model could incorporate motorway-specific pricing strategies, including time-of-use rates, dynamic pricing, and reservation-based fees. These policies can influence not only charging behavior but also traffic flows by redirecting demand to less congested routes or other time windows. The effectiveness of such strategies may vary across different user profiles: for instance, private drivers may respond more strongly to pricing incentives, while commercial vehicles are more sensitive to time constraints and may prioritize minimal downtime over cost savings. By segmenting vehicle types and adjusting charging decision logic accordingly, the model could simulate differentiated behavioral responses and support the design of pricing schemes that balance infrastructure use and operational efficiency across user groups.
Analyzing future charging demands for electrical grid and charging infrastructure planning that can be achieved by the presented method can be straightforwardly upgraded for analysis of charging hub grid operations, which can provide increased precision for predicting the operation of each individual charging hub and also the impact on traffic flows. Further, the method can be adapted to consider different pricing schemes and competition from different charging service providers.
The presented method can be used as a part of a digital twin that integrates real-time data from traffic monitors, data from other charging hubs, weather forecasts, and specific events that can influence the expected traffic or conditions. The presented hybrid model was designed flexibly so that any input can be replaced with different loads. As such, the traffic forecast could be replaced with publicly accessible traffic monitoring data, and temperature conditions—with data from weather forecast services. Estimations for battery parameters and EV charging outputs can be replaced by real specification once the charging hubs are constructed. Given that many of the parameters presented in this case are modelled based on either estimates from other studies or assumptions, replacing those inputs with those from existing services can provide both real-time and more precise short-term prediction of charging operations. This also provides both a calibration tool for the presented model as well as a validation option by comparing real-world operations to modelled results.
6. Conclusions
This study presents a hybrid model for evaluating motorway fast-charging infrastructure, combining traffic volume-based demand estimation with discrete-event simulation. The approach accounts for dynamic factors such as vehicle state-of-charge (SoC), battery efficiency influenced by temperature, and probabilistic charging behavior across diverse EV types. Applied to a realistic national motorway corridor scenario, the model demonstrates significant seasonal variation in energy demand and queueing behavior, particularly under winter conditions. It also revealed that the charger hub configuration—especially the mix of power levels and spatial spacing—had a direct impact on wait times and load distribution.
The model advances the existing literature by integrating behavioral decision logic with operational simulations in a transit setting, where infrastructure must serve directional, long-distance flows. Unlike urban-focused models, it explicitly captures constraints and patterns unique to highway environments, including limited detour flexibility and route-fixed demand. The simulation’s modular design allows key parameters to be easily updated or replaced with real-time inputs, offering potential for deployment in digital twin systems and interactive planning tools.
However, the study also has limitations. Charging behavior probabilities and efficiency adjustments were based on simplified assumptions and aggregate estimates rather than empirical trip-level data. Additionally, the model did not include spatial origin–destination (OD) matrices or grid-side constraints, which may affect the infrastructure layout and power availability.
Future work will focus on integrating the data of traffic generators and OD data to improve traffic flow accuracy and extend the model toward network-wide coordination of charging infrastructure. While the current model focused on the physical layout, traffic flow, and environmental conditions affecting motorway charging demand, behavioral and economic factors such as pricing strategies and user segmentation are areas for future investigation. The impact of dynamic pricing, time-slot reservations, and user-specific constraints could significantly influence charging patterns and the traffic distribution. As these mechanisms are increasingly adopted in real-world networks, incorporating them into simulation frameworks is essential for providing more realistic demand scenarios and supporting policy design.
Furthermore, integration with grid simulation models or co-simulation platforms would enable full-system evaluations that reflect both traffic and energy levels. These developments would support real-time decision making and robust infrastructure planning in line with evolving EV policy targets across the TEN-T network.


