Abstract
Crowd management at turnstiles in metro stations is a critical task for ensuring safety, efficiency, and comfort for passengers. A methodology based on observation and microsimulation provides an advanced understanding and optimization of crowd flow through these turnstiles. The aim is to optimize crowd management and prevent overcrowding and delays at metro turnstiles through innovative solutions. The methodology is based on simulating passenger movements through turnstiles to observe and optimize crowd behavior. The results show that passenger decisions (e.g., choosing which turnstile to use, adjusting pace) are based on perceived crowd density, level of service, and usage of space. For instance, the number of turnstiles, their location, and the layout are important variables to be considered in the decision-making sequence. These decisions can be influenced by parameters like turnstile availability, walking paths, and real-time data (e.g., density of passengers). The methodology can help metro operators decide where to place additional turnstiles or adjust operational schedules. By simulating crowd behavior, operators can make informed decisions to reduce congestion and improve the efficiency of turnstile usage. This methodology could be implemented in various metro systems to optimize operations during different crowd conditions and peak times, ensuring smooth, safe, and efficient passenger flow.
1. Introduction
In rapidly growing cities like Valparaiso (Chile), metro stations are experiencing significant crowding, leading to increased congestion in areas such as turnstiles [1]. Similarly, in other developed cities like London (UK), the railway system sees over 3 billion interactions annually, largely due to high congestion during the boarding and alighting process [2]. The dense interaction of passengers during these stages affects both the efficiency and safety of the entire system. For example, as the number of passengers rises, the time required at turnstiles increases, which in turn impacts the station’s service level (LOS), particularly its capacity [3].
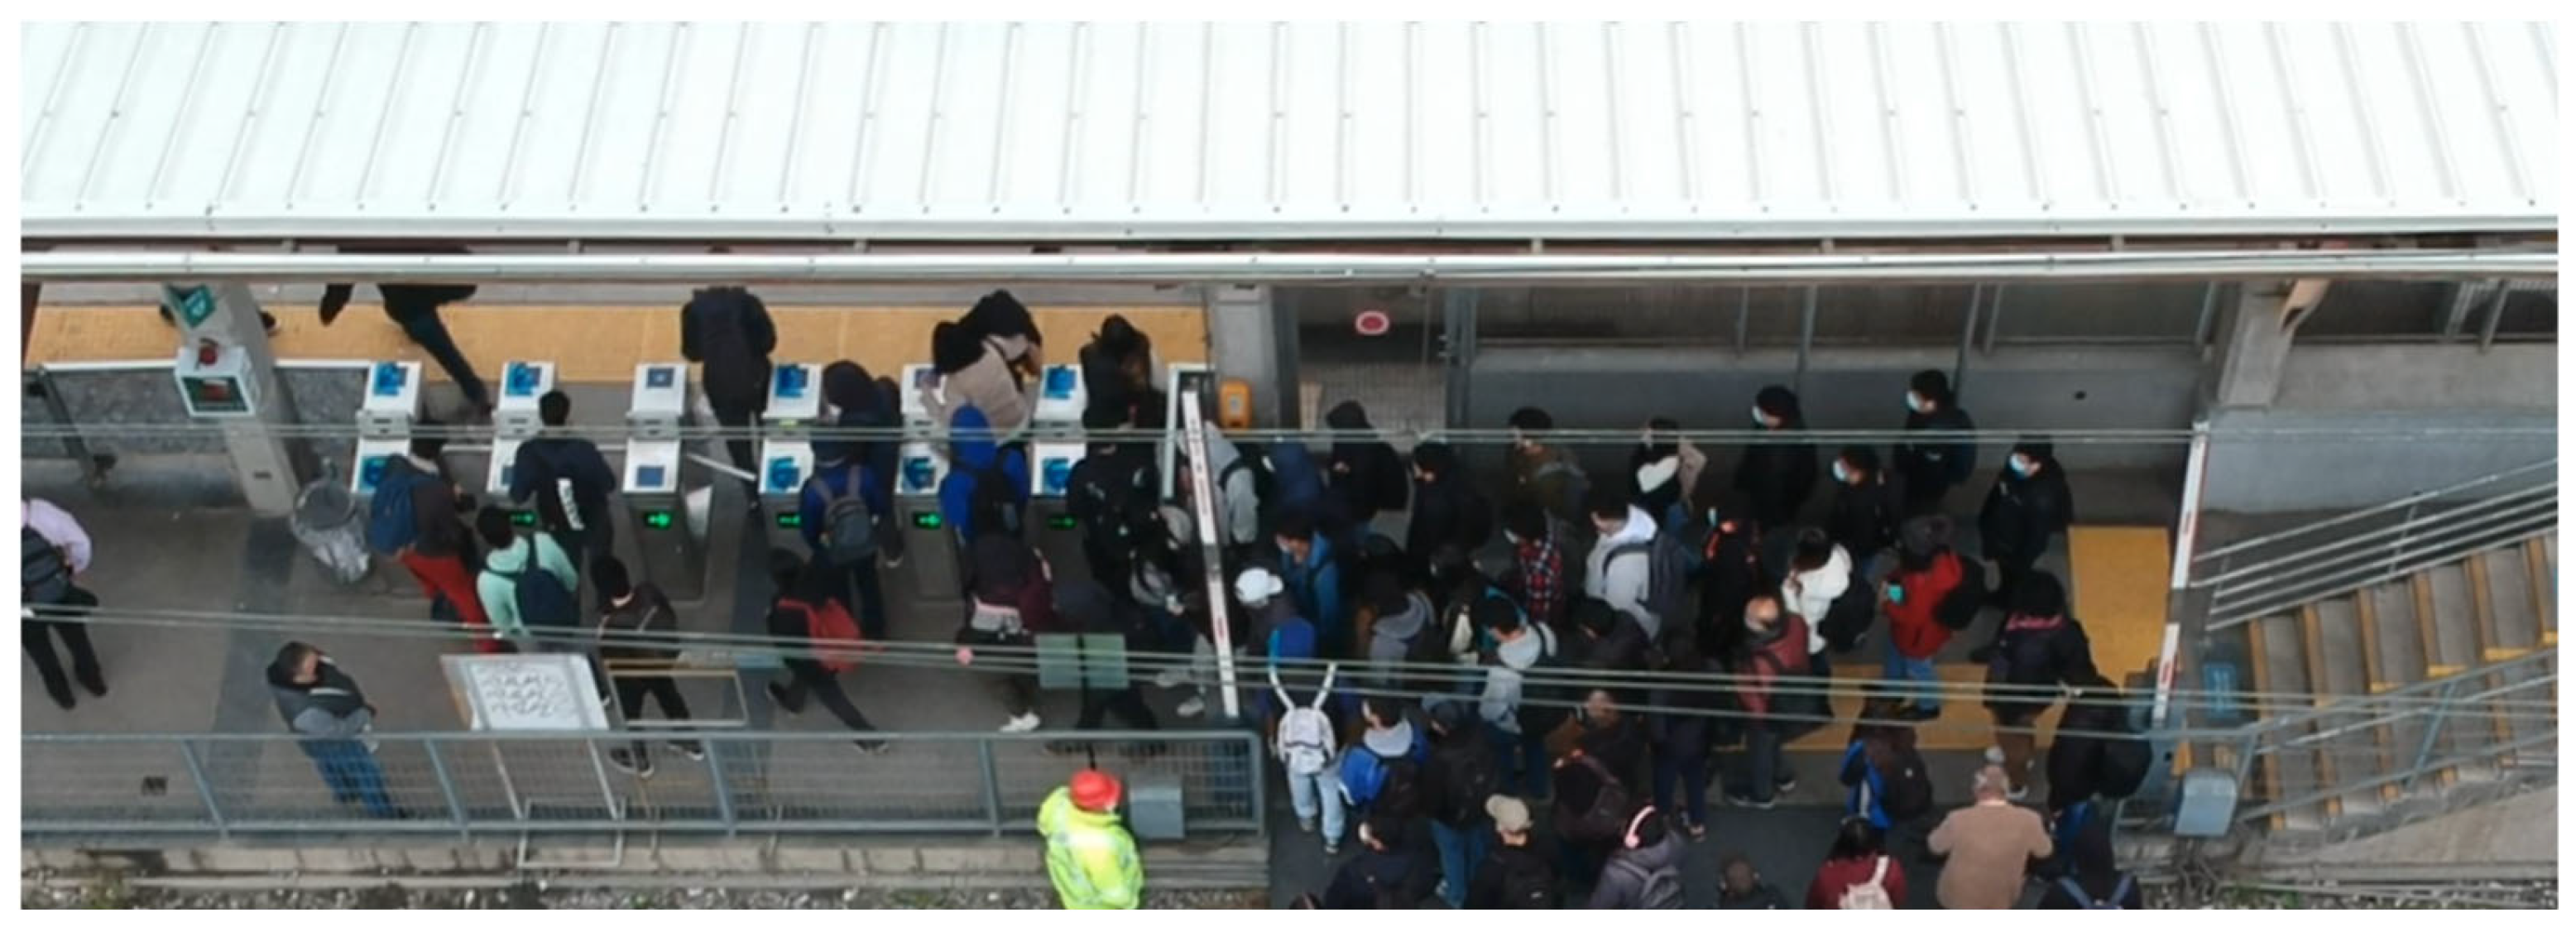
A particular space in metro stations is the turnstiles [4,5]. In this context, the interaction between passengers is influenced by several key factors, including the formation of flow lanes, the distance between individuals, and their distribution throughout the station, among other variables. These elements significantly impact the LOS, as well as the efficiency of the system. The arrangement and density of passengers within this space play a crucial role in determining the smoothness of passenger movement, as well as the time required for passengers to enter and exit the station. For instance, narrower flow lanes or crowded areas may cause bottlenecks, delaying the movement of passengers and increasing the overall time spent in the station. Similarly, an uneven distribution of passengers can lead to congestion in certain areas while leaving other sections underutilized, further complicating the boarding and alighting process. These dynamics are essential in evaluating the operational efficiency of the station and ensuring passenger safety and comfort, particularly during peak hours. Figure 1 illustrates these factors and their influence on the passenger flow and the overcrowded situation which affected all the stations.
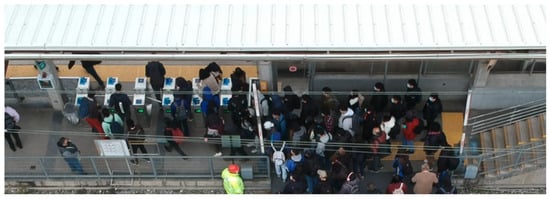
Figure 1.
Crowding level at turnstiles in Francia station (Valparaiso Metro).
The lack of crowd management measures at stations like Francia causes inconveniences, and the formation of queues, and negatively impacts the evacuation time from the platforms, compromising service levels and the user experience. Passengers who need to exit the station must walk along the platform and then cross through an area shared by pedestrians and trains. This area is controlled by an automated barrier system that restricts access when a train is approaching from either direction. As a result, passengers trying to exit the station must wait for the train to pass in either direction or then wait for the barriers to lift before crossing safely (see Figure 2). These barriers, which control the crossing over the railway tracks, create a bottleneck in the flow of passengers, hindering a gradual evacuation process and causing a buildup of passengers along the platform. Once the sensors no longer detect the approach of a train, the barriers lift, releasing the accumulation of passengers in front of the barrier. This release causes a surge of pedestrians, leading to congestion in the crossing area over the tracks and in the area before the turnstiles.

Figure 2.
Crowding level at the platform in Francia station (Valparaiso Metro).
To solve the problems mentioned above, this study aims to apply a methodology for proposing innovative crowd management solutions at metro station turnstiles, with the goal of improving the Level of Service (LOS) through observation and simulation of the current scenario and proposed solutions. To achieve this, the study first characterizes the passenger flow from the platforms by collecting data through structured direct observation, based on criteria such as time of day and passenger flow, complemented by turnstile validation data. Second, the existing problems in the current scenarios are identified to better understand the issues through field observation and analysis. Third, solutions implemented in similar scenarios are modeled to assess their applicability through microsimulation. Finally, potential innovative solutions for passenger management are evaluated based on the LOS.
2. Literature Review
To study passenger interactions, the Level of Service (LOS) is often used, based on variables such as flow, density, and speed of passengers [6]. LOS, which can be analyzed in areas like walkways, stairs, and queues, serves as an indicator of congestion at turnstiles. While this indicator is widely used, variations in LOS can occur due to factors such as passenger type, culture, and other elements [7,8]. Therefore, it is crucial to examine flow, density, and speed from the perspective of the passengers and their experiences, as this provides a more accurate representation of passenger interactions than average or overall LOS values [9,10].
To address this issue, detection techniques have been developed to track individual passengers and analyze their movement at metro stations [11,12,13]. These techniques enable the identification of LOS by measuring variables like flow, density, and speed from the passengers’ perspectives, which is the focus of this study on overground metro stations. To achieve this, it is necessary to identify the variables that influence LOS and then apply detection methods through video cameras to count passengers.
To determine the LOS, it is necessary to calculate the station’s capacity, which is related to factors such as the width of the platform, the number of passengers to evacuate, evacuation time, and passenger flow. With this information, circulation spaces in transport infrastructures, such as train or metro stations, can be properly dimensioned. However, it is also important to consider additional factors, including the flow of passengers gathering after disembarking from the train, the layout or geometry of the space, and the train’s stopping position, among others [14].
To address the above, different types of simulation models can be used, which allow for a collection of autonomous individuals that can interact with each other, enabling the visualization of complex behavior patterns and providing valuable insights into the real-world dynamics they simulate [15]. As an example, the use of infrastructure may improve the flow of passengers of passengers exiting a door. In the simulation without a column, 44 people escape and 5 are injured after 45 s. In the case with the column, 72 people escape and none are injured after the same 45 s. Contrary to what common sense might suggest, placing a slightly off-center column in front of the exit allows for a smoother evacuation, potentially saving more people at the same time and with the same escape width [16]. Other types of solutions suggest the use of segregation barriers to control pedestrian flow [17] and counterflows [18], as well as improving the design of intersections [19] and train stopping areas on the platform [20]. Other case studies demonstrate the application of reducing train speeds to ensure the clearance of platforms before the arrival of the next service at the station or even stopping trains or diverting their stops to another station. For example, increasing capacity through changes in corners, by reducing angles to 90°. In the work conducted for the passenger evacuation at the Copacabana metro during New Year’s Eve, an increase in the capacity of a bridge was observed after smoothing the curves before a staircase. Pedestrians tend to move closer to the inner area of the 90° curve, reducing the walking distance, a phenomenon known as the “curve-hugging effect” [18].
The LOS is a valuable tool for identifying congestion issues in walkways, waiting areas, and stairs [6]. However, the challenge with LOS is that it is based on a macroscopic or global view, where pedestrian flow is treated as “fluid dynamics”, meaning pedestrians are analyzed solely by physical variables (speed, density, and flow) that have been previously discussed. Additionally, some authors [21] argue that pedestrians are not like fluids and should be analyzed by considering each individual’s characteristics and preferences, as pedestrians can overtake one another, become stuck in bottlenecks, or move in different directions.
When it comes to density in metro stations, using general density values (such as the total number of passengers in a physical space like a platform) does not seem to be the ideal way to measure passenger interactions. According to Banerjee et al. [22], it is necessary to identify where and how passengers move within these spaces to better understand their interactions. Moreover, an interaction index could be used to represent the LOS in metro stations, broken down by specific locations such as exits, stairways, corridors, and open areas [23]. Recent studies [24] have shown that the interior layout of the train (e.g., handrails or seats) can affect the number of touches and the density inside the train (e.g., crowding), which in turn impacts the LOS. Similarly, the seating arrangement inside the train carriage may affect the LOS and, consequently, the train’s capacity [25].
In the case of turnstiles, [26] reported that the LOS is influenced by the number of passengers standing, the number and direction of the passenger flow, and the turnstile direction restrictions. For [27], when passengers use luggage, turnstiles could be considered obstacles. There are different positions to locate turnstiles. For instance, turnstiles can be located perpendicular or parallel to the movement of passengers. It is also possible to identify the characteristics of the passenger flow and its relationship with the width of the turnstiles [28].
Despite the relevant research in the literature, there is a lack of studies focusing on turnstiles in metro stations for developing cities, such as Valparaíso, where the LOS should be analyzed based on innovative crowd management solutions.
3. Methodology
The methodology is composed of 4 stages as described in the following.
3.1. Variables and Characterization
In the first stage, the variables are identified. To this end, the passenger flow from the platforms is characterized by gathering data through structured direct observation, considering factors such as time of day and passenger flow, and is supplemented by turnstile validation data.
The public passenger transport service called Limache-Puerto, operated by EFE, is a commuter train that spans 43 km of double-track electrified railway through catenary, with 20 stations, and a new station currently under construction. The network includes an intermodal terminal station, connections to trolleybuses, and bus terminals between its stations. It serves as a public transportation alternative for the residents of the Valparaíso region, specifically for the communes of Valparaíso, Viña del Mar, Quilpué, Villa Alemana, Limache, Quillota, and La Calera, which according to the most recent national census, have a total of 1,142,472 inhabitants.
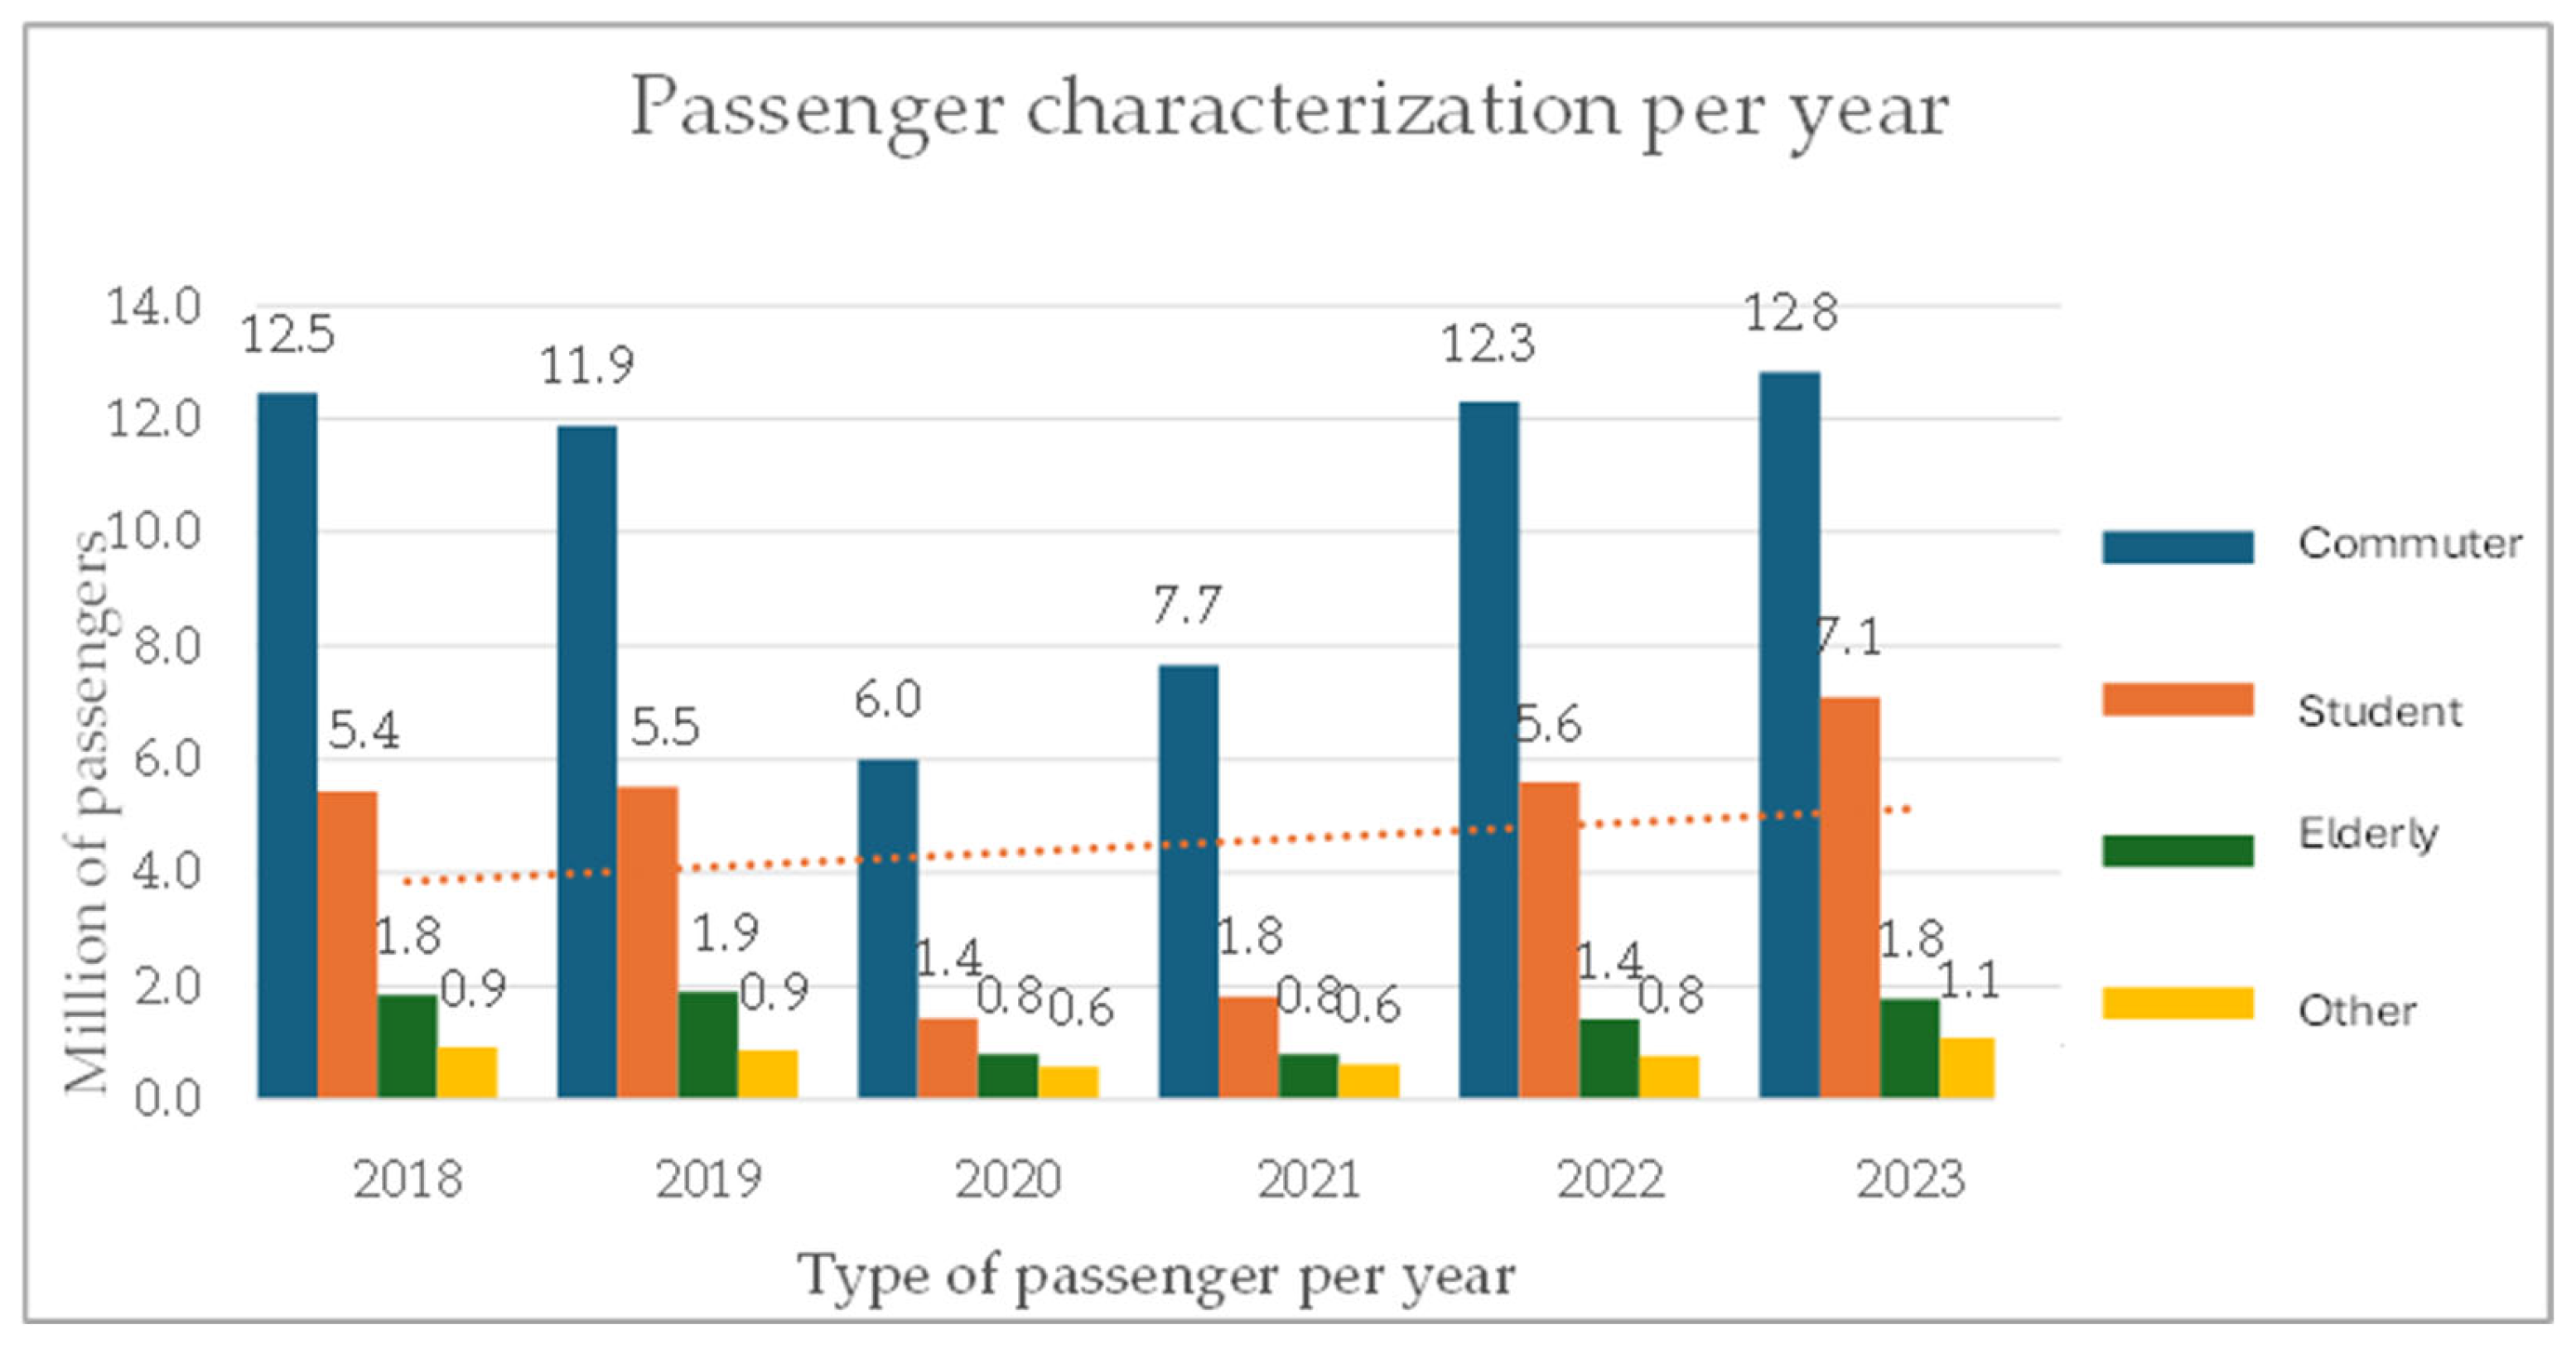
The service is currently facing a sharp increase in passenger demand. In April 2023, the highest number of passengers transported on a weekday was recorded, reaching 93,762 trips [1]. This sudden surge in demand brings about a series of risks and issues, including a lack of pedestrian management inside the stations, where situations with potential accident risks, discomfort for users, and dissatisfaction with the service occur (see Figure 3).
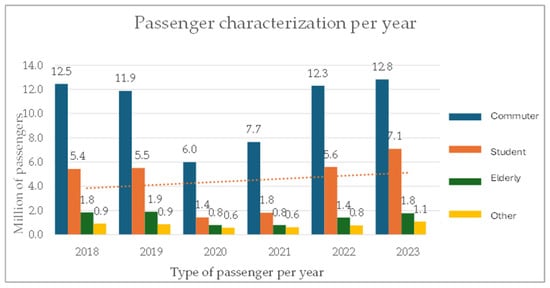
Figure 3.
Passenger characterization per year in Valparaiso Metro.
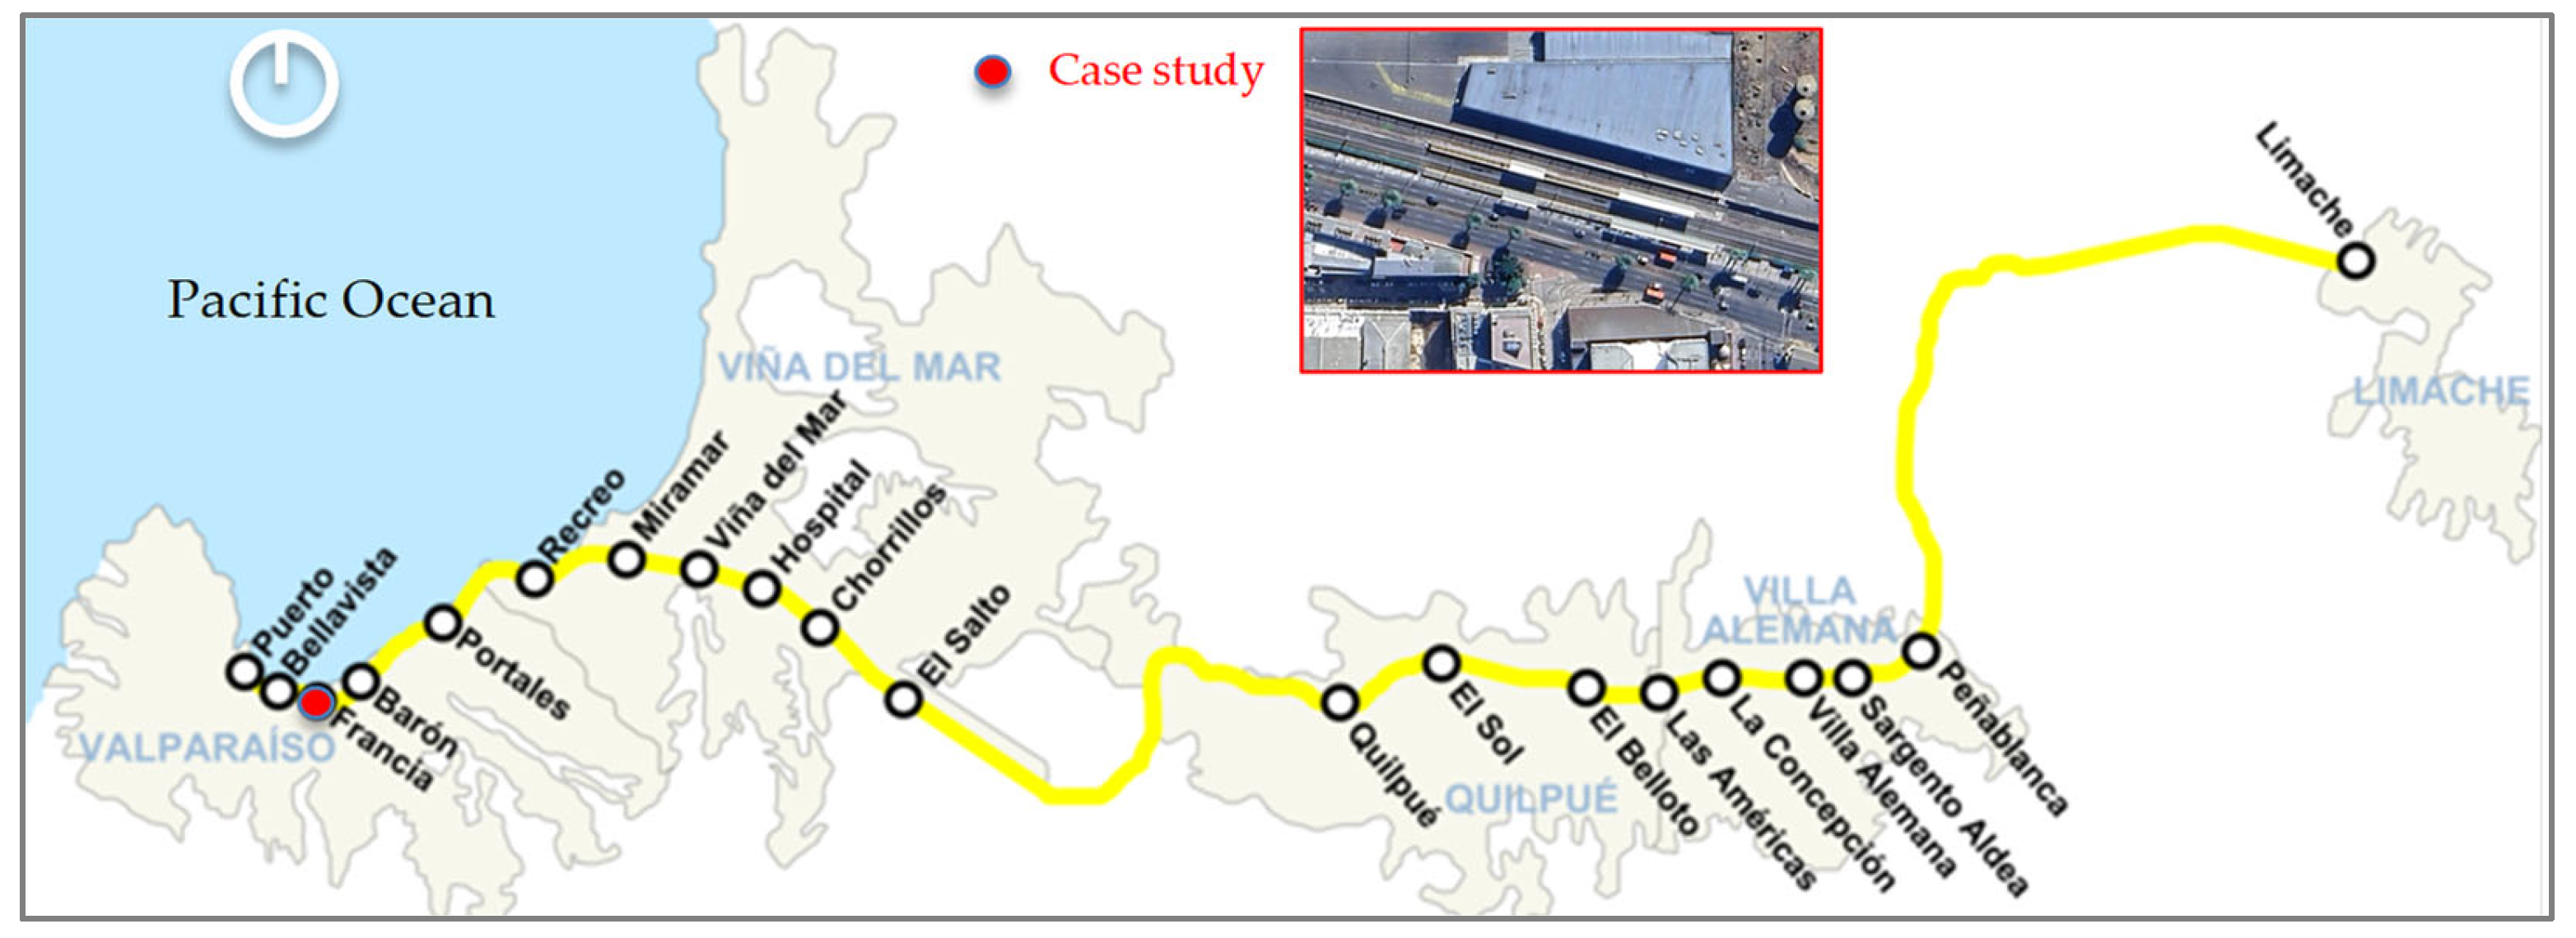
This study will specifically focus on the Francia station (see Figure 4), analyzing pedestrian scenarios at the platform turnstiles. The scenarios to simulate will include the common activity of passengers unloading from the train and the passengers validating their trip at the station’s entry and exit turnstiles. Additionally, an emergency evacuation scenario will also be considered. It is of vital importance to be properly prepared because this concerns human lives in a potentially risky situation, which could be critical for passengers. Therefore, rigorous preparation is necessary, and international standards such as NFPA 130 should be considered. This includes considering recommended international platform evacuation times, which ensure sufficient capacity for passengers to evacuate the platform in 4 min or less, and station evacuation times, which should be less than 6 min [29].
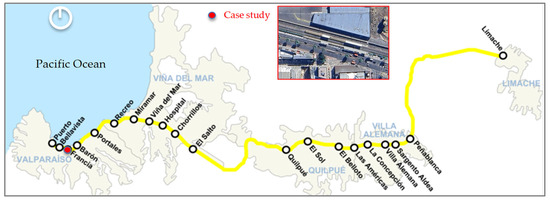
Figure 4.
Network in Valparaiso Metro and case study (Francia station).
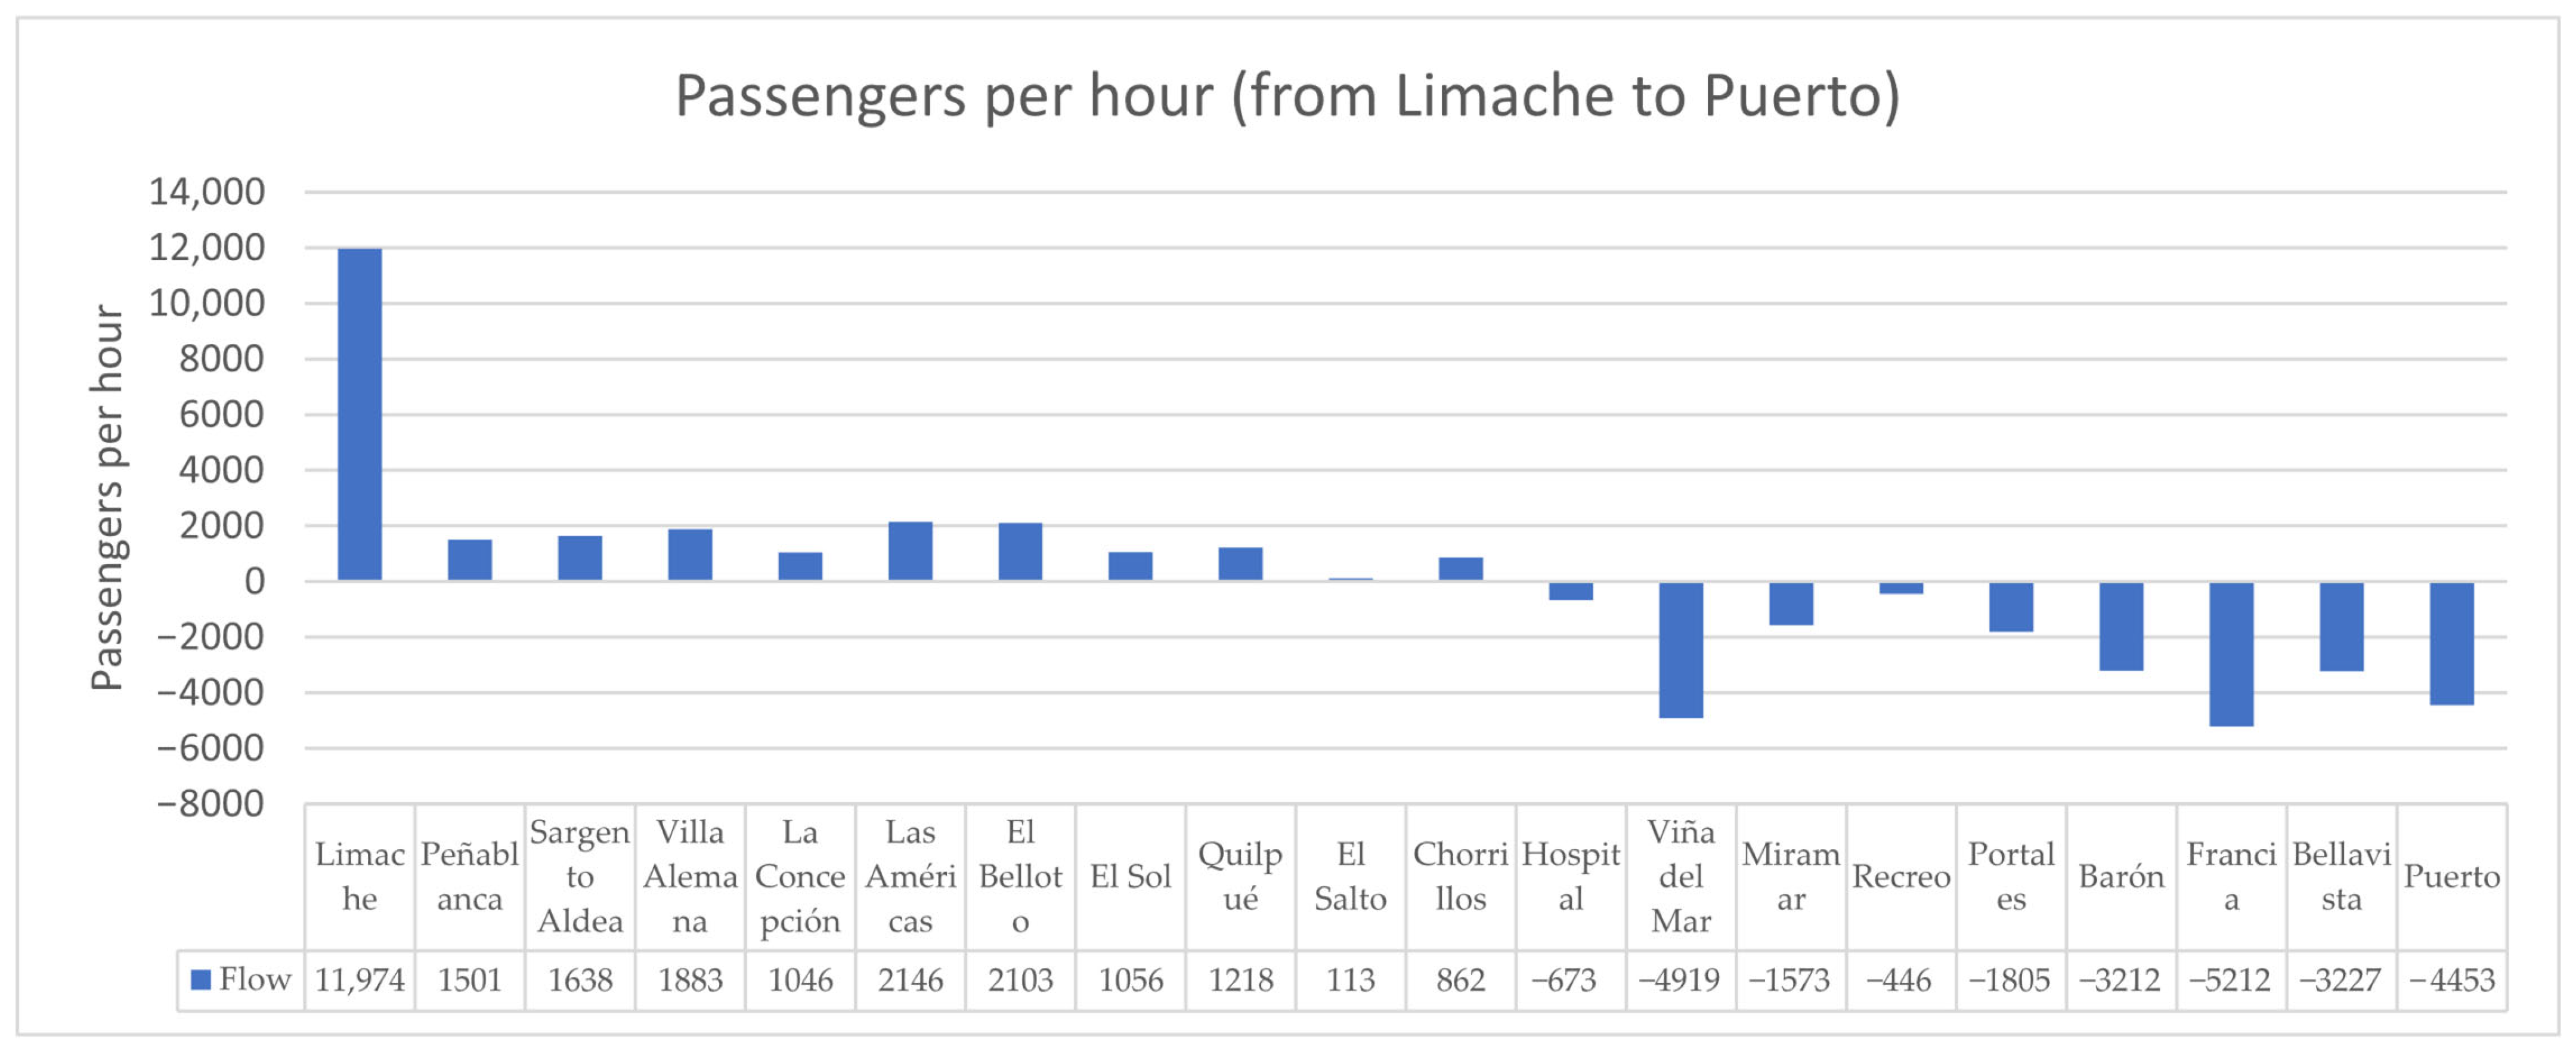
The representative time was determined by analyzing passenger behavior during the Morning Peak Hour (MPH, from 7:00 a.m. to 9:00 a.m.) and the Afternoon Peak Hour (APH, from 5:00 p.m. to 7:30 p.m.). The most congested station is Francia, where over 5000 passengers disembark during the MPH (see Figure 5) from the train service traveling from Limache station (11,974 passengers board) to Puerto station (4453 passengers alight).
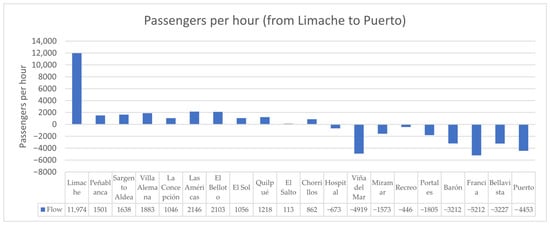
Figure 5.
Level of demand during the most congested hour of the day at each station in Valparaiso Metro.
3.2. Problem Analysis
In the second stage, the existing issues in the current scenarios are identified to gain a better understanding of the problems through field observation. A series of measurements were taken regarding the time the train doors remained open for passenger boarding and alighting, and it was found to average 30 s. Using the turnstile validation data from a typical day (Tuesday and Thursday), their loads were averaged to create a model load to be used for the current situation and as a baseline for the simulation and comparison with potential solutions. From the observations, the following data can be extracted (see Table 1):

Table 1.
Number of passengers (pass) who alighted at the morning peak hour (8:00 to 9:00 AM)—Francia station.
- On a typical Tuesday day, 108 more passengers alighted than on a Thursday, representing a 12.8% increase. This could be due to differences in mobility patterns depending on the day of the week.
- Train 1 has the highest average number of passengers alighted (270), standing out as the most used train, and it is also the one closest to 8:00 AM.
- Train 4 has the lowest average (181), suggesting either lower demand or a less favorable time, as it is the one closest to 9:00 AM.
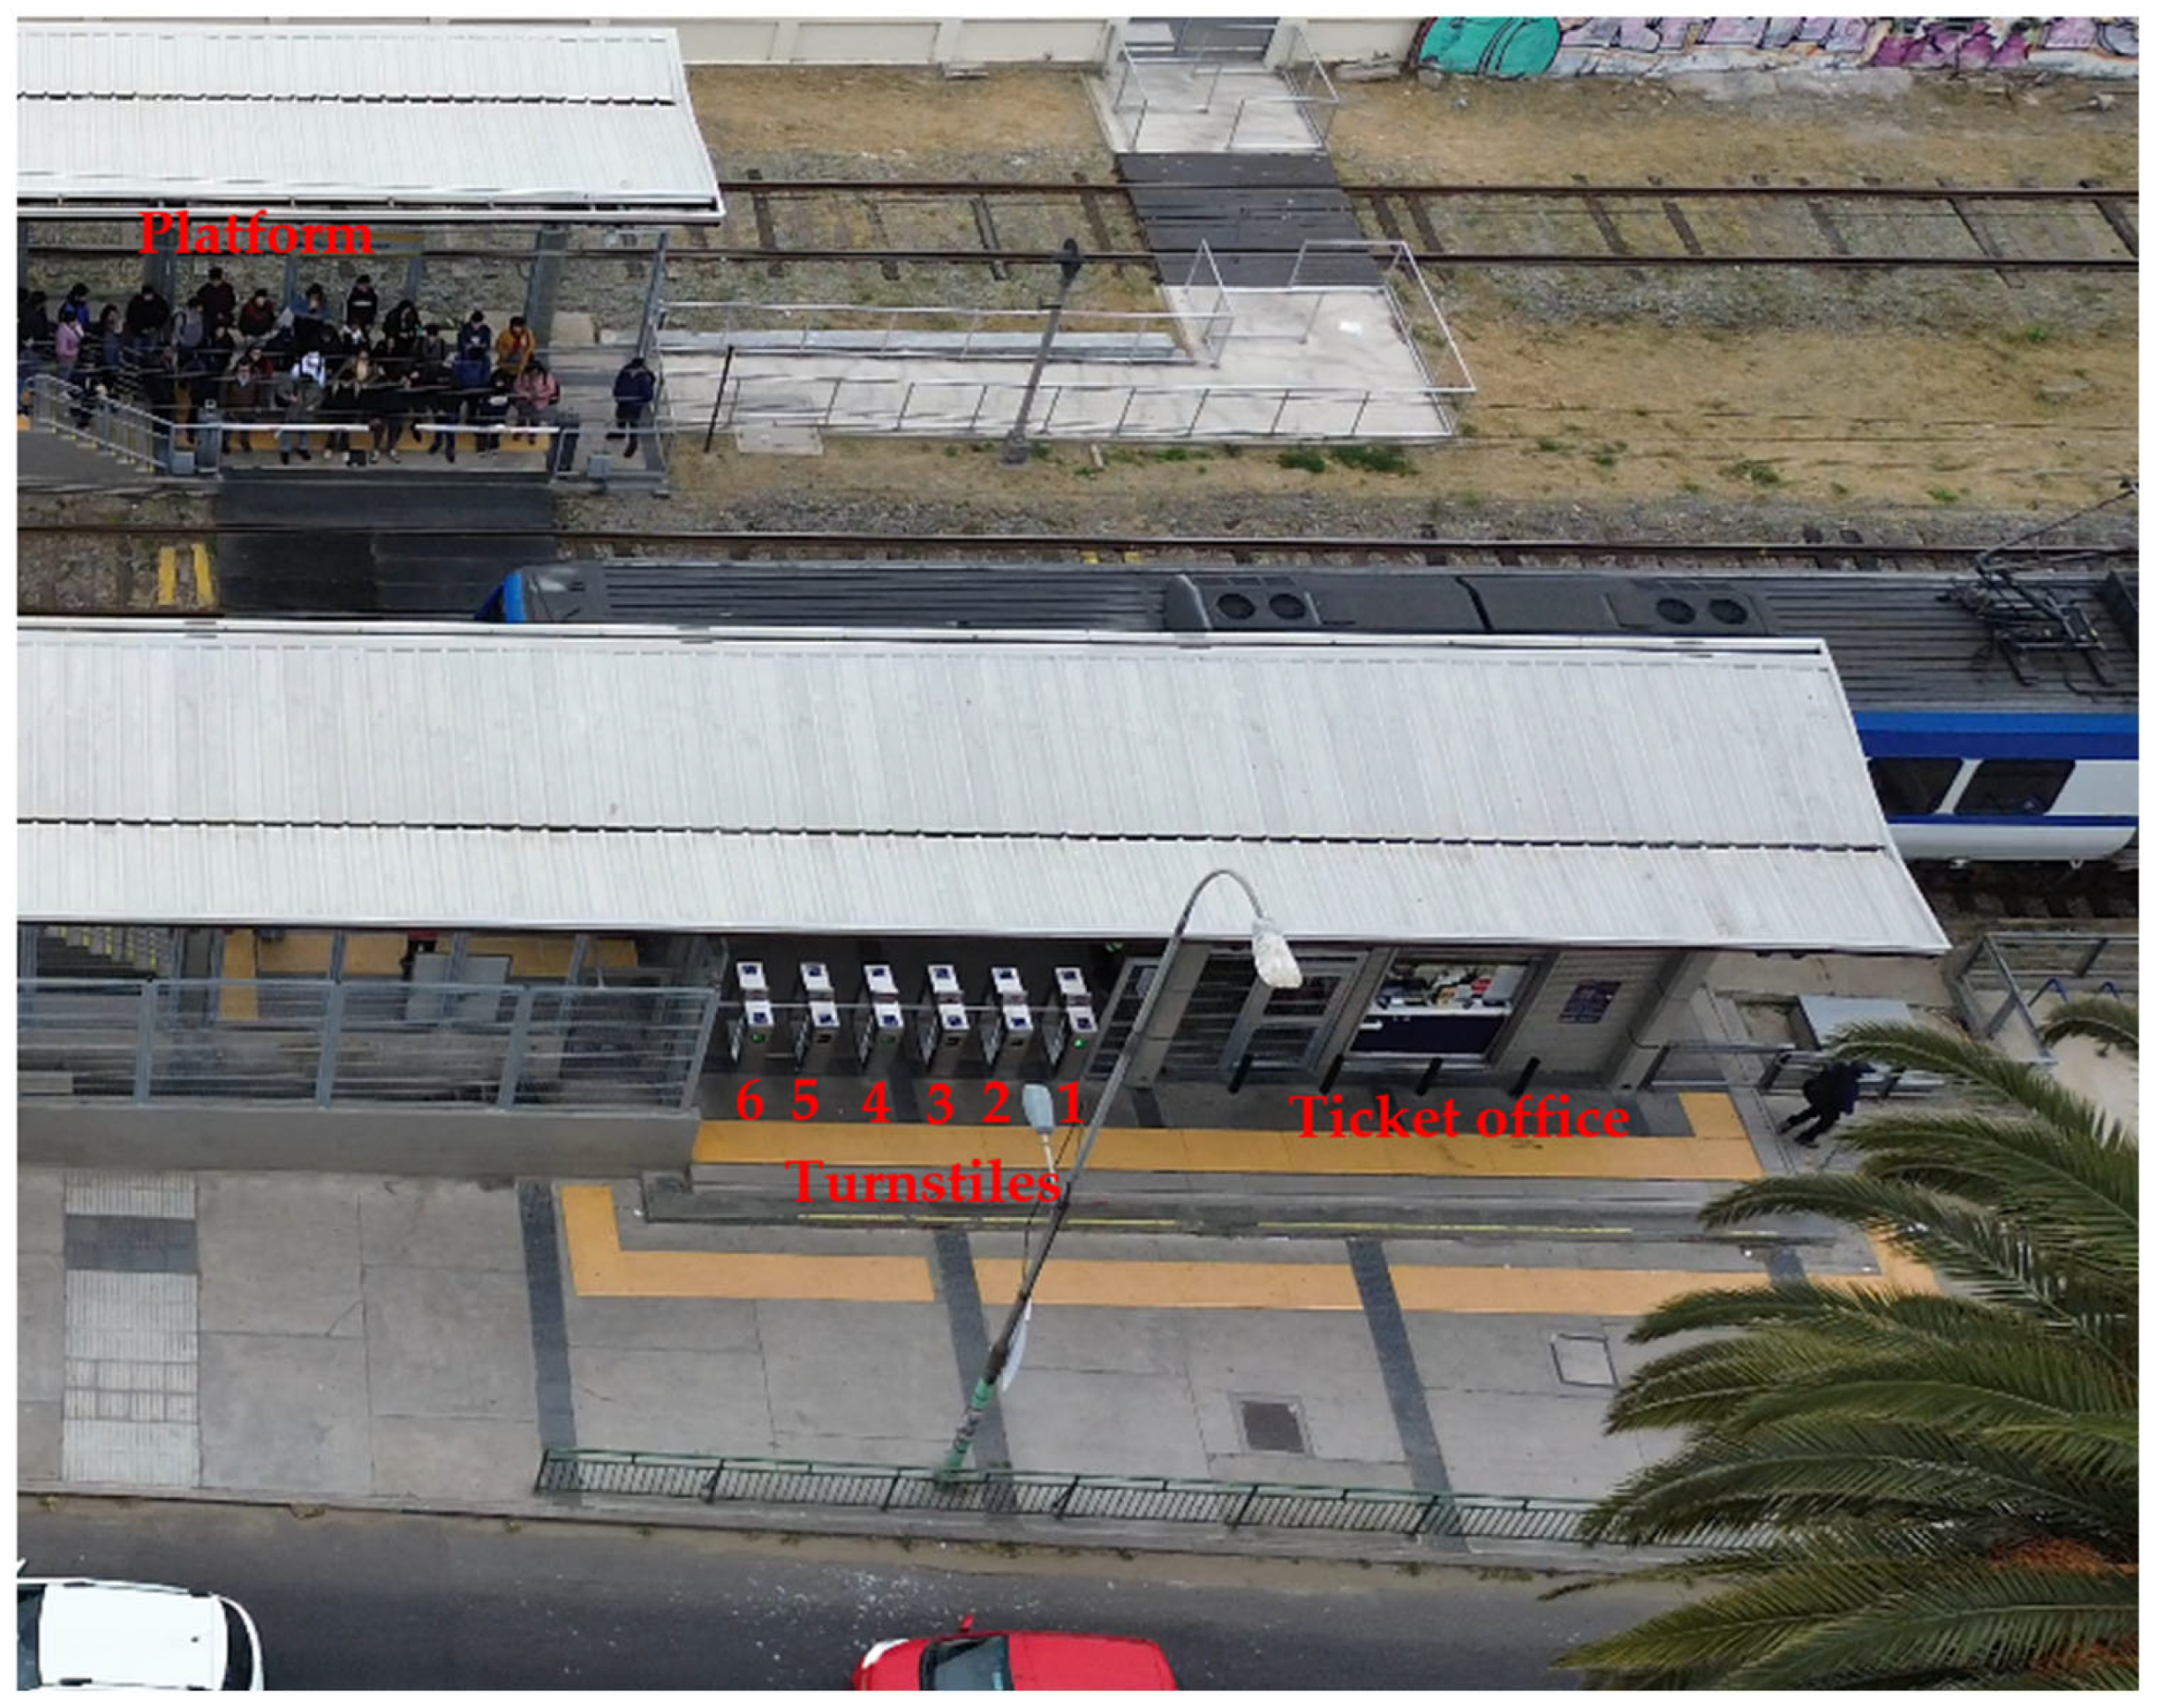
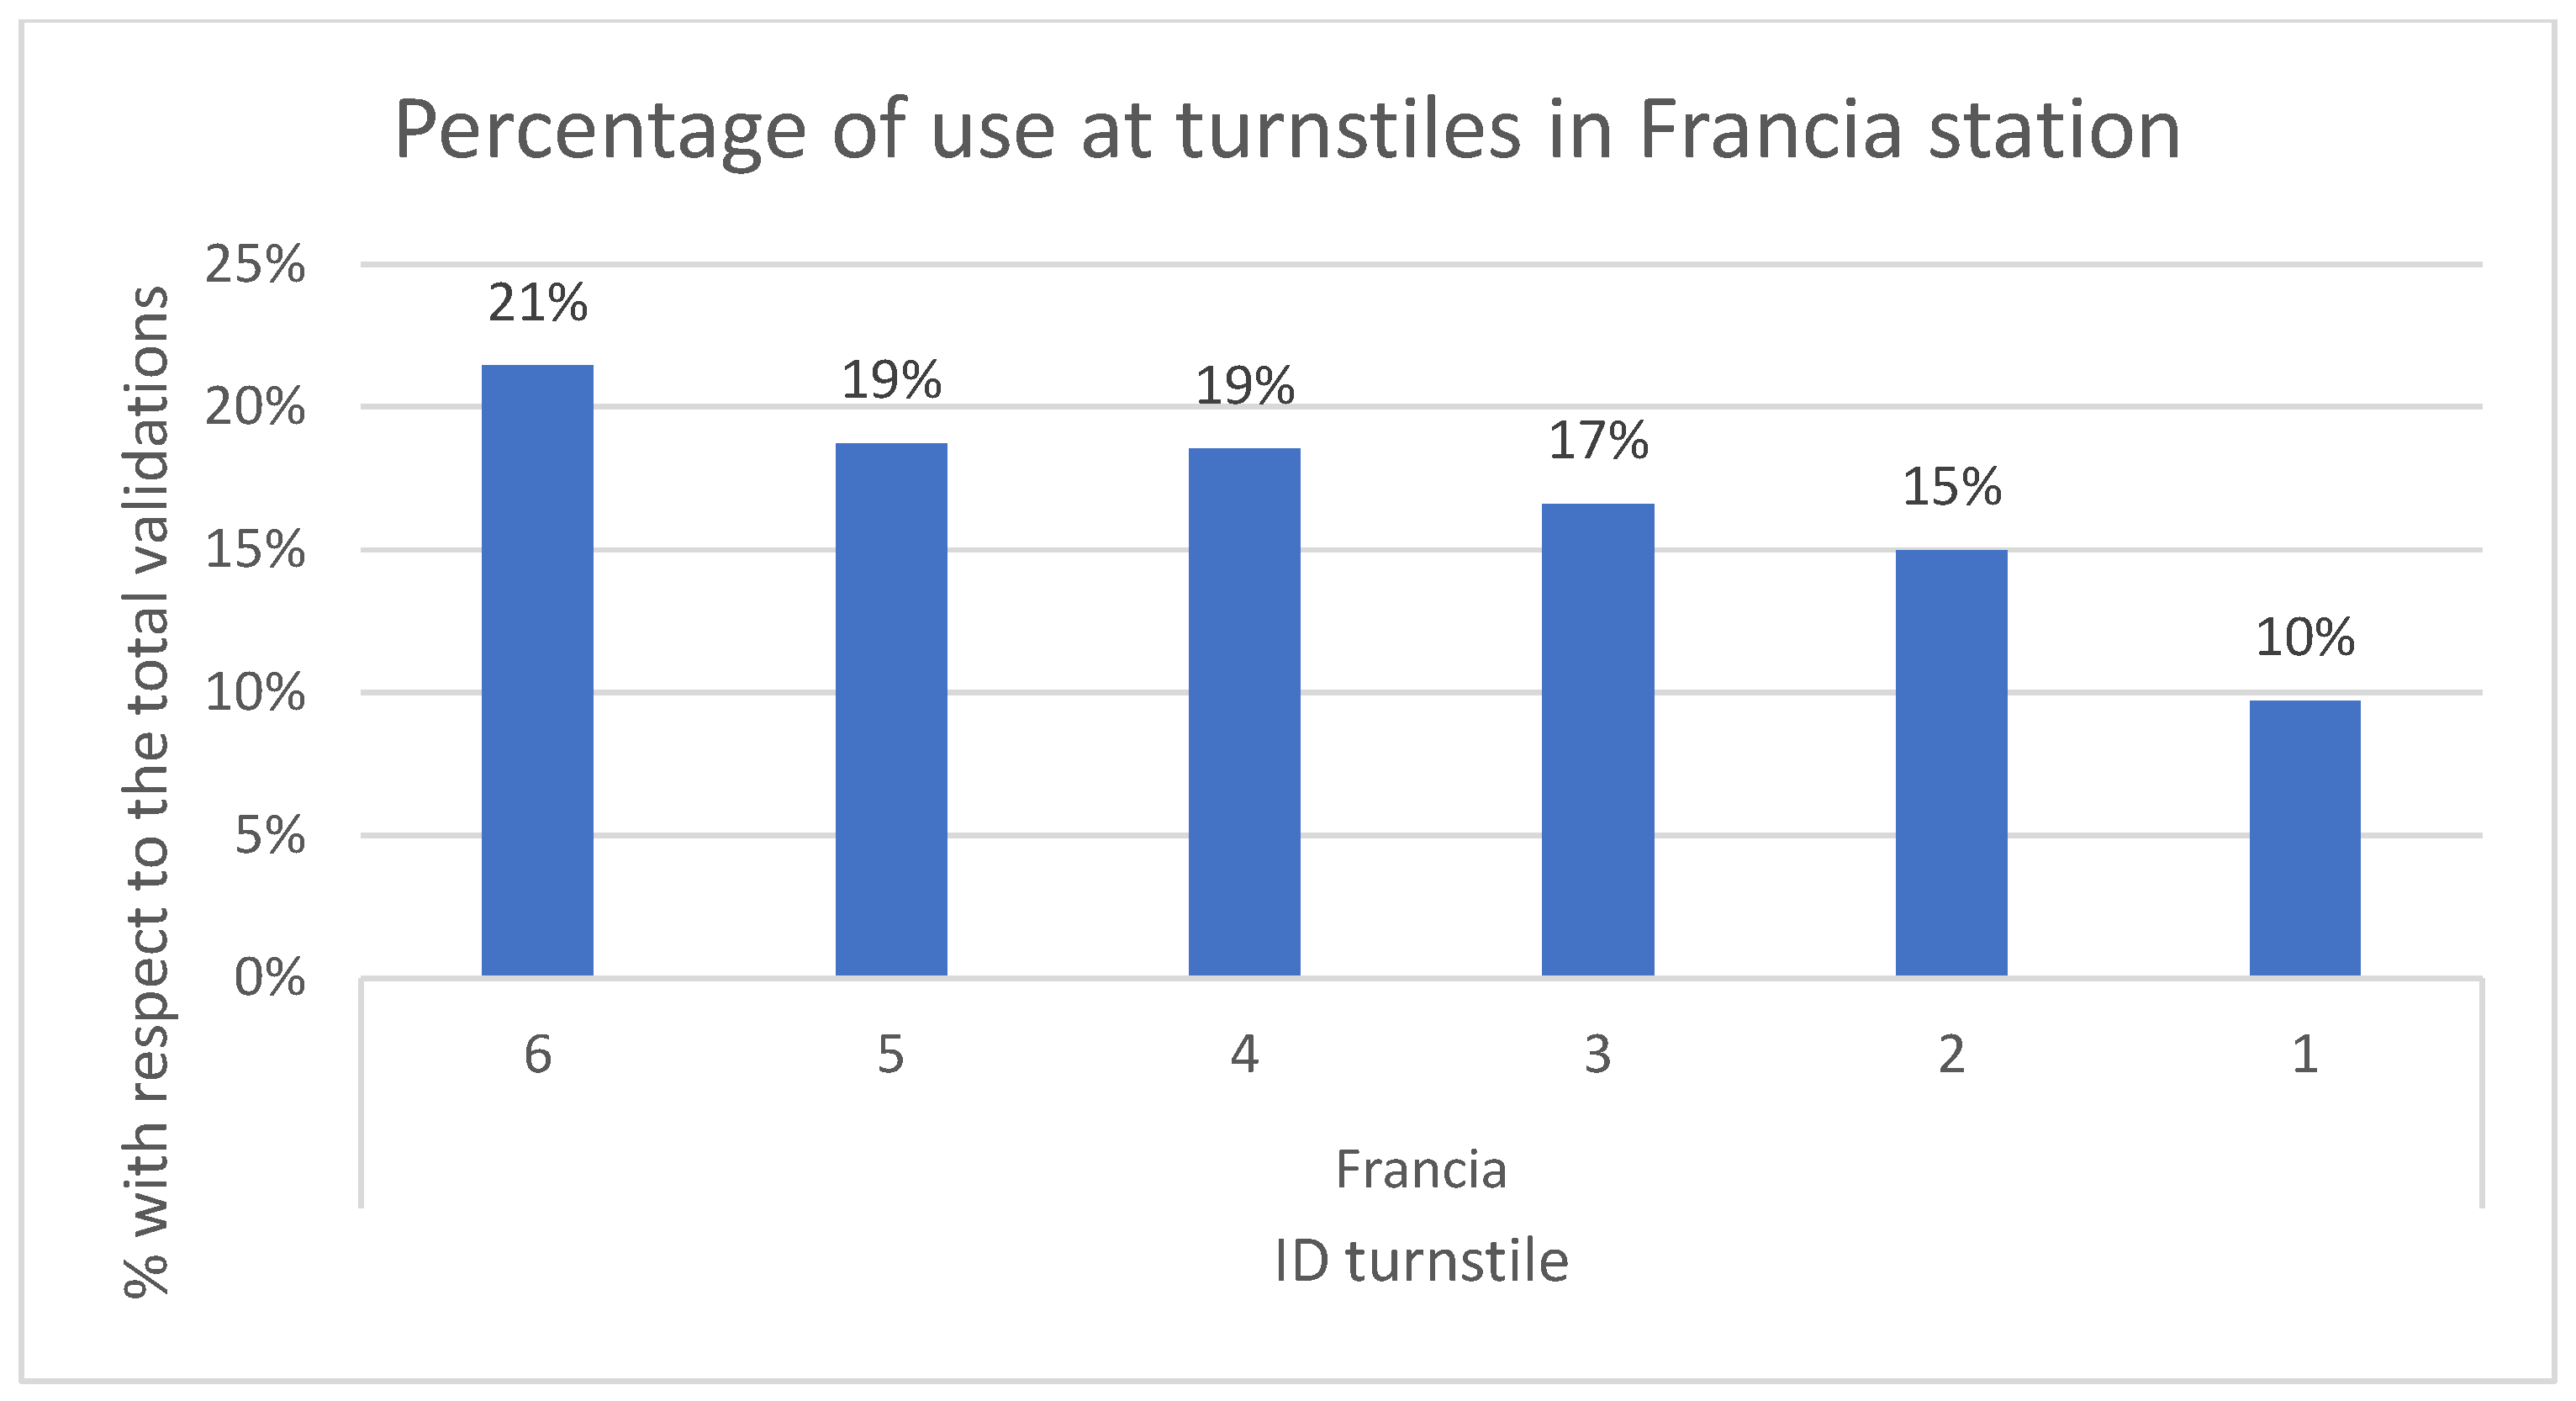
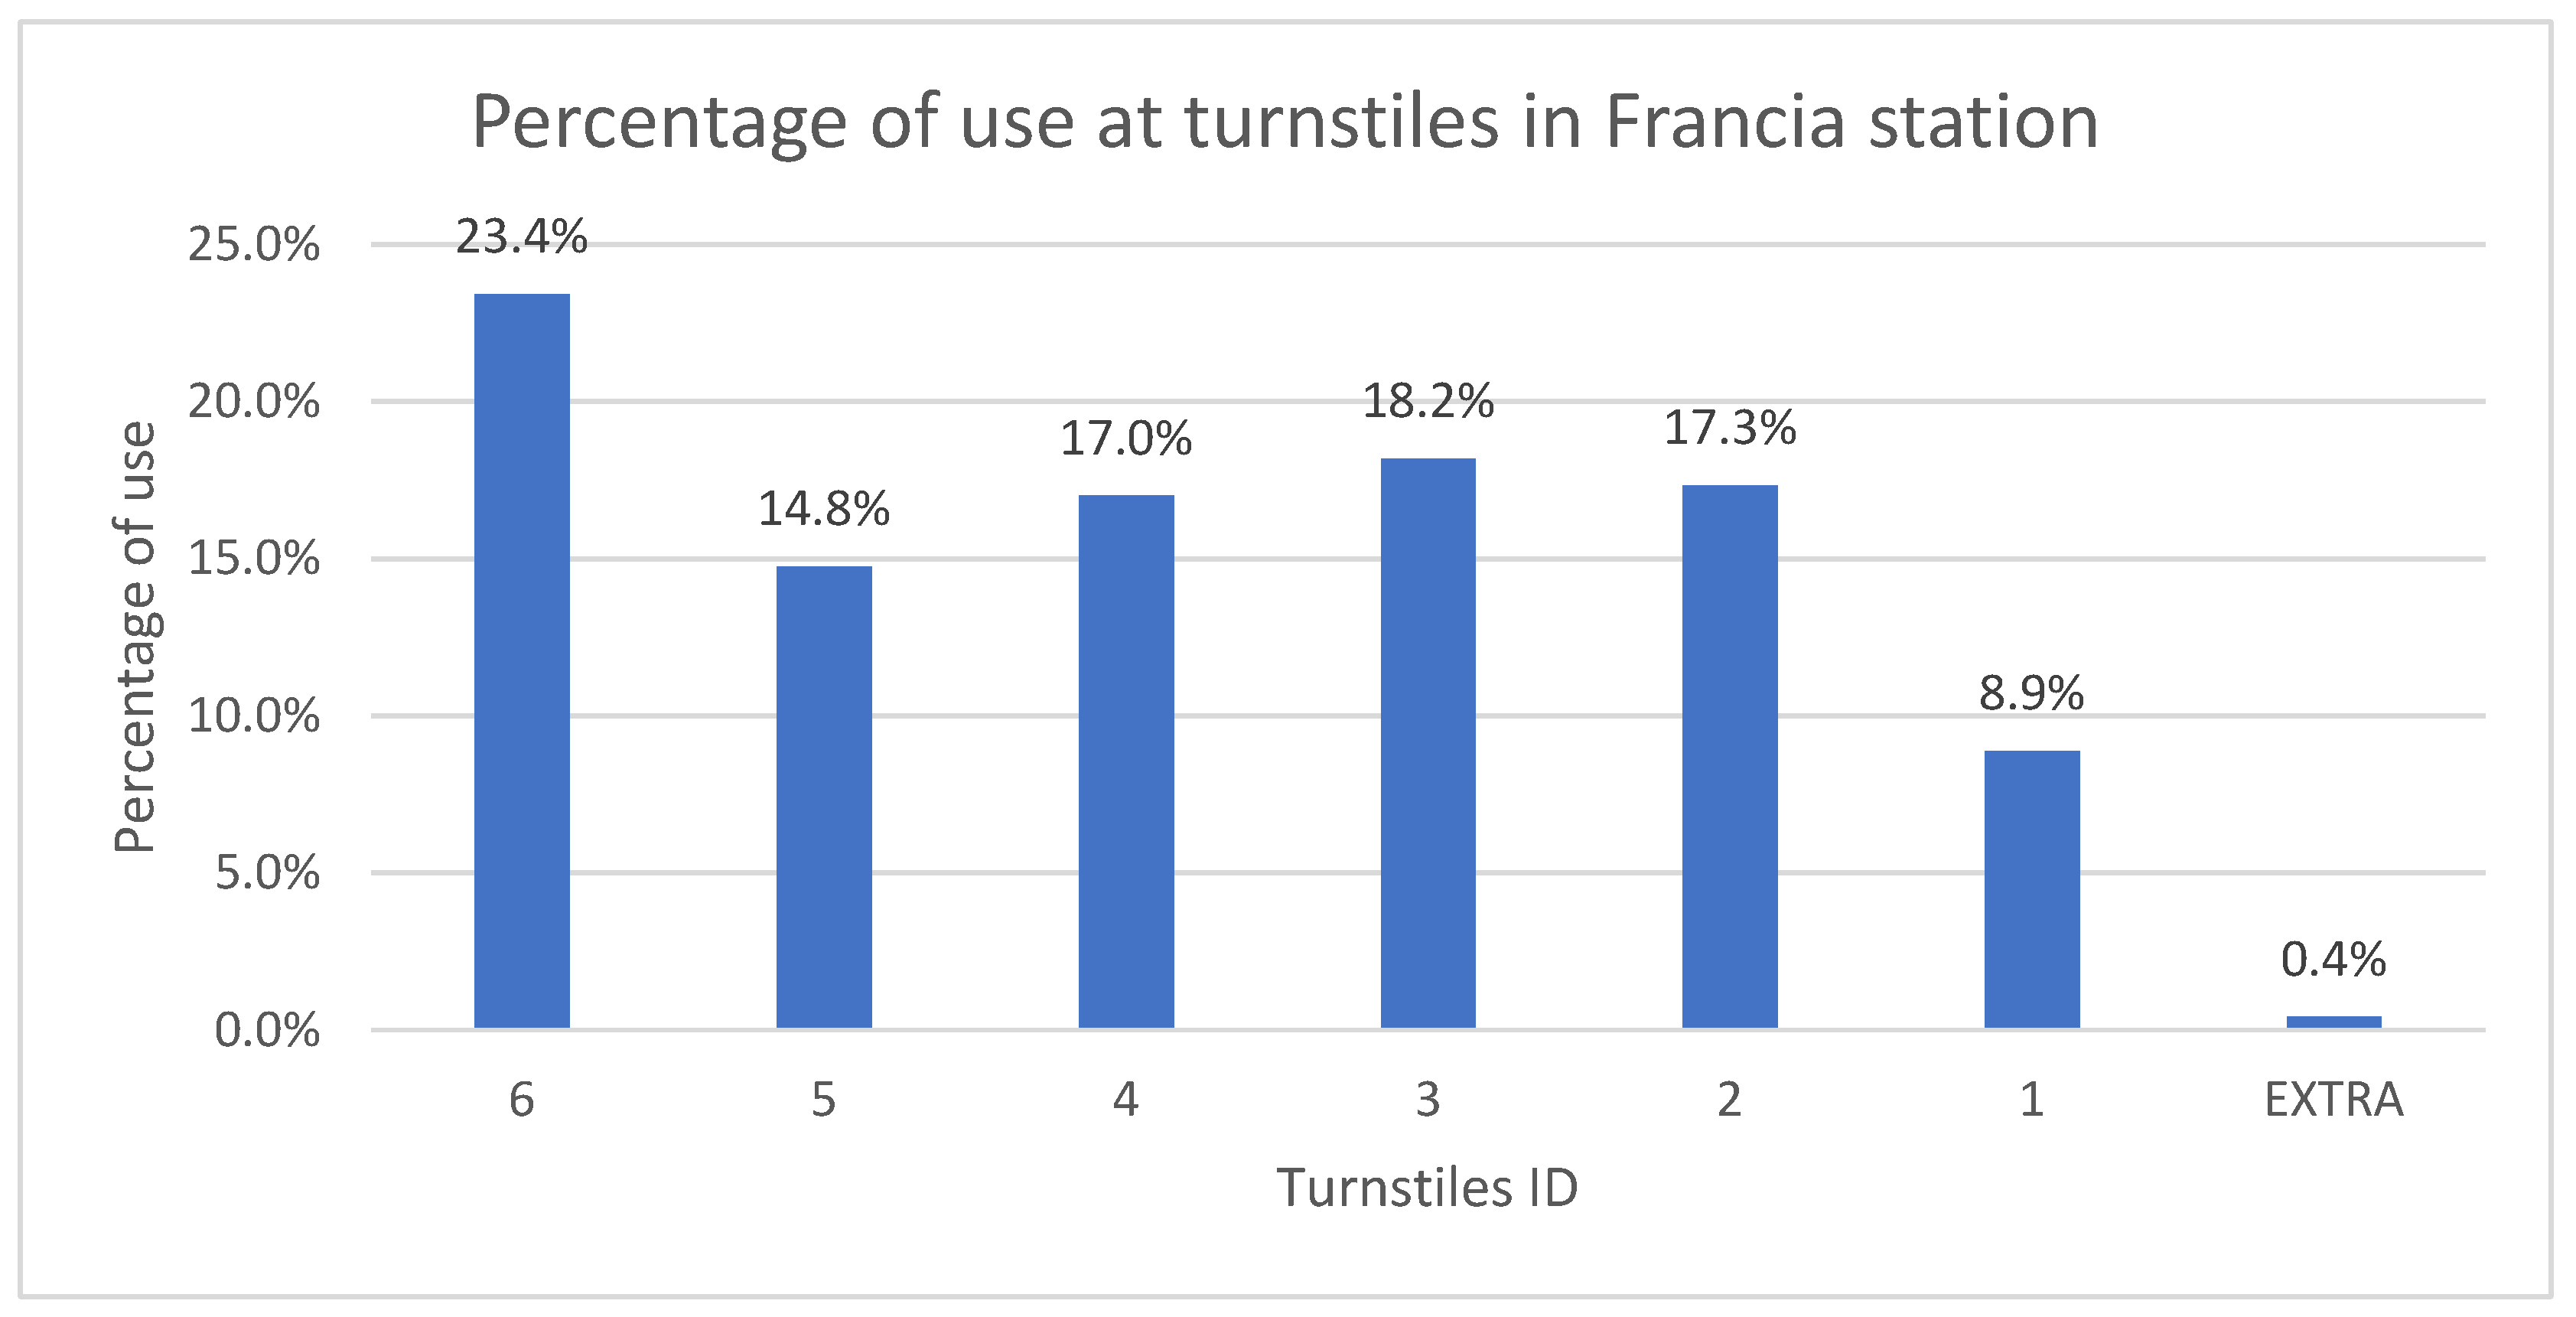
According to the measurements taken, the average time for a passenger to pass through the entire turnstile is 2 s, from the moment they place their card on the reader until they manage to move the turnstile and pass to the other side. Through field observation and the data obtained from turnstile validations, it can be verified that turnstile number 6, which is closest to the crossing over the railway tracks, has the highest utilization rate. This indicates underutilization of the other turnstiles in the station, providing insight into the type of solution we may need to apply. It suggests that the design may not be suitable for the passenger flow (see Figure 6 and Figure 7).
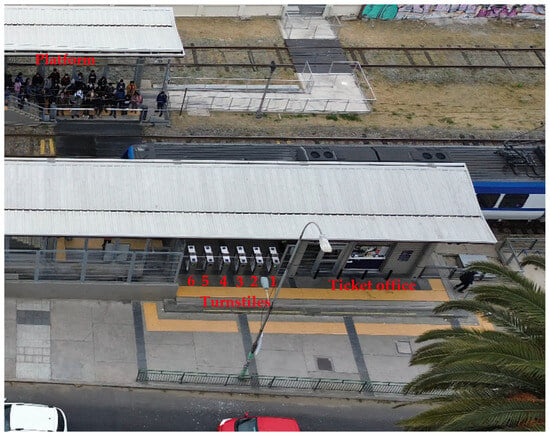
Figure 6.
Turnstiles layout which are closer to the ticket office in the case of study (Francia station).
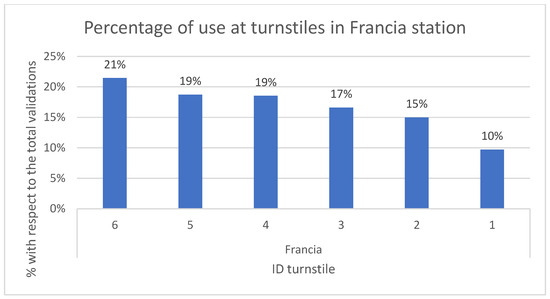
Figure 7.
Turnstile usage in the case of study (Francia station).
3.3. Model
To simulate the passenger behavior at Francia station of the EFE Valparaíso service, all previously measured and collected data will be used in the third stage of the methodology. These data are essential to ensure that the simulation model is realistic and representative of the actual operational conditions of the station.
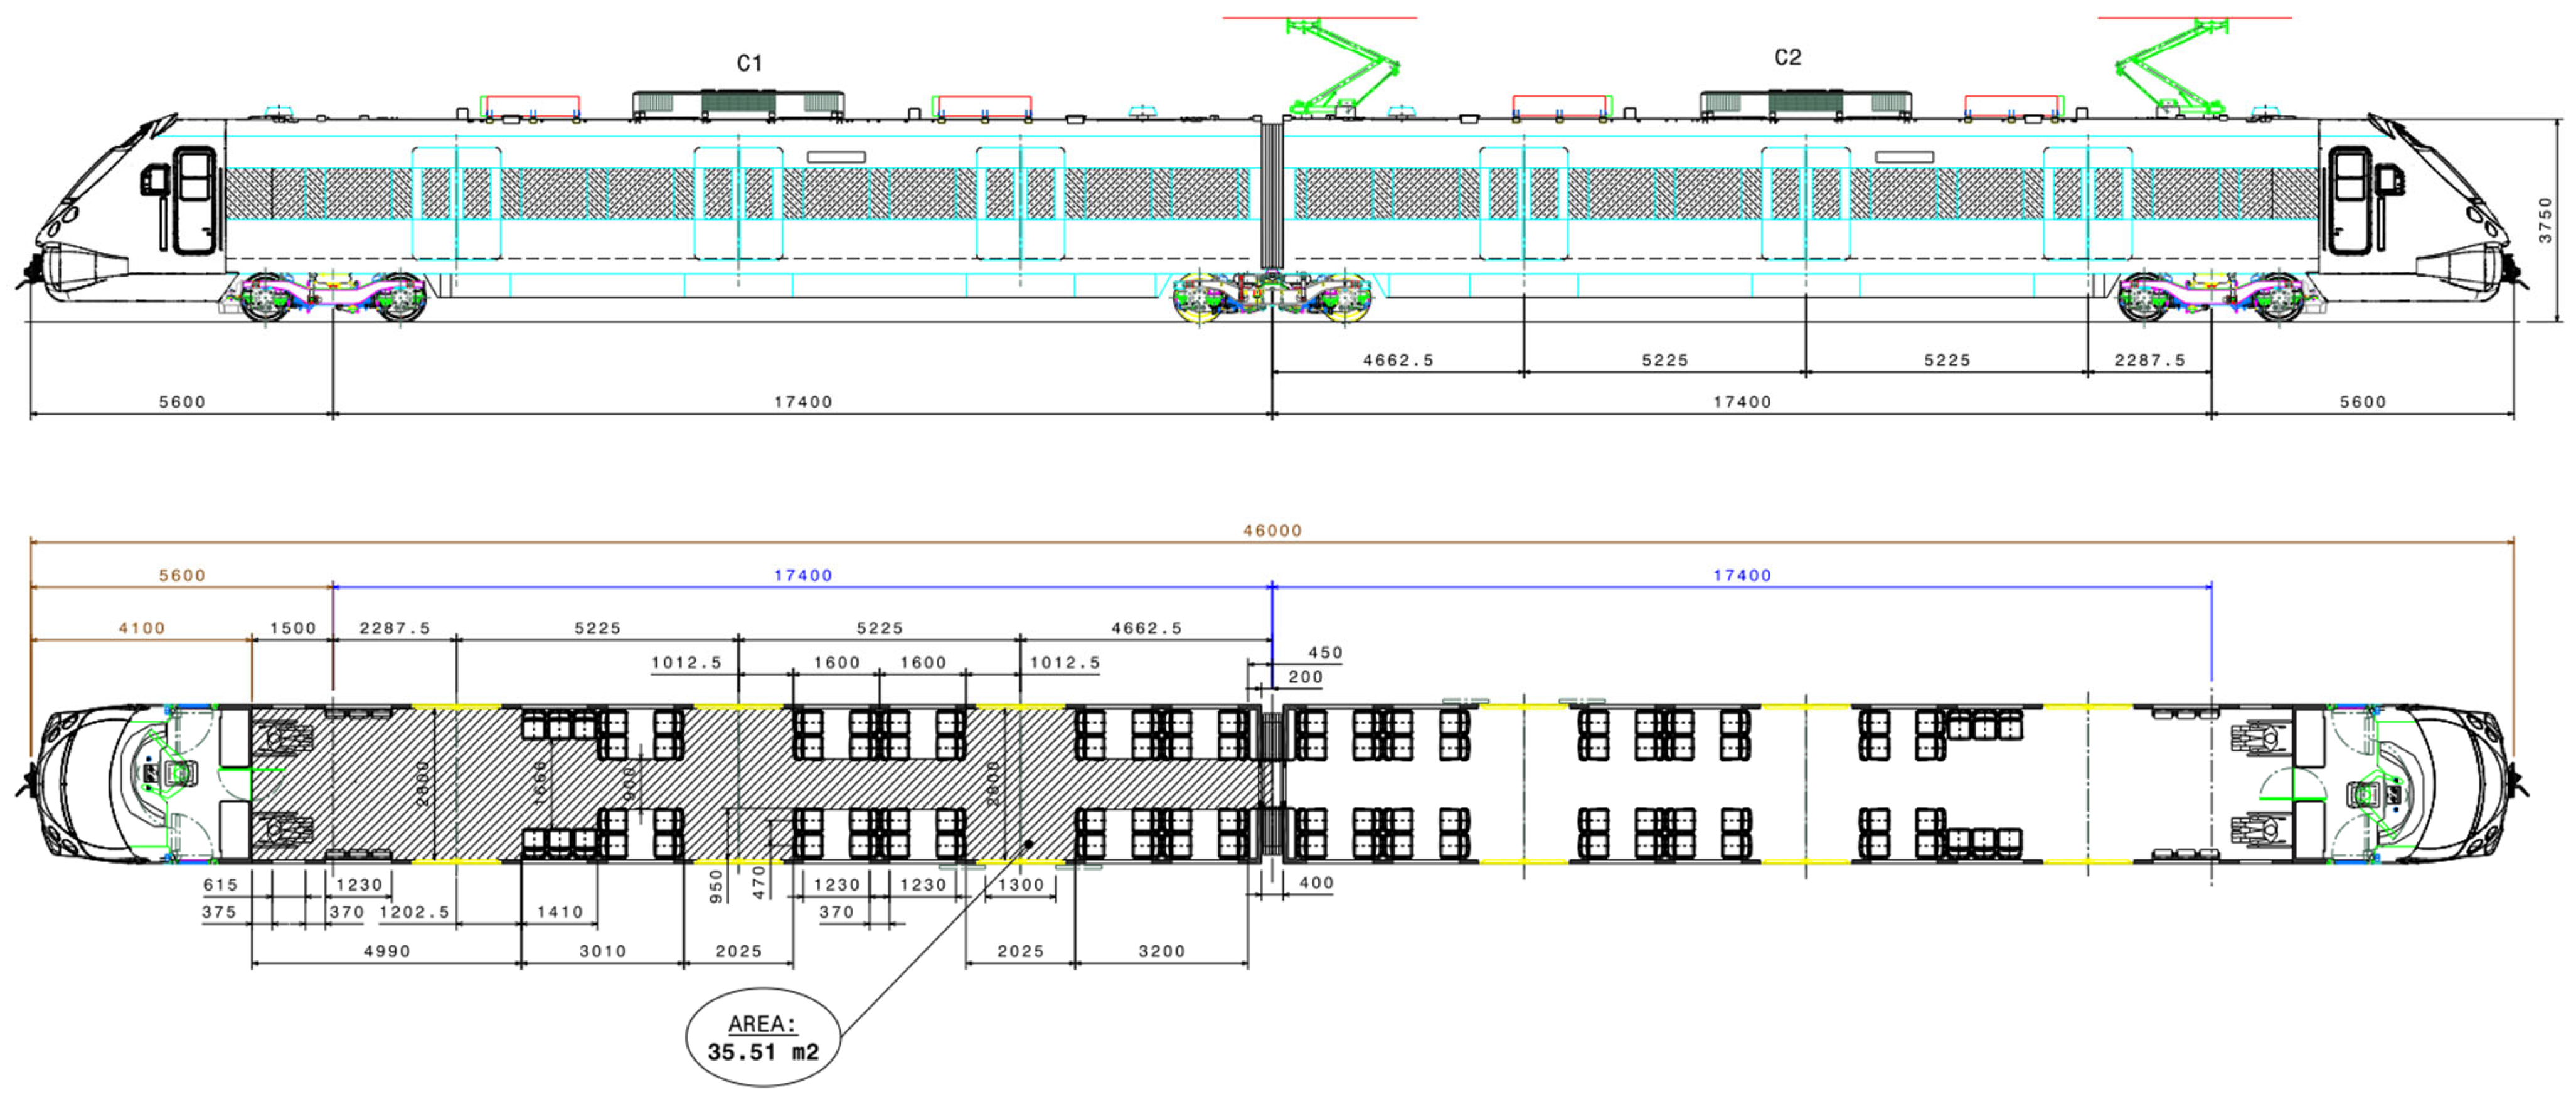
The current scenario of the station is constructed. To do this, the data from the measurements taken at the station are used, and a model is created in AutoCAD, distinguishing between areas accessible to pedestrians and those that are not. Subsequently, the metro car must be modeled in AutoCAD. The train in the Valparaíso Metro is an Alstom model (Xtrapolis modular), measuring 46 m in length and 3 m in width. It has a capacity of 376 passengers, assuming all seats are occupied, and a density of 4 passengers per square meter. The layout includes 12 train doors, 104 seats, vertical and horizontal handrails, a corridor, and a central hall in front of each train door. Figure 8 shows the train model used in the simulation with LEGION. This representation is highly relevant as it reflects the layout employed to study the behavior of passengers who, upon exiting the train, move toward the turnstiles, passing first through the platform. This model is essential for understanding how passengers interact with various system elements on their route to the exit and for analyzing potential congestion or bottlenecks in the flow of people.
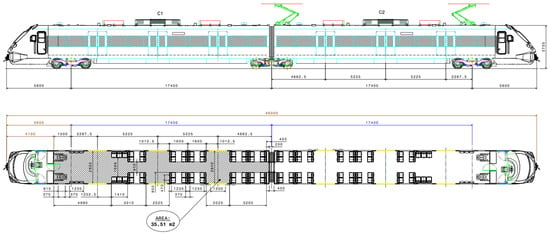
Figure 8.
Train layout in Valparaiso Metro (Xtrapolis modular).
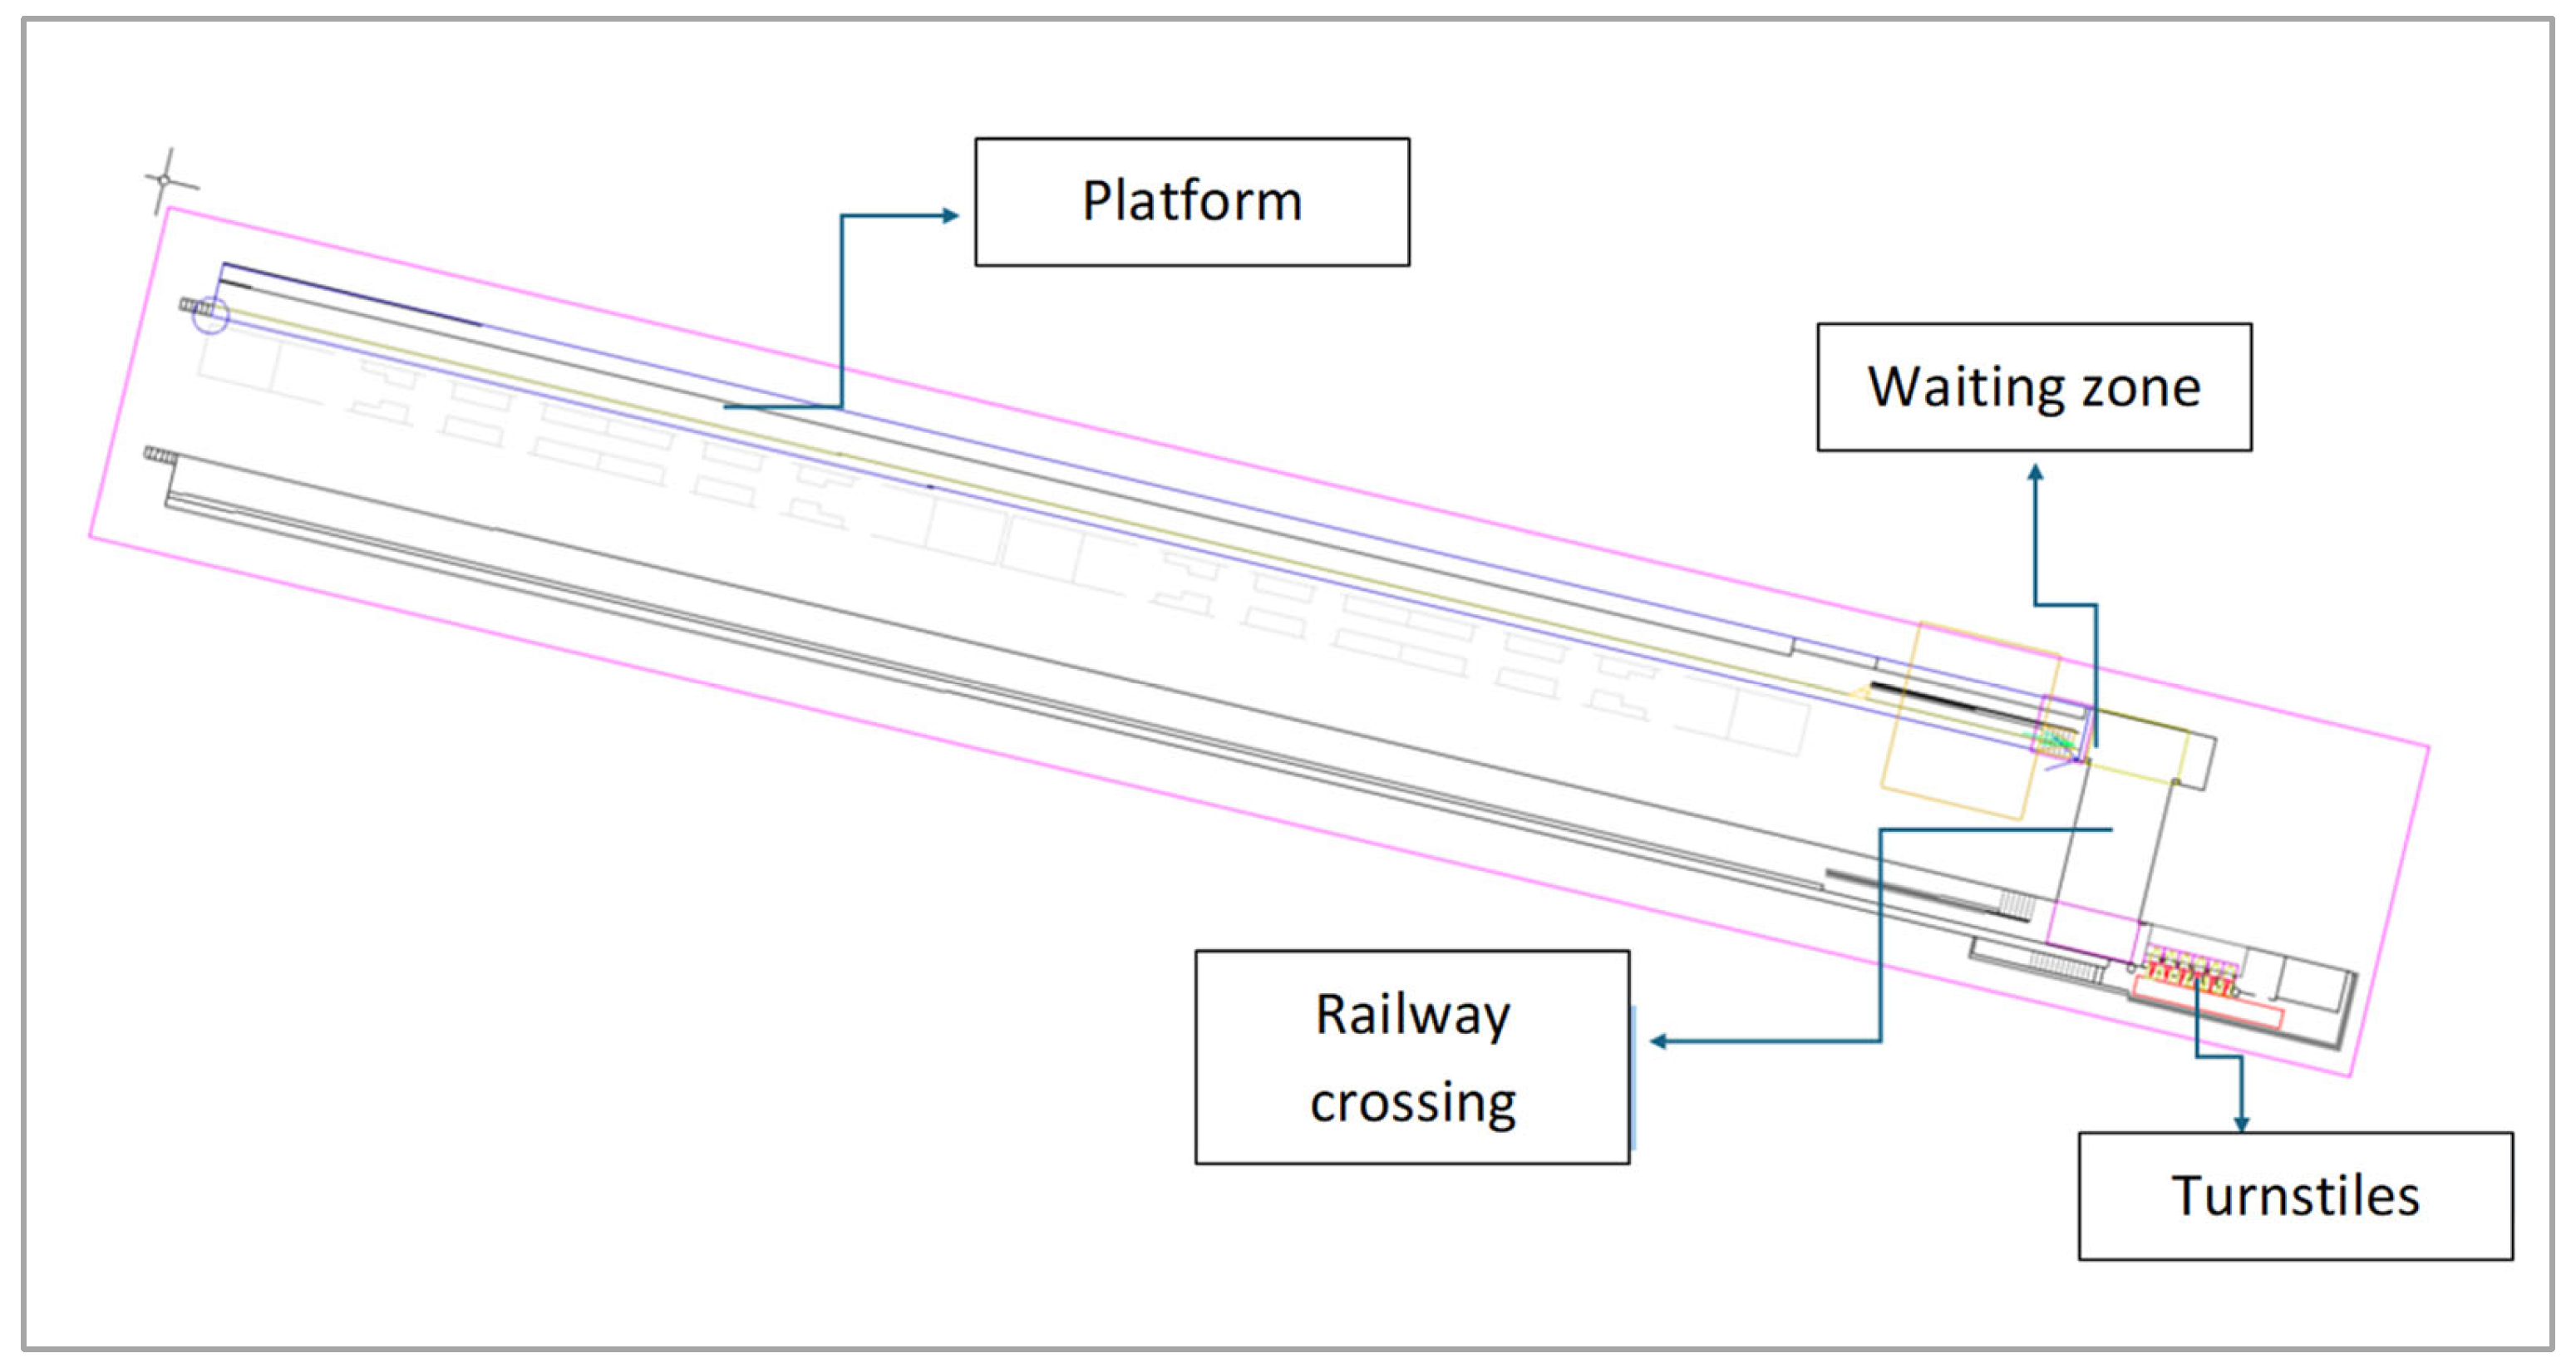
An Excel base sheet must be filled out, where the origins and destinations of passengers are created, in this case from the metro car to the station exit, along with passenger distribution and train arrival times. Subsequently, the simulation elements must be generated, designating the waiting areas, turnstiles, platforms, train arrival zones, and the width of the yellow line on the platform. To this end, the following variables are used (see Table 2).

Table 2.
Input variables used in the model—Francia station.
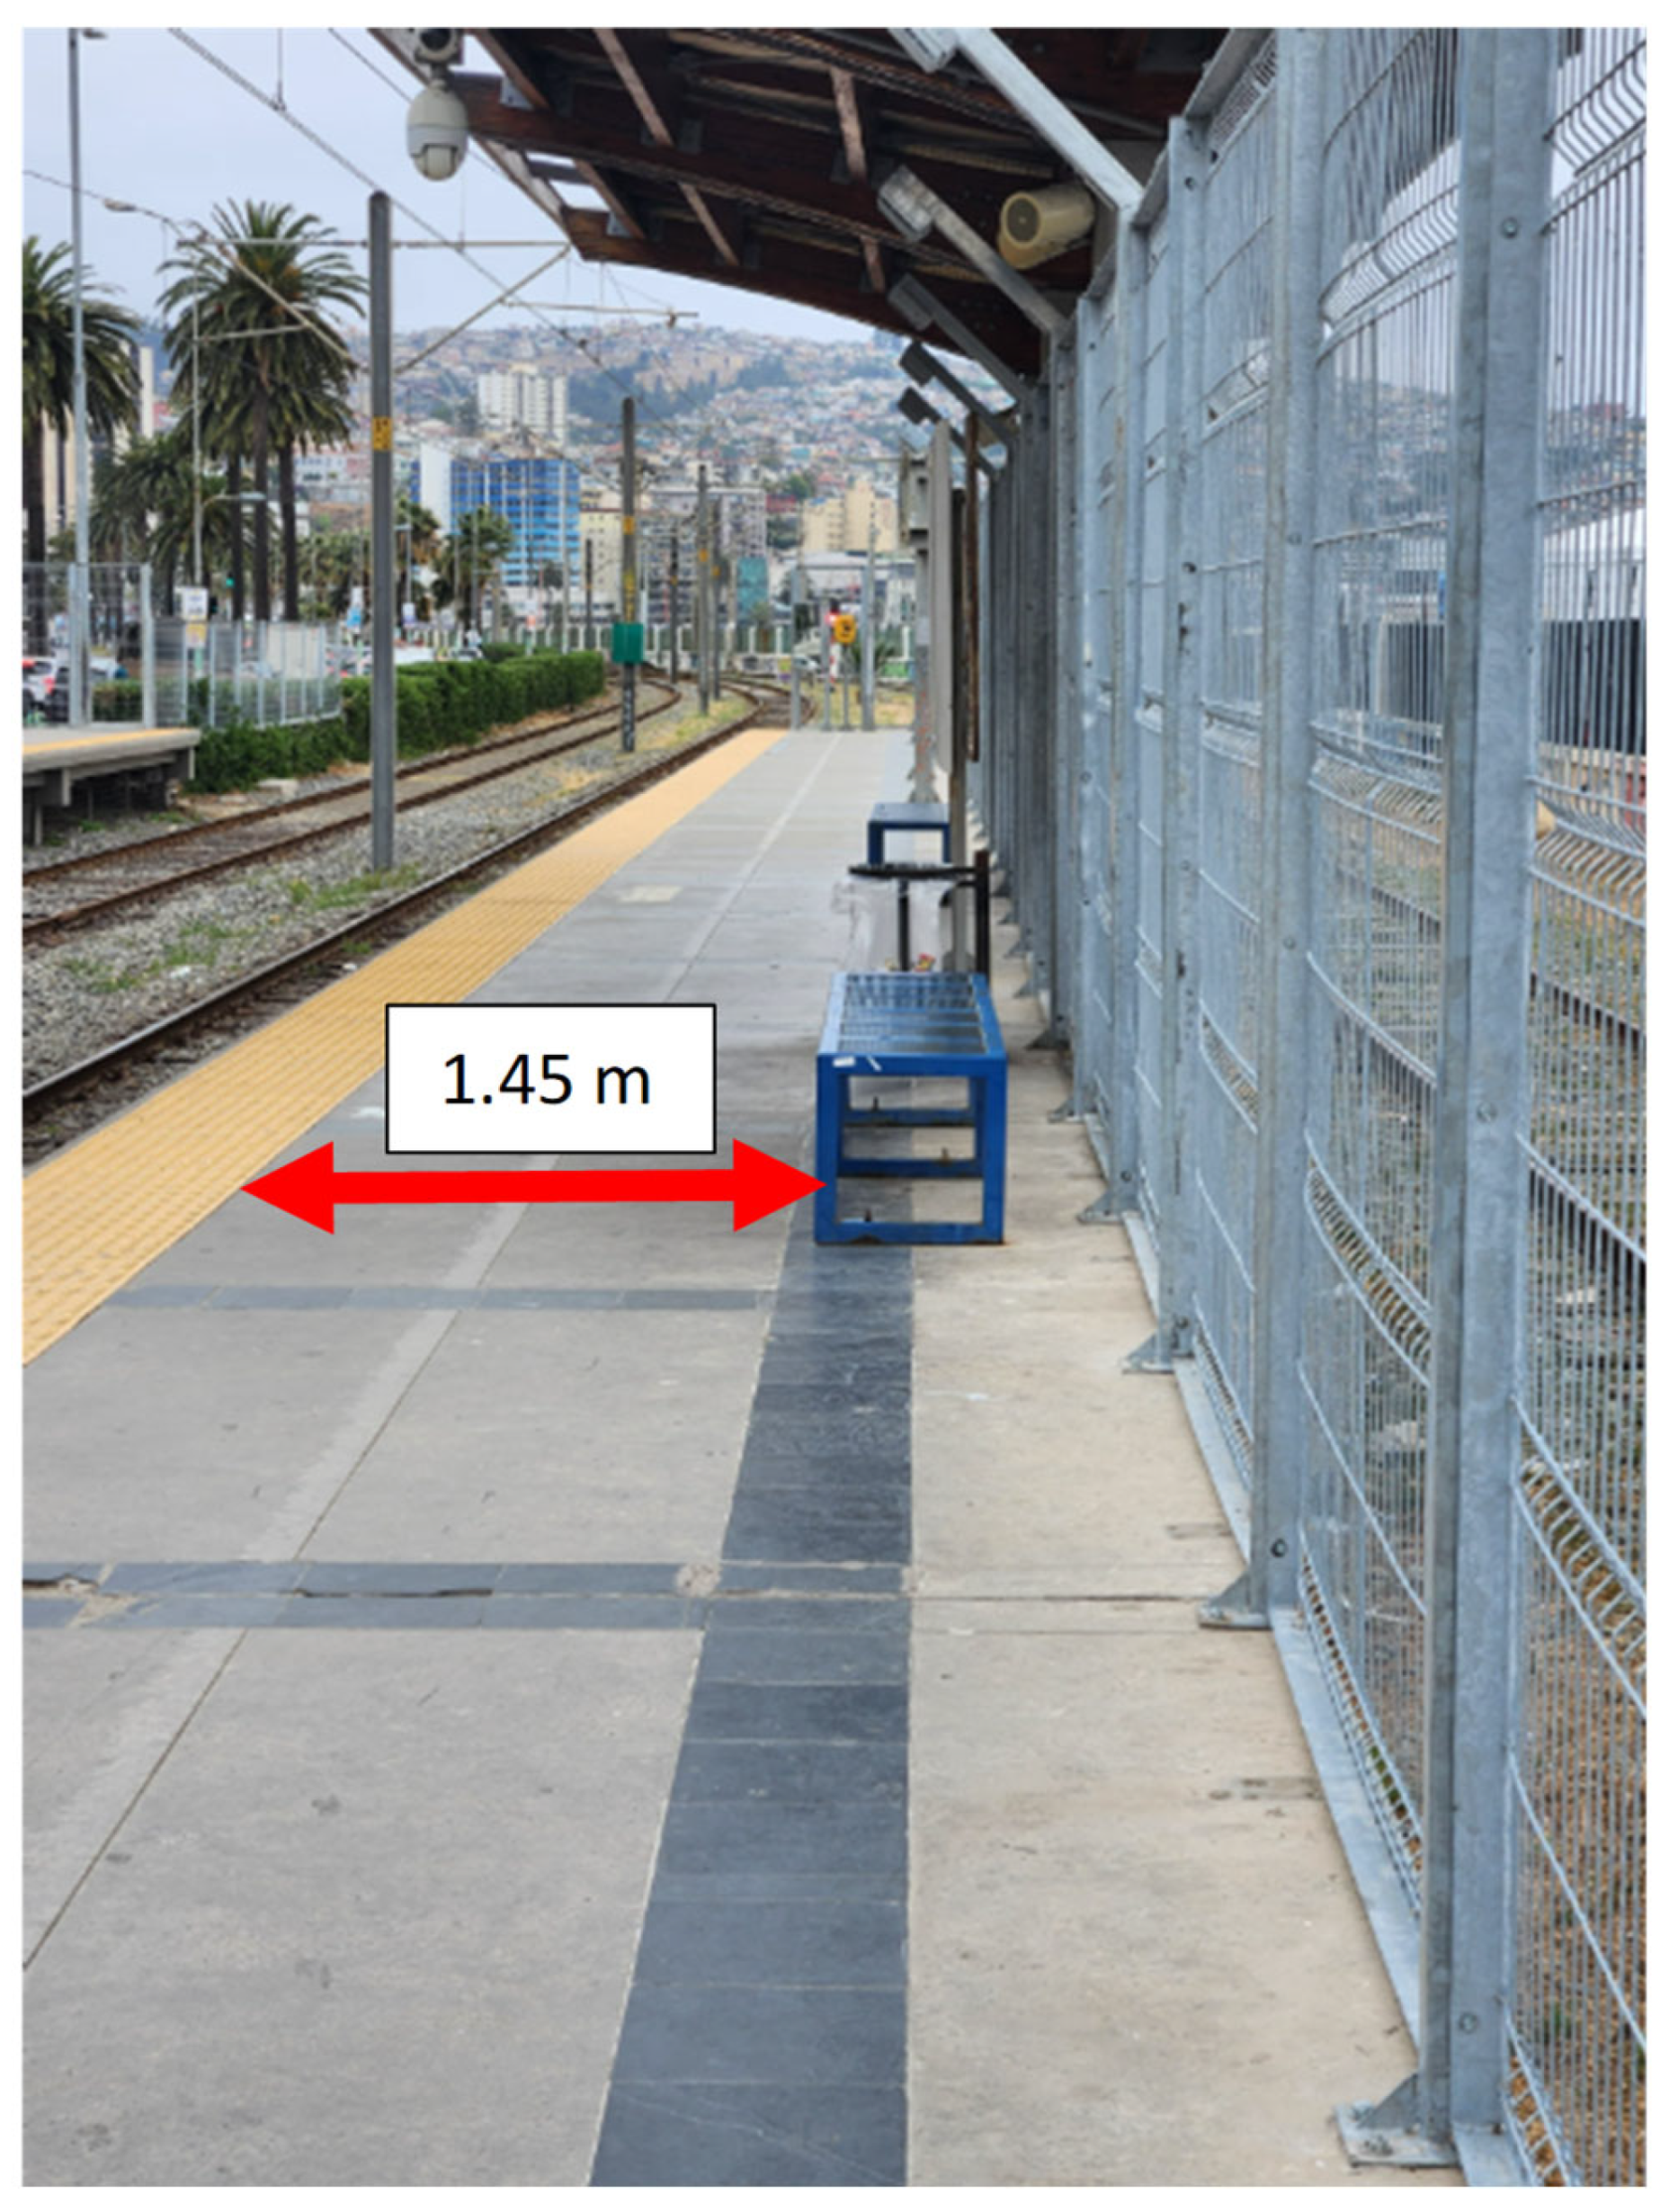
Different scenarios are simulated in LEGION [30], performing the necessary calibration using the elements provided by the simulator and applying the best practice manual for simulating pedestrians from the London Underground [31]. The scenarios include the simulation of passengers from the platform to the turnstiles. The platform dimensions take into account the existing furniture. To facilitate the simulation, the entire strip along the edge of the platform is considered as seating without occupants, so the platform width, excluding the safety yellow line, is 1.45 m. In the following image, it can be seen that, although the furniture measures less in the survey conducted, it is assumed that it is not placed directly against the railing, which is why the platform width is set to the previously mentioned value (see Figure 9).
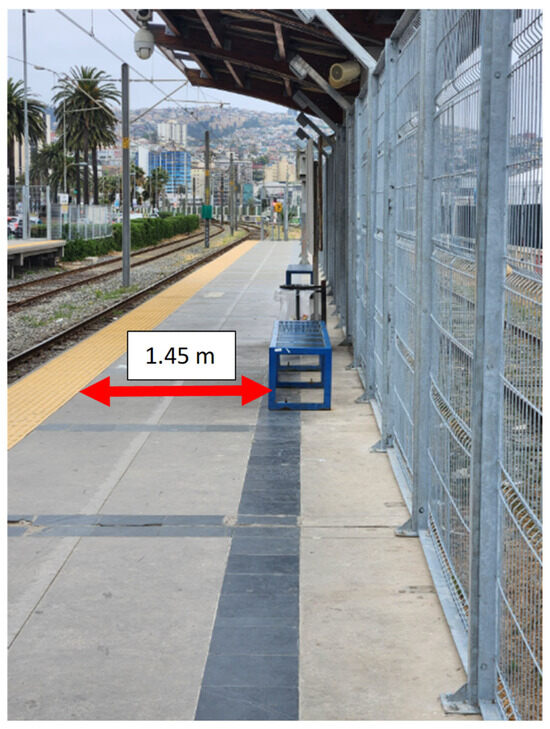
Figure 9.
Image of the north platform at Francia station and furniture.
The tool selected was the LEGION simulator, which is mainly used and calibrated to simulate the boarding and alighting in metro stations worldwide [1,21,32]. The objective of using this tool is summarized in the following points:
- Model the pedestrian movement at the turnstile zones.
- Implement crowd management measures to study passenger behavior.
- Collect output data that quantify the quality of station design, to be subsequently analyzed using the LOS.
In addition, LEGION was used due to the possibility of selecting the type of user and therefore analyzing their behavior. In this case, equality is represented by women and men in each simulation process. It is important to highlight that in LEGION the increase in size due to luggage is absorbed into an extended circle with an area equal to the sum of the original entity area augmented by that of the luggage. The shape represented by each passenger used a Gaussian distribution function assigning “luggage” sizes randomly to designated entities.
3.4. Sequences
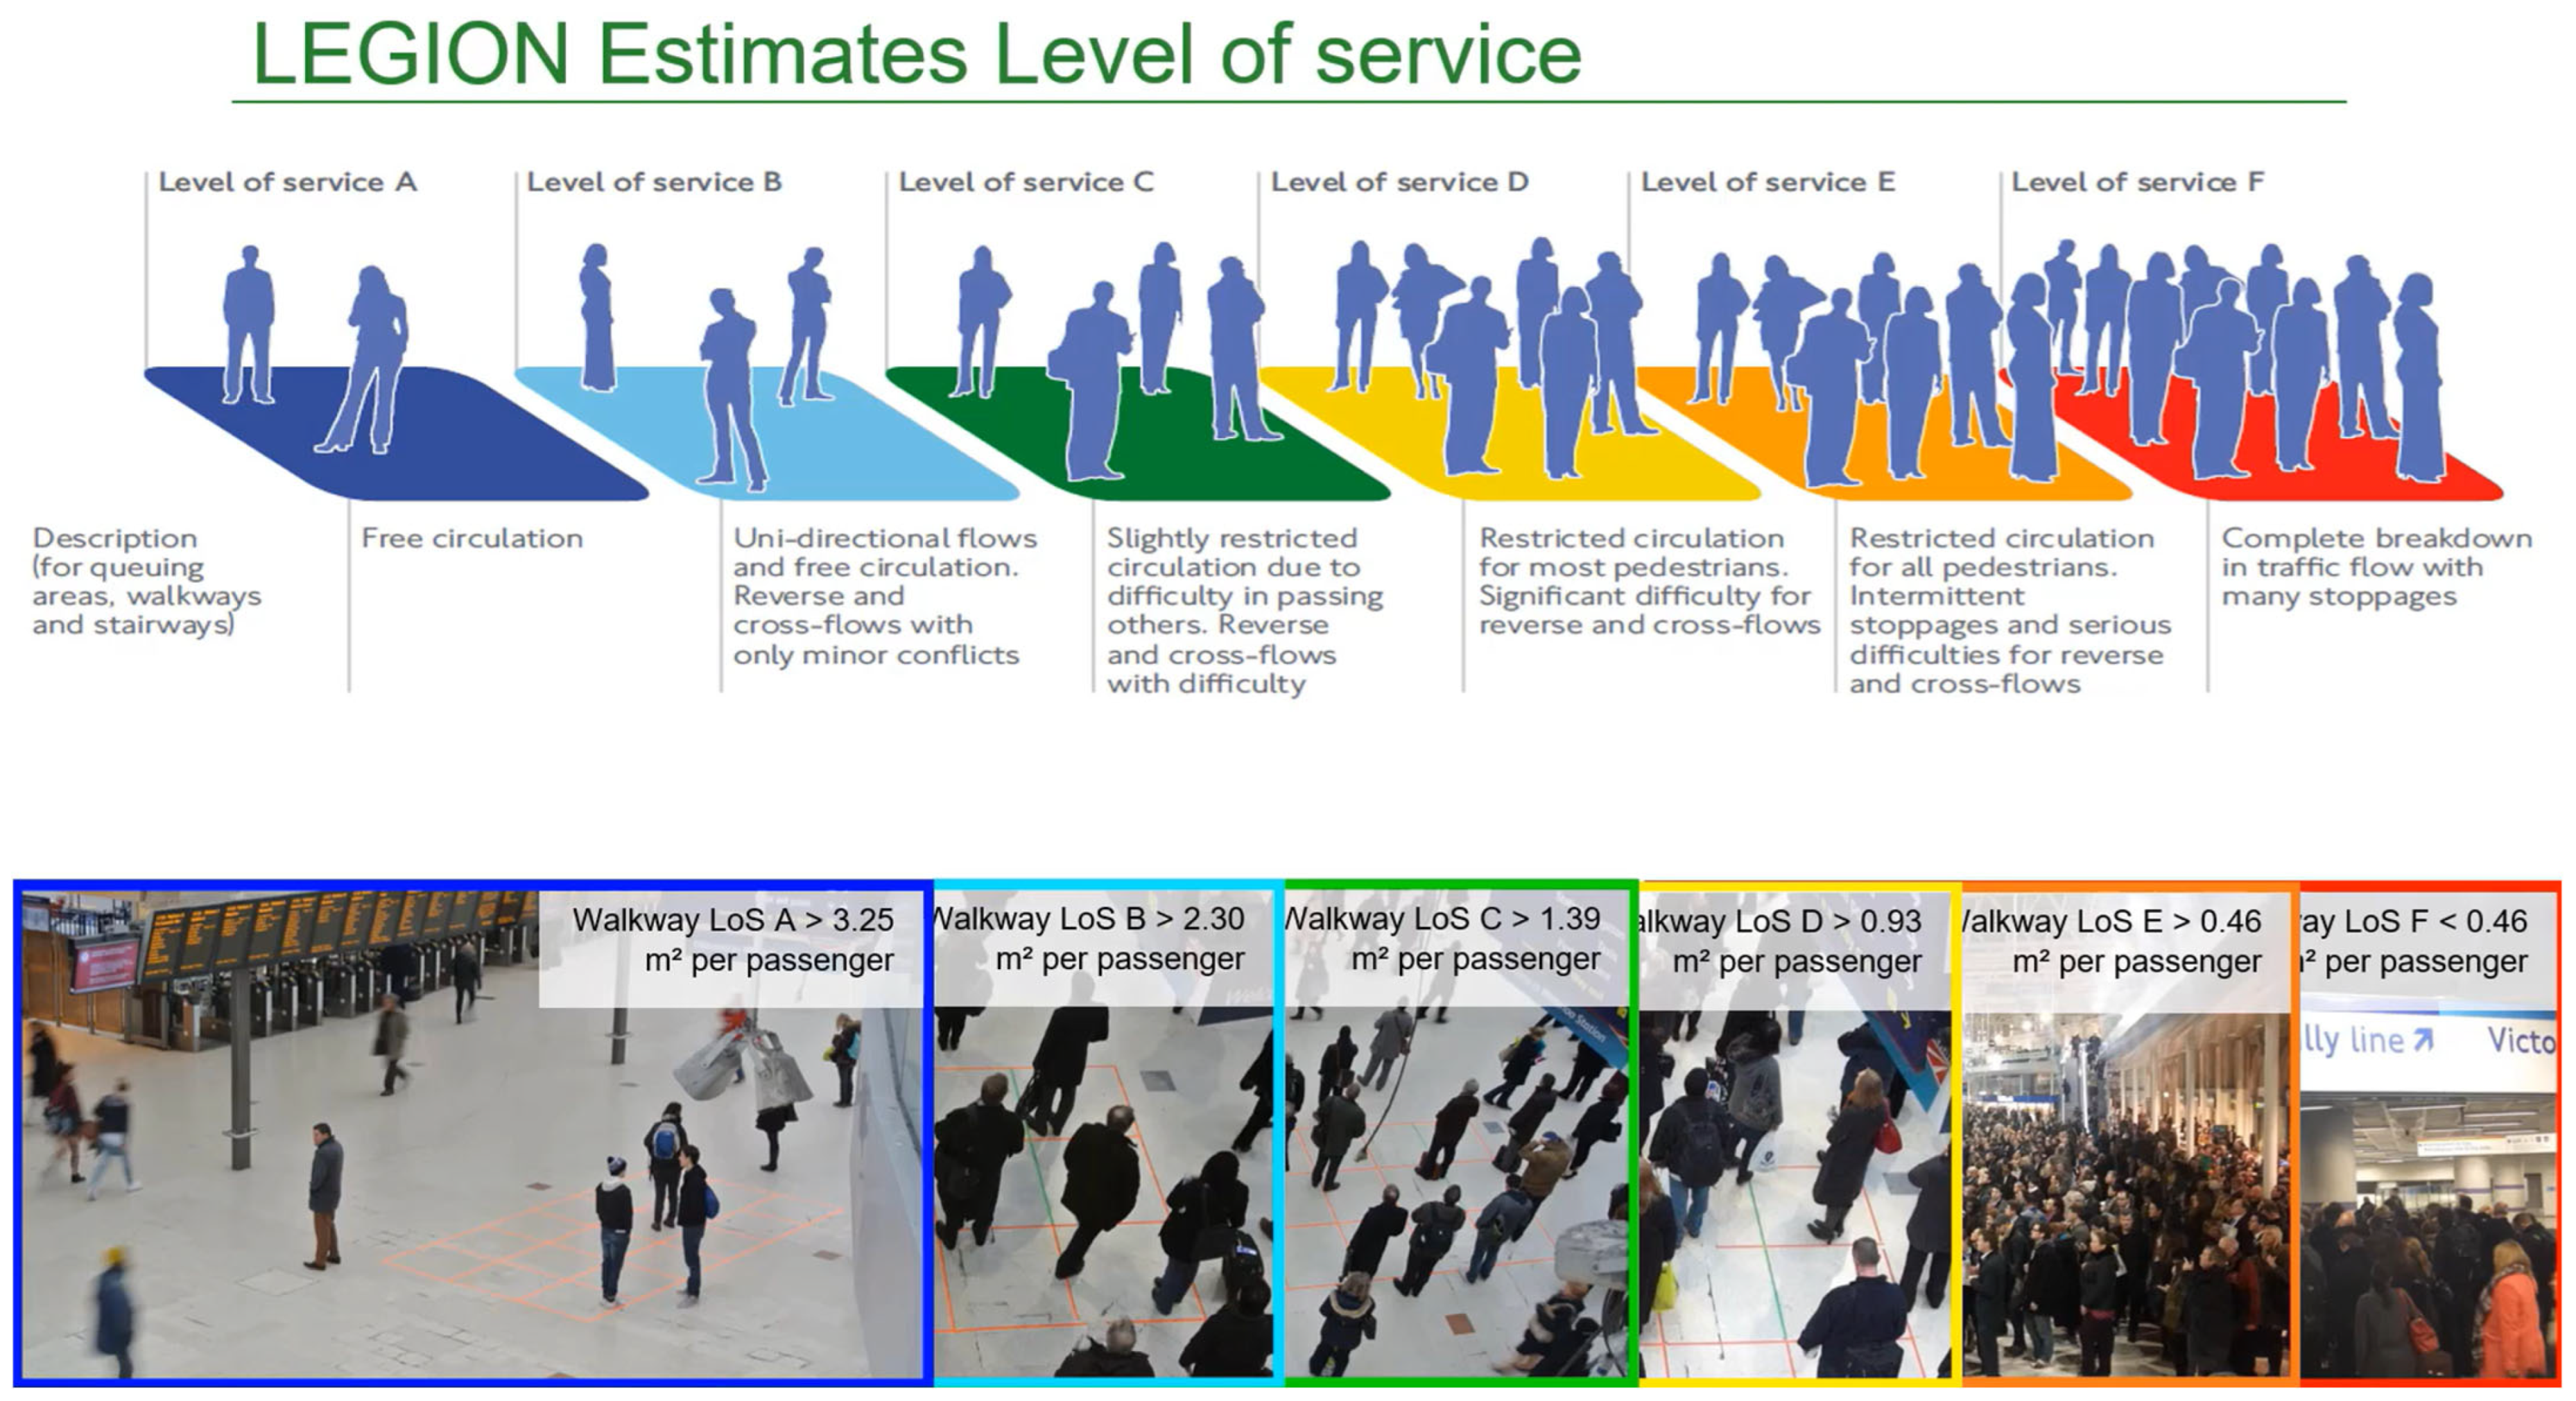
Due to the study of scenarios, its implementation is tested in the case study. Simulations are conducted in software (LEGION) calibrated with the obtained data to decide on simulating different scenarios. This software allows modeling the interaction between pedestrians and physical obstacles, as well as circulation and evacuation. As a result, it generates information maps such as the LOS (see Figure 10).
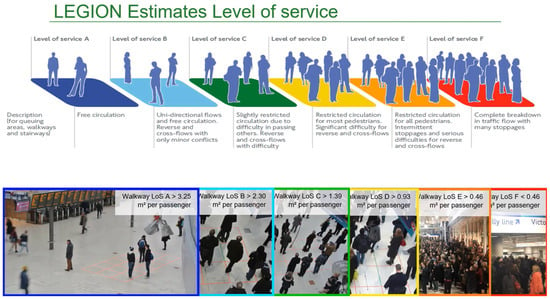
Figure 10.
LOS used in LEGION to represent the congestion in different mobility spaces [3,6].
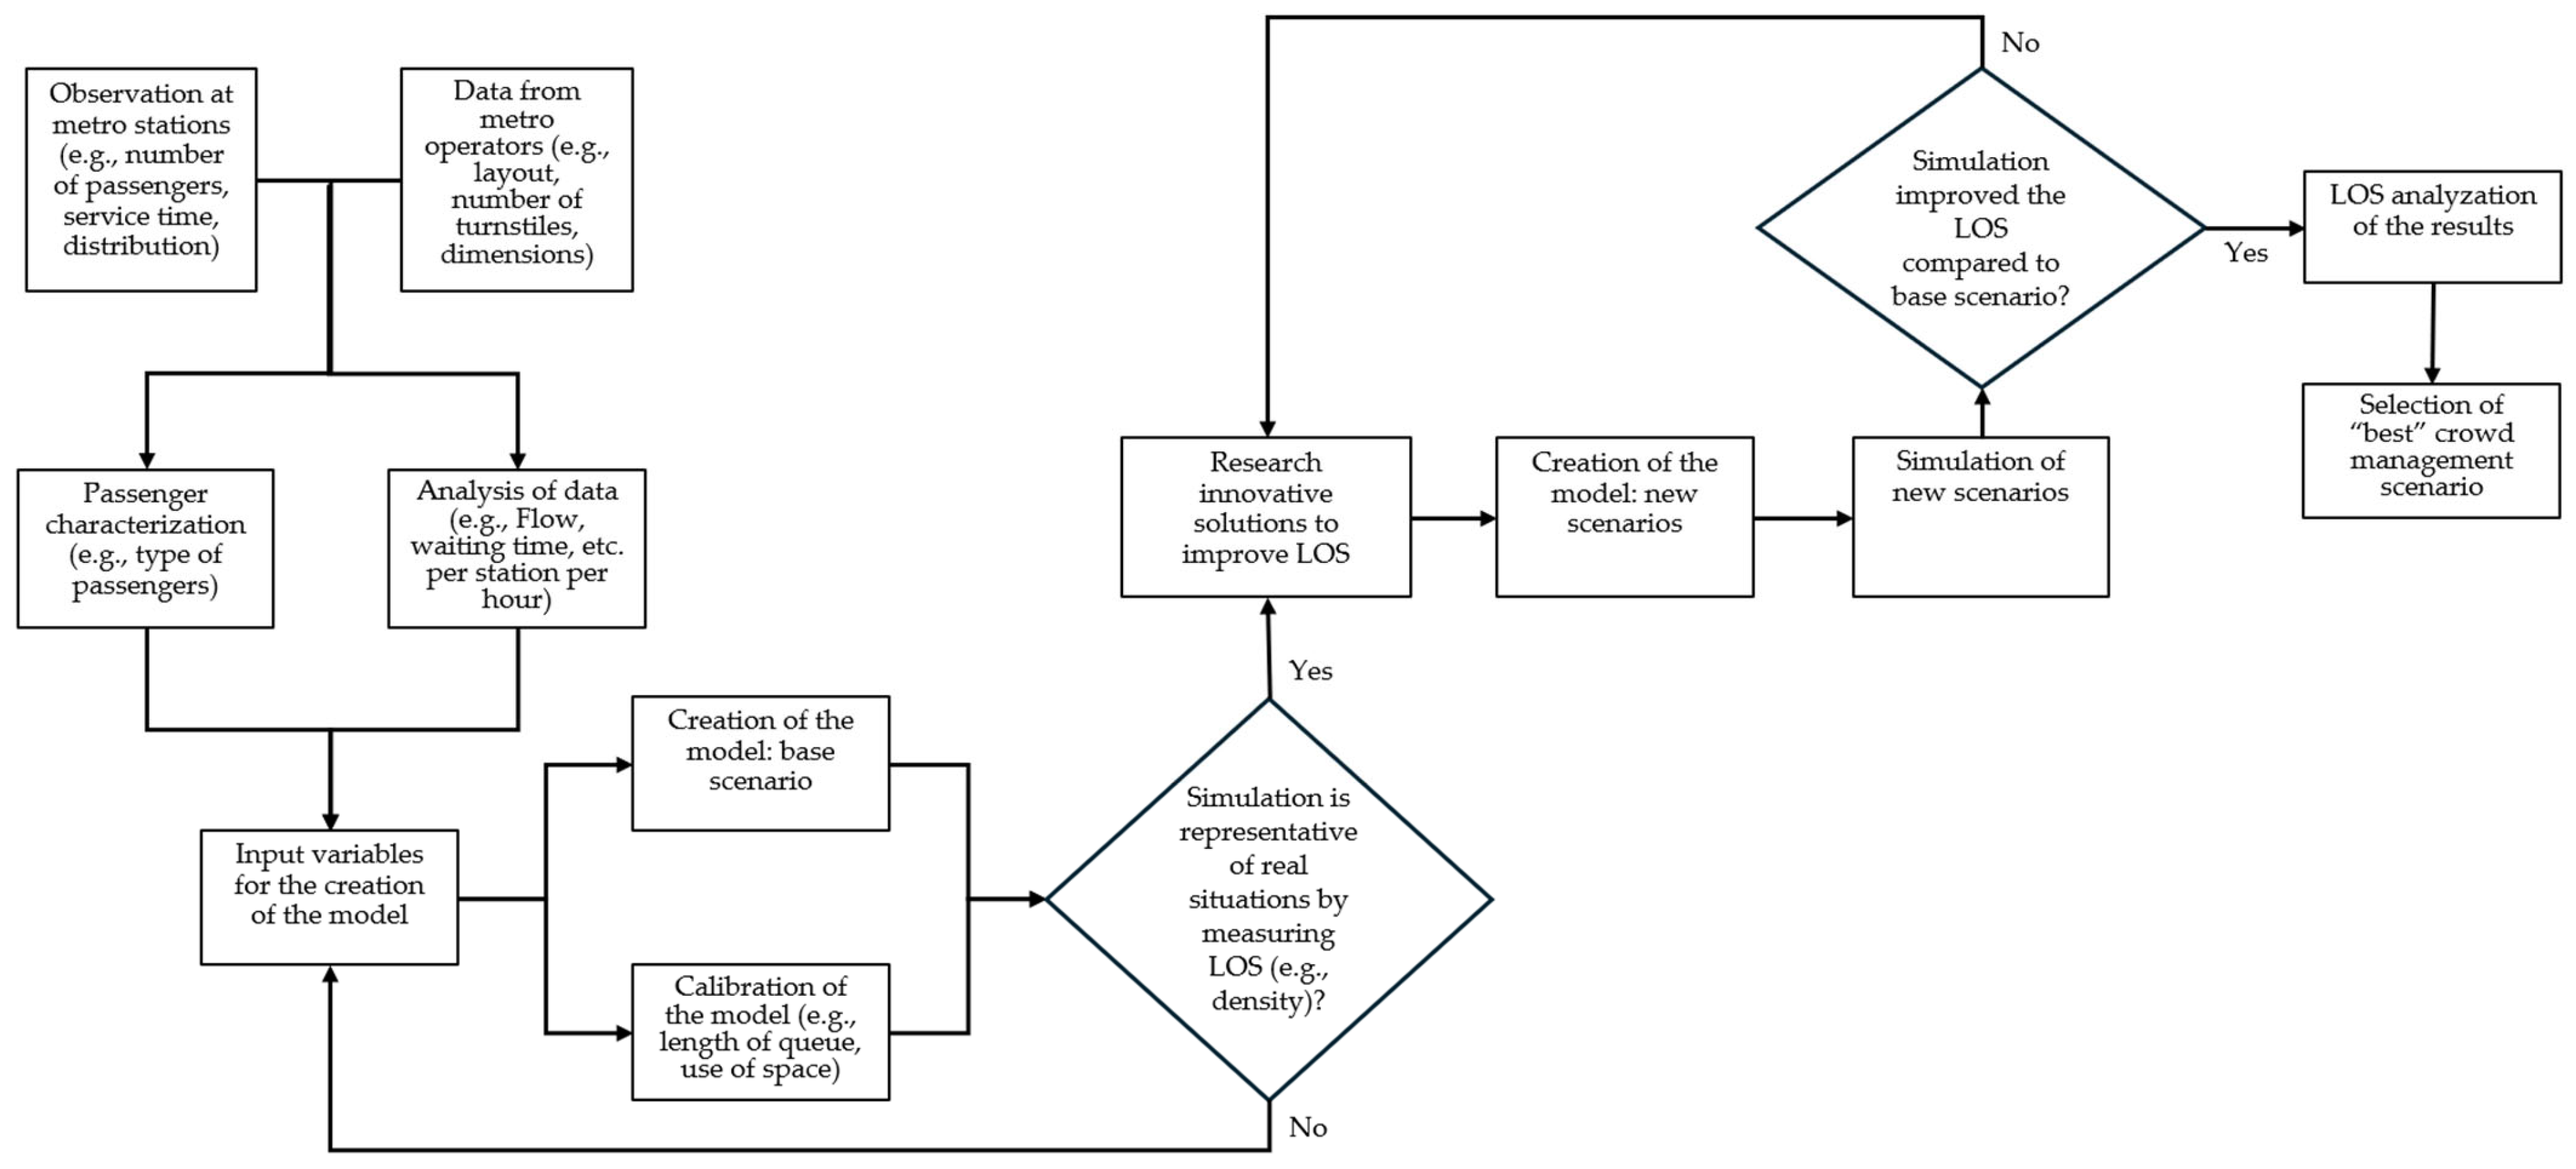
As a result of the previous steps, defined in the methodology of this research, Figure 11 illustrates the proposed sequence for decision-making aimed at identifying the most effective scenario that incorporates innovative crowd management solutions. This sequence outlines the process through which various crowd-management strategies are evaluated and compared, based on the data and insights gathered during the earlier phases of the study. It takes into account factors such as passenger flow, station layout, and peak-hour traffic, and uses simulations to assess how different solutions perform under varying conditions by analyzing the LOS. Ultimately, the goal is to identify the scenario that best addresses the challenges of overcrowding and therefore may ensure passenger safety and optimize the overall efficiency of the system. This approach provides a structured sequence for selecting the most appropriate and sustainable crowd management strategies.
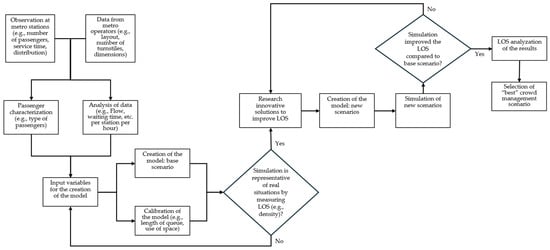
Figure 11.
Decision-making sequences to identify the “best” crowd management scenario based on observation and microsimulation at metro stations.
4. Results
4.1. Base Scenario
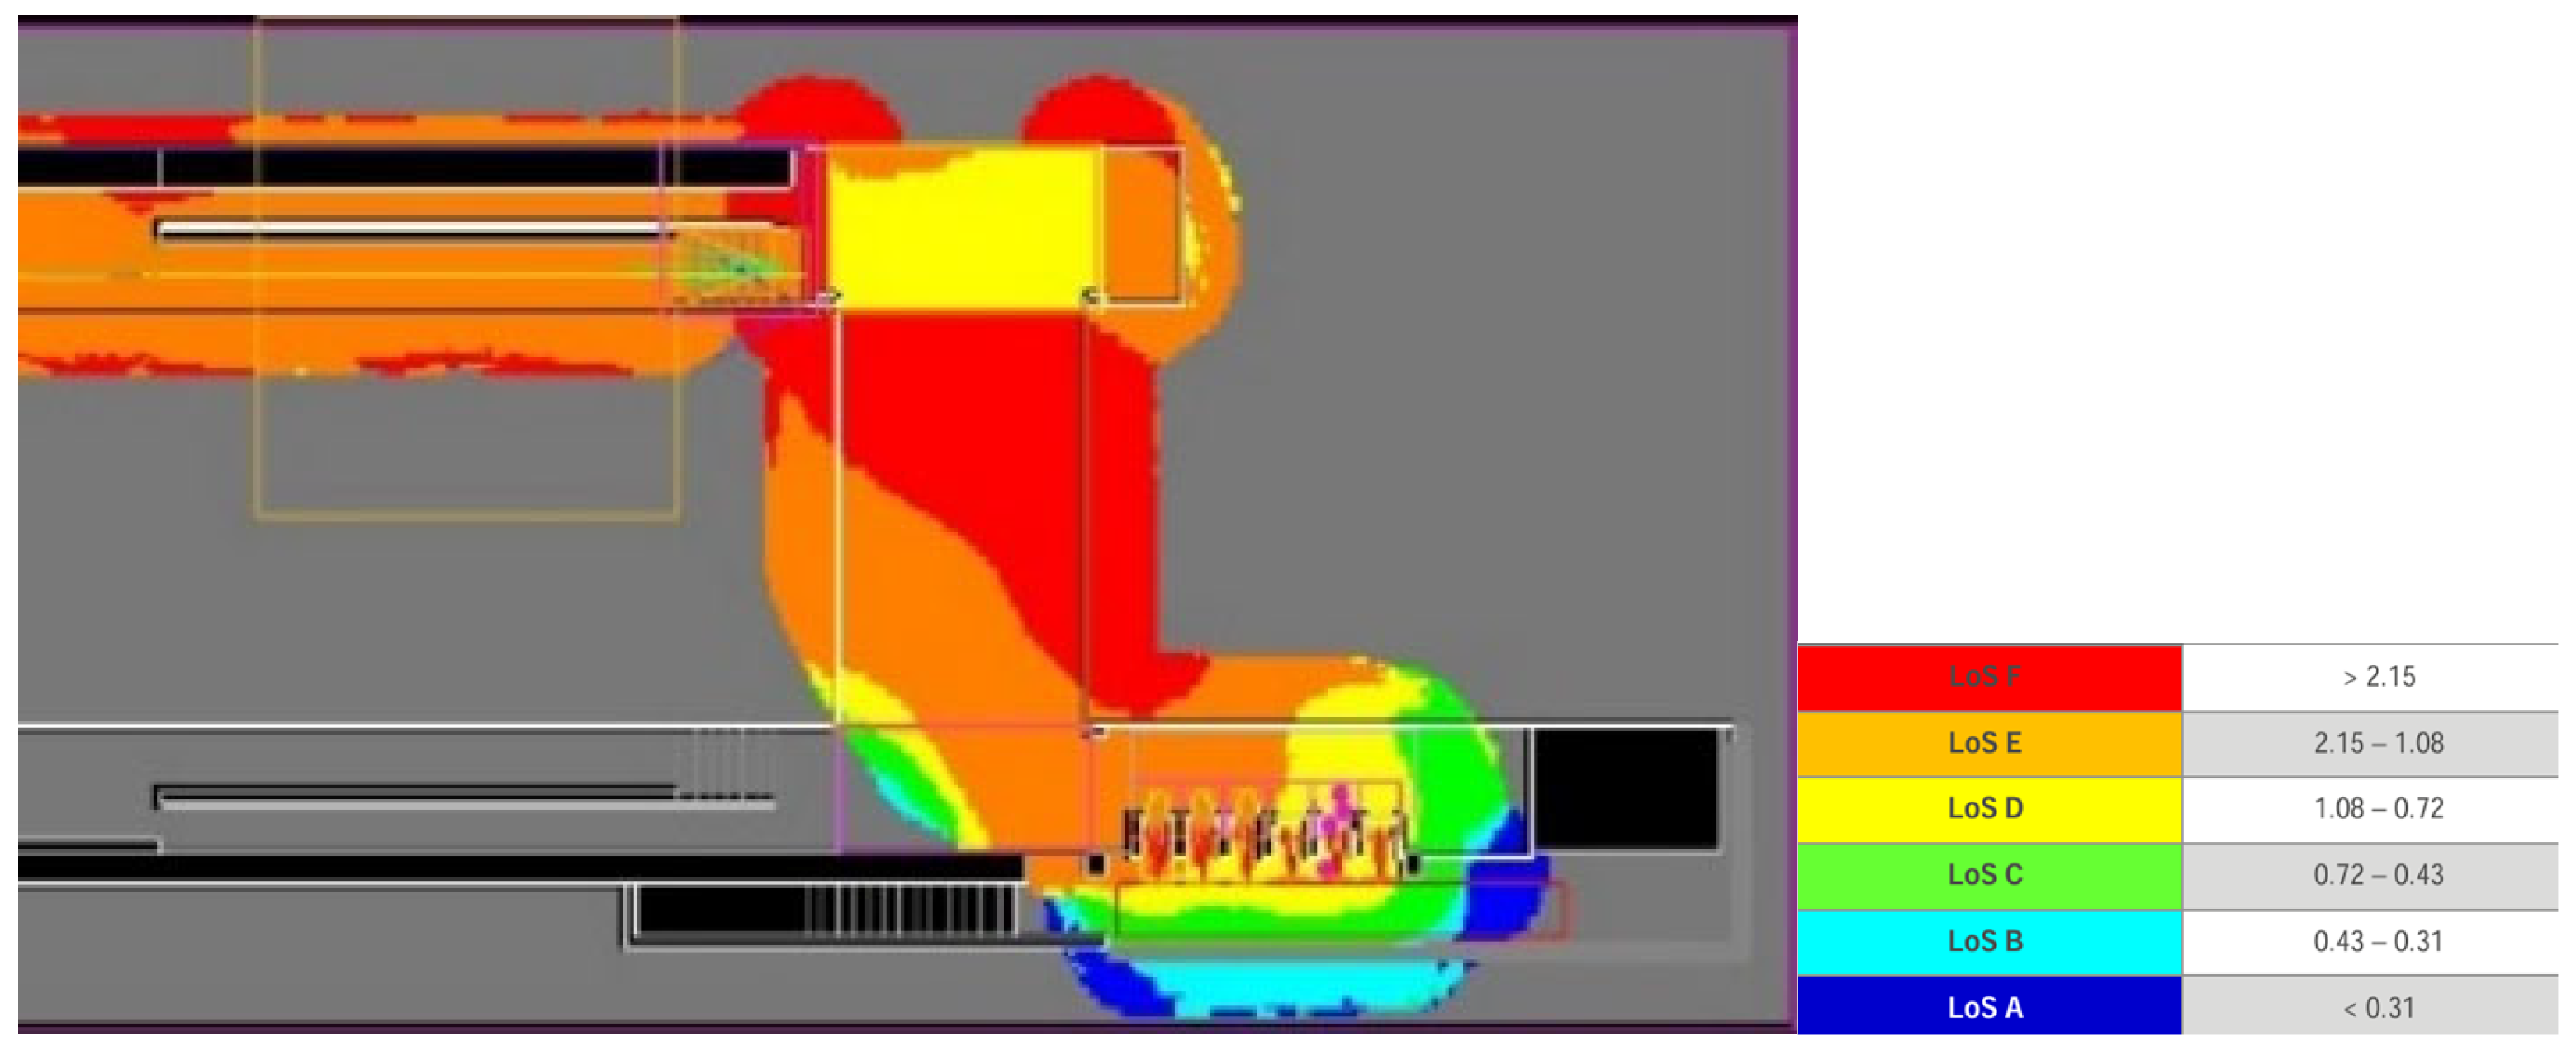
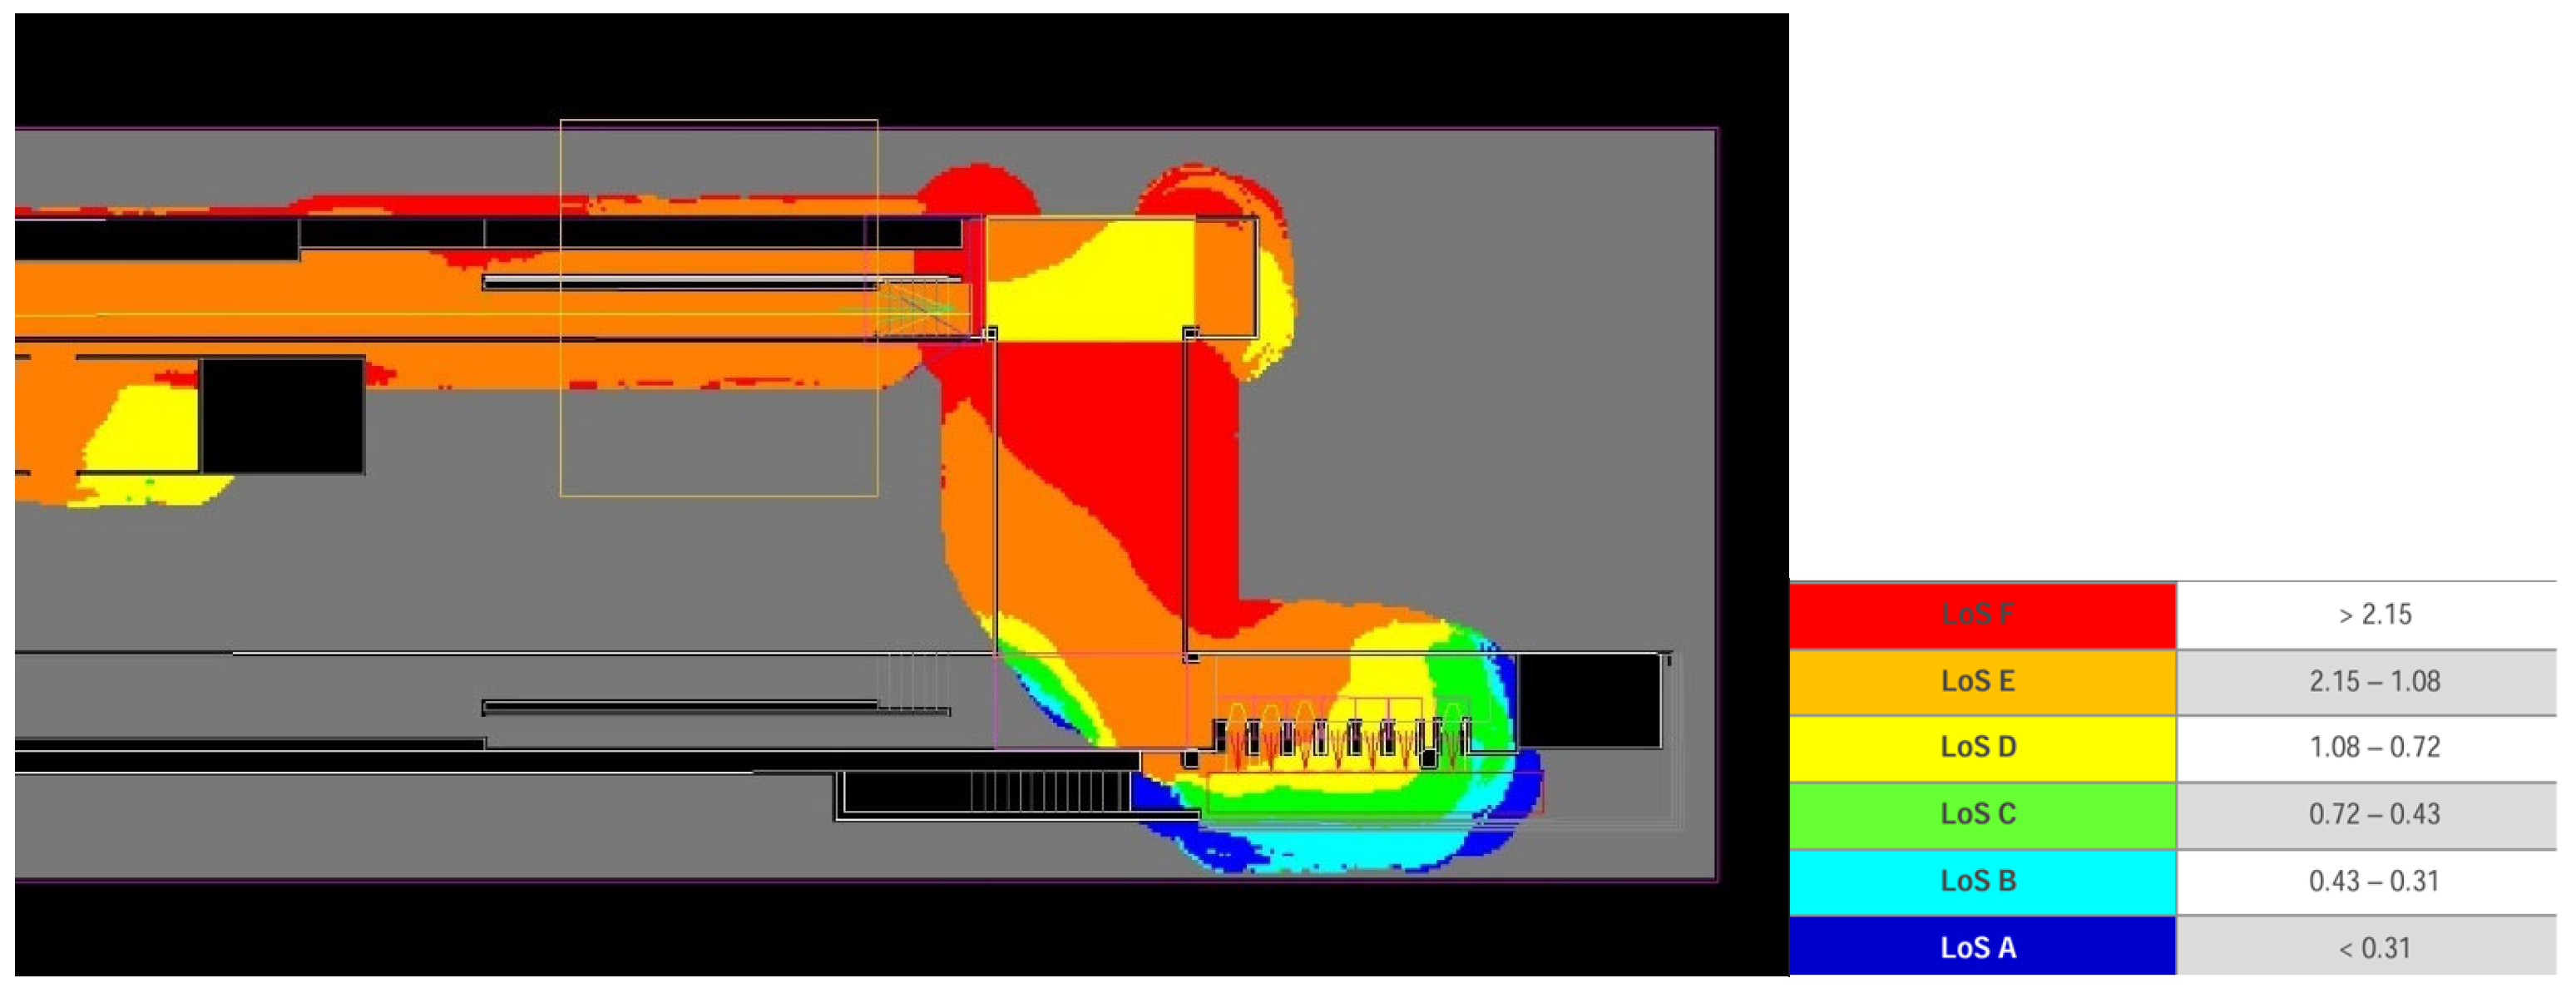
Figure 12 shows the Base Scenario. According to the simulation data, average densities of 1.13 (p/m2) persons per square meter are achieved in the rectangular area of the crossing over the railway tracks, which places us in the current situation with a service level of E (see Table 3 and Figure 13).
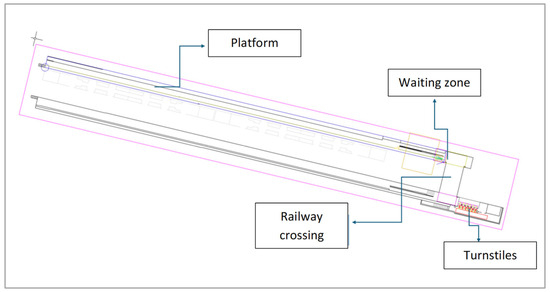
Figure 12.
Base Scenario layout using LEGION to represent different mobility spaces at Francia station.

Table 3.
LOS obtained in Base Scenario at Francia station during the morning peak hour.
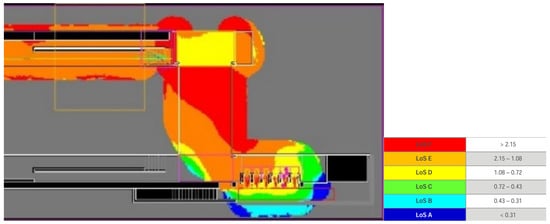
Figure 13.
Model LOS to represent the density in the Base Scenario at Francia station.
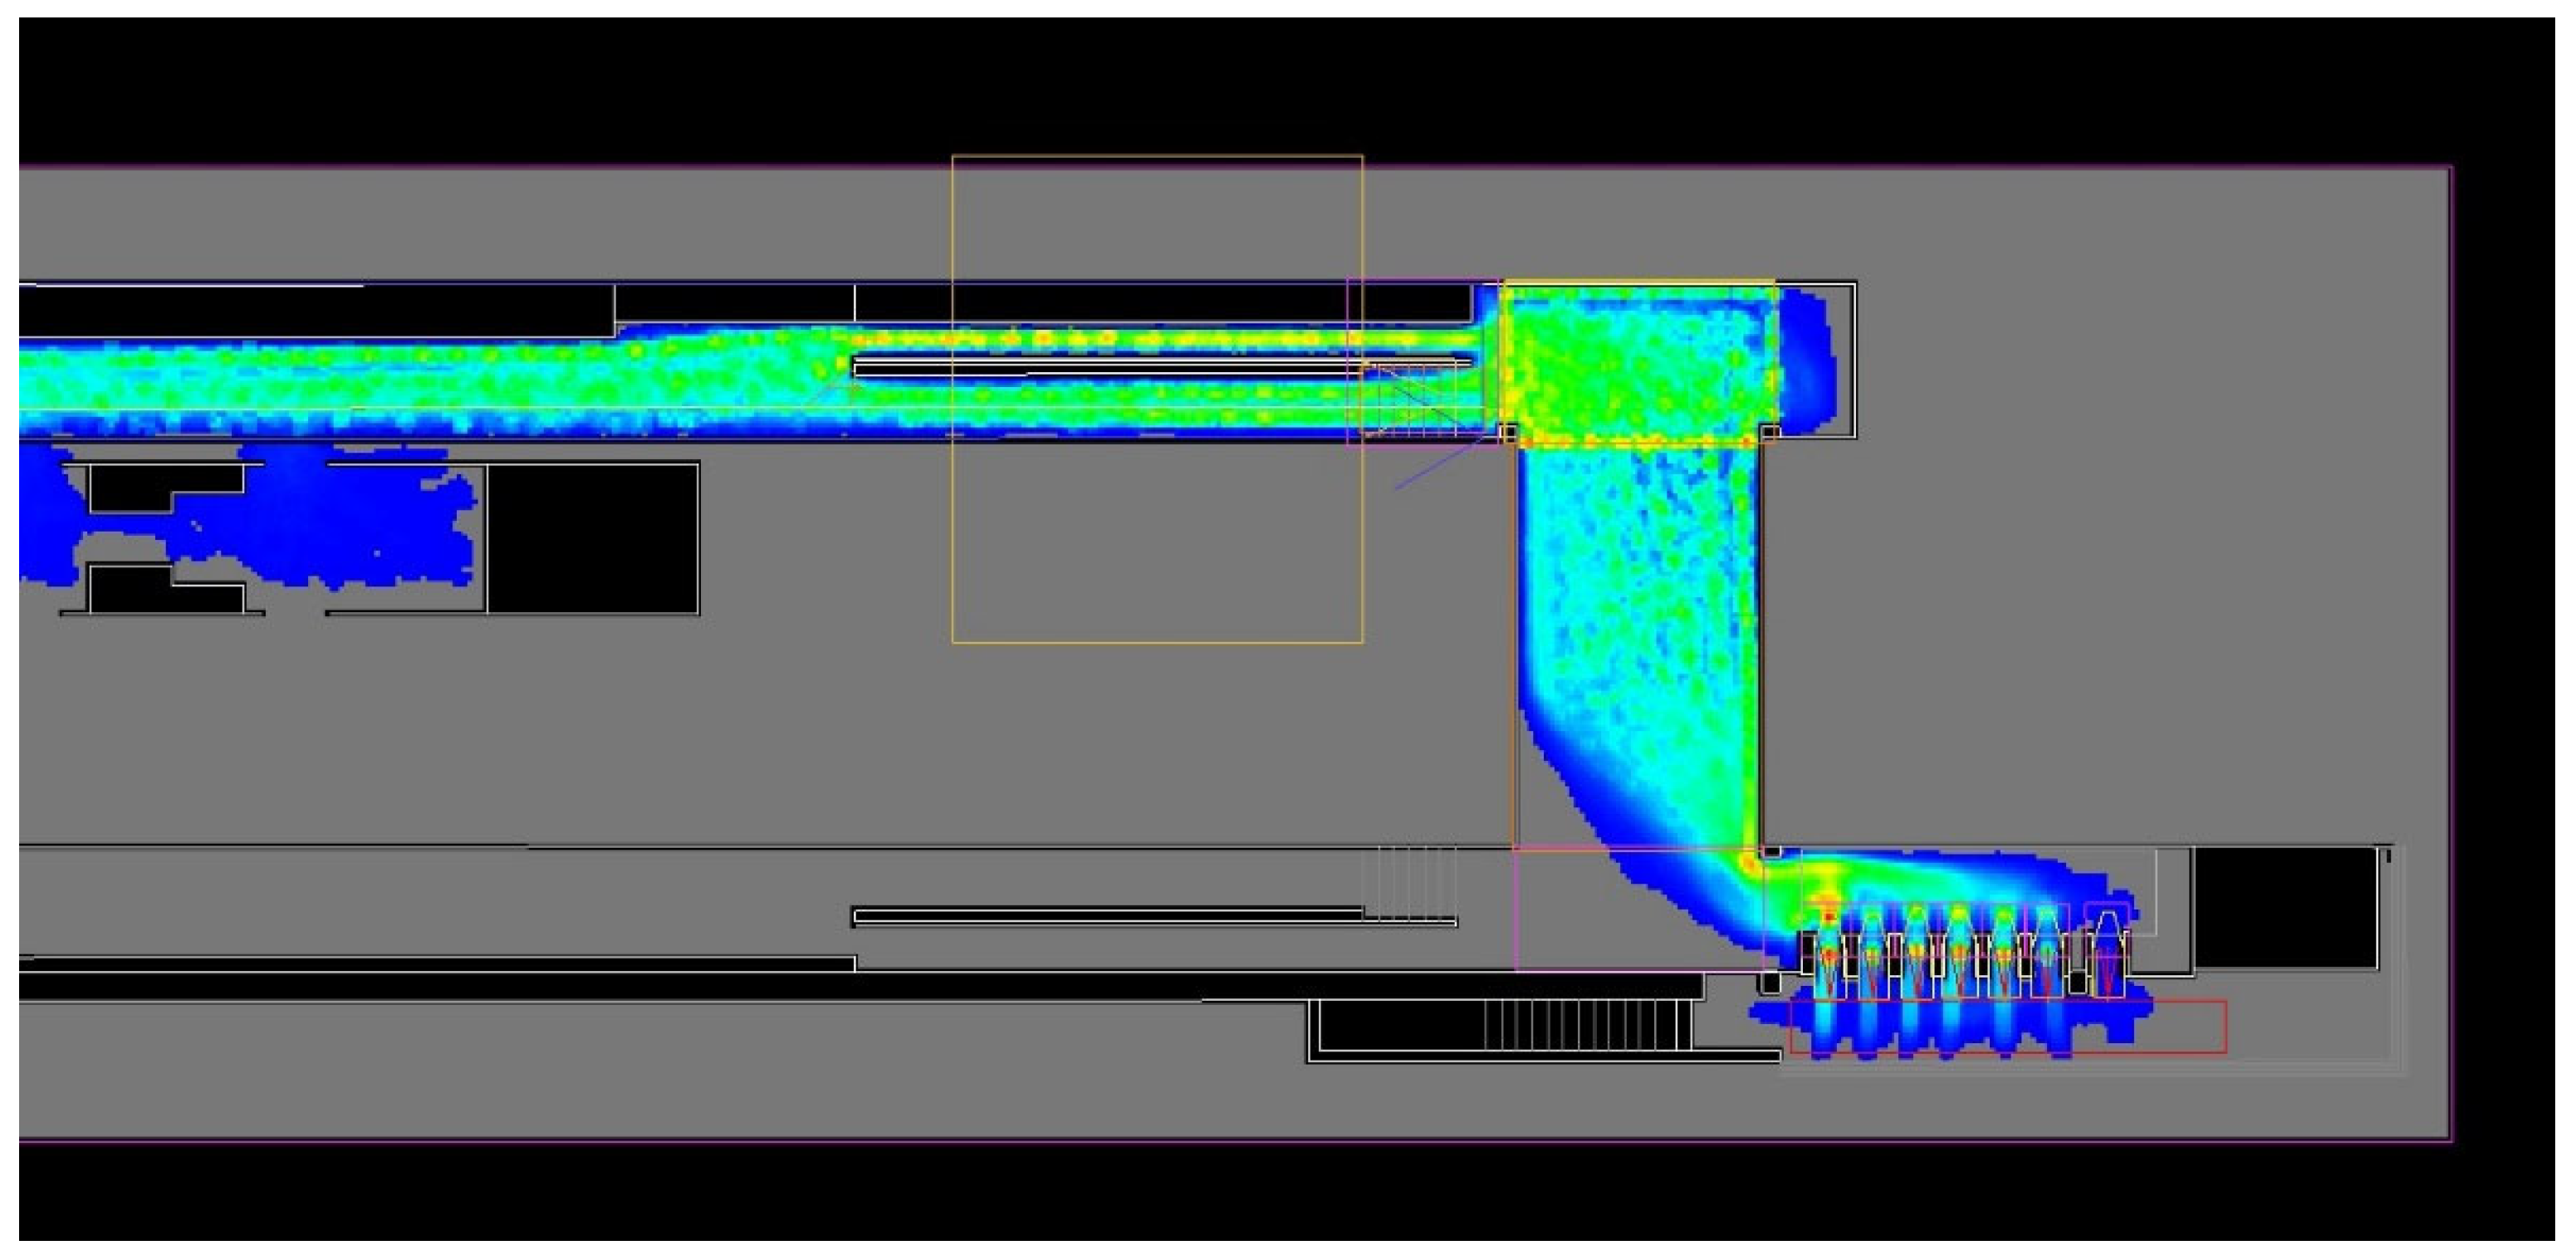
Regarding the turnstile usage percentages, the calibrated Base Scenario closely resembles reality, with minimal variations of 4%, as is the case with turnstiles 4, 5, and 6 (see Table 4). In addition, Figure 14 shows that there are areas of the space that are underutilized, particularly in the turnstile sector, where users do not use the entire space and avoid using the more distant turnstiles. Additionally, the usage of the crossing over the tracks is evident, where users tend to follow the principle of being drawn diagonally, taking the path of least effort, and utilizing the space in the lower corner.

Table 4.
Use of turnstiles in the Base Scenario at Francia station during the morning peak hour.

Figure 14.
Model space usage to represent the walking paths in the Base Scenario at Francia station.
With respect to the evacuation times provided by the simulation, an approximation to be used as a baseline for comparison with the proposed solutions is obtained. The time is measured from the moment the train doors open until the last passenger exits through the turnstile. An analysis zone is also created at the crossing over the railway tracks, where the average speed per passenger discharge is calculated. The following results are provided in meters per second. The low average speed indicates a risk of congestion at the crossing, especially if multiple trains arrive simultaneously or if the area is not evacuated efficiently (see Table 5).

Table 5.
Evacuation time and speed of passengers in the Base Scenario at Francia station during the morning peak hour.
4.2. Improved Scenarios
For this work, three modeled scenarios of potential innovative solutions are presented in the search to improve passenger flow and service levels during evacuation.
4.2.1. Number of Turnstiles
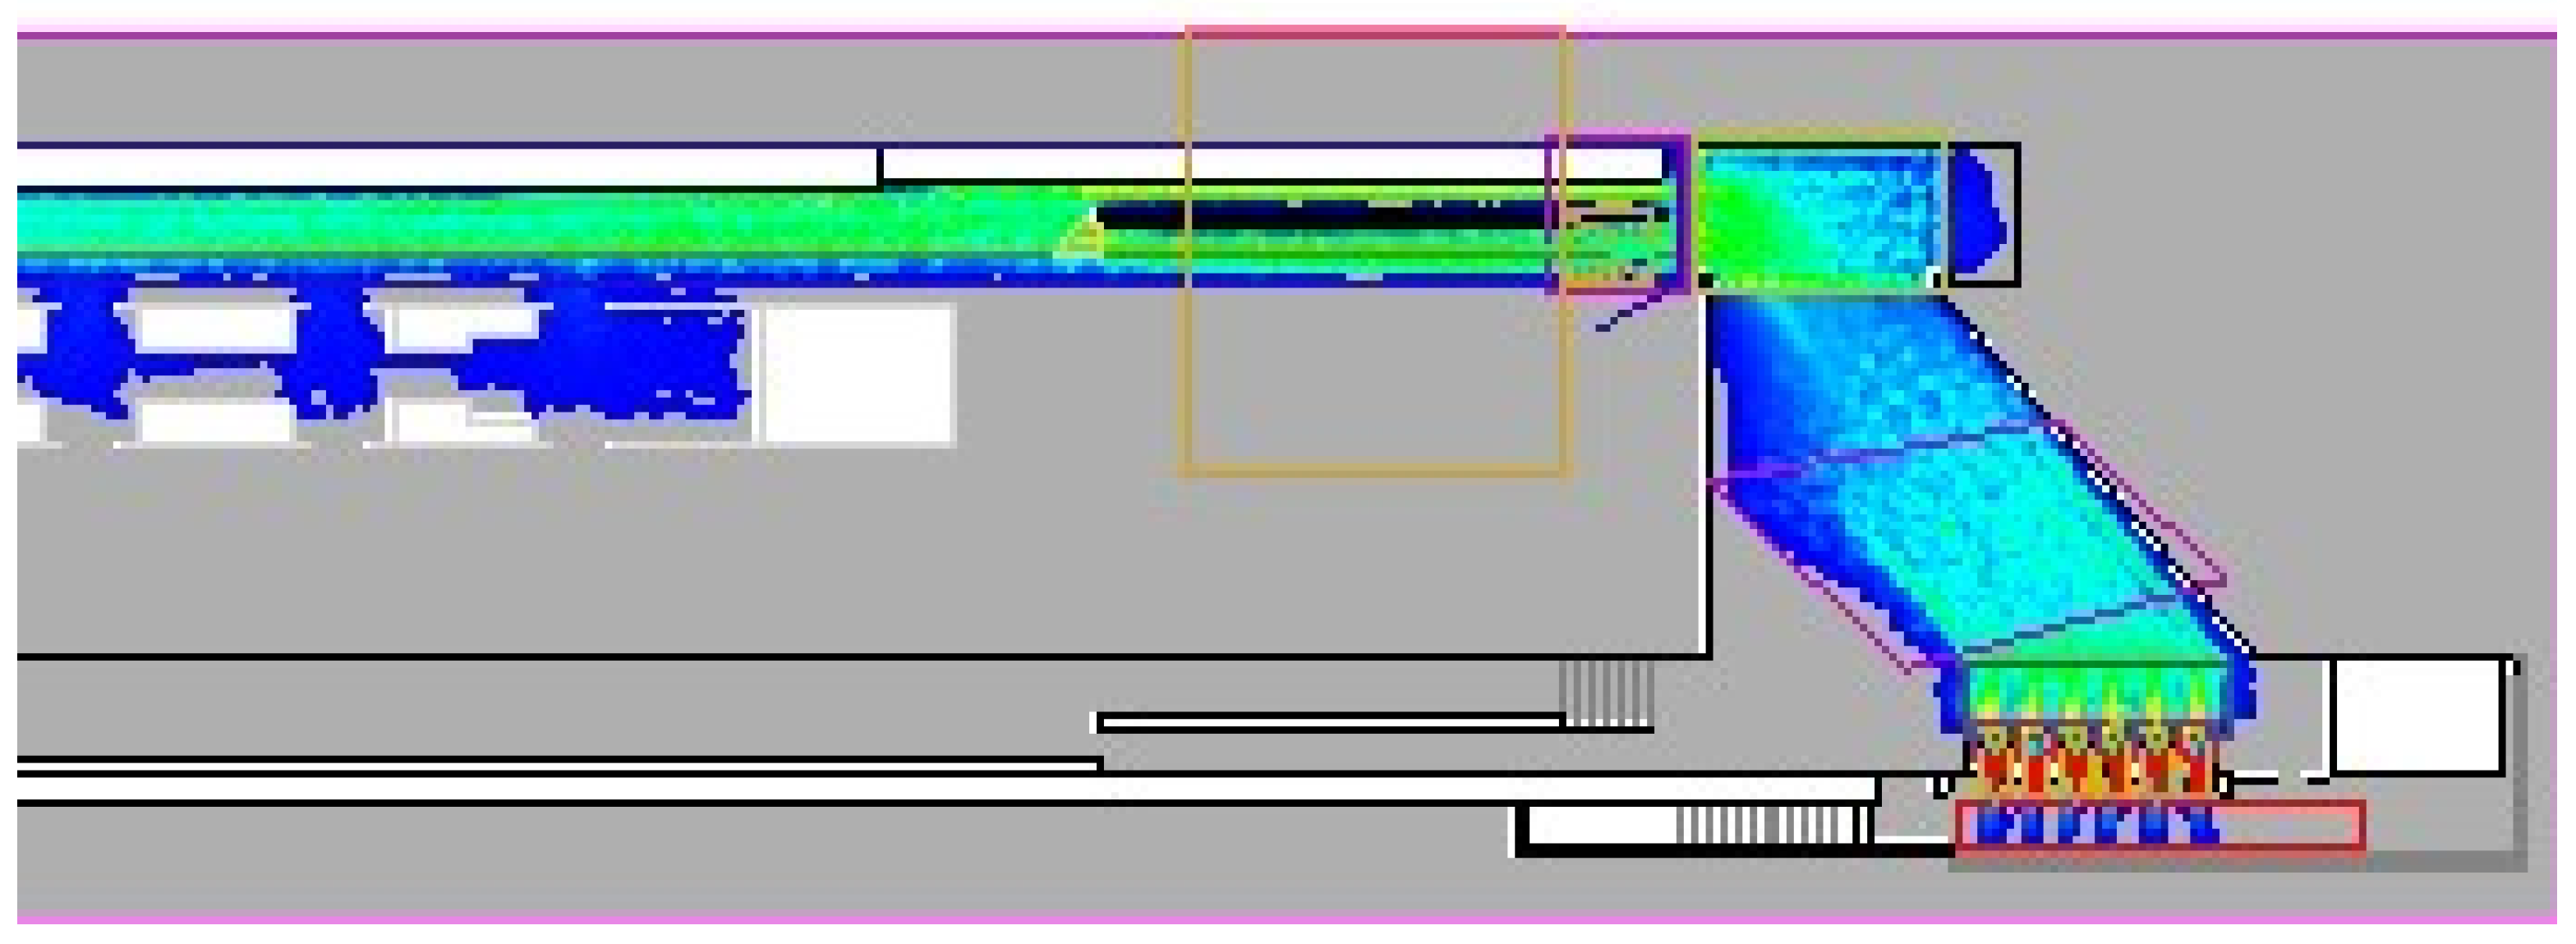
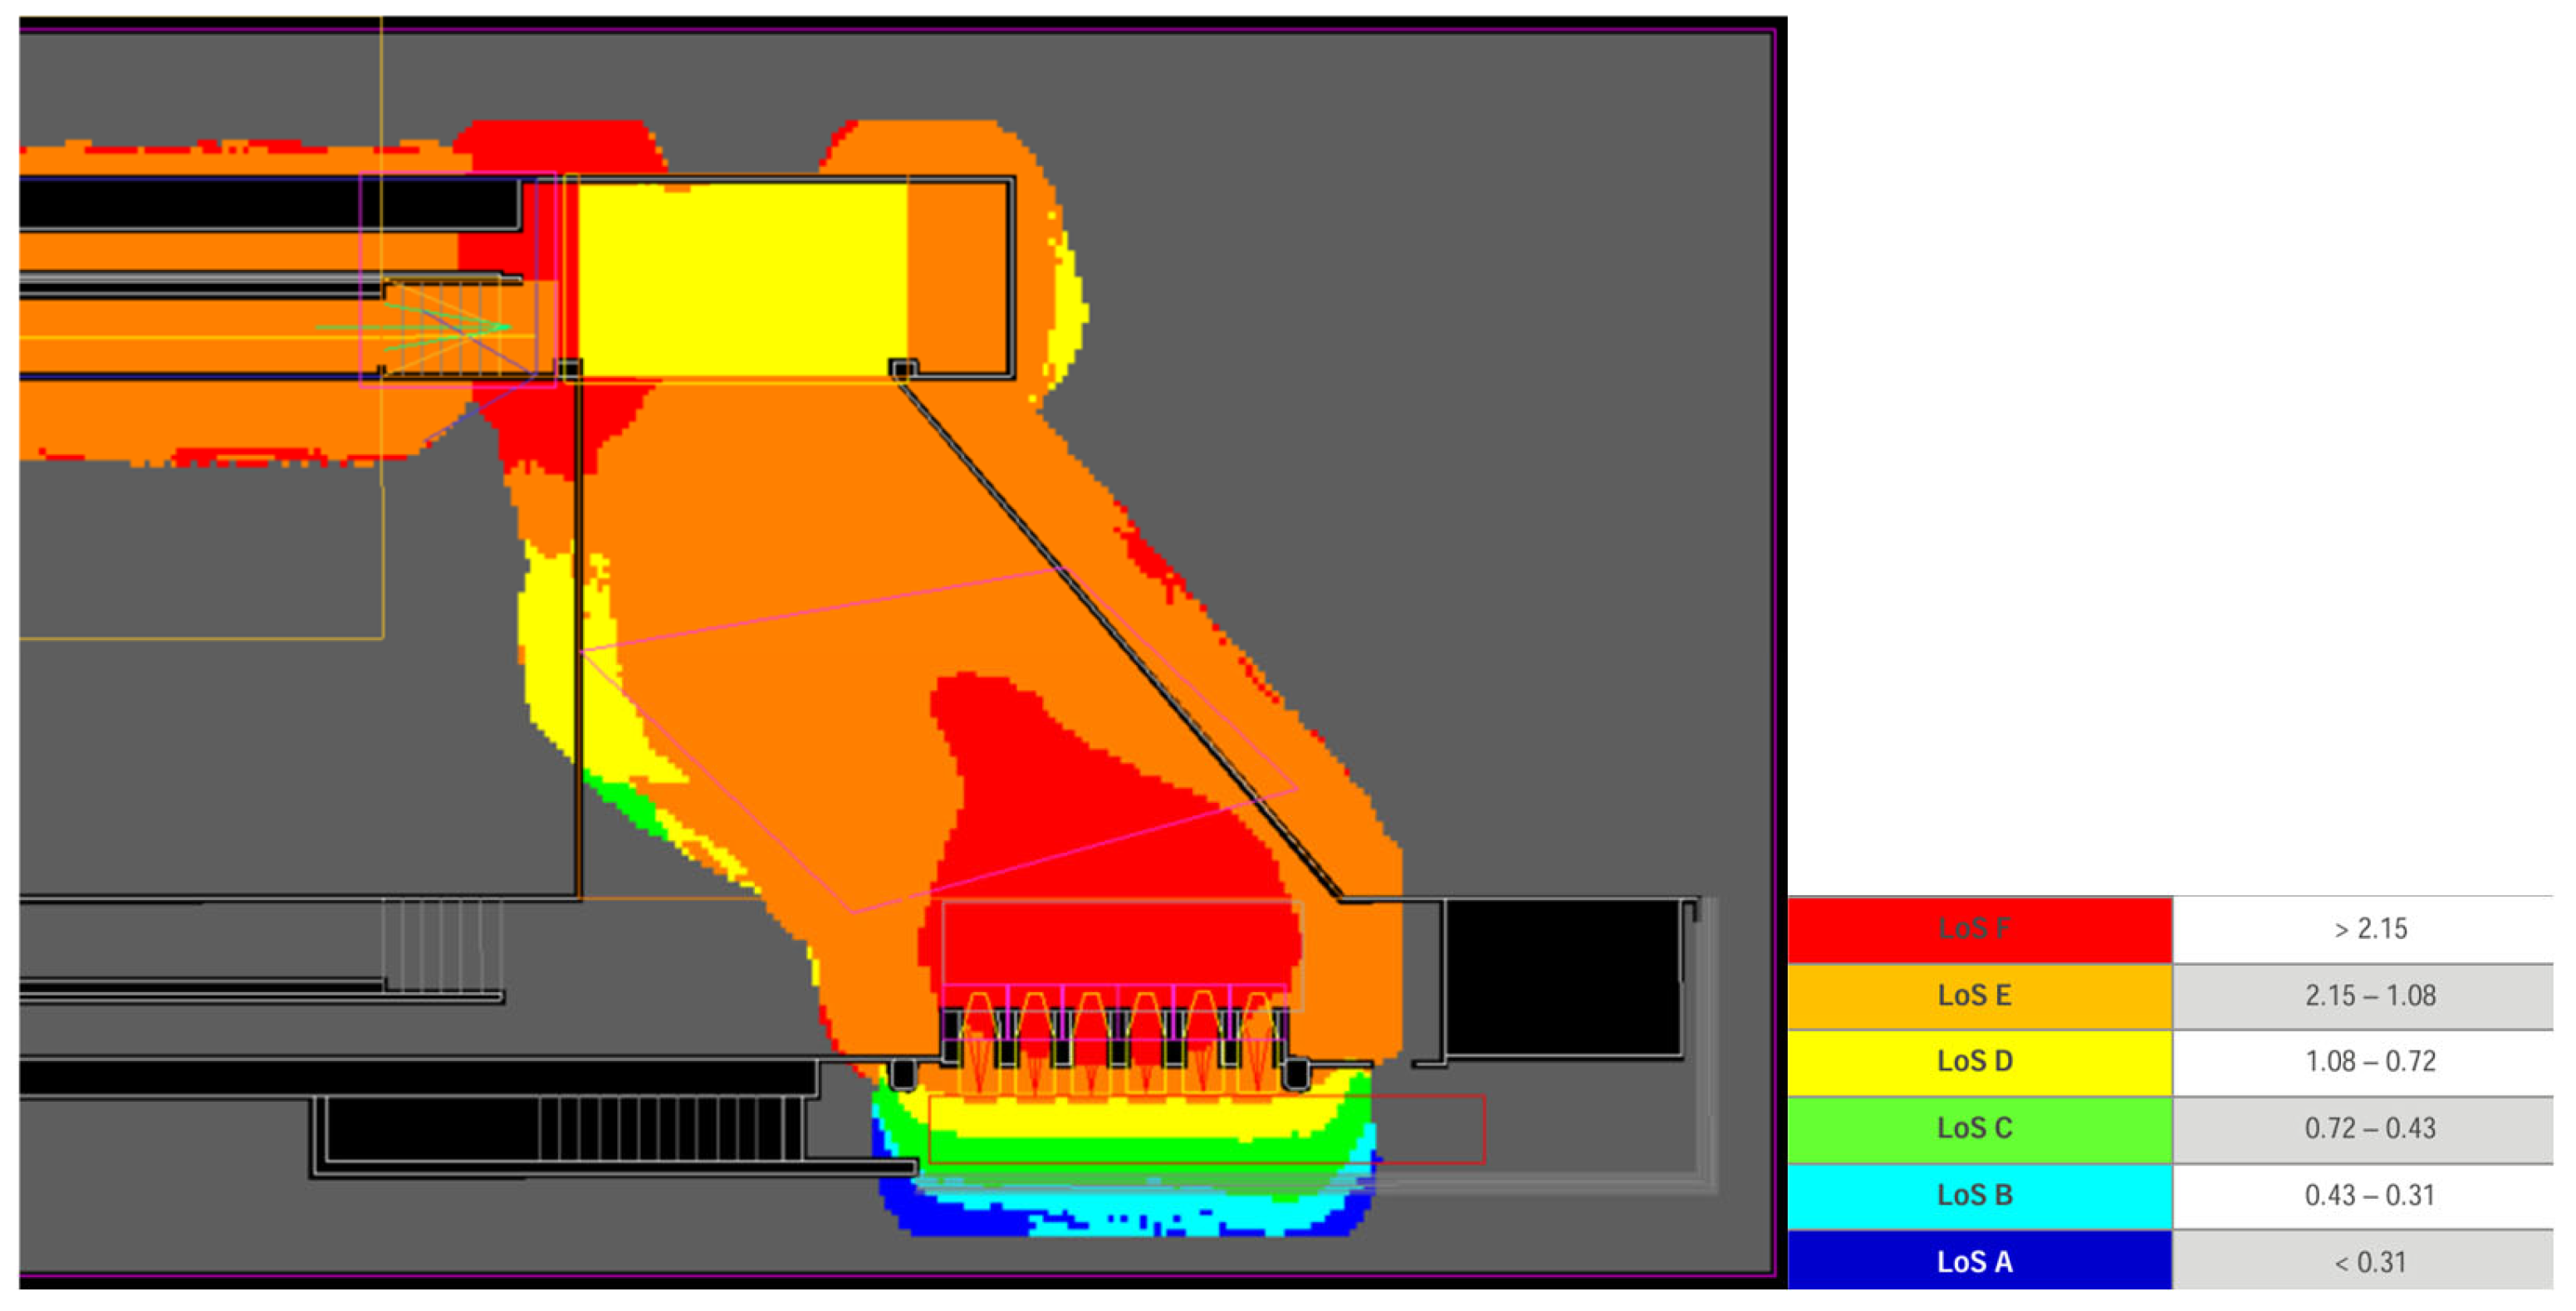
The first scenario, “Scenario A” consists of an addition of 1 more turnstile to the current design. This is often the most intuitive solution to a capacity problem. Due to the station’s physical limitations, this turnstile can only be placed next to the universal accessibility door, in the area farthest from the railway track crossing.
In the case of Scenario A, the addition of one more turnstile at the farthest end shows that there is no change in its usage. It follows the same trend of reduced use as the turnstile becomes farther from the railway track crossing (see Figure 15).
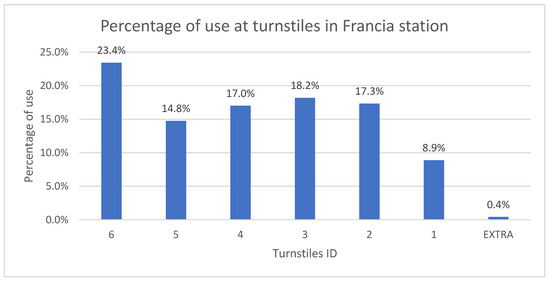
Figure 15.
Turnstile usage in Scenario A with an extra turnstile (Francia station).
In terms of space usage, the underutilized areas in Scenario A remain unchanged, indicating that the addition of a new turnstile did not significantly impact how passengers distribute themselves throughout the station. Despite the increased capacity offered by the new turnstile, passengers still tend to gravitate toward the turnstiles closest to the railway track crossing, leaving the more distant turnstiles and other available spaces underused. This suggests that additional measures, beyond merely adding infrastructure, may be needed to encourage a more balanced distribution of passenger flow across the entire platform and improve overall space utilization. In addition, the service levels remain the same in both the crossing area and the waiting area before the railway track crossing. These areas continue to experience the same flow patterns and congestion levels observed prior to the modification, indicating that the changes made do not significantly alter the overall passenger behavior in these zones. The only noticeable change occurs at the newly added turnstile, where service levels improve markedly. This is primarily due to the turnstiles’ almost nonexistent usage by passengers, as most passengers continue to prefer the turnstiles closer to the crossing point, leading to the underutilization of the newly added infrastructure. This suggests that while the additional turnstile provides additional capacity, it does not effectively address the existing patterns of passenger movement, which are more influenced by convenience and proximity than by increased capacity alone (see Figure 16 and Figure 17).
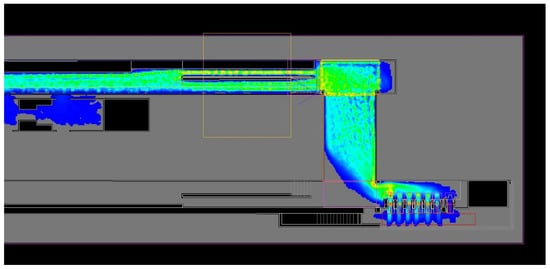
Figure 16.
Model space usage to represent the walking paths in Scenario A at Francia station.
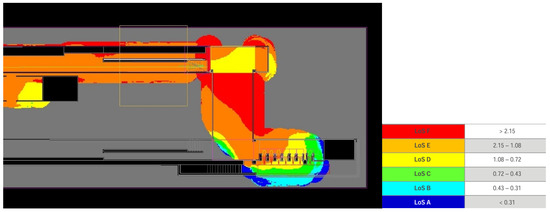
Figure 17.
Model LOS to represent the density in Scenario A at Francia station.
4.2.2. Diagonal Crossing
The second scenario, Scenario B, is composed of a diagonal crossing. For the second improvement proposal, the scenario of modifying the crossing over the railway tracks is simulated. It is proposed to create a diagonal crossing, following the principle of least effort and the pedestrian behavior observed both in the simulation and during field observations.
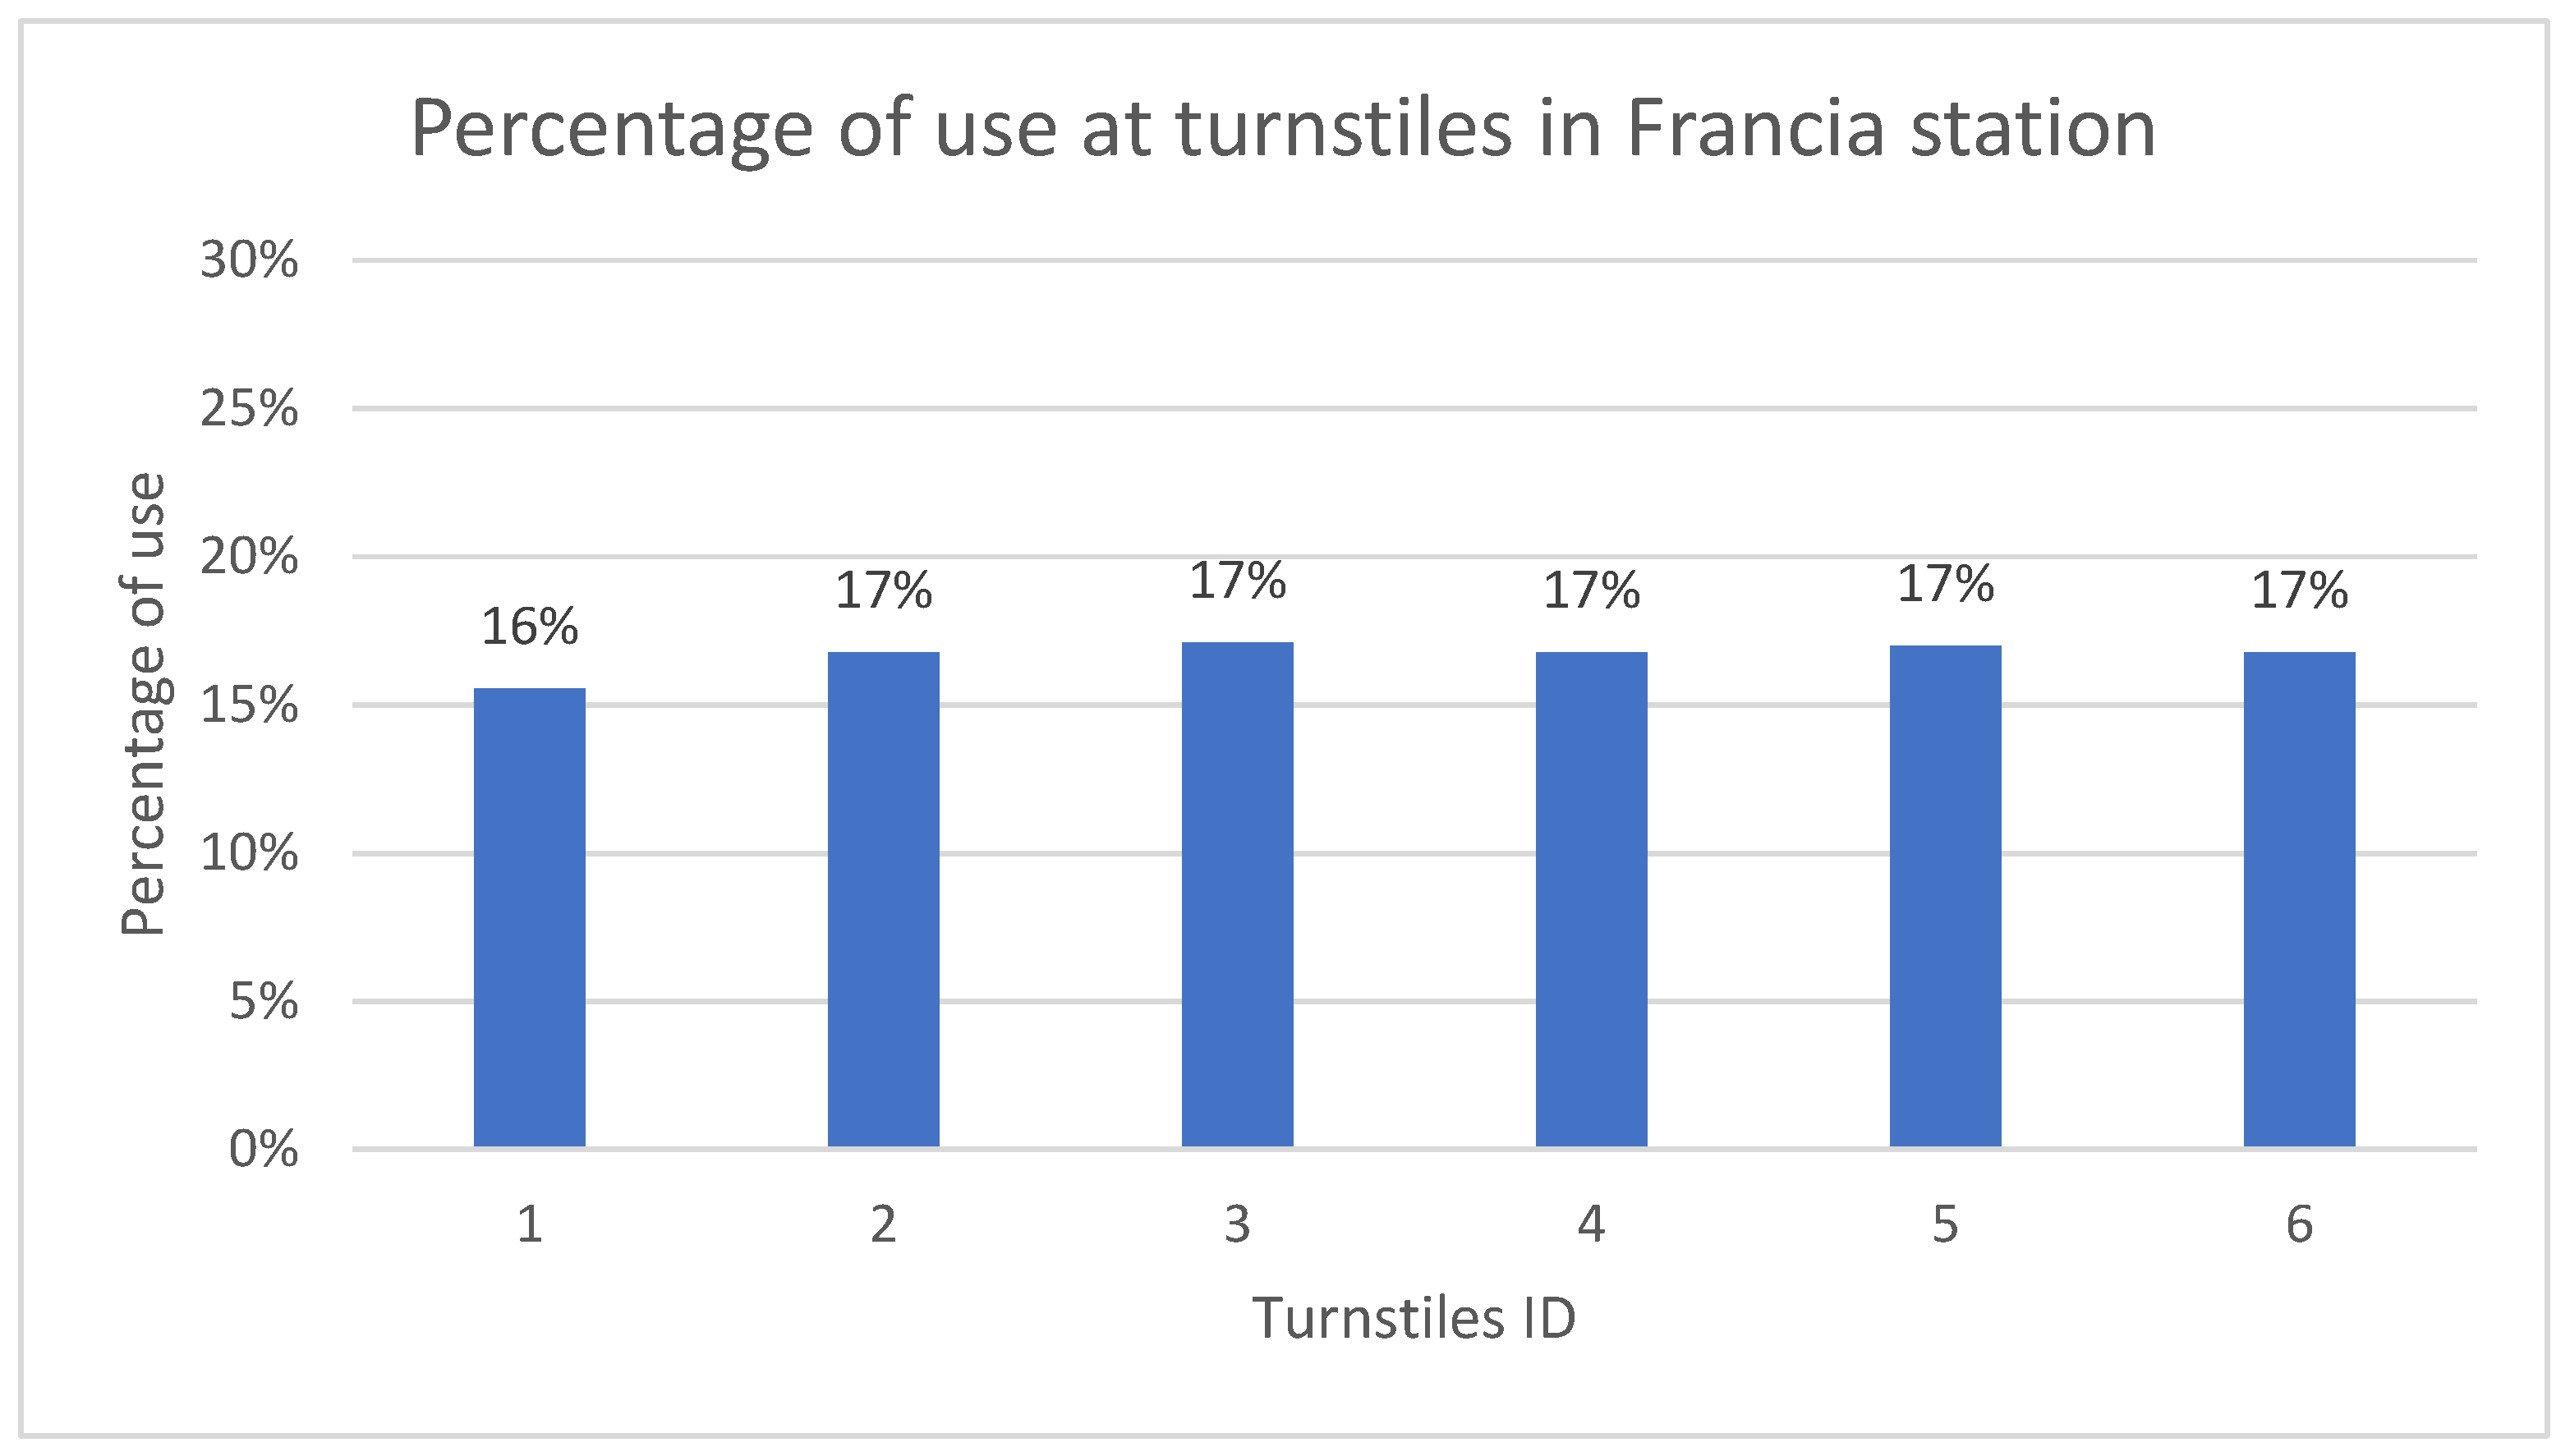
On the other hand, in the case of Scenario B, the distribution of the turnstile usage percentage is quite uniform, with only a slight variation observed in Turnstile 6, which shows a usage rate of 16%, compared to the 17% seen in the other turnstiles (see Figure 18). This indicates a positive shift in how the turnstiles are being used, particularly for the ones that currently experience the least usage in the existing scenario. The more balanced distribution suggests that the changes implemented in this scenario, such as the strategic positioning of the additional turnstile or other adjustments, have contributed to a more efficient use of the available infrastructure. This improvement could help reduce congestion and enhance the overall passenger flow, especially in areas where bottlenecks were previously a concern. By optimizing the usage of all turnstiles, this scenario demonstrates an effective approach to addressing underutilized resources, leading to a better overall service experience for passengers (see Figure 18).
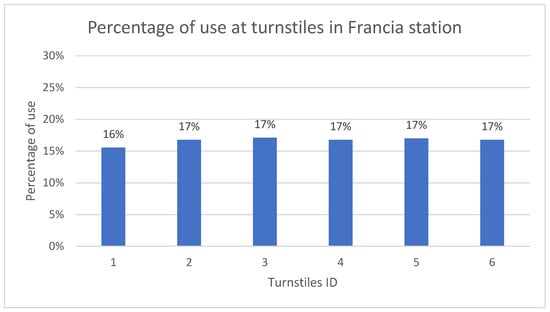
Figure 18.
Turnstile usage in Scenario B with a diagonal crossing over the railway track (Francia station).
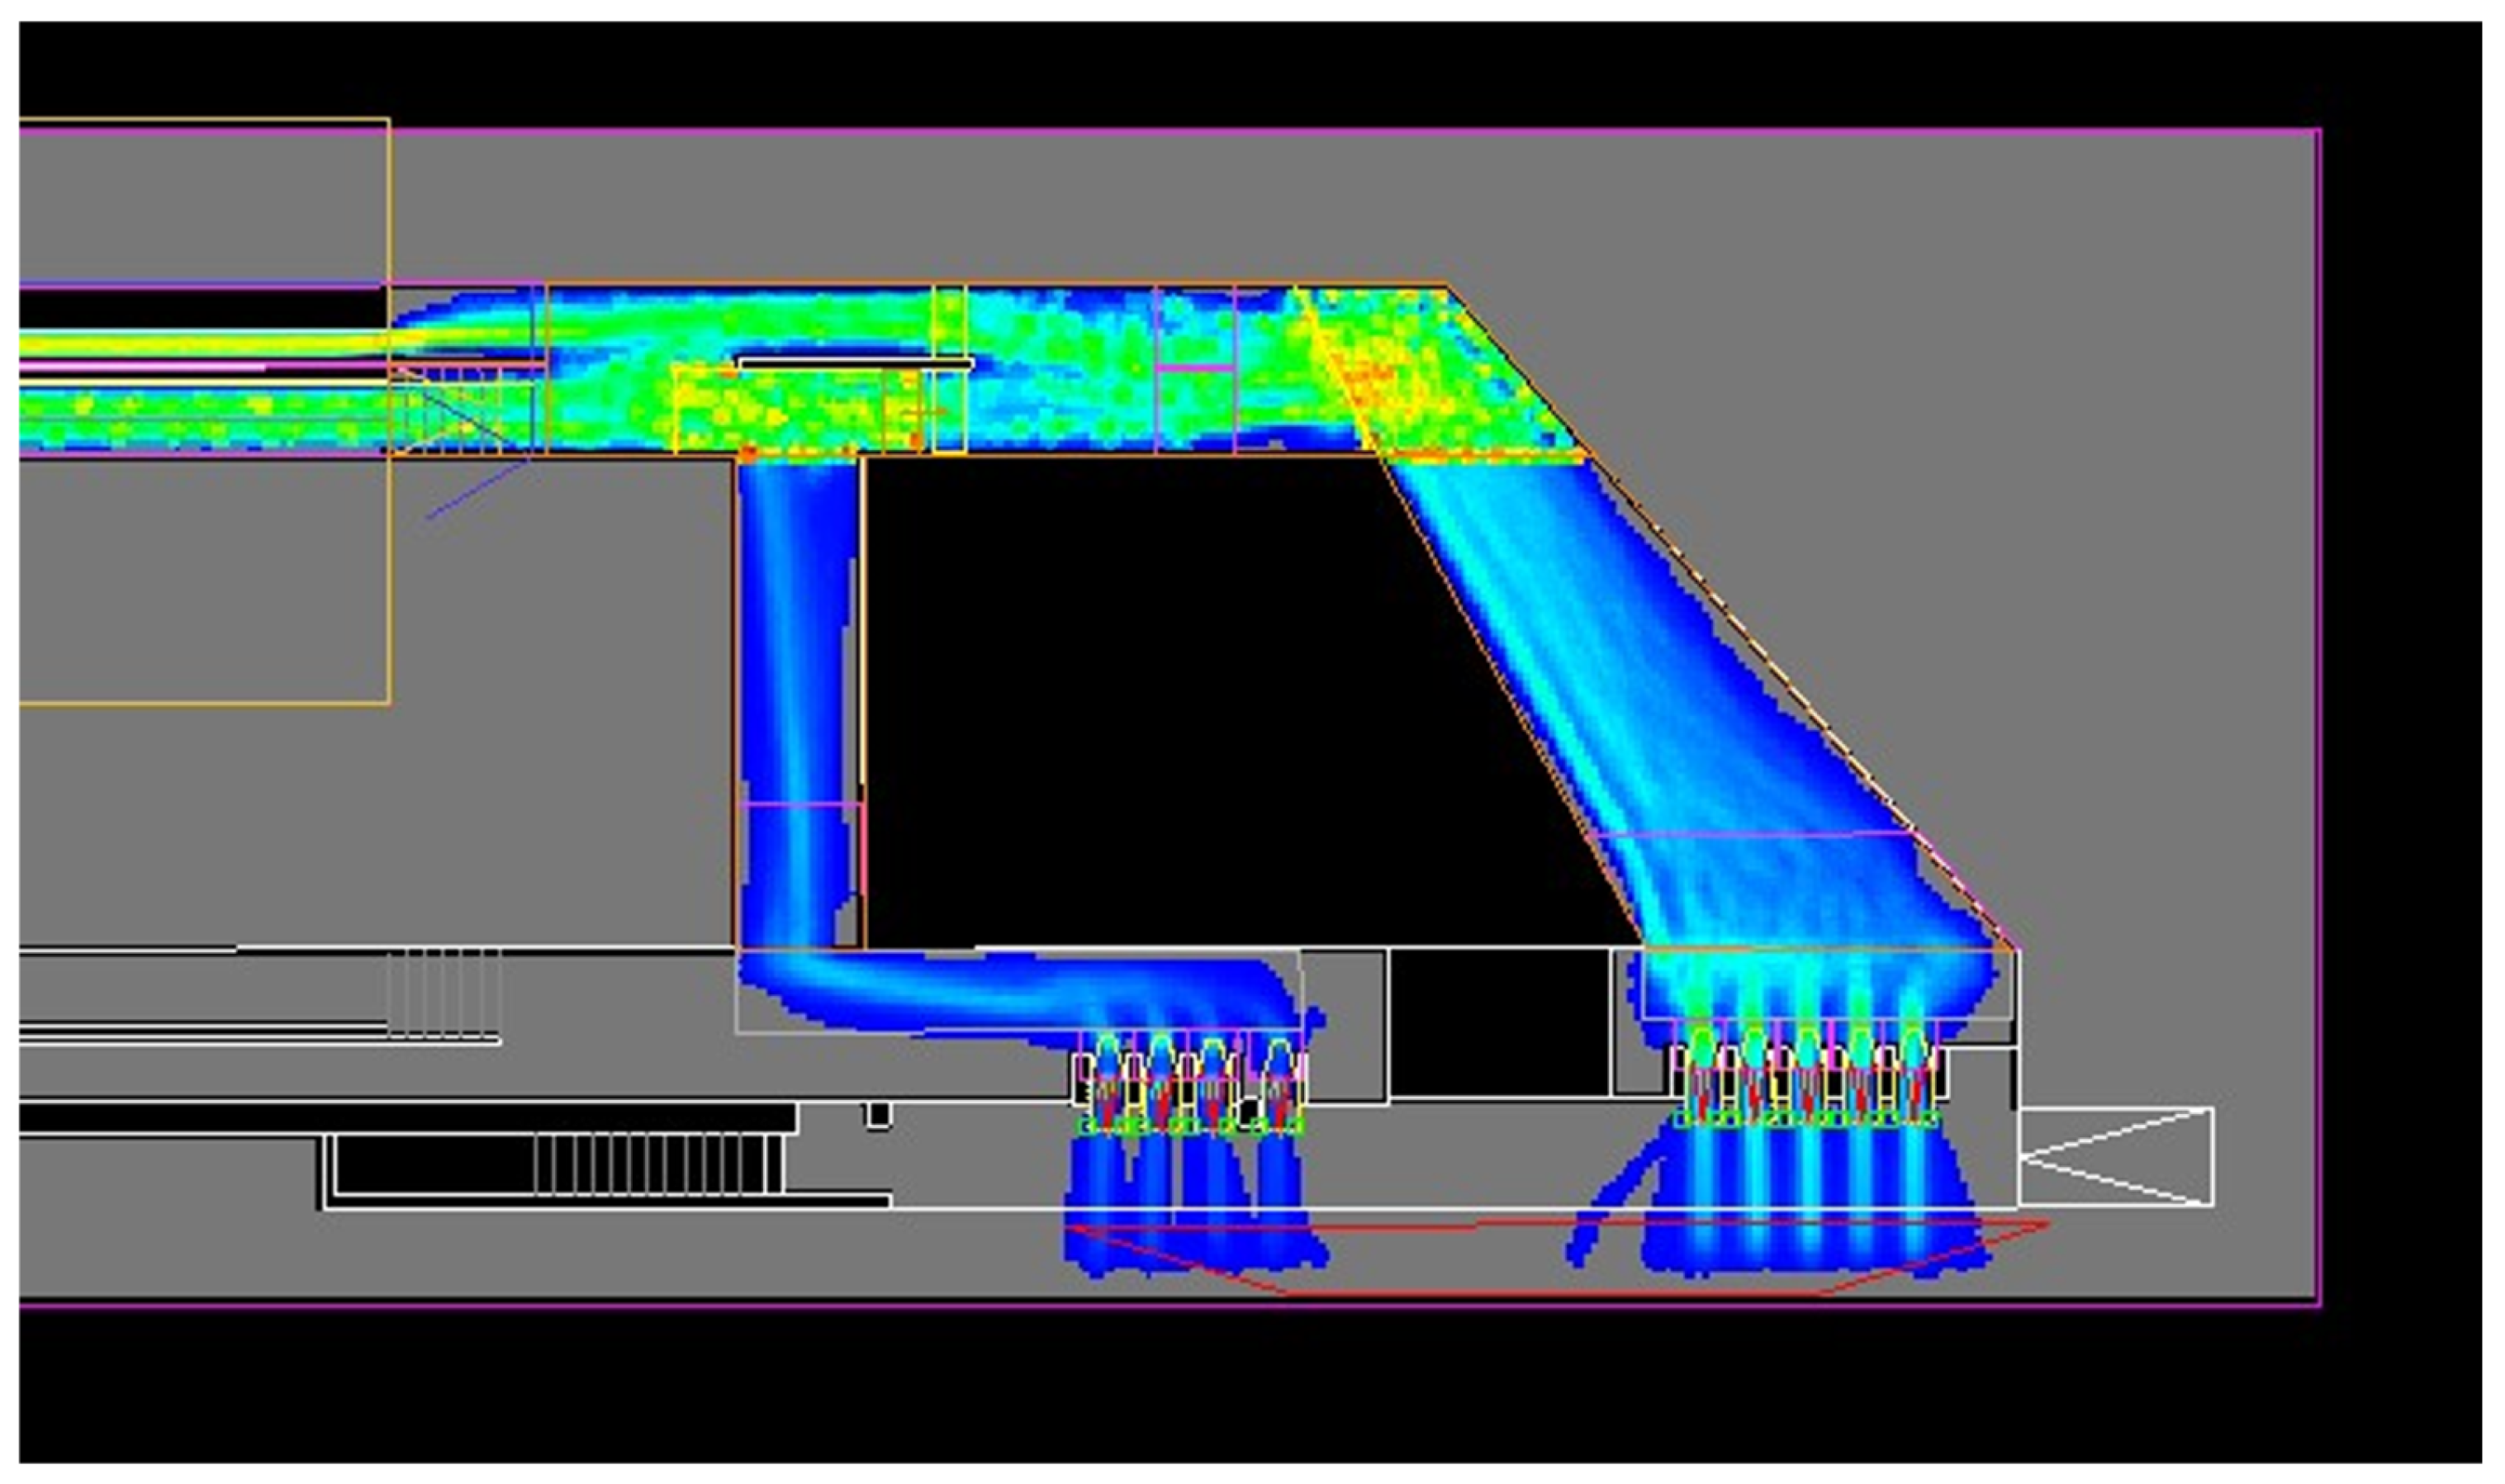
The use of space in Scenario B changes considerably, with previously underutilized areas now being actively utilized. This shift in space usage becomes especially noticeable in the sector before the turnstile area and in the crossing over the railway tracks. Previously, these areas had experienced lower passenger density and were often left idle, contributing to inefficient flow and space usage. However, with the changes implemented, there is now a more even distribution of passengers throughout the station, which alleviates congestion in key areas and optimizes the flow.
In particular, the area before the turnstiles, which was once underused, now sees more foot traffic as passengers spread out more evenly, rather than clustering around the turnstiles closest to the crossing (see Figure 19). Similarly, the crossing over the railway tracks, which was previously a bottleneck, now sees better utilization, with passengers taking more direct and efficient routes, following the principle of least effort. These improvements not only enhance the overall passenger experience but also help to prevent delays and reduce the likelihood of congestion during peak times. This indicates that with strategic changes to space design and passenger movement, stations can significantly improve their operational efficiency without needing major infrastructure changes.
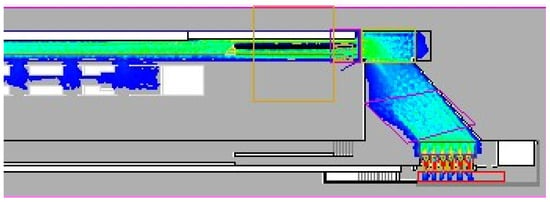
Figure 19.
Model space usage to represent the walking paths in Scenario B at Francia station.
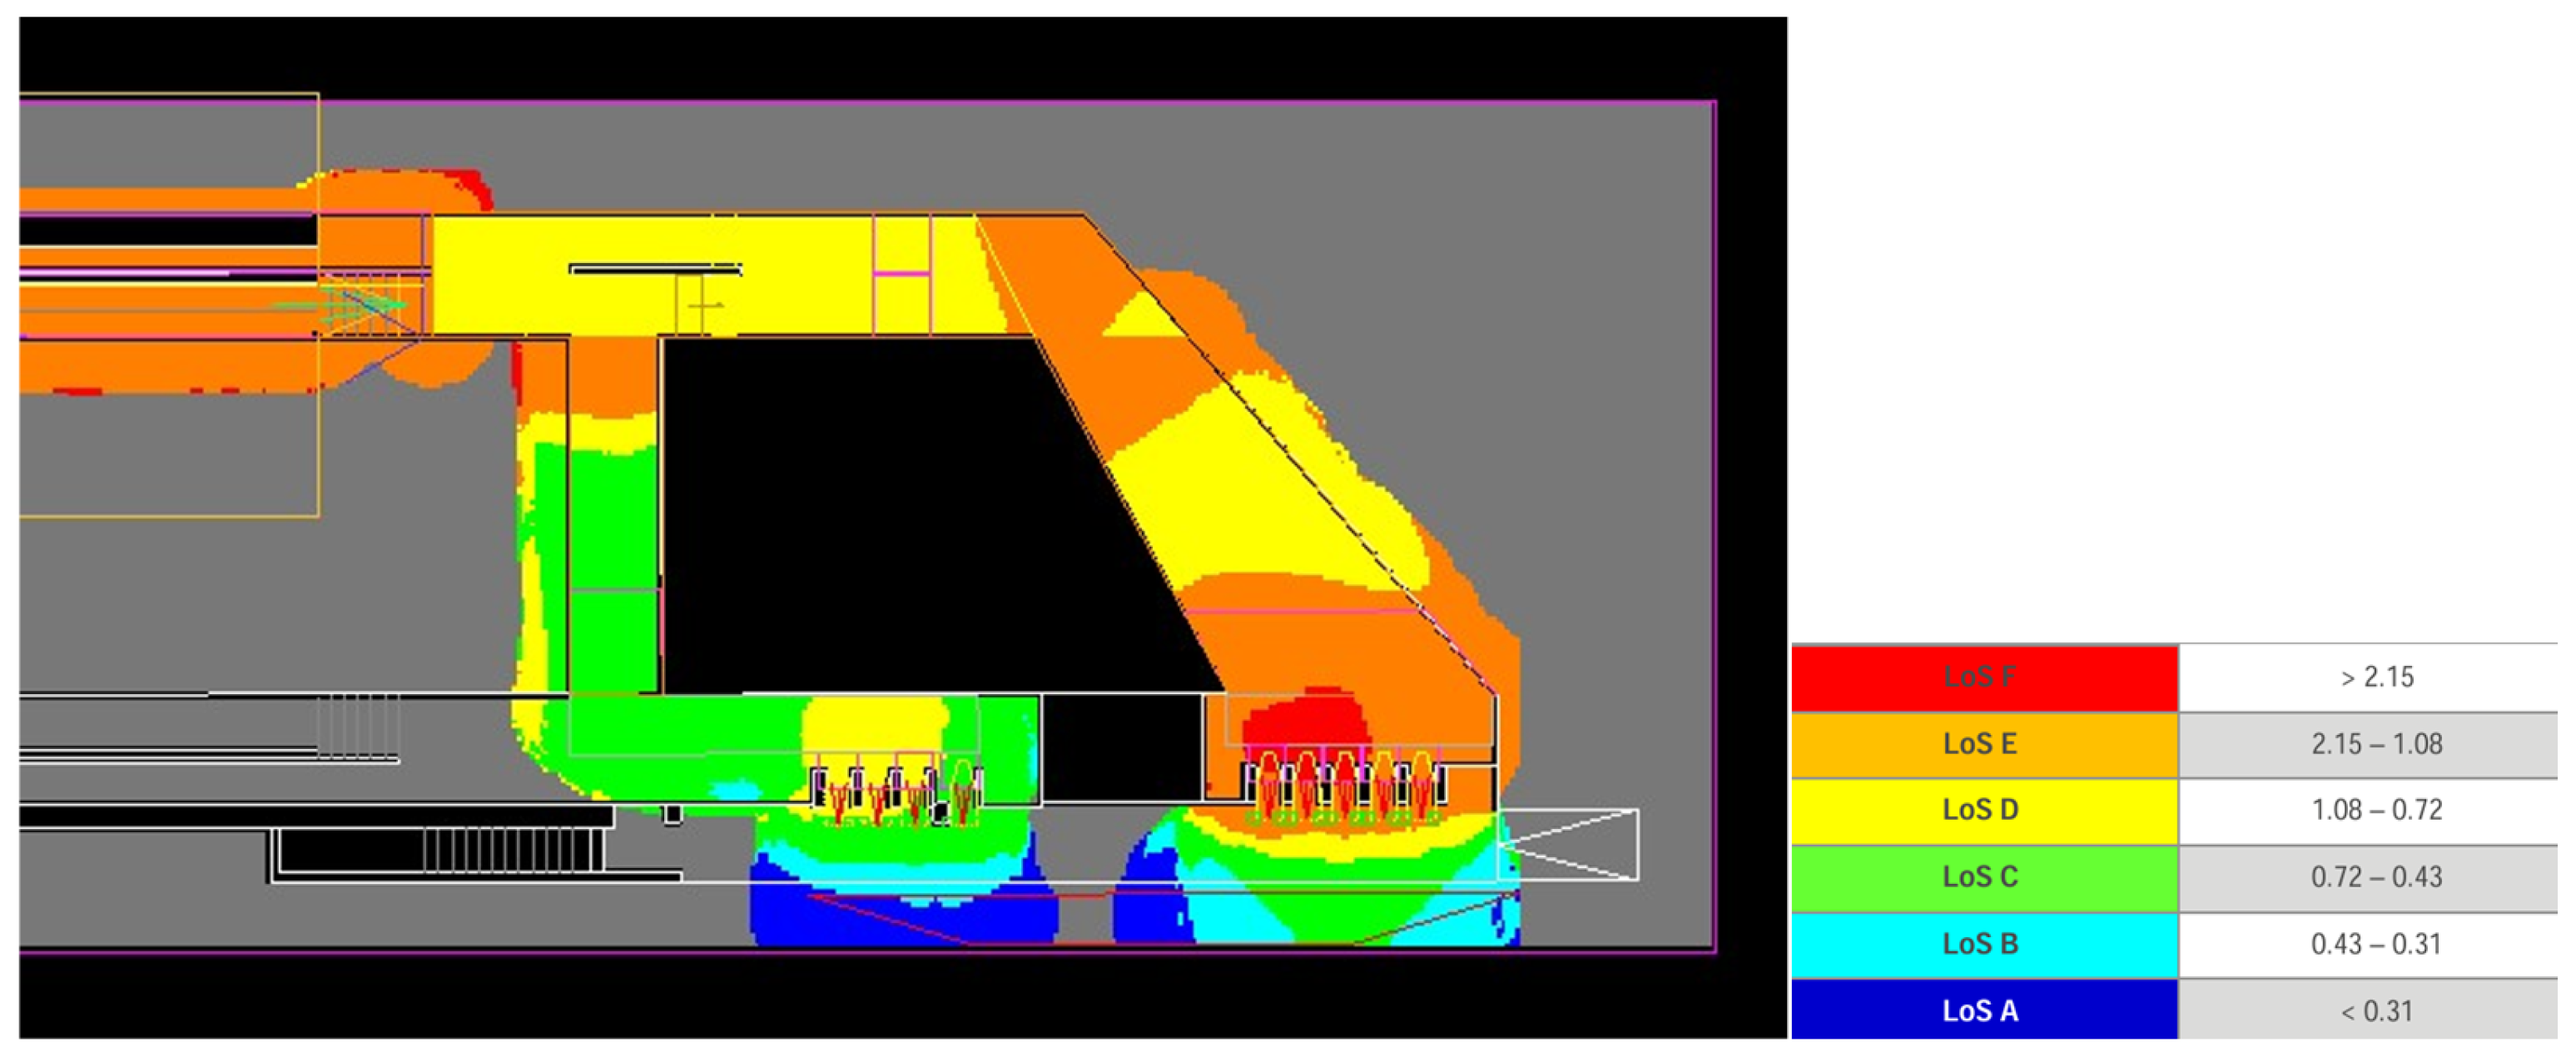
In addition, a level of service E is maintained in the crossing area over the railway tracks in Scenario B (see Figure 20), indicating that the area is still experiencing significant congestion, with passengers facing delays and reduced comfort during peak times. However, there is a noticeable improvement in the distribution of service levels across the model. The previously uneven flow and congestion patterns have been addressed to some extent, resulting in a more uniform distribution of service levels throughout the station.
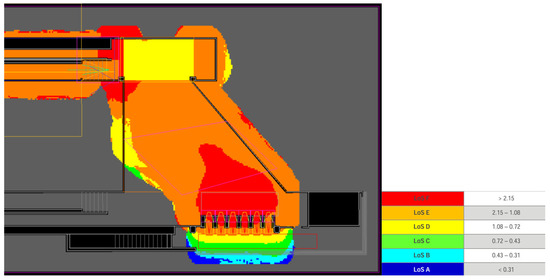
Figure 20.
Model LOS to represent the density in Scenario B at Francia station.
Despite this improvement, the level of service at the turnstiles remains at an F, which signifies a critical level of congestion and severe delays. Passengers in this area are likely facing significant discomfort, with long wait times and overcrowding, as the demand for passage through the turnstiles exceeds the available capacity. This suggests that while the adjustments made to the space have improved the overall flow to some degree, the turnstile area still remains a bottleneck, potentially due to the concentration of passengers at certain entry points.
This indicates that while some improvements have been achieved, further measures may be necessary to reduce the congestion at the turnstiles and enhance the service level to a more acceptable standard. Addressing this issue could involve additional adjustments to the station layout, the addition of more turnstiles, or improvements in passenger distribution strategies to better match the flow and demand.
4.2.3. Two Groups of Turnstiles
The third scenario, Scenario C, is defined as two groups of turnstiles. For the case of the last scenario to be simulated, a validation area is created prior to the railway crossing, with the aim of allowing users to make better use of their time on the platform and more effectively utilize the waiting time imposed by the pedestrian barrier. Additionally, a new crossing is created exclusively for these new users of this exit modality, which will henceforth be referred to as “express”. This proposal includes a reduction in the width of the original crossing to only 2 m, in order to encourage the use of the new crossing. The new crossing is designed diagonally, from 3.5 m in width on the north side to 6.1 m on the south side, closer to the exit doors. The number of turnstiles at the previous entrance is reduced from 6 to just 4. For the new exit, the traditional service turnstile is not present; instead, an anti-evasion automatic-opening gate is proposed to allow a free flow of passengers outward, while still maintaining security in terms of evasion prevention. Five traditional gates are considered, along with one gate for people with disabilities, 115 cm wide. Additionally, access to the ticketing area is provided in case someone has insufficient balance. The exit validation method will be via totems with a validation time of 1 s.
Regarding the distribution of use for the new exit doors, it is considered that there is no validation time, so in the simulation scenario, they do not cause any delays for the users. The numbering runs from right to left. It is assumed that the doors are equipped with sensors that keep them open while users are evacuating. There is a balanced use of all the exit doors, with none standing out with significantly higher usage compared to the others, indicating that all doors are being used uniformly.
Regarding the use of space, the distribution is highly efficient, with the majority of the available area being fully utilized. The waiting area is particularly well-organized, ensuring that no significant spaces remain underused or unused, which optimizes the flow of passengers. The design ensures that every square meter serves its purpose, enhancing the overall efficiency of the station. Notably, there is a significant improvement in the area just before the door and turnstile zone. This area sees better management of passenger movement, ensuring that the space is fully engaged without overcrowding. Additionally, the crossing over the railway tracks has been optimized, allowing for a smoother transition for passengers and effectively using the available space to ensure safety and efficiency. The overall layout promotes an even distribution of passengers throughout the station, preventing bottlenecks and improving the overall user experience (see Figure 21).
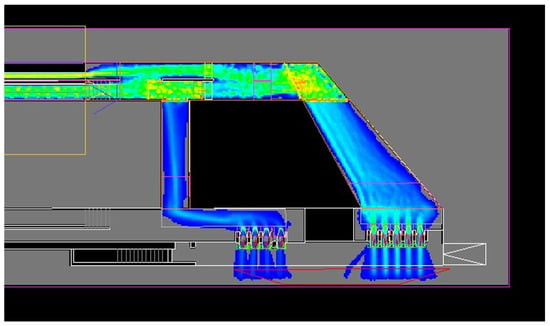
Figure 21.
Model space usage to represent the walking paths in Scenario C at Francia station.
In terms of service level, there is an improvement in the waiting area, with an average service level of D. The analysis focuses solely on the new crossing on the left side, where improvements are observed compared to the current scenario, with the service level improving from E to D. This indicates a better overall flow and efficiency, enhancing the experience for users in this area. The improvements contribute to a more balanced and comfortable environment, reducing congestion and improving the movement of passengers through the station (see Figure 22).
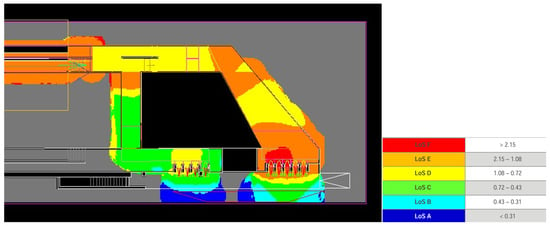
Figure 22.
Model LOS to represent the density in Scenario C at Francia station.
5. Conclusions
It is important to highlight that effective crowd management at metro station turnstiles is critical for ensuring smooth passenger flow, safety, and comfort, especially during peak hours. This pilot study aims to apply a methodology for analyzing crowd behavior at turnstiles, combining direct observation with microsimulation techniques. The study focused on understanding crowd dynamics, identifying bottlenecks, and testing different strategies for improving turnstile throughput, which has not been tested before in Valparaiso Metro. By leveraging observational data and microsimulation, the methodology will provide a solid foundation for managing congestion at turnstiles and inform future research on enhancing passenger experience and operational efficiency in metro stations. This study is an applied research project funded by ANID, Chile (Project Number: ID22I10018).
In a region with continuous and significant growth, the existing infrastructure often becomes outdated for the volume of passengers it needs to accommodate. Therefore, it is essential to think about optimizing the use of the spaces that already exist. For example, Proposal 2, which suggests a diagonal crossing, makes use of existing spaces without requiring significant investments, thus improving the utilization of turnstiles and enhancing evacuation times. By increasing the necessary investment, service levels, security, and user experience can be further improved. A prime example of this is the express exit, which significantly improves service levels at the crossing and makes better use of passengers’ time. These measures should be complemented with clear signage and passenger education to ensure a smooth and efficient experience for all users.
From a practical perspective, it is important to highlight the potential impact that the proposed methodology may have on public transportation systems. Designing efficient and effective stations requires a deep understanding of passenger behavior, infrastructure limitations, and environmental factors. In this regard, observation and simulation studies should be integral components of station design. These studies help assess not only the operational conditions of the station but also the environment in which the station is situated, taking into account factors such as local demographics, passenger types, peak usage patterns, and the necessary service levels for each area.
In particular, simulations can offer valuable insights into how stations function under various conditions, including high-demand scenarios. The simulation conducted using LEGION provided a powerful tool to explore different scenarios, allowing us to evaluate a wide range of potential outcomes that would be difficult or prohibitively expensive to test in real-life conditions. These simulations allowed us to model pedestrian movements, identify potential bottlenecks, and assess the overall flow, offering actionable data that can guide decisions on infrastructure improvements.
Moreover, the economic aspects of conducting pedestrian simulations should not be overlooked. While simulation tools require upfront investment, the long-term benefits often far outweigh the costs. These simulations can help optimize station layouts, reduce the risk of accidents or overcrowding, and ensure that stations are designed to handle future increases in passenger demand. In particular, simulations can be crucial in identifying and mitigating existing risks, especially in high-risk areas like the crossing over the railway tracks. This area, where pedestrian movement is directly impacted by the presence of restricted zones, can be a critical point for potential accidents or delays. By modeling various scenarios, we can better understand how passengers interact with such spaces and implement measures to improve safety and efficiency.
Ultimately, the proposed methodology emphasizes the importance of integrating simulation and observation studies into the planning and design of public transportation systems, ensuring that both current and future challenges are addressed in a proactive and cost-effective manner. In summary, the following recommendations are suggested:
- An increased number of turnstiles helps reduce passenger congestion. However, if the additional turnstile is not placed in the natural path that passengers take, it is likely that its usage will be lower than expected, making it an inefficient measure.
- Based on the above, it is recommended to use two groups of turnstiles, with some designated only for exits and others only for entrances, to separate flow lines and reduce passenger congestion.
- An intermediate solution is to provide turnstiles connected to the platform via a path (e.g., a corridor or crossing with the train tracks) that minimizes passenger effort (e.g., diagonal and direct).
In future work, it is possible to extend the study to the other stations of the service, not just focusing on the specific case of Francia. Special attention should be given to studying the layout, seasonal variations, or unexpected disruptions in underground stations, where there is no possibility of expanding the available spaces due to the high cost involved. Therefore, it is crucial to analyze and manage pedestrian behaviors in these scenarios of increasing passengers, service frequency, and expansions to new areas of the region. Without proper measures, these factors will lead to worse service levels.
Author Contributions
Conceptualization, S.S., V.A., V.M., C.F. and T.F.; Methodology, S.S., V.A., A.P., V.M., C.F. and T.F.; Software, A.G.; Validation, B.A.; Formal analysis, S.S., and A.G.; Investigation, S.S.; Resources, A.P.; Data curation, B.A. and A.G.; Writing—original draft, S.S.; Writing—review & editing, V.A., A.P., V.M., C.F. and T.F.; Visualization, B.A. and A.G.; Supervision, S.S.; Project administration, S.S.; Funding acquisition, A.P. All authors have read and agreed to the published version of the manuscript.
Funding
This research was funded by ANID, Chile grant number ID22I10018.
Data Availability Statement
The raw data supporting the conclusions of this article will be made available by the authors on request.
Acknowledgments
In particular, the authors are thankful for the collaboration between researchers who shared some techniques and methods of study. In addition, the authors would like to thank students and professionals who worked at the Mobility and Transport Laboratory.
Conflicts of Interest
The authors declare no conflict of interest.
References
- Memoria Anual EFE. Memoria Anual Empresa de los Ferrocarriles del Estado; Valparaíso, Chile, 2023. (In Spanish) [Google Scholar]
- ORR. Office of Rail and Road. Passenger Rail Usage. United Kingdom. Retrieved on 14 May 2022. Available online: https://dataportal.orr.gov.uk/statistics/usage/passenger-rail-usage/#:~:text=A%20total%20of%20417%20million,year%20to%2031%20December%202023 (accessed on 1 December 2024).
- TRB; National Research Council. Highway Capacity Manual 2010; TRB: Washington, DC, USA, 2010. [Google Scholar]
- Seriani, S.; Fernández, R. Planning guidelines for metro–bus interchanges by means of a pedestrian microsimulation model. Transp. Plan. Technol. 2015, 38, 569–583. [Google Scholar] [CrossRef]
- Seriani, S.; Fujiyama, T.; Holloway, C. Exploring the pedestrian level of interaction on platform conflict areas at metro stations by real-scale laboratory experiments. Transp. Plan. Technol. 2017, 40, 100–118. [Google Scholar] [CrossRef]
- Fruin, J.J. Pedestrian Planning and Design; Metropolitan Association of Urban Designers and Environmental Planners: New York, NY, USA, 1971. [Google Scholar]
- Seyfried, A.; Steffen, B.; Klingsch, W.; Boltes, M. The fundamental diagram of pedestrian movement revisited. J. Stat. Mech. Theory Exp. 2005, 2005, P10002. [Google Scholar] [CrossRef]
- Bellomo, N.; Liao, J.; Quaini, A.; Russo, L.; Siettos, C. Human behavioral crowds: Review, critical analysis, and research perspectives. Math. Models Methods Appl. Sci. 2023, 33, 1611–1659. [Google Scholar] [CrossRef]
- Evans, G.W.; Wener, R.E. Crowding and personal space invasion on the train: Please don’t make me sit in the middle. J. Environ. Psychol. 2007, 27, 90–94. [Google Scholar] [CrossRef]
- Yang, J.; Shiwakoti, N.; Tay, R. Train passengers’ perceptions and preferences for different platform and carriage design features. J. Public Transp. 2024, 26, 100085. [Google Scholar] [CrossRef]
- Boltes, M.; Seyfried, A. Collecting pedestrian trajectories. Neurocomputing 2013, 100, 127–133. [Google Scholar] [CrossRef]
- Aguayo, P.; Seriani, S.; Delpiano, J.; Farias, G.; Fujiyama, T.; Velastin, S.A. Experimental Method to Estimate the Density of Passengers on Urban Railway Platforms. Sustainability 2023, 15, 1000. [Google Scholar] [CrossRef]
- Seriani, S.; Aprigliano, V.; Garcia, G.; Lopez, A.; Fujiyama, T. The Pedestrian Level of Service in Metro Stations: A Pilot Study Based on Passenger Detection Techniques. Appl. Sci. 2024, 14, 6515. [Google Scholar] [CrossRef]
- Perea Burrel, A. Análisis de Flujo en las Estaciones Ferroviarias; Universidad Politecnica de Cataluña: Barcelona, Spain, 2010. [Google Scholar]
- Bonabeau, E. Agent-based modeling: Methods and techniques for simulating human systems. Proc. Natl. Acad. Sci. USA 2002, 99 (Suppl. 3), 7280–7287. [Google Scholar] [CrossRef]
- Helbing, D.; Farkas, I.; Vicsek, T. Simulating dynamical features of escape panic. Nature 2000, 407, 487–490. [Google Scholar] [CrossRef] [PubMed]
- Bauer, D.; Seer, S.; Brändle, N. Macroscopic pedestrian flow simulation for designing crowd control measures in public transport after special events. In Proceedings of the 2007 Summer Computer Simulation Conference, San Diego, CA, USA, 16–19 July 2007; pp. 1035–1042. [Google Scholar]
- Campanella, M.; Halliday, R.; Hoogendoorn, S.; Daamen, W. Managing large flows in metro stations: The new year celebration in copacabana. IEEE Intell. Transp. Syst. Mag. 2015, 7, 103–113. [Google Scholar] [CrossRef]
- Helbing, D.; Buzna, L.; Johansson, A.; Werner, T. Self-organized pedestrian crowd dynamics: Experiments, simulations, and design solutions. Transp. Sci. 2005, 39, 1–24. [Google Scholar] [CrossRef]
- van den Heuvel, J. Field experiments with train stopping positions at Schiphol Airport train station in Amsterdam, Netherlands. Transp. Res. Rec. 2016, 2546, 24–32. [Google Scholar] [CrossRef]
- Berrou, J.L.; Beecham, J.; Quaglia, P.; Kagarlis, M.A.; Gerodimos, A. Calibration and validation of the Legion simulation model using empirical data. In Pedestrian and Evacuation Dynamics 2005; Springer: Berlin/Heidelberg, Germany, 2005; pp. 167–181. [Google Scholar]
- Banerjee, A.; Maurya, A.K.; Lämmel, G. A review of pedestrian flow characteristics and level of service over different pedestrian facilities. Collect. Dyn. 2018, 3, 1–52. [Google Scholar]
- Hu, M.; Lu, L.; Yang, J. Exploring an estimation approach for the pedestrian level of service for metro stations based on an interaction index. Transp. Lett. 2020, 12, 417–426. [Google Scholar] [CrossRef]
- Mow, C.; Seriani, S.; Fujiyama, T. Where and how often do people touch train interiors? An investigation during the pandemic. In Proceedings of the Institution of Civil Engineers-Municipal Engineer, 17; Emerald Group Publishing Ltd.: Bradford, UK, 2024. [Google Scholar]
- Seriani, S.; Aprigliano, V.; Gonzalez, S.; Baeza, G.; Lopez, A.; Fujiyama, T. The Effect of Seat Layout on the Interaction of Passengers Inside the Train Carriage: An Experimental Approach for Urban Services. Sustainability 2024, 16, 998. [Google Scholar] [CrossRef]
- Yamada, T.; Utaka, M. Evaluating ticket gate directional restrictions using simulations of pedestrian flow considering stationary people in a railroad station concourse. J. Asian Archit. Build. Eng. 2023, 22, 2058–2073. [Google Scholar] [CrossRef]
- Fu, L.; Shen, C.; Chen, Y.; He, Y.; Zhang, Y.; Shi, Y.; Lo, J.T. The effect of the ticket gate layout on mixed-flow movement including luggage-laden pedestrians in metro stations. Saf. Sci. 2024, 179, 106625. [Google Scholar] [CrossRef]
- Fujii, K.; Sano, T. Experimental study on crowd flow passing through ticket gates in railway stations. Transp. Res. Procedia 2014, 2, 630–635. [Google Scholar] [CrossRef][Green Version]
- Till, R.C. Timed Egress Requirements for Transit and Passenger Rail Station Evacuation as Described in NFPA 130. ASHRAE Trans. 2006, 112, 246. [Google Scholar]
- Bentley. Best Practice Manual on Station Analysis Reporting Using Legion Pedestrian Simulation. 2023. Available online: https://www.bentley.com/software/legion/ (accessed on 15 December 2024).
- Transport for London. Station Modeling with Legion Spaceworks: Best Practice Guide; TfL Rail & Underground—Station Modelling: London, UK, 2016. [Google Scholar]
- Still. Crowd Dynamics; Universidad de Warwick: Coventry, UK, 2000. [Google Scholar]
Disclaimer/Publisher’s Note: The statements, opinions and data contained in all publications are solely those of the individual author(s) and contributor(s) and not of MDPI and/or the editor(s). MDPI and/or the editor(s) disclaim responsibility for any injury to people or property resulting from any ideas, methods, instructions or products referred to in the content. |
© 2025 by the authors. Licensee MDPI, Basel, Switzerland. This article is an open access article distributed under the terms and conditions of the Creative Commons Attribution (CC BY) license (https://creativecommons.org/licenses/by/4.0/).

