Abstract
In China, the current policy of the financial sector on water conservation and management is being vigorously pursued; therefore, efficient synergy between the two systems is of great significance. In this study, the coupling and coordination degree (CCD) between reclaimed water usage efficiency (RWUE) and high-quality development of the financial sector (HQDFS) was assessed using a coupling coordination model with panel data from 27 provinces in China during 2010–2021, and a more in-depth coupling and coordination relationship (CCR) was carried out using a spatiotemporal evolution methodology and PVAR model. The results of this study show the following: (1) CCD exhibits a continuous upward trajectory. At the end of the study period, the eastern, central, western, and northeastern regions moved to the primary coordination level. (2) The eastern and northeastern regions show an increasing trend in absolute differences and polarization. Meanwhile, the central region experiences a gradual rise in polarization. (3) The elliptical plot of the CCD’s standard deviation tends toward a circular shape with a positive aspect ratio. An expanding trend of absolute differences and polarization is observed in the eastern and northeastern regions. (4) The PVAR results show that the two systems can promote each other in the early stages and have a negative impact in the later stages. This study provides policy recommendations for a balanced development of the two systems and the formulation of regional development strategies based on the state of coupling and coordination between the two.
1. Introduction
Nowadays, China attaches great importance to the role of the financial sector in helping to save water and pool resources. And, in 2024, the Ministry of Water Resources of the People’s Republic of China and the Bank of China jointly issued the ‘Guiding Opinions on Financial Support for the High-Quality Development of the Water Conservation Industry’, which states that the financial industry should focus on supporting the utilization of non-conventional water and providing integrated financial services. To broaden the financing channels of water conservation projects, we must actively explore various financial products and tools, such as bond issuance and underwriting, equity investment, financial leasing, investment consultants, etc. Combined with the above background, it is of practical significance to explore the extent to which the high-quality development level of the regional financial sector is coupled and coordinated with the use of reclaimed water [1,2]. Therefore, the reclaimed water industry still needs to address the challenges of funding, technology, and market mechanisms to achieve wider application and more efficient resource utilization [3].
The financial industry needs to achieve the following goals in the process of high-quality development [4]: above all, it should enhance the core competitiveness of the country, build a financial powerhouse, improve the capacity of financial services, and enhance the international competitiveness of China’s economic system [5]. Subsidiarily, it is necessary to promote scientific and technological innovation and green development through deepening the development of scientific and technological finance and green finance, to guide financial resources towards scientific and technological innovation and green industries, and to promote the optimization and upgrading of the industrial structure to achieve sustainable development [6]. The financial sector’s support for the green industry can lead to the development of the reclaimed water industry [7]. Financial support enables wider reclaimed water applications in industrial production, municipal miscellaneous uses, and other areas, thereby increasing the demand for reclaimed water [8]. Therefore, HQDFS can have a positive impact on RWUE; meanwhile, an increase in RWUE means more efficient and sustainable water management, which can help to reduce the risk of financial institutions investing in water-intensive industries, as water scarcity and water pollution are some of the main risks faced by these industries [9,10,11,12].
As summarized above, there is a significant coupling and coordination relationship between HQDFS and RWUE. On the one hand, the financial industry provides financial support for reclaimed water projects through green financial products and services, such as green credit, green bonds, etc., which promotes the construction of reclaimed water treatment facilities and technological upgrades [13,14]. On the other hand, an improvement in RWUE can reduce the operating costs of enterprises and improve their economic efficiency and market competitiveness, which, in turn, increases their demand for financial products and services and promotes the HQDFS of the financial industry. In addition, the improvement in RWUE can also reduce the dependence on traditional water resources, reduce environmental risks and enhance the stability of the financial system [15,16]. Therefore, the positive interaction between the financial industry and RWUE not only helps to achieve sustainable economic development but also promotes the stability and efficient operation of the financial market.
In the final analysis, the question of how to build HQDFS and RWUE in a balanced manner has gained importance recently [17,18]. The main research questions in this study are as follows: (1) What is the coupled coordination relationship between HQDFS and RWUE, meaning is it for quality coordination or on the verge of disorder? (2) What changes occur in the coupled and coordinated interaction between the two systems in terms of time and space? (3) What government policies are necessary to support the balanced growth of RWUE and HQDFS? Based on this, the CCD between HQDFS and RWUE is calculated and its temporal variation features are analyzed in this study using the coupling coordination model. Additionally, the CCR between HQDFS and RWUE is further investigated in this study using the PVAR model and spatial autocorrelation analysis. Finally, based on the results from this study, we offer sensible policy recommendations.
This study’s following portions are organized as follows: A review of the relevant literature is included in Section 2. The methodology employed in this study is described in Section 3 and consists mostly of the data sources, research techniques, and indicator system of RWUE and HQDFS. A detailed analysis of the empirical results is presented in Section 4. This study’s conclusions are summarized in Section 5 along with some insightful policy recommendations.
2. Literature Review and Theoretical Analysis
2.1. Literature Review
2.1.1. The Connotation and Functions of RWUE
Green development is a strategic evolution from traditional models, pivotal for China’s commitment to resource conservation, pollution reduction, and enhanced ecological and environmental protection. It is an indispensable component in achieving a sustainable water environment, integral to fostering an ecological civilization and realizing the vision of a beautiful China. Scholars advocate for an enriched understanding of water resource efficiency, steering its development towards a ‘green’ paradigm. They emphasize the importance of assessing the green efficiency of water resources to ensure sustainable management and utilization. The impact of water resource efficiency and effective crop water use was examined from a water footprint perspective [19,20]. The efficiency of wastewater resourcing in China was evaluated [21]. Scholars’ research on water usage efficiency has been abundant, but not enough research has been carried out on the RWUE. In the water use efficiency system, reclaimed water use highlights the green implications of this. Accordingly, scholars are gradually focusing their attention on it. Reclaimed water usage is a practical way to reduce water scarcity and enhance the quality of the water in stream ecosystems [22]. A system dynamics urban reclaimed water model that considered the current conditions was developed in the Northwest Arid Zone [23]. The researchers employed the reclaimed water supply–demand balance index and the reclaimed water usage efficiency index as evaluation metrics. Furthermore, they employed the SD model to estimate the potential of reclaimed water usage from 2016 to 2025 in three representative cities with comparable natural environments and population sizes but significant economic disparities. Currently, scholars for reclaimed water, a relatively weak research field, through model assessments and case study analysis to solve the problem of water shortage, provided a reference basis with practical value but also laid the foundation for the research in this study.
2.1.2. The Connotation and Influencing Factors of HQGFS
Scholarly research in the domain of the HQDFS is primarily dedicated to the development and refinement of an evaluation system that can accurately assess and enhance the caliber of financial practices. Certain scholars employ the entropy value method to devise an indicator system for HQDFS, encompassing three critical dimensions: efficiency, equity, and sustainability. The impacts of environmental pollution and green finance on energy high-quality development was constructed by using a spatial Durbin model [24]. The impact of green finance and finance technology on the high-quality development of the economy was empirically examined [25]. Based on a comprehensive index of green finance development, the impact of green finance, finance development, and green technological innovation on green total factor productivity in 28 provinces in China was examined [22]. Additionally, scholars have developed an evaluative index system for assessing the quality of the financial sector’s development, grounded in financial function theory and sustainable financial development theory while taking into account the results of other relevant research, based on studies such as high-quality economic development [26,27]. This system encompasses five key dimensions: financial scale, structure, efficiency, functionality, and robustness. Consequently, this study will also use this as the basis for constructing the indicator system.
In the field of HQDFS, scholars have focused on developing and refining an evaluation system that can accurately assess and improve the quality of financial practices. This system is important for promoting the efficient, fair, and sustainable development of the economic system. In this study, it will be possible to improve the HQDFS evaluation system further and advance the unification of evaluation indexes and standards.
2.1.3. The Relationship Between RWUE and HQDFS
Scholars have initiated exploratory discussions on the characteristics of spatial and temporal evolution within the coupling coordination among various systems [28,29,30,31]. The scholars have modelled the coupling coordination degree between the subsystems of the research object and dynamically evaluated the degree of coupling coordination between their three subsystems [32,33,34,35,36]. The entropy weight method and the coupling coordination degree model were used to establish a conceptual indicator system for the coupling and coordinated relationship between the regional economy, ecological environment and island tourism [37]. The coupling Coordination Degree Model and Geographic Time-Weighted Regression were combined to measure the interactions and spatiotemporal heterogeneity between urbanization and ecosystem health in Chongqing at the county scale from 1997 to 2015 [38]. The above study broadens the research ideas for exploring the synergistic evolution law of RWUE and HQDFS; fully embodies the applicability and science of the coupling coordination degree model, the Dagum Gini coefficient decomposition method, and the Kernel density estimation and other methods in this kind of research; and provides important information for choosing what research methods to use to explore the spatiotemporal coupling coordination of China’s RWUE and HQDFS. This study aims to offer a pivotal reference for selecting appropriate research methodologies to examine the spatiotemporal CCD between RWUE and HQDFS in China.
HQDFS serves as a crucial mechanism and driving force for the economy’s high-quality growth. It is an intrinsic requirement for advancing modernization with Chinese characteristics and a foundational principle for refining the financial system’s structure and charting the path for financial development in the new era. How FDI affects financial development was explored, showing that FDI not only increases financial deepening but also enhances financial function [39]. The interaction between natural resource rents and the development of the financial sector was analyzed, realizing that the consideration of institutional factors has been neglected in previous studies [40]. There is still a gap in academic research on the spatiotemporal coupling of RWUE and HQDFS. This article delves into the dynamic relationship between RWUE and HQDFS. The efficient deployment of resources is central to reclaimed water usage, mirroring the financial sector’s emphasis on optimizing the allocation of capital to support the burgeoning green industry. Thus, achieving a harmonious integration and synergy between these two domains is of paramount importance.
2.2. Theoretical Analysis
As the nucleus and linchpin of contemporary economic systems, financial markets are poised to leverage their inherent strengths to furnish the necessary financial backing to advance green transition. The emergence of the new development paradigm has highlighted the central role of green finance in China’s supply-side structural reforms and in promoting the growth of a green, circular and digital economy [41]. The principles of economic development dictate that the promotion of rapid reclaimed water usage is primarily driven by the need for environmentally friendly development to guide the economy on a high-quality growth path [42]. This is achieved by deepening the financial supply-side reforms and establishing a robust foundation for the sustainable growth of the real economy. From a pragmatic perspective, adopting RWUE as a catalyst for HQDFS can significantly enhance the concentration of economic activity. This, in turn, leads to significant benefits for economic agglomeration and serves as a notable indicator of ongoing progress towards a modernized economic standard. In summary, exploring RWUE is a key component of the current HQDFS phase.
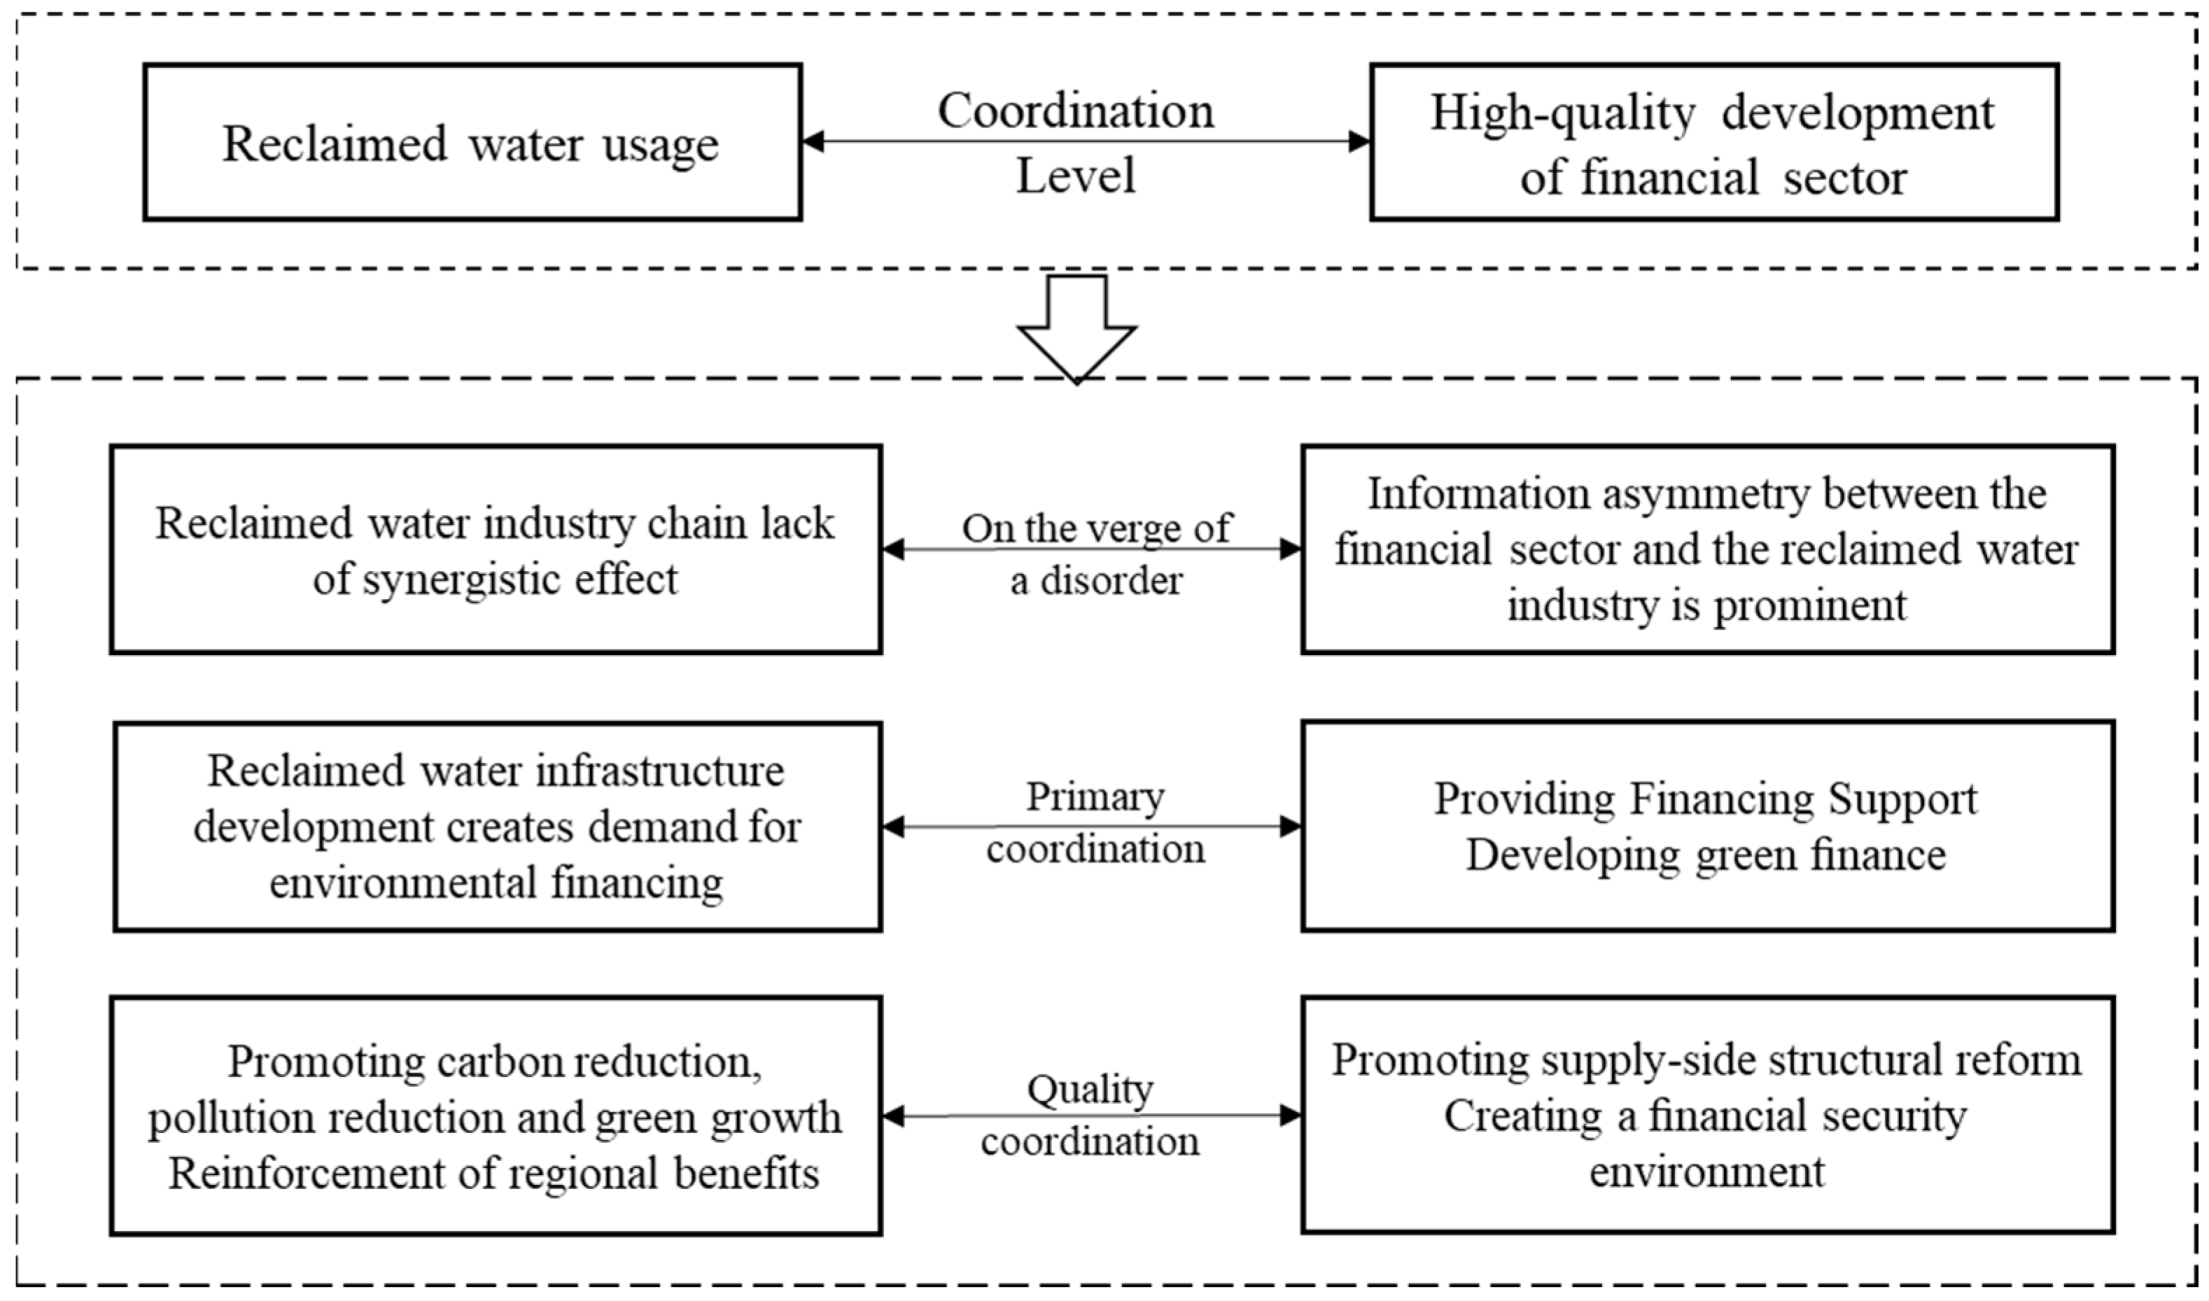
Technological innovation can play a driving role in coupling and coordinating the development of reclaimed water and HQDFS. Financial institutions should increase their investment in the research and development of reclaimed water technology and help enterprises improve the efficiency and quality of treatment, focusing on supervision and management, strengthening intelligent management, and forming a long-term dynamic operation system to ensure the safe and sustainable use of reclaimed water. These mechanisms interact with each other to promote the use of reclaimed water and the financial industry synergistic development, to achieve the double enhancement of economic and environmental benefits and to encourage the green transformation of the economy and society [43]. A coupling mismatch between the two may also be caused by development concepts, industrial synergies, policy support, technological innovation, and market mechanisms. The importance of reclaimed water in some areas is insufficient, the industrial chain is not perfect, and the integration with the financial industry is low, resulting in difficulties in project financing. In terms of policy, the policy systems of reclaimed water and financial support policies are not sound enough, affecting project implementation and industrial development. In terms of technological innovation, reclaimed water technology R&D investment is insufficient, and the financial industry on technological innovation support is limited, restricting the technological upgrading of the industry. In terms of market mechanism, the price mechanism of reclaimed water is unreasonable, and the financial market resource allocation efficiency is not high, affecting the market development of the reclaimed water industry. These problems lead to recycled water and the financial industry in promoting green development in the synergistic effect failing to give full play to the need to strengthen the policy guidance, innovative financial products, improve the market mechanism, and other measures to solve this issue.
The interactions and synergies between these elements are described in detail in the coupling and coordination mechanism diagram in Figure 1.

Figure 1.
Schematic diagram of the coupled synergistic relationship mechanism between RWUE and HQDFS.
In summary, the existing body of literature offers a coherent foundation and theoretical underpinnings for embarking on an integrated study that examines the CCD between RWUE and HQDFS. By scientifically measuring the CCD of RWUE and HQDFS, and by examining the regional disparities and dynamic evolution of their two-way interactive relationship across spatial and temporal dimensions, it becomes more feasible to identify the entry point for a virtuous cycle of development between these two domains. This approach can foster an enduring impetus for the comprehensive green transformation of economic development models.
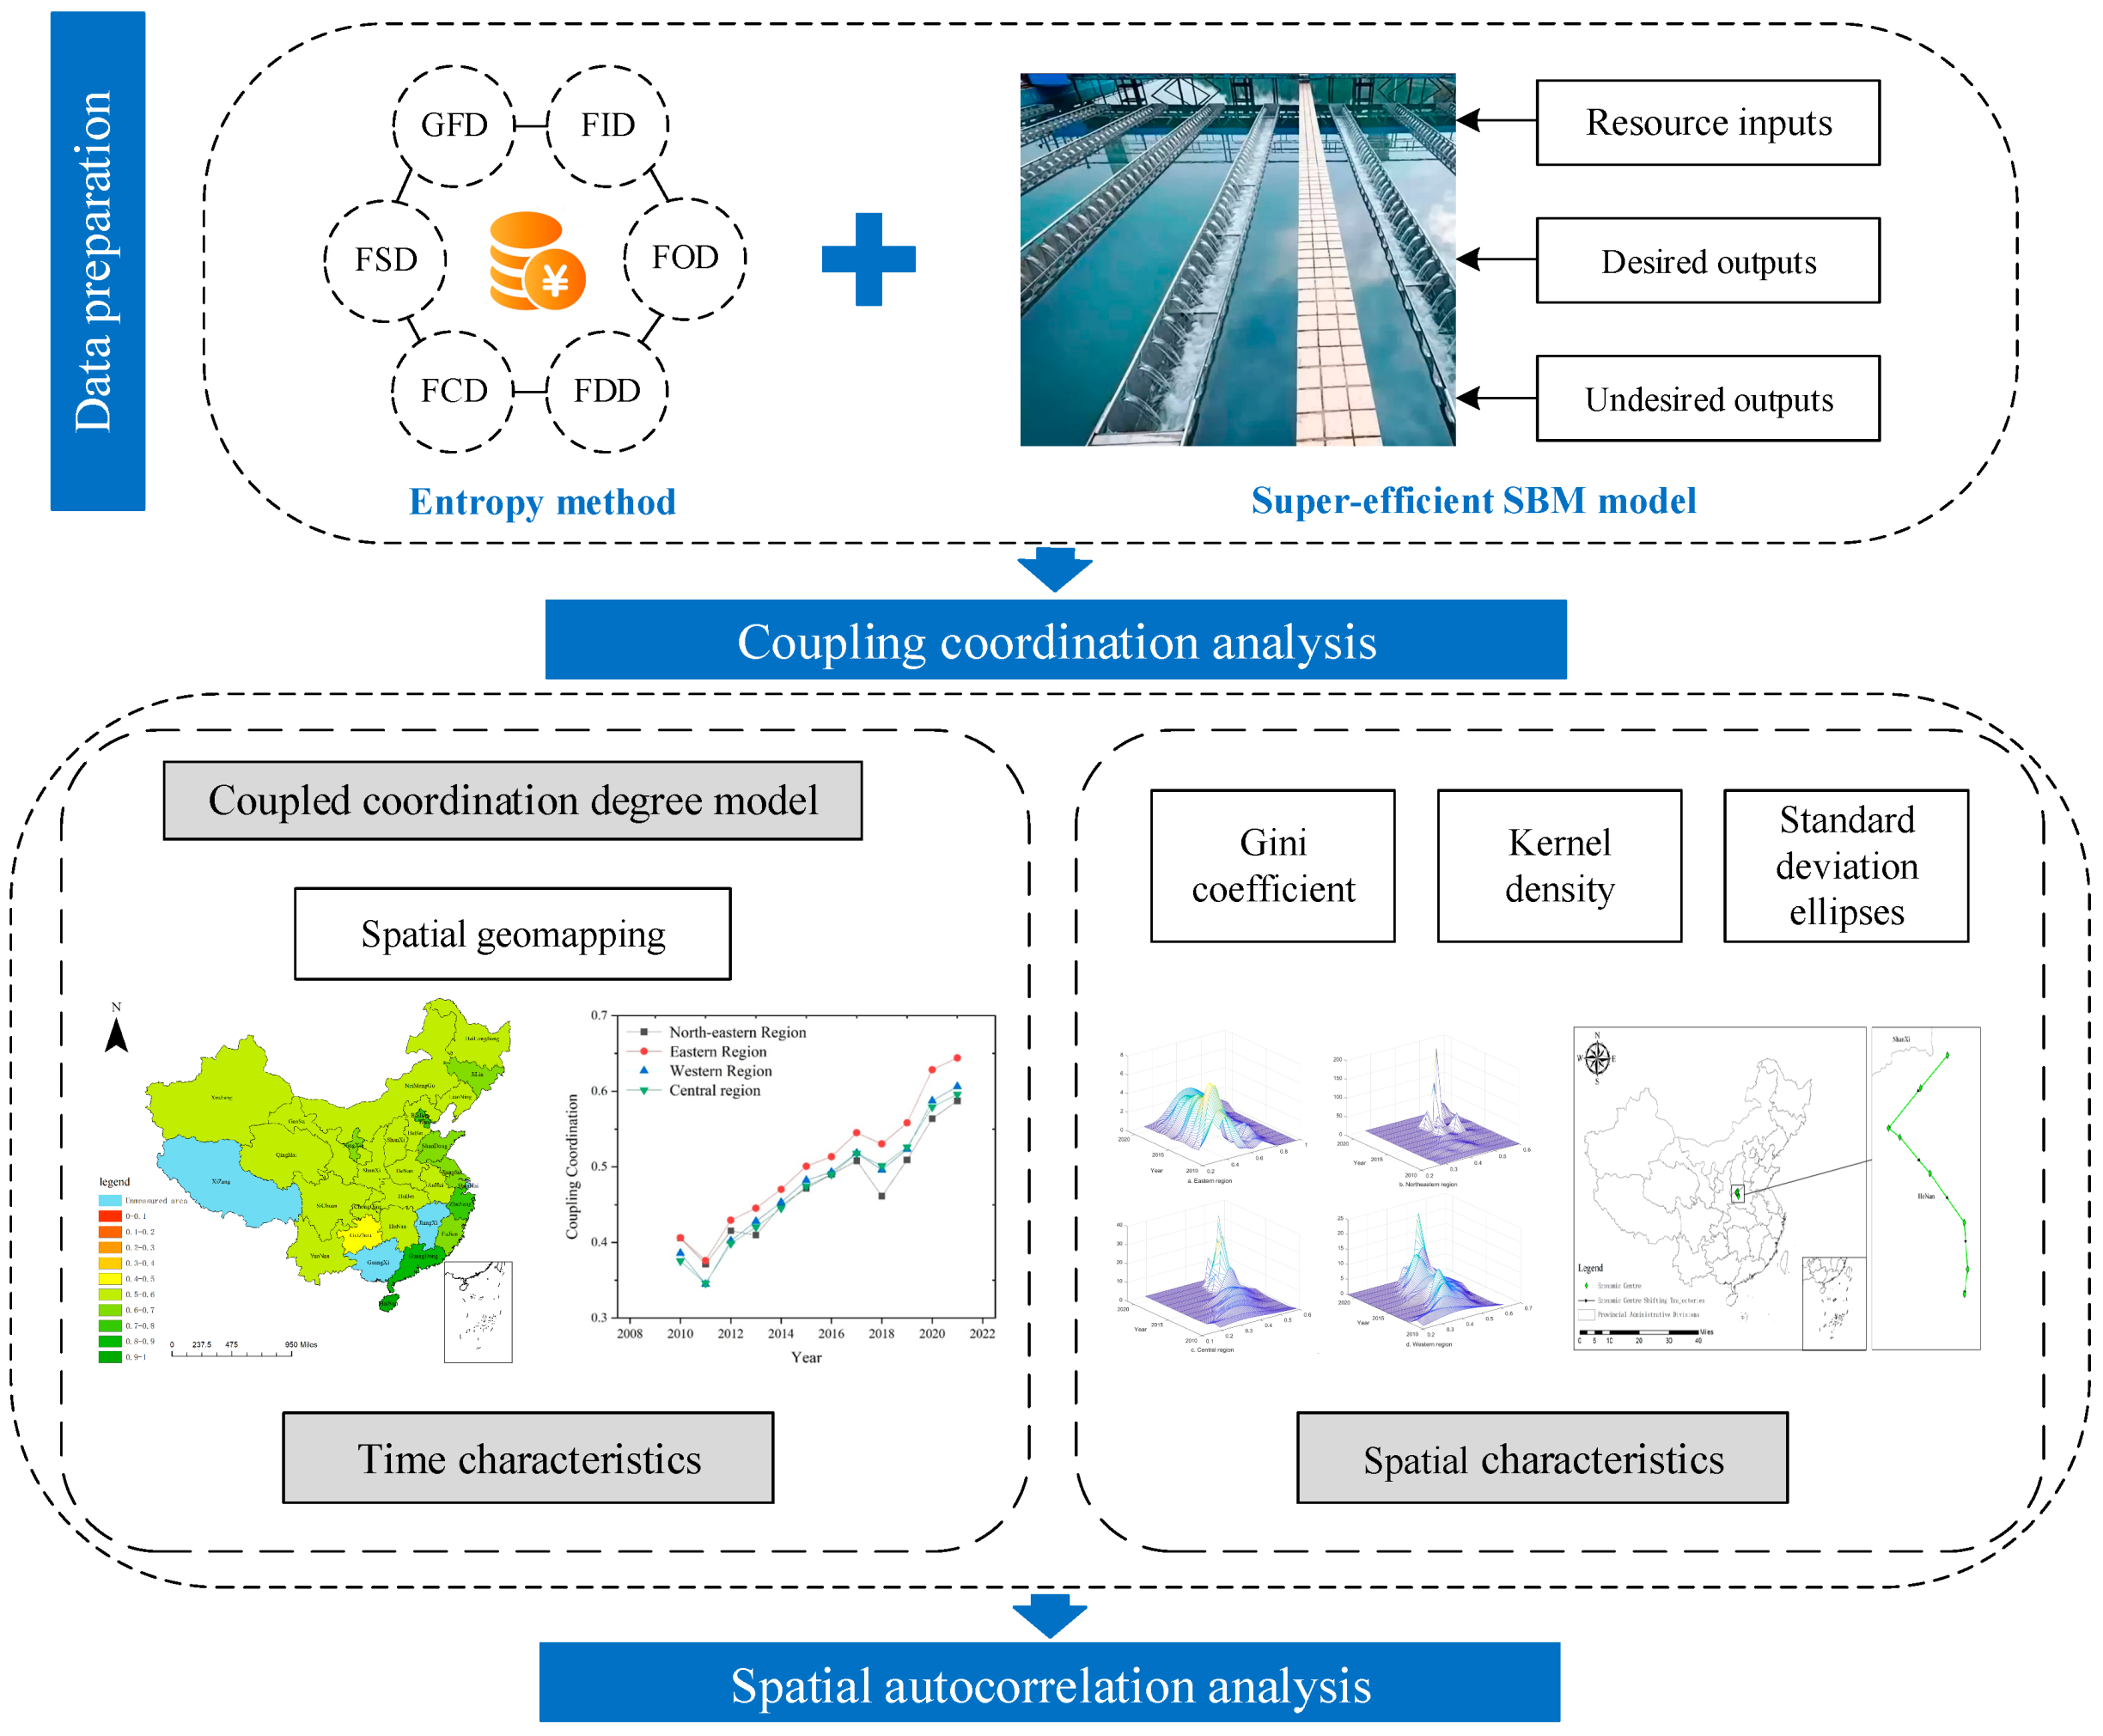
The key novelties of this study are encapsulated as follows: (1) Based on the principle of coupling coordination, the spatial and temporal dynamics of CCD between RWUE and HQDFS in China are investigated. (2) Considering the possible spatial imbalance of CCD, the spatial differences in CCD between RWUE and HQDFS in the four major regions of China were explored based on the spatial Gini coefficient as well as the underlying causes of these differences. (3) The temporal evolution of the coupling between RWUE and HQDFS in China is examined using standard deviation ellipses and kernel density estimation; the spatial autocorrelation between RWUE and HQDFS is then further analyzed using the PVAR model. To summarize, the research framework of this study is shown in Figure 2.
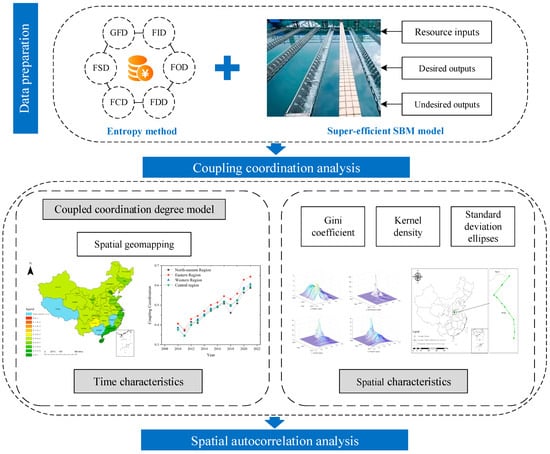
Figure 2.
Research framework.
3. Methodology
3.1. Construction of RWUE Indicator System
Combined with existing studies, this study makes reference to other studies to measure RWUE by using the super-efficient SBM model and constructing the input–output indicator system. Input indicators represent capital, labor, energy and facilities inputs for reclaimed water usage. The desired output indicator represents the effect of reclaimed water usage, so reclaimed water usage (million m3) is chosen as the output indicator. Sewage charges and industrial wastewater discharge are the selection of undesired output indicators. Table 1 presents the basic statistics for each variable.

Table 1.
Indicator system of reclaimed water usage efficiency.
3.2. Construction of HQDFS Indicator System
HQDFS is the process of serving the real economy with financial services, promoting sustainable economic development, and enhancing the stability and efficiency of the financial system. Having given due consideration to the development objectives of HQDFS of serving the real economy [44], contributing to the green and low-carbon transition [45], and integrating financial openness and security [46], and in the principles of scientific, systematic, hierarchical, and operability, this study refers to the research on the construction of the indicator system [47]. Eighteen indicators were selected to construct a comprehensive evaluation index system for the HQDFS. It includes six dimensions: general finance development (GFD), finance innovation development (FID), finance open development (FOD), finance green development (FDD), finance coordinated development (FCD), and finance sharing development (FSD). This study used the entropy weight method to calculate the weight of each index, and the specific indexes are listed in Table 2. The entropy method was used to measure the HQDFS index for each province and city in China.
Table 2.
Indicator system for high-quality development of the financial sector.
3.3. Data Sources
Given data updating, this study collects and constructs an indicator system for each province in China for the period 2010–2021 using the China Environmental Statistical Yearbook, Urban Drainage Statistical Yearbook, China Urban Construction Statistical Yearbook, China Statistical Yearbook, CSMAR database, and Wind database. Given that all RWUE in Shanghai is confined to enterprise internal use, and considering the absence of pertinent data in three mainland provinces, Jiangxi, Guangxi, and Tibet, as well as in the special administrative regions of Hong Kong, Macao, and Taiwan, this study focused on the remaining 27 provinces in China.
3.4. The Research Methods
3.4.1. Coupling Coordination Method
Drawing upon the existing scholarly literature in pertinent fields, this study aims to lay a foundational framework that will facilitate subsequent assessments of the CCD between regional RWUE and HQDFS. It is necessary to standardize the results of the E1 and E2 calculations using the normalization method, as shown in Equation (1):
where E denotes the standardized RWUE index or HQDFS index and Ei denotes the RWUE index or HQDFS index of the ith province, respectively. Emax and Emin denote the maximum and minimum values of the RWUE index or HQDFS index, respectively.
This study refers to the existing research results related to the coupling model to analyze the development mechanism of the coupling role between the RWUE and HQDFS. It constructs a model as shown in Equation (2):
where refers to the degree of coupling between the RWUE and HQDFS, and its value ranges from 0 to 1. When the is closer to 1, it means that the higher the coupling between the RWUE and HQDFS, the more coordinated it is; when is 1, it means that the two systems are extremely interdependent, and changes in one system will directly affect the other. However, the closer the coupling is to 0, the lower the coupling is indicated and the more disjointed is the coupling; when is 0, it means that there is no interdependence or interaction between the two systems. The two systems operate independently of each other and are in a state of irrelevance and need not develop. and denote the score indexes of RWUE and HQDFS after normalization, respectively. In order to further evaluate the benign coupling development level between the two, the CCD model is constructed as follows:
where D is the CCD between RWUE and HQDFS, and its value ranges from 0 to 1; C is the coupling degree; T is the comprehensive coordination index of RWUE and HQDFS; and are parameters to be determined. In this study, the RWUE is considered to be slightly lower compared to the importance of HQDFS; hence, is taken.
In this study, by combining and summarizing the relevant studies on coupling and taking into full consideration the previous analysis of the correlation between RWUE and HQDFS, the CCD of RWUE and HQDFS was classified as shown in Table 3.
Table 3.
Evaluation criteria for CCD.
3.4.2. Dagum Gini Coefficient Decomposition Method
Compared with traditional approaches such as the Dagum Gini coefficient and Terrell index, the Dagum Gini coefficient decomposition method offers a distinct advantage by effectively addressing the issue of subsample overlap. It disaggregates spatial disparities into three distinct components: intra-regional differences, inter-regional differences, and hypervariance density. This methodological refinement yields a more rigorous and nuanced measurement outcome. Consequently, this study employs the Dagum Gini coefficient decomposition method to analyze the spatial disparities and their sources in the CCD between RWUE and HQDFS. The overall Gini coefficient, denoted as R, is used to gauge the extent of these disparities; a higher R value signifies a greater overall gap in CCD. The mathematical formulation is described by Equation (5).
Among others, denotes the number of provinces, denotes the total number of districts, and and represent the number of provinces within regions and . and represent the degree of coupling coordination between the two systems for any province in the region and . is the mean value of coupling coordination between the two systems.
3.4.3. Kernel Density Estimate
After measuring the CCD between the RWUE and HQDFS in China, the country is divided into four major regions to analyze the spatial and temporal differences [48,49]. Kernel density estimation is used to examine the time-evolving characteristics of CCD with the functional expression:
where represents the probability density function of the CCD, is the kernel function, indicates the number of provinces in the region, is the average value, , indicating the bandwidth, which determines the smoothing parameter of the density function. For the degree of smoothing of the kernel density curve kernel accuracy, the smaller the bandwidth, the less smooth the estimated density function curve, and the higher the estimation accuracy.
3.4.4. Standard Deviation Ellipse
The standard deviation ellipse was first proposed by Lefever and has since been used by numerous scholars to characterize the spatial and temporal evolution of variables [50,51,52,53]. Mainly based on the spatial structure and location characteristics of the research object, the development trend and directional characteristics of the variables are quantitatively revealed through multiple types of elements, such as the center of gravity of the standard deviation ellipse, the long and short axes, the area, the azimuthal angle, and the flat rate. The specific calculation formula is as follows:
Center of gravity coordinates:
Long and short axes:
Among others
Area:
Azimuth angle:
Flat rate:
Format: is the coordinates of the center of gravity of the standard deviation ellipse; n is the number of provinces and municipalities; represents the weights. In this study, the CCD of RWUE and HQDFS is used as the weight; and denote the longitude and latitude of each city. and represent the standard deviation of the ellipse along the X and Y axes, respectively; and are the coordinate deviations from the geographical coordinates of each city to the center of gravity of the ellipse; S is the area of the standard deviation ellipse; and is the azimuth of the standard deviation ellipse.
3.4.5. PVAR Model
In contrast to the conventional VAR model [54,55,56], the PVAR model integrates the features of geographical data and time series. It efficiently analyzes the intricate interrelationships among variables and allows for the assessment of the dynamic influence of jointly endogenous variables without any previous limitations. In order to further examine the relationship between RWUE and HQDFS, this study will create a PVAR model [57].
In the present instance, i stands for the provinces, t for the time, j for the lag order, and Yit for the column vectors of RWUE and HQDFS. θ0 indicates the intercept term, θj is the parameter matrix, αi is the individual effect vector, βt is the time effect vector, and μit is the random perturbation term. Yit−j is the j-order lag term of Yit.
4. Results and Discussion
4.1. Time Analysis of the CCD Between RWUE and HQDFS
4.1.1. Overall Time Characteristics of CCD Between RWUE and HQDFS
Based on the results of the coupling coordination model, the CCD is shown in Table 4. The average value of the from 2010 to 2021 has been improved but still fluctuates and is concentrated in the barely coordinated and primary coordinated levels. In 2020–2021, the CCD between the two largely stabilized at the primary coordination level, but there is still a long way to go before maximizing the value of CCD between RWUE and HQDFS. As shown in Table 4, the CCD between the two basically stabilized at the primary coordination level from 2010 to 2021; however, achieving the full potential of the CCD between RWUE and HQDFS remains a significant challenge. It is a journey that entails considerable effort and strategic planning.
Table 4.
Characteristics of the CCD between RWUE and HQDFS in China.
As shown in Table 4, the overall E1 tends to be stable from 2010 to 2021, and the E2 is generally on the rise. During the examination period, the ratio of E1/E2 is generally approaching the development target of ratio 1 with a significant decrease, indicating that the balanced development pattern of the two systems is gradually forming, but HQDFS is always lagging behind that of the RWUE system, which will constrain the optimization and upgrading of the coupling and coordination pattern of the two. Improving HQDFS is a key breakthrough in reaching a high-quality coupling coordination model of RWUE and HQDFS. A primary impediment to the advancement of the HQDFS system lies in the persisting challenges, despite the ongoing enhancement of the Chinese financial system’s service to the real economy. These challenges include a suboptimal fund supply system, an imbalance in the distribution of financial resources, and the persistent issue of access to affordable credit for businesses, with a particular impact on small- and medium-sized enterprises. The efficiency of financial resource allocation remains relatively low, indicating a need for further refinement of the interplay between the financial sector and the real economy.
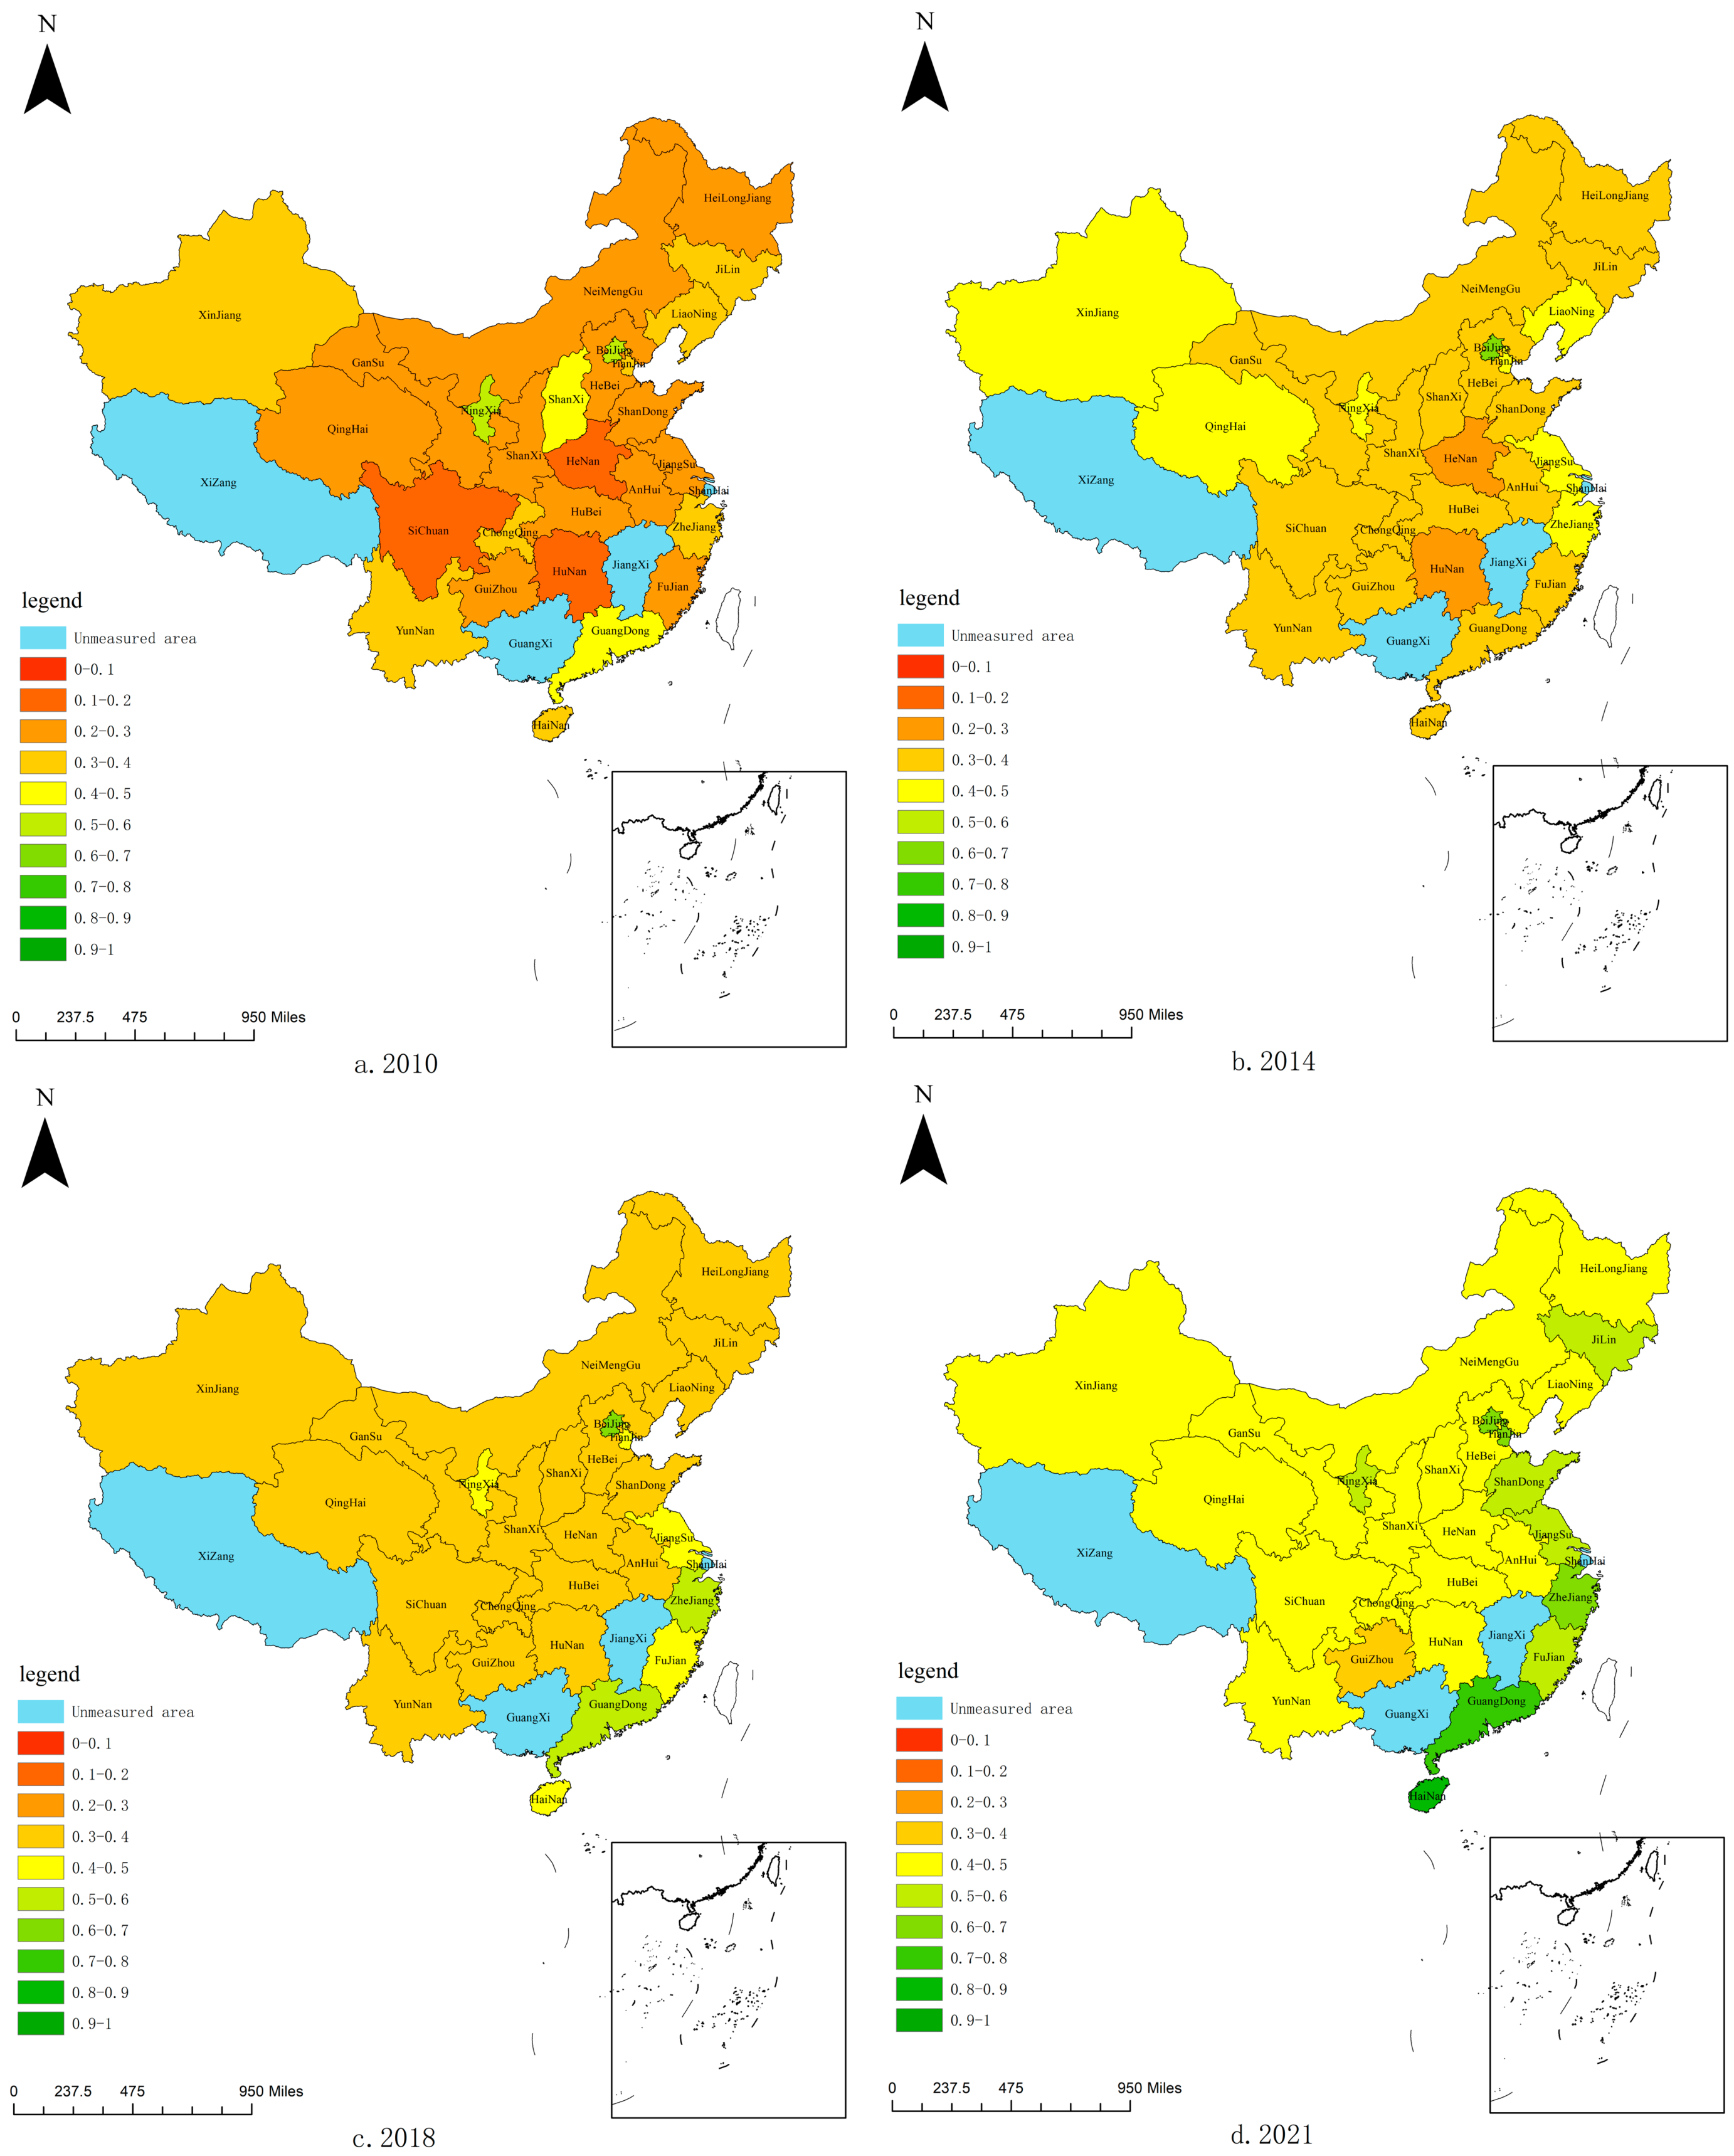
As shown in Figure 3, the CCD of China’s RWUE and HQDFS in general is gradually increasing over time, with the highest degree of coordination in the eastern region. The central region has seen the most significant improvement in CCD, essentially achieving primary coordination. This indicates that the financial sector in the central region has experienced rapid development in recent years, significantly reducing the gap between RWUE and HQDFS. However, it is in the eastern region where the gap is the largest, suggesting that there is still substantial room for improvement in the coordination between RWUE and HQDFS.
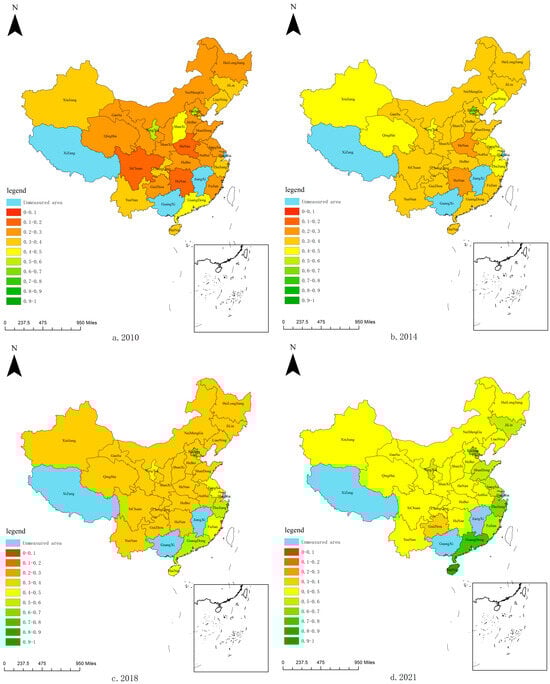
Figure 3.
Spatial and temporal changes in CCD of RWUE and HQDFS in China.
4.1.2. Characteristics of Four Regions
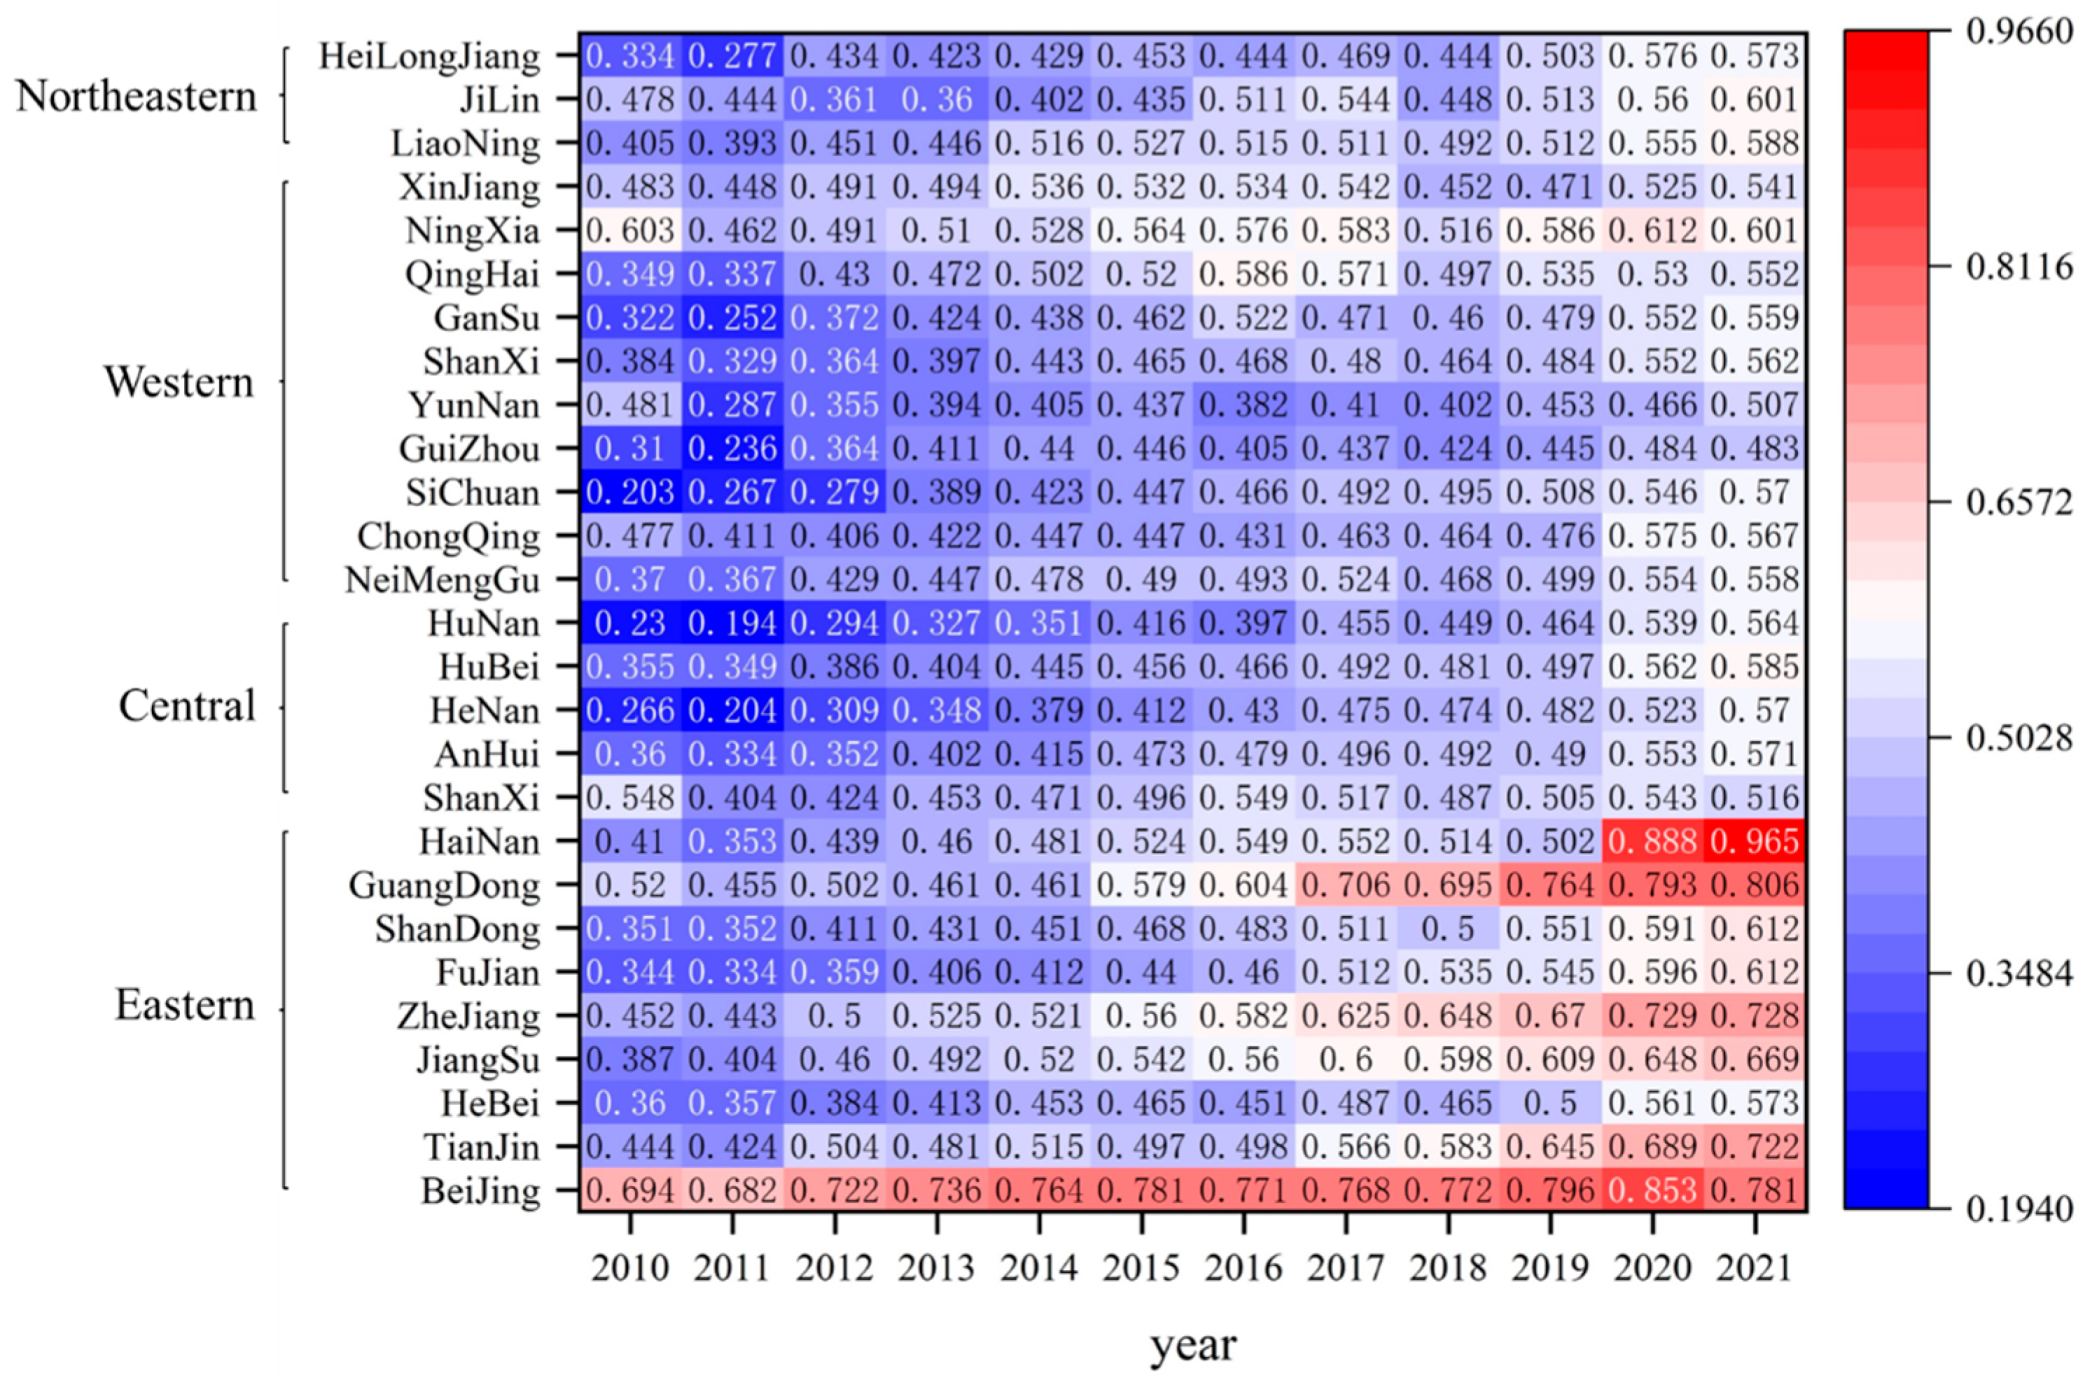
As depicted in Figure 4, the eastern region exhibits a marginally higher mean value of CCD compared to the western, central, and northeastern regions. Despite this, there remains a disparity with the mean values of these three regions, which are predominantly at the barely coordinated level yet show an upward trend towards achieving the primary coordination level by the conclusion of the review period. Notably, the eastern provinces, including Beijing and Guangdong, have witnessed an optimization and an upgrade in their CCD, transitioning from a state of near misalignment to one of strong coordination. In contrast, Hainan has experienced a remarkable leap in its CCD, advancing from a state of near misalignment at the start of the examination period to achieving quality coordination by its conclusion. All these provinces stand as frontrunners in the eastern region, consistently surpassing the national average. This underscores the eastern region’s distinct development advantage, positioning it as a pivotal force in enhancing the overall CCD between RWUE and HQDFS in China.
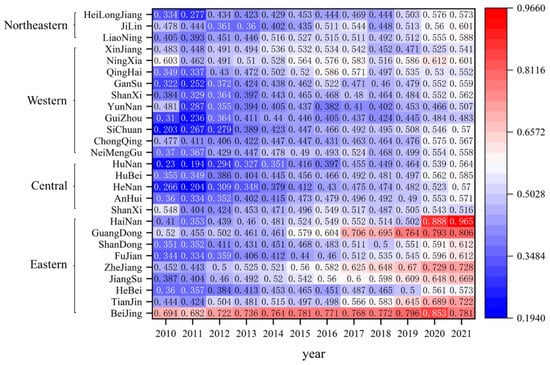
Figure 4.
The CCD of RWUE and HQDFS in 27 provinces of China.
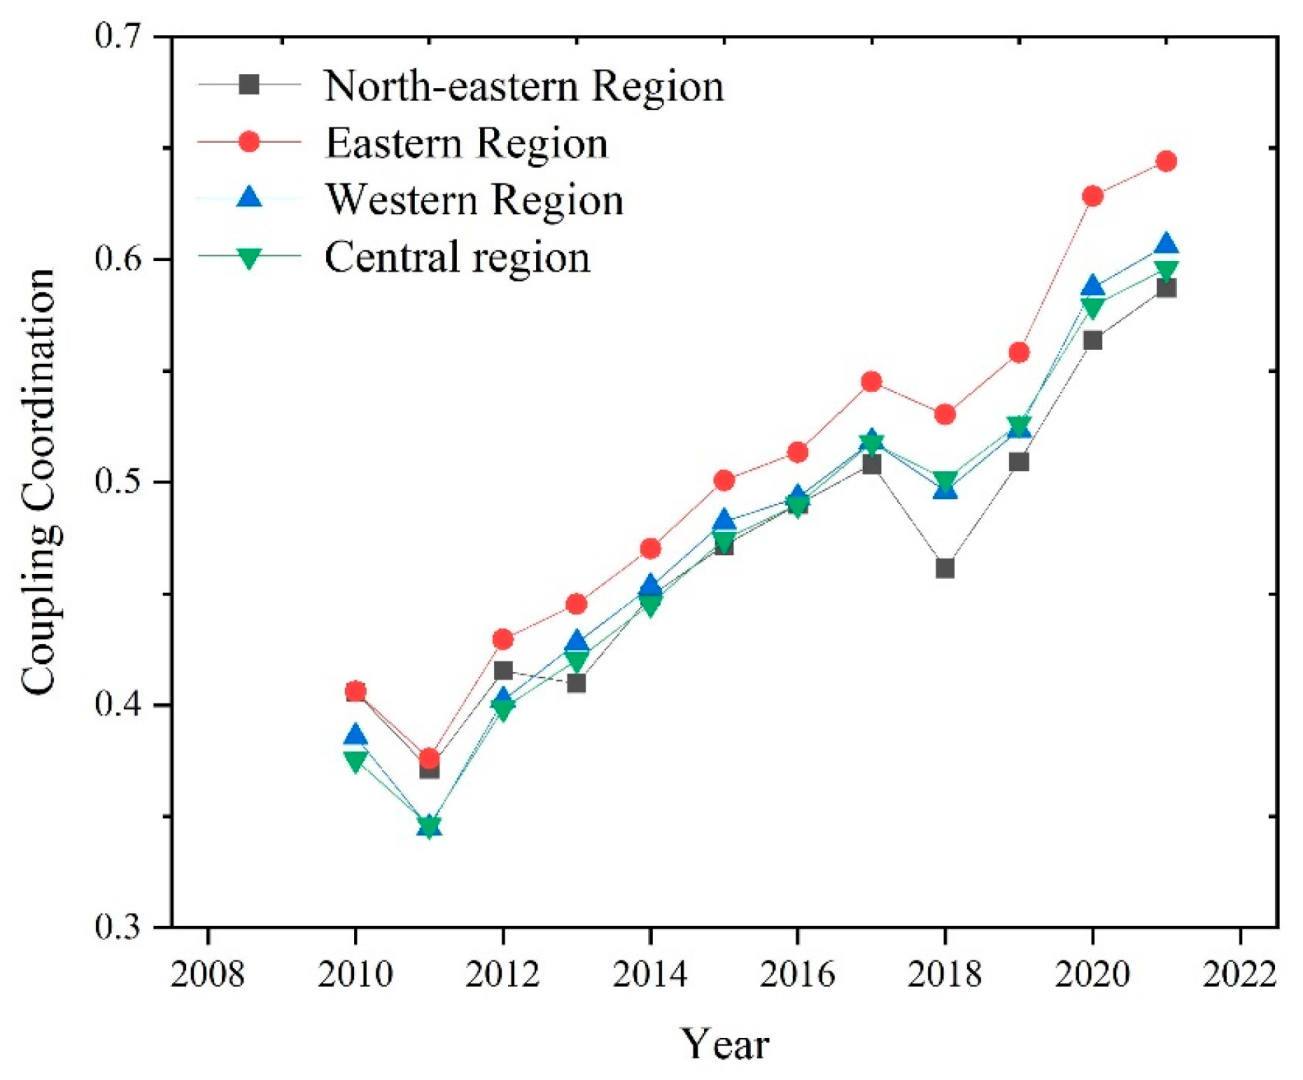
The evolution of the mean value of CCD between RWUE and HQDFS in the four major regions from 2010 to 2021 is shown in Figure 5. Figure 5 shows that the long-term evolution of the mean CCD of the four regions has generally improved. This is mainly due to the fact that after the 11th Five-Year Plan, China realized the importance of coordinated development between the environment and the economy, and the 11th Five-Year Plan explicitly put forward the concept of green development, actively promoting the transformation of the economic growth mode.
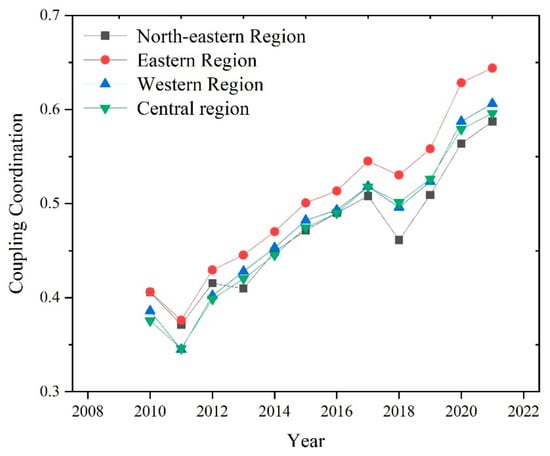
Figure 5.
Evolution of CCD in four major regions.
4.2. Spatial Analysis of the CCD Between RWUE and HQDFS
4.2.1. Overall Spatial Variation
As illustrated in Table 5, the overall Gini coefficient indicates that the spatial differences in CCD have followed an undulating downward trajectory. There was a period of decline from 2010 to 2015, followed by a series of fluctuations between 2015 and 2018. The coefficient eventually stabilized at approximately 0.081 by 2021. Notably, the overall Gini coefficient for CCD in 2021 exhibited a significant decrease compared to its value in 2010. Specifically, from 2010 to 2015, the overall spatial disparity experienced a downward trend, primarily due to the strategic implementation of coordinated regional development. This shift was prompted by the State’s recognition of the issue of uncoordinated regional development, leading to a consistent reduction in spatial disparity until 2015. Subsequently, between 2015 and 2021, there was a slight uptick in the overall spatial difference, which then underwent a period of fluctuation before stabilizing at 0.081. In summary, while the overall spatial disparity has shown a general decline, the persistent fluctuations in the overall Gini coefficient throughout the period under review suggest that the dynamics of spatial differences remain in a phase of instability. This indicates that the coupling and coordination mechanisms between RWUE and HQDFS continue to face significant regional heterogeneity. These disparities are issues that warrant close attention and cannot be overlooked. From the results of the Gini coefficient decomposition [58], the intra-regional Gini coefficient has been in a downward trend, while the inter-regional Gini coefficient has shown a fluctuating upward trend, which indicates that the coupling coordination gap between different provinces and cities in China is getting bigger. And the hypervariable Gini coefficient transforms from 0.064 to 0.003, which indicates that the degree of overlap between different regions decreases sharply and also proves the accuracy of the conclusions in this study.
Table 5.
Overall Dagum Gini coefficient and contribution rate results.
As shown in Table 5, the sources of spatial variation in the CCD of RWUE and HQDFS are intra-regional variation, inter-regional variation, and hypervariable density contribution. Specifically, the average contribution of inter-regional differences to the spatial variance in the CCD of RWUE and HQDFS is 56.94 percent. This represents the most significant source of spatial variance, indicating that the overall disparities between different regions in CCD can largely account for the spatial variance observed in the system. The average contribution rates of intra-regional differences and hypervariable density contribution are 24.54% and 18.52%, respectively, which are both less than 1/2 of the contribution rate of inter-regional differences, indicating that neither of them is a key contributor to spatial differences in CCD. In contrast, the hypervariable density contribution has the lowest contribution rate, indicating that the cross-over problem between different regions has the least degree of influence on the spatial difference of CCD. In summary, it can be seen that the key to solving the problem of spatial imbalance between the RWUE and HQDFS is to reduce the inter-regional differences.
4.2.2. Four Major Regional Differences
Table 6 reports the intra- and inter-regional Gini coefficients for the four major regions. In terms of intra-regional Gini coefficients, compared with 2010, the intra-regional Gini coefficients for CCD in the northeastern, eastern, central and western regions decrease by 86.08%, 26.67%, 87.35% and 80.13%, respectively, in 2021. This means that the balance of CCD within the four major regions has been enhanced in the context of the intensive implementation of the regional coordinated development strategy. Particularly, the intra-regional difference in CCD in the central region shows an overall downward trend, with a mean value of 0.0592, and a large fluctuation phenomenon between 2011 and 2015, making it the region with the largest difference in CCD among the four major regions. In contrast, the intra-regional differences in the western, central, and northeastern regions are significantly smaller than those in the eastern region. The intra-regional variation in the western region is second only to that in the eastern region, with a mean value of 0.0671, which fluctuates markedly between 2011 and 2014 and exhibits a relatively small alternation of rise and fall between 2015 and 2021. Compared to the other three regions, the eastern region has the smallest overall fluctuation in intra-regional variance, with a mean value of 0.0951, and it sees another small decline in intra-regional variance at the end of the period under examination after a flat decline from 2010 to 2014 and alternating fluctuations from 2015 to 2021. The northeastern region has the smallest intra-regional variation, with an average of only 0.0403, while it is worth noting that the instability of intra-regional variation in the northeastern area is relatively more pronounced.
Table 6.
Results of decomposition of differences in Dagum Gini coefficients for the four major regions.
As can be seen from Table 6, the largest inter-regional difference in CCD is between the eastern and central regions, with a mean value of 0.1237; the smallest inter-regional difference is between the central and northeastern regions, with a mean value of 0.0576. The inter-regional Gini coefficients for the northeastern and central regions, the northeastern and western regions, and the western and central regions all show an overall fluctuating downward trend from 2010 to 2021, and, in general, the inter-regional differences between the northeastern and central regions, the northeastern and western regions, and the western and central regions are on a downward trend. The inter-regional differences between the northeastern and eastern regions, the eastern and central regions, and the eastern and western regions show a more similar time-varying trend, with a ‘downward-ascending’ alternating trend from 2010 to 2021, gradually showing relatively stable development. Reducing the inter-regional differences between the northeastern and eastern regions, the eastern and central regions, and the eastern and western regions to stabilize at a low level is an issue that should be focused on in the process of promoting coordinated regional development.
4.3. Distributional Dynamic Evolution of CCD Between RWUE and HQDFS
4.3.1. National-Level Kernel Density Estimation Analyses
The results of the Kernel density estimation of the CCD between RWUE and HQDFS at the overall national level are shown in Figure 6. As shown in Figure 6, the distribution curve of CCD in 2010–2021 generally shows a rightward shifting trend, indicating that the coupling coordination mode is continuously optimized. There is an alternating trend of rising and falling in the height of the main peak of the CCD distribution during the examination period, and at the end of the examination period, it shows a trend of rising in the height of the main peak and decreasing in the width of the peak, which implies that the absolute difference in the CCD has a tendency to decrease from a national perspective, and there is a characteristic of dynamic convergence. The simultaneous occurrence of an increase in the height of the main peak and a widening of the peak width suggests that the CCD shows a favorable trend, but the differences between different regions or subsystems also widen. This may imply that in the process of overall coordinated development, the coordination degree of some regions has improved faster, while others have lagged relatively, leading to a widening of the peak width of the overall distribution.
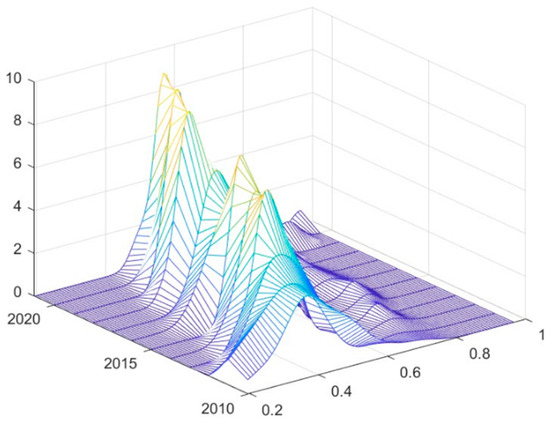
Figure 6.
Kernel density estimation of CCD between RWUE and HQDFS in China.
4.3.2. Analysis of Kernel Density Estimates for Four Major Regions
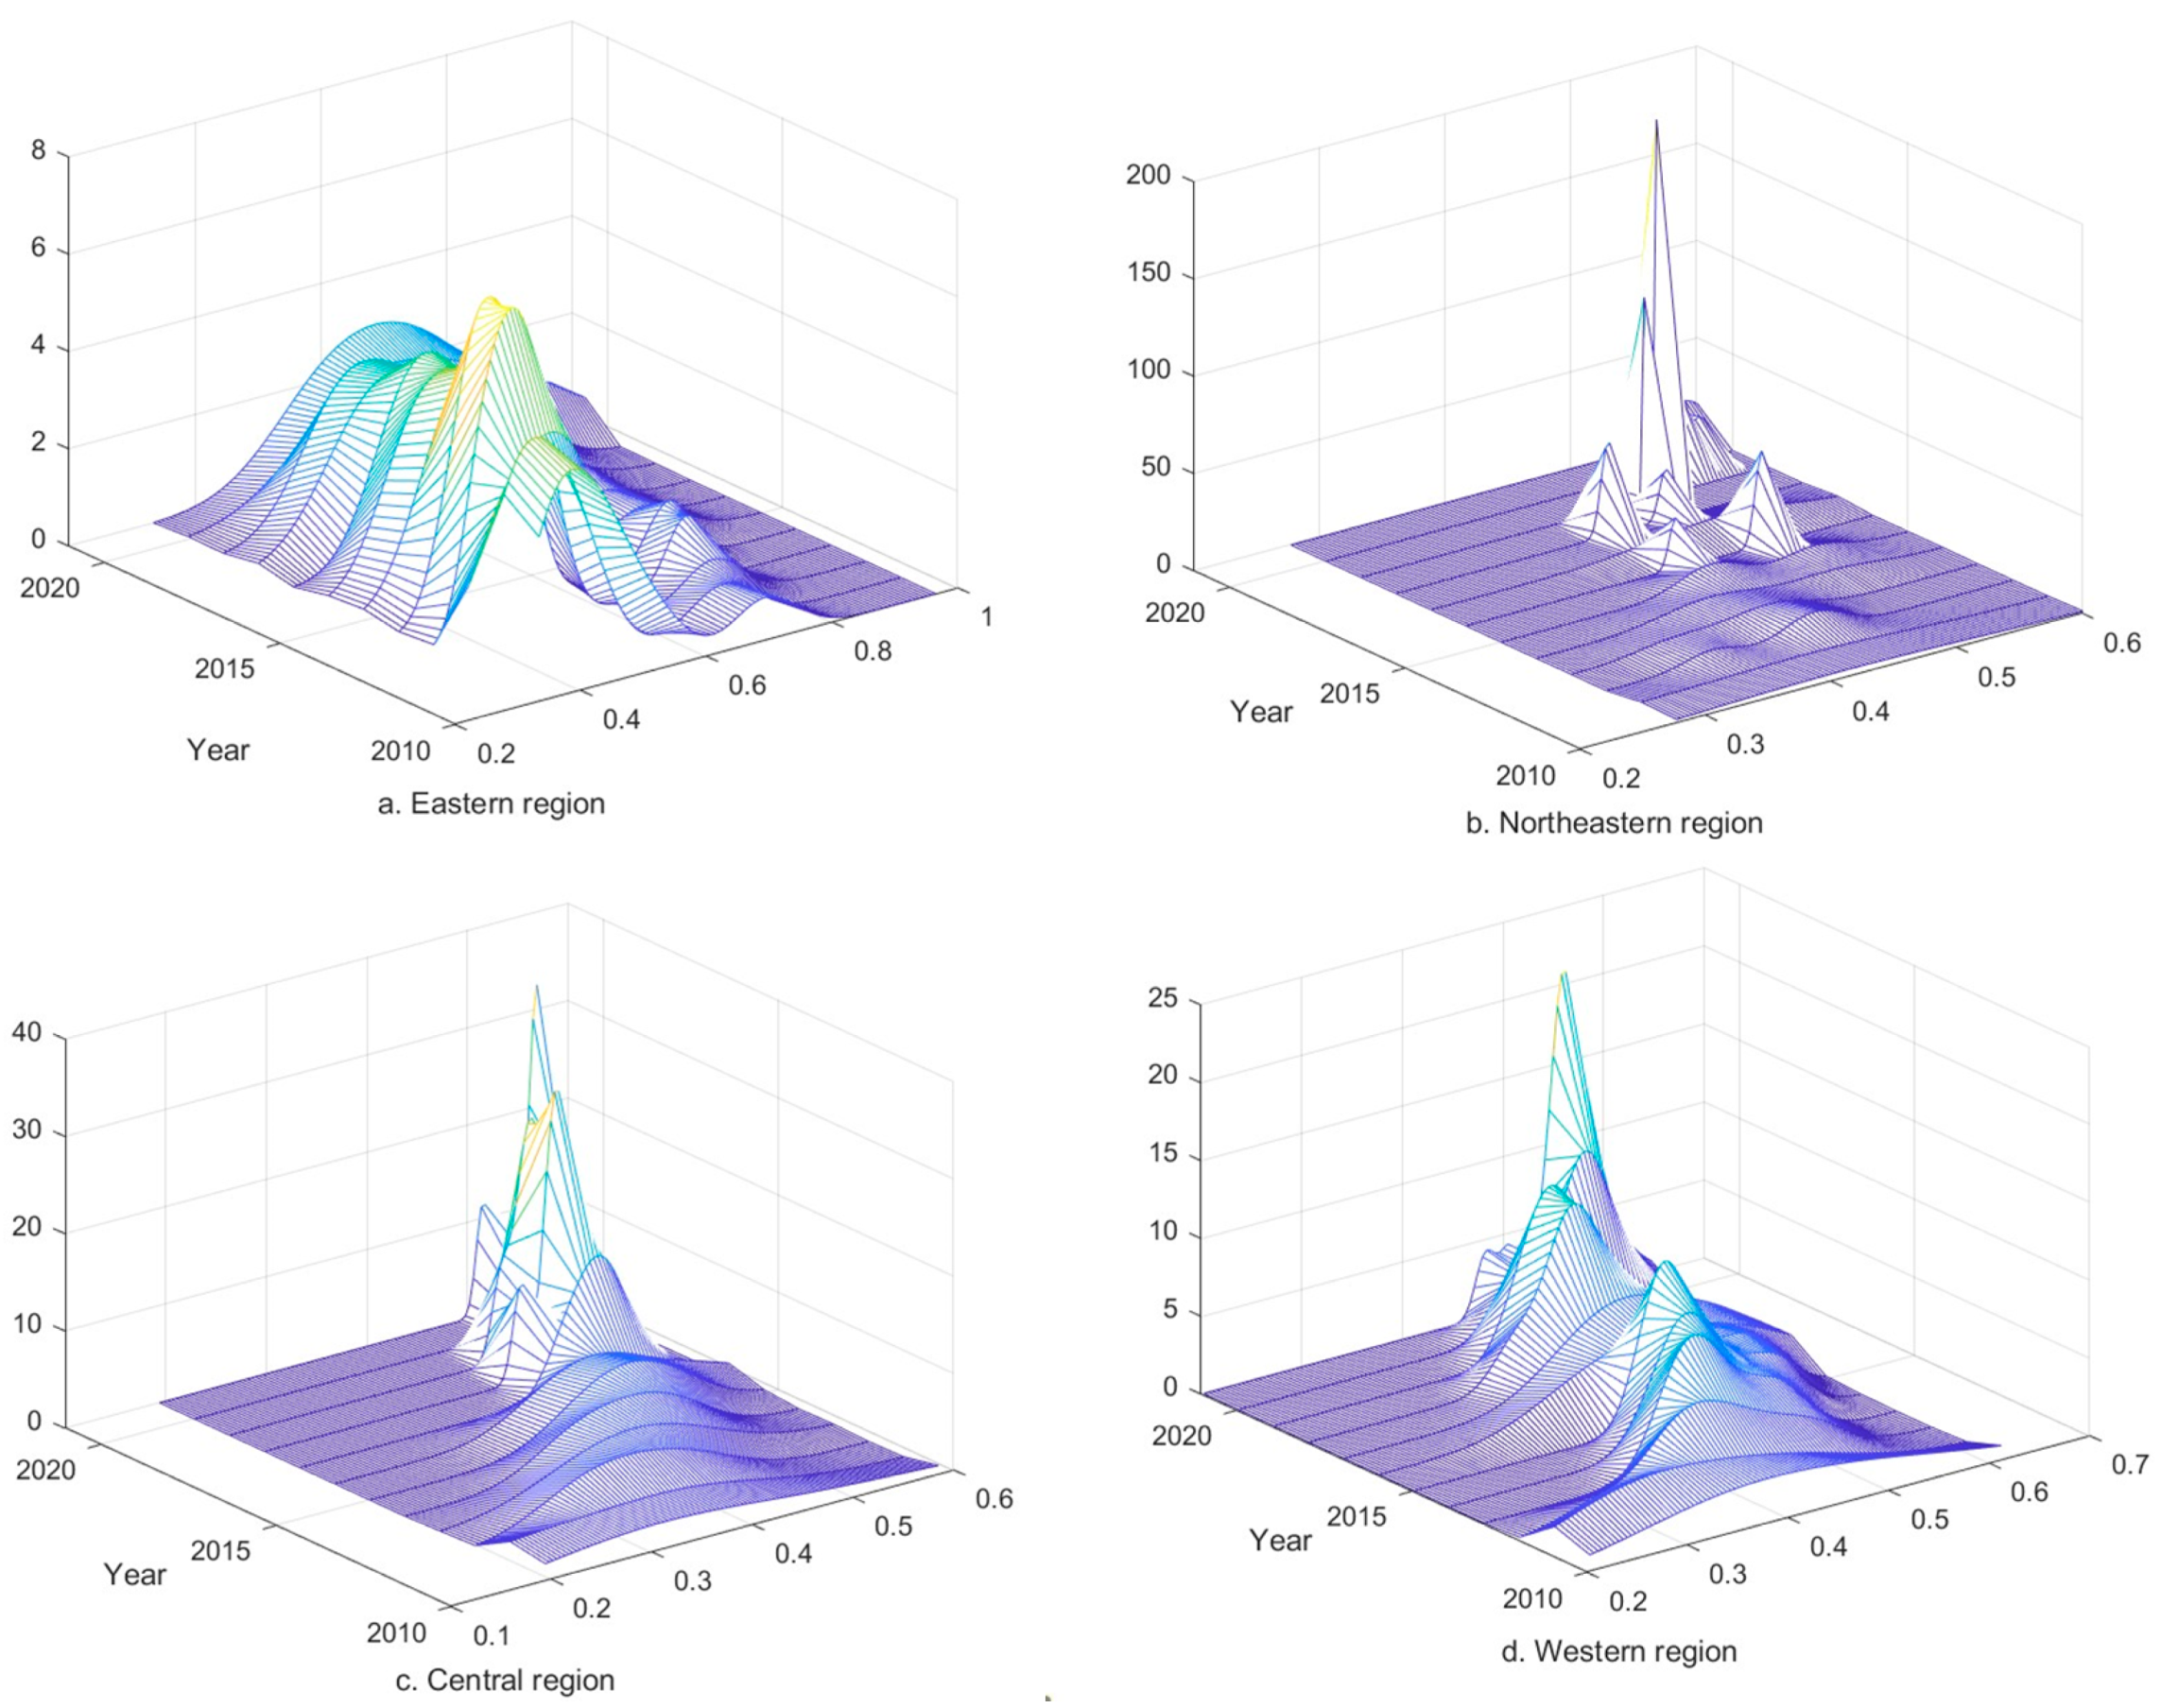
The results of the Kernel density estimation of CCD between RWUE and HQDFS in the eastern region are shown in Figure 7a. The main peak of the CCD distribution curve in the eastern region is generally shifted to the right; the height of the main peak shows a cyclic fluctuation trend of “upward-declining”, with the overall performance of a slight increase, and the width of the main peak gradually becomes wider. It shows that the CCD in the eastern region has improved, but there is a trend of expanding the absolute difference, and there may be a polarization phenomenon. According to Figure 7b, after 2016, the CCD in the northeastern region gradually evolved into a multi-peak distribution state, indicating that there is a multi-polarization phenomenon in the region, and the spatial imbalance problem needs to be solved. There is an overall trend of rightward shift in the position of the wave peak over time; the height of the wave peak has achieved a significant improvement since 2018, and the width of the wave peak has narrowed, indicating that CCD in the northeastern region has been improved, and a downward trend in the absolute difference in CCD has gradually developed.
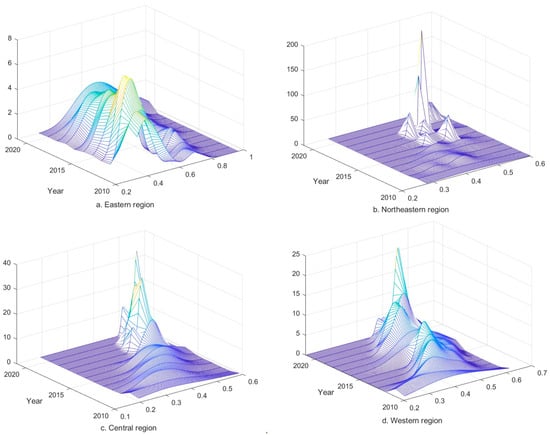
Figure 7.
Kernel density estimation of CCD between RWUE and HQDFS in four major regions. Where (a–d) represent the eastern, north-eastern, central and western regions, respectively.
The results of Kernel density estimation of CCD in the central region are shown in Figure 7c. As can be seen from Figure 7c, the position of the main peak has an overall tendency to shift to the right during the period under examination, indicating an overall increase in CCD in the central region. The wave peaks in the central region sharply went up after 2015 and evolved from a single peak to a double peak after 2010, indicating that the trend of polarization in the region has gradually strengthened; meanwhile, the height of the wave peaks has risen, and the width of the wave peaks has decreased, implying that the work related to narrowing the absolute differences in CCD in the region has been effective. As shown in Figure 7d, the Kernel density estimation results for the western region show that the overall rightward shift in the position of the wave peaks indicates an upward trend in the level of CCD development in the region. The cyclic changes of “low-high” and “wide-narrow” of the wave peaks during the examination period imply that the fluctuation in the absolute difference of CCD in the western region is obvious. In terms of the number of wave peaks, the distribution of wave peaks is relatively stable from 2010 to 2021; there is no multi-peak distribution, reflecting the trend of centrality in the western region.
4.3.3. Characteristics of Spatial Distribution Trends
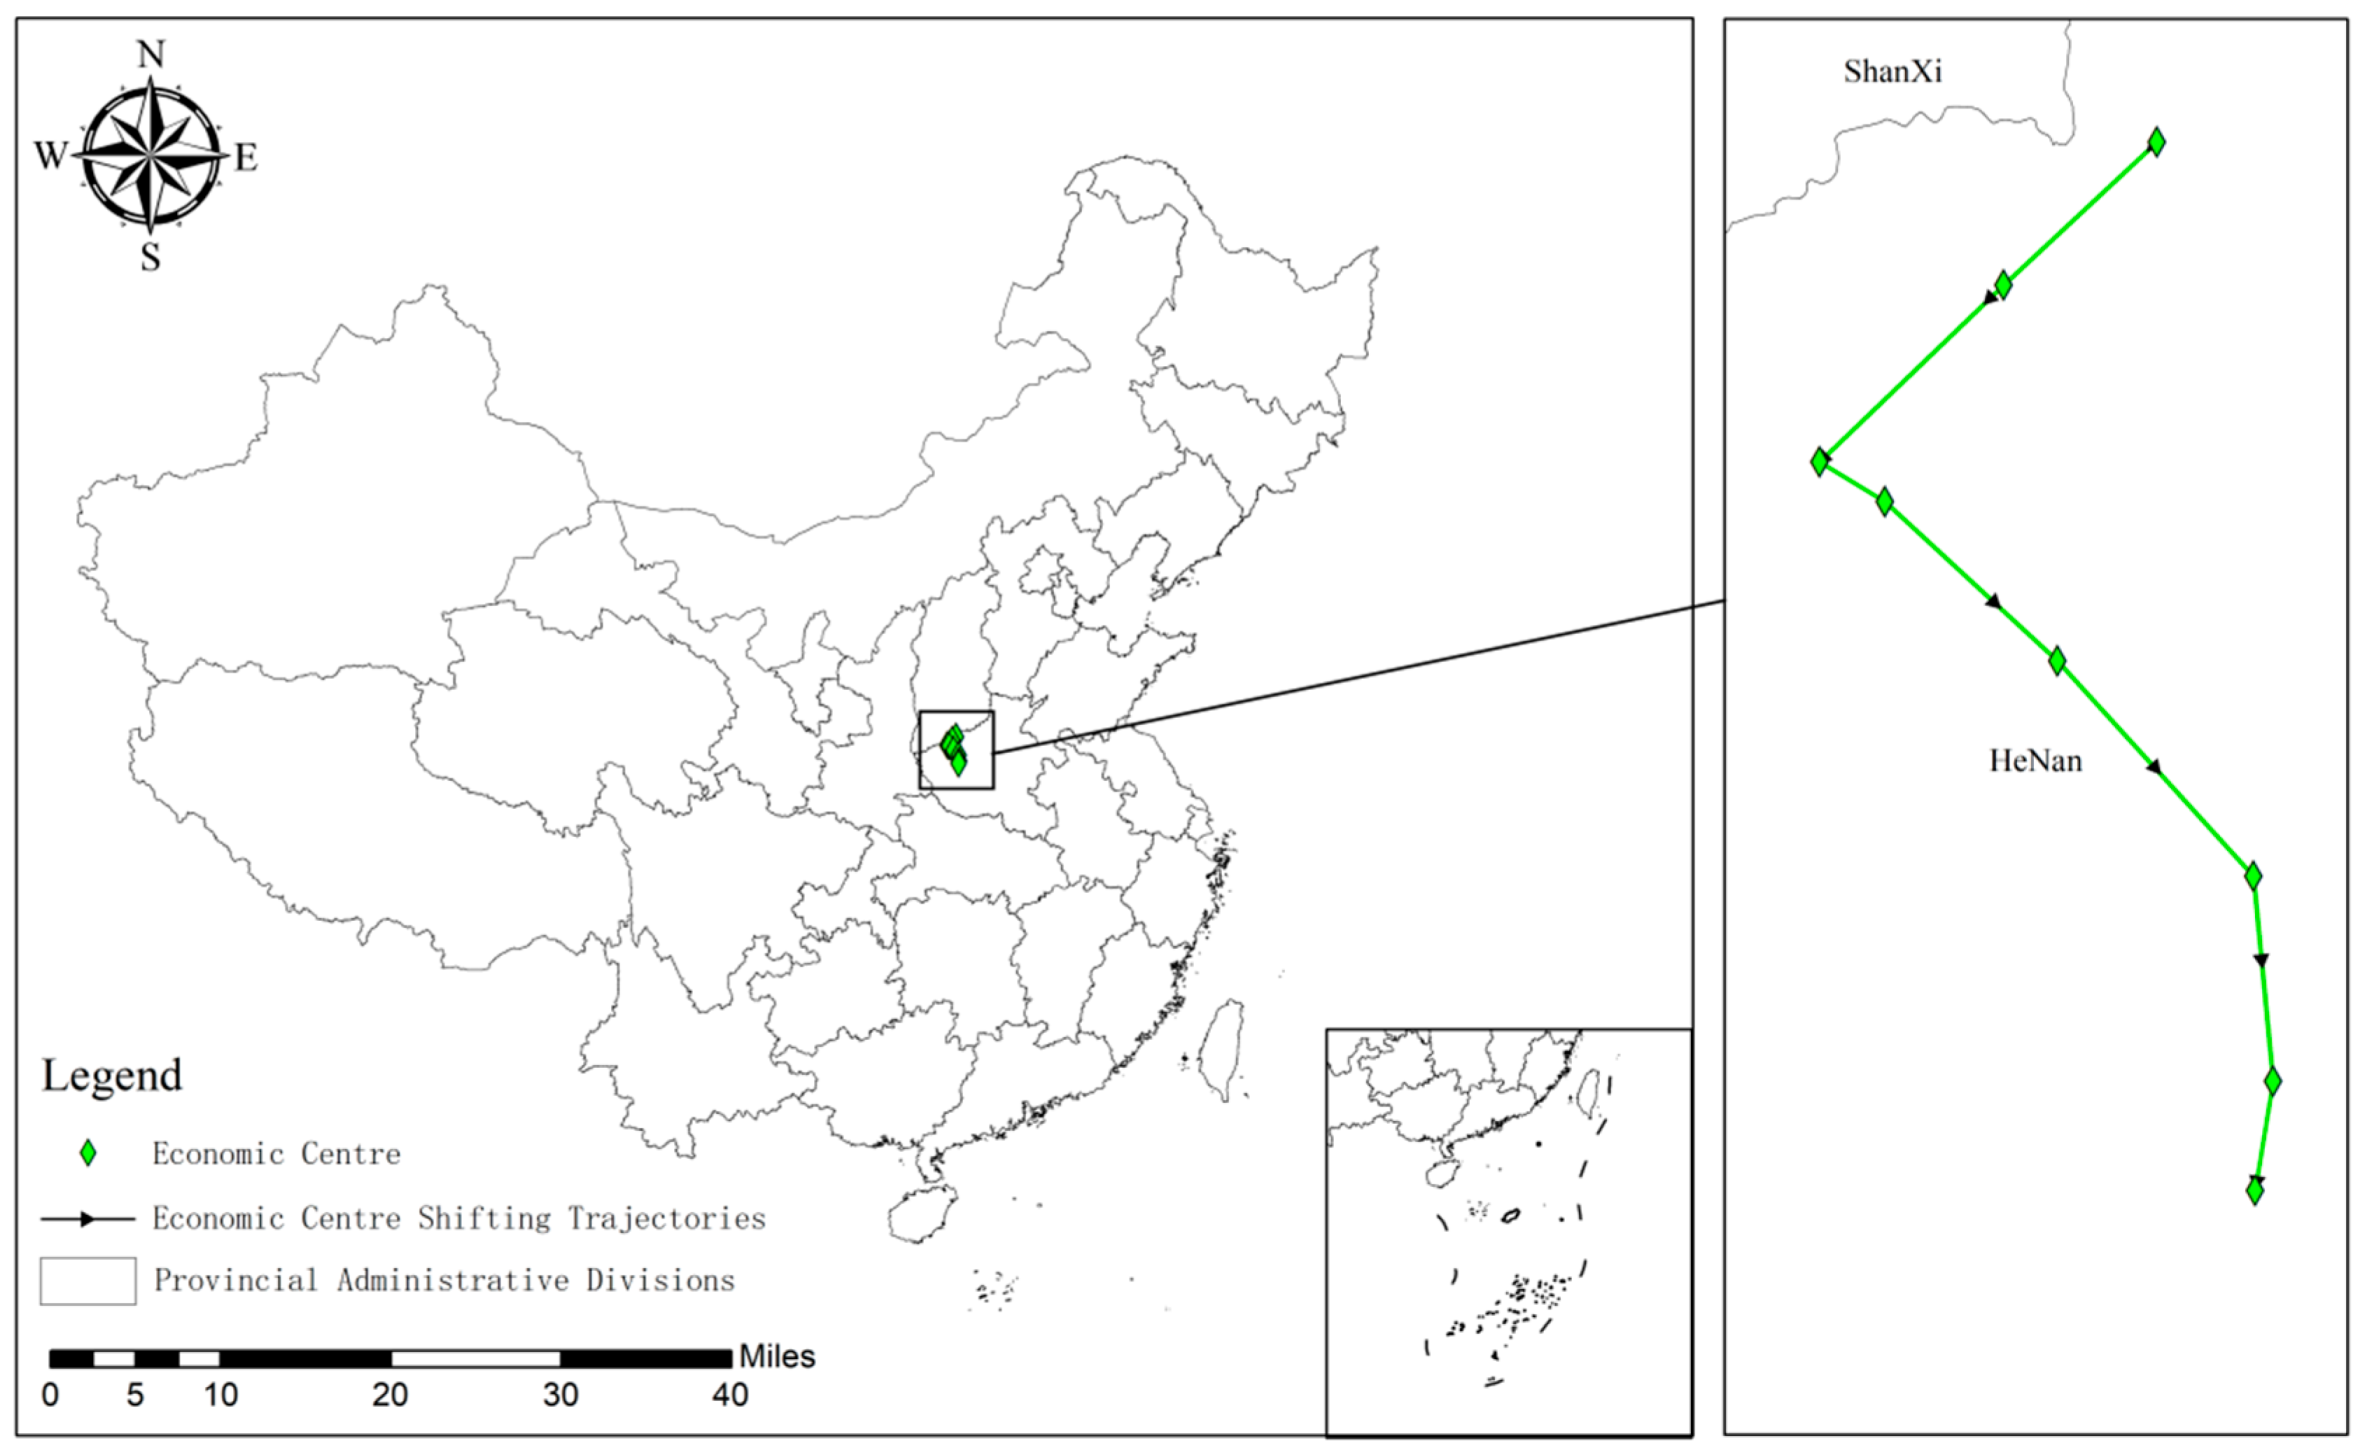
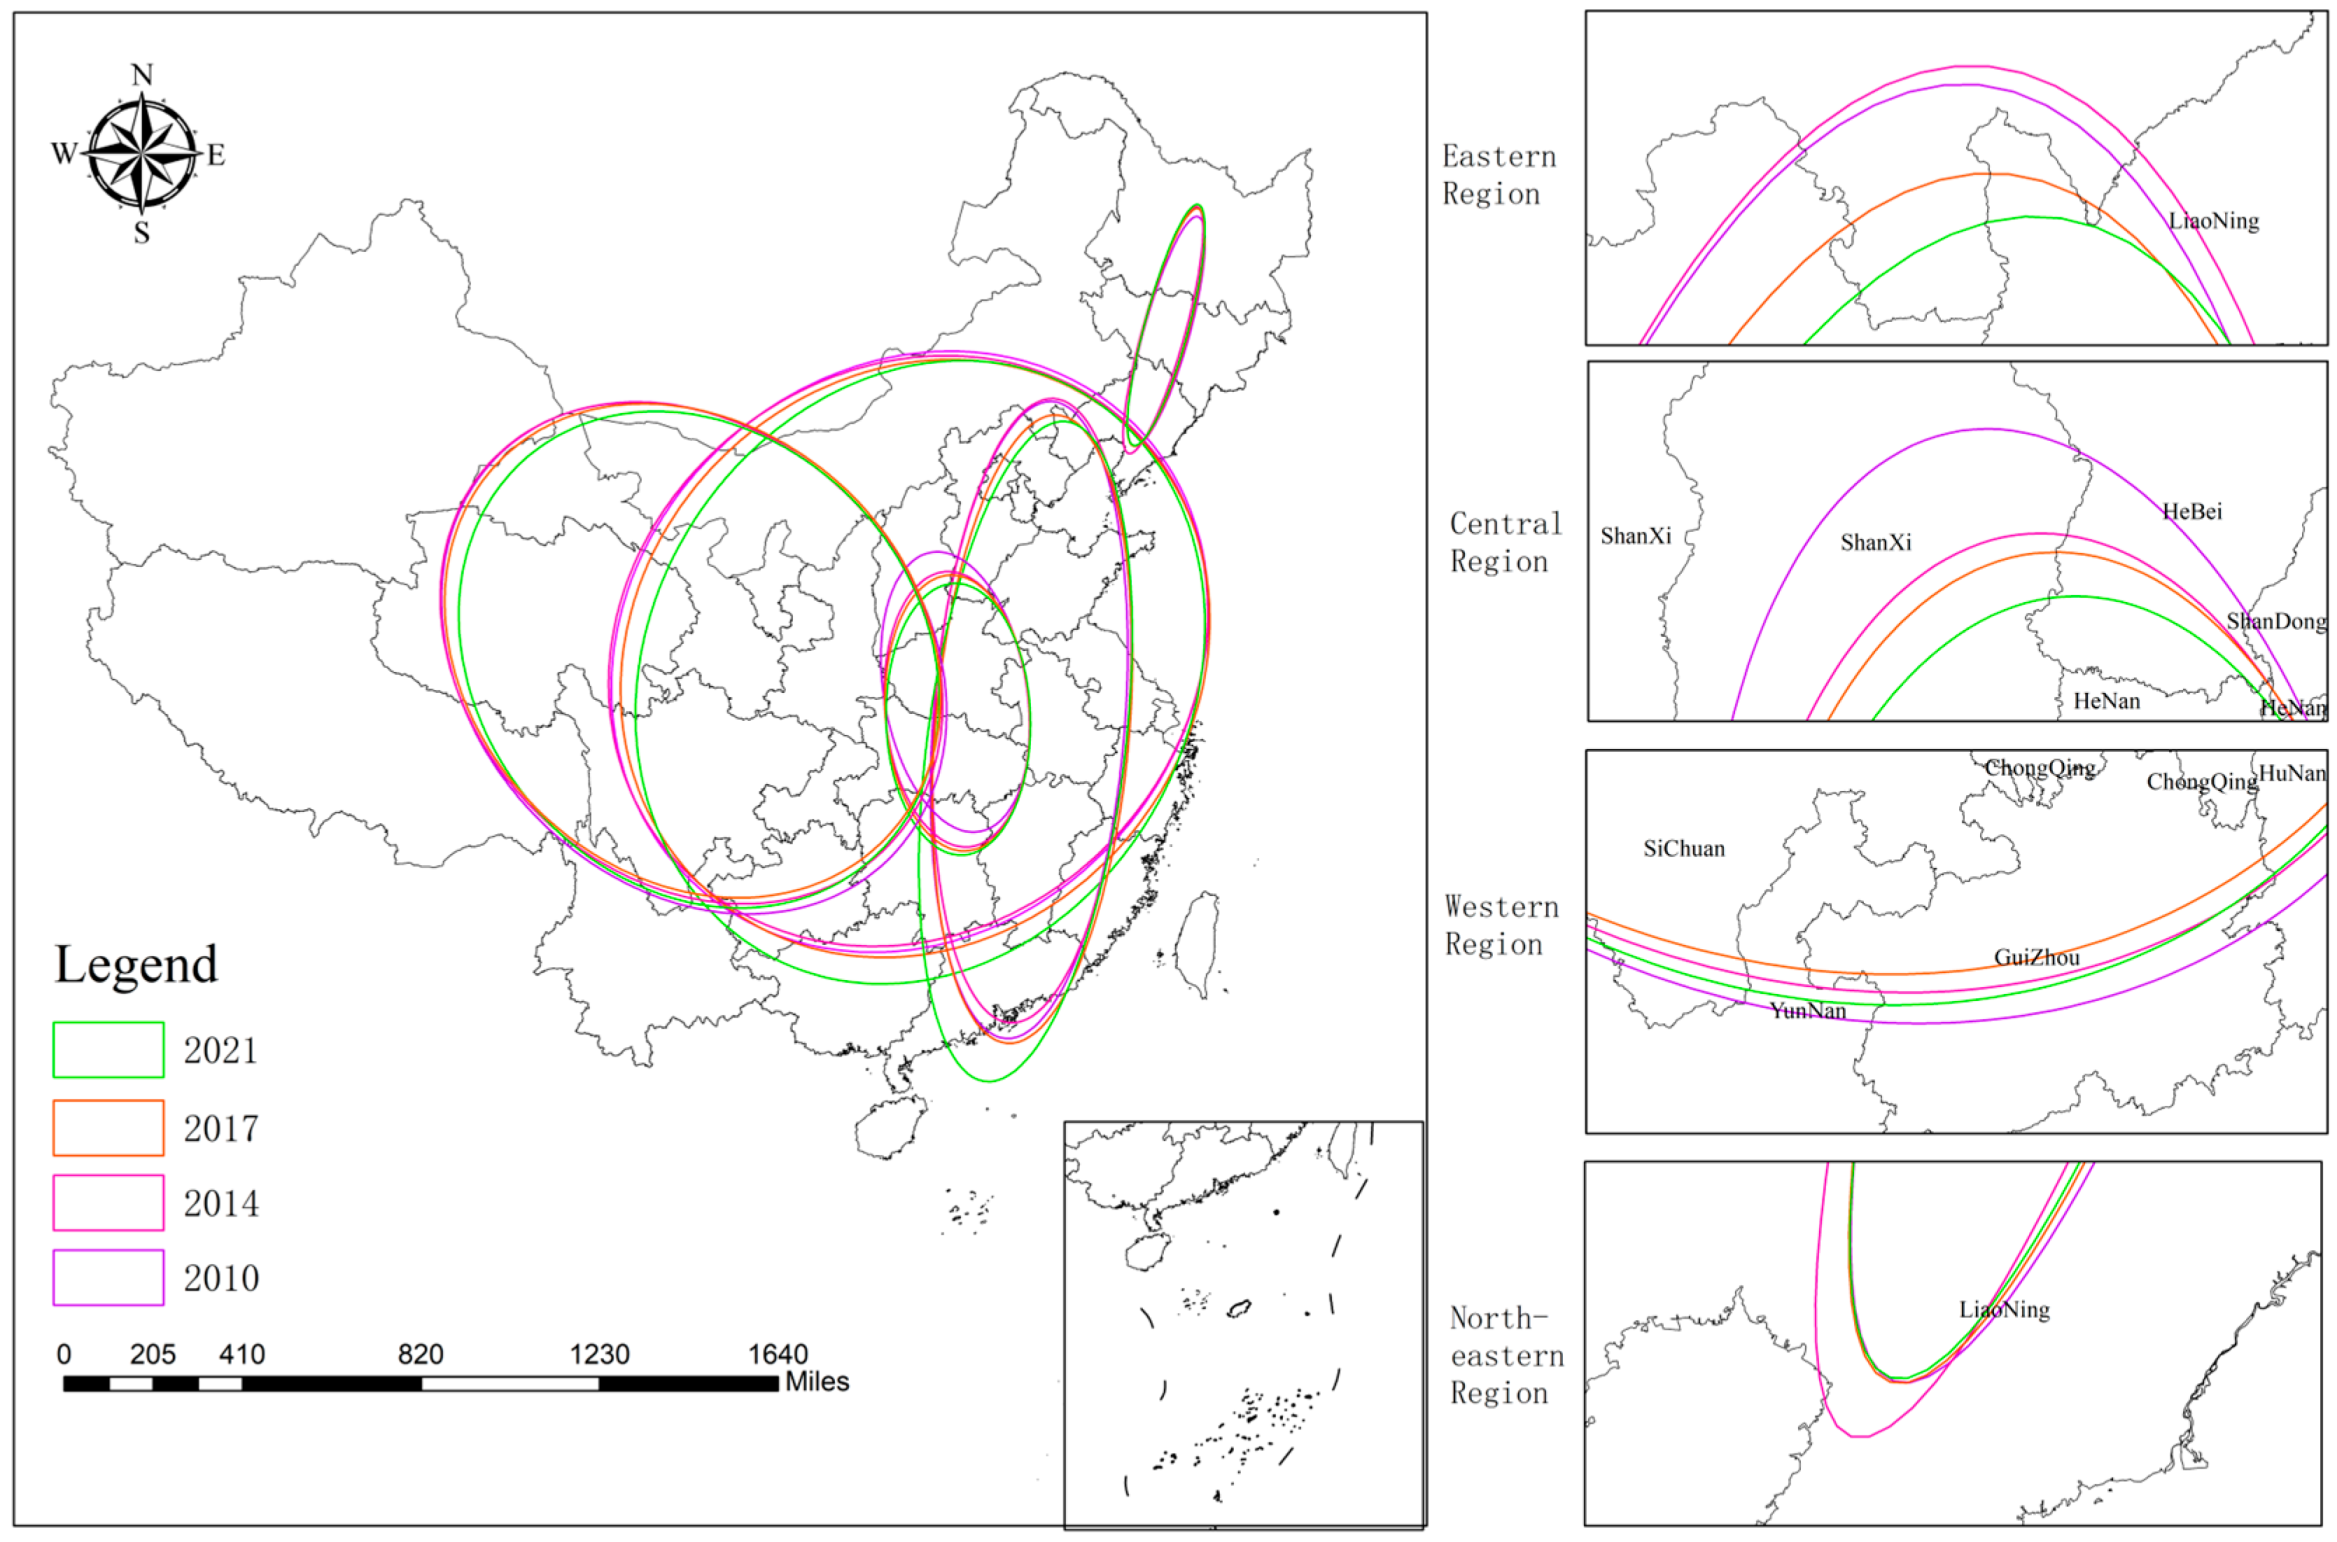
Utilizing ArcGIS Metric Geographic Distribution module, standard deviation ellipses and gravity center shift trajectories were charted for the years 2010, 2014, 2017, and 2021, focusing on the first standard deviation level (as depicted in Figure 8 and Figure 9). To delve deeper into the spatial distribution patterns of CCD between RWUE and HQDFS, this study examines 27 provinces and cities across China.
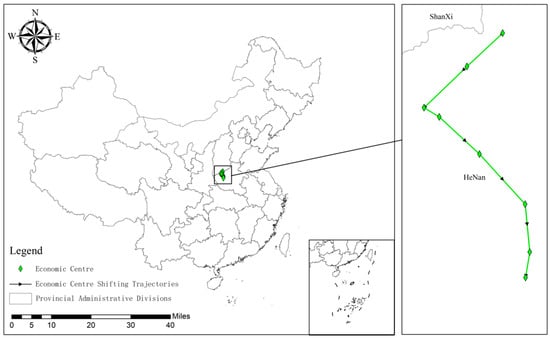
Figure 8.
Migration trajectory of the gravity center for CCD between RWUE and HQDFS (2010–2021).
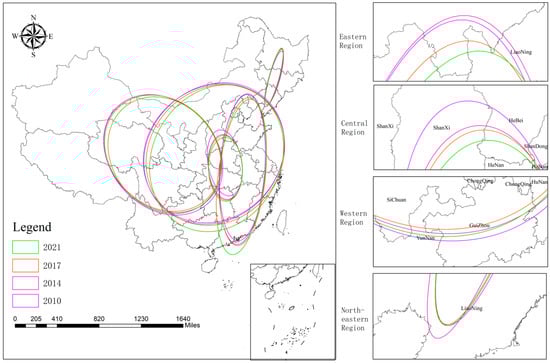
Figure 9.
Standard deviation ellipse of CCD between RWUE and HQDFS.
As depicted in Figure 8, the gravity center of the overall CCD between RWUE and HQDFS exhibits a distinct migration pattern during the study period. Initially, the center is situated in Henan Province and moves in the following directions: first to the lower left, then to the lower right, and finally, it descends vertically. This indicates that the overall CCD between RWUE and HQDFS increased at a faster rate in the southwest than in the northeast in the previous period; subsequently, the southeastern region accelerated its improvement efforts to catch up with the northwestern region. Eventually, the economic gravity shifted southward, indicating that in recent years, the overall CCD between RWUE and HQDFS in the southeastern region has increased more rapidly than in other regions. The higher CCD in the southeast than in other regions can bring multiple benefits to neighboring regions through positive spatial spillover effects, regional synergistic development, ecological improvement, and social welfare enhancement. This high CCD improves not only the overall development level of the region but also promotes balanced inter-regional development.
Figure 9 illustrates that from 2010 to 2021, the standard deviation ellipses of CCD for 27 provinces and cities in China generally approximate a positive circle, predominantly situated in the eastern and central regions. This indicates a more balanced development in the overall CCD between RWUE and HQDFS. Additionally, a ‘northwest to southeast’ spatial distribution pattern is progressively emerging. Figure 9 demonstrates that between 2010 and 2021, the standard deviation ellipse’s dimensions shifted: the long semi-axis increased by 9.525 km, while the short semi-axis decreased by 17.457 km. Concurrently, the ellipse’s area has experienced a slight reduction. This suggests that the spatial distribution of CCD level is exhibiting a clustering trend. On a subregional level, the standard deviation ellipse in the eastern region exhibits a ‘northeast-southwest’ orientation, with an elongation of both the long and short semi-axes and a slight increase in the ellipse’s area. This expansion suggests a reduction in the directional focus of the ellipse in the eastern region, indicating a more dispersed pattern in the level of CCD. In the central region, the standard deviation ellipse aligns with a ‘north-south’ orientation. It has experienced an increase of 0.971 km in the long semi-axis and a reduction of 12.26 km in the short semi-axis, resulting in a slight decrease in the ellipse’s area. This indicates a tightening concentration of the CCD level in the central region, with a less pronounced directional spread. The standard deviation ellipse in the western region has an overall ‘southeast-northwest’ orientation, with both the long and short semi-axes reduced by 5.99 km and 29.08 km, respectively. This contraction suggests that the east–west imbalance in CCD level within the downstream region has diminished. In the northeast region, the standard deviation ellipse has a ‘southwest-northeast’ orientation. The long semi-axis has expanded by 10.97 km, while the short semi-axis has decreased by 1.32 km, leading to a slight increase in the ellipse’s area. This suggests that the directional emphasis of the CCD level in the northeast region has become less pronounced.
4.4. Analysis of the Interaction Between RWUE and HQDFS
4.4.1. Unit Root Test
The efficacy of later analyses may be impacted by spurious regression caused by the volatility of the variables. Consequently, in order to be sure that every variable passes the stationarity test, we must perform a unit root test on the data. The stationarity tests on the model’s variables in this study are carried out using the IPS and LLC tests. Table 7 demonstrates that all p-values are less than 0.01, one sign that this study’s original data are stable and that the PVAR model may be further developed for empirical research.
Table 7.
The unit root test.
4.4.2. The GMM Estimation Results of PVAR Model
This study uses the AIC, BIC, and HQIC information criterion to find the ideal lag order of the PVAR model, ensuring the accuracy of the estimated parameters of the model. After considering the order that corresponds to the lowest information value, these three information criteria determine that lag order 1 is the ideal lag order for the model. Table 8 illustrates that RWUE has a self-inhibitory impact, as seen by the influence coefficient of −0.473 when lagging by one period on itself. In addition, the influence coefficient of HQDFS lagging on RWUE by one period is 0.541, suggesting that HQDFS significantly promotes RWUE. Additionally, it is discovered that HQDFS has a self-promoting impact, as seen by the influence coefficient of HQDFS lagging by one period on itself, which is 0.001. Simultaneously, RWUE may impede the growth of HQDFS, as indicated by its −0.327 effect coefficient on HQDFS when lagging by one period. In conclusion, RWUE and HQDFS are influenced by a complicated system.
Table 8.
GMM estimation results of PVAR model.
4.4.3. Granger Causality Test
This study may examine the possibility of a causal relationship between RWUE and HQDFS further by using the Granger causality test. As can be seen in Table 9, the equivalent p-value is 0.009, which passes the 1% significance level test and indicates that HQDFS is the Granger cause of RWUE, whereas the initial hypothesis is that it is not. In addition, the associated p-value of 0.003, which is significant at the 1% level, indicates that RWUE is the Granger cause of HQDFS when the initial hypothesis is that RWUE is not the Granger cause of HQDFS. Thus, HQDFS can advance RWUE’s development level in addition to helping RWUE promote it.
Table 9.
The results of the granger causality test.
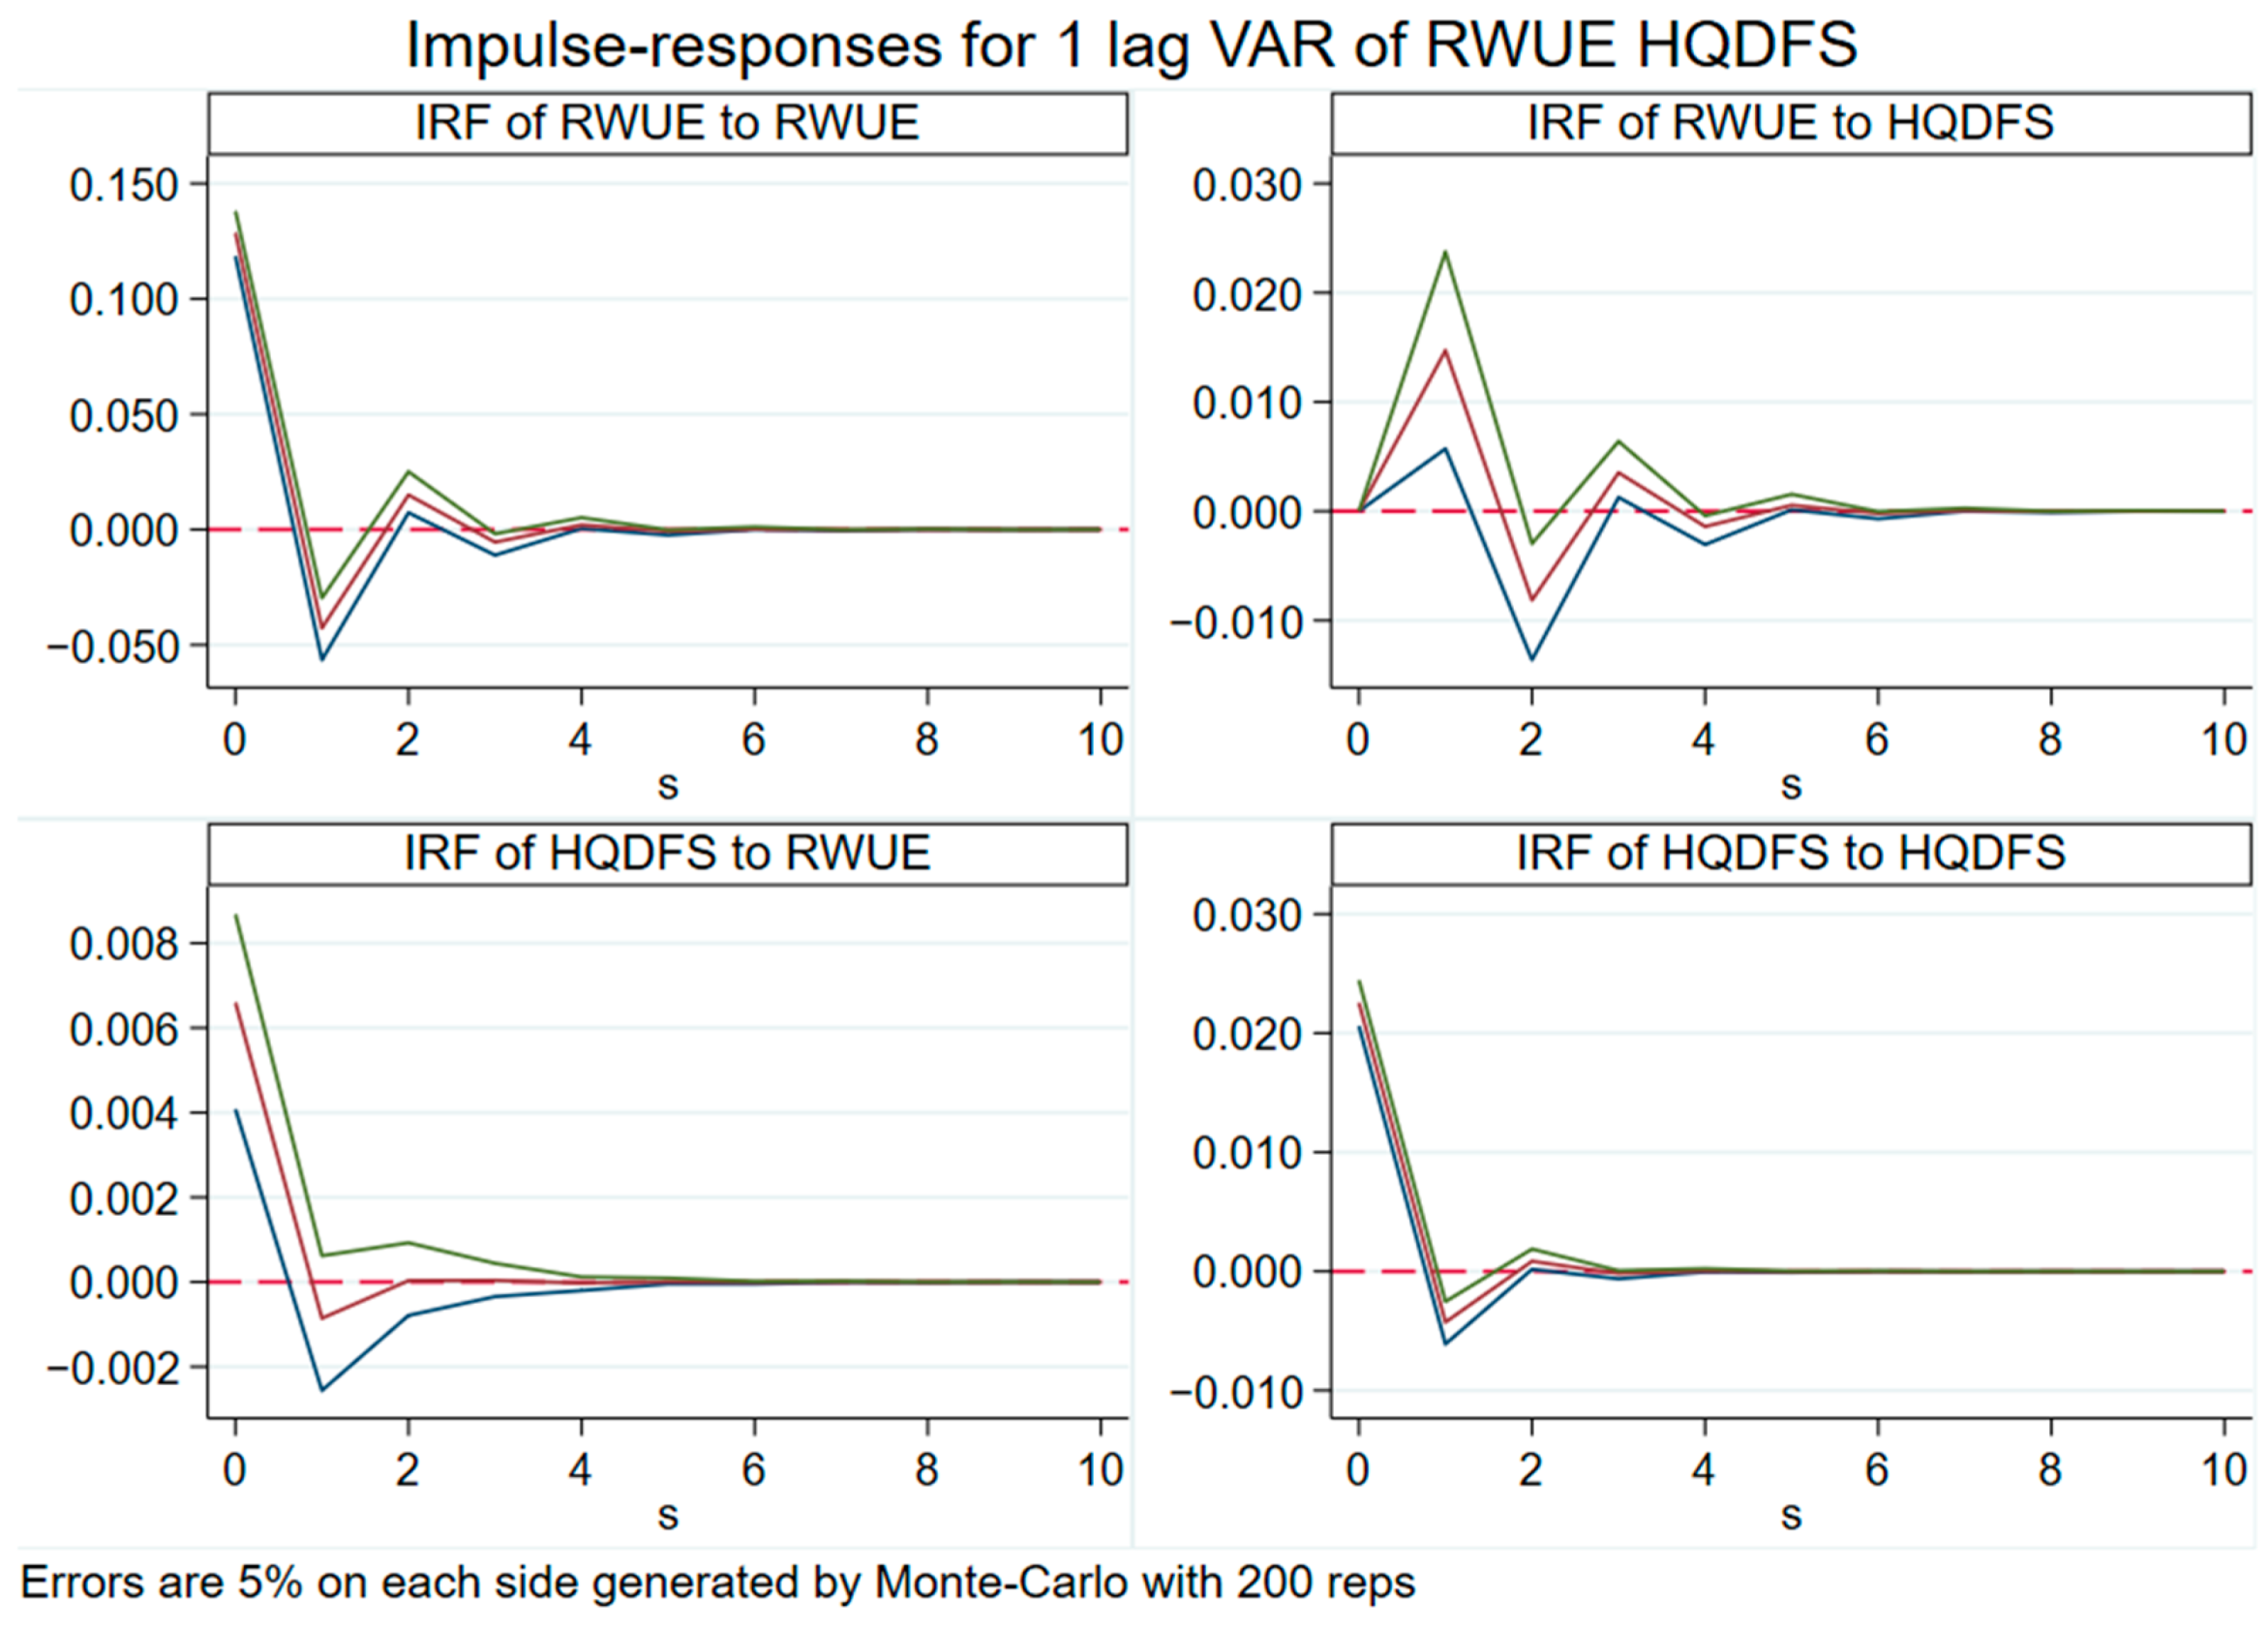
4.4.4. Impulse Response Analysis
The dynamic shock effects between RWUE and HQDFS can be precisely analyzed using the impulse response analysis. As illustrated in Figure 10, the positive impact effect on itself achieves its maximum value in the current period when RWUE sends out a shock with one standard deviation. It fell to negative values in the first period and then started to rebound to zero in the second period. In response to its own shock, HQDFS performs similarly, peaking in the current period, then gradually declining and finally settling at zero. This suggests that they both display a comparatively high level of self-reliance. In addition, the HQDFS responds to zero in the current period when RWUE generates a shock with one standard deviation. This is followed by a significant increase in the first period, a decrease to negative values in the second period, and then fluctuates and varies at a value of zero before finally converging to zero. However, it has a favorable effect in the first period and then returns to a negative effect in the second period, demonstrating that RWUE’s facilitation mechanism on HQDFS is obvious in the first period but swiftly fades thereafter. The improvement in RWUE means that the related industry needs a lot of capital investment, which may lead to the financial industry’s capital flow to reclaimed water-related areas. In the short term, this capital diversion may lower the financial industry’s resource allocation efficiency, affecting its business expansion and profitability, which, in turn, will have a negative impact on the HQDFS. Simultaneously, following the HQDFS shock of one standard deviation, RWUE demonstrates its peak response in the current period and then progressively decreases; however, the bulk of the period shows a favorable effect. The HQDFS may promote the adjustment of industrial structure, but in the short term with a lag, the improvement in the RWUE may not be able to benefit from the industrial restructuring promptly but may be negatively affected by the short-term interest orientation of financial institutions.
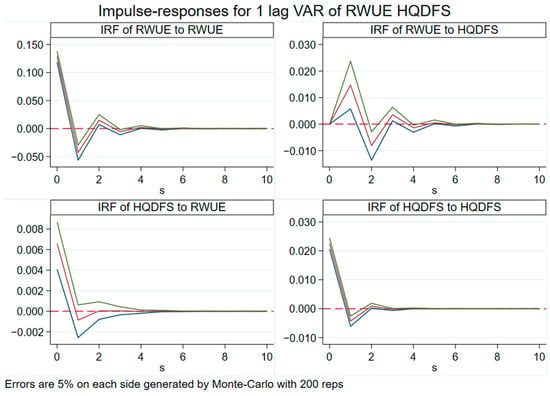
Figure 10.
The impulse response diagram of RWUE and HQDFS.
4.4.5. Variance Decomposition
Variance decomposition is used in this work to examine the contribution connection and level of influence between HQDFS and RWUE. Table 10 makes it clear that RWUE and HQDFS contribute significantly more to themselves than to one another, indicating that the changes in RWUE and HQDFS are mostly caused by their own effects. On the other hand, RWUE’s self-contribution rates exhibit a downward tendency over time. Over time, HQDFS self-contribution rates exhibit a modest rising trend. For instance, the self-contribution rate of HQDFS falls from 92.1% in the first period to 92.2% in the eighth period, and then it remains stable. In contrast, the self-contribution rate of RWUE reduces from 100% in the first period to 98.4% in the tenth period. Furthermore, RWUE displays a tendency of rising HQDFS contributions over time. While the influence contribution rate of HQDFS to RWUE decreases from 7.9% in the first period to 7.8% in the tenth, staying stable thereafter, the influence contribution rate of RWUE to HQDFS increases from an initial 0 to 1.6% in the tenth period. Consequently, it is evident that in our nation, RWUE has a bigger influence on HQDFS than HQDFS has on RWUE. As such, it is possible to promote the high-quality development of reclaimed water, thereby enhancing the efficiency of financial resource allocation, strengthening the competitiveness of financial institutions and promoting the deep integration of finance and the real economy.
Table 10.
The decomposition table of variance between RWUE and HQDFS.
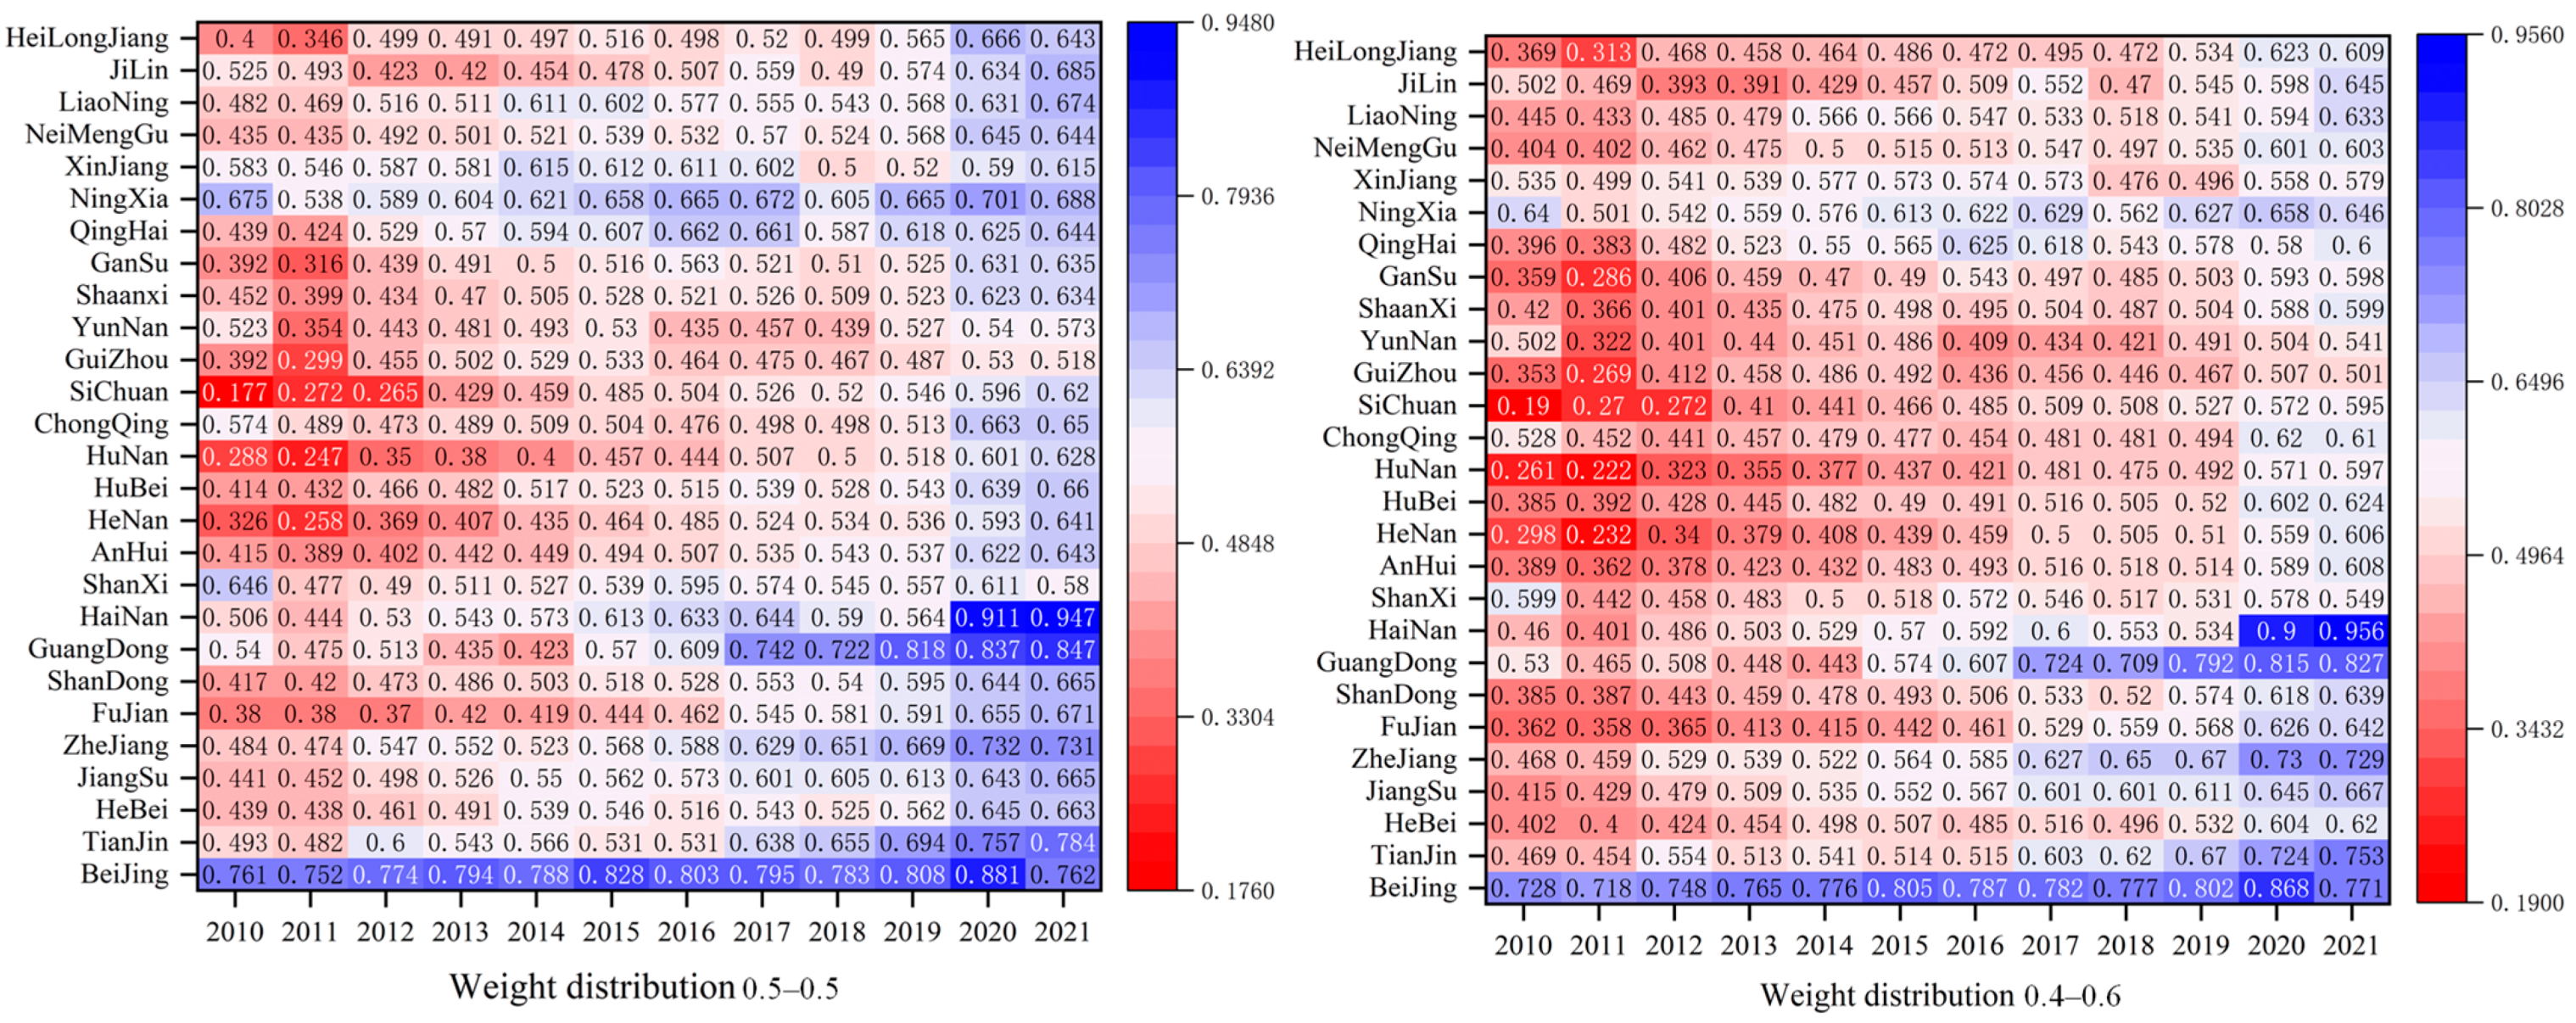
4.5. Sensitivity Analysis
A sensitivity analysis should be carried out to ensure the reliability of the results of the coupled coordination of RWUE and HQDFS. In this study, the results are tested by adjusting the weights of RWUE and HQDFS, and the coupling coordination degree between the two is recalculated by taking the weight distribution of 0.5–0.5 and 0.4–0.6. The calculation results after updating the weights show basic consistency with the previous calculation results, and the results show that most provinces and cities are in the primary coordination stage; the eastern region is slightly higher than other regions. The specific results are shown in Figure 11.
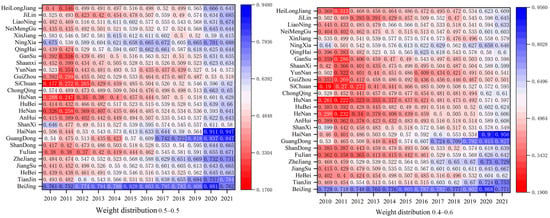
Figure 11.
Results of sensitivity analyses.
5. Conclusions and Policy Recommendations
5.1. Conclusions
Utilizing provincial panel data from China spanning the years 2010 to 2021, this study measures the CCD between RWUE and HQDFS. While the methodological limitations in this study do not allow us to explore how CCD is affected by other external factors, this study provides a comprehensive analysis of the temporal and spatial evolution characteristics of CCD. The conclusions of this study are as follows:
- The CCD of RWUE and HQDFS shows a rising trend in general, and it has been upgraded from barely coordinated to primary coordinated evolution. The key breakthrough to intermediate and quality coordination grades is to improve the level of HQDFS. The eastern region demonstrates a marginally higher mean value of CCD than the western, central, and northeastern regions, achieving a primary coordination level by the end of the examination period. The eastern region should give full play to its demonstration effect, pulling the upgrading of CCD in the neighboring regions, strengthening inter-regional cooperation, and creating a mutually beneficial and complementary situation. Similarly, the western, central, and northeastern areas have also made progress, reaching the primary coordination level during the same timeframe.
- The overall spatial variance of CCD shows a fluctuating downward trend. The core of solving the problem of uneven spatial distribution of CCD is to reduce the inter-regional difference, and the contribution of intra-regional difference and hypervariable density contribution to the spatial difference is relatively small. The largest intra- and inter-regional differences are found in the eastern and western regions. China should increase its financial investment in the western region, especially in infrastructure development, scientific and technological innovation, and ecological environmental protection, to address the problem of excessive inter-regional disparities. And the largest intra-regional differences are found in the eastern region. The eastern region should address the problem of polarization, i.e., the over-coordination of individual regional couplings and the wide gap with neighboring regions, by strengthening the circulation of talents and technical exchanges between provinces and cities and by disseminating successful experiences to reduce intra-regional disparities.
- The distribution curve of the CCD from 2010 to 2021 shows an overall rightward shifting trend, with the height of the main peak rising and the width of the peak decreasing, indicating that the absolute difference in CCD has a tendency to decrease, and there is a dynamic convergence characteristic. The CCD between the eastern and northeastern regions showed an increase, yet there is a tendency for the absolute differences to widen, potentially indicating the emergence of a polarization phenomenon. Meanwhile, the central region has experienced a shift from a single peak to a double peak in its distribution, suggesting that polarization trends within the region have been intensifying. The standard deviation of CCD, elliptical in shape, approximates a positive circle and is predominantly situated in China’s eastern and central regions. It is gradually exhibiting a ‘northwest-southeast’ spatial distribution pattern.
- The spatial autocorrelation between RWUE and HQDFS shows that the mechanism by which RWUE contributes to HQDFS is very pronounced in the first period, while at the same time, under a one-standard-deviation shock to HQDFS, RWUE exhibits a peak response in the current period, followed by a gradual decline, but exhibits favorable impacts for most of the period. Therefore, the facilitating effect of RWUE on HQDFS can be fully utilized, which not only promotes the simultaneous development of HQDFS but also improves the level of CCD between the two.
5.2. Policy Recommendations
To make the CCD of RWUE and HQDFS in China synergistically optimized across regions, and to accelerate the construction of a development system for RWUE, based on the above conclusions, the following policy recommendations are proposed:
The first focuses on improving the level of HQDFS and exploiting the potential for CCD between RWUE and HQDFS. Based on the conclusions of the above study, it can be seen that the key to achieving high-quality coordination between the two is to improve the level of HQDFS. In light of this, prioritizing HQDFS is essential for advancing the construction of reclaimed water systems. To initiate this process, it is imperative to bolster the financial sector’s infrastructure. Another is to improve the financial regulatory system. The last is to promote the deep integration of the financial sector and technology. Financial institutions should actively introduce and apply new technologies, such as artificial intelligence and blockchain, to improve the efficiency and quality of financial services.
The second is to remove regional heterogeneity and explore the path of constructing benign synergies between RWUE and HQDFS. From the findings of this study, it is clear that inter-regional differences are the main source of differences in CCD among the four major regions in China. Therefore, from the perspective of the four major regions, to focus on reducing interregional differences, we should start with the eastern and western regions, which have the greatest inter-regional differences, and promote the docking and development of the two major regions; the central and western regions should give fuller play to their comparative advantages, such as their resource advantages and location advantages, and promote industrial upgrading and rapid economic growth through policy guidance and market mechanisms.
The third is to actively build a spatially linked synergistic development pattern of RWUE and HQDFS. As can be seen from the empirical results, there is a spatial correlation between the RWUE and HQDFS in most provinces and neighboring provinces. Hence, to make effective use of positive interregional spatial spillovers, it is important to create special working groups to optimize the CCD patterns specific to each region, based on the changing trends and spatial differences in CCD development in the eastern, western, central, and northeastern regions. These working groups should focus on the characteristics of their regions to enhance the level of CCD development of their respective provinces in the future and to make efficient use of the results of high CCD development already achieved by neighboring provinces.
5.3. Limitations and Prospects
This study uses the coupling coordination degree model to investigate the relationship between RWUE and HQDFS and employs a series of models to verify the spatial and temporal characteristics of the coupling relationship between the two. However, the provincial research object was selected in the research scale, and the spatial scale is too large, which may affect the robustness of the conclusions of this study. Further, only the influence effect between the two systems was considered, failing to take into account the influence effect of other external factors on this coupling degree. Therefore, in the future, the research object can be set to the city scale to consider the influence of policy regulation, economic environment technological innovation, and other factors on the degree of coordination of the two couplings, to provide a richer and more detailed empirical value for the coordinated development of reclaimed water and the financial industry.
Author Contributions
Conceptualization, Y.Z.; methodology, Y.Z.; software, Y.Z.; validation, Y.Z., F.W. and G.L.; formal analysis, Y.Z.; investigation, Y.Z.; resources, Y.Z.; data curation, Y.Z.; writing—original draft preparation, Y.Z.; writing—review and editing, Y.Z.; visualization, Y.Z.; supervision, G.L.; project administration, C.F.; funding acquisition, F.W. All authors have read and agreed to the published version of the manuscript.
Funding
This research was funded by the National Natural Science Foundation of China (Grant No. 42271303).
Data Availability Statement
The authors do not have permission to share data.
Acknowledgments
The author appreciates all the participants and anonymous reviewers for their valuable comments and criticisms.
Conflicts of Interest
The authors declare that they have no known competing financial interests or personal relationships that could have appeared to influence the work reported in this study.
References
- Lee, D.G.; Roehrdanz, P.R.; Feraud, M.; Ervin, J.; Anumol, T.; Jia, A.; Park, M.; Tamez, C.; Morelius, E.W.; Gardea-Torresdey, J.L.; et al. Wastewater compounds in urban shallow groundwater wells correspond to exfiltration probabilities of nearby sewers. Water Res. 2015, 85, 467–475. [Google Scholar] [CrossRef] [PubMed]
- Zhou, L.; Kong, X.; Shen, G.; Li, Y.; Zhu, H.; Chen, T.; Yan, Y.; Liu, Y. Spatial-temporal impacts of landscape metrics and uses of land reclamation on coastal water conditions: The case of Macao. Ecol. Indic. 2023, 154, 110518. [Google Scholar] [CrossRef]
- Cheng, H.-H.; Yu, W.-S.; Tseng, S.-C.; Wu, Y.-J.; Hsieh, C.-L.; Lin, S.-S.; Chu, C.-P.; Huang, Y.-D.; Chen, W.-R.; Lin, T.-F.; et al. Reclaimed water in Taiwan: Current status and future prospects. Sustain. Environ. Res. 2023, 33, 16. [Google Scholar] [CrossRef]
- Zheng, Y.; Shen, A.; Li, R.; Yang, Y.; Wang, S.; Cheng, L.-Y. Spillover effects between internet financial industry and traditional financial industry: Evidence from the Chinese stock market. Pac.-Basin Financ. J. 2023, 79, 101971. [Google Scholar] [CrossRef]
- Hepburn, C.; Qi, Y.; Stern, N.; Ward, B.; Xie, C.; Zenghelis, D. Towards carbon neutrality and China’s 14th Five-Year Plan: Clean energy transition, sustainable urban development, and investment priorities. Environ. Sci. Ecotechnol. 2021, 8, 100130. [Google Scholar] [CrossRef]
- Tan, L.; Yang, Z.; Irfan, M.; Ding, C.J.; Hu, M.; Hu, J. Toward low-carbon sustainable development: Exploring the impact of digital economy development and industrial restructuring. Bus. Strategy Environ. 2024, 33, 2159–2172. [Google Scholar] [CrossRef]
- Xu, J.; Wei, D.; Wang, F.; Bai, C.; Du, Y. Bioassay: A useful tool for evaluating reclaimed water safety. J. Environ. Sci. 2020, 88, 165–176. [Google Scholar] [CrossRef]
- Bals, L.; Taylor, K.M.; Rosca, E.; Ciulli, F. Toward a circular supply chain: The enabling role of information and financial flows in open and closed loop designs. Resour. Conserv. Recycl. 2024, 209, 107781. [Google Scholar] [CrossRef]
- Aloulou, M.; Grati, R.; Al-Qudah, A.A.; Al-Okaily, M. Does FinTech adoption increase the diffusion rate of digital financial inclusion? A study of the banking industry sector. J. Financ. Rep. Account. 2024, 22, 289–307. [Google Scholar] [CrossRef]
- Gao, Y.; Xu, Y.M.; Ji, C.F.; Zhong, Y.P. Research on the measurement of the level of high-quality development of China’s financial sector and the characteristics of spatial and temporal distribution. Res. Quant. Econ. Tech. Econ. 2020, 37, 63–82. [Google Scholar]
- Gao, Z.; Li, L.; Hao, Y. Resource industry dependence and high-quality economic development of Chinese style: Reexamining the effect of the “Resource Curse”. Struct. Change Econ. Dyn. 2024, 68, 1–16. [Google Scholar] [CrossRef]
- Hosseini, M.; Shahverdian, M.H.; Sayyaadi, H.; Javadijam, R. Renewable Energy Supplying Strategy for a Greenhouse Based on the Water-Energy-Economy Nexus. J. Clean. Prod. 2024, 457, 142388. [Google Scholar] [CrossRef]
- Lee, J.M.; Taylor, L.O.; Berglund, E.Z. Water use in the landscape: A comparison of water quality and irrigation technologies on behavior. Water Resour. Res. 2021, 57, e2020WR028853. [Google Scholar] [CrossRef]
- Badruzzaman, M.; Anazi, J.R.; Al-Wohaib, F.A.; Al-Malki, A.A.; Jutail, F. Municipal reclaimed water as makeup water for cooling systems: Water efficiency, biohazards, and reliability. Water Resour. Ind. 2022, 28, 100188. [Google Scholar] [CrossRef]
- Nguyen, Q.K. Globalization, credit information sharing and financial stability in developing countries. Econ. Change Restruct. 2024, 57, 254. [Google Scholar] [CrossRef]
- Wu, J.; Xia, L. Double well stochastic resonance for a class of three-dimensional financial systems. Chaos Solitons Fractals 2024, 181, 114632. [Google Scholar] [CrossRef]
- Hu, A.; Zhou, S. Green development: Function definition, mechanism analysis and development strategy. China Popul.-Resour. Environ. 2014, 24, 14–20. [Google Scholar]
- Jiakui, C.; Abbas, J.; Najam, H.; Liu, J.; Abbas, J. Green technological innovation, green finance, and financial development and their role in green total factor productivity: Empirical insights from China. J. Clean. Prod. 2023, 382, 135131. [Google Scholar] [CrossRef]
- Song, M.; Wang, R.; Zeng, X. Water resources utilization efficiency and influence factors under environmental restrictions. J. Clean. Prod. 2018, 184, 611–621. [Google Scholar] [CrossRef]
- Cao, X.; Zeng, W.; Wu, M.; Li, T.; Chen, S.; Wang, W. Water resources efficiency assessment in crop production from the perspective of water footprint. J. Clean. Prod. 2021, 309, 127371. [Google Scholar] [CrossRef]
- Li, X.; Feng, Y.; Chiu, Y.; Lin, T.; Chiu, S. Recycling water and sludge disposal efficiency in China’s sewage treatment industry. Manag. Decis. Econ. 2021, 42, 1703–1717. [Google Scholar] [CrossRef]
- Chen, S.; Chen, Z.; Zhang, Y.; Huang, J. A coupled modeling framework to screen reclaimed water supplement schemes in an urban watershed. J. Hydrol. Reg. Stud. 2023, 50, 101602. [Google Scholar] [CrossRef]
- Li, Q.; Wang, W.; Jiang, X.; Lu, D.; Zhang, Y.; Li, J. Analysis of the potential of reclaimed water utilization in typical inland cities in northwest China via system dynamics. J. Environ. Manag. 2020, 270, 110878. [Google Scholar] [CrossRef]
- Wang, F.; Wang, R.; He, Z. The impact of environmental pollution and green finance on the high-quality development of energy based on spatial Dubin model. Resour. Policy 2021, 74, 102451. [Google Scholar] [CrossRef]
- Yang, Y.; Su, X.; Yao, S. Nexus between green finance, fintech, and high-quality economic development: Empirical evidence from China. Resour. Policy 2021, 74, 102445. [Google Scholar] [CrossRef]
- Zhang, L.; Yang, S.; Dong, Z. Evaluating disparities and convergence of financial support efficiency for resource recycling in-dustry in China. J. Clean. Prod. 2023, 398, 136655. [Google Scholar] [CrossRef]
- Dong, F.; Li, Y. How does industrial convergence affect regional high-quality development? Evidence from China. J. Asia Pac. Econ. 2024, 29, 1650–1683. [Google Scholar] [CrossRef]
- Kubayevich, K.F. Current Analysis and Current Issues of Ensuring the Financial Stability of the Banking System in Uzbekistan. Eur. J. Bus. Startups Open Soc. 2024, 4, 169–176. [Google Scholar]
- Misati, R.; Osoro, J.; Odongo, M.; Abdul, F. Does digital financial innovation enhance financial deepening and growth in Kenya? Int. J. Emerg. Mark. 2024, 19, 679–705. [Google Scholar] [CrossRef]
- Song, W.; Sun, Z.; Fournier-Viger, P.; Wu, Y. MRI-CE: Minimal rare itemset discovery using the cross-entropy method. Inf. Sci. 2024, 665, 120392. [Google Scholar] [CrossRef]
- Tang, Q.; Ma, L.; Zhao, D.; Sun, Y.; Lei, J.; Wang, Q. A dual-robot cooperative arc welding path planning algorithm based on multi-objective cross-entropy optimization. Robot. Comput.-Integr. Manuf. 2024, 89, 102760. [Google Scholar] [CrossRef]
- Tiwari, A.K.; Menegaki, A.N. Editorial special issue: Novel longitudinal data research methods in renewable energy use and management. Renew. Energy 2024, 223, 120019. [Google Scholar] [CrossRef]
- Wu, F.; Yao, X.; Gong, J.; Hu, Y.; Wang, T.; Zhao, N. A novel hybrid method for the stationary non-Gaussian wind pressures simulation based on maximum entropy method and moment-based translation function. Mech. Syst. Signal Process. 2024, 210, 111167. [Google Scholar] [CrossRef]
- Li, J.; Sun, W.; Li, M.; Meng, L. Coupling coordination degree of production, living and ecological spaces and its influencing factors in the Yellow River Basin. J. Clean. Prod. 2021, 298, 126803. [Google Scholar] [CrossRef]
- Tomal, M. Evaluation of coupling coordination degree and convergence behaviour of local development: A spatio-temporal analysis of all Polish municipalities over the period 2003–2019. Sustain. Cities Soc. 2021, 71, 102992. [Google Scholar] [CrossRef]
- Dong, F.; Li, W. Research on the coupling coordination degree of “upstream-midstream-downstream” of China’s wind power industry chain. J. Clean. Prod. 2021, 283, 124633. [Google Scholar] [CrossRef]
- Fei, J.; Lin, Y.; Jiang, Q.; Jiang, K.; Li, P.; Ye, G. Spatio temporal coupling coordination measurement on islands’ economy-environment-tourism system. Ocean. Coast. Manag. 2021, 212, 105793. [Google Scholar] [CrossRef]
- Li, W.; Wang, Y.; Xie, S.; Cheng, X. Coupling coordination analysis and spatiotemporal heterogeneity between urbanization and ecosystem health in Chongqing municipality, China. Sci. Total Environ. 2021, 791, 148311. [Google Scholar] [CrossRef]
- Aibai, A.; Huang, X.; Luo, Y.; Peng, Y. Foreign direct investment, institutional quality, and financial development along the belt and road: An empirical investigation. Emerg. Mark. Financ. Trade 2019, 55, 3275–3294. [Google Scholar] [CrossRef]
- Sandow, J.N.; Oteng-Abayie, E.F.; Sakyi, D.; Obuobi, B. Financial sector development and natural resource rents: The role of institutions in Sub-Saharan Africa. Environ. Sci. Pollut. Res. 2022, 29, 89340–89357. [Google Scholar] [CrossRef]
- Chen, L.; Qi, B. The “Supply-Side Reform Policy” and the Share of Labor Income in Enterprises. Sustainability 2024, 16, 5231. [Google Scholar] [CrossRef]
- Luo, H.; Qu, X. Export trade, absorptive capacity, and high-quality economic development in China. Systems 2023, 11, 54. [Google Scholar] [CrossRef]
- Mentes, M. Sustainable development economy and the development of green economy in the European Union. Energy Sustain. Soc. 2023, 13, 32. [Google Scholar] [CrossRef]
- Tian, X.; Tu, G.; Wang, Y. The real effects of shadow banking: Evidence from China. Manag. Sci. 2024, 70, 8556–8582. [Google Scholar] [CrossRef]
- Liu, M.; Li, S.; Li, Y.; Shi, J.; Bai, J. Evaluating the synergistic effects of digital economy and government governance on urban low-carbon transition. Sustain. Cities Soc. 2024, 105, 105337. [Google Scholar] [CrossRef]
- Alamsyah, A.; Kusuma, G.N.W.; Ramadhani, D.P. A Review on Decentralized Finance Ecosystems. Future Internet 2024, 16, 76. [Google Scholar] [CrossRef]
- Li, J.; Dai, C.; Lv, B.; Xu, A.; Zhang, J. Connotation and evaluation of high-quality development of finance in the context of the new era—An empirical study based on inter-provincial panel data. Res. Financ. Regul. 2019, 1, 15–30. [Google Scholar]
- Liu, Y.; Feng, X.; Lou, J.; Hu, L.; He, Z. Central node identification via weighted kernel density estimation. Data Min. Knowl. Discov. 2024, 38, 1417–1439. [Google Scholar] [CrossRef]
- Graham, B.S.; Niu, F.; Powell, J.L. Kernel density estimation for undirected dyadic data. J. Econom. 2024, 240, 105336. [Google Scholar] [CrossRef]
- Wang, C.; Ibrahim, H.; Wu, F.; Chang, W. Spatial and temporal evolution patterns and spatial spillover effects of carbon emissions in China in the context of digital economy. J. Environ. Manag. 2025, 373, 123811. [Google Scholar] [CrossRef]
- Lefever, D.W. Measuring geographic concentration by means of the standard deviational ellipse. Am. J. Sociol. 1926, 32, 88–94. [Google Scholar] [CrossRef]
- Duman, Z.; Mao, X.; Cai, B.; Zhang, Q.; Chen, Y.; Gao, Y.; Guo, Z. Exploring the spatiotemporal pattern evolution of carbon emissions and air pollution in Chinese cities. J. Environ. Manag. 2023, 345, 118870. [Google Scholar] [CrossRef] [PubMed]
- Yang, Z.; Xiu, Q.H.; Chen, D.X. Industry in Hong Kong and the underlying policies. Transp. Policy 2019, 82, 138–147. [Google Scholar] [CrossRef]
- Xu, X. Intraday price information flows between the CSI300 and futures market: An application of wavelet analysis. Empir. Econ. 2018, 54, 1267–1295. [Google Scholar] [CrossRef]
- Xu, X. Contemporaneous and Granger causality among US corn cash and futures prices. Eur. Rev. Agric. Econ. 2019, 46, 663–695. [Google Scholar] [CrossRef]
- Xu, X. Corn cash price forecasting. Am. J. Agric. Econ. 2020, 102, 1297–1320. [Google Scholar] [CrossRef]
- Gao, C.; Cao, M.; Wen, Y.; Li, C. Coupling and interaction between science and technology finance and green development: Based on coupling coordination degree model and panel vector autoregression model. Front. Environ. Sci. 2023, 11, 274. [Google Scholar] [CrossRef]
- Rey, S.J.; Smith, R.J. A spatial decomposition of the Gini coefficient. Lett. Spat. Resour. Sci. 2013, 6, 55–70. [Google Scholar] [CrossRef]

Disclaimer/Publisher’s Note: The statements, opinions and data contained in all publications are solely those of the individual author(s) and contributor(s) and not of MDPI and/or the editor(s). MDPI and/or the editor(s) disclaim responsibility for any injury to people or property resulting from any ideas, methods, instructions or products referred to in the content. |
© 2025 by the authors. Licensee MDPI, Basel, Switzerland. This article is an open access article distributed under the terms and conditions of the Creative Commons Attribution (CC BY) license (https://creativecommons.org/licenses/by/4.0/).