Abstract
As an emerging economic phenomenon, deindustrialization has begun to be valued. Rapid economy and industrial upgrading have resulted in various deindustrialization across mainland China’s provinces, especially premature deindustrialization. In order to scientifically measure deindustrialization with the new criteria, we investigate the spatiotemporal heterogeneities of deindustrialization in mainland China during 2008–2050 using the fixed-effects regression model, Geodetector, and the ARIMA time trend model. Premature deindustrialization appeared in Beijing and Hainan, while it does not occur in China’s most eastern and central provinces, with a pronounced trend toward output-based deindustrialization. The scale of manufacturing employment is the primary determinant of deindustrialization, while the share of tertiary industry value added in GDP is the key driver of output-based deindustrialization. Interaction analysis reveals that employment-based deindustrialization is mainly affected by the industrial labor force, while output-based deindustrialization is intensified through interactive effects such as enterprise agglomeration. By 2050, deindustrialization will appear in 6 of China’s provinces, while premature deindustrialization will appear in 14 provinces. The Bohai Rim and Southwest provinces will be the core areas of China’s premature deindustrialization. To mitigate the adverse effects of premature deindustrialization, industrial upgrading by strengthening policy, increasing investment in R&D innovation, and optimizing the business environment should be carried out in some designated provinces.
1. Introduction
As an emerging economic phenomenon, deindustrialization has begun to be valued. A moderate decline in manufacturing share should not be simplistically interpreted as premature deindustrialization [1,2], but rather understood as a reflection of industrial restructuring and innovation-driven development [3,4], which is mainly used today to refer to the experience, mainly in these advanced economies [2]. Premature deindustrialization typically refers to a situation of a decline in manufacturing share in a country (or region) with relatively low income per capita, transitioning into a service-based economy before achieving full industrialization [2]. Compared with traditional deindustrialization, premature deindustrialization tends to exert more profound negative effects on the local economy [5] and is a critical structural barrier to sustainable development, which is particularly prominent in some developing countries in Africa and Latin America [6]. Deindustrialization has been a concern for nearly two decades, first in developed countries in Europe and America [7,8], such as the UK [9], the USA [3,10], and Japan [9,11], and later in developing countries such as China [12], India [13], and OECD countries [14,15,16].
As the world’s leading manufacturing hub, China’s manufacturing industry has continued to expand [17], with its share of global manufacturing value added steadily increasing [18]. However, its proportion within China’s GDP has shown a consistent downward trend in recent years [19]. The share of industrial value added in China’s GDP declined from 32.50% in 2006 to 26.30% in 2022, indicating a weakening relative position of the industrial sector within China’s economy [20]. Meanwhile, labor has been shifting rapidly toward the tertiary sector, significantly altering China’s employment structure [21]. The rising share of the service sector has become a common feature in China’s economy [22,23,24]. At present, China’s manufacturing sector stands at a critical juncture, where quality and efficiency have continued to improve, while producer services have been gradually decoupled from the traditional manufacturing sector and developed rapidly [25], becoming new drivers of China’s economy [26]. Nonetheless, concerns over whether China is experiencing premature deindustrialization have increasingly emerged [12], which has attracted widespread scholarly attention and prompted in-depth discussions [13].
Currently, according to the existing research [27], China should be characterized as situated between the first turning point and the second turning point, rather than as having entered premature deindustrialization. However, China as a whole has reached the late stage of industrialization [28] as defined by common sense, in that the process remains marked by imbalances and deficiencies, exhibiting broad, premature, and rapid characteristics of excessive deindustrialization [29,30]. In particular, severely imbalanced industrial structure and significantly low production efficiency appear in China’s western provinces [31], where deindustrialization is especially acute [32]. If premature deindustrialization is not effectively curbed, China risks falling into the middle-income trap, thereby restricting its sustainable economy [33].
Thus, in-depth research on premature deindustrialization is very significant, as it can uncover the complex socio-economic and policy factors, while providing a theoretical foundation for the formulation of targeted regional strategies. In contrast to existing case studies that focus on some countries or specific regions [34,35,36,37,38], we investigate the spatiotemporal heterogeneities, dominant factors, and the evolutionary trends of China’s premature deindustrialization during 2008–2050 using Geodetector, the fixed-effects model, and the ARIMA time trend model. Through an in-depth investigation of premature deindustrialization, on the one hand, we try to further improve the measurement and research paradigms of premature deindustrialization, in order to expand the future research fields of industrialization in the new era. On the other hand, our findings aim to provide a scientific basis for optimizing regional industrial layouts and synergistic development in China’s various provinces, offering valuable references for achieving regional sustainable development. Hopefully, the spatiotemporal heterogeneity analysis framework and case studies of China’s deindustrialization can improve the new research paradigm of disciplines such as economic geography and structural economics in the 21st century.
The remainder of this paper is organized as follows: Section 2 presents the methodology and data; the spatiotemporal evolution of deindustrialization in China during 2008–2022 is described in Section 3; Section 4 presents detailed results and discussions; Section 5 forecasts deindustrialization in China’s various provinces during 2023–2050; and Section 6 gives the conclusions and policy implications.
2. Methodology and Data Sources
2.1. Methodology
2.1.1. Measurement Criteria for Deindustrialization
So far, the measurement of deindustrialization primarily relies on indicators such as manufacturing value added [39,40] and the employment share in the manufacturing sector [41,42]. Given the data availability, we select the share of industrial value added (IAV) in GDP and the proportion of manufacturing employment within urban work units, private enterprises, and self-employed sectors (EMS) as proxy variables to reflect the manufacturing value added and employment shares, respectively (Table 1). A continuous decline in IAV indicates output-based deindustrialization, while a continuous decline in EMS indicates employment-based deindustrialization. If both of them decline concurrently, deindustrialization appears. Given the long-term and structural nature of economic transformation, identifying premature deindustrialization based on a single-year fluctuation in manufacturing employment or industrial value added may lead to misjudgment. Drawing on the existing approach [43], we construct a standardized indicator system (Table 1) by five-year averages of manufacturing employment share and industrial value-added share across distinct periods. In addition, then, we set four diagnostic criteria. This region is considered to have undergone premature deindustrialization if all four criteria are simultaneously met during a single period.

Table 1.
Deindustrialization measurement indicators.
2.1.2. Mfuzz Cluster Analysis
Mfuzz cluster analysis is an R package based on a flexible clustering algorithm capable of handling high-dimensional, nonlinear, and noisy data1, which was initially developed as a cluster method for processing gene expression or protein expression profiling data. We do Mfuzz cluster analysis [44] to conduct a time-series analysis of employment- and output-based deindustrialization by R-4.2.2 in order to investigate deindustrialization in China’s provinces.
2.1.3. The ARIMA Time Trend Model
The ARIMA time trend model is effective at handling non-stationary data, capturing long-term trends, seasonality, and other characteristics of time series, thereby enabling more accurate long-term forecasting. Based on data during 2008–2022, we forecast the deindustrialization in China’s provinces during 2030–2050 using the ARIMA time trend model in SPSS 28.0.
2.1.4. Geodetector
Geodetector is a spatial statistical method widely employed to investigate spatial heterogeneities in geo-elements and their potential driving mechanisms [45]. This method quantifies the similarity between the spatial distributions of two variables to reveal spatial covariation patterns, thereby inferring the strength of geo-causality between them and their potential drivers. The formula for the factor detector is as follows.
where N and Nh represent the sample scale of the study area and its subregion, respectively, α2 and denote their variances, respectively, L is the number of explanatory variables, and q ∈ [0, 1].
The interaction detector is designed to explore the mechanism by which a geo-factor (Xi) affects the target (Y), specifically determining whether its effect is independent or interactive—and, if interactive, whether it is enhanced or weakened. Based on the mathematical relationship of interaction expression, the interaction between two geo-factors is classified into five typical types: nonlinear weakened, unifactor nonlinear weakened, bifactor enhanced, mutually independent, and nonlinear enhanced (Table 2).
Table 2.
Expression of interaction relationships.
2.1.5. Panel Data Model
After dimensionless processing of the relevant indicators, we analyze the spatiotemporal heterogeneities in China’s deindustrialization using Stata 18.0 and construct a fixed-effects regression model as follows.
where Manshareit includes the scale of employment in manufacturing urban units, private firms, and individuals as a percentage of employment in secondary and tertiary industries (EMSit), and the share of industrial added value in GDP (IAVit) in province i in year t, VAPit is the share of tertiary value added in GDP in province i in year t, IAVit is the share of industrial added value as a share of GDP, NEUit is the logarithm of the number of units of industrial enterprises above scale in province i in year t, NIPit is the logarithm of the number of effective invention patents in industrial enterprises above scale in province i in year t, RPit is the logarithm of the scale of the resident population of province i in year t, and PGDPit is the logarithm of GDP per capita in province i in year t. RPit is the logarithm of the resident population scale in province i in year t. αi is a fixed effect, β0 is a constant term, β1,…,β7 are regression coefficients, and εit is a random-error term. i ∈ [1,…,31]. t ∈ [2008,…,2022].
Manshareit = f(EMSit,IAVit) = β0 + αi + β1MEit + β2NSIit + β3VAPit + β4NEUit + β5NIPit + β6RPit + β7PGDPit + εit
2.1.6. The Spatiotemporal Measurement Model
As a critical evolution path of regional industrial structure, deindustrialization exhibits significant spatial dependence. Traditional econometric models may produce biased estimates due to their failure to account for spatiotemporal association. Accordingly, a spatiotemporal Durbin dynamic panel model [46] is constructed to investigate the factors for deindustrialization in China’s provinces during 2008–2022. In specifying spatial weights, an economic–geographic spatial weight matrix is adopted to comprehensively measure the effects of various economic–geographic factors. The model is formulated as follows.
where Manvit denotes the share of manufacturing employment, ρ represents the spatial autoregressive coefficient, and μ1,…,μ7, and p1,…,p7 are the regression coefficients and the spatial spillover intensity of each explanatory variable, respectively. Wit denotes the spatial weight matrix. δi denotes the individual fixed effect, ψt denotes the time fixed effect, and εit is the random-error term. i ∈ [1,…,31]. t ∈ [2008,…,2022].
InManvit = c + ρWitInManvit + μ1MEit + μ2NSIit + … + μ7RPit + p1WitMEit + p2WitNSIit + … + p7WitRPit + ψt + δi + εit
2.2. Data Sources
Data on the scale of employment in manufacturing industry, the scale of employment in secondary industry, the scale of employment in tertiary industry, the industrial value added, the number of units of industrial enterprises above designated size, the number of effective invention patents of industrial enterprises above designated size, the value added of secondary industry, the value added of tertiary industry, and GDP per capita in China’s provinces during 2008–2022 come from the National Bureau of Statistics (https://www.stats.gov.cn (accessed on 24 January 2024)). Data on the total employed population in each province are from the China Statistical Yearbook (2009–2023) (Table 3). Considering the availability of data, Hong Kong, Macao, and Taiwan are not taken into consideration. With reference to China’s Seventh Five-Year Plan and the Western Development Policy, mainland China is divided into eastern, central, and western regions2.
Table 3.
Descriptive statistics.
3. The Spatiotemporal Characteristics of Deindustrialization in China
3.1. The Overall Evolution Characteristics
ME exhibited a dynamic pattern of growth–stabilization–decline in China during 2008–2022. In 2008, the ME was approximately 71.00 million persons in China, reaching a peak of 100.37 million persons in 2013, followed by a period of relative stability subsequently. Since 2017, ME has begun to decline gradually, with a slight rebound observed in 2021 (Figure 1a). The share of manufacturing employment in total national employment increased from 14.04% in 2008 to 16.38% in 2013, but has continuously declined since 2013, reaching a historical low of 13.40% in 2020, followed by a modest recovery. Meanwhile, the total industrial value added increased steadily, while IAV rapidly initially declined, followed by a slight rebound (Figure 1b). Driven by rising production costs (e.g., land and raw materials), increasingly stringent environmental regulations, and intensifying population aging, IAV declined sharply after 2011, hitting a trough of 28.53% in 2020. Thereafter, IAV began to recover gradually, stabilizing within a range from 29.00 to 31.00%.
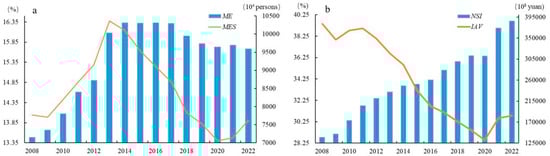
Figure 1.
The manufacturing employment and industrial value added in China during 2008–2022.
3.2. The Regional Spatiotemporal Heterogeneous Characteristics
ME increased significantly in the eastern region from 2008 to 2014, reaching a peak of 23.66% in 2014, and then declined and stabilized at approximately 20.00% by 2022. This indicates the strong capacity to attract labor in the eastern region, enabled by the capital, technology, and human resources accumulated through prolonged openness to international markets, gradually establishing it as the core hub of China’s manufacturing sector. Meanwhile, EMS remained relatively stable in the central region, fluctuating in 12.00–15.00% (Figure 2), then increasing slightly from 2008 to 2015, followed by a minor decline and subsequent stabilization. This indicates the relatively stable capacity to absorb manufacturing employment in the central region. The situation in the western region is similar to that of the central region. However, due to its relatively undiversified industrial structure, the lower development level of the manufacturing industry has been consistently maintained in the western region.
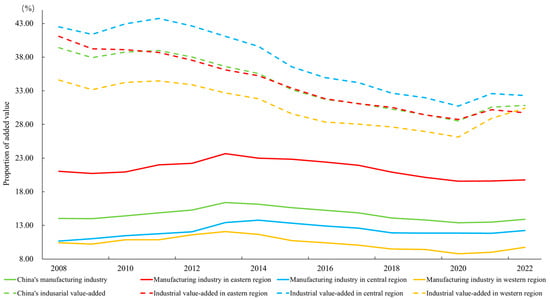
Figure 2.
IAV in China’s eastern, central, and western regions during 2008–2022.
In 2008, IAV reached 41.11% in the eastern region, but declined annually thereafter, falling to 29.74% by 2022 (Figure 2). This indicates that, alongside the continuous optimization and adjustment of industrial structure, IAV has steadily decreased in the eastern region, signaling a transition toward a more diversified regional economy. IAV experienced considerable fluctuations in the central region during 2008–2022, peaking at 43.77% in 2011 and subsequently declining to 32.31% by 2022, yet remaining significantly higher than that of the eastern region. This indicates that rapid industrialization has been completed in the central region at an early stage, followed by structural adjustments and industrial upgrading in later years. Moreover, as a key destination for the gradient industry transfer, the central region attracted many manufacturing enterprises from the eastern region, further boosting its IAV. Meanwhile, IAV remained relatively stable in the western region, fluctuating in 25.00%–30.00%. This indicates that IAV has remained relatively stable in the western region, with only minor variations over time.
3.3. The Provincial Spatiotemporal Heterogeneous Characteristics
During 2008–2022, premature deindustrialization appeared in Beijing and Hainan, while output-based deindustrialization occurred in 15 eastern and central provinces (Figure 3). Deindustrialization became increasingly normalized at the provincial level, with 11 provinces—accounting for 27.79% of the total population—undergoing deindustrialization. The number of provinces experiencing employment-based deindustrialization was 5 (45.45%), 2 (25.00%), and 7 (58.33%) in the eastern, central, and western regions, respectively. Provinces experiencing output-based deindustrialization are primarily concentrated in eastern and central regions. Except for four southwestern provinces, other deindustrializing provinces remain relatively scattered.
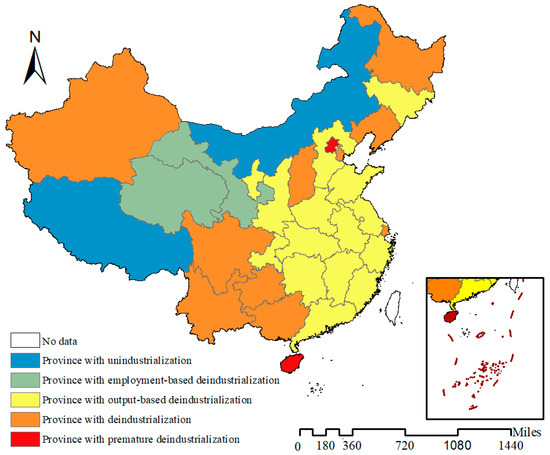
Figure 3.
The distribution of deindustrialization in China.
Based on the trajectory patterns derived from Mfuzz clustering, we summarize the characteristics of Cluster (1) and Cluster (2) as employment-declining deindustrialization (Figure 4a), employment-rise-then-decline deindustrialization (Figure 4b), output-decline-then-rise deindustrialization (Figure 4c), and output-declining deindustrialization (Figure 4d). Based on these, China’s provinces are classified into four categories: simultaneous type, employment-decline with output-decline-then-rise type, employment-rise-then-decline with output-decline-then-rise type, and employment-rise-then-decline with output-decline type. Provinces characterized by employment-declining and output-declining deindustrialization constitute the majority.
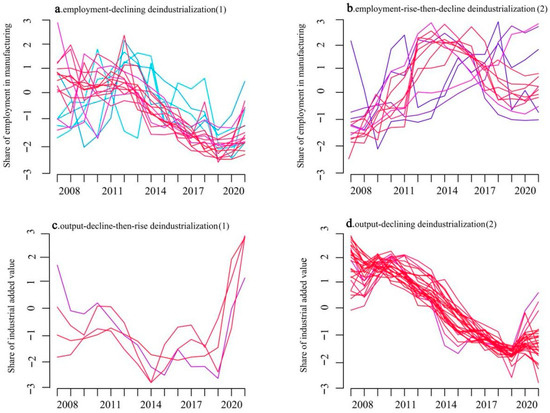
Figure 4.
Mfuzz clustering.
Provinces exhibiting simultaneous declines in employment and output are primarily concentrated in northeastern and southwestern China (Figure 5). Historically dominated by heavy industry, the northeastern provinces have seen a continuous decline in IAV due to resource depletion and population outflow. Due to the service industry, several southwestern provinces have undergone a shift from labor-intensive to technology- and capital-intensive industries, resulting in a reduced demand for labor [47,48]. Provinces with employment-decline and output-decline-then-rise types are scattered across the central and western regions. IAV declined in traditional energy and chemical-production bases such as Shanxi and Ningxia, affected by changing market demand and increasingly stringent environmental regulations, particularly under the ongoing optimization of energy structures. Subsequently, governments introduced a series of policy measures to boost industrial value added. For instance, the chain chief system to strengthen industrial chains has been implemented in Shanxi, while an integrated industrial chain covering coal, oil, gas, chemicals, heat, electricity, and new energy has been actively promoted in Xinjiang. To protect the ecological environment, restrictions and restructuring on traditional enterprises have been imposed in Qinghai. Later, by leveraging its abundant salt lake and clean-energy resources [49], a rebound in its industrial value-added share following an initial decline has been achieved in Qinghai. Provinces with employment-rise-then-decline and output decline-then-rise in industrial areas are mainly located in the eastern coastal and some central regions. During the early and middle industrialization stages, labor-intensive manufacturing and modern service industries developed rapidly in China’s eastern and central provinces [50,51]. These provinces with output-based deindustrialization are located in the middle reaches of the Yangtze River and some eastern provinces. As traditional industrial powerhouses, the pressure to restructure industrial systems is enormous in Shandong, Hunan, and Hubei.
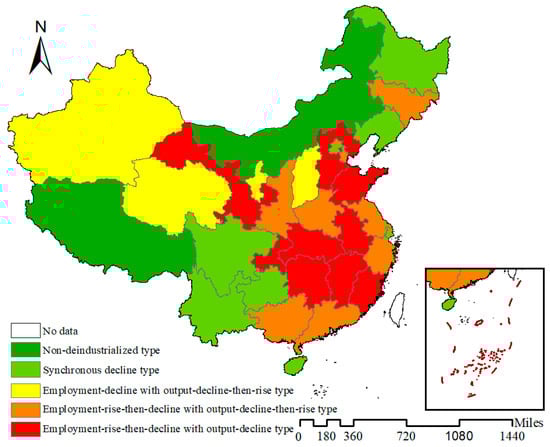
Figure 5.
The various deindustrialization types in China during 2008–2022.
4. The Empirical Results and Discussions
4.1. Factor Detection
EMS and IAV are selected as dependent variables. Other factors are the explanatory variables. By the natural breakpoint method, continuous variables are stratified into categorical variables to facilitate factor detection and evaluate the impact of various factors on employment- and output-based deindustrialization (Table 4). The dominant factors for employment-based deindustrialization include ME, NSI, NEU, and PGDP at the provincial level. This indicates that labor-market dynamics and overall industrial economic capacity dominate in this process. None of the factors pass the 1% significance threshold for output-based deindustrialization. However, VAP is significant at the level of 5% and identified as the dominant driver of output-based deindustrialization.
Table 4.
Factor detector results.
4.2. Interaction Detection
Univariate analysis enables the identification of independent factors responsible for spatial heterogeneities in employment- and output-based deindustrialization, while interaction detectors are employed to assess inter-factor relationships and evaluate whether their combined effects enhance or weaken explanatory power. The interaction detection results (Table 5) reveal that the impact of all interactive effects exceeds that of any individual factor. Furthermore, these effects are classified as either bivariate enhancement or nonlinear enhancement without mutually independent factors. This indicates that spatial heterogeneities in employment- and output-based deindustrialization are not attributable to single factors, but rather stem from the synergistic effects of multiple interactive factors. Regarding employment-based deindustrialization, the interaction effects involving ME and NSI with other variables are the most pronounced. Additionally, NEU demonstrates substantial interaction effects with other explanatory factors. This indicates that the labor scale in industry, total output levels, and the enterprise scale dominate employment-based deindustrialization. The interaction between ME and RP has the strongest explanatory power (q = 0.931), followed by that between PGDP and ME (q = 0.918) and between VAP and ME (q = 0.901). This indicates that the interaction effect between labor regional allocation and local economy is an important driving force for employment-based deindustrialization. The interaction effects between NSI and other factors are also strong, indicating that industrial restructuring, technological progress, labor supply and demand, and local economy jointly affect employment-based deindustrialization. Regarding output-based deindustrialization, the interaction effects between NEU and VAP are the strongest (q = 0.921). The stronger interaction effects between NEU, NIP, RP, and PGDP, VAP indicate that enterprise agglomeration and industrial synergy have significantly affected output-based deindustrialization.
Table 5.
Interaction detection results.
4.3. Spatial Durbin Analysis
As the core explanatory variable, IAV does not pass the significance test. Therefore, spatial econometric analysis is conducted solely on EMS. The Spatial Durbin model regression results (Table 6) indicate that the direct effect of ME is 0.0986, which is statistically insignificant. This indicates that ME exerts an insignificant positive spillover effect on employment-based deindustrialization, indicating that its positive effect on EMS primarily arises from its direct effect rather than the spatial spillover effect. The direct effect of RP is −0.178, implying that a 1% increase in RP is associated with a 0.178% decrease in EMS. The indirect effect of RP is −0.233, while the total effect is −0.411. This indicates that the significant negative effect of RP on EMS may be attributed to the combined effect of demographic transition, employment structure transformation, and unbalanced industrial development. The direct effect of PGDP is −0.0657, while the indirect effect is negative but not statistically significant. This reflects the direct role of the economy in promoting the service-oriented transformation of industrial structure and the substitution of labor with capital. Meanwhile, PGDP may affect manufacturing employment in surrounding regions through spatial spillovers, which fails to reach significance, possibly due to weak interregional industrial linkages or barriers to factor mobility.
Table 6.
Spatial Durbin model regression results.
4.4. Fixed-Effects Model
In the whole model (Table 4), VAP exerts the strongest positive effect (0.155) on employment-based deindustrialization in China. This indicates that an increase in VAP significantly enhances the spillover effects of producer services and optimizes employment structure, thereby expanding the overall scale of employment. RP and PGDP both show significant negative effects on employment-based deindustrialization. A larger RP implies increased pressure on resource competition, while a higher PGDP reflects the stronger capacity for industrial upgrading and relocation. Regarding output-based deindustrialization, VAP promotes its share by driving resource reallocation toward services and upgrading the consumption structure in China, thereby contributing to a decline in IAV. A total of 1% increase in VAP leads to a 0.423% decrease in output-based deindustrialization. ME, NEU, RP, and PGDP all exert significant negative effects on output-based deindustrialization. This indicates that the spatial agglomeration of industrial factors suppresses output-based deindustrialization. In contrast, NSI exhibits a significant positive effect (0.226%) on output-based deindustrialization.
In the regional model (Table 7), VAP is identified as the key factor for output-based deindustrialization in the eastern region. This is because the service sector in the eastern region has attracted capital and labor, leading to resource reallocation toward tertiary industry and thereby constraining secondary industry. NEU has a significant positive effect on employment-based deindustrialization in the eastern region. This indicates that industrial enterprises in the eastern region have enhanced efficiency through agglomeration effects, industrial coordination, and market competition, thereby counteracting output-based deindustrialization. RP and NSI are the core determinants of output-based deindustrialization in the central region. Population agglomeration has accelerated industrial transformation in the central region, resulting in a significant negative effect (0.488%) of RP on output-based deindustrialization. Additionally, the increases in VAP and PGDP have further accelerated deindustrialization in the central region. As a key destination for the relocation of traditional industries, the rise in NSI in the central region has acted to curb output-based deindustrialization. VAP is the principal driver of output-based deindustrialization in the western region, with a pronounced substitution effect of the service industry on industrial output. This indicates that the crowding-out effect of the service industry on secondary industry is more prominent in the western region than in other regions. RP shows a significantly negative effect on employment-based deindustrialization in three regions. The effect is strongest (−0.403) in the eastern region and weakest (−0.238) in the central region. High population density and intense labor-market competition in the eastern region have accelerated employment-based deindustrialization. Meanwhile, due to limited labor absorption capacity, population growth has a relatively weaker effect on employment-based deindustrialization in the central region. Although ME and NSI have positive effects on employment-based deindustrialization in the western region, the lack of innovation capacity and delayed industrial upgrading have amplified the negative effect of RP, as a key factor for employment-based deindustrialization.
Table 7.
Fixed-effects regression results.
5. Forecasts of Deindustrialization
5.1. Overall Forecast
According to forecasts based on the ARIMA time-series model, China’s EMS will briefly increase and then generally continue to decline during 2023–2050. Meanwhile, China’s IAV will decrease from 30.21% in 2023 to 13.67% in 2050, while EMS will fall from a peak of 14.72% in 2025 to 13.45% in 2050 (Figure 6). Future deindustrialization can be attributed primarily to three reasons in mainland China. Firstly, continuously increasing labor costs in developed regions have driven some labor-intensive manufacturing enterprises to relocate their production facilities abroad, inevitably resulting in a decline in local manufacturing employment. Secondly, rapid technological advancement has significantly reduced the demand for traditional labor in manufacturing by the widespread adoption of automated equipment. Lastly, the high-value-added service industry can offer more employment opportunities and career choices, further accelerating employment-based deindustrialization.
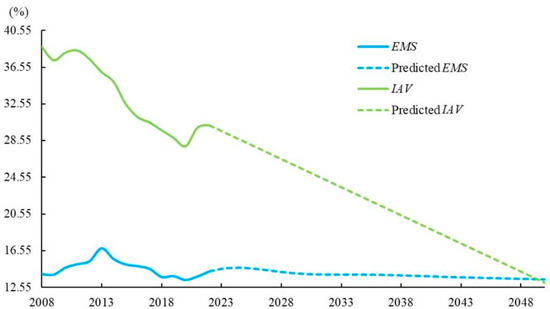
Figure 6.
Manufacturing and industrial value added in China during 2008–2050.
5.2. Provincial Forecast
According to forecasts based on the ARIMA time-series model, by 2030, industrial value added and manufacturing employment in provinces such as Shanghai will continue declining. There will be 5 provinces with premature deindustrialization and 15 provinces undergoing general deindustrialization (Figure 7a). By 2040, manufacturing employment and industrial value added will continue to decrease in deindustrialization provinces (e.g., Heilongjiang and Guangxi). There will be 14 provinces with premature deindustrialization, primarily concentrated in the Bohai Rim and southwestern region (Figure 7b). Compared to some Southeast Asian countries (or regions), the labor-cost advantage in southwestern provinces has become less pronounced. Due to cost considerations, enterprises are likely to relocate production and related departments to Southeast Asia, thereby hindering industrialization in southwestern provinces. Because of industrial restructuring, some traditional industries in the eastern region have been relocated to central and western regions. However, the reduced labor demand associated with high-end manufacturing has contributed to deindustrialization in the eastern region. By 2050, the spatial distribution of deindustrialization will remain largely consistent with that in China in 2040. Premature deindustrialization will appear in 14 provinces, while deindustrialization will occur in 6 provinces (Figure 7c). Meanwhile, deindustrialization has not occurred in the eastern provinces, where a significant and sustained decline in IAV has been observed. This indicates that the relocation of traditional industries from the eastern region to central and western regions, coupled with modern industries such as finance and services, has led to a structural shift toward service-oriented industries in the eastern region.
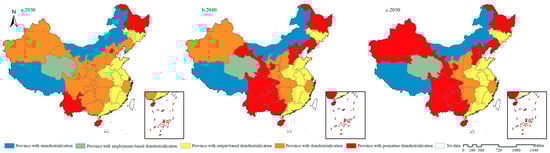
Figure 7.
The spatiotemporal evolution of deindustrialization in China during 2030–2050.
6. Conclusions and Policy Implications
6.1. Main Conclusions
We investigated the spatiotemporal heterogeneities of deindustrialization in China, so as to provide a scientific basis for the formulation of relevant policies for the regional sustainable economy. Our main conclusions are as follows.
① During 2008–2022, premature deindustrialization only appeared in Beijing and Hainan, while deindustrialization occurred in ten other provinces, including Shanghai. Although dual declines—in both NSI and ME—are not observed in the eastern and central provinces, a widespread trend of output-based deindustrialization existed, characterized by a sustained decline in IAV. Deindustrialization has been accelerated by the expansion of the service industry and the relocation of industrial activities to the eastern region. Industrialization has remained relatively stable in the central region due to its role in receiving transferred industries. Deindustrialization is not very obvious in the western region, constrained by resource dependency and underdeveloped infrastructure. Deindustrialization has been particularly pronounced in western regions such as Guizhou and Xinjiang due to a highly undiversified industrial structure.
② Regression results from the Spatial Durbin Model reveal that the spatial spillover effects of deindustrialization among China’s provinces are not statistically significant. Only NIP exhibits a significant spatial spillover effect (the indirect effect of 0.032), which contributes to employment-based deindustrialization through technological diffusion. RP has the most pronounced negative effects (the direct effect of −0.178) and the total effect of −0.411) on EMS, indicating a significant localized effect on employment-based deindustrialization with an insignificant spatial spillover effect. NSI and VAP exhibit significant direct effects of 0.064 and 0.180, respectively, driven by direct job creation and industrial support.
③ The regional heterogeneities in employment- and output-based deindustrialization in China are obvious. The drivers of employment-based deindustrialization can be categorized into five dominant factors, namely: ME, NSI, NEU, and PGDP, which interact through two-factor enhancement effects. Among them, ME and NSI exhibit the strongest interactive effects with other factors. The dominant driver of output-based deindustrialization is VAP. In the eastern region, VAP is key (−0.698) to deindustrialization, where service-industry agglomeration significantly suppresses secondary industry. Deindustrialization is dominated by RP (−0.488) and NSI (0.302) in the central region. Demographic transition accelerates the replacement of the service industry, while industrialization still relies on the secondary industry. VAP dominates deindustrialization in the western region, which exhibits a strong substitution effect (−0.445) of nonagricultural industries.
④ According to forecasts based on the ARIMA time-series model, China will undergo a significant deindustrialization during 2023–2050. By 2030, premature deindustrialization will appear in 5 provinces (including Yunnan and Shanghai), and deindustrialization will occur in 16 provinces. By 2050, much of the Bohai Rim and southwestern provinces will become the core areas of premature deindustrialization in China. However, EMS will decline only marginally from 13.90% in 2023 to 13.66% in 2050. Meanwhile, IAV will drop sharply, falling from 30.21% to 13.67%. This dual pattern of relatively stable employment and sharply contracting output indicates that labor productivity has been enhanced by technological innovation in China’s traditional manufacturing sector, whose low-value-added production processes are being rapidly transferred.
6.2. Policy Implications
Based on the spatiotemporal heterogeneities of and various deindustrialization types and their dominant factors in China’s different provinces, we make targeted implications as follows.
At the regional scale, ① innovation-driven development and spatial coordination should be prioritized in the eastern region, the Yangtze River Economic Belt in China [52], aiming to reshape industrial geography by the polarization–diffusion of innovation. A core–periphery collaborative network should be established by leveraging urban agglomerations and innovation corridors. A clear gradient-based division of labor should be defined between the high-end manufacturing industry and the producer service industry. Through land spatial planning, industrial functional zones should be delineated to avoid homogeneous competition and to reinforce the agglomeration effects of strategic emerging industries (e.g., the digital economy and biopharmaceuticals). The construction of innovation ecosystems should be promoted by centering on leading enterprises and research institutes, facilitating integrated spatial platforms for R&D–commercialization–pilot production to foster knowledge spillovers and technological diffusion. Cross-border innovation cooperation zones [53] should be supported by attracting international R&D resources into local industrial chains. ② Endogenous development momentum should be activated in the central region through a hub–network model. The coupling of transportation and industry is to be advanced by utilizing the strategic advantages of the cross-shaped high-speed rail network to establish national logistics hubs and advanced manufacturing bases, thereby enabling chain-embedded reception of industrial transfers from the eastern region. The spatial reconfiguration of knowledge and industry should be accelerated by establishing university–enterprise joint innovation enclaves in science and education hubs (e.g., Wuhan Optics Valley), facilitating the localized conversion of patented technologies. ③ A distinctive development path in the western region should be constrained by ecological and cultural considerations. In ecologically fragile regions (e.g., the Qinghai–Tibet and Loess Plateaus), a model of Protection Within Red Lines and Intensification Beyond [54] should be implemented to restrict water-intensive and highly polluting industries. Coordinated border economic belts should be promoted by establishing cross-border industrial cooperation zones in key Belt-and-Road cities, targeting equipment manufacturing and advanced agricultural processing for Central and Southeast Asian markets [55]. A new path for cultural–industrial integration should be advanced by promoting cross-sectoral convergence of intangible cultural heritage and intelligent manufacturing in ethnic-minority regions. Cultural symbols such as the embroidery and silverware of the Miao nationality should be leveraged to empower characteristic light industries, forming a value chain linking geographical indication products, cultural tourism IP, and e-commerce platforms.
At the provincial level, ① provinces exhibiting premature deindustrialization are characterized by a simultaneous decline in both manufacturing value added and employment share, where the economy shifts too early toward service- or tourism-led growth, thereby risking entrapment in the middle-income trap. While retaining strengths in the high-end service industry, the high-value-added manufacturing industry should be attracted using preferential tax policies and land-use incentives [56] to prevent industrial hollowing. It is also essential to establish regional platforms for collaborative innovation among academia, research institutes, and enterprises to facilitate the integration of strategic emerging industries (e.g., artificial intelligence and biopharmaceuticals) with the traditional manufacturing industry, thereby forming an integrated chain of R&D–transformation–production [57]. ② The industrial foundation in some provinces undergoing deindustrialization is gradually eroding, but has not yet reached premature decline. However, job losses and technological discontinuities stemming from industrial relocation must be carefully addressed. The upgrading of traditional manufacturing toward intelligent manufacturing should be promoted in these provinces while strategically absorbing key segments [58] of industrial chains relocated from eastern provinces. In response to the decline in manufacturing employment, vocational training systems should be developed to cultivate skilled workforces in digital and automated domains, thereby enabling the labor transition toward higher-value-added positions. ③ The share of manufacturing value added in these provinces with output-based deindustrialization has continuously declined, while employment levels have remained relatively stable. Industrial value-added content and competitiveness must be enhanced in these provinces. Efforts should focus on upgrading industrial structures and supporting the transformation of traditional manufacturing into service-oriented manufacturing [59]. Meanwhile, a green and low-carbon transition must be pursued by implementing carbon-quota systems for energy-intensive industries such as steel and chemicals, accompanied by fiscal subsidies to encourage the adoption of clean production technologies and the advancement of a circular economy. ④ A highly homogeneous industrial structure appears in these provinces with deindustrialization, and excessive reliance on resource-based or low-end manufacturing has resulted in weak resilience to external shocks, thus exacerbating economic vulnerability. To mitigate these risks, infrastructure deficiencies must be addressed by increasing investments in transportation, energy, and digital infrastructure, thereby lowering operational costs and enhancing industrial absorption capacity. Additionally, synergistic ecological–industrial initiatives should be explored, with strict limitations on highly polluting projects. The ecology + specialized industry model [60] should be promoted to chart a path toward green industrialization in these provinces.
6.3. Research Prospects
Deindustrialization has become a necessary stage for regional development. How to measure and predict deindustrialization has become crucial. Therefore, our main contributions include the following two points. Firstly, we successfully constructed a scientifically comparable measurement index system from the dimensions of employment and output, which can relatively fairly evaluate the characteristics of deindustrialization in various regions. Secondly, the analysis of spatiotemporal heterogeneity and related factors in deindustrialization at the macro scale has become both a traditional research focus in economic geography and an emerging hotspot in regional economics. This promotes interdisciplinary development. Inevitably, our research also has some limitations. On the one hand, our research period is relatively short, which is limited by the various industrialization processes in China’s provinces. In particular, the heterogeneity of deindustrialized regions increases the difficulty of analyzing the related mechanisms. On the other hand, forecasts of China’s deindustrialization are relatively simple over the next 30 years. Scientific predictions are crucial for regional sustainable development. These will be important aspects that we strive to improve.
Author Contributions
Y.L.: Data Curation, Supervision, Writing—Review and Editing. Z.W.: Conceptualization, Methodology, Visualization, Investigation, Writing—Review and Editing. J.R.: Supervision. All authors have read and agreed to the published version of the manuscript.
Funding
This research is funded by the National Nature Science Foundation of China (Grant No. 42401204) and Shandong Provincial Natural Science Foundation (ZR2022QD129).
Institutional Review Board Statement
Not applicable.
Informed Consent Statement
Not applicable.
Data Availability Statement
The data used to support the findings of this study are available from the corresponding author upon request.
Acknowledgments
The authors would like to thank anonymous reviewers for helpful comments to earlier versions of the article.
Conflicts of Interest
The authors declare no conflicts of interest.
Notes
| 1 | http://mfuzz.sysbiolab.eu (accessed on 23 November 2025). |
| 2 | The eastern region includes Beijing, Tianjin, Hebei, Liaoning, Shanghai, Jiangsu, Zhejiang, Fujian, Shandong, Guangdong, and Hainan. The central region includes Shanxi, Jilin, Heilongjiang, Anhui, Jiangxi, Henan, Hubei, and Hunan. The western region includes Gansu, Guangxi, Guizhou, Inner Mongolia, Ningxia, Qinghai, Shaanxi, Sichuan, Tibet, Xinjiang, Yunnan, and Chongqing. |
References
- Destek, M.A.; Hossain, M.R.; Khan, Z. Premature deindustrialization and environmental degradation. Gondwana Res. 2024, 127, 199–210. [Google Scholar] [CrossRef]
- Rodrik, D. Premature deindustrialization. J. Econ. Growth 2016, 21, 1–33. [Google Scholar] [CrossRef]
- Fujiwara, I.; Matsuyama, K. A technology-gap model of ‘Premature’ Deindustrialization. Am. Econ. Rev. 2024, 114, 3714–3745. [Google Scholar] [CrossRef]
- Zou, T. Technological innovation promotes industrial upgrading: An analytical framework. Struct. Change Econ. Dyn. 2024, 70, 150–167. [Google Scholar] [CrossRef]
- Myovella, G.; Karacuka, M.; Haucap, J. Digitalization and economic growth: A comparative analysis of Sub-Saharan Africa and OECD economies. Telecommun. Policy 2020, 44, 101856. [Google Scholar] [CrossRef]
- Szirmai, A.; Verspagen, B. Manufacturing and economic growth in developing countries, 1950–2005. Struct. Change Econ. Dyn. 2015, 34, 46–59. [Google Scholar] [CrossRef]
- Emery, J. Geographies of deindustrialization and the working-class: Industrial ruination, legacies, and affect. Geogr. Compass 2019, 13, e12417. [Google Scholar] [CrossRef]
- Van Neuss, L. Globalization and deindustrialization in advanced countries. Struct. Change Econ. Dyn. 2018, 45, 49–63. [Google Scholar] [CrossRef]
- Alderson, A.S. Explaining deindustrialization: Globalization, failure, or success? Am. Sociol. Rev. 1999, 64, 701–721. [Google Scholar] [CrossRef]
- Barry, B.; Bennett, H. The Deindustrialization of America: Plant Closings, Community Abandonment, and the Dismantling of Basic Industry; Basic Books, Inc.: New York, NY, USA, 1984. [Google Scholar] [CrossRef][Green Version]
- James, J.; Ebin, V. Succeeding with industrialization: The experience of Germany and Japan as late industrializers. Int. J. Mech. Ind. Technol. 2021, 9, 18–24. Available online: https://www.researchpublish.com (accessed on 1 January 2023).
- Taguchi, H.; Tsukada, Y. Premature deindustrialization risk in Asian latecomer developing economies. Asian Econ. Pap. 2022, 21, 61–77. [Google Scholar] [CrossRef]
- Nagaraj, R. India’s premature deindustrialization and falling investment rate in the 2010s. World Dev. 2025, 191, 106954. [Google Scholar] [CrossRef]
- Kollmeyer, C.; Pichler, F. Is deindustrialization causing high unemployment in affluent countries? Evidence from 16 OECD countries, 1970–2003. Soc. Forces 2013, 91, 785–812. [Google Scholar] [CrossRef]
- Lee, C.S. International migration, deindustrialization and union decline in 16 affluent OECD countries, 1962–1997. Soc. Forces 2005, 84, 71–88. [Google Scholar] [CrossRef]
- Teimouri, S.; Zietz, J. Coping with deindustrialization: A panel study for early OECD countries. Struct. Change Econ. Dyn. 2020, 54, 26–41. [Google Scholar] [CrossRef]
- Gosens, J.; Lu, Y. Prospects for global market expansion of China’s wind turbine manufacturing industry. Energy Policy 2014, 67, 301–318. [Google Scholar] [CrossRef]
- Yu, C.; Luo, Z. What are China’s real gains within global value chains? Measuring domestic value added in China’s exports of manufactures. China Econ. Rev. 2018, 47, 263–273. [Google Scholar] [CrossRef]
- Li, L. China’s manufacturing locus in 2025: With a comparison of “Made-in-China 2025” and “Industry 4.0”. Technol. Forecast. Soc. Change 2018, 135, 66–74. [Google Scholar] [CrossRef]
- Golley, J. Regional patterns of industrial development during China’s economic transition. Econ. Transit. 2002, 10, 761–801. [Google Scholar] [CrossRef]
- Wei, Y.H.D.; Liefner, I. Globalization, industrial restructuring, and regional development in China. Appl. Geogr. 2012, 32, 102–105. [Google Scholar] [CrossRef]
- Cheng, D. The development of the service industry in the modern economy: Mechanisms and implications for China. China Financ. Econ. Rev. 2013, 1, 3. [Google Scholar] [CrossRef]
- Liao, J. The rise of the service sector in China. China Econ. Rev. 2020, 59, 101385. [Google Scholar] [CrossRef]
- Wu, Y. China’s services sector: The new engine of economic growth. Eurasian Geogr. Econ. 2015, 56, 618–634. [Google Scholar] [CrossRef]
- Rekha, R.; Suresh, B.M. Premature deindustrialisation and growth slowdowns in middle-income countries. Struct. Change Econ. Dyn. 2022, 62, 377–389. [Google Scholar] [CrossRef]
- Yang, H.; Zhang, F.; He, Y. Exploring the effect of producer services and manufacturing industrial co-agglomeration on the ecological environment pollution control in China. Environ. Dev. Sustain. 2021, 23, 16119–16144. [Google Scholar] [CrossRef]
- Kuznets, S. Modern Economic Growth: Rate, Structure and Spread; Yale University Press: New Haven, CT, USA; London, UK, 1966. [Google Scholar]
- Huang, Q. China’s Industrialization Process; Springer: Singapore, 2018. [Google Scholar]
- Anastasi, A.W.D. China’s imbalances and the shrinking of the development space. Trans. Inst. Br. Geogr. 1992, 17, 481–494. [Google Scholar] [CrossRef]
- Neel, P. Broken Circle: Premature deindustrialization, Chinese capital exports, and the stumbling development of new territorial industrial complexes. Int. Labor Work.-Cl. Hist. 2022, 102, 94–123. [Google Scholar] [CrossRef]
- Lin, B.; Zhou, Y. How does vertical fiscal imbalance affect the upgrading of industrial structure? Empirical evidence from China. Technol. Forecast. Soc. Change 2021, 170, 120886. [Google Scholar] [CrossRef]
- Tang, Y.; Zhu, H.; Yang, J. The asymmetric effects of economic growth, urbanization and deindustrialization on carbon emissions: Evidence from China. Energy Rep. 2022, 8 (Suppl. 7), 513–521. [Google Scholar] [CrossRef]
- Gill, I.S.; Kharas, H.J.; Bhattasali, D.; Brahmbhatt, M. An East Asian Renaissance: Ideas for Economic Growth; World Bank Publications: Washington, DC, USA, 2007; Volume 22, pp. 57–59. [Google Scholar] [CrossRef]
- Haraguchi, N.; Cheng, C.F.C.; Smeets, E. The importance of manufacturing in economic development: Has this changed? World Dev. 2017, 93, 293–315. [Google Scholar] [CrossRef]
- High, S. The radical origins of the deindustrialization thesis: From dependency to capital flight and community abandonment. Labour/Le Trav. 2023, 91, 31–56. [Google Scholar] [CrossRef]
- Oreiro, J.L.; Manarin, L.L.; Gala, P. Deindustrialization, economic complexity and exchange rate overvaluation: The case of Brazil (1998–2017). PSL Q. Rev. 2020, 73, 313–341. [Google Scholar] [CrossRef]
- Saeger, S.S. Globalization and deindustrialization: Myth and reality in the OECD. Rev. World Econ. 1997, 133, 579–608. [Google Scholar] [CrossRef]
- Tregenna, F. Characterising deindustrialisation: An analysis of changes in manufacturing employment and output internationally. Camb. J. Econ. 2009, 33, 433–466. [Google Scholar] [CrossRef]
- Di Berardino, C.; Doganieri, I.; Onesti, G. Deindustrialization in the EU between transformation and decline. East. Eur. Econ. 2021, 59, 225–249. [Google Scholar] [CrossRef]
- Rowthorn, R.; Ramaswamy, R. Growth, trade, and deindustrialization. IMF Econ. Rev. 1999, 46, 18–41. [Google Scholar] [CrossRef]
- Liu, L.; An, S. Deindustrialization and the incidence of poverty: Empirical evidence from developing countries. Technol. Forecast. Soc. Change 2023, 187, 122202. [Google Scholar] [CrossRef]
- Schindler, S.; Gillespie, T.; Banks, N.; Bayırbağ, M.K.; Burte, H.; Kanai, J.M.; Sami, N. Deindustrialization in cities of the Global South. Area Dev. Policy 2020, 5, 283–304. [Google Scholar] [CrossRef]
- Felipe, J.; Mehta, A.; Rhee, C. Manufacturing matters, but it’s the jobs that count. Camb. J. Econ. 2019, 43, 139–168. [Google Scholar] [CrossRef]
- Skinner, J.F.; Garibaldi, J.M.; Curnow, J.; Ifeachor, E.C. Intelligent fetal heart rate analysis. In Proceedings of the First International Conference on Advances in Medical Signal and Information Processing, Bristol, UK, 4–6 September 2000; IEEE: London, UK, 2000; pp. 14–21. [Google Scholar] [CrossRef]
- Wang, J.-F.; Li, X.-H.; Christakos, G.; Liao, Y.-L.; Zhang, T.; Gu, X.; Zheng, X.-Y. Geographical detectors-based health risk assessment and its application in the neural tube defects study of the Heshun Region, China. Int. J. Geogr. Inf. Sci. 2010, 24, 107–127. [Google Scholar] [CrossRef]
- Lee, L.F.; Yu, J. Identification of spatial Durbin panel models. J. Appl. Econom. 2016, 31, 133–162. [Google Scholar] [CrossRef]
- Dai, Z.; Niu, Y.; Zhang, H.; Niu, X. Impact of the transforming and upgrading of China’s labor-intensive manufacturing industry on the labor market. Sustainability 2022, 14, 13750. [Google Scholar] [CrossRef]
- Sargent, J.; Matthews, L. Capital intensity, technology intensity, and skill development in post China/WTO maquiladoras. World Dev. 2008, 36, 541–559. [Google Scholar] [CrossRef]
- Li, L.; Ge, F.; Jiang, Y.; An, Z.; Li, N.; Zhang, Z.; Liu, H.; Li, J.; Liang, D. Research status and development trends of Inorganic salt lake resource extraction based on bibliometric analysis. Sustainability 2025, 17, 121. [Google Scholar] [CrossRef]
- Liu, Y.; Zhang, X. Does labor mobility follow the inter-regional transfer of labor-intensive manufacturing? The spatial choices of China’s migrant workers. Habitat Int. 2022, 124, 102559. [Google Scholar] [CrossRef]
- Mao, Q.; Wang, F.; Li, J.; Dong, S. Evolving a core-periphery pattern of manufacturing industries across Chinese provinces. J. Geogr. Sci. 2014, 24, 924–942. [Google Scholar] [CrossRef]
- Wang, W.; Zhou, L.; Chen, W.; Wu, C. Research on the coordination characteristics and interaction between the innovation-driven development and green development of the Yangtze River Economic Belt in China. Environ. Sci. Pollut. Res. 2022, 29, 22952–22969. [Google Scholar] [CrossRef]
- Makkonen, T.; Williams, A.M.; Mitze, T.; Weidenfeld, A. Science and technology cooperation in cross-border regions: A proximity approach with evidence for Northern Europe. Eur. Plan. Stud. 2018, 26, 1961–1979. [Google Scholar] [CrossRef]
- He, J.; Chen, J.; Xiao, J.; Zhao, T.; Cao, P. Defining important areas for ecosystem conservation in Qinghai province under the policy of ecological red line. Sustainability 2023, 15, 5524. [Google Scholar] [CrossRef]
- Wang, Z.; Wei, W. Cross-Border Economic Cooperation Between China and Southeast Asian Countries; Springer: Singapore, 2022. [Google Scholar] [CrossRef]
- Sun, Y.; Ma, A.; Su, H.; Su, S.; Chen, F.; Wang, W.; Weng, M. Does the establishment of development zones really improve industrial land use efficiency? Implications for China’s high-quality development policy. Land Use Policy 2020, 90, 104265. [Google Scholar] [CrossRef]
- Deng, X.; Hou, Q.; Shen, J. Can digital transformation reduce R&D investment disruption during the top executive transition period? Manag. Decis. Econ. 2024, 45, 1901–1926. [Google Scholar] [CrossRef]
- Zhou, Y.; Zang, J.; Miao, Z.; Minshall, T. Upgrading pathways of intelligent manufacturing in China: Transitioning across technological paradigms. Engineering 2019, 5, 691–701. [Google Scholar] [CrossRef]
- Liu, H.; Zhao, H.; Li, S. Future social change of manufacturing and service industries: Service-oriented manufacturing under the integration of innovation-flows drive. Technol. Forecast. Soc. Change 2023, 196, 122808. [Google Scholar] [CrossRef]
- Sagar, A.D.; Frosch, R.A. A perspective on industrial ecology and its application to a metals-industry ecosystem. J. Clean. Prod. 1997, 5, 39–45. [Google Scholar] [CrossRef]


Disclaimer/Publisher’s Note: The statements, opinions and data contained in all publications are solely those of the individual author(s) and contributor(s) and not of MDPI and/or the editor(s). MDPI and/or the editor(s) disclaim responsibility for any injury to people or property resulting from any ideas, methods, instructions or products referred to in the content. |
© 2025 by the authors. Licensee MDPI, Basel, Switzerland. This article is an open access article distributed under the terms and conditions of the Creative Commons Attribution (CC BY) license (https://creativecommons.org/licenses/by/4.0/).