Article

Evolutionary Game Analysis for Regional Collaborative Supply Chain Innovation Under Geospatial Restructuring

School of Management, Tianjin University of Technology, Tianjin 300384, China
*
Author to whom correspondence should be addressed.
Systems 2025, 13(12), 1044; https://doi.org/10.3390/systems13121044
Submission received: 7 October 2025 / Revised: 31 October 2025 / Accepted: 3 November 2025 / Published: 21 November 2025

Abstract

Regional economic diversity and unevenly allocated space-based resources have created unprecedented difficulties for collaborative and innovative supply chain construction. This paper sets up a tripartite evolutionary model of the government, upstream companies, and downstream companies to explore dynamic processes of regional supply chain collaborative innovation with bounded rationality. Through incorporation of hierarchical space organizations and policy incentive differentiation mechanisms, the model discerns actors’ behavioral evolution and strategic adjustment in a geographically divided structure. Adopting evolutionary game theory and numerical simulation, this paper includes crucial parameters like the conversion efficiency of return conversion, information-sharing coefficient, mutual trust coefficient, and fiscal subsidy coefficient for examining policy and spatial heterogeneity effects on information collaborative innovations. The results reveal that fiscal incentives are the primary driving factor for collaborative evolution across local supply chains. Adaptive profit-sharing and subsidy intensities both stimulate upstream innovation investments and downstream cooperation adoption efficiently, stimulating a shift out of inefficient equilibrium states towards sustainable high-cooperation states. Furthermore, the restructuring of space accelerates hierarchical differentiation—core region companies are able to act like initiators and leaders for collaborative innovations, while periphery companies encounter participatory barriers in terms of elevated coordination costs and incentive shortages. In light of this, it is therefore crucial to have a “core-driven, periphery-subsidized” policy system for eliminating spatial gaps, stimulating cross-regional information exchange, and building systemic robustness. These findings contribute to enhancing the overall efficiency, stability, and innovation capacity of regional supply chain systems. They also provide a theoretical basis for policy decision making and industrial upgrading across regions of varying scales and environments.

1. Introduction

In recent years, the global economic scenario underwent profound transformations that imposed unforeseen challenges on supply chain stability and resiliency [1]. Disruptive events such as the geo-political conflicts, and resurgent trade protectionism illustrated the vulnerabilities of traditional supply chain systems in cross-regional coordination and spatial configuration [2,3,4]. As a crucial network that connects production, logistics, and consumption, supply chain management influences not only the competitive strength of enterprises, but also plays a core role in regional economic coordination and industrial chain security [3]. From this background, it is a question of utmost importance for scholars and practitioners alike: determining how to reconstruct theories of supply chain management from geographical–spatial viewpoints toward regional collaborative innovation.
The spatial–geographic characteristics of supply chains are represented in the physical location pattern of suppliers, manufacturers, and distributors and their impact on material flows, information exchange, and capital movements [4,5,6,7,8]. Traditional supply chain arrangements commonly emphasize minimizing costs and maximizing efficiency without regard to the importance of spatial dynamics [9]. This has led to rigid spatial structures, imbalanced allocation of node resources, and inefficiencies in coordination. Such space disproportions not only challenge the overall system of the supply chain’s resilience and innovation capacity but also distort regional economic coordination and industrial structure optimization [10]. Under this background, digital technologies and platform economy-based forms are dramatically changing the spatial configuration of supply chains [11]. Innovative supply chain structures revolving around digital platforms—such as cross-regional cloud warehousing, platform-based direct selling, and shared logistics—have significantly enhanced flexibility and coordination [12]. Concurrently, governments, being principal forces behind regional economic planning and industrial policy implementation, are at the forefront of the optimization of supply chain spatial frameworks and inspiring upstream–downstream interaction through strategic plans such as logistics hub planning, industrial relocation, and fiscal subsidies [13]. The interaction between governments, suppliers, and distributors creates a complex multi-agent game that determines the success of supply chain innovation models and their dissemination at the regional level [14].
Yet, there are a number of tensions that come with spatial restructuring. Upstream suppliers face high innovation investment costs, the burden of rapid technological development, and uncertainty about the fairness of profit-sharing agreements, which may deter them from innovating [15]. Downstream distributors, by contrast, must trade off the benefit of channel integration gained from platform-based coordination against costs of customer service and flexibility [16,17,18,19,20]. Moreover, the effectiveness of governmental incentives, robust regulatory frameworks, and policies of regional development that discriminate also impact the co-evolutionary processes, as well as the strategic decisions of all the actors [21]. Such interdependent effects form a sophisticated game-theoretical model that has a profound impact on innovative supply chain model performance and sustainability at the regional level [22].
While previous research on geographic supply chain management innovation has made significant progress, most of the literature addresses uses of technology, organizational processes, or one-agent models [23,24,25,26,27,28]. Limited systematic studies exist that incorporate spatial features in a triadic game-theoretical context. Specifically, there are very few instances of research that has looked, at length, at how the spatial configuration of supply chains affects the adoption of new models [29]. Particularly, there is no exploration of how multiple stakeholders develop dynamically towards balanced strategies by being impacted by regional cooperation goals and government policies. Therefore, there is a pressing need to establish an evolutionary game model for the government, suppliers, and distributors from a spatial perspective, in order to systematically analyze the mechanisms of behavior and evolutionary processes of regional supply chain innovation [30,31,32,33,34,35,36]. This would provide theoretical insights to guide policy design and operations implementation.
The threefold contributions of this research include the following: First, it integrates geographic–spatial elements into the supply chain innovation game analysis framework, expanding interdisciplinary discourse between supply chain management and regional economic development. Second, it embodies the behavioral rationality and dynamic interaction of governments, suppliers, and distributors in spatially coordinated innovation through a triadic evolutionary game model. Third, it calls for diversified innovation pathways attuned to local policy environments, with management guidelines for maximizing industrial spatial arrangement and developing digitally enabled, platform-based supply chains. Briefly, as regional economic integration accelerates, spatial innovation of supply chain management is increasingly becoming a major impetus for enhancing industrial competitiveness and promoting balanced regional development. This research adopts a geographic–spatial reconstruction strategy and applies a triadic evolutionary game framework to investigate the behavioral logic of regional supply chain collaboration and innovation in a systematic fashion.
The subsequent structure of this paper is arranged as follows: Section 2 presents the problem description and model construction of the game; Section 3 analyzes the stability of the model; Section 4 conducts simulation analysis; Section 5 offers discussion; Section 6 presents research conclusions; finally, this paper concludes by discussing research limitations and future research directions. The framework diagram of the entire paper is shown in Figure 1.

2. Problem Statement and Model Construction

This study aims to develop a dynamic evolutionary game model involving three core stakeholders—government, upstream suppliers, and downstream distributors—to reveal the dynamic evolution of strategic choices during the innovation process in supply chain management [37]. The model addresses the following key research questions: How can government incentive policies influence innovation investment and collaboration decisions across the supply chain? How do suppliers and distributors balance expected returns with associated cooperation costs in choosing innovation and coordination strategies? How does regional collaborative development affect the strategic choices of all parties and the dissemination of innovative models?
Under the framework of regional collaborative development, innovation in supply chain management models has emerged as a critical pathway to enhancing regional industrial competitiveness and achieving sustainable development [38]. To quantitatively define the spatial heterogeneity of the regional supply chain system, this study introduces measurable indicators for the three-tier spatial structure—core, secondary, and periphery. Specifically, three variables are adopted to distinguish spatial levels:
(1)
Industrial concentration (LQ), measured by the location quotient of major manufacturing and logistics industries in each region;
(2)
Logistics network density, calculated as the ratio of freight flow volume to total transportation capacity, representing intercity connectivity;
(3)
Regional GDP share, indicating the relative economic strength of each spatial unit.
These indicators are normalized to a [0, 1] scale and combined to classify cities into three categories: core areas (LQ > 1.2, GDP share > 20%), secondary areas (LQ between 0.8 and 1.2), and peripheral areas (LQ < 0.8, GDP share < 10%). This quantitative classification provides an empirical basis for the spatial structure of the evolutionary game model and strengthens the model’s applicability to real regional systems.
If any enterprise opts not to participate in innovation or adopt the collaborative mechanism, it may engage in “free-riding” behavior and gain short-term benefits Ni (i = 1, 2) by avoiding transformation costs. However, it will be identified as a “non-cooperative actor” and must compensate its partners with a penalty P, while the cooperative partner incurs opportunity costs Ci (i = 1, 2) due to managerial frictions and delays in coordination.
When both upstream and downstream enterprises participate in innovation and adopt collaborative mechanisms, positive synergy effects are realized. These synergistic benefits consist of two components: (1) direct gains from information sharing and process synchronization, modeled as aibivj (i = 1.2), where ai denotes absorptive capacity and bi represents the degree of information sharing in supply chain collaboration; and (2) spillover effects arising from the complementarity of heterogeneous capabilities, captured by gevi, where g is a trust parameter and e reflects the complementarity between innovation capabilities and channel strengths [39].
Given that platform-based mechanisms must be implemented across multiple regions and nodes, spatial information asymmetry and geographic trust deficits introduce collaboration risks. When cooperation fails, losses occur. Such failures may result from institutional defects or differences in technical standards. These problems often arise after the adoption of platform mechanisms. Participating firms then incur losses, denoted as hLi (i = 1, 2). Here, h represents an institutional barrier factor that reflects local regulatory and industrial standard constraints, while Li (i = 1, 2) represents the scale of the loss [40].
The government, as regulator and coordinator, has two strategic options: passive guidance or active intervention. Under passive guidance, the government promotes enterprise innovation through fiscal subsidies xF and tax incentives mG. Under active intervention, it imposes penalties rM and restrictive policies lT on non-participating firms, where r and l denote the penalty and constraint coefficients, respectively. Moreover, the implementation of proactive policies may generate social supervision support and reputational gains B3 for the government but also entails administrative execution costs C3.
To enhance intraregional coordination, the government policy adopts a “core-periphery” space policy approach. It involves the provision of technological platform facilitation and market access advantages to core cities, offering fiscal benefits to secondary nodes, and establishing subsidy and safety-net arrangements in the peripheral areas. This spatial policy logic aims to develop a hierarchical structure of “core-driven-secondary collaboration-periphery support”.
In order to explain the behavioral adjustment of stakeholders under bounded rationality, we let the probability of the government’s active incentive policy be z, the probability of upstream firms’ investment in innovation be x, and the probability of downstream firms’ adoption of the collaborative mechanism be y. They are changing with time t and form the elementary strategy space of the evolutionary game system. As such, following this, the subsequent analysis will construct the respective payoff matrix and replicator dynamic equations to simulate the strategy updating processes, ultimately showing how multi-agent games achieve regional supply chain collaborative innovation under geographic heterogeneity [41]. The game payoff matrix of the construction unit, project management, and government is shown in Table 1.
Let the expected payoffs of the upstream supplier under the strategies “collaborative innovation” and “non-collaborative innovation” be denoted as Ux1 and Ux2, respectively. The average expected payoff is denoted as U x ¯ . Thus, the replicator dynamic equation for the upstream supplier is
U x 1 = y z ( E 1 + α 1 β 2 v 2 + γ ε v 1 1 2 k 1 v 1 2 η L 1 + μ G ) + y ( 1 z ) ( E 2 + α 2 β 1 v 1 + γ ε v 2 1 2 k 2 v 2 2 η L 2 + μ G ) + z ( 1 y ) ( E 1 + A 1 P ρ M ) + ( 1 y ) ( 1 z ) ( E 1 + A 1 P ) U x 2 = y z ( E 1 + A 1 P ρ M ) + y ( 1 z ) ( E 1 + A 1 P ) + z ( 1 y ) ( E 1 ρ M ) + ( 1 y ) ( 1 z ) E 1 U x ¯ = x U x 1 + ( 1 x ) U x 2
Similarly, let the expected payoffs of the downstream retailer under the strategies “collaborative innovation” and “non-collaborative innovation” be denoted as Uy1 and Uy2, respectively. The average expected payoff is denoted as U y ¯ . Therefore, the replicator dynamic equation for the downstream retailer is
U y 1 = x z ( E 1 + α 1 β 2 v 2 + γ ε v 1 1 2 k 1 v 1 2 + ξ F η L 1 ) + x ( 1 z ) ( E 2 + α 2 β 1 v 1 + γ ε v 2 1 2 k 2 v 2 2 + ξ F η L 2 ) + z ( 1 x ) ( E 1 + P + ξ F 1 2 k 1 v 1 2 η L 1 C 1 ) + ( 1 x ) ( 1 z ) ( E 2 + P + ξ F 1 2 k 2 v 2 2 η L 2 C 2 ) U y 2 = x z ( E 2 + A 2 P λ T ) + x ( 1 z ) ( E 2 + A 2 P ) + z ( 1 x ) ( E 2 λ T ) + ( 1 x ) ( 1 z ) E 2 U z ¯ = z U z 1 + ( 1 z ) U z 2
Let the expected payoffs of the government under the “active” and “passive” policy strategies be denoted as Uz1 and Uz2, respectively. The average expected payoff is denoted as U z ¯ . Accordingly, the replicator dynamic equation for the government is
U z 1 = x y ( E 3 + S + B 3 μ G ξ F C 3 K ) + x ( 1 y ) ( R 3 + N 3 + ω H ρ G C 3 F ) + y ( 1 x ) ( E 3 + B 3 + ρ M ξ F 1 C 3 K ) + ( 1 x ) ( 1 y ) ( E 3 + B 3 + ρ M + λ T C 3 K ) U z 2 = x y ( E 3 + S μ G ξ F K ) + x ( 1 y ) ( R 3 ρ G F ) + y ( 1 x ) ( E 3 ξ F 1 K ) + ( 1 x ) ( 1 y ) ( E 3 K ) U z ¯ = z U z 1 + ( 1 z ) U z 2
Based on the above expected payoff functions, the tripartite evolutionary game yields the following system of replicator dynamic equations:
U ( x ) = x ( U x 1 U ¯ x ) = x ( 1 x ) ( U x 1 U x 2 ) U ( y ) = y ( U y 1 U ¯ y ) = y ( 1 y ) ( U y 1 U y 2 ) U ( z ) = z ( U z 1 U ¯ z ) = z ( 1 z ) ( U z 1 U z 2 )
To determine the equilibrium points of the evolutionary game system, we set F ( x ) = F ( y ) = F ( z ) = 0 . By solving the system of equations simultaneously, we obtain eight pure-strategy equilibrium points, E 1 ( 0 , 0 , 0 ) , E 2 ( 0 , 0 , 1 ) , E 3 ( 0 , 1 , 0 ) , E 4 ( 0 , 1 , 1 ) , E 5 ( 1 , 0 , 0 ) , E 7 ( 1 , 1 , 0 ) , and E 8 ( 1 , 1 , 1 ) , and one mixed-strategy equilibrium point: E 9 ( x , y , z ) . In order for E 9 ( x , y , z ) to constitute a locally asymptotically stable equilibrium point of the system, it must satisfy the following conditions:
y ( C 1 B 1 + α 1 β 2 v 2 + γ ε v 1 ) + ρ M z + μ G + P C 1 η L 1 1 2 k 1 v 1 2 = 0 x ( C 2 B 2 + α 2 β 1 v 1 + γ ε v 2 ) + λ T z + ξ F + P C 2 η L 2 1 2 k 2 v 2 2 = 0 ( 1 x ) ρ M + ( 1 y ) λ T + B 3 C 3 = 0

3. Tripartite Evolutionarily Stable Strategy Analysis

3.1. Replicator Dynamics Analysis of Upstream Suppliers

The replicator dynamic equation describing the strategy evolution of the upstream suppliers is given by F ( x ) = x ( 1 x ) ( y ( C 1 B 1 + α 1 β 2 v 2 + γ ε v 1 ) + ρ M z + μ G + P C 1 η L 1 1 2 k 1 v 1 2 ) . Let F ( x ) = 0 ; then, the equilibrium points of the system are x = 0, x = 1, where y * = 1 2 k 1 v 1 2 ρ M z μ G P + C 1 + η L 1 C 1 B 1 + α 1 β 2 v 2 + γ ε v 1 .
According to the stability theorem of replicator dynamics, xxx represents an evolutionarily stable strategy (ESS) if the following condition is satisfied, F ( x ) = ( 1 2 x ) ( y ( C 1 B 1 + α 1 β 2 v 2 + γ ε v 1 ) + ρ M z + μ G + P C 1 η L 1 1 2 k 1 v 1 2 ) , where F ( x ) = 0 and F ( x ) < 0 denote the expected payoffs for the non-innovative and innovative strategies, respectively.
(1)
When y = y * = 1 2 k 1 v 1 2 ρ M z μ G P + C 1 + η L 1 C 1 B 1 + α 1 β 2 v 2 + γ ε v 1 , F ( x ) = 0 is non-positive or non-negative over the interval [0, 1], and any value of x can be stable. This implies that the upstream supplier’s strategy tends to remain unchanged over time regardless of its initial value. The strategy of choosing innovation investment does not evolve dynamically.
(2)
When y 1 2 k 1 v 1 2 ρ M z μ G P + C 1 + η L 1 C 1 B 1 + α 1 β 2 v 2 + γ ε v 1 , both x = 0 and x = 1 are potential equilibrium strategies. The stability of each depends on the relative payoff conditions. We consider two sub-cases:
(i)
If 0 < y < 1 2 k 1 v 1 2 ρ M z μ G P + C 1 + η L 1 C 1 B 1 + α 1 β 2 v 2 + γ ε v 1 , substituting x = 0 and x = 1 into the replicator dynamic equation yields F ( x ) . This indicates that x = 0 is a locally stable strategy. That is, when the probability 1 2 k 1 v 1 2 ρ M z μ G P + C 1 + η L 1 C 1 B 1 + α 1 β 2 v 2 + γ ε v 1 that downstream retailers adopt an innovation investment strategy is below a critical threshold 1 2 k 1 v 1 2 ρ M z μ G P + C 1 + η L 1 C 1 B 1 + α 1 β 2 v 2 + γ ε v 1 , upstream suppliers are more likely to evolve toward the “non-innovation investment” strategy.
(ii)
If 1 2 k 1 v 1 2 ρ M z μ G P + C 1 + η L 1 C 1 B 1 + α 1 β 2 v 2 + γ ε v 1 < y < 1 , similarly, substituting into the replicator dynamic equation gives F ( 0 ) > 0 and F ( 1 ) < 0 . In this case, x = 0, x = 1 becomes the evolutionarily stable point F ( x ) . This implies that when the probability of downstream retailers choosing innovation exceeds the threshold 1 2 k 1 v 1 2 ρ M z μ G P + C 1 + η L 1 C 1 B 1 + α 1 β 2 v 2 + γ ε v 1 , upstream suppliers tend to evolve toward the “innovation investment” strategy.
The above analysis gives the replicator dynamics phase diagrams for upstream suppliers, as presented in Figure 2. As can be seen from Figure 2, the evolutionary stability analysis of upstream suppliers’ strategies demonstrates that downstream retailers’ and the government’s strategic choices have a significant influence on the evolutionary equilibrium of upstream suppliers. Also, factors such as the cost of innovation investment, the economic surplus and prospect-related gains or losses associated with such investments, government support for innovation, and penalties for non-innovative behavior also play vital roles in affecting upstream suppliers’ strategic development.
When 0 < y < 1 2 k 1 v 1 2 ρ M z μ G P + C 1 + η L 1 C 1 B 1 + α 1 β 2 v 2 + γ ε v 1 , upstream suppliers adopt a non-innovative investment strategy as an evolutionarily stable state. A shift toward an innovation-oriented strategy may occur under the following conditions: (1) a reduction in innovation investment costs and associated prospect losses; (2) an increase in the excess economic returns gained from innovation; (3) enhanced governmental support for innovation and stricter penalties for non-innovative actions; and (4) an increase in the probabilities of the government adopting an active regulatory strategy and downstream retailers engaging in innovation investment. Under such conditions, the evolutionarily stable strategy of upstream suppliers may shift from non-innovation to innovation investment (i.e., from 1 2 k 1 v 1 2 ρ M z μ G P + C 1 + η L 1 C 1 B 1 + α 1 β 2 v 2 + γ ε v 1 < y < 1 ).
This figure illustrates the dynamic evolution of an evolutionary game system. The lines and arrows depict the evolutionary paths and directions of the system under different strategy profiles. Solid Lines with Arrows: Typically represent the stable paths or mainstream directions of the system’s evolution. The arrows point towards a potential Evolutionarily Stable Strategy or a stable equilibrium, indicating the direction in which the system will converge in most regions. Dashed Lines: Usually represent the critical line or separatrix. It divides the phase diagram into different “basins of attraction.” The system with an initial state on one side of this line will converge to one stable equilibrium, while an initial state on the other side will lead to a different equilibrium. This line itself is often an unstable “saddle path.”

3.2. Replicator Dynamics Analysis of Downstream Retailers

The replicator dynamic equation for the strategic choices of downstream retailers can be expressed as follows: Let F ( y ) = 0 ; then, the fixed points occur at y = 0, y = 1, and z * = 1 2 k 2 v 2 2 λ T z ξ F P + C 2 + η L 2 x ( C 2 B 2 + α 2 β 1 v 1 + γ ε v 2 ) λ T , where F ( y ) = y ( 1 y ) ( x ( C 2 B 2 + α 2 β 1 v 1 + γ ε v 2 ) + λ T z + ξ F + P C 2 η L 2 1 2 k 2 v 2 2 ) .
Based on the stability theorem of replicator dynamics, when F ( y ) = 0 , F ( y ) < 0 at the fixed point, the corresponding strategy is considered evolutionarily stable. Specifically, the equilibrium point y is evolutionarily stable if F ( y ) = ( 1 2 y ) ( x ( C 2 B 2 + α 2 β 1 v 1 + γ ε v 2 ) + λ T z + ξ F + P C 2 η L 2 1 2 k 2 v 2 2 ) .
(1)
When z = z * = 1 2 k 2 v 2 2 λ T z ξ F P + C 2 + η L 2 x ( C 2 B 2 + α 2 β 1 v 1 + γ ε v 2 ) λ T , it follows that F ( y ) = 0 , and the strategy of adopting collaborative innovation remains dynamically stable regardless of its initial probability. That is, the probability of downstream retailers adopting collaborative innovation remains unchanged over time.
(2)
When z 1 2 k 2 v 2 2 λ T z ξ F P + C 2 + η L 2 x ( C 2 B 2 + α 2 β 1 v 1 + γ ε v 2 ) λ T , two pure strategies exist at y = 0 and y = 1. The stability of each can be examined under the following conditions:
(i)
If 0 < z < 1 2 k 2 v 2 2 λ T z ξ F P + C 2 + η L 2 x ( C 2 B 2 + α 2 β 1 v 1 + γ ε v 2 ) λ T , then plugging in y = 0 and y = 1 into the replicator dynamic yields F ( 0 ) < 0 . This indicates that y = 0 is an evolutionarily stable strategy. That is, if the likelihood of upstream suppliers assuming collaborative innovation falls below some threshold, 1 2 k 2 v 2 2 λ T z ξ F P + C 2 + η L 2 x ( C 2 B 2 + α 2 β 1 v 1 + γ ε v 2 ) λ T , downstream retailers are more likely to take a non-collaborative approach.
(ii)
If 1 2 k 2 v 2 2 λ T z ξ F P + C 2 + η L 2 x ( C 2 B 2 + α 2 β 1 v 1 + γ ε v 2 ) λ T < z < 1 , then substituting y = 0 and y = 1 yields F ( y ) . In this case, y = 1 becomes the evolutionarily stable point, indicating that when the probability of upstream suppliers engaging in collaborative innovation exceeds a certain threshold 1 2 k 2 v 2 2 λ T z ξ F P + C 2 + η L 2 x ( C 2 B 2 + α 2 β 1 v 1 + γ ε v 2 ) λ T , downstream retailers tend to adopt collaborative innovation strategies.
Based on the above analysis, the phase diagram of the replicator dynamics for downstream retailers is illustrated in Figure 3.
As illustrated in Figure 3, the analysis of the evolutionary stability of downstream retailers’ strategies reveals that the strategic choices of upstream suppliers and the government exert significant influence on the evolutionarily stable strategies of downstream retailers. Moreover, factors such as the cost of collaborative innovation for downstream retailers, the excess economic returns and perceived gains/losses from such innovation, government subsidies for collaborative innovation, and regulatory constraints on non-collaborative behaviors also impact the stability of their strategic evolution. When downstream retailers adopt a non-collaborative innovation strategy as an evolutionarily stable outcome, it corresponds to a situation 0 < z < 1 2 k 2 v 2 2 λ T z ξ F P + C 2 + η L 2 x ( C 2 B 2 + α 2 β 1 v 1 + γ ε v 2 ) λ T where the expected payoff from collaboration is insufficient to drive behavioral change. However, if the following conditions are met—the costs and perceived losses associated with collaborative innovation decrease, the excess economic returns from collaborative innovation increase, government subsidies for collaborative innovation are enhanced, constraints on non-collaborative innovation are relaxed, and the probability of the government adopting an active regulatory strategy and that of upstream suppliers choosing collaborative innovation increases, 1 2 k 2 v 2 2 λ T z ξ F P + C 2 + η L 2 x ( C 2 B 2 + α 2 β 1 v 1 + γ ε v 2 ) λ T < z < 1 —then, a critical threshold may be surpassed, prompting a shift in the evolutionarily stable strategy from non-collaborative to collaborative innovation.

3.3. Government Replicator Dynamics Analysis

The replicator dynamic equation for the government’s strategic choice is given by F ( z ) = z ( 1 z ) ( ( 1 x ) ρ M + ( 1 y ) λ T + B 3 C 3 ) . Letting F ( z ) = 0 , we identify three equilibrium points: z = 0, z = 1, and x * = ρ M + A 3 + ( 1 y ) λ T C 3 ρ M .
According to the stability theorem of replicator dynamics, when F ( z ) = 0 and F ( z ) < 0 π , z represents an evolutionarily stable strategy (ESS), where F ( z ) = ( 1 2 z ) ( ( 1 x ) ρ M + ( 1 y ) λ T + B 3 C 3 ) .
When x = x * = ρ M + A 3 + ( 1 y ) λ T C 3 ρ M , the derivative F ( z ) = 0 for any z ∈ [0, 1], indicating that all strategy choices are evolutionarily stable, and the government’s inclination toward active regulation remains constant over time.
When x ρ M + A 3 + ( 1 y ) λ T C 3 ρ M , the two strategies z = 0 and z = 1 become focal points of z analysis. The discussion is divided into two cases:
(i)
If 0 < x < ρ M + A 3 + ( 1 y ) λ T C 3 ρ M , substituting z = 0 and z = 1 into the replicator dynamic equation yields F ( z ) , indicating that z = 1 is the evolutionarily stable strategy for the government. This implies that if the probability of upstream suppliers engaging in collaborative innovation falls below ρ M + A 3 + ( 1 y ) λ T C 3 ρ M , the government will prefer the “active regulation” strategy.
(ii)
If ρ M + A 3 + ( 1 y ) λ T C 3 ρ M < x < 1 , substituting z = 0 and z = 1 into the replicator dynamic equation F ( z ) yields F ( 0 ) < 0 and F ( 1 ) > 0 , indicating that z = 0 is the evolutionarily stable strategy. In this scenario, when the probability of upstream suppliers engaging in collaborative innovation exceeds ρ M + A 3 + ( 1 y ) λ T C 3 ρ M , the government will adopt the “passive regulation” strategy.
Based on the analysis above, the phase diagrams of the government replicator dynamics are presented in Figure 4.
As shown in Figure 4, the evolutionary stability of the government’s strategy is significantly influenced by the strategic decisions of upstream suppliers and downstream retailers. In addition, factors such as the cost of active regulation, reputational gains from regulatory enforcement, the severity of penalties imposed on upstream suppliers for non-collaborative innovation, and constraints applied to downstream retailers engaging in non-collaborative behavior also affect the government’s evolutionarily stable strategy. When the government adopts a passive regulatory strategy, this corresponds to a situation in which the perceived benefits of active regulation do not outweigh its associated costs. However, if the following conditions are met—the cost of active regulation decreases, the reputational benefits derived from active regulatory intervention increase, penalties imposed on upstream suppliers for non-collaborative innovation and constraints on downstream retailers engaging in non-collaborative behavior are intensified, and the probabilities of upstream suppliers and downstream retailers choosing collaborative innovation strategies decrease—then, a threshold may be reached, triggering a shift in the government’s evolutionarily stable strategy from passive to active regulation.
The evolutionary stability of the system is evaluated using Friedman’s method. Based on the replicator dynamic equations, the Jacobian matrix of the system is derived as follows, J = F ( x ) x F ( x ) y F ( x ) z F ( y ) x F ( y ) y F ( y ) z F ( z ) x F ( z ) y F ( z ) z , where the partial derivatives are functions of the payoff parameters and the strategy proportions, denoted as F ( x ) x = ( 1 2 x ) ( y ( C 1 B 1 + α 1 β 2 v 2 + γ ε v 1 ) + ρ M z + μ G + P C 1 η L 1 1 2 k 1 v 1 2 ) , F ( x ) y = x ( 1 x ) ( C 1 B 1 + α 1 β 2 v 2 + γ ε v 1 ) , F ( x ) z = x ( 1 x ) ρ M , F ( y ) x = y ( 1 y ) ( C 2 B 2 + α 2 β 1 v 1 + γ ε v 2 ) , F ( y ) z = y ( 1 y ) λ T , F ( y ) y = ( 1 2 y ) ( x ( C 2 B 2 + α 2 β 1 v 1 + γ ε v 2 ) + λ T z + ξ F + P C 2 η L 2 1 2 k 2 v 2 2 ) , F ( z ) x = z ( 1 z ) ρ M , F ( z ) z = z ( 1 z ) λ T , and F ( z ) z = ( 1 2 z ) ( ( 1 x ) ρ M + ( 1 y ) λ T + B 3 C 3 ) .
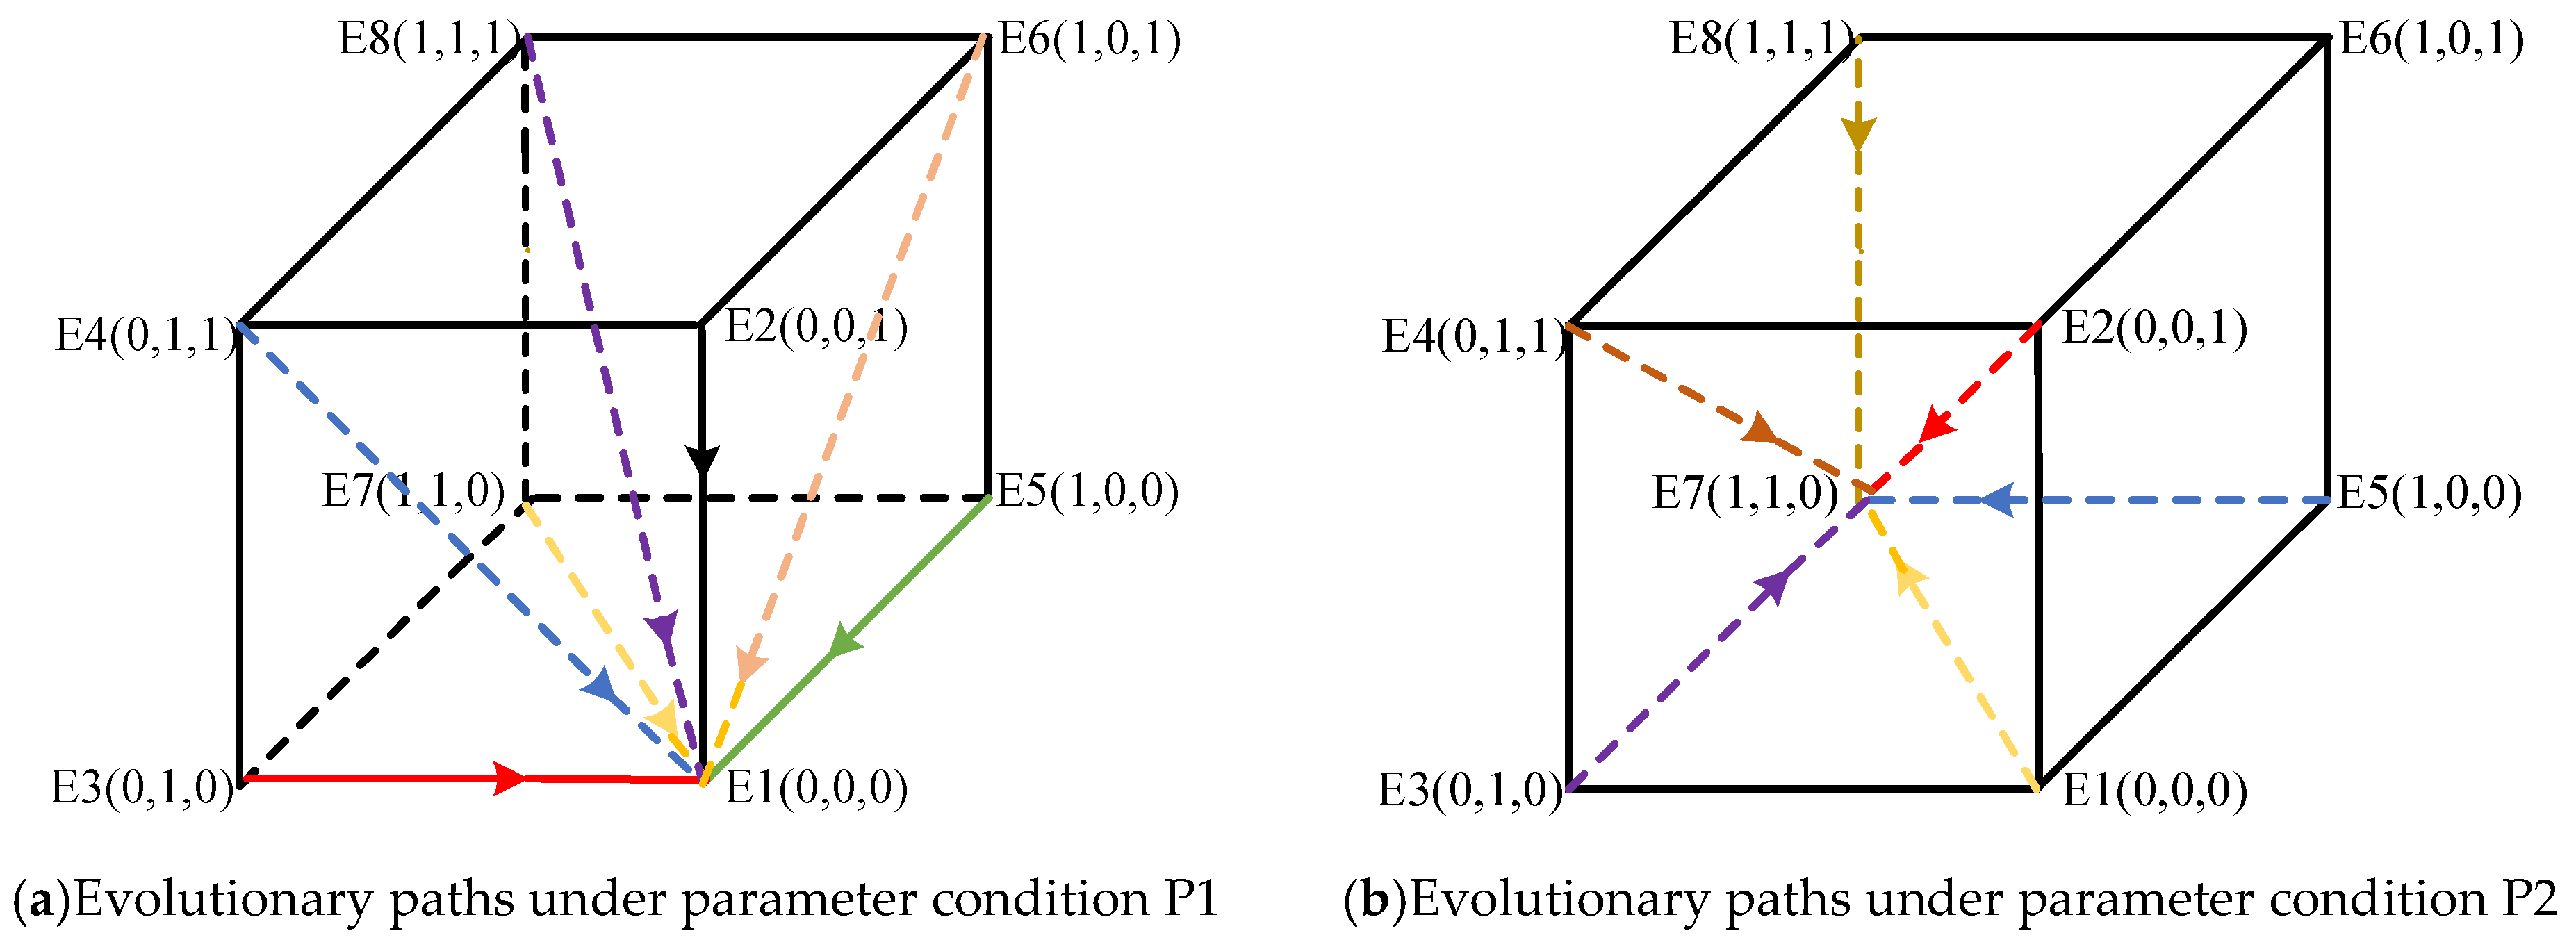
The analysis of evolutionarily stable strategies (ESSs) focuses exclusively on pure strategy equilibria. Specifically, the system contains eight pure strategy equilibrium points: E 1 ( 0 , 0 , 0 ) , E 2 ( 0 , 0 , 1 ) , E 3 ( 0 , 1 , 0 ) , E 4 ( 0 , 1 , 1 ) , E 5 ( 1 , 0 , 0 ) , E 6 ( 1 , 0 , 1 ) , E 7 ( 1 , 1 , 0 ) , and E 8 ( 1 , 1 , 1 ) .
According to the Lyapunov stability criterion, a given equilibrium point can be classified as follows:
J 1 = ρ G + L C 1 σ M 1 1 2 k 1 v 1 2 0 0 0 γ A + L C 2 σ M 2 1 2 k 2 v 2 2 0 0 0 η W + ω H + N 3 C 3
As shown in J1, the eigenvalues at equilibrium point E 1 ( 0 , 0 , 0 ) are λ 1 = μ G + P C 1 η L 1 1 2 k 1 v 1 2 , λ 2 = ξ F + P C 2 η L 2 1 2 k 2 v 2 2 , and λ 3 = ρ M + λ T + B 3 C 3 , respectively. Similarly, by substituting the remaining equilibrium points into the Jacobian matrix, the corresponding eigenvalues at each equilibrium point can be obtained. The results are summarized in Table 2.
Based on the eigenvalues of the Jacobian matrices at each equilibrium point as shown in Table 2, it is difficult to directly identify the Evolutionarily Stable Strategy (ESS) using the Lyapunov criterion due to the complexity of the model’s parameter settings. Therefore, a case-based analysis is required. To streamline the stability analysis without compromising generality, we assume that α 1 β 2 v 2 + γ ε v 1 + μ G + P A 1 η L 1 1 2 k 1 v 1 2 > 0 and α 2 β 1 v 1 + γ ε v 2 + ξ F + P A 2 η L 2 1 2 k 2 v 2 2 > 0 , indicating that when upstream and downstream firms engage in collaborative innovation and the government adopts active regulation, the firms’ innovation returns exceed their respective costs. The evolutionary stability of the tripartite game system is examined under the following three scenarios:
Scenario 1: When μ G + P C 1 η L 1 1 2 k 1 v 1 2 < 0, ξ F + P C 2 η L 2 1 2 k 2 v 2 2 < 0, and ρ M + λ T + B 3 C 3 < 0, the combined benefit of passive government regulation in supporting upstream suppliers’ collaborative innovation and the breach gains from downstream retailers’ non-collaborative behavior is less than the cost borne by upstream suppliers for collaboration. Likewise, the sum of subsidies provided under passive regulation to downstream retailers for collaborative innovation and the breach gains from upstream suppliers’ non-collaborative behavior is less than the cost borne by downstream retailers. Furthermore, the total benefits of active regulation—including penalties imposed on non-collaborative firms, constraints enforced, and improvements to the government’s regulatory image—are lower than the regulatory cost itself.
As shown in Table 3, the eigenvalues of the Jacobian matrices corresponding to points E 1 ( 0 , 0 , 0 ) and E 7 ( 1 , 1 , 0 ) are all negative, indicating that these two points are evolutionarily stable equilibria. That is, the strategies {Non-collaborative Innovation, Non-collaborative Innovation, Passive Regulation} and {Collaborative Innovation, Collaborative Innovation, Passive Regulation} represent the evolutionarily stable strategies of the system under this scenario. The corresponding phase diagram of system evolution is illustrated in Figure 5.
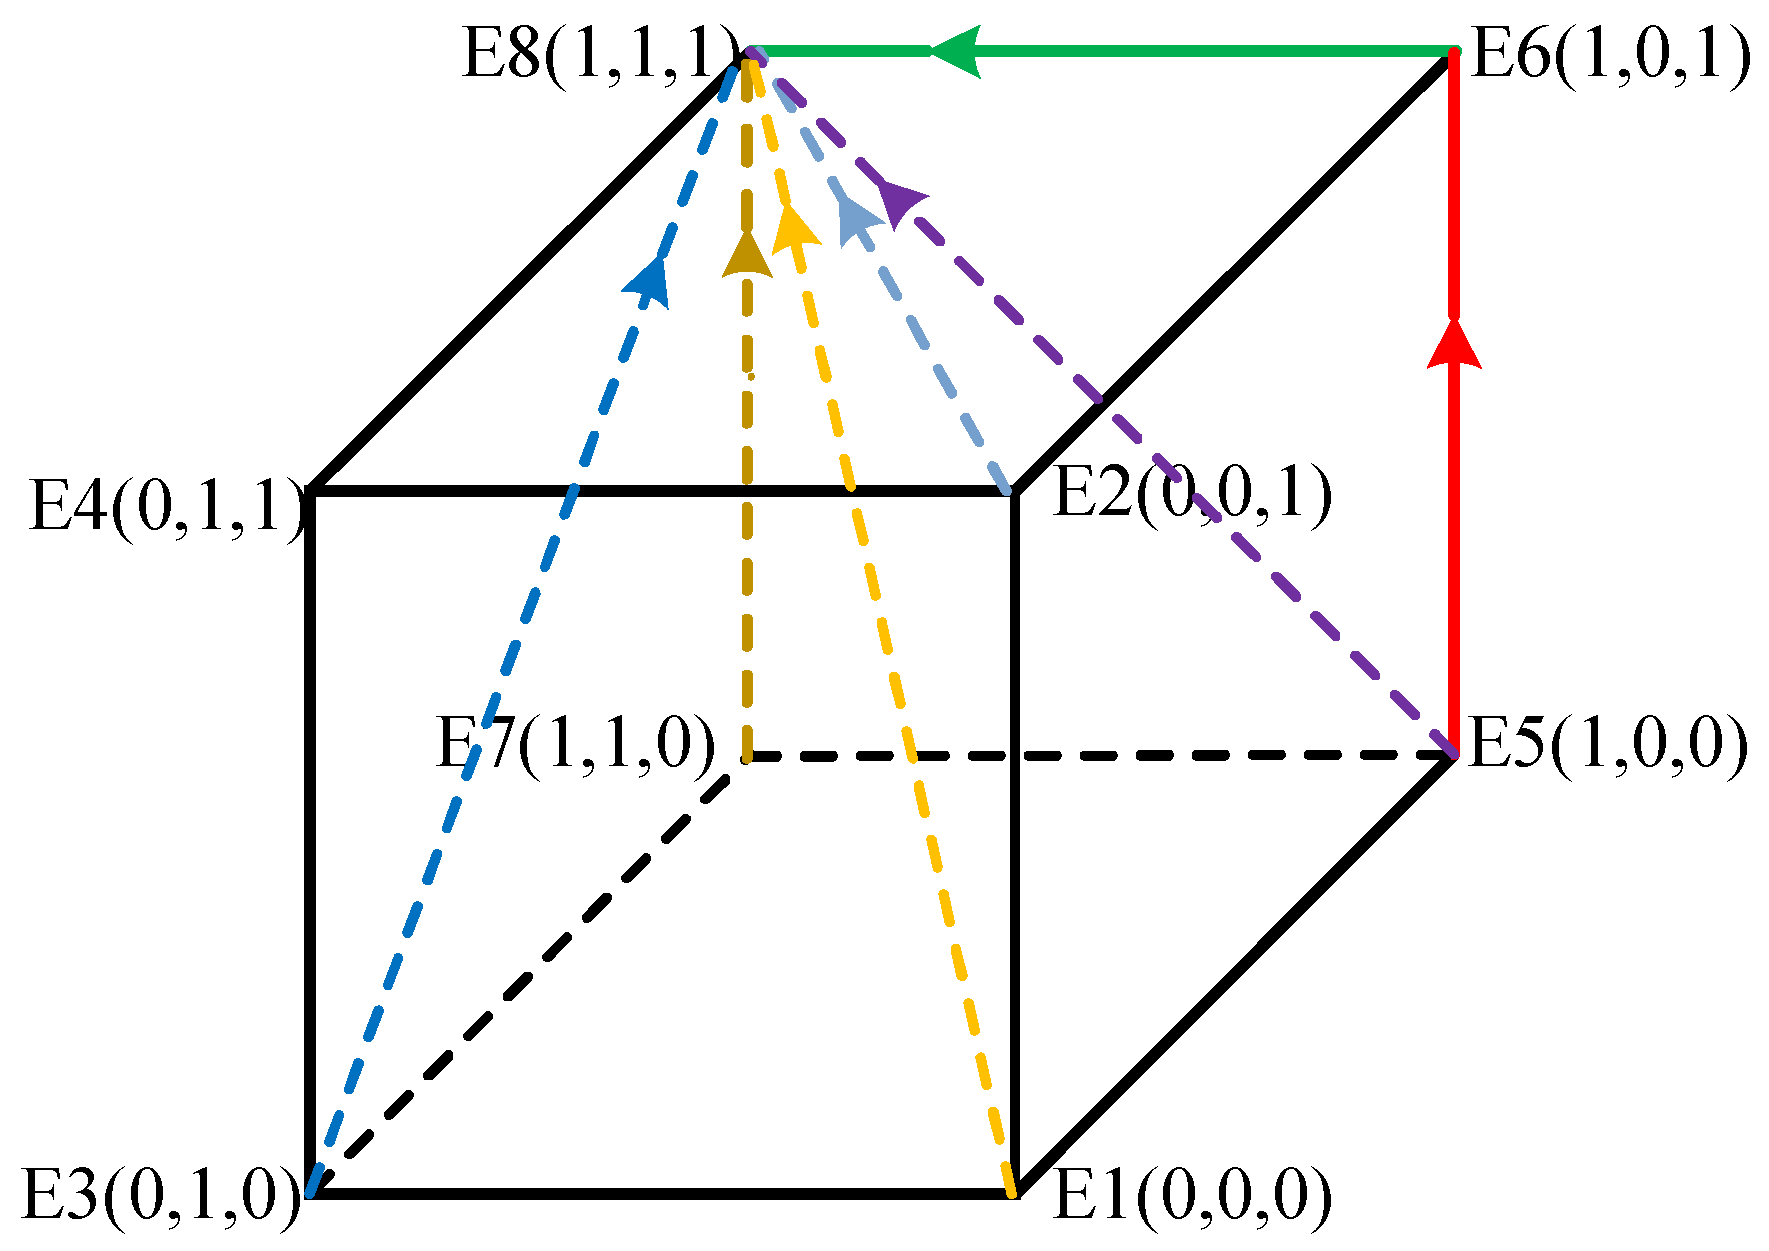
Scenario 2: When μ G + P C 1 η L 1 1 2 k 1 v 1 2 > 0, ξ F + P C 2 η L 2 1 2 k 2 v 2 2 > 0, and B 3 C 3 > 0, the combined benefit of passive government regulation in supporting upstream suppliers’ collaborative innovation and the breach gains from downstream retailers’ non-collaborative behavior exceeds the cost borne by upstream suppliers for engaging in collaborative innovation. Similarly, the total benefit of passive regulation—including subsidies to downstream retailers and the breach gains from upstream suppliers’ non-collaborative behavior—exceeds the cost of collaborative innovation for downstream retailers. Additionally, the reputational benefits gained by the government through active regulation are greater than its regulatory costs.
As shown in Table 3, the eigenvalues of the Jacobian matrix at point E 8 ( 1 , 1 , 1 ) are both negative, indicating that E 8 ( 1 , 1 , 1 ) is an evolutionarily stable equilibrium. This also implies that the strategy profile {Collaborative Innovation, Collaborative Innovation, Active Regulation} is the evolutionarily stable strategy of the system in this case. The corresponding phase diagram is provided in Figure 6. The validity conditions for Scenario 2 indicate that if the government increases its fiscal backing of upstream suppliers and provides additional subsidies to downstream retailers, then both of them are more likely to head towards collaborative innovation. Therefore, the greater the degree of fiscal incentives and policy support provided under passive regulation, the more likely is Scenario 2 as the stable equilibrium of the system.
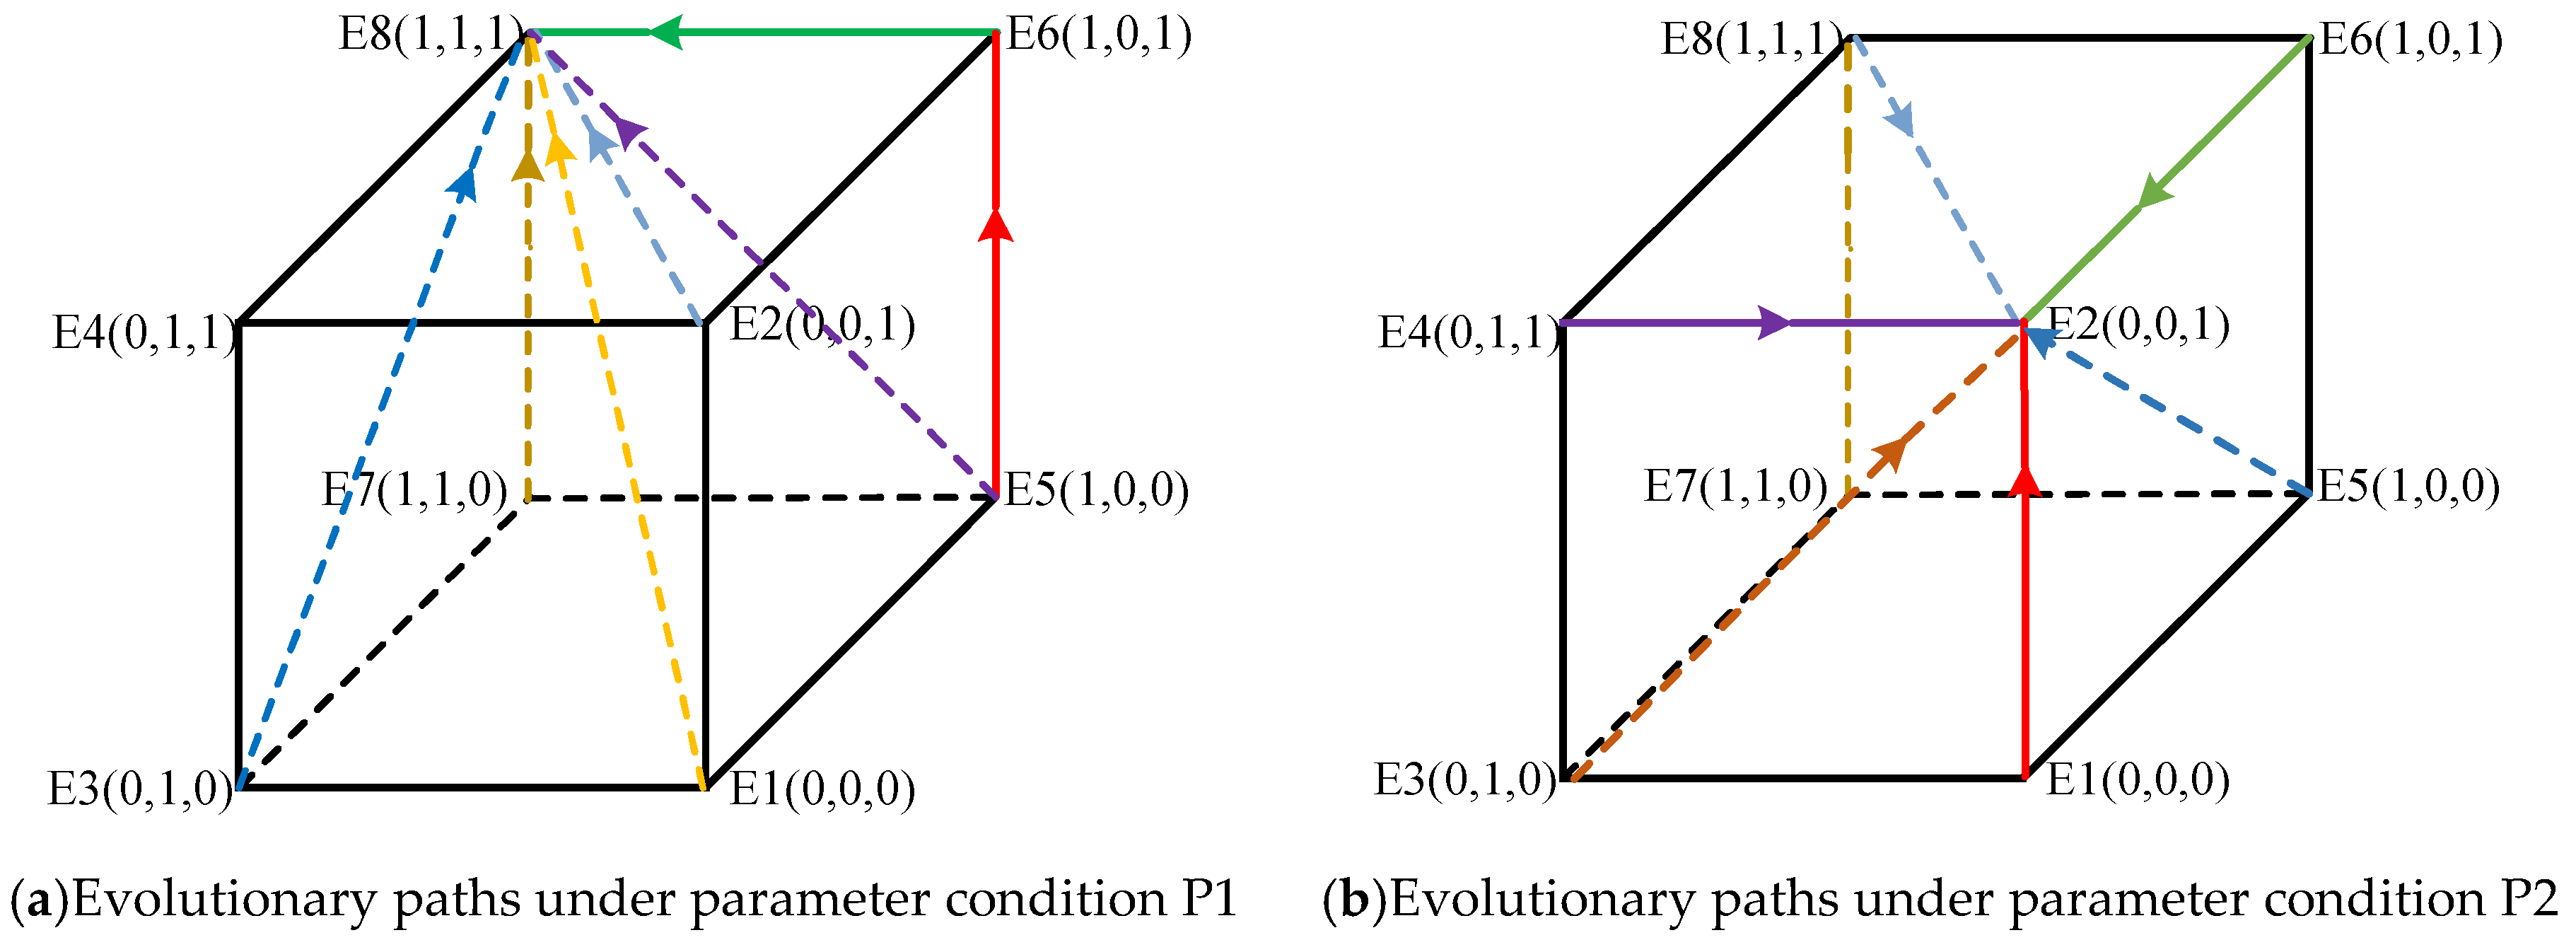
Scenario 3: When μ G + P + ρ M C 1 η L 1 1 2 k 1 v 1 2 < 0, ξ F + P + λ T C 2 η L 2 1 2 k 2 v 2 2 < 0, and B 3 C 3 > 0, the combined effect of passive regulation in supporting upstream suppliers, active regulation in penalizing non-collaborative behavior, and the breach gains from downstream retailers’ non-collaboration is still insufficient to offset the cost of upstream suppliers’ collaborative innovation. Similarly, the total benefit received by downstream retailers—including subsidies under passive regulation, constraints on non-collaborative behavior under active regulation, and breach gains from upstream suppliers’ non-collaboration—remains lower than their innovation cost. Meanwhile, the reputational benefits of active regulation for the government outweigh the corresponding costs.
According to Table 3, the eigenvalues of the Jacobian matrices at points E 2 ( 0 , 0 , 1 ) and E 8 ( 1 , 1 , 1 ) are all negative, indicating that both are evolutionarily stable equilibria. Thus, the strategy profiles {Non-collaborative Innovation, Non-collaborative Innovation, Active Regulation} and {Collaborative Innovation, Collaborative Innovation, Active Regulation} constitute stable evolutionary strategies under this scenario. The corresponding phase diagram is shown in Figure 7.

4. Simulation Analysis

Using Scenario 5 as reference in which the government has a moderately incentivizing policy, and both upstream suppliers’ and downstream retailers’ initial probabilities of collaborative innovation are 0.5. This is for the purpose of enabling more intuitive and qualitative examination of how the evolutionary stability of strategic actions of involved agents varies under different policy tools and intensities of incentives. For making the simulation outcomes scientific, and practically applicable, parameter values are selected against the literature and prevailing actualities. It should be noted here that the parameters are used only for analysis and modeling of evolutionary trends and do not represent actual monetary figures. The initial values of the parameters are C1 = 3, C2 = 3, A1 = 1, B2 = 1, α1 = 0.6, α2 = 0.5, β1 = 0.8, β2 = 0.6, v1 = 4, v2 = 5, γ = 0.8, ε = 0.7, P = 6, η = 0.5, L1 = 2, L2 = 3, k1 = 0.4, and k2 = 0.4.

4.1. Impact of the Benefit Conversion Efficiency Coefficient on System Evolution

Based on the assumption that the initial strategic probabilities and other parameters remain constant, the return conversion efficiency coefficient α is controlled at levels of 0.0, 0.1, 0.2, 0.3, 0.4, 0.5, 0.6, 0.7, 0.8, 0.9, and 1.0. The evolutionary trajectories of system strategies at each α level are drawn in Figure 8. As shown, at different levels of α , the system always converges to a cooperative innovation strategy. In addition, the pace of evolution is higher for greater values of α . This implies that in supply chain management innovation, the rate at which upstream and downstream firms convert external resources into internal benefits is the deciding factor for both the stability and speed of their evolution towards collaborative innovation strategies.
Higher return conversion efficiency will enable each unit of resource input to generate more returns, thereby enhancing participants’ intention to accept collaborative innovation and accelerating their strategic development. In this connection, the government may indirectly promote stakeholders’ acceptance and utilization of collaborative innovation by introducing incentive policies, offering management training, and constructing in-formation-sharing platforms. These activities make it possible for the participants to improve their capacities to take in external resources and transform them into real benefits, thus elevating the overall management level and driving the system to develop steadily towards the pattern of high-efficiency, collaborative innovation.

4.2. Impact of Information Sharing Coefficient on System Evolution

With other parameters and initial strategic probabilities maintained constant, the information sharing coefficient β is increased from 0.0 to 1.0 (step size = 0.1) [42]. The resulting evolutionary trajectories of system strategies are depicted in Figure 9. It is observed from the figure that for any value of β , the system always evolves towards a collaborative innovation strategy, and the rate of evolution is greater for higher values of β . This means that the extent of information exchange is a primary driver of stakeholders’ adoption of collaborative innovation methods. Greater exchange of information between the upstream and downstream supply chain actors facilitates broader exchange of technological information, managerial expertise, and operational experience, thereby improving co-ordination efficiency. The system consequently develops much more quickly towards a collaborative innovation state, and the resulting synergistic benefits are greatly enhanced.
To cultivate collective innovation, actors in the supply chain should continually enhance their information-exchange mechanisms via measures such as the development of open data interfaces, co-construction of mutual platforms, and institutional arrangement modifications. Meanwhile, the government β as a facilitator and regulator can be directly engaged by offering financial subsidies, tax rebates, and pilot demonstration programs. These policy tools can effectively guide and stimulate stakeholders to improve inter-organizational alignment and resource coordination, thereby establishing a more robust innovation ecosystem.

4.3. Impact of Mutual Trust Coefficient on System Evolution

Keeping the initial strategic probabilities and other parameters constant, information sharing coefficient γ is changed incrementally from 0.0 to 1.0 (at intervals of 0.1) [43]. The ensuing evolutionary trajectories of system strategies are sketched in Figure 10. As the figure shows, regardless of the value of γ , the system always converges to a cooperative innovation strategy, and the evolutionary speed accelerates with increasing γ . It implies that the degree of information sharing is among the most important drivers of stakeholders adopting collaborative innovation strategies. More information sharing between upstream and downstream supply chain actors allows for the more comprehensive exchange of technological information, managerial knowledge, and operational experience, thereby enhancing coordination efficiency. Consequently, the duration of the system’s transition towards a collaborative innovation regime is significantly reduced, and the resulting synergy gains are significantly enhanced [44].
To promote collaborative innovation, supply chain actors must constantly refine their information-sharing practices through actions such as developing open data interfaces, co-building collaborative platforms, and modifying institutional arrangements. Meanwhile, the government—as a regulative and facilitative institution—can play an active role by implementing fiscal subsidies, tax rebates, and pilot demonstration projects. Such policy tools can effectively guide and motivate actors to strengthen inter-organizational coordination and resource alignment, thereby constructing a more stable innovation ecosystem.

4.4. Impact of Fiscal Subsidy Coefficient on System Evolution

Keeping other parameters and initial strategic probabilities constant, the fiscal subsidy coefficient δ is varied from 0.0 to 1.0. The resulting evolutionary trajectories of system strategies are shown in Figure 11. The results demonstrate that the evolutionary dynamics of the system vary significantly with changes in δ , highlighting the critical role of fiscal subsidies as an external incentive variable. Fiscal incentives significantly enhance the evolutionary stability and systemic efficiency of collaborative innovation in supply chains.
Inadequate funding does not overcome path dependence and short-termism and hence discourages cooperation on the part of companies. A moderate to high fiscal subsidy, however, can counteract firms’ financial necessity and regulatory risk during the early stages while, simultaneously, creating an effective signaling mechanism. This reinforces the view of long-term collaborative benefits among stakeholders and compels the development of the system towards a highly synergized, green, low-carbon, and platform-based supply chain model. Hence, the policymakers shall modify fiscal subsidy intensities in accordance with regional development stages, functional geographic positions, and dominant industry capabilities. A marginal policy effectiveness determination in real time must also be performed to gradually construct a tiered adaptive regional incentive system. Such a system would provide ongoing support for upgrading regional supply chain innovation models.

5. Discussion

This section focuses on the theoretical interpretation of the simulation results, aiming to reveal the internal mechanisms of collaborative innovation and the influence of spatial heterogeneity, rather than managerial or policy recommendations.
We focused on supply chain collaborative innovation within the context of regional economic heterogeneity and spatial resource reallocation. We construct a tripartite evolutionary game model encompassing government, upstream enterprises, and downstream enterprises. By evolutionary game theory and numerical simulation methods, we incorporate hierarchical spatial structures and differentiated policy incentive mechanisms. This reveals the strategic adjustment pathways and collaborative evolutionary dynamics of various actors under bounded rationality conditions. This research elucidates how multidimensional policy incentives influence firms’ collaborative innovative strategy. Furthermore, we uncover the profound impact of geographical spatial patterns on the overall efficiency of supply chain collaboration.
Theoretical contributions. This study introduces a geographically stratified structure (core cities–secondary nodes–peripheral regions) within the evolutionary system. This differs from earlier research which assumed homogeneous regions or employed static game frameworks. We integrated regional heterogeneity parameters into the policy design function. This enables the model to achieve a higher level of spatial differentiation. Compared with previous studies, it overcomes the shortcomings of spatial configuration homogeneity or even neglects traditional supply chain collaboration models. Through computer simulation, we estimated the strategic shifts in different regional nodes under incentive mechanisms. This research expands the application domain of evolutionary game theory in multi-level regional systems.
Methodological Innovation. We integrate platform-based cooperation mechanisms, innovation investment behaviors, and profit-sharing policies into the strategic domain of game models. Employing Evolutionarily Stable Strategy theory, we construct a dynamic replicator equation system. This better elucidates the adaptive behavioral evolution process of corporate organizations and government agencies in promoting coordinated development. This study diverges from traditional static equilibrium analysis. Through system simulation and sensitivity testing of fiscal incentive parameters, we establish a research framework that integrates dynamic characteristics with strategic feedback mechanisms.
Practical Implications. Simulation results indicate that if government subsidies are limited in core regions, firms outside core regions will be less inclined to join, and it therefore becomes difficult to form a closed-loop collaboration mechanism. A stratified policy framework—measuring “core-driven” initiatives in combination with “periphery-subsidized” help—will enable effective facilitation of cross-regional flows of resources and information. This, in turn, encourages diversified collaboration models for firms, making the entire supply chain system more flexible and robust. These results have important reference value for enhancing regional industrial cooperation policies and maximizing spatial–functional integration.

6. Conclusions

As a first point, fiscal incentive policies are a key force behind the evolutionary dynamics of regional supply chain collaborative innovation. Through the derived results from the evolutionary game model and numerical simulations, it is shown that the intensity of fiscal subsidies largely determines whether stakeholders, especially upstream suppliers and downstream distributors, follow cooperative, innovative, and high-investment strategies. When the subsidy rate is low, firms adopt conservative and traditional forms of strategy in order to avoid the risks and uncertainties of investment in innovation so that the system becomes trapped in a low-efficiency mode of extensive expansion. But when the fiscal subsidy coefficient increases, compensation from the outside and risk aversion evoke the willingness and capacity of firms to engage in collaborative innovation. This change leads the system toward more efficient, sustainable, and stable collaborative equilibrium. They highlight the supply chain management role of fiscal policy and refer to the interdependent, dynamic relationship between government stimuli, firm adjustment, and system optimization.
Second, spatial restructuring reinforces hierarchical differentiation at the level of supply chain systems, thereby affecting collaborative efficiency and path dependence. Differentials in industrial bases, resource endowments, institutional environments, and market capacities across locations suggest that the marginal effects of a specific collaborative innovation mechanism vary considerably by location. By incorporating spatial hierarchy and heterogeneity parameters into the model, this research reveals that firms in core regions, with the privilege of agglomeration of resources, policy favor, and information advantage, will be inclined to act as initiators and leaders of collaborative innovation. Firms in peripheral regions, in contrast, are burdened with excessive coordination costs, institutional barriers, and inadequate incentives, thus finding themselves inactive or passive participants, and thus becoming a crucial bottleneck to improving regional collaborative efficiency. As such, uniform fiscal incentives are insufficient to overcome regional path dependencies. A more effective approach is to have differentiated, adaptive, and stratified policy mechanisms in terms of geographic distribution and industrial structures, so as to generate point-to-surface synergy and facilitate regional integration.
Third, the government’s role in regional supply chain collaboration must shift from a “regulator” to an “ecosystem architect.” The traditional approaches by government concentrate on administrative command and ex-post correction. However, in a collaborative innovation-led governance regime, the optimal role government can play is no longer as a monolithic regulator, but one of a system designer, a resource allocator, and a multi-stakeholder coordinator. The findings show that by dynamic adjustment of the intensity of subsidy, optimization of mechanisms for profit-sharing, and steering of platform-based collaboration mechanism generation, the government can significantly improve firm participation, as well as strategic stability. Furthermore, they favor the evolution of a self-organizing collaborative innovation ecosystem. Therefore, promoting high-quality development of local supply chains requires the government to further increase the systemic coherence and flexibility of its policies, more clearly demarcate the institutional coordination logic at various spatial scales, and best play its multi-functional role as a regulator, facilitator, and service provider in a polycentric governance system.
In supply chain transformation and upgrading, the government should not only act as a regulator but also as an institutional designer and incentive provider. By more complex and regionally targeted fiscal policy, governments are capable of mobilizing enterprise participation more effectively and constructing a stronger and cooperative supply chain system under multi-regional configurations. From a policy perspective, the simulation results provide several practical implications. First, maintaining an appropriate level of fiscal subsidy (x) is essential. Moderate subsidies can effectively encourage firms to participate in collaborative innovation, but excessive support may cause dependency and inefficiency. Second, improving the efficiency of information sharing (b) and building stable trust mechanisms (g) among regional enterprises can reduce cooperation risks and accelerate the convergence of collaborative behaviors. Therefore, the government should promote open data-sharing platforms and transparent cooperation mechanisms to enhance information flow and trust. Finally, due to regional heterogeneity, a differentiated strategy should be applied—core regions should play a leading role in technology and innovation diffusion, while peripheral regions should receive targeted fiscal and technical assistance. This “core-driving and periphery-supporting” framework helps balance efficiency and equity in regional collaborative development.
Governments are advised to carefully consider, when they plan fiscal subsidies and policy incentives for innovation, the industrial maturity, the resource carrying capacity, and the level of development of the location of every enterprise. A differentiated fiscal support strategy—“core leadership, nodal activation, and peripheral compensation”—should be pursued. On one hand, policies should reinforce the leading role of core enterprises in coordinating platforms. By contrast, risk compensation, tax relief, and initial investment support should be provided to peripheral-region businesses to eliminate participation barriers, thereby enhancing the structural integrity and regional connectivity of the supply chain collaboration network.
Promote the Development of Platform-Based Supply Chain Mechanisms to Reduce Collaboration Barriers and Operating Expenses. This platform is a significant vehicle for enhancing supply chain collaboration capabilities and effectiveness in bringing together resources. Governments and leading businesses are advised to jointly develop regional digital collaboration platforms, promoting the utilization of standardized interfaces, common databases, and integrated information flow systems. These tools can function as one “technology-institution-market” collaborative system. These platforms have to provide transparency, secure information exchange, and value capture and thereby both intrinsically contribute to the stability and efficiency of collaborative innovation and reduce the costs inherent in strategic interactions.
Establish Inter-Regional Cooperative Governance Institutions to Achieve Fiscal Synergy and Institutional Harmony. Regional innovation in cooperation tends to cross several administrative domains, where there are institutional constraints of diverse policy goals, fiscal systems, and regulatory standards. Central or higher-level governments are tasked with taking the initiative to launch inter-regional fiscal co-ordination platforms and advancing institutional arrangements in line with the principles of “co-construction, co-sharing, and co-governance.” Inter-regional incentive alignment mechanisms, co-operative development funds, and cross-jurisdictional profit-sharing arrangements must be utilized to counter administrative fragmentation and enable collective effectiveness of systemic governance.
Strengthen the Institutional Environment to Solidify Firms’ Confidence and Stabilize Expectations in Participating in Collaborative Innovation. In addition to fiscal incentives, governments must also establish complementary institutional arrangements, including failure-tolerance mechanisms for innovation, risk guarantee systems, and intellectual property protection systems. These can generate a supportive environment that will encourage firms to invest in trial-and-error and continuous innovation activities. In addition, building the collaborative innovation behavior assessment and feedback mechanisms is necessary. There is a need to move from outcome-oriented evaluation to process-oriented optimization to provide enterprises with policy predictability in the long run and enhance confidence in long-term regional collaboration.
In summary, regional collaborative supply chain innovation also requires not only technological cooperation among firms but also shared institutional styles and policymaking coordination. Based on a theoretically robust framework, this paper presents an understanding of the dynamic mechanisms of regional supply chain collaboration. Further model complexity, empirical testing, and spatial representational dimensions can be added by future research to yield more precise managerial implications and policymaking adaptability analysis.

Author Contributions

Conceptualization, R.L. and C.L.; methodology, R.L.; software, R.L.; validation, J.Z.; formal analysis, R.L.; investigation, C.L.; resources, C.L.; data curation, R.L.; writing—original draft preparation, R.L.; writing—review and editing, C.L.; visualization, J.Z.; supervision, J.Z. and C.L.; project administration, R.L.; funding acquisition, C.L. All authors have read and agreed to the published version of the manuscript.

Funding

Funded by the National Social Science Fund of China (Key Program: 24AGL026).

Data Availability Statement

The authors confirm that the data supporting the findings of this study are available within the article.

Acknowledgments

The authors express their sincere gratitude to the editors and reviewers whose constructive and invaluable comments and suggestions played a decisive role in improving the quality of this article.

Conflicts of Interest

The authors declare no conflicts of interest.

References

  1. Wang, Y.; Xu, J.; Zhang, G. An Evolutionary Game Study of Collaborative Innovation across the Whole Industry Chain of Rural E-Commerce under Digital Empowerment. Systems 2024, 12, 353. [Google Scholar] [CrossRef]
  2. Ciarli, T.; Kenney, M.; Massini, S.; Piscitello, L. Digital technologies, innovation, and skills: Emerging trajectories and challenges. Res. Policy 2021, 50, 104289. [Google Scholar] [CrossRef]
  3. Chen, X.; Wang, C.; Li, S. The impact of supply chain finance on corporate social responsibility and creating shared value: A case from the emerging economy. Supply Chain Manag. 2023, 28, 324–346. [Google Scholar] [CrossRef]
  4. Feng, K.; Han, S.; Feng, M.; Szolnoki, A. An evolutionary game with reputation-based imitation-mutation dynamics. Appl. Math. Comput. 2024, 472, 128618. [Google Scholar] [CrossRef]
  5. Han, J.; Guo, J.E.; Cai, X.; Lv, C.; Lev, B. An analysis on strategy evolution of research & development in cooperative innovation network of new energy vehicle within policy transition period. Omega 2022, 112, 102686. [Google Scholar] [CrossRef]
  6. Hashemi, V.; Taleai, M.; Abolhasani, S. Enhancing agricultural land valuation in land consolidation projects through cooperative game theory and genetic algorithm optimization. Habitat Int. 2024, 152, 103157. [Google Scholar] [CrossRef]
  7. He, Y.; Yang, Y.; Wang, S. Network and mechanism of China’s new energy vehicle industry from the perspective of value chain. J. Geogr. Sci. 2024, 34, 779–803. [Google Scholar] [CrossRef]
  8. Hendriksen, C. Artificial intelligence for supply chain management: Disruptive innovation or innovative disruption? J. Supply Chain Manag. 2023, 59, 65–76. [Google Scholar] [CrossRef]
  9. Iftikhar, A.; Ali, I.; Arslan, A.; Tarba, S. Digital innovation, data analytics, and supply chain resiliency: A bibliometric-based systematic literature review. Ann. Oper. Res. 2024, 333, 825–848. [Google Scholar] [CrossRef]
  10. Isaksen, A.; Jakobsen, S.-E.; Njøs, R.; Normann, R. Regional industrial restructuring resulting from individual and system agency. Innov. Eur. J. Soc. Sci. Res. 2019, 32, 48–65. [Google Scholar] [CrossRef]
  11. Lingfan, Y.; Mi, T.; Xiaolong, L.; Xiaolong, L. Inter-city cooperation fever’ in China: Its trajectory, mechanisms and adjustment strategy. Habitat Int. 2025, 158, 103355. [Google Scholar] [CrossRef]
  12. Qiu, L.; Xia, W.; Wei, S.; Hu, H.; Yang, L.; Chen, Y.; Zhou, H.; Hu, F. Collaborative management of environmental pollution and carbon emissions drives local green growth: An analysis based on spatial effects. Environ. Res. 2024, 259, 119546. [Google Scholar] [CrossRef]
  13. Rahmanzadeh, S.; Pishvaee, M.S.; Govindan, K. Emergence of open supply chain management: The role of open innovation in the future smart industry using digital twin network. Ann. Oper. Res. 2023, 329, 979–1007. [Google Scholar] [CrossRef]
  14. Richey, R.G.; Chowdhury, S.; Davis-Sramek, B.; Giannakis, M.; Dwivedi, Y.K. Artificial intelligence in logistics and supply chain management: A primer and roadmap for research. J. Bus. Logist. 2023, 44, 532–549. [Google Scholar] [CrossRef]
  15. Shi, T.; Han, F.; Chen, L.; Shi, J.; Xiao, H. Study on value co-creation and evolution game of low-carbon technological innovation ecosystem. J. Clean. Prod. 2023, 414, 137720. [Google Scholar] [CrossRef]
  16. Wang, J.; Sun, Q.; Zou, L. Spatial-temporal evolution and driving mechanism of rural production-living-ecological space in Pingtan islands, China. Habitat Int. 2023, 137, 102833. [Google Scholar] [CrossRef]
  17. Belhadi, A.; Mani, V.; Kamble, S.S.; Khan, S.A.R.; Verma, S. Artificial intelligence-driven innovation for enhancing supply chain resilience and performance under the effect of supply chain dynamism: An empirical investigation. Ann. Oper. Res. 2024, 333, 627–652. [Google Scholar] [CrossRef] [PubMed]
  18. Chen, W.; Yang, Z.; Yan, H.; Zhao, Y. How to reduce construction risks in rural areas: An evolutionary game analysis. Eng. Constr. Archit. Manag. 2024, 32, 4495–4521. [Google Scholar] [CrossRef]
  19. Hellström, D.; Olsson, J. Let’s Go Thrift Shopping: Exploring Circular Business Model Innovation in Fashion Retail. Technol. Forecast. Soc. Change 2024, 198, 123000. [Google Scholar] [CrossRef]
  20. Zhang, G.; Wang, X.; Wang, Y.; Xu, J. A Tripartite Evolutionary Game for the Regional Green Logistics: The Roles of Government Subsidy and Platform’s Cost-Sharing. Kybernetes 2024, 53, 216–237. [Google Scholar] [CrossRef]
  21. Huang, F.; Fan, H.; Shang, Y.; Wei, Y.; Almutairi, S.Z.; Alharbi, A.M.; Ma, H.; Wang, H. Research on Renewable Energy Trading Strategies Based on Evolutionary Game Theory. Sustainability 2024, 16, 2671. [Google Scholar] [CrossRef]
  22. Jiang, X.; Wang, L.; Cao, B.; Fan, X. Benefit distribution and stability analysis of enterprises’ technological innovation cooperation alliance. Comput. Ind. Eng. 2021, 161, 107637. [Google Scholar] [CrossRef]
  23. Liu, H.; Wu, Q. Evolutionary game analysis on technological innovation strategies of marine ranching enterprises considering government’s incentive policies and consumer preferences. Front. Mar. Sci. 2024, 11, 1470846. [Google Scholar] [CrossRef]
  24. Cai, M.; Hu, S.; Wang, Y.; Xiao, J. A Dynamic Social Network Matching Model for Virtual Power Plants and Distributed Energy Resources with Probabilistic Linguistic Information. Sustainability 2022, 14, 14920. [Google Scholar] [CrossRef]
  25. Zou, H.; Qin, H.; He, D.; Sun, J. Research on an enterprise green innovation ecosystem from the vulnerability perspective: Evolutionary game and simulation. IEEE Access 2021, 9, 140809–140823. [Google Scholar] [CrossRef]
  26. Shakiba, H.; Belitski, M. A game theory analysis of regional innovation ecosystems. J. Technol. Transf. 2025, 50, 797–820. [Google Scholar] [CrossRef]
  27. Zhao, X.; Zou, Z.; Li, J.; Yuan, X.; He, X. Monitoring Policy-Driven Urban Restructuring and Logistics Agglomeration in Zhengzhou Through Multi-Source Remote Sensing: An NTL-POI Integrated Spatiotemporal Analysis. Remote Sens. 2025, 17, 3107. [Google Scholar] [CrossRef]
  28. Hao, Q.; Chen, C.; Xu, Q.; Lou, F.; Li, Y.; Yan, R.; Fang, J. Analysis of the evolutionary game of energy-saving retrofit of residential buildings in urban villages under the background of urban renewal. J. Hous. Built Environ. 2025, 40, 1715–1747. [Google Scholar] [CrossRef]
  29. Paula, I.C.; Campos, E.A.R.; Pagani, R.N.; Guarnieri, P.; Kaviani, M.A. Are collaboration and trust sources for innovation in the reverse logistics? Insights from a systematic literature review. Supply Chain Manag. Int. J. 2020, 25, 176–222. [Google Scholar] [CrossRef]
  30. Hulke, C.; Diez, J.R. Understanding regional value chain evolution in peripheral areas through governance interactions-An institutional layering approach. Appl. Geogr. 2022, 139, 102640. [Google Scholar] [CrossRef]
  31. Jakobsen, S.E.; Uyarra, E.; Njøs, R.; Fløysand, A. Policy action for green restructuring in specialized industrial regions. Eur. Urban Reg. Stud. 2022, 29, 312–331. [Google Scholar] [CrossRef]
  32. Wang, N.; Weng, G. Spatiotemporal Evolution of and Regional Differences in Consumer Disputes in the Tourism System: Empirical Evidence from the Yangtze River Economic Belt, China. Systems 2025, 13, 473. [Google Scholar] [CrossRef]
  33. Xu, J.; Liu, S. Current status, evolutionary path, and development trends of low-carbon technology innovation: A bibliometric analysis. Environ. Dev. Sustain. 2024, 26, 24151–24182. [Google Scholar] [CrossRef]
  34. Yeung, H.W. Regional worlds: From related variety in regional diversification to strategic coupling in global production networks. Reg. Stud. 2021, 55, 989–1010. [Google Scholar] [CrossRef]
  35. Xue, L.; Yao, F.; Liang, J. Study on the spatial and temporal evolution characteristics and future trends of China’s coal mining and dressing industry green total factor productivity. Environ. Dev. Sustain. 2025, 27, 19025–19066. [Google Scholar] [CrossRef]
  36. Liu, J.; Dong, C. Understanding the complex adaptive characteristics of cross-regional emergency collaboration in china: A stochastic evolutionary game approach. Fractal Fract. 2024, 8, 98. [Google Scholar] [CrossRef]
  37. Tang, Q.; Wang, C.; Feng, T. Research on the Group Innovation Information-Sharing Strategy of the Industry–University-Research Innovation Alliance Based on an Evolutionary Game. Mathematics 2023, 11, 4161. [Google Scholar] [CrossRef]
  38. Weibull, J.W. Evolutionary Game Theory; MIT Press: Cambridge, MA, USA, 1997; Volume 3, pp. 190–196. [Google Scholar]
  39. Shi, J.; Lu, H.; Liu, W. Tripartite Evolutionary Game Analysis for Manufacturing Firms, Service Providers and Consumers in Collaborative Innovation Systems. Mathematics 2025, 13, 2227–7390. [Google Scholar] [CrossRef]
  40. Ding, X.; Ren, J.; Lu, H.; Hussain, J.; Zhou, R. Strategic dynamics of local governments in regional collaborative governance: An evolutionary game theory analysis of haze pollution response in the Fen-Wei Plain, China. Heliyon 2024, 10, 2405–8440. [Google Scholar] [CrossRef]
  41. Peng, D.; Wu, H.; Wang, L. Comprehensive energy cooperative optimization model based on energy conversion efficiency considering investment benefit. Int. J. Energy Res. 2021, 45, 2997–3015. [Google Scholar] [CrossRef]
  42. Zha, Y.; Li, Q.; Huang, T.; Yu, Y. Strategic information sharing of online platforms as resellers or marketplaces. Mark. Sci. 2023, 42, 659–678. [Google Scholar] [CrossRef]
  43. Singh, A.; Chatterjee, K. An adaptive mutual trust based access control model for electronic healthcare system. J. Ambient. Intell. Hum. Comput. 2020, 11, 2117–2136. [Google Scholar] [CrossRef]
  44. Zhou, C.; Leng, M.; Liu, Z.; Cui, X.; Yu, J. The impact of recommender systems and pricing strategies on brand competition and consumer search. Electron. Commer. Res. Appl. 2022, 53, 101144. [Google Scholar] [CrossRef]
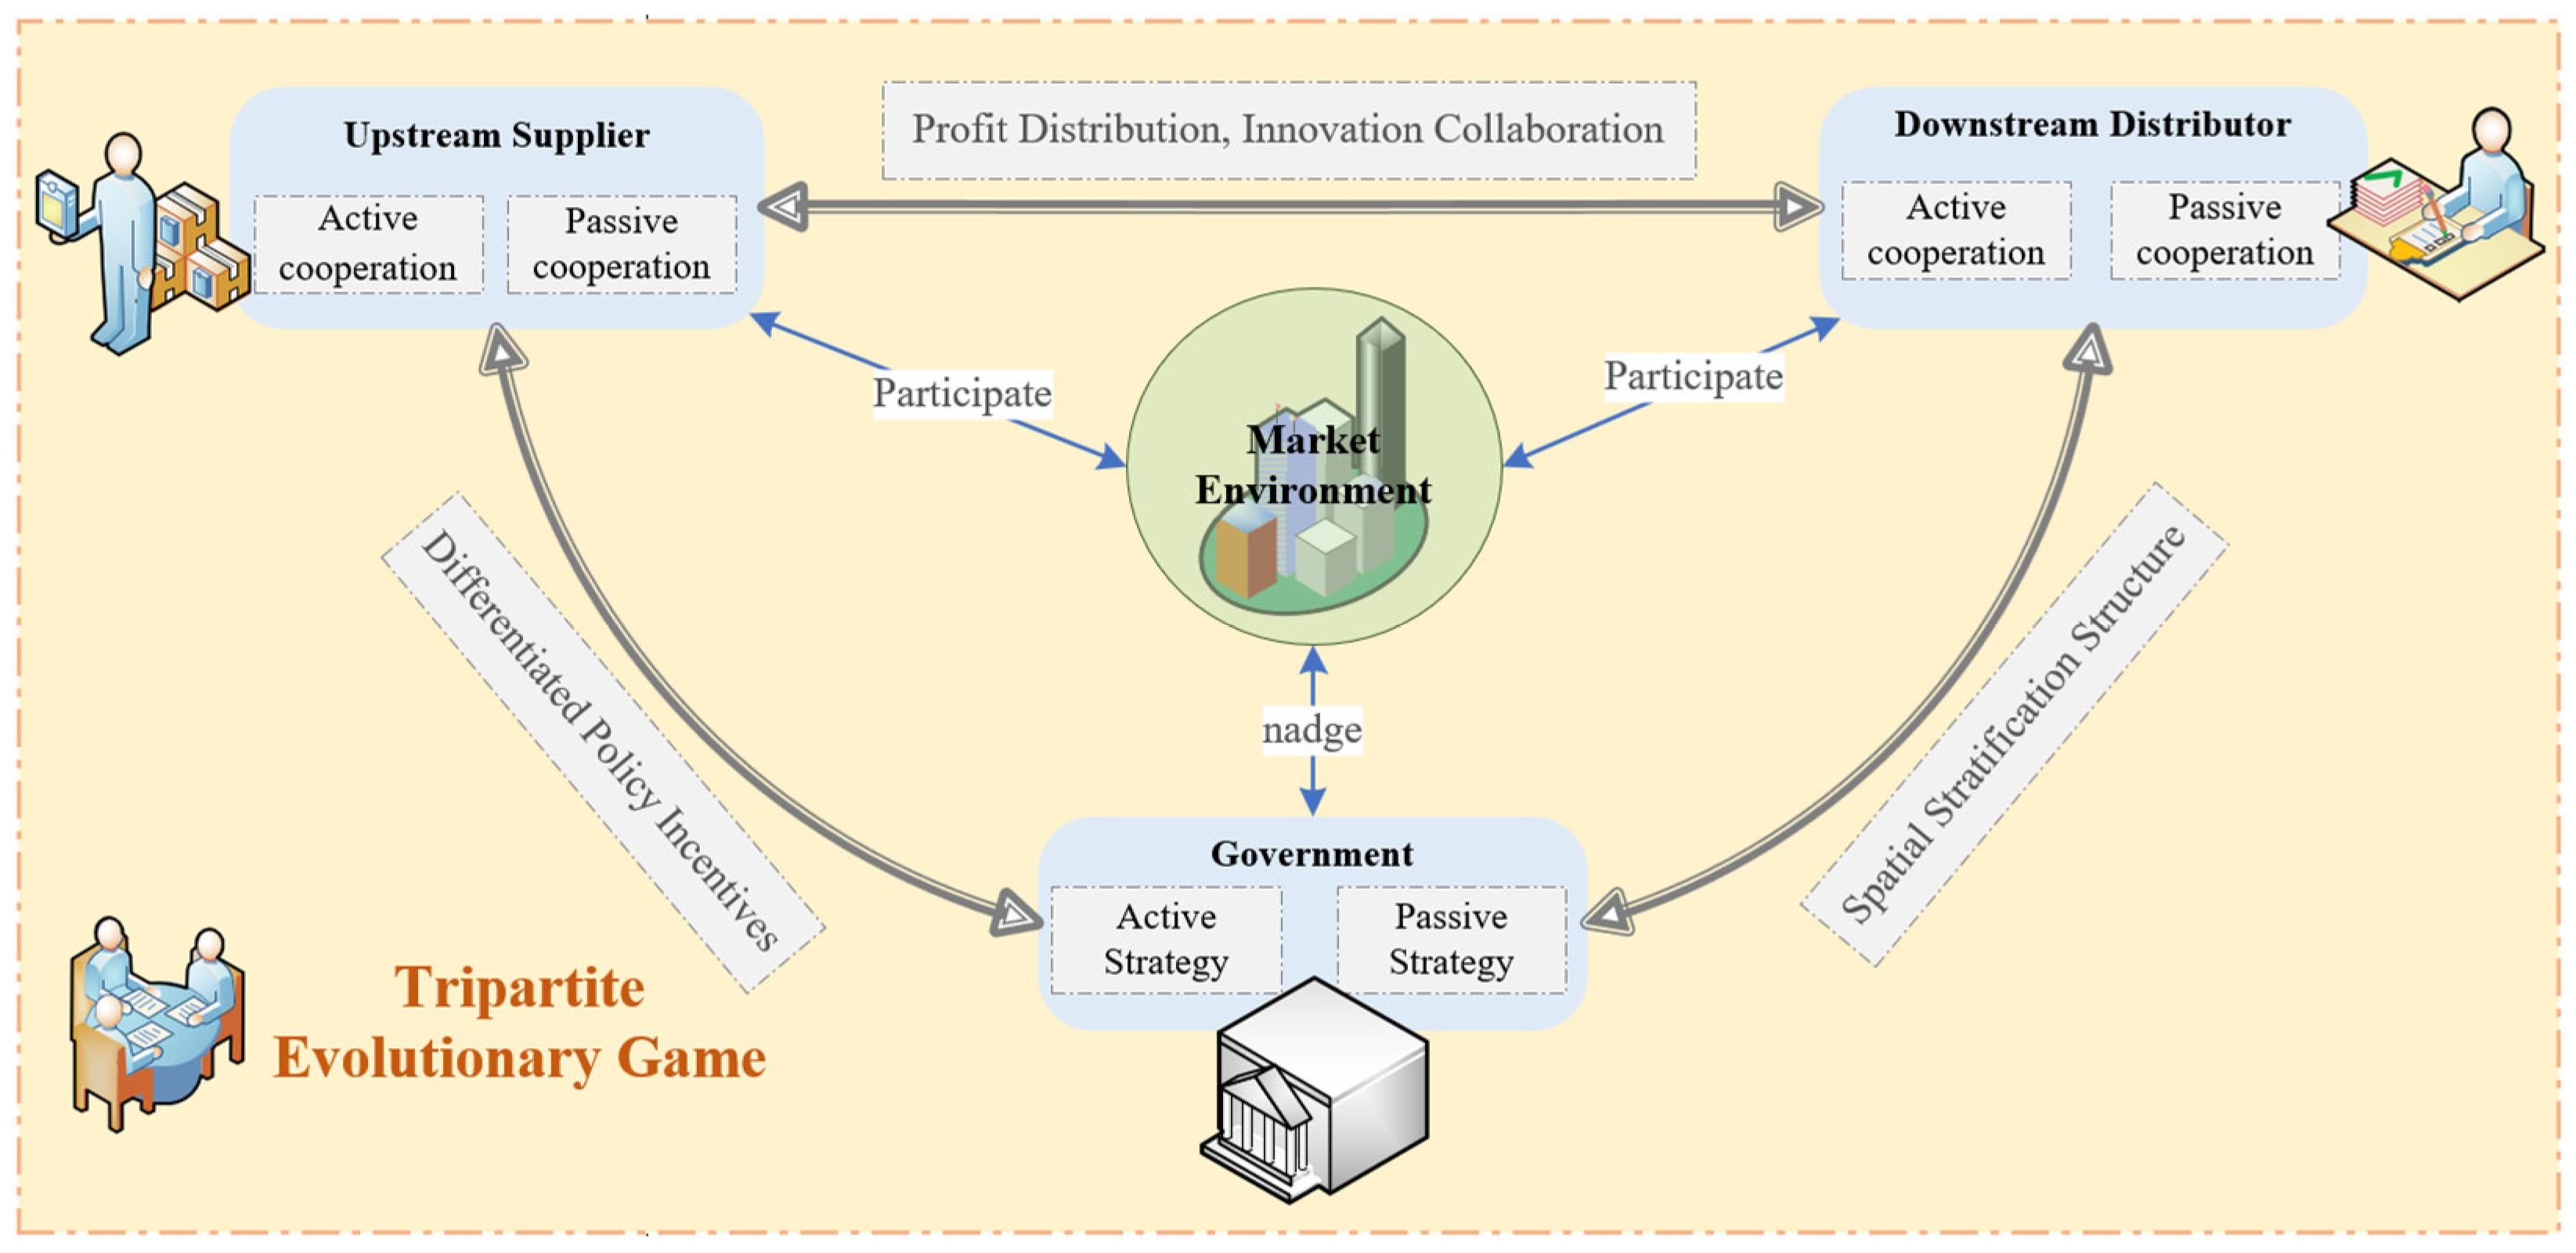
Figure 1. Logical relationship diagram based on tripartite evolutionary game.
Systems 13 01044 g001
Figure 2. Replicator dynamic phase diagrams. (a) y = y * , (b) 0 < y < y , and (c) y < y < 1 .
Systems 13 01044 g002
Figure 3. Replicator dynamic phase diagrams of downstream enterprise. (a) z = z , (b) 0 < z < z , (c) z < z < 1 .
Systems 13 01044 g003
Figure 4. Replicator dynamic phase diagrams of government. (a) x = x , (b) 0 < x < x , (c) x < x < 1 .
Systems 13 01044 g004
Figure 5. Phase diagram of system evolution in case 1. The solid arrows indicate the stable evolutionary paths towards the evolutionarily stable strategies (ESS), while the dashed arrows represent the critical separatrices (saddle paths) that divide the basins of attraction for different stable states. The different colors of the trajectories are for visual dis-tinction only.
Systems 13 01044 g005
Figure 6. Phase diagram of system evolution in case 2. The solid arrows indicate the stable evolutionary paths towards the evolutionarily stable strategies (ESS), while the dashed arrows represent the critical separatrices (saddle paths) that divide the basins of attraction for different stable states. The different colors of the trajectories are for visual distinction only.
Systems 13 01044 g006
Figure 7. Phase diagram of system evolution in case 3. The solid arrows indicate the stable evolutionary paths towards the evolutionarily stable strategies (ESS), while the dashed arrows represent the critical separatrices (saddle paths) that divide the basins of attraction for different stable states. The different colors of the trajectories are for visual dis-tinction only.
Systems 13 01044 g007
Figure 8. The effect of benefit conversion coefficient on system evolution. (a) x, (b) y, and (c) z.
Systems 13 01044 g008
Figure 9. The effect of the information sharing coefficient on system evolution. (a) x, (b) y, and (c) z.
Systems 13 01044 g009
Figure 10. The effect of Mutual Trust Level on system evolution. (a) x, (b) y, and (c) z.
Systems 13 01044 g010
Figure 11. The effect of the fiscal subsidy coefficient on system evolution. (a) x, (b) y, and (c) z.
Systems 13 01044 g011
Table 1. Game payment matrix of construction unit, project management, and government.
Game ParticipantGovernment
Active Strategy (z)Passive Strategy (1 − z)
Innovation Investment (x)Collaborative Innovation (y) E 1 + α 1 β 2 v 2 + γ ε v 1 1 2 k 1 v 1 2 η L 1 + μ G
E 1 + α 1 β 2 v 2 + γ ε v 1 1 2 k 1 v 1 2 + ξ F η L 1
E 3 + S + B 3 μ G ξ F C 3 K
E 2 + α 2 β 1 v 1 + γ ε v 2 1 2 k 2 v 2 2 η L 2 + μ G
E 2 + α 2 β 1 v 1 + γ ε v 2 1 2 k 2 v 2 2 + ξ F η L 2
E 3 + S μ G ξ F K
No Collaborative Innovation (1 − y) E 1 + P + μ G 1 2 k 1 v 1 2 η L 1 C 1
E 2 + A 2 P λ T
R 3 + N 3 + ω H ρ G C 3 F
E 2 + P + μ G 1 2 k 2 v 2 2 η L 2 C 2
E 2 + A 2 P
R 3 ρ G F
No Innovation Investment
(1 − x)
Collaborative Innovation (y) E 1 + A 1 P ρ M
E 1 + P + ξ F 1 2 k 1 v 1 2 η L 1 C 1
E 3 + B 3 + ρ M ξ F 1 C 3 K
E 1 + A 1 P
E 2 + P + ξ F 1 2 k 2 v 2 2 η L 2 C 2
E 3 ξ F 1 K
No Collaborative Innovation (1 − y) E 1 ρ M
E 2 λ T
E 3 + B 3 + ρ M + λ T C 3 K
E 1
E 2
E 3 K
Table 2. Eigenvalues of Jacobi matrix of equilibrium points of each system.
Equilibrium Pointλ1λ2λ3
E1(0, 0, 0) μ G + P C 1 η L 1 1 2 k 1 v 1 2 ξ F + P C 1 η L 1 1 2 k 1 v 1 2 ρ M + λ T + B 3 C 3
E2(0, 0, 1) μ G + P C 1 + η L 1 η L 1 1 2 k 1 v 1 2 ξ F + P C 1 η L 1 1 2 k 1 v 1 2 + λ T ( ρ M + λ T + B 3 C 3 )
E3(0, 1, 0) α 1 β 2 v 2 + γ ε v 1 + μ G + P B 1 η L 1 1 2 k 1 v 1 2 ( ξ F + P C 2 η L 2 1 2 k 2 v 2 2 ) ρ M + B 3 C 3
E4(0, 1, 1) α 1 β 2 v 2 + γ ε v 1 + ρ M + P A 1 η L 1 1 2 k 1 v 1 2 ( ξ F + P C 2 η L 2 1 2 k 2 v 2 2 + λ T ) ( ρ M + B 3 C 3 )
E5(1, 0, 0) ( μ G + P C 1 η L 1 1 2 k 1 v 1 2 ) α 2 β 1 v 1 + γ ε v 2 + ξ F + P A 2 η L 2 1 2 k 2 v 2 2 λ T + B 3 C 3
E6(1, 0, 1) ( μ G + P + ρ M C 1 η L 1 1 2 k 1 v 1 2 ) α 2 β 1 v 1 + γ ε v 2 + ξ F + P A 2 η L 2 1 2 k 2 v 2 2 + λ T ( λ T + B 3 C 3 )
E7(1, 1, 0) ( α 1 β 2 v 2 + γ ε v 1 + μ G + P A 1 σ M 1 1 2 k 1 v 1 2 ) ( α 2 β 1 v 1 + γ ε v 2 + ξ F + P A 2 η L 2 1 2 k 2 v 2 2 ) B 3 C 3
E8(1, 1, 1) ( α 1 β 2 v 2 + γ ε v 1 + ρ M + μ G + P A 1 η L 1 1 2 k 1 v 1 2 ) ( α 2 β 1 v 1 + γ ε v 2 + ξ F + P A 2 η L 2 1 2 k 2 v 2 2 + λ T ) ( B 3 C 3 )
Table 3. Local stability analysis results of equilibrium points.
Equilibrium PointSituation 1Situation 2Situation 3
λ1λ2λ3Stabilityλ1λ2λ3Stabilityλ1λ2λ3Stability
E1(0, 0, 0)ESS+++instability+saddle point
E2(0, 0, 1)±±+saddle point++saddle pointESS
E3(0, 1, 0)++saddle point++saddle point+++instability
E4(0, 1, 1)+±+saddle point+saddle point++saddle point
E5(1, 0, 0)++saddle point++saddle point+++instability
E6(1, 0, 1)±++saddle point+saddle point++saddle point
E7(1, 1, 0)ESS+saddle point+saddle point
E8(1, 1, 1)+saddle pointESSESS
Note: “+” denotes a positive eigenvalue, “−” denotes a negative eigenvalue, and “±” indicates the sign of the eigenvalue is indeterminate. The stability is judged by Lyapunov’s indirect method: an equilibrium point is deemed an Evolutionarily Stable Stratgy if all eigenvalues are negative.
Disclaimer/Publisher’s Note: The statements, opinions and data contained in all publications are solely those of the individual author(s) and contributor(s) and not of MDPI and/or the editor(s). MDPI and/or the editor(s) disclaim responsibility for any injury to people or property resulting from any ideas, methods, instructions or products referred to in the content.