Abstract
Recent investigations on the relationship between economic performance and COVID-19 mortality showed positive and negative associations of those variables on a national level. We propose a model that is composed of two branches to explain this contradiction: In this model, (1) higher GDP causes higher healthcare capabilities and lower COVID-19 mortality, and (2) higher GDP is associated with older populations which causes higher COVID-19 mortality. Accordingly, we speculate that (1) national economic performance (modelled through GDP) simultaneously acts as an attenuator (branch 1) and amplifier (branch 2) of COVID-19 mortality and that (2) the interaction between branches explains contradictory observations. To investigate our assumptions, we carried out partial correlation analyses for 79 countries. Results showed that in countries with below average healthcare capabilities (these are low GDP countries), age was a significantly stronger predictor of mortality than in countries with above average healthcare capabilities. By contrast, in countries with above average population age (these are high GDP countries), healthcare capabilities were significantly stronger predictors of mortality than in countries having below average population age. As a result, the attenuating effect of branch 1 dominated in high GDP countries, whereas the amplifying effect of branch 2 dominated in low GDP countries which explains contradictory outcomes of other studies.
1. Introduction
According to WHO [1], more than 7 million COVID-19 deaths were reported worldwide by September, 2025. Profound estimates on all-cause excess mortality even suggest that between 16 [2] and 18 million [3] people died worldwide during the COVID-19 pandemic. Interestingly, the spatial distribution of COVID-19 mortality did not correspond to the global population distribution. Within Europe the age-standardized death rates ranged from 1.8 per 10,000 population in Sweden to 24.7 in Bulgaria [4]. On a global scale, Wang [3] estimated excess death ranging from deficit mortality (e.g., fewer deaths than expected were reported during the first two years of the pandemic in Australia or New Zealand) to 734.9 deaths per 100,000 of the population in Bolivia. Other studies suggested national excess mortality estimates in ranges from negative to 437 deaths per 100,000 [5] and negative to 97% surplus in deaths [6] over the first two years of the pandemic.
Given these large differences in mortality, it is crucial to explain what has caused such a heterogeneous pattern. Among the large number of predictors that have been investigated with the aim to explain variability in COVID-19 mortality, governmental response stringency [4] or population density (e.g., [7,8]) showed only short-term or inconsistent effects, whereas predictors such as population age [9], temperature, UV-radiation [10] or vaccination rates [11] proved to be significant.
Moreover, numerous studies used socio-economic indicators such as the Gini Index of income inequality [4], percent of the population living in poverty [12], trust in the national government or gross domestic product (GDP) [13] as predictors of COVID-19 mortality. Those indicators tend to have indirect effects on mortality, i.e., the effect of such a predictor is mediated by at least one additional variable. As causality often remains unclear, the outcomes of such studies tend to be contradictory.
For instance, according to Chang [14] higher GDP was associated with higher mortality rates of COVID-19. In line with this research, Zinsou [15] concluded that COVID-19 was the first infectious disease for which a fatal outcome was more frequent in the most affluent populations. Similar conclusions were presented by Oshakbayev [16] or Cash [17] who speculated that COVID-19 had reverted global health as the world’s richest countries were hit harder than poor countries. In stark contrast to these studies, Pizzato [4] as well as Ioannidis [12] observed an inverse relationship between GDP per capita and excess death rate.
In this study, we aim to reconcile these conflicting findings by integrating variables into our analyses that mediate the relationship between economic performance (modelled through GDP) and COVID-19 mortality. Potential mediator variables are social contact frequencies, healthcare capabilities, population age or the prevalence of non-communicable diseases such as diabetes or obesity.
For instance, despite a mixed association between wealth and fertility [18], in advanced economies the share of the elderly population is on the increase [19]. Older populations were in turn hit more heavily by the pandemic [20]. The significance of population age as the most relevant predictor of COVID-19 mortality was underlined through a large-scale meta-analysis conducted by Sorensen [9] based on more than 3000 seroprevalence surveys. This study concluded that population age structure accounted for 74% of the variation in COVID-19 infection fatality rate. Given these relationships, it is speculated that a country’s economic strength increased COVID-19 mortality indirectly through the mediating variable of population age.
Population age itself has a strong positive correlation with the prevalence of non-communicable chronic diseases such as obesity, diabetes, hypertension or chronic respiratory illnesses [21]. Consequently, population age acts as a proxy variable accounting for effects of age-dependent chronic diseases. Hence, we assumed that effects of chronic disease prevalence are inherent to the mediator variable population age and thus did not explicitly consider the prevalence of non-communicable chronic diseases as a mediator variable in our models.
National healthcare capabilities may act as another mediator. Higher economic performance is associated with better healthcare and a lower COVID-19 death toll. This particularly pertains to the COVID-19 vaccination. According to Basak [22] GDP per capita accounted for 50% of the variation in the vaccination rate on a national level and vaccination proved to significantly reduce COVID-19 severity and mortality [11]. Similarly, well-funded healthcare systems and broad health coverage served to reduce mortality during the pandemic [23].
Other mechanisms that potentially have mediating effects on the researched relationship between economic performance and COVID-19 mortality pertain to people’s cultural or social behavior. For instance, studies in the US showed that high income was associated with less social contacts [24], fewer social contacts in turn reduced the transmission and the severity of the epidemic. Apart from available income, during the pandemic social contact frequencies were affected by governmental interventions or through individual’s response to news from public sources about the spread of the disease [25]. The enforceability of governmental interventions may have in turn been restricted through the level of collective compliance [26]. In addition, precautionary measures such as wearing a mask or maintaining a distance were likely confounding effects [27] that potentially resulted in a decoupling of social contact frequency from transmission [28]. Many of these mechanisms are still poorly understood. Beyond that, empirical investigations are constrained by the limited availability of large-scale social contact surveys.
Based on these considerations, we include the mediator variables of population age and healthcare capabilities into a generic model of the economy-mortality nexus (Figure 1). In this realization, economic performance has no immediate causal effect on mortality. It, however, indirectly acts through population age as amplifier (age branch) or through healthcare capabilities as attenuator of COVID-19 mortality (healthcare branch).
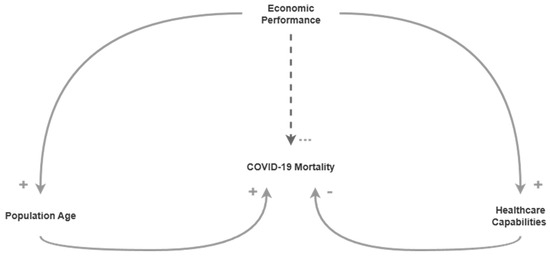
Figure 1.
Generic model of the economy-mortality nexus. Arrows represent positive ‘+’ and negative ‘-’ relations. The dashed arrow from Economic Performance to COVID-19 Mortality indicates a relation of undefined polarity and without direct causation.
It is speculated that depending on what branch is stronger, more economic performance will cause more mortality or less mortality. The opposite polarity of mediator variables population age and healthcare capabilities on mortality tends to unravel the correlation between economic performance and mortality given that effects of both branches are equally strong.
In addition, mediator variables may be mutually dependent, i.e., it is likely that the effect of population age on mortality is affected by healthcare capabilities, in the same way as the effect of healthcare capabilities is likely to be a function of population age. In addition to linear effects, mediator variables may involve interactions, i.e., effects of population age on mortality may depend on the level of healthcare capabilities and effects of healthcare capabilities on mortality may depend on the level of population age.
It is assumed that effects of age and healthcare branches are not equally strong, provided such interactions do exist. While the healthcare branch may be more dominant in one country, the age branch may play a stronger role in another. This potentially explains the observed discrepancies in associations between economic performance and mortality on a national scale.
To investigate our assumptions, we carry out bivariate correlation analyses on relationships depicted in Figure 1 and conduct partial correlations, median-split conditional correlations and Ordinary Least Squares (OLS) moderation analyses with the aim of investigating main effects and interactions of mediator variables.
2. Materials and Methods
To underpin the relationships represented by the economy-mortality nexus in Figure 1, we examined bivariate Pearson and Spearman coefficients of correlations between economic performance and population age, population age and mortality, economic performance and healthcare capabilities, and healthcare capabilities and mortality.
To investigate the unbiased main effects of population age and healthcare capabilities on mortality we used partial correlation as described by Kim [29] as a method where the control variable C is treated as a continuous variable to isolate the relationship between variables A and B. We implemented two partial correlation models of this type: (1) Population age was controlled to examine main effects of healthcare capabilities on mortality, (2) healthcare capabilities were controlled to examine main effects of age on mortality.
Moreover, we split variable C by its median to inspect interaction effects of C on the relationship between variables A and B. We implemented two median-split correlation models of this type: (1) Variable population age was split into countries above and below median population age to examine effects on the relationship between healthcare and mortality. (2) Variable healthcare capability was split into groups of countries above and below median healthcare capability to examine effects on the relationship between population age and mortality.
To test significant differences of independent Pearson and Spearman correlations of groups above and below median values, we used Fisher’s z transformation [30]. As sample sizes of respective groups were small (~40), we in addition carried out a non-parametric test after Zou [31]. This test calculates confidence intervals for the difference of independent correlation coefficients using bootstrapping. The null hypothesis was rejected in case the confidence interval did not include zero, i.e., the null hypothesis was rejected given that a zero difference of coefficients was not included in the 95% confidence interval.
To support the results of the median-split conditional models, we additionally conducted an OLS moderation analysis of the form
where the term describes interactions between healthcare capabilities and population age . All variables were z-standardized prior to the regression analysis.
In our models, economic performance was represented by records on inflation- and living-cost-adjusted GDP per capita in 2022. These data were obtained from World Bank. Population age was represented by median population age in 2022 sourced from the UN’s World Population Prospects. To more explicitly account for age distribution, we alternatively represented population age using the percentage of individuals aged 65 and older in 2022, based on data from the World Bank.
Healthcare capabilities were represented by the UHC service coverage index in 2021, which is a WHO health indicator that measures the coverage of a country’s essential health services on a scale of 0 to 100 (where higher is better).
Moreover, the cumulative number of vaccination doses administered per 100 people (sourced from Our World in Data) until the end of the PHEIC (Public Health Emergence of International Concern) on 5 May 2023 (according to WHO) was considered as a second variable to represent healthcare capabilities by country. If vaccination data were unavailable for 5 May 2023, we used the closest available data point (Figure A1). The same procedure was suggested by WHO and Our World in Data.
Among the system variables considered in our model, mortality was the hardest variable to capture. Whereas records on confirmed COVID-19 deaths were unreliable due to inconsistent reporting and testing [32], data on excess mortality did not include COVID-19 deaths alone but relied on all-cause mortality. For instance, diminished air pollution during large-scale quarantine may have reduced excess mortality [33]. Similarly, social restrictions may have led to falls in deaths from causes such as injury and poisoning [32]. Those effects are likely to negatively affect the accuracy of excess deaths as a proxy for COVID-19 mortality. Despite those limitations, excess mortality was considered a more reliable and comparable measure of the pandemic’s total death toll than records on counted COVID-19 deaths [34]. Accordingly, we used the cumulative excess mortality per million between 1 January 2020 and 5 May 2023 (end of the PHEIC) to represent COVID-19 mortality. This data was obtained from WHO.
Due to the inconsistent temporal resolution of national time series, a general form cubic spline regression as suggested by Wood [35] was used to estimate cumulative excess mortality on 5 May 2023 based on available records. We quantified the uncertainty of this estimate as the 95% confidence interval (CI) width divided by the mean of the absolute values of all country estimates, providing a scale-invariant precision metric robust to negative or near-zero estimates. Accordingly, relative CI width can be interpreted as a country’s uncertainty range relative to the typical magnitude of excess mortality across all countries. Calculated relative CI widths indicated high confidence in the spline-modelled excess mortality estimates (Figure A2). Among all countries, Armenia showed the highest relative CI width (10.74%), i.e., the 95% CI width () was about a tenth of the typical effect size. Due to substantial uncertainties, we did not use excess mortality estimates modelled by The Economist as inputs to the cubic spline regression. Instead, we included only countries with complete and consistent records in our model.
Complete records for the six variables excess mortality, vaccination (Vacc.), median age, percentage aged 65 and older, service coverage index (UHC) and GDP per capita could be acquired for 79 countries (Figure 2). Most of those countries were located within Europe (37) and Asia (21). Only 6 African and 13 American countries as well as Australia and New Zealand had suitable data. Many of those countries were characterized by high GDP (Q2 = 33149 US$), high performance healthcare systems (UHC Q2 = 79) and old populations (Q2 = 37.72). This likely had implications for the results, which we will revisit later in the article.
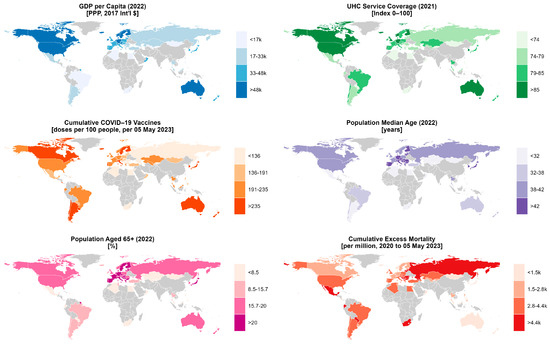
Figure 2.
Variables used to model economic performance (GDP per capita in 2022), population age (Median Age and Population Aged 65+ per 2022), healthcare capabilities (UHC Service Coverage in 2021 and Cumulative COVID-19 Vaccines) and COVID-19 mortality (Cumulative excess mortality). Complete data for all six variables were available for 79 countries. Gray areas indicate countries with incomplete data excluded from the analysis.
3. Results
This section was divided into three subsections that contain the results of the major methodological steps described in Section 2. Accordingly, subsections contain (1) bivariate correlations of the economy-mortality nexus in Figure 1 as well as (2) main effects of mediator variables Vacc., UHC and age on mortality as results of partial correlations and (3) interaction effects as results of the median-split conditional correlations and OLS moderation analyses.
Analyses were conducted using two different age specifications: (1) median population age and (2) the percentage of the population aged 65 and older. The outcomes from both specifications showed only minor differences. Therefore, the remainder of this article primarily focuses on the results obtained using the first specification (median age). Unless otherwise stated, any reference to ‘age’ refers to median population age. Key findings from the second specification (percentage aged 65 and older) are explicitly noted where relevant. The complete analysis and all results are publicly available in a GitHub repository.
3.1. Economy-Mortality Nexus
Figure 3 shows weak to moderate correlations for relationships specified by the economy-mortality nexus (Figure 1). Imperfect correlations of mediator variables age, Vacc. and UHC on mortality may be due to the system’s inherent interdependence. For instance, high population age directly increased mortality and at the same time acted as an attenuator of mortality through mediators GDP, Vacc. and UHC. Similarly, high values in UHC and Vacc. decreased mortality and simultaneously amplified mortality through mediators GDP and age.
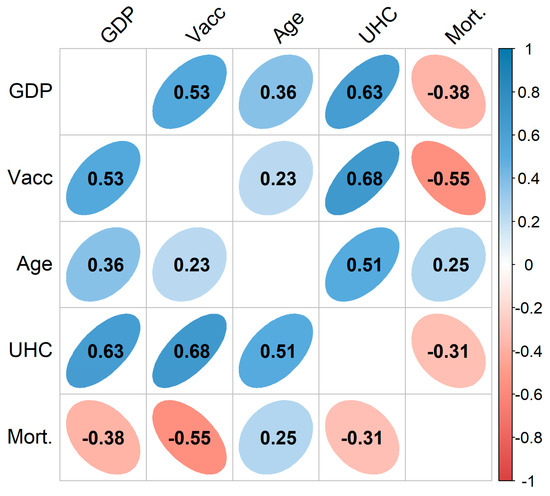
Figure 3.
Pearson correlation matrix (n = 79 countries) with variables GDP per capita, cumulative number of vaccination doses (Vacc.), median population age, healthcare service coverage (UHC) and cumulative COVID-19 excess mortality (Mort.). Coefficients are significant with p ≤ 0.05.
Moreover, modeling the relationship between GDP and age as unidirectional neglects the inherent delays and feedback mechanisms in this dynamic system. Increases in GDP per capita tend to reduce fertility rates, thereby initiating a demographic transition toward older population structures over the long term. This shift can in turn promote economic growth by increasing the proportion of the working-age population relative to dependent children [36]. However, this advantage is eventually reversed as the population continues to age, leading to a rise in old-age dependency and imposing a growing economic burden [37].
Despite the simplifications in our model, the direction of the correlation coefficients aligned with the assumptions underlying the economy-mortality nexus: GDP was positively related to age and healthcare variables (Vacc. and UHC). Healthcare variables were negatively related to mortality, and age had a positive correlation with mortality.
Interestingly, GDP was inversely correlated with excess mortality which corresponds to study outcomes of Pizzato [4] and Ioannidis [12].
Spearman rank correlations were in line with those results and were thus not presented separately.
3.2. Main Effects of Mediator Variables
Removing the linear influence of the control variable in a partial correlation revealed main effects with-compared to bivariate correlations-increased correlation coefficients; the polarity of correlations remained unchanged.
Controlling for age in a partial correlation increased correlation coefficients of Vacc. on mortality (no age control: r = −0.55, p < 0.001, age control: r = −0.644, p < 0.001) and UHC on mortality (no age control: r = −0.314, p < 0.01, age control: r = −0.530, p < 0.001). Similarly, controlling for healthcare variables (UHC and Vacc.) improved the explanatory power of population age on mortality (no control: r = 0.249, p < 0.05; UHC control: r = 0.502, p < 0.001, Vacc. control: r = 0.461, p < 0.001).
This outcome confirmed the assumption that the effects of mediator variables are mutually dependent. More specifically, the effect of mediator variables (Vacc., UHC and age) on mortality was suppressed and mediator variables acted as suppressors themselves. As a result, main effects of mediators were stronger than in biased bivariate correlations.
Together with the above-mentioned bivariate correlations, the initially conceptualized balancing mechanism of age and healthcare branches as described by the economy-mortality nexus (Figure 1) could be confirmed.
3.3. Interaction of Mediator Variables
Table 1 shows that population age was a strong to moderate predictor of COVID-19 mortality among countries with below-average healthcare capabilities (UHC ≤ 79) and a weak predictor among countries having above-average healthcare (UHC > 79). Variables UHC and Vacc. were strong predictors of mortality in above-average age countries (age > 37.72), and weak to moderate predictors in below-average age countries (age ≤ 37.72).

Table 1.
Pearson and Spearman coefficients (r/rho) for correlations of healthcare service coverage (UHC), cumulative number of vaccination doses (Vacc.) and countries’ median population age on cumulative COVID-19 excess mortality. Correlations of UHC and Vacc. on mortality are presented for countries below- and above-average population age and correlations of age on mortality are presented for countries below- and above-average UHC; variable ‘Age’ is specified as the median population age; ** represents statistical significance at p ≤ 0.01.
The second model specification, using the percentage of the population aged 65 and older, revealed the same interaction effects, albeit more pronounced (Table 2).
Table 2.
Pearson and Spearman coefficients (r/rho) for correlations of healthcare service coverage (UHC), cumulative number of vaccination doses (Vacc.) and countries’ median population age on cumulative COVID-19 excess mortality. Correlations of UHC and Vacc. on mortality are presented for countries below and above median population age and correlations of age on mortality are presented for countries below and above median UHC; variable ‘Age’ is specified as the percentage of the population aged 65 and older; ** represents statistical significance at p ≤ 0.01; * represents statistical significance at p ≤ 0.05.
Tests on the significant difference of correlation coefficients confirmed that age variables (median age and percentage of the population aged 65 and older) significantly better predict mortality in countries with below-average healthcare than in countries with above-average healthcare capabilities. Healthcare variables (UHC and Vacc.) proved to be significantly stronger predictors of mortality in countries with above-average population age than in countries with below-average population age. Results were significant at the 5% level in both correlation comparison tests, Fisher’s Z and Zou’s non-parametric test, and for both correlation coefficients, Pearson r and Spearman rho.
These negative interactions between age and healthcare variables were confirmed by the results of the OLS moderation models (Table 3). Specifically, the effect of age on mortality becomes stronger (i.e., more positive) as healthcare capacity decreases, while the effect of healthcare variables on mortality becomes more negative as the population age increases. This means that, in the regression model, a one-unit increase in age is associated with a larger increase in mortality when healthcare capabilities are lower. Conversely, a one-unit improvement in healthcare capabilities leads to a greater reduction in mortality when the population is older.
Table 3.
Highly significant negative interaction effects between age and healthcare variables as outcomes of the OLS moderation analysis.
These outcomes imply that the amplifying and attenuating effects of age and healthcare branches prevail depending on local healthcare conditions and population age. In the discussion, we will further elaborate on the implications associated with this interaction effect.
4. Discussion
Our results supported the assumption that higher GDP was associated with higher population age and more performant healthcare systems (represented by variables Vacc. and UHC). Higher population age and more performant healthcare systems were in turn associated with higher and lower COVID-19 mortality, respectively. Accordingly, a country’s economic performance (expressed in our model through GDP) simultaneously attenuates COVID-19 mortality through better healthcare (healthcare branch) and amplifies mortality through older populations (age branch).
Given that these two effects cancel out each other, economic performance should have little effect on mortality. The correlation GDP per capita with COVID-19 excess mortality, however, was highly significant and negative (r = −0.38, p < 0.001, see first column, last row in Figure 3). Accordingly, the attenuating healthcare branch was found to be more dominant than the amplifying age branch when considering the entire sample of 79 countries.
Interaction effects observed in median-split conditional correlations revealed that healthcare variables had significantly stronger negative correlations on mortality in old-population countries than in young-population countries. Moreover, the age of a country’s population was a significantly stronger predictor of mortality in countries with below-average healthcare capabilities as compared to countries with above-average healthcare (see Table 1 and Table 2, first row). In other words, healthcare services were more effective in curbing mortality in old-population countries, whereas higher population age increased mortality more strongly in poor-healthcare countries.
Given that high GDP countries tend to have old populations, higher GDP reduces mortality in those countries, i.e., the attenuating healthcare branch is more dominant. Conversely, as low GDP countries tend to have poor healthcare capabilities, higher GDP increases mortality in such countries, i.e., the amplifying age branch dominates.
Correlations in Table 4 underpin this conclusion. Whereas countries above GDP thresholds showed significant negative correlations, countries below those thresholds showed weak to moderate positive correlations of GDP and excess mortality.
Table 4.
Pearson correlations and sample size (r/n) of GDP per capita with cumulative excess mortality for groups of countries above and below GDP thresholds. The GDP threshold of 33,000$ corresponds to the median of 79 countries considered in this study. ** represents statistical significance at p ≤ 0.01; * represents statistical significance at p ≤ 0.05.
As countries considered in this study tend to have high GDP (Q2 global: 15,700 US$, Q2 of studied countries: 33,149 US$), the correlation between GDP and mortality was negative (r = −0.38, p < 0.001) when analyses were carried out for the entire sample of 79 countries. It is, therefore, not surprising that Ioannidis [12] also found a negative correlation between GDP per capita and excess death for a selection of 34 wealthy countries with older population (Europe, USA, Australia, Canada, Chile, South Korea and New Zealand). Similarly, Pizzato [4] observed an inverse association between GDP per capita and excess mortality for wealthy European countries, while Zinsou [15] found a positive correlation between economic status and COVID-19 mortality for sub-Saharan African countries with poor healthcare capabilities and underdeveloped economy.
The latter study even reported an increase in mortality associated with higher per capita health expenditure, which implicitly throws doubt on the effectiveness of medical treatment in the case of COVID-19. Our own investigations did not confirm such conclusions. Although studied healthcare variables did show less pronounced effects on mortality reduction in young-population countries, correlation coefficients between healthcare variables and mortality were positive regardless of age grouping. In addition, partial correlations showed significantly stronger correlations when controlling for age. Accordingly, neglecting population age in a study on healthcare efficiency may contribute to underrate the role of healthcare inputs during the COVID-19 pandemic, which effectively gives rise to erroneous conclusions and misguided policy design.
5. Conclusions
In this article, we used correlation analysis with control variables to examine the complex interplay between countries’ economic performance (represented by GDP per capita) healthcare capabilities (measured by the UHC service coverage index and the cumulative number of vaccination doses), and population age as predictors of national COVID-19 mortality. The investigation of those relations revealed two balancing forces: (1) High GDP was associated with old populations and high mortality (age branch), and (2) high GDP was associated with high healthcare capabilities and low mortality (healthcare branch). While in the age branch-through mediator variable population age-economic performance (GDP) acts to amplify mortality, in the healthcare branch-through mediating effects of healthcare variables-economic performance (GDP) acts to attenuate mortality.
Controlling one branch in a partial correlation improves the predictive power of the other branch, i.e., the effect of age on mortality was suppressed by variables representing healthcare capabilities and effects of healthcare variables on mortality were suppressed by variable ‘population age’. Among all partial correlation results, the healthcare variable cumulative number of vaccination doses showed the strongest effect on excess mortality when controlling for variable median population age (r = −0.645, p < 0.001).
In addition, the interactions were investigated by means of median-split conditional correlations. Among all median-split correlations, highest explanatory strength was observed for the correlation between cumulative vaccination doses and mortality (rho = −0.842; p < 0.001, see Table 2, last column) in countries with an above-average proportion of the population aged 65 and older.
Population age showed significantly stronger effects on COVID-19 mortality in countries with below-average healthcare capabilities, whereas correlations of healthcare variables on mortality proved to be significantly stronger in countries with above-average population age.
Accordingly, since countries with higher GDPs tend to have older populations, we observed a stronger influence of the healthcare branch in these contexts—specifically, higher GDP was associated with lower COVID-19 mortality. In contrast, in countries with lower levels of economic development and less established healthcare systems, the age branch had a stronger effect. In these cases, higher GDP was associated with higher COVID-19 mortality.
The key contribution of our study was the explanation of contradictions in study results that showed higher COVID-19 mortality with higher economic status [15] and lower COVID-19 mortality with higher economic status [12]. Two interaction effects explained that contradiction (1) the efficiency gains of healthcare inputs in countries with older populations, and (2) the increasingly age-driven COVID-19 mortality in countries with poor healthcare conditions.
In economically underdeveloped regions, the latter effect could be significantly stronger than observed in our sample of 79 predominantly advanced economies. To extend this investigation, reliable data sources on cumulative COVID-19 excess mortality for less developed countries are needed.
Author Contributions
Conceptualization, writing—original draft preparation, writing—review, editing and supervision, C.N.; methodology, validation, formal analysis and data curation C.N., M.E.; visualization, M.E. All authors have read and agreed to the published version of the manuscript.
Funding
This research received no external funding.
Data Availability Statement
Data used and created in this study, along with the R code used for the analyses, are available at https://github.com/simsynser/economy-mortality-nexus, accessed on 26 September 2025.
Acknowledgments
We have received Open Access Funding by the University of Salzburg.
Conflicts of Interest
The authors declare no conflict of interest.
Appendix A

Figure A1.
Cumulative number of COVID-19 vaccine doses administered across 79 countries included in this study. The dashed line indicates the end of the Public Health Emergency of International Concern (PHEIC) on 5 May 2023.

Figure A2.
Relative width of the 95% confidence interval (CI) for estimated cumulative excess mortality, 1 January 2020–5 May 2023. Relative CI width is calculated as and are the upper and lower bound of the confidence interval in country , and abs is the absolute mean of all 79 country estimates.
References
- World Health Organization. WHO Coronavirus (COVID-19) Dashboard. 2025. Available online: https://data.who.int/dashboards/covid19/more-resources (accessed on 26 September 2025).
- GBD 2021 Demographics Collaborators. Global age-sex-specific mortality, life expectancy, and population estimates in 204 countries and territories and 811 subnational locations, 1950–2021, and the impact of the COVID-19 pandemic: A comprehensive demographic analysis for the Global Burden of Disease Study 2021. Lancet 2024, 403, 1989–2056. [Google Scholar]
- Wang, H.; Paulson, K.R.; Pease, S.A.; Watson, S.; Comfort, H.; Zheng, P.; Aravkin, A.Y.; Bisignano, C.; Barber, R.M.; Alam, T.; et al. Estimating excess mortality due to the COVID-19 pandemic: A systematic analysis of COVID-19-related mortality, 2020–2021. Lancet 2022, 399, 1513–1536. [Google Scholar] [CrossRef]
- Pizzato, M.; Gerli, A.G.; La Vecchia, C.; Alicandro, G. Impact of COVID-19 on total excess mortality and geographic disparities in Europe, 2020–2023: A spatio-temporal analysis. Lancet Reg. Health–Eur. 2024, 44, 100996. [Google Scholar] [CrossRef]
- Knutson, V.; Aleshin-Guendel, S.; Karlinsky, A.; Msemburi, W.; Wakefield, J. Estimating global and country-specific excess mortality during the COVID-19 pandemic. Ann. Appl. Stat. 2023, 17, 1353–1374. [Google Scholar] [CrossRef]
- Msemburi, W.; Karlinsky, A.; Knutson, V.; Aleshin-Guendel, S.; Chatterji, S.; Wakefield, J. The WHO estimates of excess mortality associated with the COVID-19 pandemic. Nature 2023, 613, 130–137. [Google Scholar] [CrossRef]
- Alidadi, M.; Sharifi, A. Beyond the blame game: Unraveling the complex relationship between density and COVID-19 through a systematic literature review. Cities 2023, 141, 104519. [Google Scholar] [CrossRef]
- Zhang, X.; Sun, Z.; Ashcroft, T.; Dozier, M.; Ostrishko, K.; Krishan, P.; McSwiggan, E.; Keller, M.; Douglas, M. Compact cities and the Covid-19 pandemic: Systematic review of the associations between transmission of Covid-19 or other respiratory viruses and population density or other features of neighbourhood design. Health Place 2022, 76, 102827. [Google Scholar] [CrossRef]
- Sorensen, R.; Barber, R.; Pigott, D.; Carter, A.; Spencer, C.; Ostroff, S.; Reiner, R.; Abbafati, C.; Adolph, C.; Allorant, A.; et al. Variation in the COVID-19 infection-fatality ratio by age, time, and geography during the pre-vaccine era: A systematic analysis. Lancet 2022, 399, 1469–1488. [Google Scholar]
- Chen, S.; Prettner, K.; Kuhn, M.; Geldsetzer, P.; Wang, C.; Bärnighausen, T.; Bloom, D.E. Climate and the spread of COVID-19. Sci. Rep. 2021, 11, 9042. [Google Scholar] [CrossRef] [PubMed]
- Hoxha, I.; Agahi, R.; Bimbashi, A.; Aliu, M.; Raka, L.; Bajraktari, I.; Beqiri, P.; Adams, L.V. Higher COVID-19 vaccination rates are associated with lower COVID-19 mortality: A global analysis. Vaccines 2022, 11, 74. [Google Scholar] [CrossRef] [PubMed]
- Ioannidis, J.P.; Zonta, F.; Levitt, M. Variability in excess deaths across countries with different vulnerability during 2020–2023. Proc. Natl. Acad. Sci. USA 2023, 120, e2309557120. [Google Scholar] [CrossRef]
- Galmiche, S.; Coustaury, C.; Charniga, K.; Grant, R.; Cauchemez, S.; Fontanet, A. Patterns and drivers of excess mortality during the COVID-19 pandemic in 13 Western European countries. BMC Glob. Public Health 2024, 2, 78. [Google Scholar] [CrossRef]
- Chang, D.; Chang, X.; He, Y.; Tan, K.J.K. The determinants of COVID-19 morbidity and mortality across countries. Sci. Rep. 2022, 12, 5888. [Google Scholar] [CrossRef] [PubMed]
- Zinsou, B.-E.; Letourneur, D.; Siko, J.; de Souza, R.M.; Adjagba, F.; Pineau, P. Main modulators of COVID-19 epidemic in sub-Saharan Africa. Heliyon 2023, 9, e12727. [Google Scholar] [CrossRef] [PubMed]
- Oshakbayev, K.; Zhankalova, Z.; Gazaliyeva, M.; Mustafin, K.; Bedelbayeva, G.; Dukenbayeva, B.; Otarbayev, N.; Tordai, A. Association between COVID-19 morbidity, mortality, and gross domestic product, overweight/obesity, non-communicable diseases, vaccination rate: A cross-sectional study. J. Infect. Public Health 2022, 15, 255. [Google Scholar] [PubMed]
- Cash, R.; Patel, V. Has COVID-19 subverted global health? Lancet 2020, 395, 1687–1688. [Google Scholar] [CrossRef]
- Hackman, J.; Hruschka, D. Disentangling wealth effects on fertility in 64 low-and middle-income countries. Evol. Hum. Sci. 2020, 2, e58. [Google Scholar] [CrossRef]
- Papapetrou, E.; Tsalaporta, P. The impact of population aging in rich countries: What’s the future? J. Policy Model. 2020, 42, 77–95. [Google Scholar] [CrossRef]
- Booth, A.; Reed, A.B.; Ponzo, S.; Yassaee, A.; Aral, M.; Plans, D.; Labrique, A.; Mohan, D. Population risk factors for severe disease and mortality in COVID-19: A global systematic review and meta-analysis. PLoS ONE 2021, 16, e0247461. [Google Scholar]
- Lv, Y.; Fan, L.; Zhou, J.; Ding, E.; Shen, J.; Tang, S.; He, Y.; Shi, X. Burden of non-communicable diseases due to population ageing in China: Challenges to healthcare delivery and long term care services. BMJ 2024, 387, e076529. [Google Scholar] [CrossRef]
- Basak, P.; Abir, T.; Al Mamun, A.; Zainol, N.R.; Khanam, M.; Haque, M.R.; Milton, A.H.; Agho, K.E. A global study on the correlates of gross domestic product (GDP) and COVID-19 vaccine distribution. Vaccines 2022, 10, 266. [Google Scholar] [CrossRef]
- Kapitsinis, N. The underlying factors of excess mortality in 2020: A cross-country analysis of pre-pandemic healthcare conditions and strategies to cope with Covid-19. BMC Health Serv. Res. 2021, 21, 1197. [Google Scholar] [CrossRef] [PubMed]
- Bianchi, E.C.; Vohs, K.D. Social class and social worlds: Income predicts the frequency and nature of social contact. Soc. Psychol. Personal. Sci. 2016, 7, 479–486. [Google Scholar]
- Blendon, R.J.; Benson, J.M.; DesRoches, C.M.; Raleigh, E.; Taylor-Clark, K. The public’s response to severe acute respiratory syndrome in Toronto and the United States. Clin. Infect. Dis. 2004, 38, 925–931. [Google Scholar] [CrossRef]
- Glaubitz, A.; Fu, F. Social dilemma of nonpharmaceutical interventions: Determinants of dynamic compliance and behavioral shifts. Proc. Natl. Acad. Sci. USA 2024, 121, e2407308121. [Google Scholar] [PubMed]
- Gatalo, O.; Tseng, K.; Hamilton, A.; Lin, G.; Klein, E. Associations between phone mobility data and COVID-19 cases. Lancet Infect. Dis. 2021, 21, e111. [Google Scholar] [CrossRef]
- Nouvellet, P.; Bhatia, S.; Cori, A.; Ainslie, K.E.; Baguelin, M.; Bhatt, S.; Boonyasiri, A.; Brazeau, N.F.; Cattarino, L.; Cooper, L.V.; et al. Reduction in mobility and COVID-19 transmission. Nat. Commun. 2021, 12, 1090. [Google Scholar] [CrossRef]
- Kim, S. ppcor: An R package for a fast calculation to semi-partial correlation coefficients. Commun. Stat. Appl. Methods 2015, 22, 665. [Google Scholar] [CrossRef]
- Fisher, R.A. Statistical methods for research workers. In Breakthroughs in Statistics: Methodology and Distribution; Springer: Berlin/Heidelberg, Germany, 1970; pp. 66–70. [Google Scholar]
- Zou, G.Y. Toward using confidence intervals to compare correlations. Psychol. Methods 2007, 12, 399. [Google Scholar] [CrossRef]
- Beaney, T.; Clarke, J.M.; Jain, V.; Golestaneh, A.K.; Lyons, G.; Salman, D.; Majeed, A. Excess mortality: The gold standard in measuring the impact of COVID-19 worldwide? J. R. Soc. Med. 2020, 113, 329–334. [Google Scholar] [CrossRef]
- Chen, K.; Wang, M.; Huang, C.; Kinney, P.L.; Anastas, P.T. Air pollution reduction and mortality benefit during the COVID-19 outbreak in China. Lancet Planet. Health 2020, 4, e210–e212. [Google Scholar] [CrossRef] [PubMed]
- Krelle, H.; Barclay, C.; Tallack, C. Understanding Excess Mortality. What Is the Fairest Way to Compare COVID-19 Deaths Internationally? The Health Foundation: London, UK, 2020; Volume 6, pp. e210–e212. [Google Scholar]
- Wood, S.N. Inference and computation with generalized additive models and their extensions. Test 2020, 29, 307–339. [Google Scholar] [CrossRef]
- Kotschy, R.; Suarez Urtaza, P.; Sunde, U. The demographic dividend is more than an education dividend. Proc. Natl. Acad. Sci. USA 2020, 117, 25982–25984. [Google Scholar] [CrossRef] [PubMed]
- Sagaza, H. Population Aging and Dependency Burden-An International Comparison Among Japan and Other Developed Countries. In Global Competition and Integration; Springer: Berlin/Heidelberg, Germany, 1999; pp. 529–557. [Google Scholar]
Disclaimer/Publisher’s Note: The statements, opinions and data contained in all publications are solely those of the individual author(s) and contributor(s) and not of MDPI and/or the editor(s). MDPI and/or the editor(s) disclaim responsibility for any injury to people or property resulting from any ideas, methods, instructions or products referred to in the content. |
© 2025 by the authors. Licensee MDPI, Basel, Switzerland. This article is an open access article distributed under the terms and conditions of the Creative Commons Attribution (CC BY) license (https://creativecommons.org/licenses/by/4.0/).