1. Introduction
Against the backdrop of increasingly severe global climate change and the widespread acceptance of sustainable development concepts, green transition has become a pressing task for energy enterprises [
1,
2,
3]. At the 2024 United Nations Climate Change Conference (COP29), countries called for a cessation of military actions during the conference, uniting to tackle climate change, and emphasized the acceleration of the energy transition process to ensure the achievement of the net-zero carbon emissions goal by 2050. As major sources of greenhouse gas emissions, traditional energy enterprises, while driving economic growth, pose severe challenges to the ecological environment [
4,
5,
6]. However, current energy enterprises face multiple challenges in their transition, including technological bottlenecks and elongated investment return periods [
7], making the green transition not only a technical issue but also a strategic endeavor [
8,
9,
10]. Therefore, researching the mechanisms of green transition for energy enterprises holds significant theoretical and practical importance for the thorough implementation of sustainable development concepts.
The green transition of energy enterprises has long been a critical area of research for scholars. Current studies on the influencing factors of energy enterprises’ green transitions primarily involve two dimensions. First, there is a focus on the impact of external incentive factors, such as government subsidies, on green transitions [
11,
12,
13]. For instance, Guo et al. [
13], from the perspective of game theory, demonstrate that when government subsidies are controlled within a reasonable range during the energy transition process, energy enterprises can achieve higher profits through transitioning to greener practices. However, such studies primarily center on the one-way transmission mechanism of external incentives, often neglecting the reverse regulatory effects induced by the internal strategies of enterprises. Second, an equally important dimension involves the internal decision-making factors of energy enterprises, such as competitive intensity [
14], executive risk preference [
15], sales value [
16], investment cost [
17], and production cost [
8,
18], and their impact on the green transition of energy enterprises. For example, Sun et al. [
14] find that increasing the competitive intensity among energy enterprises raises production cost, thereby making enterprises more sensitive to technological R&D. Similarly, Duffner et al. [
16] indicate that technological progress can reduce carbon emissions and, therefore, promote the energy transition. However, such studies tend to focus on the internal drivers of enterprises while relatively overlooking the interplay between external incentives and internal strategies. In reality, the green transition of energy enterprises is a complex process, influenced not only by external or internal factors in isolation but by the comprehensive interplay between them. Given this, the present study focuses on the combined effects of internal and external factors and seeks to explore the issue of sales strategy optimization during the green transition of energy enterprises.
In recent years, game theory has been widely applied in the fields of energy and supply chains. For example, theories of cooperative and non-cooperative games have been extensively used in multi-agent energy system modeling to optimize energy management and demand response strategies [
19,
20,
21,
22]. Some studies, based on evolutionary game theory, analyze the strategic evolution of various social parties and firms driven by diverse interests, thus promoting the adoption of renewable energy technologies [
23,
24,
25]. Additionally, some research employs Stackelberg game models to construct multi-agent interaction mechanisms for optimizing collaborative strategies within energy systems, thereby improving energy sharing, cooperative operation, and storage management [
26,
27,
28]. The application of the biform game in energy transitions has been increasingly widespread. This model, which integrates non-cooperative and cooperative games, provides a more comprehensive analytical tool for strategic decision-making and profit-sharing among enterprises [
29,
30]. It has been extensively applied in areas such as recycling and processing [
31,
32], supply chain management [
33,
34], networked activities [
35,
36], and energy transitions [
33,
37]. Despite the ongoing advancement of biform game research in energy transition, studies on sales strategies during this transition are relatively scarce, and the interactive game dynamics between traditional and new energy enterprises have not been fully revealed. Therefore, leveraging the noncooperative-cooperative biform game theoretical model in this study not only offers a viable approach for exploring the green transition of energy enterprises but also enriches the practical applications of biform games.
In summary, this paper integrates a noncooperative-cooperative biform game model, where sales prices are treated as non-cooperative game strategies, to establish a cooperative alliance between new energy enterprises and traditional energy enterprises based on R&D expenses borne. The Shapley value is applied for profit allocation, with the profit allocation values from the cooperative game being used as payoff functions in the non-cooperative game, ultimately deriving the optimal sales price. The main contributions of this study are as follows: (1) Unlike previous studies that only considered either internal or external factors in the green transition of energy enterprises, this paper comprehensively accounts for the combined effects of both internal and external factors, making the research more aligned with practical needs. (2) This study establishes a noncooperative-cooperative biform game to reveal the complex interaction dynamics between new energy and traditional energy enterprises under the influence of multiple factors and market forces. This perspective provides a novel theoretical foundation for optimizing government subsidy policies and corporate competitive strategies. (3) This paper yields novel and practically relevant conclusions: government subsidies can enhance the production technology level of new energy enterprises; moderate competitive intensity can expand the market size of new energy enterprises; increasing the executive risk preference of traditional energy enterprises can stimulate them to take on a higher proportion of R&D expenses borne. Moreover, increases in investment cost and production cost are advantageous for traditional energy enterprises to acquire more profits, thereby promoting their green transition.
The remainder of this paper is organized as follows:
Section 2 describes the research problem and outlines the assumptions.
Section 3 demonstrates the construction and solution of the noncooperative-cooperative biform game model.
Section 4 analyzes the equilibrium strategies of new energy companies and traditional energy companies.
Section 5 presents the numerical analysis. Finally,
Section 6 concludes this study.
2. Problem Statement and Hypotheses
Considering the energy structure composed of new energy enterprises and traditional energy enterprises, the new energy enterprises determine the energy sales price as , while the traditional energy enterprises determine the energy sales price as . During the energy transition process, an increasing number of traditional energy enterprises choose to cooperate with new energy enterprises and jointly bear the R&D technology cost, with the proportion of R&D expenses borne by new energy enterprises represented as . To utilize the new energy produced by new energy enterprises for more efficient development of traditional energy and to reduce carbon emissions, the traditional energy enterprises directly invest an amount in the form of investment cost in the new energy enterprises. For the purposes of this study, the following assumptions are proposed:
Hypothesis 1. As a fundamental sector of the national economy, the market characteristics of energy companies are relatively stable. However, in recent years, they have been subject to external shocks such as policy adjustments and shifts in energy structure, leading to a certain level of dynamic volatility in market demand. Throughout this process, the game between commercial transactions and entities in the market is significantly influenced by pricing strategies, competitive actions, and executive decision preferences. Based on this context, and drawing from the research of Fox et al. [38] and Jia et al. [31], this paper assumes that the sales volumes of new energy and traditional energy enterprises are as follows: In this context, represents the market potential scale of energy enterprises, is the energy sales price of new energy enterprises, and refers to the energy sales price of traditional energy enterprises. As the energy price, , increases, the demand decreases. denotes the competitive intensity of energy sales between new energy enterprises and traditional energy enterprises. and are the executive risk preferences of new energy enterprises and traditional energy enterprises, respectively, while is the sensitivity coefficient of executive risk preference.
Hypothesis 2. The technologies employed by renewable energy companies to produce new energy sources include solar energy technology, wind energy technology, biomass energy technology, hydropower technology, geothermal energy technology, and hydrogen energy technology. These technologies are suited to varying geographical and economic conditions. It is assumed that consumers can purchase two types of energy: one produced by traditional energy enterprises, referred to as traditional energy, and the other produced by renewable energy enterprises, referred to as renewable energy. The collaboration between renewable energy enterprises and traditional energy enterprises generally takes the form of technology sharing, joint R&D investments, or direct investments. However, technology sharing and joint R&D involve risks of technological leakage and require substantial managerial effort. As a result, in real-world scenarios, traditional energy enterprises often choose to cooperate through direct investments in renewable energy companies. For instance, in the first half of 2023, Shell USA successfully acquired Volta, expanding its public EV charging network in the U.S.; in the second half of 2023, BP acquired the remaining 50.03% equity stake in Lightsource bp, further broadening its onshore renewable energy portfolio globally. Referring to the renewable energy investment cost functions of Chen et al. [39] and Zhang et al. [40], the investment cost of renewable energy is assumed to be: In this context, represents the cost coefficient of production technology investment, where a higher value of indicates lower investment efficiency per unit. The investment return rate serves as a metric for evaluating the profitability of investments. In this study, is employed to reflect the technological efficiency of new energy production by new energy enterprises, guaranteeing . Equation (2) demonstrates the quadratic relationship between new energy investment cost and the level of production technology.
Hypothesis 3. For economies that place greater emphasis on the development of renewable energy, such as China and the European Union, subsidies for renewable energy companies tend to be higher than those for traditional energy enterprises, reflecting a distinct commitment to low-carbon and innovation-oriented characteristics. In these countries, government subsidies for traditional energy enterprises are primarily based on carbon emission metrics, while subsidies for renewable energy enterprises are mainly determined by indicators such as production output and technology-related levels. Conversely, in countries like Iran, Russia, and those in the Middle East, where traditional energy enterprises form a critical economic backbone, reducing subsidies for these industries could lead to mass unemployment and social instability. Hence, in these nations, subsidies for traditional energy enterprises are typically higher than those provided to renewable energy companies. Considering that the primary focus of this study is the operational mechanism of subsidy policies rather than the differences in government subsidies, this paper assumes that the government subsidy for both renewable energy and traditional energy enterprises is denoted as .
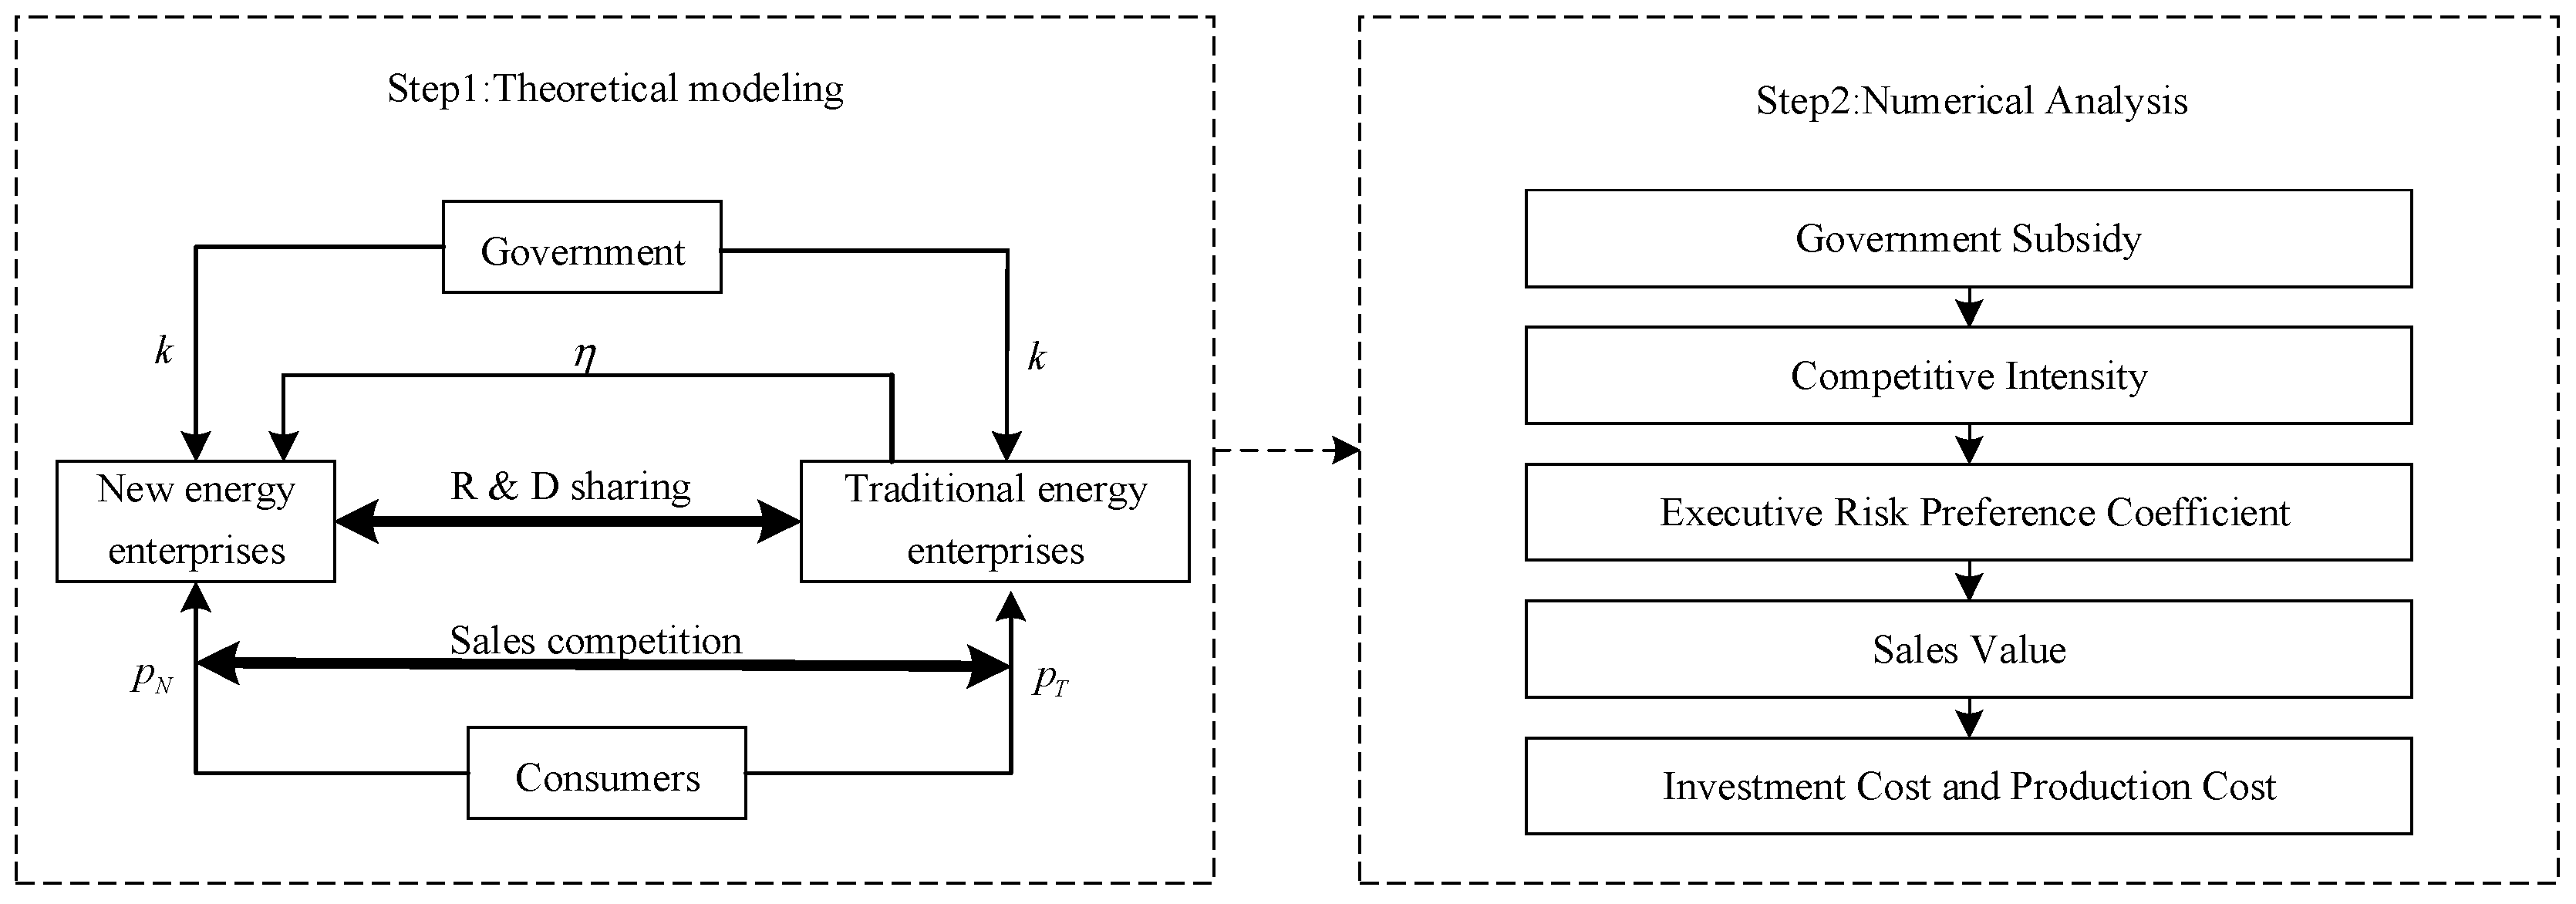
Figure 1 describes the overall research framework and process of the study.
In addition, the relevant symbols and meanings are shown in
Table 1.
3. Construction and Solution of Noncooperative–Cooperative Biform Game Model
3.1. Description of the Noncooperative–Cooperative Biform Game Model
This section establishes a noncooperative–cooperative biform game model to analyze the sales competition and R&D expenses borne issues between new energy enterprises and traditional energy enterprises during the energy sales process. First, in the noncooperative game stage, new energy enterprises and traditional energy enterprises determine their respective sales prices, resulting in a competition scenario . Second, within the cooperative game stage of any competitive scenario, new energy enterprises and traditional energy enterprises determine the proportion of R&D investments and the production technology level . Subsequently, the characteristic values of each alliance are obtained. The Shapley value is then utilized to calculate the profit allocation for both new energy enterprises and traditional energy enterprises. Next, the calculated profit allocation values are used as the payoff functions in the non-cooperative game stage to derive the optimal sales prices . Finally, the optimal sales prices are incorporated into the cooperative game stage, resulting in the optimal strategies and , as well as the optimal sales profits and optimal sales quantities .
Based on the above analysis, the profit functions for new energy enterprises and traditional energy enterprises can be expressed as follows:
In Equation (3), the first term represents the energy sales revenue of the new energy enterprises. The second term denotes the synergistic gains obtained by the new energy enterprises from the product sales of the traditional energy enterprises. The third term is the investment cost borne by the new energy enterprises for new energy development. In Equation (4), the first term represents the energy sales revenue of the traditional energy enterprises. The second term refers to the share of the new energy investment cost undertaken by the traditional energy enterprises.
In the non-cooperative game, the optimal sales price is determined using the profit distribution values from the cooperative game as the payoff function. Therefore, it is necessary first to construct the coalition characteristic function in the cooperative game portion and then determine the profit distribution values for the new energy enterprises and traditional energy enterprises.
3.2. Construction of the Coalition Characteristic Function and Profit Allocation in Cooperative Games
This section begins by constructing the characteristic function for the coalition in the cooperative game framework. The characteristic value
is calculated for all possible coalitions, where
represents the coalition set and
. A total of four coalitions are formed, with
being the grand coalition comprised of the new energy enterprises and traditional energy enterprises [
41]. Using the von Neumann coalitional characteristic function determination method [
42], the characteristic function for the empty coalition is identified as:
According to Equation (3) and the max–min theorem, the coalition characteristic function of a non-cooperative (stand-alone) scenario for new energy enterprises is as follows:
In Equation (6), when
and
, the profit function of the new energy enterprises reaches its minimum, and the following can be derived:
The first-order derivative of Equation (7) equals zero, yielding
, which maximizes the profit of Alliance
. Consequently, the characteristic function of Alliance
can be expressed as:
According to Equation (4) and the max–min principle, the characteristic function of a coalition
is given by:
In Equation (9),
. Therefore, when
, the solution reaches its maximum value. By substituting
into
, the following result can be obtained:
Given that
, a minimum value solution exists when
. The coalition characteristic function is expressed as:
When New Energy enterprises
and Traditional Energy enterprises
cooperate to form a grand coalition
, the characteristic function of the grand coalition is given as:
The production technology level
for the grand coalition
is determined as follows:
By substituting
into Equation (12), the characteristic function of the grand coalition can be obtained as:
From Equations (8), (11) and (14), it can be deduced that:
Since the combined demand for new energy and traditional energy must be greater than the demand for new energy alone, in Equation (15), , hence Equation (15) is always greater than zero.
Proposition 1. Under any competitive scenario , the cooperative game is a convex game, and the characteristic function satisfies: . Therefore, the Shapley value of the cooperative game lies within the core solution, satisfying individual rationality. The Shapley value can thus be used to determine the profit allocation in the cooperative game. The profit allocation based on the Shapley value is calculated as follows: The profit allocation value for new energy enterprises and traditional energy enterprises is given by:
In the cooperative game, the condition of individual rationality requires that each participant’s allocated profit within the coalition must be no less than the payoff they would receive by acting independently, i.e.,
and
. If this condition is not satisfied, new energy enterprises and traditional energy enterprises will have no incentive to participate in the cooperation, and the formation of the coalition will fail. Based on calculations, the following results can be obtained:
It can be concluded from Equations (19) and (20) that and are both strictly greater than zero.
Proposition 2. Under any competitive scenario, the profit allocation between new energy enterprises and traditional energy enterprises satisfies that
and .
Proposition 2 indicates that, under any competitive scenario , when the new energy enterprises and the traditional energy enterprises cooperate, the profit allocated to each party is no less than the profit they would obtain individually. Therefore, the economic growth generated by cooperation facilitates the formation of a stable cooperative alliance.
3.3. The Optimal Pricing Strategies of New Energy Enterprises and Traditional Energy Enterprises
The profit distribution values and , derived during the cooperative game stage, are utilized as the payoff functions for the non-cooperative game between the new energy enterprises and the traditional energy enterprises. By calculating the first-order derivative of these payoff functions, the reaction functions are obtained. The equilibrium strategy is determined by solving the simultaneous equations of the reaction functions.
Proposition 3. The optimal recycling price can be obtained by taking the first-order partial derivatives of and with respect to and respectively, and solving the resulting system of equations . Based on these results, the optimal sales prices for the new energy enterprises and the traditional energy enterprises are as follows: Among them: , , , , , , , , , , , , , , , , , , , , .
By taking the second-order partial derivatives of the profit distribution values for new energy enterprises and traditional energy enterprises, we obtain the following:
When the conditions are satisfied, there exists an optimal pricing strategy such that the profits of both the new energy firm and the traditional energy firm are maximized.
By substituting Equations (21) and (22) into Equation (13), the optimal investment return can be obtained as follows:
By substituting
and
into the profit function
, and combining it with
, the optimal proportion of R&D expenses borne can be derived as follows:
The optimal profits of new energy enterprises and traditional energy enterprises are as follows:
The optimal sales volume for new energy enterprises and traditional energy enterprises are as follows:
This paper investigates the energy sales problem between new energy enterprises and traditional energy enterprises by constructing and solving both the non-cooperative and cooperative game models. The study derives the optimal sales price, optimal technology level, optimal proportion of R&D expenses borne, optimal sales volume, and optimal profit.
4. Strategic Balance Analysis Between New Energy and Traditional Energy Enterprises
Proposition 4. When , and ; when , and .
Proposition 4 indicates that when , subsidies reduce the unit production cost of energy for firms, allowing them to compete at lower prices while maintaining a certain profit margin. As government subsidies increase, both new energy firms and traditional energy firms choose to lower their energy sales prices. On the other hand, when , an increase in government subsidy leads to a rise in the prices of both new energy and traditional energy. The increase in subsidies encourages firms to expand their energy production scale. Given a fixed level of technical efficiency, firms may raise sales prices to compensate for the increased cost associated with the expanded production scale.
Proof. . Since , , and , the numerator can be expressed in terms of . Further, through , the value of can be derived. Thus, . Given that achieves its maximum value when , the maximum value is denoted as . Hence, and . Therefore, when , ; and when , . □
Similarly, set . In the numerator of the expression, let . Given that , it follows that , i.e., . Hence, When , we have ; and when , it holds that .
Proposition 5. When , ; when , .
Proposition 5 indicates that when subsidies are regarded as a tool to reduce production costs for firms, which allows them to obtain excess profits without the need to expand their production levels. Consequently, the intrinsic motivation for firms to maximize profits through production scale expansion is weakened. As a result, an increase in government subsidies leads to a decrease in the sales volumes of both new energy enterprises and traditional energy enterprises. In contrast, when , subsidies have a certain incentive effect, encouraging energy enterprises to increase their R&D investments. Therefore, under such conditions, an increase in government subsidies will enhance the sales volumes of both new energy enterprises and traditional energy enterprises.
Proof. , since , it follows that in this interval, . Therefore, when ; when . □
Similarly, . So when , ; when , .
The theoretical analysis highlights the impact of key variables such as government subsidies, competitive intensity, and sales value on the profits of traditional energy companies and new energy enterprises, as well as on the overall market structure. Additionally, it explores the economic interpretation of government subsidies under different scenarios. However, solely relying on theoretical calculations is insufficient to capture the complexities of dynamic changes in reality. To validate the practical applicability of the proposed model, this study will employ numerical analysis to further quantify the sensitivity of parameters to outcomes. Based on these findings, strategic optimization pathways and practical implications will be discussed.
5. Numerical Analysis
This section analyzes the impact of government subsidy intensity, competitive intensity, executive risk preference coefficient, and sales value on the equilibrium strategies of new energy enterprises and traditional energy enterprises through numerical analysis. To visualize the effects more intuitively, numerical analyses are conducted using MATLAB 2023b. In this study, the units are standardized as RMB/kWh to facilitate comparative analysis.
Traditional energy sources can not only generate thermal energy through combustion but also enable electricity output. According to data from the U.S. Energy Information Administration (EIA), the energy content of one gallon of gasoline is approximately 33.7 kWh, with an average sales value of about 0.089 USD/kWh. Similarly, the energy content of one cubic meter of natural gas is approximately 10.76 kWh, with an international average price of 0.50 USD per cubic meter and an average sales value of about 0.046 USD/kWh. Based on the recent RMB exchange rate of 7.14, the equivalent sales value is approximately 0.33 RMB/kWh. According to the 2024 report by the International Renewable Energy Agency (IRENA), renewable energy not only offers environmental advantages in new power installations in China, the European Union, and the United States but also provides significant cost and economic benefits. The report reveals that the global average production cost of wind and solar power has decreased to 0.031 USD/kWh and 0.042 USD/kWh, respectively, which corresponds to 0.22 RMB/kWh and 0.30 RMB/kWh. Therefore, the sales value range for this study is set between 0.2 and 1.5 RMB/kWh.
5.1. The Impact of Government Subsidy on the Sales Strategies of New Energy and Traditional Energy Enterprises
To investigate the relationship between government subsidy intensity and optimal sales price, optimal sales volume, optimal proportion of R&D expenses borne, optimal processing technology level, and optimal profit, the parameters are set as follows:
, based on the references [
33,
43,
44,
45,
46,], while incorporating relevant data published by the EIA and IRENA. The relationships between the level of government subsidy and the optimal sales price, optimal sales volume, optimal treatment technology level, and optimal profit are illustrated in
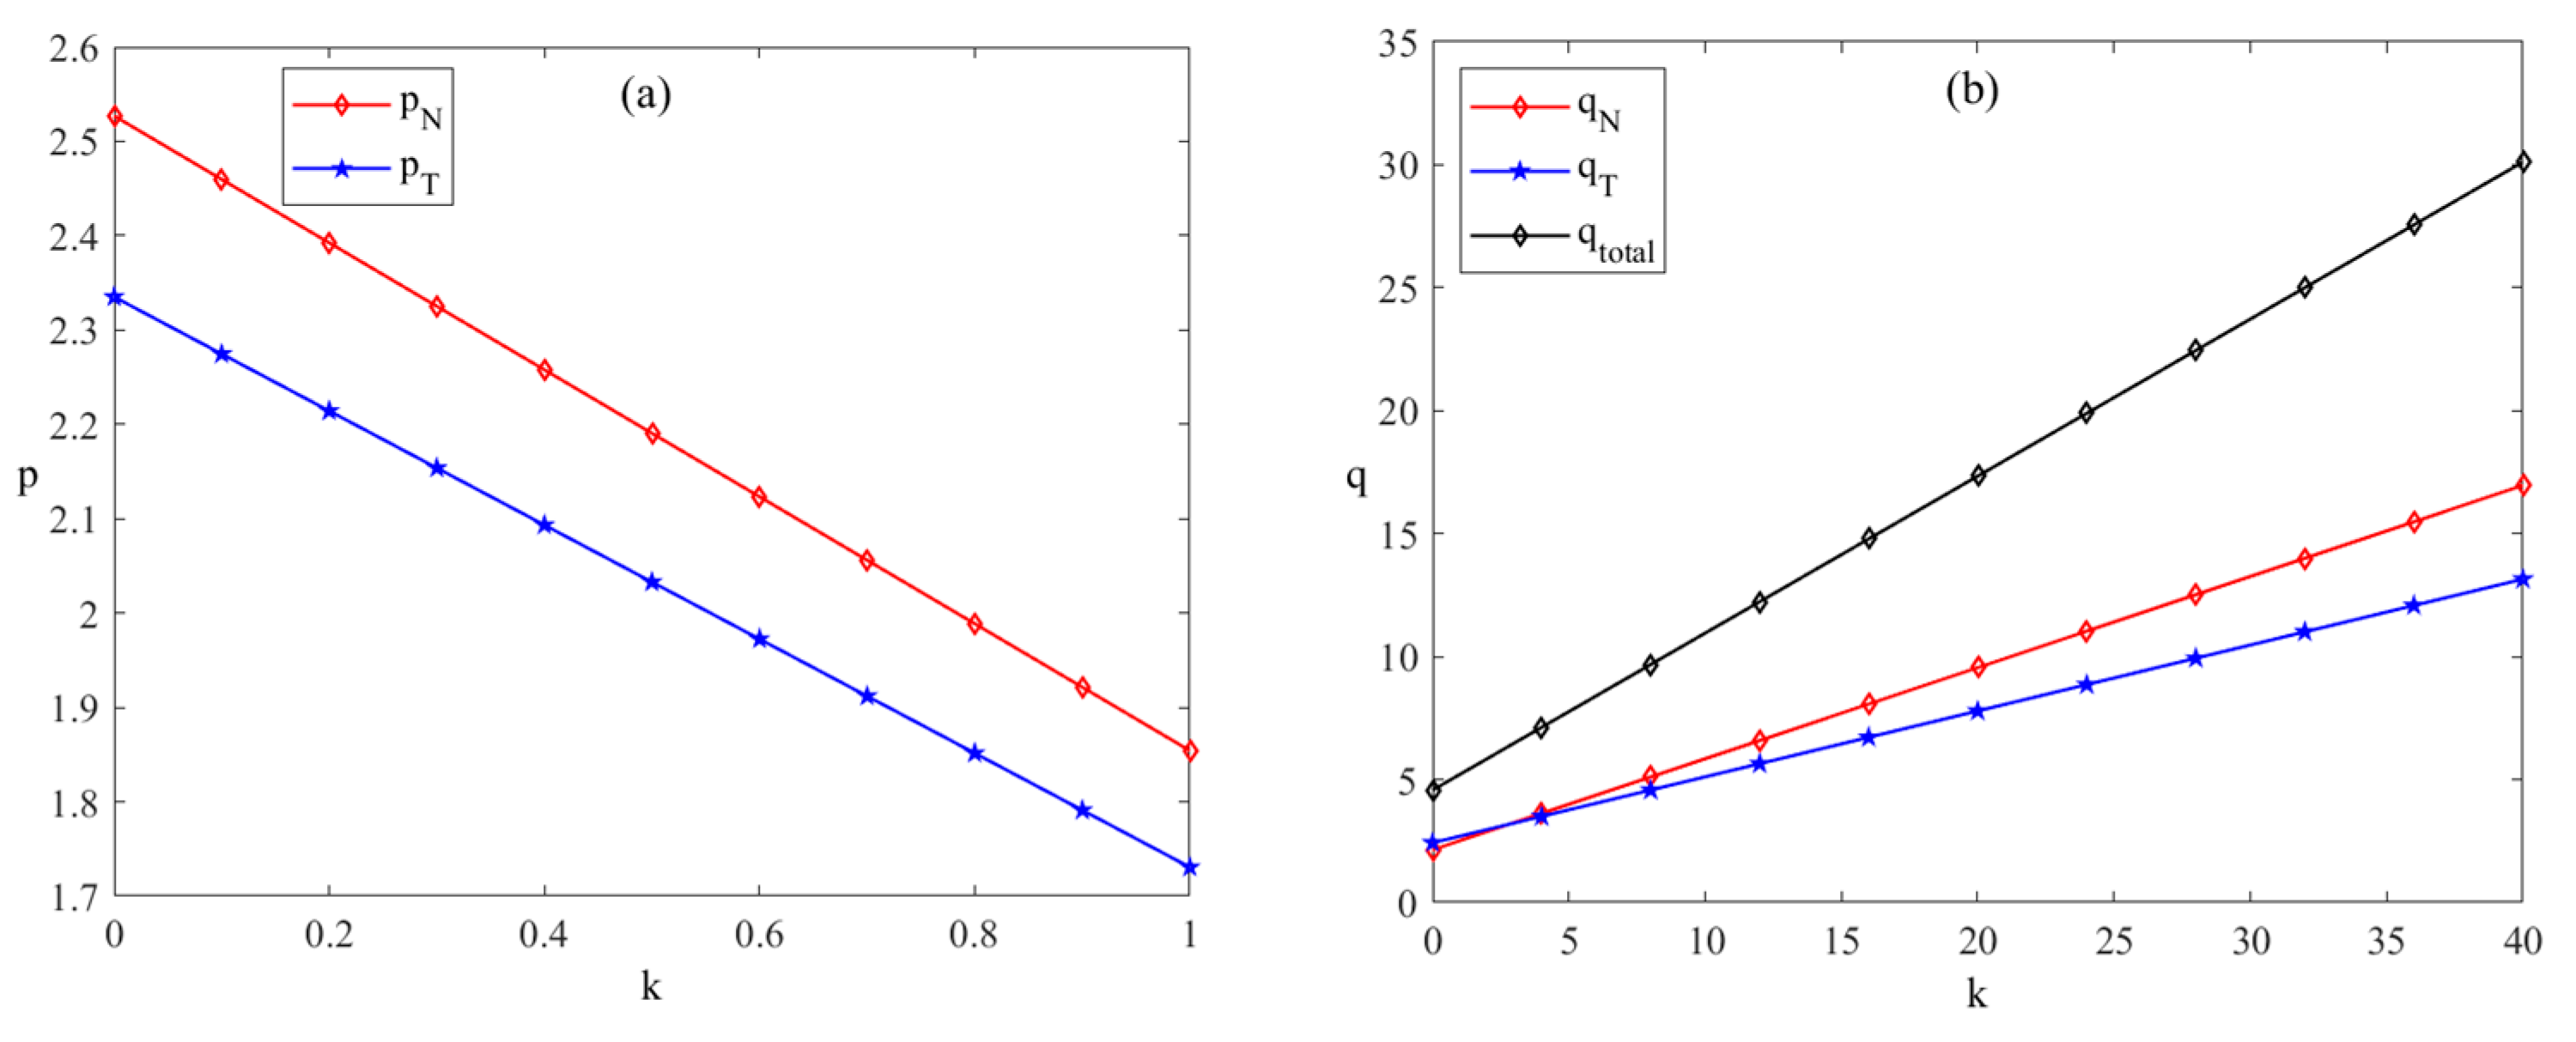
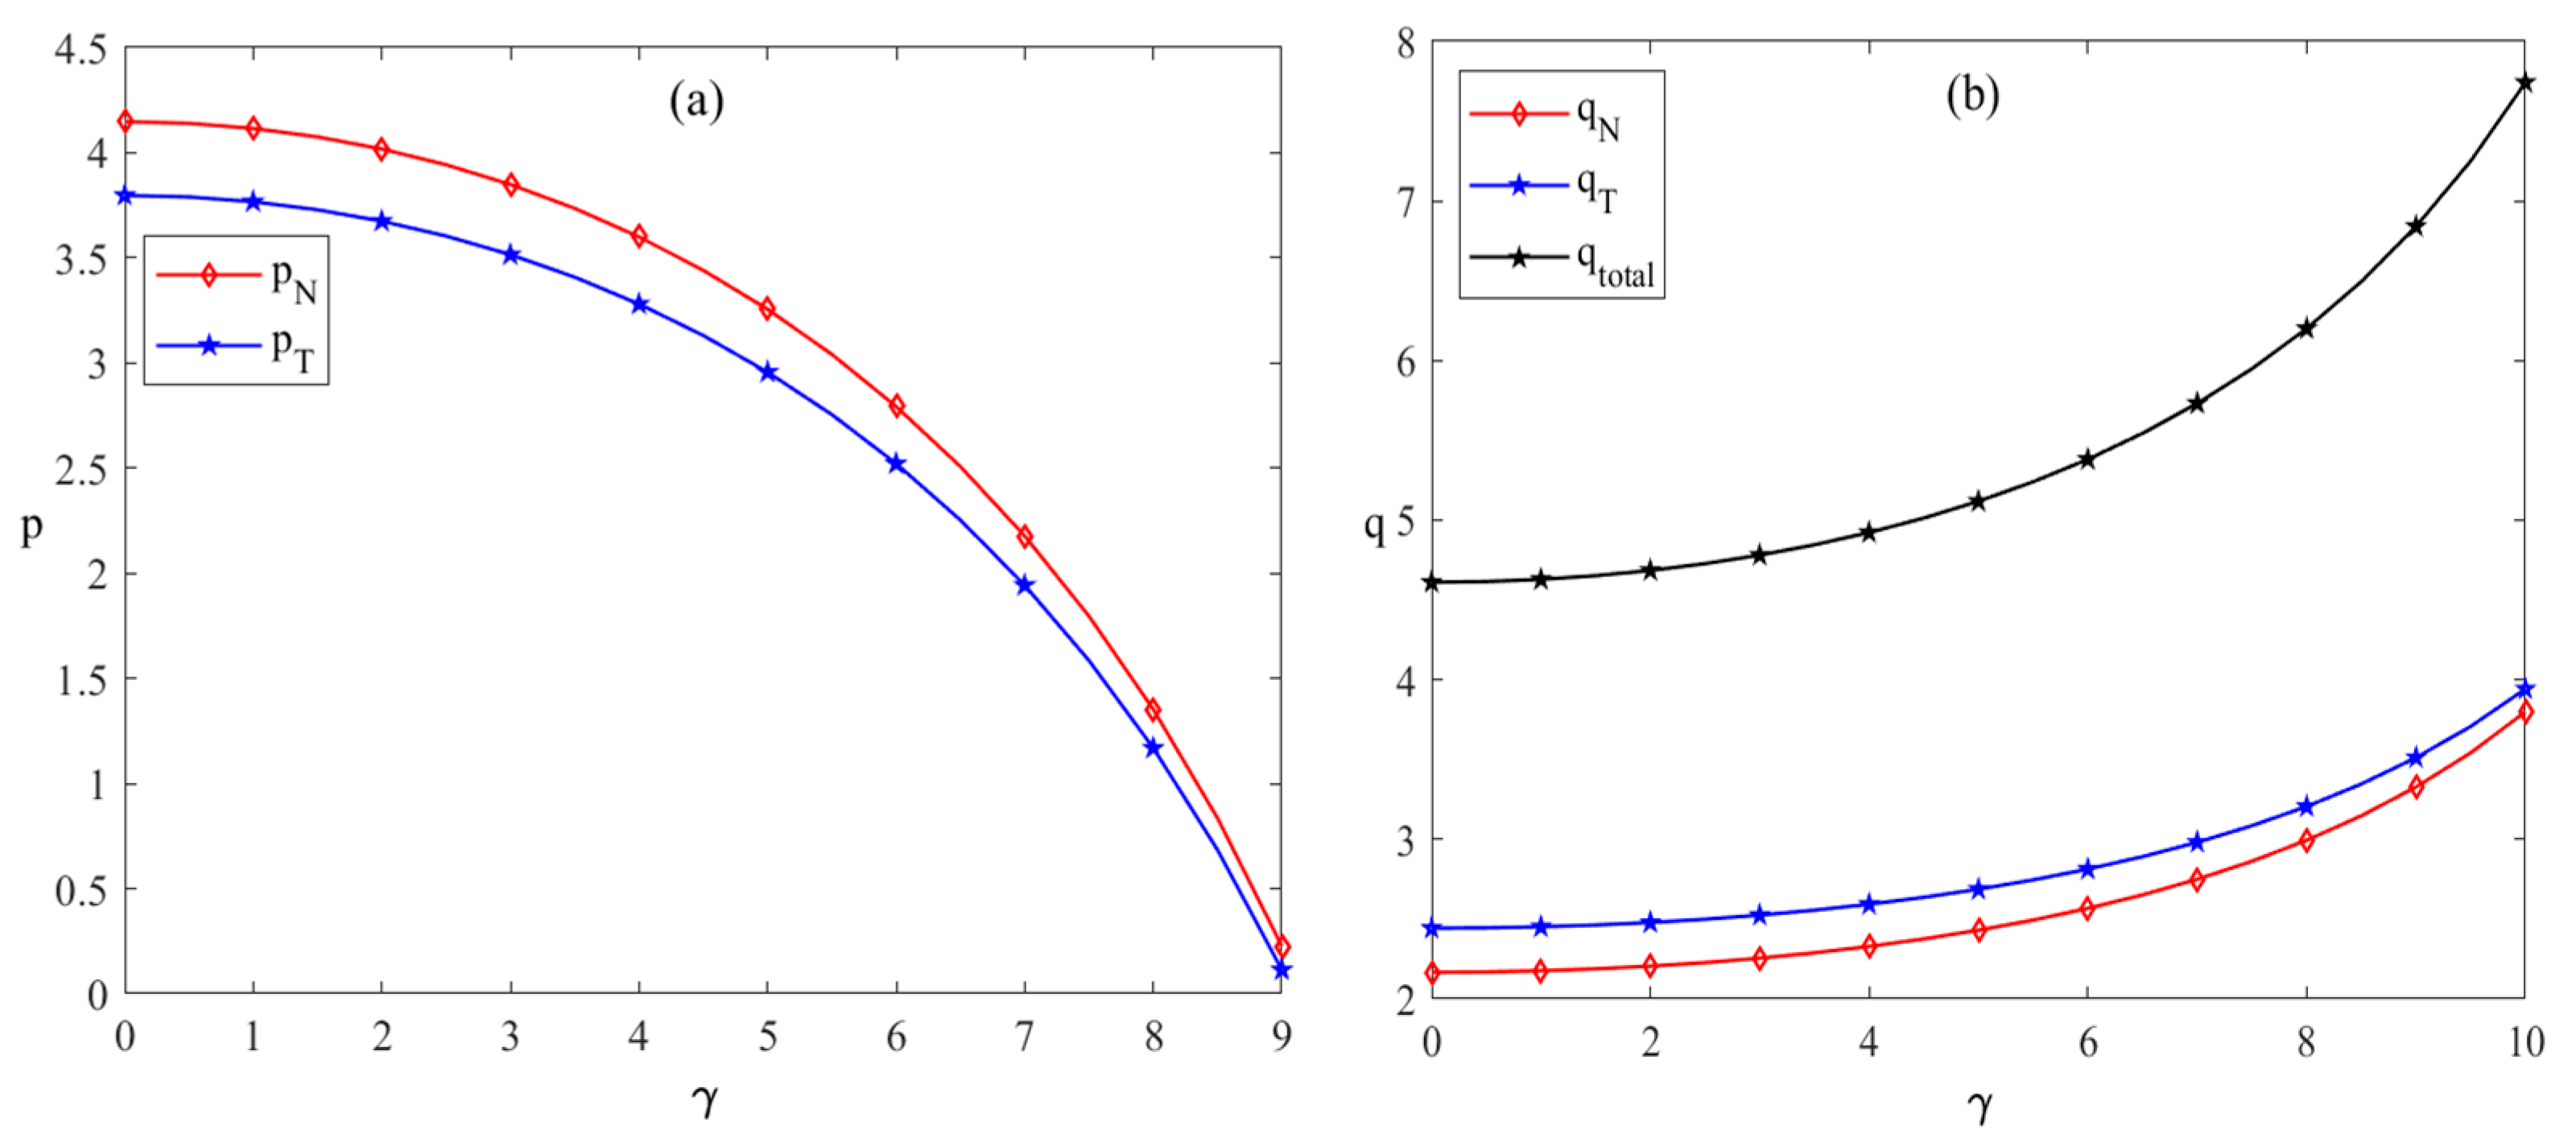
Figure 2.
From
Figure 2a, it can be concluded that increasing government subsidies leads both new energy companies and traditional energy companies to lower their energy sales prices, which corroborates the conclusion of Proposition 4. This phenomenon arises because government subsidies significantly reduce the cost of energy development and production for enterprises. Simultaneously, while subsidies from policy systems lower production costs, they also influence consumer behavior through market systems by encouraging consumers to purchase more energy. However, due to the production technology advantages possessed by new energy companies, traditional energy companies are constrained from raising their energy prices to a certain extent. Consequently, new energy companies can more substantially lower their prices and increase their sales volume. As a result, the sales price curve and sales volume curve of new energy companies are steeper compared to the corresponding curves of traditional energy companies.
From
Figure 2b, it can be observed that increasing government subsidies leads to a continuous rise in the energy sales volume of both new energy enterprises and traditional energy enterprises. This finding aligns with Proposition 5, as the implementation of government subsidies enhances consumers’ willingness to purchase energy. Simultaneously, the market system provides feedback on technological research and development, in that the increase in energy sales stimulates energy enterprises to intensify their investment in R&D. Consequently, the technological system further improves the production efficiency of new energy enterprises, thereby amplifying the effectiveness of subsidies within the policy system. This creates a dynamic linkage mechanism among the market, technology, and policy systems.
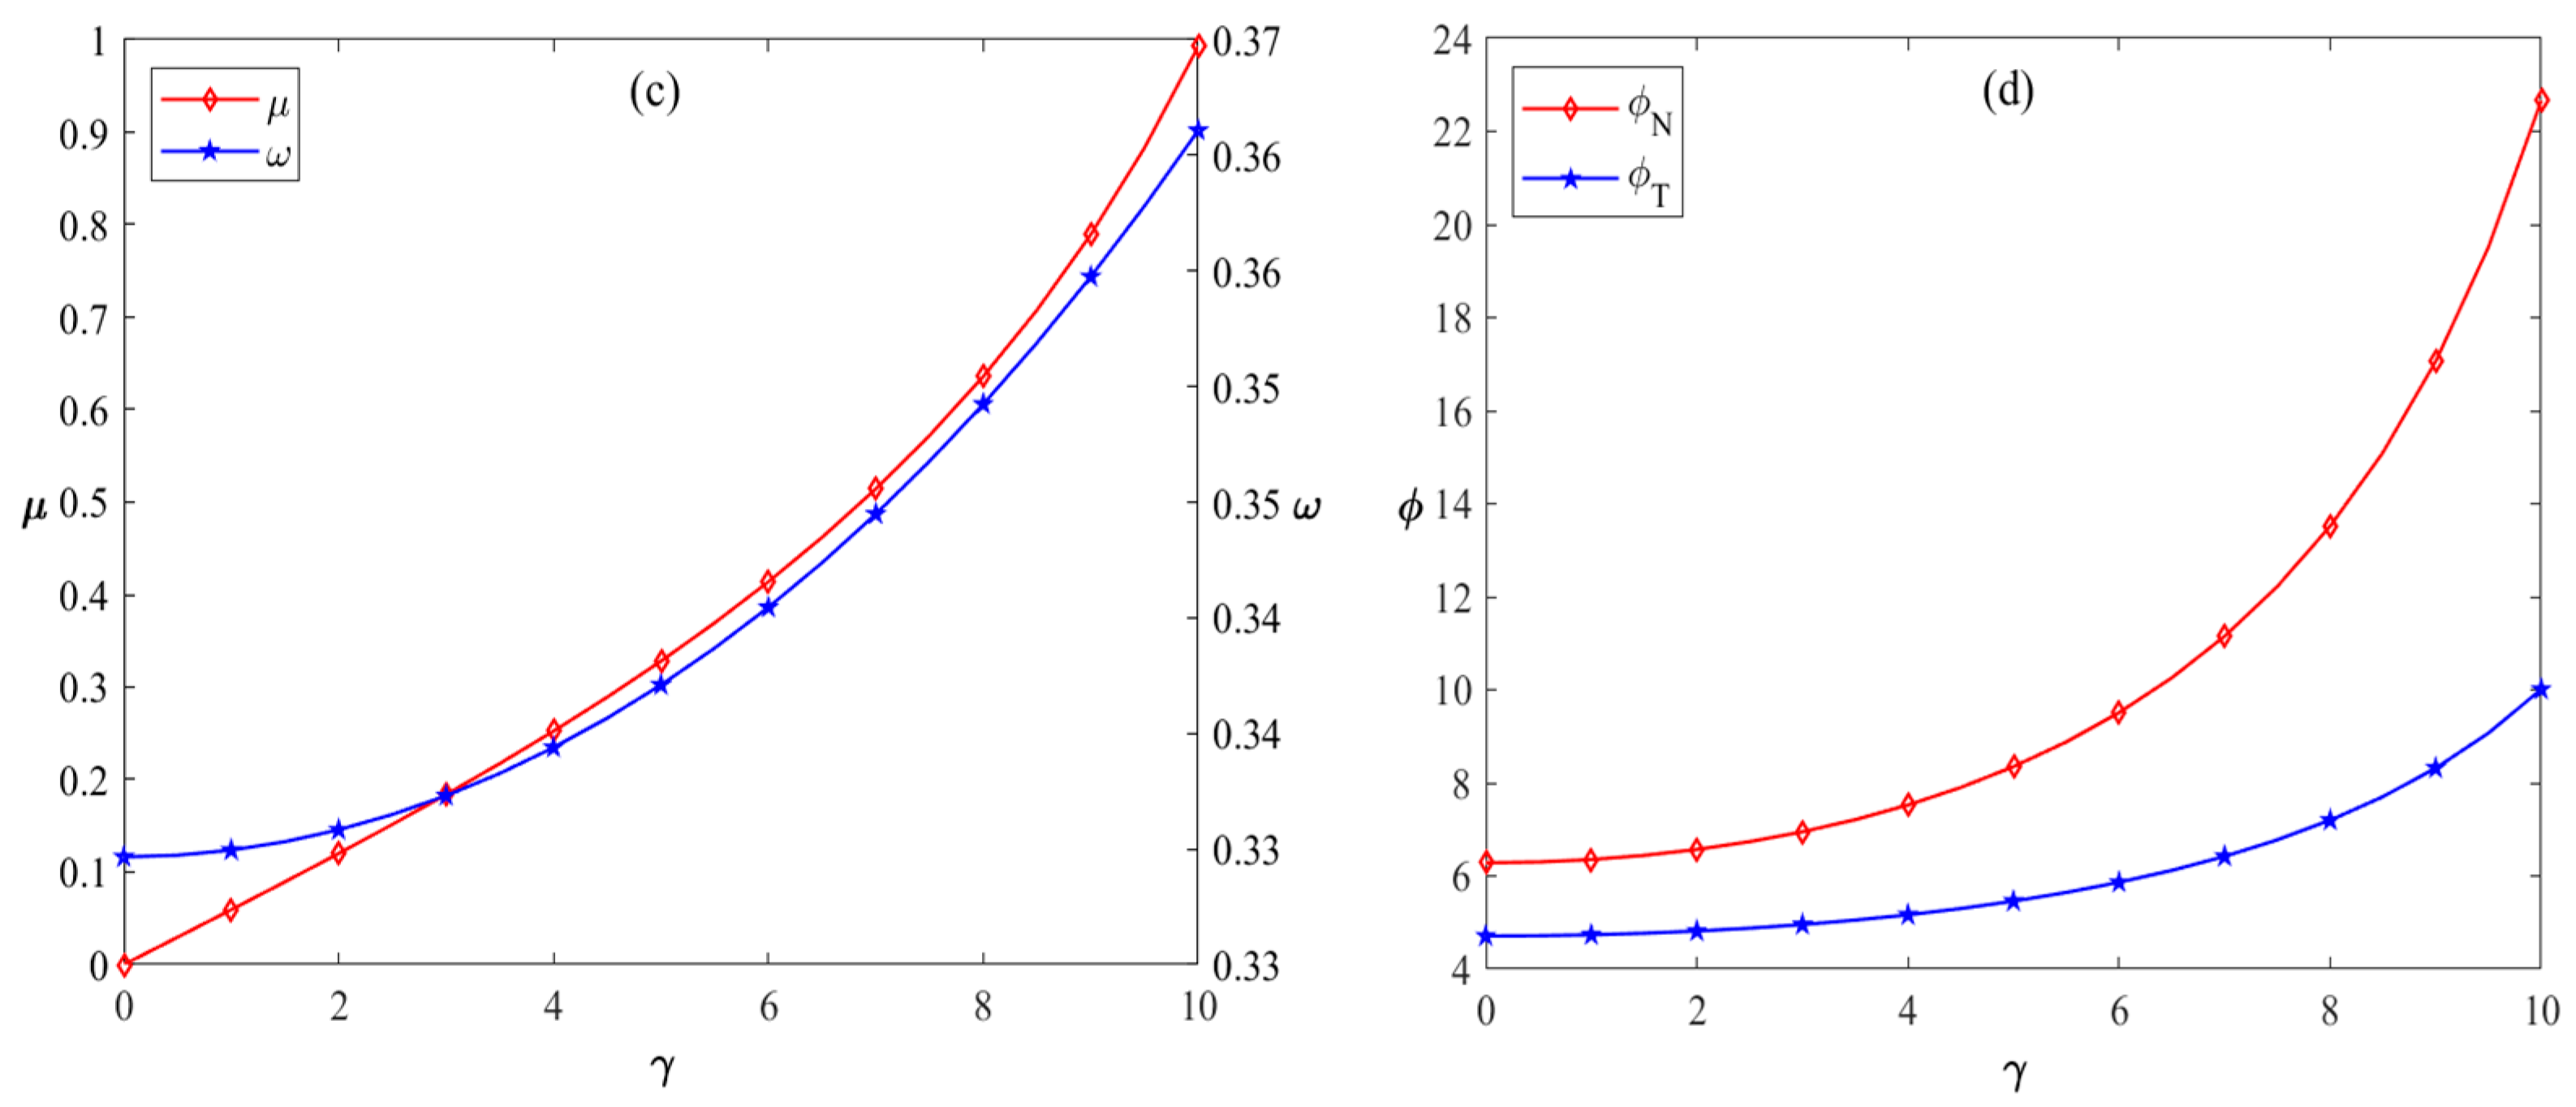
Figure 2c illustrates that as the intensity of government subsidies increases, both the level of production technology and the proportion of R&D expenses borne by new energy companies also increase. This finding aligns with the study by Guo et al. [
4], which asserts that government subsidies have a positive effect on enhancing technological levels. The rationale is that through increasing subsidies, the government enhances the sales profits of both new energy companies and traditional energy firms, encouraging new energy companies to assume a larger share of R&D expenses, thereby improving the level of production technology in the renewable sector. However, despite being emerging entities with advantages in technological innovation motivation and flexibility compared to traditional energy enterprises, new energy companies exhibit lower efficiency change and scale efficiency change. This results in a relatively slow enhancement in production technology levels. From the perspective of technological systems analysis, the improvement in production technology levels inversely influences the competitive landscape of the market system, further highlighting the necessity of policy formulation.
From
Figure 2d, it can be observed that as government subsidies increase, the growth rates in profits are 2.43 for new energy companies and 2.11 for traditional energy companies when the rate of decline in prices is 0.6. This increase in government subsidies leads to a continuous rise in sales profits for both new energy and traditional energy enterprises. The findings by Vincent [
47] support this viewpoint. However, excessively high subsidy rates could reduce the future investment profitability of the new energy sector. Therefore, it is crucial for the government to set a threshold for subsidies. From
Figure 2a, it is recommended that government subsidies remain within the range of (0, 1).
Figure 2c demonstrates that if government subsidies exceed 1, new energy companies may become overly reliant on government support and voluntarily take on a higher proportion of R&D expenses. This reverse scenario indicates that such a situation adversely affects the collaboration between new energy and traditional energy companies.
5.2. The Impact of Competitive Intensity on the Sales Strategies of New Energy Enterprises and Traditional Energy Enterprises
To investigate the relationships between competitive intensity and the optimal sales price, optimal sales volume, optimal proportion of R&D expenses borne, optimal treatment technology level, and optimal profit, the parameters are set as follows:
. The relationships between competitive intensity and the optimal sales price, optimal sales volume, optimal treatment technology level, and optimal profit are illustrated in
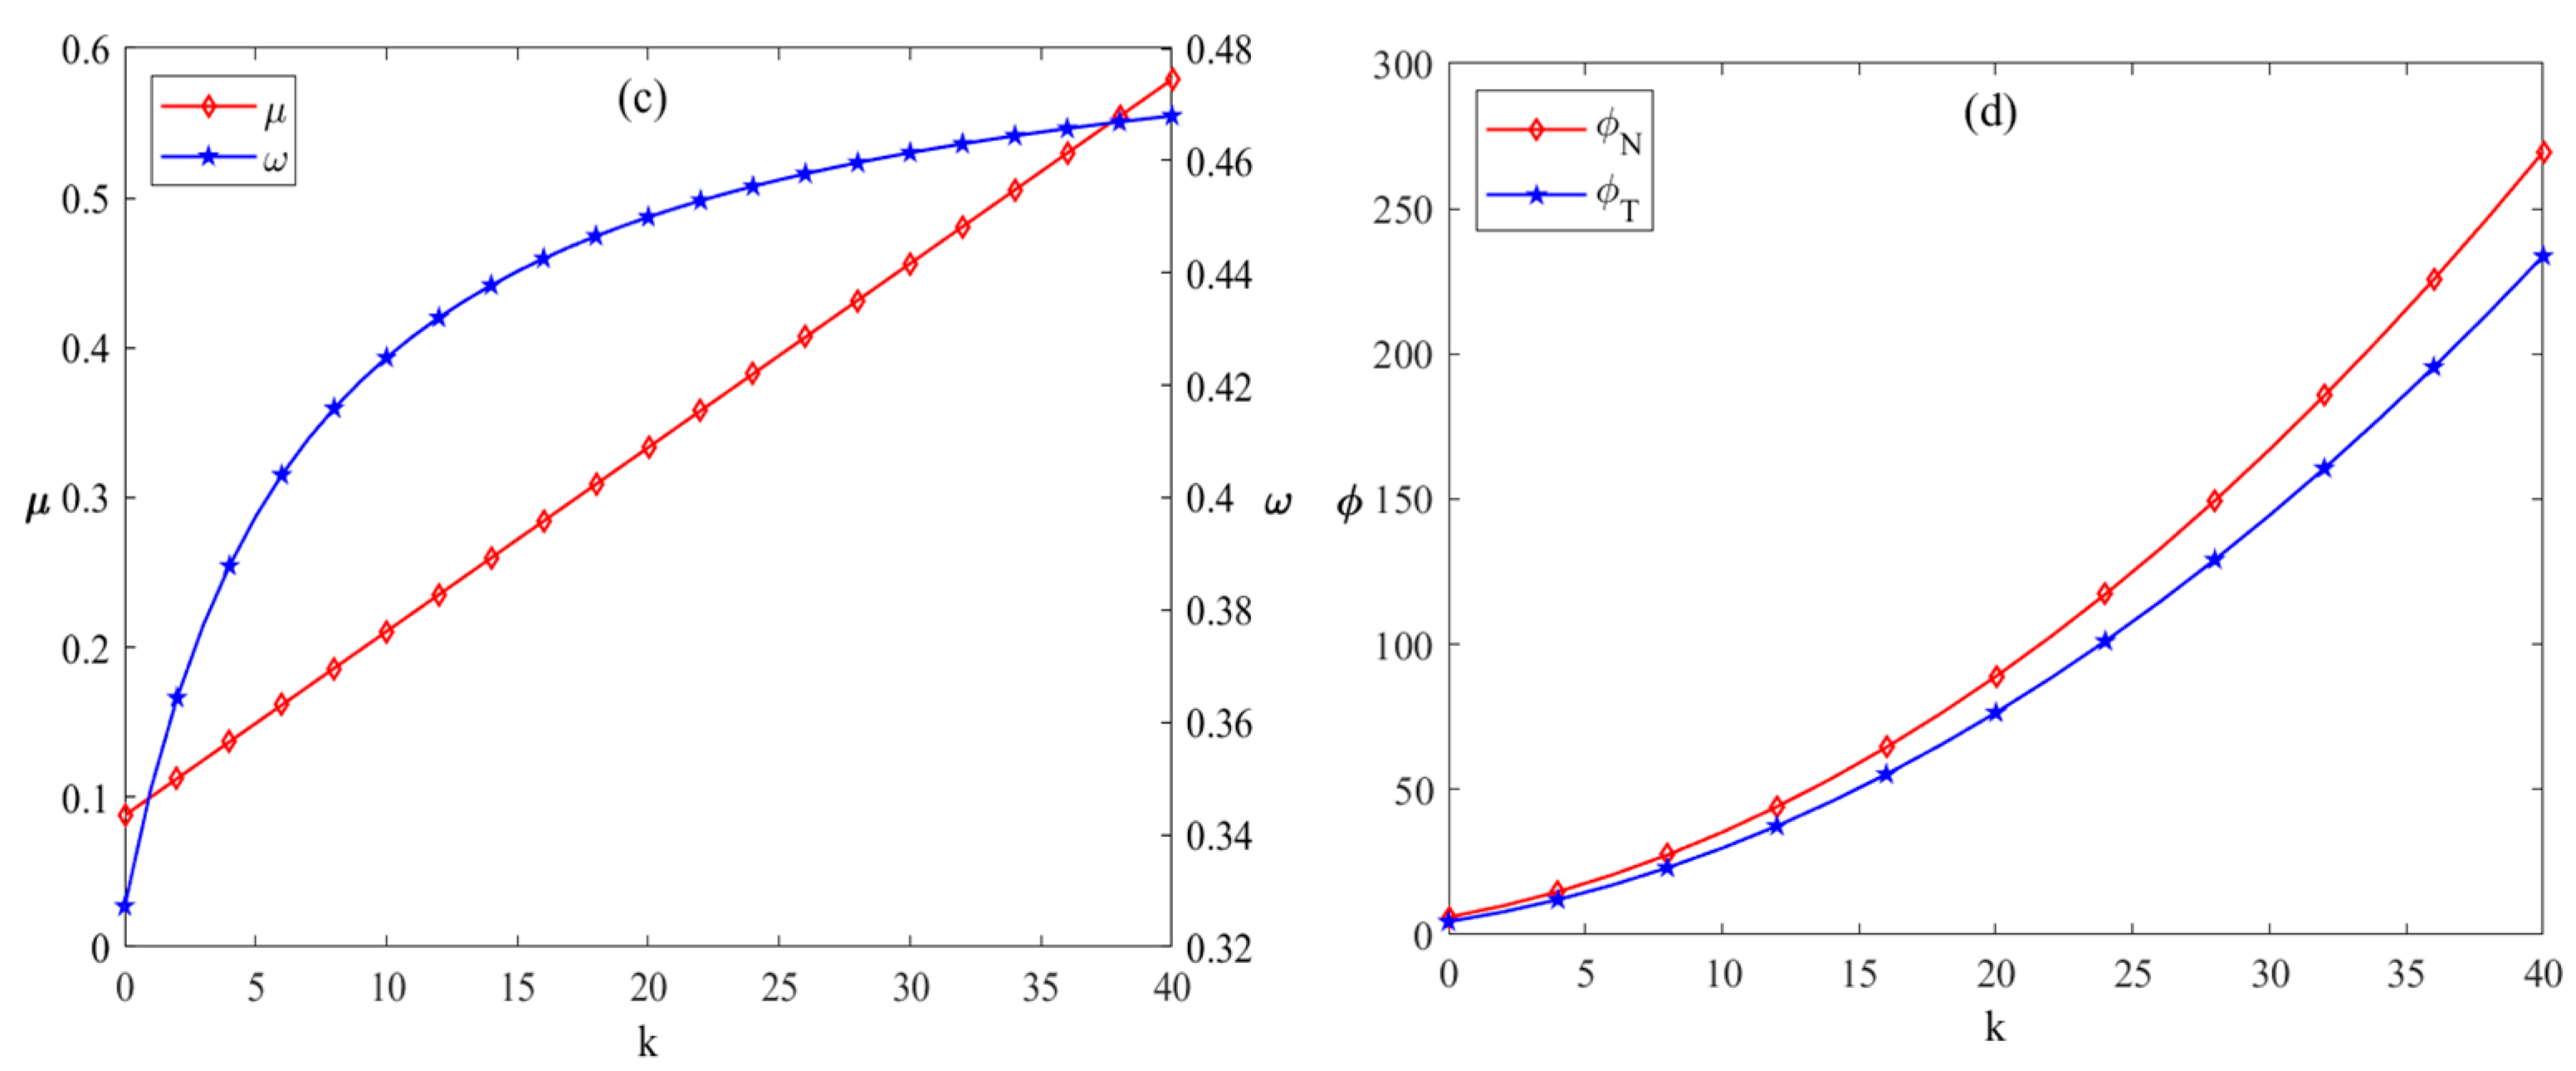
Figure 3.
As illustrated in
Figure 3a, both the energy sales prices of new energy enterprises and conventional energy enterprises increase with the rise in competitive intensity. Increasing competitive intensity can lead to higher sales prices, thereby generating greater profits. This conclusion appears counterintuitive since, for example, Ren [
48] observed in their study that heightened competition typically results in price reductions for goods. The reasoning behind this contrary result in the present study lies in the consideration of production technology levels. Referring to
Figure 3c, it is evident that with increasing competitive intensity, the production technology levels of new energy enterprises improve continuously. The advancement in innovative technologies expands market size, enabling enterprises to offset R&D costs through higher pricing, thereby achieving greater profits. A comparison of the pricing trends for new energy and conventional energy enterprises reveals that prices for new energy rise more rapidly than those for conventional energy. When the rate of price change for new energy reaches 1.35, the profit growth rate of new energy enterprises is 3.5. Conversely, when the profit growth rate for conventional energy enterprises stands at 4.5, their price change rate is only 0.55. Due to their inherent market advantages, conventional energy enterprises can expand their profit margins with small price adjustments. For instance, in recent years, despite the increase in oil prices caused by war, consumer demand for oil has remained unchanged. As shown in
Figure 3b, when the competitive intensity between new energy and conventional energy enterprises increases, the energy sales volumes of both experience a growing trend. This finding is supported by the study conducted by Chenavaz [
49], which demonstrated that under the combined influence of multiple factors, there is a significant positive correlation between product prices and demand.
Figure 3c illustrates that with increasing competitive intensity between new energy enterprises and traditional energy enterprises, the proportion of R&D expenses borne by new energy enterprises initially decreases and then rises, while the level of production technology continues to improve. During the early stages of heightened sales competition, traditional energy enterprises tend to increase their investments in new energy technologies. However, in the later stages, as competitive intensity further increases, traditional energy enterprises reduce their willingness to share R&D expenses in order to expand their own scale. From
Figure 3d, it can be observed that as competitive intensity increases, the profits of both new energy enterprises and traditional energy enterprises also exhibit accelerated growth. The benefits generated by the expansion of energy sales volume and the enhancement of production technology in new energy offset the price increase pressure caused by the growth in unit production cost. As a result, the profits of both new energy and traditional energy enterprises show an accelerating upward trend. Nevertheless, excessive competition negatively impacts corporate interests, while moderate competitive intensity promotes innovation activities, thereby facilitating the transformation and development of energy enterprises. The competitive intensity of energy enterprises should be maintained within the range of (0.2, 1). In this interval, traditional energy enterprises surpass new energy enterprises in terms of sales volume, while maintaining lower sales prices than their new energy counterparts. This is because, during this period, new energy enterprises are breaking through technical bottlenecks, highlighting the necessity of collaboration between the two types of enterprises.
5.3. Preference Coefficient on the Sales Strategies of New Energy and Traditional Energy Enterprises
To investigate the relationships between the executive risk preference coefficient and the optimal sales price, optimal sales volume, optimal proportion of R&D expenses borne, optimal treatment technology level, and optimal profit, the parameter values are set as:
. The relationships between the executive risk preference coefficient and the optimal sales price, optimal sales volume, optimal treatment technology level, and optimal profit are illustrated in
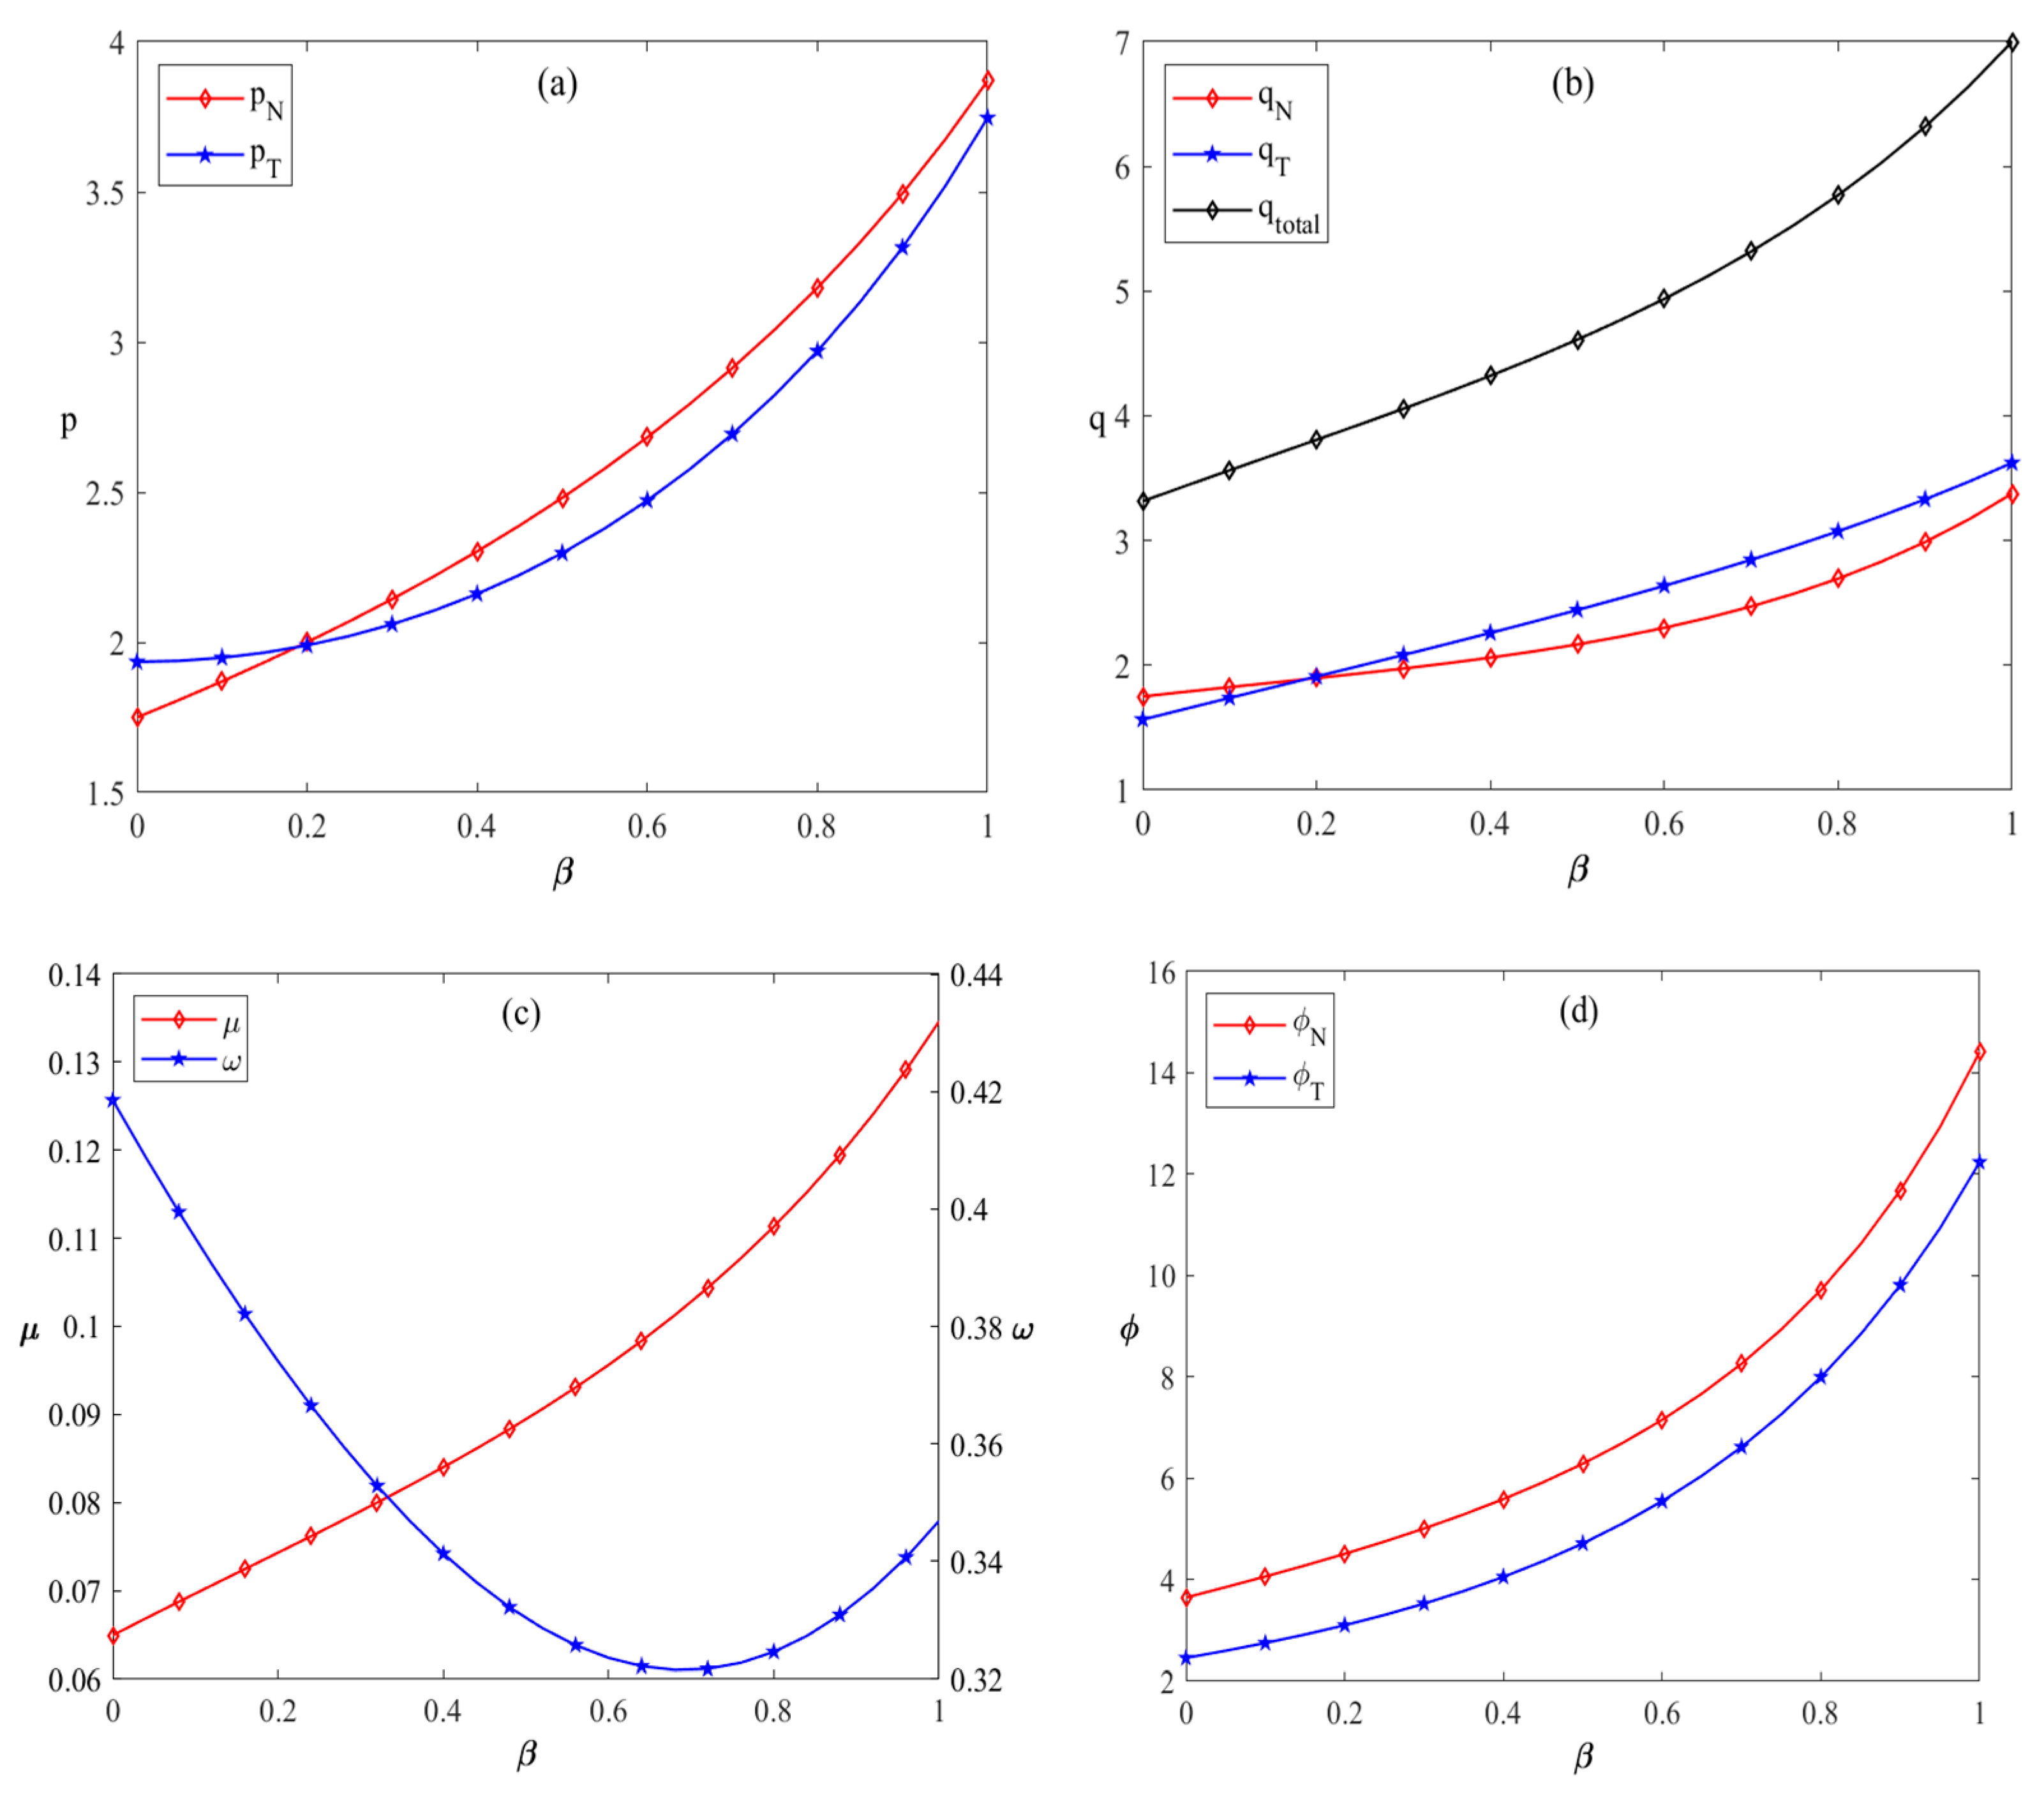
Figure 4.
Based on
Figure 4a, it can be observed that the sales prices of both new energy companies and traditional energy companies are positively correlated with executive risk preferences, increasing as the executive risk preference coefficient rises. Comparing the sales prices of new energy companies and traditional energy companies, the sales price of new energy companies is more sensitive to changes in the executive risk preference coefficient. This is because new energy companies require ongoing technological innovation to enhance competitiveness and reduce cost, thus favoring increased R&D investment. However, higher R&D investment leads to short-term increases in operational cost. To maintain profitability, new energy companies tend to pass these increased costs onto consumers by raising sales prices. From
Figure 4b, it is evident that as the executive risk preference coefficient increases, the sales volume of energy decreases. This reduction can be attributed to the higher prices consumers must pay for energy, which weakens consumer demand.
Based on
Figure 4c, it can be observed that as the executive risk preference coefficient of both new energy enterprises and traditional energy enterprises increases, the overall level of energy technical efficiency continues to rise, while the proportion of technological effort contributed by new energy enterprises steadily decreases. This indicates that higher executive risk preference is associated with a greater emphasis on the quality of innovation.
Figure 4c also illustrates that, when the threshold of the executive risk preference coefficient falls within the range of (0.24, 1), new energy enterprises are willing to collaborate with traditional energy enterprises. However, when the coefficient exceeds 1, new energy enterprises opt out of bearing the proportion of R&D expenses, effectively abandoning the collaboration. This is consistent with the findings of Lou et al. [
50], which highlight that technological innovation is a gradual process, with challenges such as rising energy prices and declining energy sales volumes exerting pressure on innovation. Under such circumstances, traditional energy enterprises with higher executive risk preference coefficients tend to take on a larger proportion of R&D expenses borne. In
Figure 4d, it is shown that the profits of both new energy and traditional energy enterprises increase with higher executive risk preference coefficients. This is because a reasonable increase in the executive risk preference coefficient motivates energy enterprises executives to invest more resources proactively in technological innovation and market expansion. As a result, they can seize greater opportunities in the energy transition process, thereby improving the competitiveness and profitability of their enterprises. Combining the insights from
Figure 4a,d, it is evident that as the executive risk preference coefficient rises, sales prices increase steadily, leading to a more rapid acceleration in sales profits.
5.4. The Impact of Sales Value on the Sales Strategies of New Energy Enterprises and Traditional Energy Enterprises
To investigate the relationships between sales value and the optimal sales price, optimal sales volume, optimal proportion of R&D expenses borne, optimal treatment technology level, and optimal profit, the parameter values are set as follows:
. The relationships between the optimal sales price, optimal sales volume, optimal treatment technology level, optimal profit, and sales value are illustrated in
Figure 5.
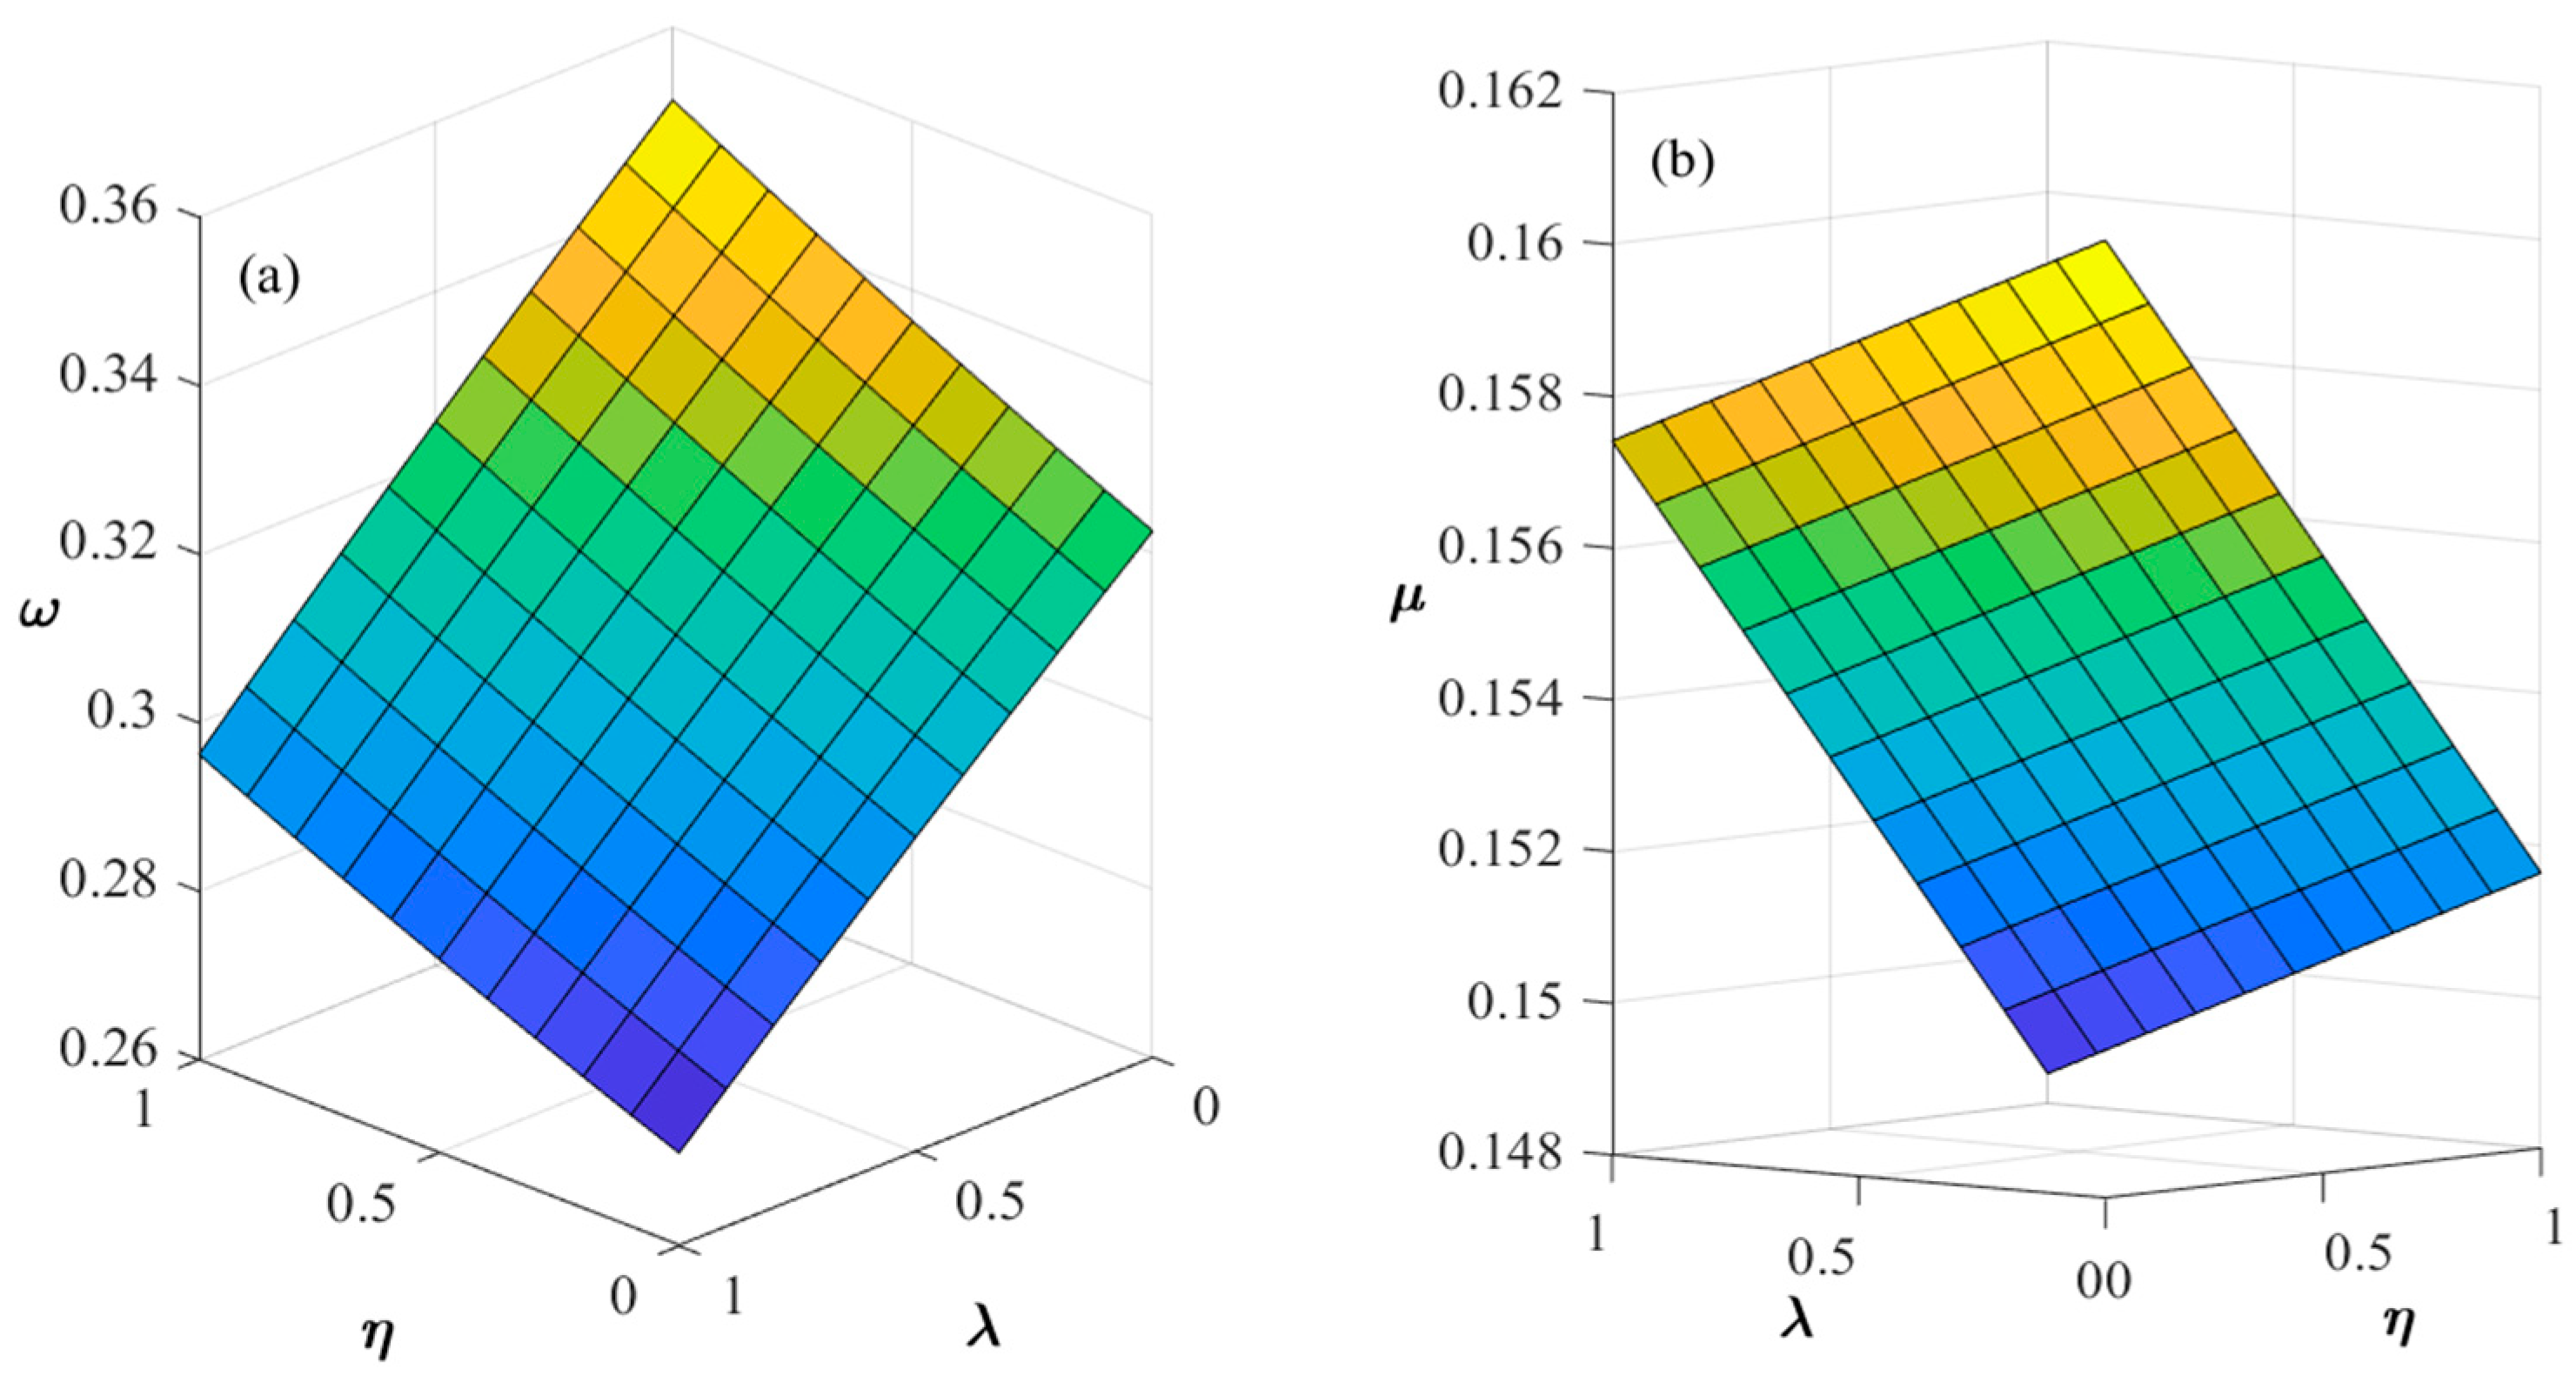
Figure 5a illustrates the impact of changes in the value of new energy on the energy sales prices of new energy companies and traditional energy companies. As observed from
Figure 5a,b, when the unit value of new energy increases, the energy sales prices for both new energy and traditional energy companies decrease. Typically, the value of a product is positively correlated with its price, meaning that as the value increases, so does the price. However, in this study, we consider technical factors where the value is positively correlated with the level of technology. An increase in the value of new energy indicates an advancement in technology levels, which in turn reduces the production cost per unit of energy. This cost reduction enables companies to lower their energy sales prices to secure greater profits. Since traditional energy companies and new energy companies are in competition, the reduction in new energy prices compels traditional energy companies to lower their prices as well. New energy companies invest significantly in technology costs and incorporate these costs into their products, leading to higher prices compared to traditional energy. As shown in
Figure 5a, the decrease in energy prices results in an upward trend in sales volume.
Figure 5c illustrates the impact of changes in the value of new energy on the production technology level and the proportion of R&D expenses borne by new energy enterprises. From
Figure 5c, it can be observed that as the value of new energy increases, the production technology level of new energy enterprises also improves gradually. Along with the enhancement of production technology, the proportion of R&D expenses borne by new energy enterprises tends to stabilize.
Figure 5d shows that when the value of new energy increases, the profit obtained by new energy enterprises exceeds that of traditional energy enterprises. This is attributed to the improvement in new energy technology, which drives up energy prices. Although the sales volume of new energy enterprises is lower compared to that of traditional energy enterprises, technological advancements create greater value and strengthen the competitiveness of new energy enterprises.
5.5. The Impact of Investment Cost and Production Cost on Sales Strategies
To investigate the relationships between investment cost and production cost with the optimal sales price, optimal sales volume, optimal proportion of R&D expenses borne, optimal treatment technology level, and optimal profit, the parameter values are set as:
. The relationships between the optimal sales price, optimal sales volume, optimal processing technology level, optimal profit, and investment cost and production cost are illustrated in
Figure 6.
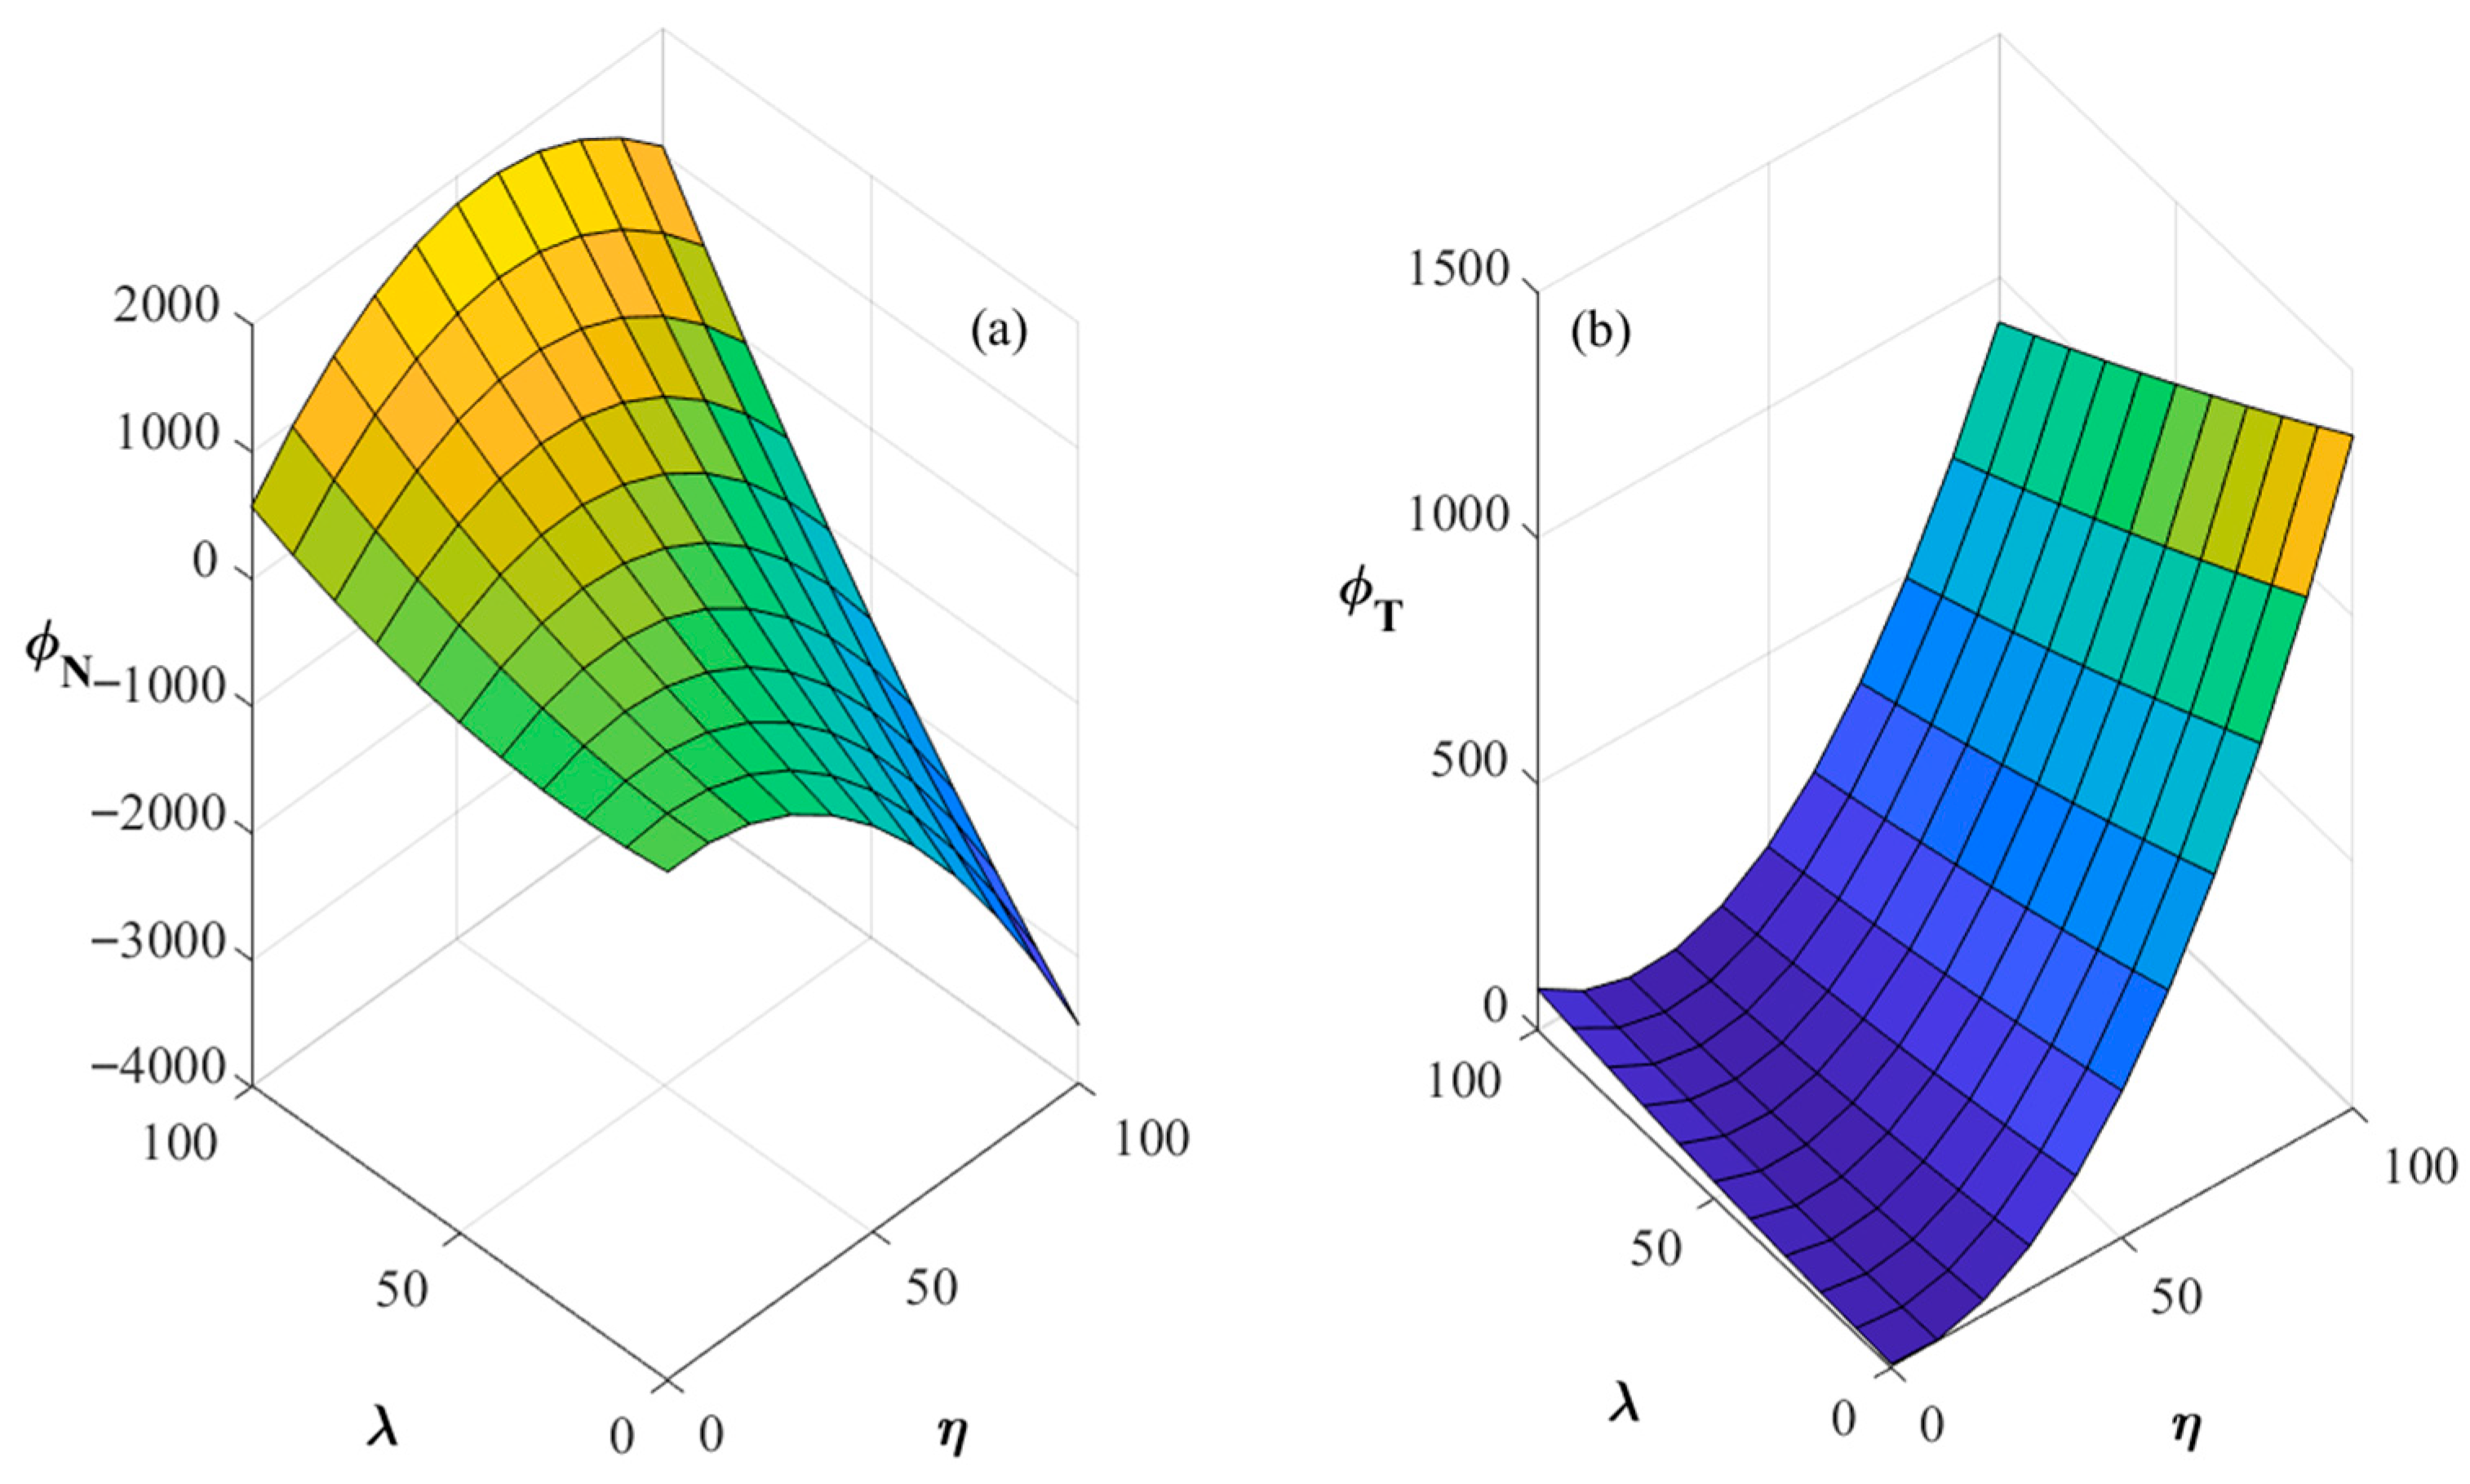
Figure 6 illustrates the impact of investment cost
and unit production cost of new energy
on the proportion of R&D expenses borne
and the technological level of new energy production
. As shown in
Figure 6a, the proportion of R&D expenses borne by new energy enterprises increases with rising investment cost and production cost. Meanwhile,
Figure 6b reveals that higher investment cost and production cost lead to a decrease in the technological production level. This decline primarily results from two factors: first, new energy enterprises, in order to protect their sales revenue, tend to raise product price, reducing the proportion of R&D expenses borne by traditional energy enterprises and ultimately causing a drop in technological production levels; second, these enterprises either absorb the higher cost themselves or endure reduced profits, thereby weakening their incentive to invest in R&D, which further diminishes the technological production level. Moreover, production processes are constrained by factors such as technology and labor, whose adjustments require substantial time and cost. Consequently, even minor fluctuations in production levels can have significant and lasting effects on a firm’s competitive advantage.
Sensitivity analyses in
Table 2 and
Table 3 highlight this relationship, with
Table 2 showing that higher production cost leads to a systematic decline in the average net revenue of new energy enterprises, reducing volatility but resulting in lower overall profit levels.
Table 3 reveals that, under global policies promoting new energy development, the expansion of market demand effectively mitigates efficiency fluctuations during the early stages of technological progress, ensuring stable expected returns.
Figure 7 illustrates the impact of investment cost
and the unit production cost of renewable energy
on energy price
and sales volume
. In
Figure 7a, the price of new energy increases with rising investment cost and unit production cost.
Figure 7b shows that the price of traditional energy also rises with increasing investment cost and production cost. This is because the increase in new energy production costs results in a corresponding rise in energy prices. Meanwhile, traditional energy companies face increased costs by investing in new energy, which affects their energy supply and leads to an upward trend in traditional energy prices. According to
Figure 7d, the increase in unit cost for new energy companies causes a rise in the demand for traditional energy.
Figure 7c demonstrates that as traditional energy companies increase their investment in new energy enterprises, it encourages persistent R&D investment by new energy companies to enhance their level of technical efficiency, thereby boosting the demand for new energy. The sensitivity analysis concerning sales prices and demand related to investment cost and production cost is summarized in
Table 4,
Table 5,
Table 6 and
Table 7. From the expected values in
Table 4,
Table 5,
Table 6 and
Table 7, it can be inferred that the continuous rise in cost will affect the market competitiveness of new energy companies, making it challenging to maintain policy subsidies and ultimately resulting in the loss of policy advantages.
Figure 8 illustrates the impact of investment cost
and the unit production cost of new energy
on the profit
of energy enterprises.
Figure 8a shows that the profits of new energy companies decrease with the rise in investment and unit production cost. This aligns with
Figure 4, revealing that the decline in production technology efficiency of new energy results in a reduction in the value of new energy produced by these companies. Concurrently, as the unit production cost increases, the marginal profit from new energy reduces, driving new energy firms into losses as production cost rises. Conversely,
Figure 8b demonstrates that the profits of traditional energy companies increase with higher investment and production costs. This is because the rise in unit production cost for new energy increases the market competitiveness of traditional energy firms, allowing their profits to increase. Furthermore, the investment cost for new energy will be augmented as traditional energy companies gain more market influence.
Sensitivity analysis of the impact of investment and production cost on company profits is presented in
Table 8 and
Table 9. According to the sensitivity analysis in
Table 8, strategically increasing investment cost and production cost in the short term can reduce profits. However, in the long term, as cost rises, expected profits also increase, reflecting the long-term benefits from cost investments.
Table 9 indicates that excessive investment by traditional energy companies in new energy ventures, particularly when the executive risk preference coefficient is high, can negatively impact the expected profits of traditional energy firms.
6. Conclusions
This paper constructs a noncooperative–cooperative biform game model for new energy enterprises and traditional energy enterprises under sales competition. It explores the issues of sales price competition, R&D technology collaboration, and cost-sharing when both types of enterprises participate in the development of new energy technologies. Furthermore, it analyzes the impact of government subsidies, competitive intensity, executive risk preference coefficient, sales value, investment cost, and production cost on the optimal strategies. The main conclusions of this study are as follows:
- (1)
When government subsidies for energy enterprises increase, there exists a negative correlation between the level of government subsidies and energy prices. The inverse relationship between price and sales volume implies that, under the backdrop of increased subsidies, energy sales volume tends to rise. Concurrently, this reduces the proportion of R&D expenses borne by traditional energy enterprises while enhancing the production technology level of new energy enterprises. As a result, the profits of energy enterprises undergo a rapid increase. It is essential to control the government subsidy threshold within the range (0, 1) to prevent excessively low subsidies, which may constrain enterprise R&D activities, or excessively high subsidies, which could lead to market competition imbalances and uncontrolled price fluctuations. By setting the subsidy threshold, the model incentivizes new energy enterprises to advance their R&D technological capabilities while accelerating the green transition of traditional energy enterprises. As competitive intensity increases, the improvement in the technological efficiency of new energy enterprises slows. Simultaneously, rising energy production cost causes a sharp increase in energy sales prices. Moderate increases in competitive intensity can expand market size, stimulate energy sales volume, and significantly boost the profits of energy enterprises. The government can use industrial competition policies to guide the competitive intensity within the range (0.2, 1), thereby avoiding the adverse effects of excessive competition, which could lead to market disorder in the energy sector. Furthermore, the government should encourage traditional energy enterprises to increase investments in new energy technologies to facilitate their energy transition. Through effective regulatory measures, the government can promote the green upgrading of the energy industry.
- (2)
When the executive risk preference coefficient of energy companies increases, raising energy sales prices shifts production cost onto consumers, thereby reducing their willingness to purchase energy. At the same time, the level of technical efficiency in production continues to improve, and traditional energy companies increase their proportion of R&D expenses borne. The increase in the executive risk preference coefficient prompts a rise in energy company profits. Based on these findings, this study recommends that policymakers regulate the executive risk preference coefficient within the range of (0.24, 1). Additionally, subsidies should be established to support collaborative R&D projects, thereby sharing the risks and costs associated with cooperative research and development between traditional energy and new energy companies, enabling technological innovation in R&D. When the sales value of energy increases, the level of technical efficiency exhibits a sharp upward trend, leading energy companies to lower energy sales prices. This, in turn, boosts consumer demand for energy products and contributes to an increase in energy company profits.
- (3)
When investment cost and production cost in the renewable energy sector rise, the unit price of energy sales increases for energy companies, while renewable energy enterprises are compelled to bear a higher proportion of R&D expenses borne. The increase in investment and production costs leads to a decline in production efficiency and technology levels, resulting in a reduction in the value of renewable energy and a subsequent decrease in profits for renewable energy enterprises. Furthermore, the rising cost of renewable energy drives a significant increase in the demand for traditional energy. Consequently, the market competitiveness of traditional energy companies surpasses that of renewable energy companies, boosting the market influence of traditional energy enterprises. As a result, the profits of traditional energy companies increase, thereby facilitating their transition efforts.
This study extends the innovation system framework to provide practical references for energy enterprises in selecting sales strategies during their green transition. By focusing on the interactive relationship between traditional energy enterprises and new energy enterprises, the research develops a game-theoretic model to analyze their strategic interactions. This exploration enhances both the theoretical framework and practical applications of game theory in the context of energy transition. However, the research reveals that energy enterprises are closely linked to the energy supply chain, which significantly influences their transition strategy decisions. Therefore, the focus of subsequent research is to build upon the findings of this study while incorporating a supply chain perspective to comprehensively analyze the impacts of government subsidies, competitive intensity, executive risk preference coefficients, and sales value on energy transition strategies.
