


Abstract
Manufacturing firms may lose profits after a servitization transition due to a mismatch between service offerings and demand, causing them to fall into the servitization paradox. The purpose of this paper is to address the reality of the mismatch between the heterogeneous needs of consumers and the levels of services provided by firms. This paper constructs a two-stage game model and proposes a servitization pricing strategy based on consumers’ willingness to pay. The results show that a premium pricing strategy yields optimal profits; a value-for-money pricing strategy is preferred only when consumers’ willingness to pay is extremely high. Further, we propose to optimize the level of demand matching by matching hidden demand. Considering the characteristics of services, this paper proposes programs based on experience and word-of-mouth marketing to achieve hidden demand matching. It was verified that based on Nash equilibria, the level of supply–demand matching and the profit of firms were improved. In practice, this research provides firms with guidance on servitization pricing strategies and offers a reference path to break the servitization paradox.
1. Introduction
With rapid technological advances and changing economic conditions, the manufacturer’s value chain is becoming less attractive [1,2,3]. Many manufacturers realize the value of providing services: services can provide more stable revenues and higher profit margins [4,5,6].
Broadly speaking, a manufacturing firm’s approach to expanding its offerings through services is referred to as servitization [7,8]. There are several reasons for implementing a servitization strategy in the manufacturing industry. First, services are more profitable than products and can create higher profit growth [9,10]. In addition, services can drive product sales and increase customer loyalty [11,12,13]. Services can also balance the impact of economic cycles on different cash flows [14,15]. Finally, services can meet the growing expectations of their customers: today’s buyers demand a higher level of service support [7,16]. A key feature of a servitization strategy is customer centricity. Firms not only offer products to their customers, but also a wider range of more tailored solutions. Attention has gradually shifted to value in use, which inevitably accentuates the role of the customer. Vargo and Lusch [17] pointed out that experience and perception are crucial for customers in a servitization framework. Servitization also has a value-creating nature, with valuable services stemming from capturing the hidden demands of customers [18,19].
However, not all manufacturing firms that implement servitization gain a competitive advantage, and launching a service business may have a negative impact on firm performance, a phenomenon known as the “servitization paradox” [20]. Neely et al. [21] found through empirical research that while servitization firms are typically larger in terms of sales revenue, they are also less profitable overall than pure manufacturing firms. In other words, they fall into the servitization paradox—servitization firms generate higher revenues but lower profits than pure manufacturing firms. For example, in the case of Comau Incorporation, its service business resulted in an increase in the share of service revenues from 14% to 19% in three years, but the firm’s revenues declined by about 29% over the same period [22]. Similarly, Intel’s USD 150 million web-based services division was discontinued after a few years [23], while Siemen’s service division (Siemens Business Services) was largely unprofitable [24].
The servitization paradox arises from a mismatch between supply and demand [20,25]. Benedettini et al. [26] studied a sample of 129 insolvent manufacturers (75 serviced and 54 non-serviced) and found that demand fluctuations, heterogeneity of customer demand, and uncertainty of demand chain put firms at risk of insolvency. A key issue is the “service perception gap”: the services developed by firms often fail to gain customer recognition, resulting in an unwillingness to pay. When firms make substantial investments in services that customers are not prepared to purchase, the resulting supply–demand mismatch erodes corporate profits and manifests as the servitization paradox. Making the services offered accurately match the demands of customers has become the key to cracking the servitization paradox. The degree of supply–demand matching is closely linked to price. In the face of heterogeneous customer demand, a service pricing strategy based on Nash equilibria plays a fundamental role in realizing the matching of supply and demand [27]. Firms should pay attention to the impact of servitization on consumers’ willingness to pay and refine their pricing strategies to effectively match customer demand. Beyond pricing strategies, what other approaches can optimize demand matching and offer a pathway to crack the servitization paradox?
To address the above questions, this study constructs a two-period model to investigate how servitization firms can improve the matching of supply and demand. Consumers in this model have different levels of perceived value of servitization, and servitized products offered by manufacturers can change consumers’ willingness to pay. The results indicate that by observing market reactions, a firm can select an optimal pricing strategy to achieve a Nash equilibrium. A value-for-money pricing strategy is optimal only when the increase in willingness to pay is sufficiently high; otherwise, a premium pricing strategy is preferable. Further, we noted that the Nash equilibrium achieved through optimal pricing ignores potential customers. To address this, we propose optimizing demand matching by identifying hidden demand. Since service value is experiential and can be spread as word of mouth (WOM), we analyze both experiential and WOM marketing strategies. For WOM marketing, we propose a “Quota Discount Mechanism” to balance marketing effectiveness with cost control. The results demonstrate that this mechanism can help firms achieve higher profits under a premium pricing strategy. The “Experience in Exchange for Markets” strategy has broader applicability for most firms, whereas the “Quota Discount Mechanism” is suitable only for firms with high-quality service offerings and a highly loyal customer base.
A mismatch exists between the heterogeneity of customer demands and the services provided by the firm, and focusing on the matching of hidden demands is the solution proposed in this study. Focusing on the nature of service and then proposing to tap hidden demand and expand the market through experience and WOM is what distinguishes this study from the existing literature. Through hidden demand matching, firm profits are further enhanced on the basis of Nash equilibria. The results of this research are a good solution to the servitization paradox. This reveals that firms could pay attention to hidden demand in the market and realize matching levels of supply and demand by transforming hidden demand into explicit demand.
The rest of this paper is organized as follows. Section 2 reviews the related literature. Section 3 describes the model, assumptions, and research framework. Section 4 analyzes the equilibrium results of the two models and the applicability of pricing strategies. In Section 5, we propose converting potential customers into sales, and offer two programs. Section 6 compares the scope of application and profitability of the two programs and analyzes the reasons why they can solve the servitization paradox. Section 7 presents the conclusion. For ease of exposition, all the proofs are provided in Appendix A.
2. Literature Review
The literature related to this study is distributed in three directions: servitization and the servitization paradox, demand matching, and experience and WOM marketing.
2.1. Servitization and Servitization Paradox
Both the research and practice communities are increasingly focused on the topic of servitization [5,28]. The term servitization is both deep and comprehensive, its concept being difficult to define with precision [29,30]. Based on the findings of 154 research articles on servitization, Brax and Visintin [31] concluded that servitization is a shift from a traditional product-based business to one that is more focused on strategic and operational services. Firms competing through services, not just products, is a transformational process that manufacturing companies must undergo [28,32]. Spurred by revenue growth, servitization of manufacturing is growing rapidly on an international scale [33,34].
However, Gebauer et al. [20] developed the concept of the “servitization paradox” and argued that “where such a paradox exists, large investments in expanding service operations can lead to increased service provision and higher costs without generating correspondingly higher expected returns”. Empirical studies have shown that there is a non-linear relationship between servitization and firm productivity [35,36]. The empirical results of Kastalli et al. [37] indicate that there is a positive but non-linear relationship between the scale of service activities and profitability: although the initial service level will bring a rapid increase in profitability, the initial benefits are limited; only when the investment in service capabilities is transformed into economies of scale can the growth of profitability be realized. The results of research from Zhejiang Province, China [38], showed that there is a U-shaped relationship between servitization and firm per capita profit; only when the degree of servitization exceeds a certain threshold will its effect on improving firm performance be more significant. If manufacturers make mistakes in their servitization transformation decisions, they may fall into the “servitization paradox”. Given the risks involved, could servitization be a non-essential option? Wang et al. [39] found that manufacturers tend to adopt more servitization strategies when faced with imitation and coercive pressures. Kohtamäki et al. [40] pointed out that servitization is crucial for generating profits from a sustainable development perspective. In addition, Kohtamäki et al. [41] also showed that manufacturing firms actually have little opportunity to choose between products and services. Servitization is a long transformation process for the manufacturing industry, which requires manufacturers to shift from product-based competition to service-based competition and also requires corresponding internal organizational changes [42,43]. This transformation may take several years and requires manufacturers to balance the conflicting needs of their product and service businesses [44]. Therefore, servitization is an inevitable path for the manufacturing industry.
Numerous empirical studies have demonstrated the inevitability of servitization and explored the servitization paradox and its roots. However, no research has yet analyzed from a theoretical model perspective how firms make decisions to avoid the servitization paradox, and there is a lack of analysis on firms’ expected profitability.
2.2. Demand Matching
Activating market demand and expanding corporate profits based on the service chain is the ideal vision of a servitization firm [45]. Oliva and Kallenberg [46] pointed out that once a service organization is established, it becomes a fixed cost, and the main driver of profitability is capacity utilization. Consequently, servitization firms face the central marketing objective of maximizing the reach of their service offerings. Cheng et al. [47] also emphasized that the supply and demand matching problem of manufacturing services is becoming increasingly important due to the stability of service supply and the instability of service demand. On the demand side of services, for example, insufficient customer acceptance, increased service costs, and rising risks can all lead to a situation of service oversupply [46,48]. To avoid falling into the “servitization paradox” due to rising service costs but insufficient customer willingness to pay, firms must improve their marketing capabilities, strive to match demand, and find new customers.
With the introduction and application of information technology in manufacturing, technologies such as artificial intelligence, intelligent agents, service portfolios, and platforms have been applied to optimize supply and demand matching [47]. For example, Li et al. [49] used a product deterioration model to characterize the generation of uncertain demand and matched demand with predictive and proactive service strategies; Tao et al. [50] developed a cloud-based manufacturing service supply and demand matching simulator; Swinney [51] pointed out that when selling products to a consumer group with forward-thinking, uncertain product valuation, and high heterogeneity, rapid response production practices can achieve supply and demand matching. However, research on how firms use marketing decisions to match and enhance demand is extremely limited.
Many studies attempt to achieve precise demand matching through technologies, but research on firms’ marketing strategies is scarce, and existing research neglects the discovery and matching of hidden demand.
2.3. Experience and WOM Marketing
Service and experience have a natural intrinsic connection. Unlike with solid products, Bowen [52] points out that most of consumers‘ feelings about services stem from the experience. The experience process generates subjective and dynamic feelings and evaluations of the service [53,54,55]. Tynan et al. [56] proposed an experiential marketing theoretical model, dividing the experiential consumption process into three stages, pre-experience, core customer experience, and post-experience, emphasizing the ways to create value in the three stages of the consumption experience. Grönroos et al. [57] further pointed out that experiential marketing conforms to the logic of the value presentation of service products. Customer experience significantly affects customers’ willingness to pay for service products, from which brand owners can gain more benefits.
WOM plays an important role in product sales. Katz et al. [58] first discovered that communicators can influence others based on their own feelings and experiences and convey their views to the audience through WOM communication. WOM marketing has been studied [59] and applied [60] by scholars and businesses in both academia and practice. Studies by Hu et al. [61] and Narayan et al. [62] have shown that consumers are more inclined to listen to the opinions of their peers than to those of company marketers. Especially with the rise of social networks, WOMs are often more effective than other non-personalized marketing campaigns (such as advertising) [63,64]. The significant sales-boosting effect of WOM marketing has been proven [65], for example, when HTC launched its Windows smartphone, just 1000 user-written product reviews reached 234,000 consumers; when Dunkin’ Donuts launched its low-fat latte, a marketing campaign with 3000 users reached 111,272 consumers in just three months, resulting in a 26% increase in sales. Studies have also shown that WOM marketing can significantly improve customer conversion rates [66,67] and always bring about a quality improvement in helping people evaluate products they are already familiar with [68].
The marketing effect of WOM based on experience has great potential to increase service demand; however, few scholars have paid attention to the close connection between service and experience and WOM marketing.
In summary, existing research has not paid sufficient attention to the demand matching problem after firms’ servitization transformation, lacks research on firm strategies, and neglects experience and WOM marketing, which are closely related to services. Based on a game-theoretic model, this research considers the impact of services on willingness to pay and provides decision support not only in terms of pricing strategy but also further exploring how to optimize supply and demand matching by identifying hidden demand through experience and WOM marketing.
3. Model
3.1. Research Questions and Framework
This paper aims to conduct the following three studies by constructing a two-stage optimization model. (1) We will analyze the optimal pricing strategy for a servitization firm. (2) We will propose effective marketing mechanisms and discuss the effects on optimizing supply and demand matching and identifying hidden demand. (3) We will discuss the optimal pricing and marketing decisions for servitization firms.
This paper will proceed with the following approach: First, we will construct and analyze a benchmark model to study the product pricing and profits of firm. Then, a servitization model will be built, discussing how the additional value of services influences the firm’s pricing strategy under a Nash equilibrium, including value-for-money pricing and premium pricing. Next, two marketing mechanisms—experiential marketing and WOM marketing—will be proposed, and we will discuss how these mechanisms capture hidden demand and whether they can increase profits. Finally, the two pricing strategies and two marketing strategies will be compared and analyzed to provide optimal decision-making guidance for firms.
3.2. Model Description and Assumptions
We consider a supply chain consisting of a firm (manufacturer) and consumers, and the firm operates in a non-competitive environment.
In the benchmark model, the firm produces physical products and sells them to consumers. The unit production cost is , and the selling price is , where .
In the servitization model, the firm brings its service to a certain level by making incremental investments in technology and assets and then sells products and product–service packages, while services cannot be sold separately. If a consumer purchases a product–service package, the firm is responsible for post-sale service operations. The price of the product–service package is , and . When the firm does not adopt a marketing strategy, it only makes decisions on pricing; when the firm adopts a marketing strategy, it takes complementary measures in both stages. The firm‘s profits in the two stages are and , respectively. In the second stage, experiential marketing and WOM marketing are denoted by the superscripts and , respectively.
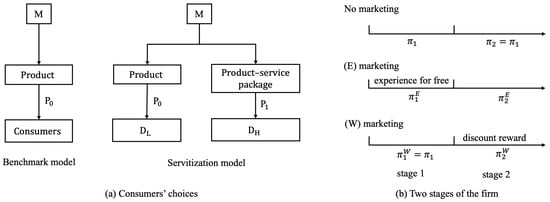
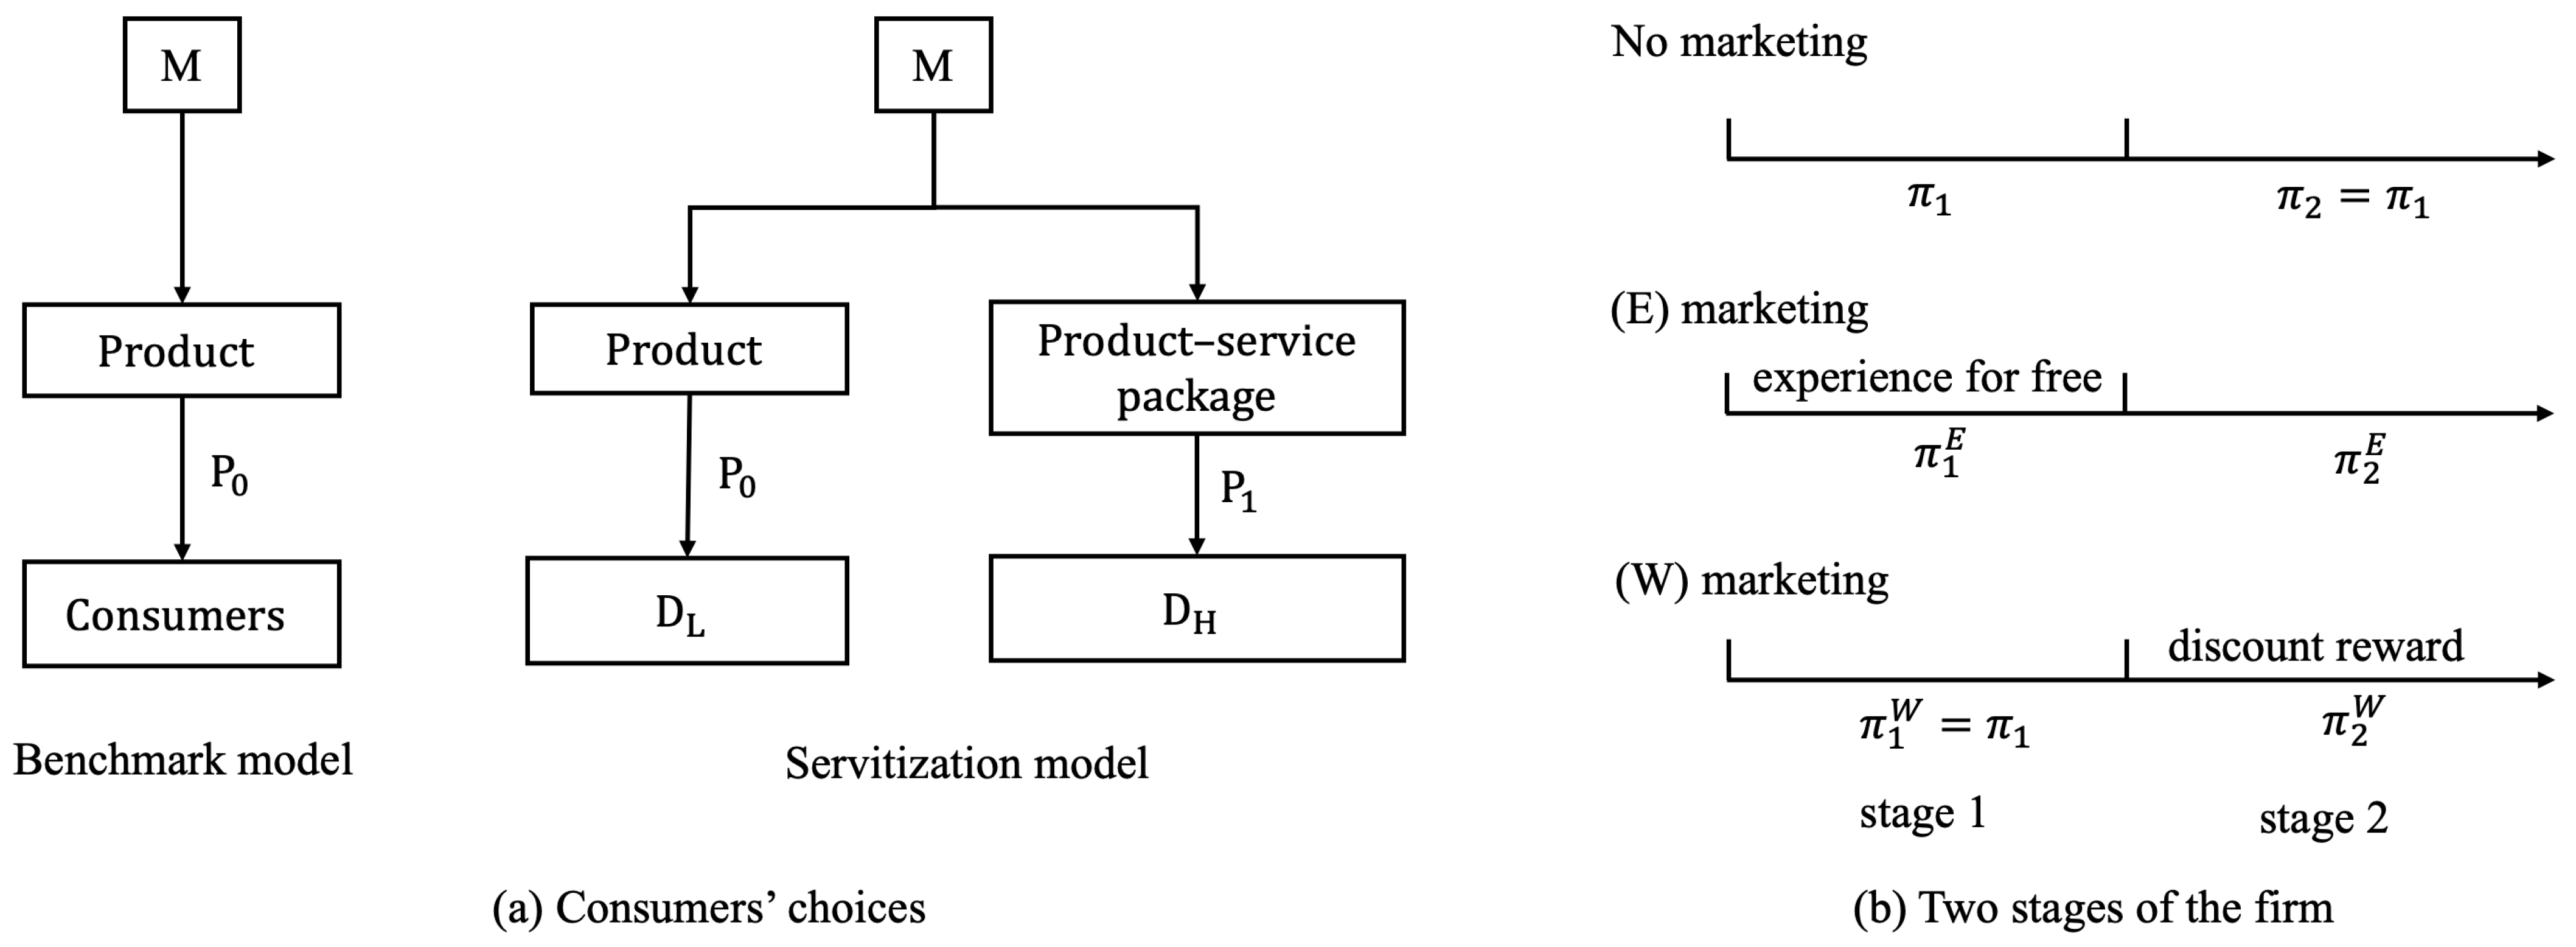
Figure 1 illustrates consumer choices in the two models, as well as the actions taken by the firm at each stage. The following are the key assumptions of the model.
Figure 1.
(a) Consumers’ choices in two models. (b) Schematic of the firm without marketing strategy and with marketing strategy.
- (1)
- Willingness to Pay: The number of consumers normalized to 1 and willingness to pay is [69]. The obeys a uniform distribution, [70]. In the servitization model, the perceived value of a service increases the willingness to pay of some consumers. Let represent the additional value these consumers gain from service provision, and their willingness to pay becomes , where .
- (2)
- Consumer Types: In the servitization model, the consumer base diverges. With reference to existing research, there is a segment of consumers who are forward-looking and anticipatory and who are perceptive [71,72]. With the launch of a service, these consumers are able to quickly recognize the value of the service and are willing to pay for the service before experiencing it. Other consumers do not have strong perceptual abilities; they do not perceive the service of the firm and will not pay for the service until they experience it. Therefore, consumers are categorized as follows: highly perceptive consumers are denoted by , with a willingness to pay of ; general consumers are denoted by , with a willingness to pay of . The total number of the two groups of consumers is still 1. The classification here is just a differentiation of the perceptual capabilities of consumers. For example, a highly perceptive consumer may still choose to buy only the product because of the high price of the service rather than the product–service package.
- (3)
- Firm Costs: The firm’s service investments result in both fixed and variable costs [73,74]. Factors such as fixed asset investments are not discussed in this study. This study focuses on demand matching, so the model considers the operating costs associated with the amount of demand, i.e., the variable costs. In reference to previous research [75], data volume complexity leads to a greater degree of maintenance investment, and an increase in the volume of services generates higher operation and maintenance costs. Therefore, this paper defines the operation cost of a service as [76]. We assume to ensure that costs are controllable. For simplicity, in the model, we set The is the cost coefficient of the operating service, . The is the demand of product–service packages.
- (4)
- Pricing strategy: In the servitization model, the firm has two pricing strategies: value-for-money pricing and premium pricing. When , the price of the product–service package is lower than the consumer’s valuation based on the product price, which is value-for-money pricing, denoted by ; when , the price of the product–service package is higher than the consumer’s valuation based on the product price, which is premium pricing, denoted by .Table 1 summarizes and explains the key variables of this study.Table 1. Variables and descriptions.
4. Equilibrium Results and Pricing Strategies
First, we will solve for the equilibrium result of the benchmark model. Then, we will solve for the two pricing strategies of the servitization model and explore the optimal pricing strategy.
4.1. Benchmark Model
For consumers, the utility has to be satisfied before the product is purchased. Consumers with willingness to pay will buy the product, i.e., demand .
The firm’s profit is
We obtain that , and .
4.2. Value-for-Money Pricing Strategy
With , the increase in the pricing of servitization is less than the increase in the willingness to pay that servitization brings to . This implies that the degree of quality improvement is higher than the degree of price improvement, which is manifested in the fact that servitization provides more value for the same amount of money.
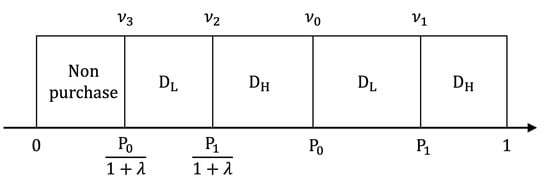
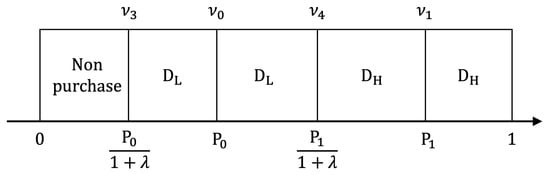
For , their willingness to pay is . If , one will choose to purchase the product, obtaining . For , if , one will choose to purchase the product–service package, obtaining . If , it indicates that even though the firm’s servitization actually provides value-for-money benefits and the willingness to pay of has increased, consumers still believe that the servitization will fail to satisfy them and choose to purchase the product, obtaining , as illustrated in Figure 2.
Figure 2.
The choices of the consumers when P1 < P0 (1 + λ).
Lemma 1.
The firm expands the total market demand from
to through servitization.
Servitization is an effective means of expanding markets. Servitization has increased the willingness to pay of some consumers, expanded market share, and lowered the willingness to pay threshold for consumers to purchase products.
Corollary 1.
The larger enhancement makes a part of highly perceptive consumers with lower base willingness to pay
choose to buy product–service package.
Between the two regions of , the demand for emerges, which is the part of the population that is concerned with the price–performance ratio of servitization in . Servitization enhances the willingness to pay of . The demand for the product is , and the demand for the product–service package is .
The firm’s profit is
Lemma 2.
Optimal pricing for the firm is , and .
Given that , we obtain that , and
Proposition 1.
When , the firm can adopt a value-for-money pricing strategy of .
Firms need to observe the extent of willingness to pay in , and then determine whether they can adopt a value-for-money pricing strategy. Only by raising consumers’ willingness to pay to a sufficiently high level will there be consumers who favor the product–service package because of their focus on value for money. If the servitization outcome is not inherently attractive enough to raise the willingness to pay of customers, then value-for-money pricing is not available.
4.3. Premium Pricing Strategy
With , the increase in the servitization pricing is greater than the increase in the willingness to pay that servitization brings to . The quality enhancement fails to be as large as the price enhancement, showing that servitization generates a premium through the product–service package.
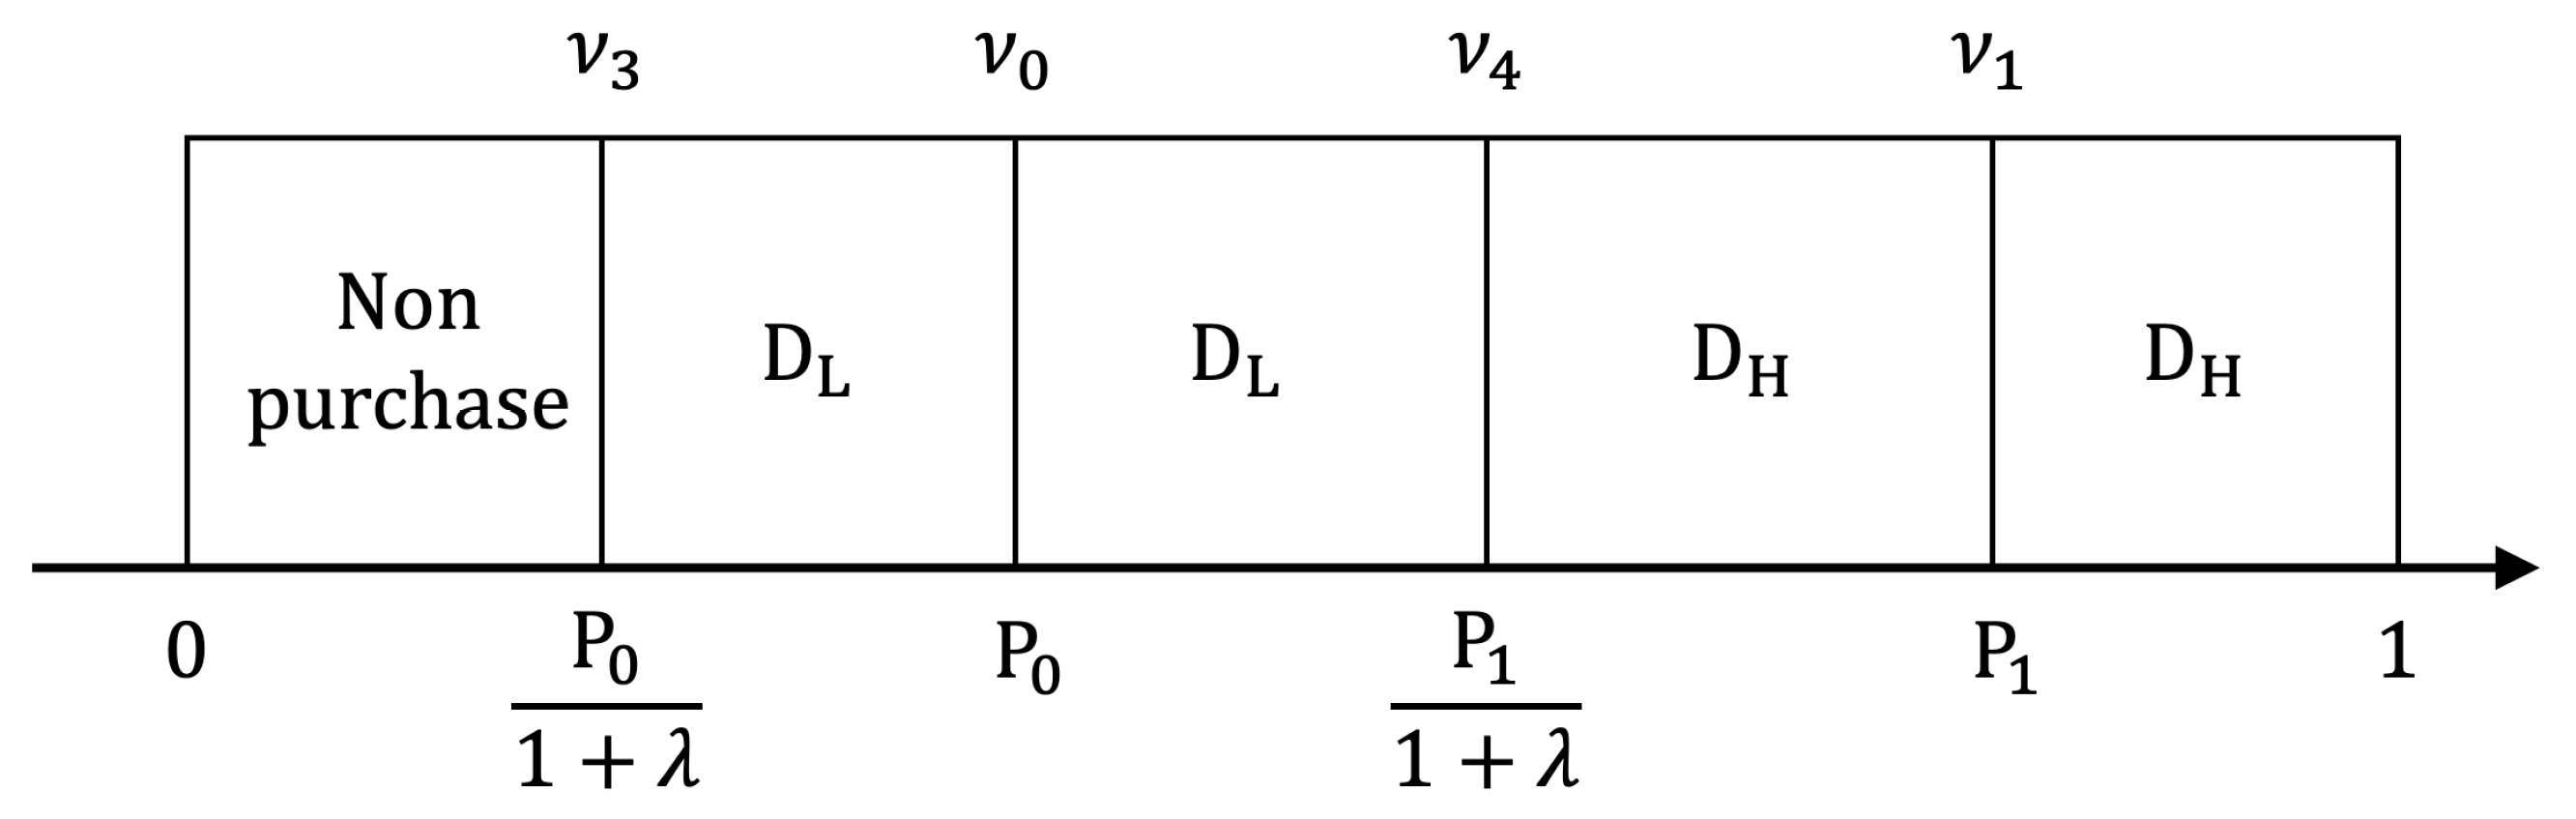
For with willingness to pay , if , they will choose to purchase the product, obtaining . For , if , they will choose to purchase the product–service package, obtaining , and if , it indicates that the firm’s product–service package has a high premium, and although the willingness to pay of has increased, they still consider the price of product–service package to be too high, and finally choose to purchase only the product, obtaining .
As shown in Figure 3, despite premium pricing, servitization still helps the firm to expand the market with the same total market share as in Section 4.2. In this strategy, the demand for the product is and the demand for the product–service package is .
Figure 3.
The choices of the consumers when .
Those highly perceptive consumers whose willingness to pay is significantly increased by servitization can be filtered out through premium pricing. According to Figure 2 and Figure 3, consumers who chose the product–service package for its value for money in Section 4.2 chose to buy only products in this section. The premium pricing strategy raises the threshold for consumers to choose the product–service package. Consumers with higher base willingness to pay remain willing to accept the premium price, and this pricing strategy filters out consumers whose willingness to pay is significantly higher due to servitization.
The firm’s profit is
Lemma 3.
Optimal pricing for the firm is , and .
Given that , we obtain that .
Proposition 2.
When , firms can adopt the premium pricing strategy .
A small increase in implies that firms can make optimal profits by premium pricing, with great scope for profit improvement, and that the main customers are those consumers who have an extremely high willingness to pay in their own right. As rises, consumers whose willingness to pay increases significantly due to servitization will choose to accept the premium. However, when there is a huge increase in consumers’ willingness to pay, the firm’s pricing needs to reach a fairly high premium, which in turn will hurt the firm’s profitability.
4.4. Servitization Pricing
In the range of , we compared the profits of the two pricing methods and obtained . So, we can obtain the equilibrium result for pricing.
Theorem 1.
The optimal pricing of the product–service package can be formulated as follows:
The service introduced by the firm’s servitization transformation have an impact on consumers’ willingness to pay, and the observed by the firm is informative for pricing decisions. When , consumers are not willing to pay more for the firm’s services. Pricing strategies using value for money cannot be optimal, and firms need premium pricing to achieve optimal pricing. In the range of , consumers’ willingness to pay for product–service packages has increased significantly, and the firm can realize optimal pricing either by adopting value-for-money pricing or premium pricing. However, premium pricing can lead to higher profits. Further, when , this implies that the firm’s product–service package has created a significant willingness to pay among consumers. If pricing continues to increase, the premium will be incredibly high, but it still will not match the increased willingness of consumers to pay; rather, it will be damaged by the high premium. Therefore, the value-for-money pricing strategy should be adopted at this stage to optimize pricing. Note that the value for money at this point is relative to the extremely high , and the pricing is actually still high.
5. Hidden Demand Matching
Servitization firms can maximize profits by achieving optimal pricing based on Nash equilibria, according to consumers’ willingness to pay. In reality, some consumers are interested in services but refuse to pay because they do not perceive the value of service. This portion of potential consumers cannot be filtered out by pricing strategies, which means that the firm loses some of these hidden consumers. Hidden demands are ignored and there is a mismatch between the services provided by firms and the demands of customers. This section will explore how to convert potential consumers into loyal service customers through experiential and WOM marketing, further answering the question of whether matching hidden demand can lead to higher profits.
5.1. Theoretical Foundations
The value of the customer experience deserves particular attention from servitization firms [77,78]. Customers are more likely to perceive the value of a service comprehensively after they have experienced the service, and therefore have paid for it. WOM marketing has a significant impact in facilitating decision-making and additional sales [79,80]. According to Berry and Beltman [81], customer education is crucial for turning customers into marketers, which helps to build and maintain a strong brand. Effective customer experience and WOM marketing can help potential customers complete the process of “awareness, recognition and loyalty”, with the ultimate goal of converting potential customers into sales.
Assuming that there are consumers in with the proportion , ; in both cases, and . They do not actively perceive the value of the service, and will only recognize the value of the service and become service customers after experiencing it for themselves or receiving WOM marketing from other consumers who have already purchased servitized products. We believe that this percentage of potential consumers will definitely be converted into service customers once they have embraced experiential or WOM marketing.
5.2. Experience in Exchange for Market (E)
Bowen [52] pointed out that customers perceive the value of the service through experience, which is a subjective feeling. Customers decide whether to buy the service or not based on their experience [54,57]. Therefore, the program calls for a free product–service package experience for customers who only purchase the product. In addition, note that the subject of the free trials in this research is the product–service package. If the customer is not satisfied with the service, they only need to cancel the service or not use the service. Therefore, unlike in a free trial for physical goods, there is no issue of return in this scenario. The process is divided into two stages. In the first stage, the firm provides product–service packages free of charge to customers who only buy the product, which means that customers who only buy the product enjoy the product–service package at the price of . And the consumer charges for choosing the product–service package remain . In the second stage, after the trial, there will be customers who will change to buy the product–service package. In this stage, the firm charges all customers normally. The demand for the product is reduced to , while the demand for the product–service package becomes . The total two-stage profit of the firm is
and , . Under the value-for-money pricing strategy, we can substitute and . The difference between the profit of the (E) program and the profit of not implementing the program is . Under the premium pricing strategy, and . It can be obtained that . We compare the profits of the two pricing strategies under this program in Figure 4.
Figure 4.
Profit comparison of two pricing strategies under (E) program.
As shown in Figure 4, by comparing and (comparison process is shown in Appendix A), it can be seen that always holds true. This implies that the pricing strategy with the largest profit improvement under the (E) program is premium pricing.
Proposition 3.
As increases, there is a larger scope for profit improvement in the firm.
As increases, profits also improve. Compared to before the implementation of this program, a firm can always earn higher profits by using premium pricing strategy as long as is satisfied. When , a value-for-money pricing strategy is required, and the firm’s profits may decrease after the implementation of the (E) program. Given that this program sacrifices the huge operating costs of the first stage for the increased sales of the second stage of a serviced product that sells at a higher price, if fails to make up for the loss in the first stage, then a two-stage profit loss is formed.
In summary, the (E) program can help firms convert potential serviced customers into loyal serviced customers. By expanding demand based on the Nash equilibrium of pricing and demand, the market share of service products is increased, and hidden demands are matched. Under the condition that , the premium pricing strategy can further improve profits.
5.3. WOM Marketing and Discount Mechanisms (W)
This program attempts to match hidden demand through WOM marketing to potential customers. Based on existing research, consumers are more willing to listen to their peers’ opinions [61,62]. Referring to the experience of successful WOM marketing cases [58,65,66], the implementation of this program relies on communicators to disseminate their opinions about product–service packages to recipients. Therefore, communicators are naturally selected from consumers who have already purchased the product–service packages. In order to incentivize these consumers to engage in WOM promotion, the firm needs to give them some discounts as incentives [67]. The whole process is divided into two stages: in the first stage, the firm takes no action; in the second stage, the firm rewards those who have played a role in WOM marketing (those who purchased product–service packages in the first stage) with price discounts. In the second stage, there will be customers who switch to purchasing product–service packages. The demand for purchasing only the product is reduced to , and the demand for product–service packages is .
Conducting effective WOM marketing can be considered to cost almost nothing, yet it can lead to discounts when product–service packages are purchased again in the second stage. So, there is ample motivation for WOM marketing for this portion of customers. For a firm, price discounting is equivalent to paying a portion of the cost. The discount mechanism should balance the effectiveness of WOM marketing with the need to reasonably control costs.
5.3.1. Two Ineffective Discount Mechanisms
For the two commonly adopted discount reward mechanisms, we analyzed here whether they are beneficial to firms in terms of enhancing WOM marketing effectiveness and cost control.
Mechanism 1.
The firm offers a price discount for each customer who engages in WOM marketing, i.e., the price of a second stage of products and services is .
Lemma 4.
Under Mechanism 1, each customer who engages in WOM marketing can choose its marketing effort arbitrarily, and any value in may be the WOM marketing effect in some pure strategy Nash equilibrium.
According to Lemma 4, mechanism 1 is inefficient. There are an infinite number of Nash equilibria with the same WOM marketing effect, and their effect is independent of the discount reward . The optimal response of each customer depends on the optimal marketing results achieved by other customers. Thus, the extent to which customers engage in WOM marketing efforts depends on how well they anticipate the strategies of other customers. Firms cannot predict what the equilibrium will be, nor can they manipulate the effectiveness of WOM marketing by setting a value for .
Mechanism 2.
Only if the effect of WOM marketing is that all the potential consumers, , purchase product–service packages in the second stage will the firm offer a price discount
to each customer who engages in WOM marketing.
Lemma 5.
Under mechanism 2, each customer who engages in WOM communication chooses the highest level of effort in order to receive a discount. The WOM marketing effect of is the equilibrium result after the customer’s effort.
Compared to mechanism 1, mechanism 2 can motivate customers to do their best to accomplish WOM marketing, improving the effectiveness of WOM marketing to the desired level. However, rewarding all customers who choose servitization in the second stage with a discount could be costly. Moreover, even though every customer is putting in the highest level of effort, customers’ highest levels of effort are not exactly the same. So, giving the same discount is not a reasonable way to reward them. In conclusion, mechanism 2 can help firms achieve the desired WOM marketing results, yet it cannot effectively control costs.
Is there a mechanism that can realize both WOM marketing effectiveness and cost control?
5.3.2. Quota Discount Mechanism
Here, we propose the “Quota Discount Mechanism”. The steps for this mechanism are as follows.
- (1)
- The firm sorts the customers according to their level of effort, divided into levels.
- (2)
- The firm rewards the group of customers with the highest level of effort with a discount of ; it then rewards the other levels of customers with discounts of , in the order until all customers are rewarded with discounts.
- (3)
- If the last group of customers exceeds the discount quota, then the firm determines which customers in the group receive the discount incentive by drawing lots.
- (4)
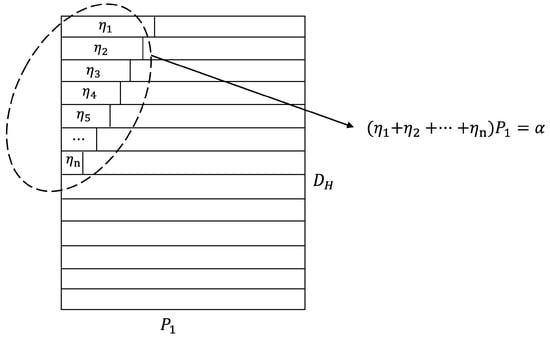
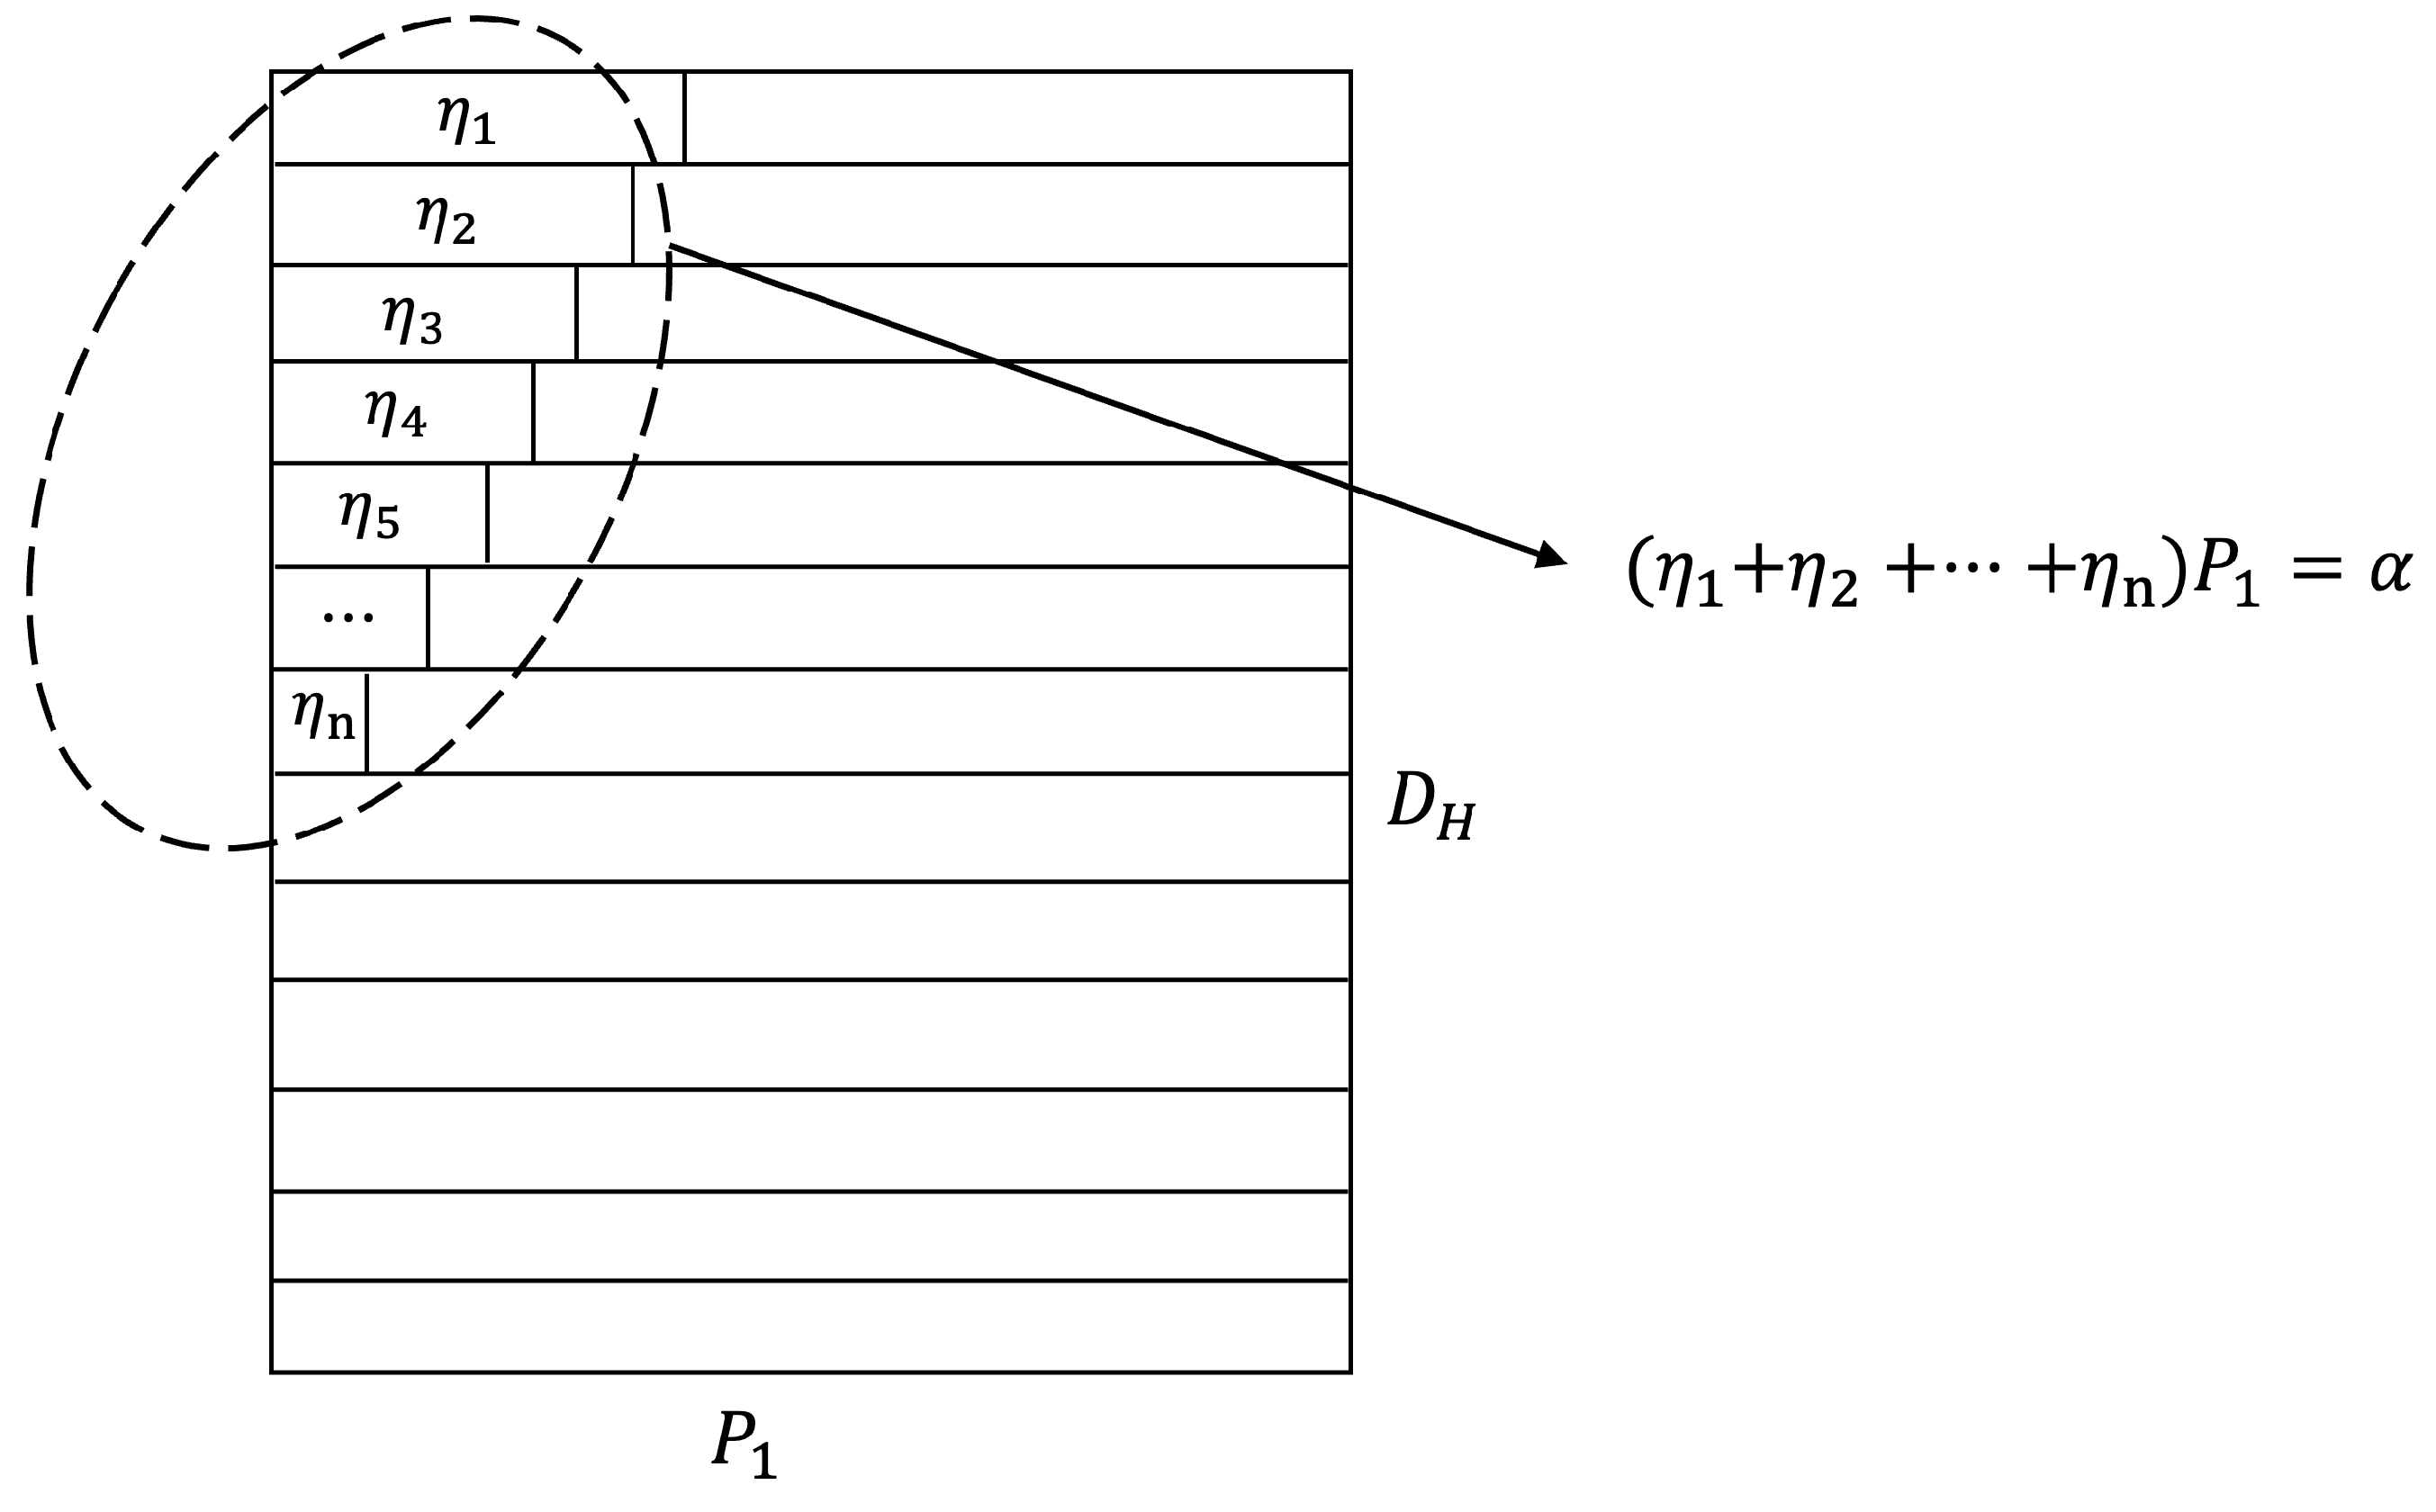
- The discounts add up to (, as shown in Figure 5.Figure 5. The process of accumulating discounts in the “Quota Discount Mechanism”.
Lemma 6.
Under the Quota Discount Mechanism, all pure strategy Nash equilibria have the same WOM marketing effect for > 0.
Quotas limit the number of customers who will be rewarded with discounts, so the firm can control costs at a macro level. In addition, the number of quotas gives rise to competition among customers, so these customers have a strong incentive to engage in effective WOM marketing. With the proper quota and discount settings, a firm can achieve the desired WOM marketing effect at a relatively small cost. Researchers have analyzed the application of the “Quota Discount Mechanism” in other fields [69,82], and this mechanism is an effective way to achieve hidden demand matching.
The total profit of the firm in two stages is
and , . Under the value-for-money pricing strategy, we substitute and . The difference between the profit of implementing the (W) program and the profit before it is implemented is . Similarly, under the premium pricing strategy, and . It can be obtained that .
Do the profits of firms increase after the implementation of the “Quota Discount Mechanism”?
Proposition 4.
By precisely controlling the cost () and the market (), a firm can obtain a value of , which ensures that the Quota Discount Mechanism with the value of can further improve the profit.
Based on the expressions for and (comparison process is shown in Appendix A), we can learn that the discount is the key variable that affects the degree of profit improvement. The larger the set by the firm, the lower the profit enhancement will be.
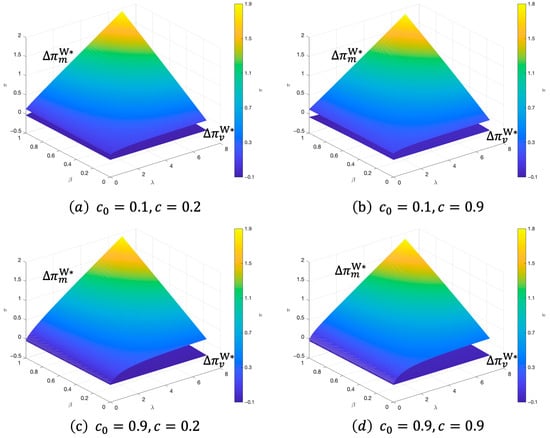
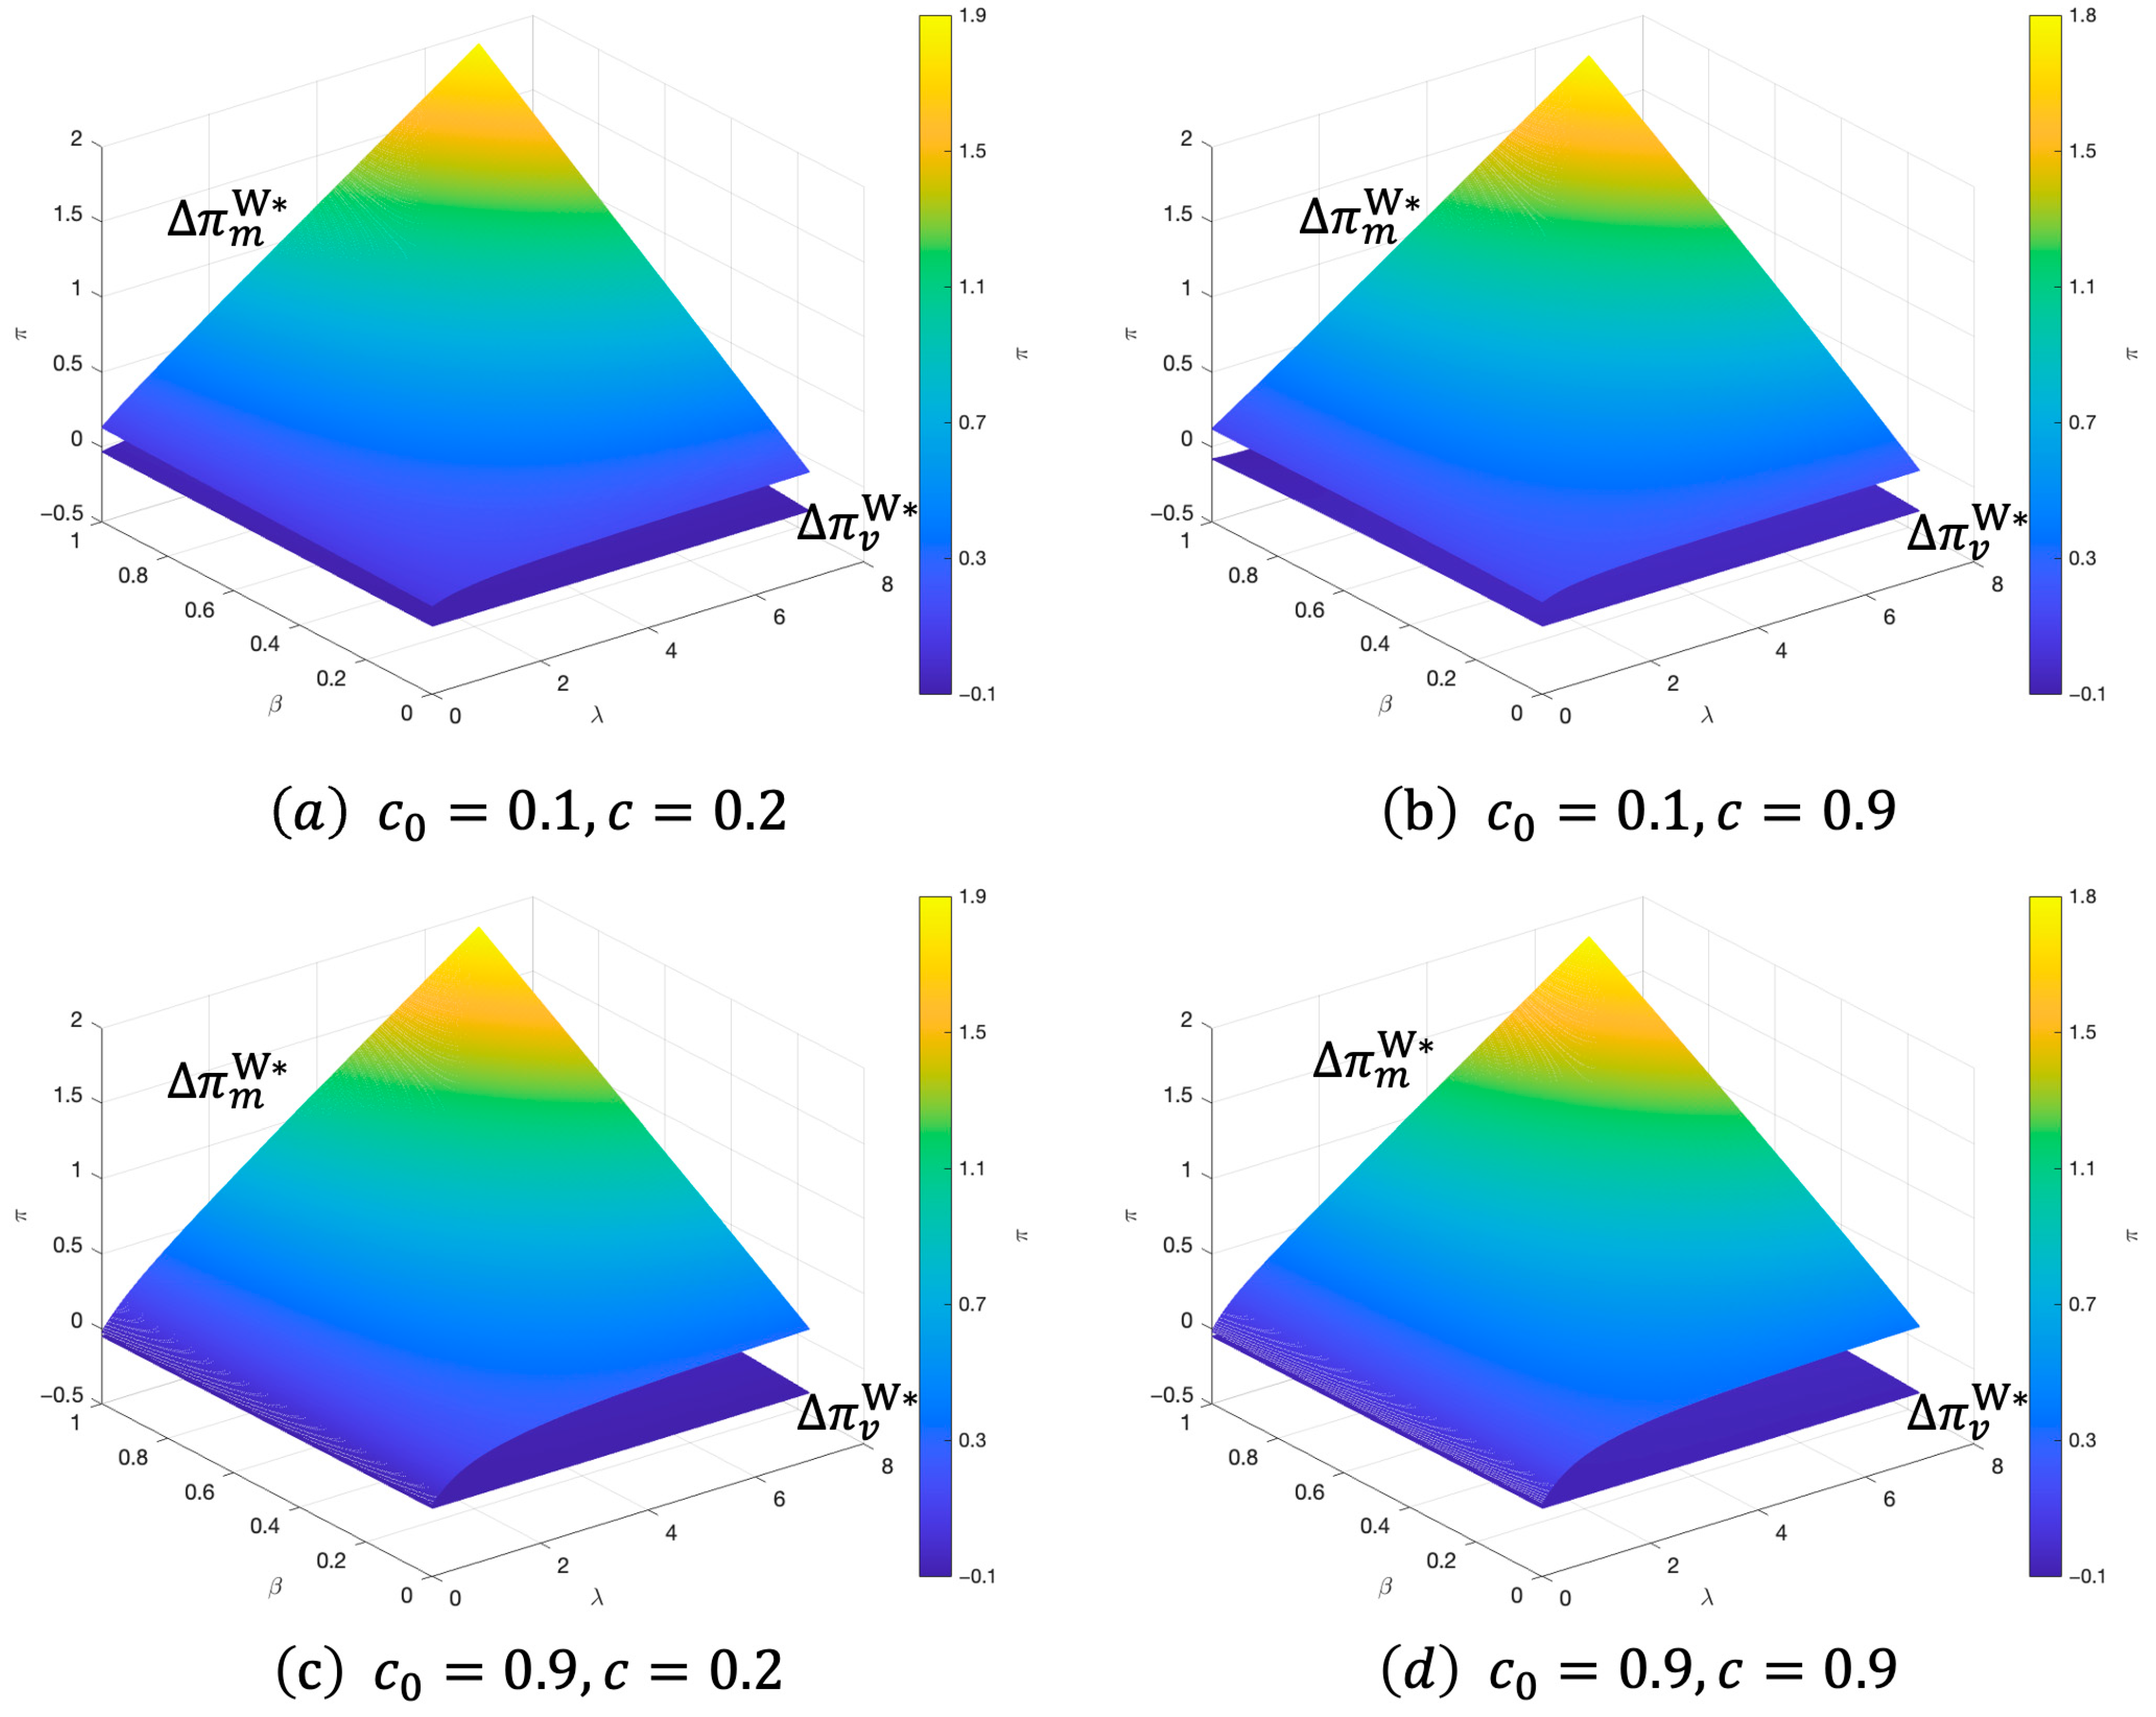
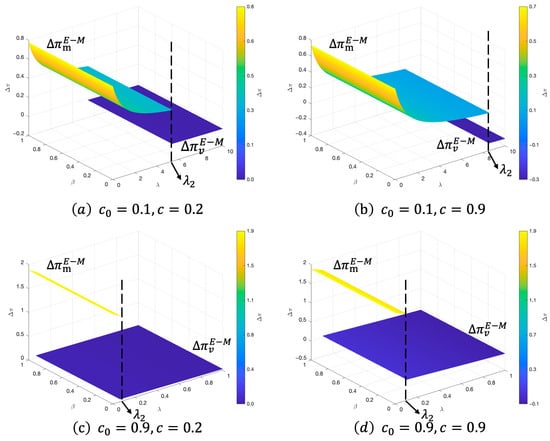
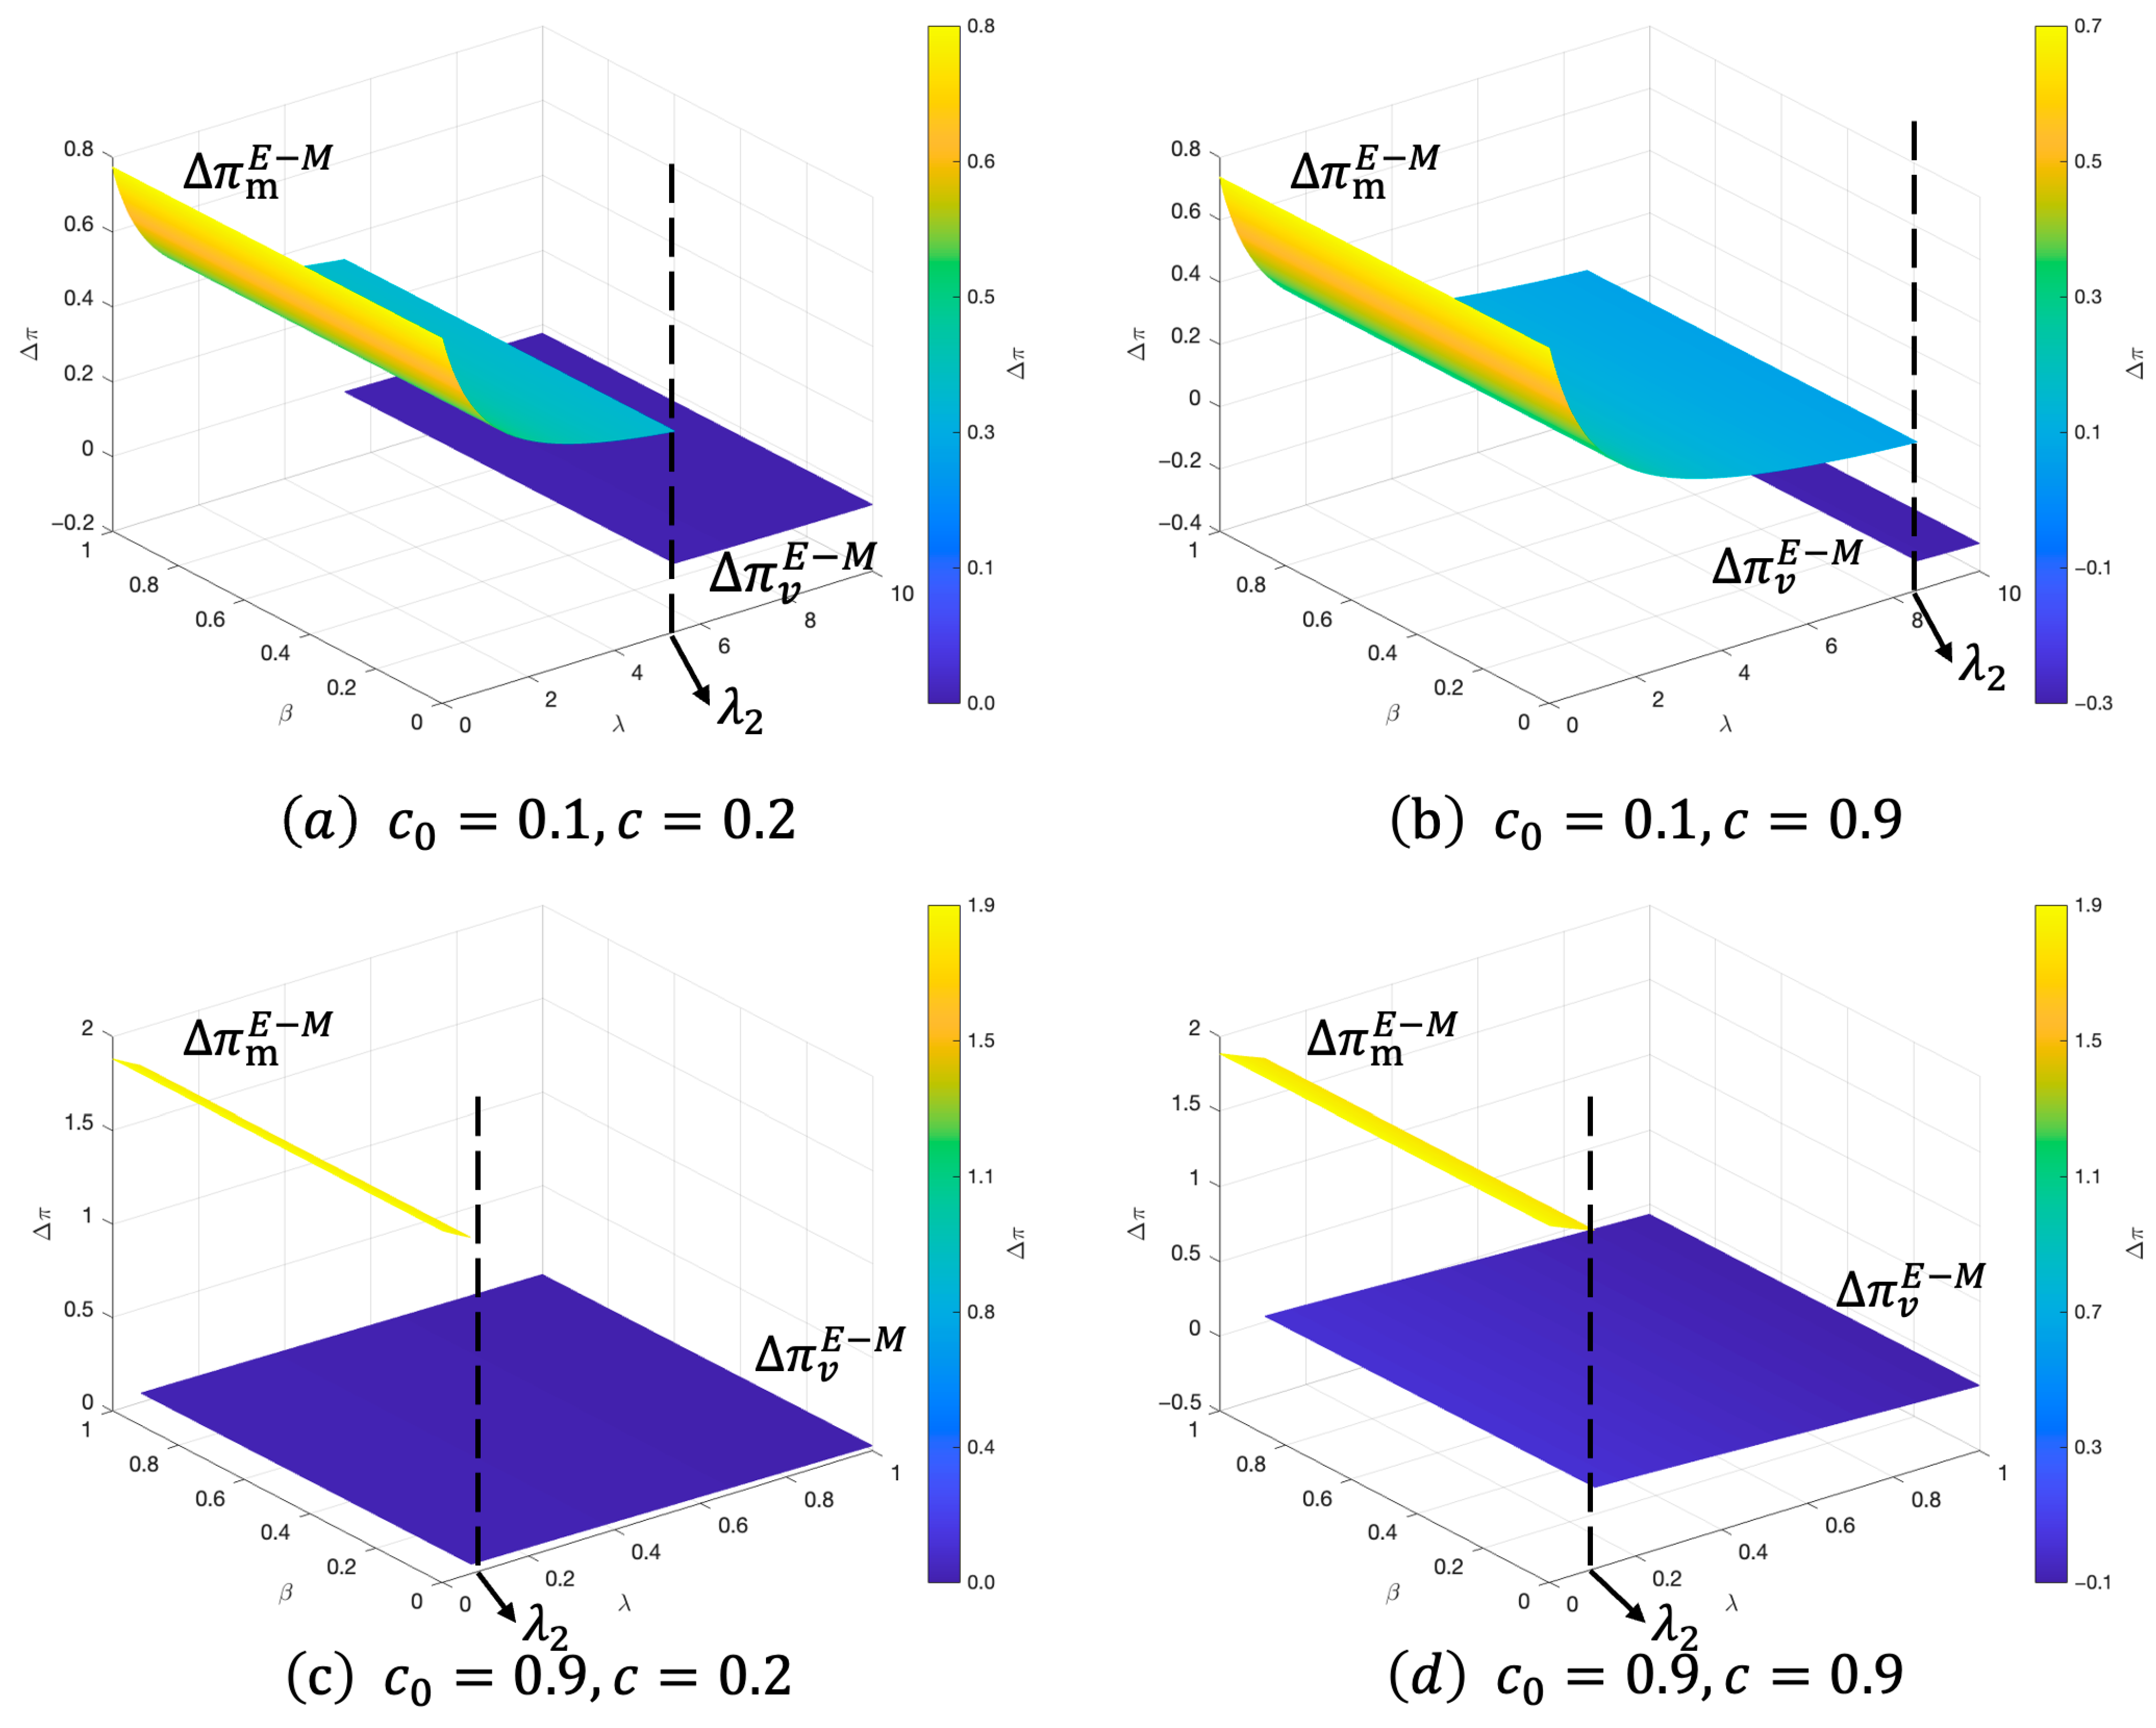
As shown in Figure 6, the premium pricing strategy improves profits to a greater extent than the value-for-money pricing strategy. As and increase, the profit of premium pricing strategy grows rapidly. occurs only when is extremely small. This implies that for extremely small increases in willingness to pay , the Quota Discount Mechanism fails to increase the percentage of servitization and thus cannot further increase profitability. Furthermore, in the range of , premium pricing always helps the firm obtain higher profits as increases. When , optimal pricing can only be achieved by adopting a value-for-money pricing strategy. Compared with the situation before the implementation of the Quota Discount Mechanism, the profit of the firm will increase minimally or even decrease. The second stage results in more sales of service products and higher operating costs but a relatively modest increase in selling price. In addition, the percentage of discounts set by the firm reduces the profitability of the second stage.
Figure 6.
Profit comparison of two pricing strategies under (W) program.
In summary, the best form of (W) program is the Quota Discount Mechanism, which enables the matching of hidden demand. Firms are exchanging a boost in the number of serviced customers for a discount on existing customers. This mechanism is proven to be effective in converting potential consumers into serviced customers under limited conditions, further enhancing the profitability of the firm. On the one hand, the firm can flexibly set the discount ratio according to the cost and the market to ensure profit enhancement; on the other hand, the premium pricing model has a significant effect on profit enhancement when is satisfied.
Based on the above analysis, we propose methods to match hidden demand based on the phenomenon of mismatched supply and demand for servitization. Both the (E) and (W) programs covered in this section can achieve the matching of hidden demand and improve the firm’s profit on the basis of the Nash equilibrium. However, at present we can only prove that both programs can increase the firm’s profit through a premium pricing strategy to the extent that . As a firm, which program is more favorable to choose? Also, what is the optimal strategy when ? These are the questions we try to answer next.
6. Assessment of Two Programs for Hidden Demand Matching
According to the previous analysis, with the firm in control of costs () and observing the markets (), what program should be adopted?
The association between and pricing strategy applies equally to both programs, comparing the profits of the two programs in the ranges of and . , and .
Theorem 2.
In the range of , , there is . The choice between the (E) and (W) programs is independent of . The firm can earn the highest profit by choosing the (E) program and premium pricing.
According to Theorem 2, the proportion of potential customers in hidden demand matching does not need to be considered. No matter how many potential consumers there are, the firm will convert all of them into loyal serviced customers. As shown in Figure 7, the range is suitable for the premium pricing strategy and implements (E) program. In addition to obtaining equilibrium profit, it also completes the optimal matching of hidden demand and maximizes profit.
Figure 7.
Comparison of profits in (E) and (W) programs (.
Lemma 7.
There exists such that under the value-for-money pricing strategy , when .
So, we can obtain Theorem 3.
Theorem 3.
In the range of , when the firm chooses a value-for-money pricing strategy, the (E) and (W) program choices can be expressed as Table 2:
Table 2.
Options (E) and (W).
In the range of , the firm can only choose the value-for-money pricing strategy, and the (E) and (W) programs are not effective in improving profits. Option (W) requires a smaller discount rate to ensure profit growth after implementation; otherwise, the firm must choose the (E) program. When consumers overvalue services, they will resist price increases due to a lack of reliable benchmarks, leading to a decline in purchasing power [83].
Based on these findings, a key step is to obtain consumers’ perception of the additional value of the service and determine their willingness to pay. Miller et al. [84] compared four commonly used methods for measuring consumer willingness to pay using real purchase data; their findings revealed that open-ended (OE) questions and choice-based conjoint (CBC) analysis are more effective. This conclusion is being widely put into practice: new product launches are accompanied by extensive surveys directly asking consumers about the perceived value enhancement of the new service to collect quantifiable data or through conjoint analysis, enabling firms to assign numerical values to each new feature and understand the factors influencing willingness to pay. Zendesk’s AI service pricing case can provide inspiration: they conducted customer needs research at the outset of service design, identified their pain points and the value of solving these pain points, and determined the level of service required and the price they were willing to pay [85]. While the potential customer ratio does not directly influence decision-making, data analysis of sales figures and social media, as well as customer interactions in physical stores, can help firms acquire this data. For example, asking customers who have already purchased products how much they are willing to pay for new services can help determine whether a customer is a potential customer.
According to Theorem 2 and Figure 7, the (E) program has a large range of applicability, which can help the firm obtain higher profits. Rajini et al. [86] shows that current demand management in the service industry focuses on dynamic pricing and advertising promotions, while neglecting a customer-centric approach. Odhe et al. [87] recognize customer value, and their service growth model emphasizes the potential of existing customers and unacquired customers. They also provide four potential service growth strategies but point out the challenge of gaining customer acceptance for a service. Our model and research have demonstrated that free experience is an effective strategy for gaining customer acceptance, and this service marketing approach has gradually been adopted by most firms. Apple Music offers new users a four-month free trial period, after which they can purchase the service. Once consumers become interested and dependent on this service, the firm can make profits from this program. The highly competitive cloud services market has seen many cloud service firms compete for customers through free trials. Firms identify potential customers through a free trial in the first stage, recover costs in the second stage or even multiple stages thereafter, and realize profit growth.
The (W) program has more stringent conditions. In the “Quota Discount Mechanism”, the customer’s willingness to pay must be high and the customer is willing to do WOM marketing of services and products for a lower discount (, as concluded in Theorem 3. This requires that the quality of the products of the business must be exceptional and that the customers are extremely loyal. Haier home appliances can provide both regular and premium customized services. Its members (loyal customers) enjoy a range of exclusive services which can be redeemed, such as product points for discounts and free appliance cleaning services, which is equivalent to a small discount offered by the firm to loyal customers. Furthermore, Haier’s “Micro-Enterprise Community Contract” management model, by stimulating organizational vitality to proactively perceive user needs, closely connects users, employees, and ecosystem resource providers. This transforms the generation and spread of WOM from a singular, accidental event into a systematic and sustainable value cycle. This model not only solves the problem of ineffective cost control of the company’s services but also amplifies the effect of WOM marketing. NIO also attempted to attract new users through WOM marketing, launching service packages including free shuttle service and full vehicle maintenance, which were applicable to all customers. These expensive services, which could be enjoyed simply by redeeming vouchers, attracted many users at first. However, due to a lack of cost control, the firm ultimately suffered significant losses and had to reduce its services. Users attracted by WOM were disappointed, and the strategy ultimately backfired on the brand. Recognizing the importance of controlling costs and matching user needs, NIO launched tiered pricing service packages and points rewards to optimize overall service costs. This case demonstrates the value of overall service cost optimization and tiered discounts for WOM marketing.
7. Conclusions
The root cause of the servitization paradox is a mismatch between supply and demand, where a firm’s provision of basic products and enhanced services is mismatched with the level of customer demand. This paper makes the following contributions. Changes in consumers’ willingness to pay after servitization are considered to inform firms’ pricing strategies, including value-for-money pricing and premium pricing. Further, we propose to optimize supply–demand matching through hidden demand matching and suggest two programs to achieve hidden demand matching based on experience and WOM marketing according to the characteristics of services. The results of this paper are validated as a path to break the servitization paradox and the conditions for the applicability of the programs are explored from a firm’s perspective.
We built a game model to research the pricing strategy and the program to match hidden demand after a firm’s servitization transition. Depending on the level of enhancement in consumers’ willingness to pay caused by servitization, firms can flexibly adopt premium pricing or value-for-money pricing to obtain optimal profits and achieve Nash equilibrium. Further, we noted that a Nash equilibrium that relies on optimal pricing ignores potential customers. Considering that services need to be valued in terms of experience and that reviews can be spread through WOM, we proposed two programs: “Experience in exchange for markets” and “WOM marketing and discount mechanism”. Both these two programs can convert potential customers into loyal service customers, effectively achieving a higher percentage of service products. The marketing programs we proposed have been proven to achieve precise matching of hidden demand, optimizing the level of matching between supply and demand. This piece of research can be used as a mechanism designed to solve the servitization paradox and solve the mismatch between supply and demand through hidden demand matching.
7.1. Management Inspiration
A firm that can adapt its servitization capabilities relative to the heterogeneous demands of consumers (expressed as willingness to pay) will be able to achieve the highest profit returns through premium pricing. Matching supply and demand for optimal profits requires the coordination of both the value of the servitized product and heterogeneous consumer demand. A low-to-moderate increase in consumers’ willingness to pay is relatively easy for a firm to achieve. As consumers’ willingness to pay increases, so does the level of acceptable premium pricing. In practice, many products and services are frequently updated and upgraded, and consumers are willing to accept a slight price increase to enjoy the value brought by the new services. If the service improvement is huge and accompanied by “leapfrog pricing”, while the price may seem to offer value for money, since consumers cannot measure its value, firms need to avoid this approach.
For firms to avoid falling into the quagmire of the servitization paradox, they need to focus on matching the services they provide with consumer demands. Compared to physical products, servitization broadens the hierarchy of consumer needs, and consumers exhibit heterogeneous demand for servitized products. The supply–demand relationship associated with pricing reflects explicit demand, and the state of supply and demand exhibited by the market obscures hidden demand. Converting invisible demand into visible demand and thus increasing profits is a path to solving the servitization paradox.
Firms undertaking servitization need to focus on the nature of the service. Unlike physical goods, the value of a service needs to be experienced in order for consumers to form an evaluation, and evaluations form consumer word-of-mouth endorsements. Experience will lead to subjective perceptions of evaluations, which in turn will affect consumers’ willingness to pay. The spread of good word-of-mouth endorsements is a cheap and efficient way of marketing for firms. From the perspective of the characteristics of services, relying on experience and WOM to increase consumer demand for services is the natural and correct path.
A WOM marketing program requires that a firm have an excellent servitization product and a loyal customer base. This program works for larger, well-established firms to broaden their market and match hidden demand. The “Experience in exchange for markets” program is suitable for most firms, especially new or small ones. In reality, many new brands and startups take their first steps towards growth by offering experience with their products.
7.2. Limitations and Future Research
It should be noted that the model presented in this paper is not applicable to studies considering service levels because we designed a fixed input cost, rather than a quadratic cost positively correlated with service levels. Furthermore, while this work aims to resolve the servitization paradox, there are still many areas for further research to enrich our findings in the field of supply and demand matching.
First, we neglected certain dynamic effects (such as time dependence and price adjustments) and behavioral factors (such as perceived value, transaction risk, customer satisfaction or loyalty, repurchase rate, and refunds), which can significantly influence decision-making and the effectiveness of servitization strategies. Second, our model only considers the firm’s profit performance within two stages. In fact, products and services can be purchased repeatedly over multiple stages, even stages. So, the additional cost of Stage 1 need not be salvaged by Stage 2 alone. Third, regarding the mechanism design of WOM marketing, we assumed that customers participating in WOM marketing do not bear any costs. However, in reality, customer costs may need to be measured through other indicators, such as the time and effort customers spend on WOM marketing. Another point that cannot be accounted for is how to determine the contribution of customers who engage in WOM marketing. We leave these possible extensions for future research.
Author Contributions
Conceptualization, G.J. and C.L.; methodology, C.L.; software, C.L.; validation, K.H.T., C.L.; formal analysis, C.L.; investigation, G.J.; resources, G.J.; data curation, C.L.; writing—original draft preparation, C.L.; writing—review and editing, G.J. and C.L.; visualization, K.H.T.; supervision, K.H.T.; project administration, G.J.; funding acquisition, G.J. All authors have read and agreed to the published version of the manuscript.
Funding
This work is supported by the National Natural Science Foundation of China (72471204 and 71871197).
Data Availability Statement
No new data were created in this study.
Acknowledgments
The authors gratefully acknowledge the financial support provided by the National Natural Science Foundation of China (72471204 and 71871197).
Conflicts of Interest
The authors report there are no competing interests to declare.
Appendix A
Proof of Lemma 2.
The firm’s profit is
Substituting ,
Whereas .
When , . □
Proof of Proposition 1.
Whereas , so it needs to satisfy
So, . □
Proof of Lemma 3.
The firm’s profit is
We obtain that , whereas . When , we obtain that . □
Proof of Proposition 2.
Whereas , so it needs to satisfy , we obtain that . □
Proof of Proposition 4.
Under the value-for-money pricing strategy, , we obtain that
Under the premium pricing strategy, , we obtain that
And . □
Proof of Theorem 2.
When , we obtain that , so, in the range of ,
If , then by calculation must be negative. So, we obtain that min in the range of . □
Proof of Lemma 7.
; we obtain that . □
Proof of the calculations in Section 5.2.
□
References
- Hu, Z.; Ma, H.; Xiong, J.; Gao, P.; Divakaran, P.K.P. Convergence or divergence: A computational text analysis of stakeholder concerns on manufacturing upgrading in China. IEEE Trans. Eng. Manag. 2022, 71, 1285–1295. [Google Scholar] [CrossRef] [Scilit]
- Zhang, W.; Banerji, S. Challenges of servitization: A systematic literature review. Ind. Mark. Manag. 2017, 65, 217–227. [Google Scholar] [CrossRef] [Scilit]
- Yu, P.; Gao, M. Research on Dynamic Evolution Mechanism of Manufacturing Servitization—Based on the Perspective of Innovation Strategy. Systems 2024, 12, 225. [Google Scholar] [CrossRef] [Scilit]
- Crozet, M.; Milet, E. Should everybody be in services? The effect of servitization on manufacturing firm performance. J. Econ. Manag. Strategy 2017, 26, 820–841. [Google Scholar] [CrossRef] [Scilit]
- Niu, Y.; Jiang, Z.; Geng, N.; Jiang, S. Disclosing the formation and value creation of servitization through influential factors: A systematic review and future research agenda. Int. J. Prod. Res. 2021, 59, 7057–7089. [Google Scholar] [CrossRef] [Scilit]
- Zhou, P.; Bu, C.; Zhai, Y. Service provision decisions of competitive manufacturers: From service spillover perspective. J. Oper. Res. Soc. 2024, 76, 677–692. [Google Scholar] [CrossRef] [Scilit]
- Pistoni, A.; Songini, L. The servitization of manufacturing: Why and how. In Servitization Strategy and Managerial Control; Emerald Publishing Limited: Leeds, UK, 2017; Volume 32, pp. 5–36. [Google Scholar]
- Huang, W.; Yang, J.; Wei, Z. How does servitization affect firm performance? IEEE Trans. Eng. Manag. 2020, 69, 2871–2881. [Google Scholar] [CrossRef] [Scilit]
- Lyu, T.; Lyu, X.; Chen, H.; Zhao, Q. Breaking away from servitization paradox to improve manufacturing enterprises’ service innovation performance: The roles of market orientation and service supply chain dynamic capability. J. Organ. Change Manag. 2023, 36, 848–874. [Google Scholar] [CrossRef] [Scilit]
- Park, J.; Lee, B.K.; Lim, S. Quality-driven profitability analysis in service operations. J. Oper. Res. Soc. 2021, 72, 1578–1590. [Google Scholar] [CrossRef] [Scilit]
- Myrden, S.E.; Kelloway, E.K. Leading to customer loyalty: A daily test of the service-profit chain. J. Serv. Mark. 2015, 29, 585–598. [Google Scholar] [CrossRef] [Scilit]
- Li, G.; Yan, K.; Wei, Z.; Cheng, T.E. Can servitization enhance customer loyalty? The roles of organizational IT, social media, and service-oriented corporate culture. IEEE Trans. Eng. Manag. 2021, 70, 40–54. [Google Scholar] [CrossRef] [Scilit]
- Prince, J.; Greenstein, S. Does service bundling reduce churn? J. Econ. Manag. Strategy 2014, 23, 839–875. [Google Scholar] [CrossRef] [Scilit]
- Brax, S. A manufacturer becoming service provider–challenges and a paradox. Manag. Serv. Qual. Int. J. 2005, 15, 142–155. [Google Scholar] [CrossRef] [Scilit]
- Malleret, V. Value creation through service offers. Eur. Manag. J. 2006, 24, 106–116. [Google Scholar] [CrossRef] [Scilit]
- Pirayesh, A.; Doumeingts, G.; Seregni, M.; Gusmeroli, S.; Westphal, I.; Gonzalez, L.; Hans, C.; Núñez Ariño, M.J.; Canepa Eugenio, A.; Laskurain, A. Conceptual framework for product service systems. Systems 2018, 6, 20. [Google Scholar] [CrossRef] [Scilit]
- Vargo, S.L.; Lusch, R.F. Service-dominant logic: Continuing the evolution. J. Acad. Mark. Sci. 2008, 36, 1–10. [Google Scholar] [CrossRef] [Scilit]
- Matthyssens, P.; Vandenbempt, K. Moving from basic offerings to value-added solutions: Strategies, barriers and alignment. Ind. Mark. Manag. 2008, 37, 316–328. [Google Scholar] [CrossRef] [Scilit]
- Rajala, R.; Töytäri, P.; Hervonen, T. Assessing customer-perceived value in industrial service systems. Serv. Sci. 2015, 7, 210–226. [Google Scholar] [CrossRef] [Scilit]
- Gebauer, H.; Fleisch, E.; Friedli, T. Overcoming the service paradox in manufacturing companies. Eur. Manag. J. 2005, 23, 14–26. [Google Scholar] [CrossRef] [Scilit]
- Neely, A. Exploring the financial consequences of the servitization of manufacturing. Oper. Manag. Res. 2008, 1, 103–118. [Google Scholar] [CrossRef] [Scilit]
- Fischer, T.; Gebauer, H.; Gregory, M.; Ren, G.; Fleisch, E. Exploitation or exploration in service business development? Insights from a dynamic capabilities perspective. J. Serv. Manag. 2010, 21, 591–624. [Google Scholar] [CrossRef] [Scilit]
- MIT Sloan Management Review. (2004, January 15). Creating Growth With Services. Available online: https://sloanreview.mit.edu/article/creating-growth-with-services/ (accessed on 10 June 2025).
- Gebauer, H.; Pütz, F.; Fischer, T.; Fleisch, E. Service orientation of organizational structures. J. Relatsh. Mark. 2009, 8, 103–126. [Google Scholar] [CrossRef] [Scilit]
- Shemwell, D.J.; Cronin, J.J. Services marketing strategies for coping with demand/supply imbalances. J. Serv. Mark. 1994, 8, 14–24. [Google Scholar] [CrossRef] [Scilit]
- Benedettini, O.; Neely, A.; Swink, M. Why do servitized firms fail? A risk-based explanation. Int. J. Oper. Prod. Manag. 2015, 35, 946–979. [Google Scholar] [CrossRef] [Scilit]
- Chintagunta, P.K.; Rao, V.R. Pricing strategies in a dynamic duopoly: A differential game model. Manag. Sci. 1996, 42, 1501–1514. [Google Scholar] [CrossRef] [Scilit]
- Baines, T.; Bigdeli, A.Z.; Sousa, R.; Schroeder, A. Framing the servitization transformation process: A model to understand and facilitate the servitization journey. Int. J. Prod. Econ. 2020, 221, 107463. [Google Scholar] [CrossRef] [Scilit]
- Vandermerwe, S.; Rada, J. Servitization of business: Adding value by adding services. Eur. Manag. J. 1988, 6, 314–324. [Google Scholar] [CrossRef] [Scilit]
- Baines, T.S.; Lightfoot, H.W.; Benedettini, O.; Kay, J.M. The servitization of manufacturing: A review of literature and reflection on future challenges. J. Manuf. Technol. Manag. 2009, 20, 547–567. [Google Scholar] [CrossRef] [Scilit]
- Brax, S.A.; Visintin, F. Meta-model of servitization: The integrative profiling approach. Ind. Mark. Manag. 2017, 60, 17–32. [Google Scholar] [CrossRef] [Scilit]
- Batista, L.; Davis-Poynter, S.; Ng, I.; Maull, R. Servitization through outcome-based contract–A systems perspective from the defence industry. Int. J. Prod. Econ. 2017, 192, 133–143. [Google Scholar] [CrossRef] [Scilit]
- Bıçakcıoğlu-Peynirci, N.; Morgan, R.E. International servitization: Theoretical roots, research gaps and implications. Int. Mark. Rev. 2023, 40, 338–364. [Google Scholar] [CrossRef] [Scilit]
- Liu, Y.; Zhang, J.Z.; Jasimuddin, S.; Babai, M.Z. Exploring servitization and digital transformation of manufacturing enterprises: Evidence from an industrial internet platform in China. Int. J. Prod. Res. 2024, 62, 2812–2831. [Google Scholar] [CrossRef] [Scilit]
- Blanchard, P.; Fuss, C.; Mathieu, C. Why Do Manufacturing Firms Produce Services? Evidence for the Servitization Paradox in Belgium; NBB Working Paper: Brussels, Belgium, 2017. [Google Scholar]
- Fedyunina, A.; Ruzhanskaya, L.; Gorodnyi, N.; Simachev, Y. Servitization and firm productivity premium across the product value chain: Evidence from Russian manufacturing firms. J. Bus. Ind. Mark. 2024, 39, 1481–1496. [Google Scholar] [CrossRef] [Scilit]
- Kastalli, I.V.; Van Looy, B. Servitization: Disentangling the impact of service business model innovation on manufacturing firm performance. J. Oper. Manag. 2013, 31, 169–180. [Google Scholar] [CrossRef] [Scilit]
- Li, J.H.; Lin, L.; Chen, D.P.; Ma, L.Y. An empirical study of servitization paradox in China. J. High Technol. Manag. Res. 2015, 26, 66–76. [Google Scholar] [CrossRef] [Scilit]
- Wang, H.; Lu, X.; Hu, C.; Wang, H. Institutional pressures and servitization paradox: The moderating effect of organizational identity orientations. Front. Psychol. 2022, 13, 901732. [Google Scholar] [CrossRef] [Scilit]
- Kohtamäki, M.; Bhandari, K.R.; Rabetino, R.; Ranta, M. Sustainable servitization in product manufacturing companies: The relationship between firm’s sustainability emphasis and profitability and the moderating role of servitization. Technovation 2024, 129, 102907. [Google Scholar] [CrossRef] [Scilit]
- Kohtamäki, M.; Einola, S.; Rabetino, R. Exploring servitization through the paradox lens: Coping practices in servitization. Int. J. Prod. Econ. 2020, 226, 107619. [Google Scholar] [CrossRef] [Scilit]
- Yan, K.; Cheng, T.E.; Li, G.; Wei, Z. Overcoming the service paradox by leveraging organizational design and cultural factors: A combined configuration and contingency approach. IEEE Trans. Eng. Manag. 2019, 68, 498–512. [Google Scholar] [CrossRef] [Scilit]
- Son, B.G.; Ries, J.M.; Subramanian, N.; Kim, S. Bridging the innovation gap: Why organizational climate matters for leveraging innovation from supply networks. J. Supply Chain Manag. 2024, 60, 39–63. [Google Scholar] [CrossRef] [Scilit]
- Dmitrijeva, J.; Schroeder, A.; Bigdeli, A.Z.; Baines, T. Paradoxes in servitization: A processual perspective. Ind. Mark. Manag. 2022, 101, 141–152. [Google Scholar] [CrossRef] [Scilit]
- Liu, H.; Zhao, H.; Li, S. Future social change of manufacturing and service industries: Service-oriented manufacturing under the integration of innovation-flows drive. Technol. Forecast. Soc. Change 2023, 196, 122808. [Google Scholar] [CrossRef] [Scilit]
- Oliva, R.; Kallenberg, R. Managing the transition from products to services. Int. J. Serv. Ind. Manag. 2003, 14, 160–172. [Google Scholar] [CrossRef] [Scilit]
- Cheng, Y.; Tao, F.; Zhao, D.; Zhang, L. Modeling of manufacturing service supply–demand matching hypernetwork in service-oriented manufacturing systems. Robot. Comput. -Integr. Manuf. 2017, 45, 59–72. [Google Scholar] [CrossRef] [Scilit]
- Hartwig, J.; Krämer, H. The ‘growth disease’at 50–Baumol after Oulton. Struct. Change Econ. Dyn. 2019, 51, 463–471. [Google Scholar] [CrossRef] [Scilit]
- Li, L.; Liu, M.; Shen, W.; Cheng, G. Product deterioration based demand forecasting and service supply model for MRO service chain. IEEE Trans. Eng. Manag. 2018, 67, 187–200. [Google Scholar] [CrossRef] [Scilit]
- Tao, F.; Cheng, J.; Cheng, Y.; Gu, S.; Zheng, T.; Yang, H. SDMSim: A manufacturing service supply–demand matching simulator under cloud environment. Robot. Comput. -Integr. Manuf. 2017, 45, 34–46. [Google Scholar] [CrossRef] [Scilit]
- Swinney, R. Selling to strategic consumers when product value is uncertain: The value of matching supply and demand. Manag. Sci. 2011, 57, 1737–1751. [Google Scholar] [CrossRef] [Scilit]
- Bowen, D. Consumer thoughts, actions, and feelings from within the service experience. Serv. Ind. J. 2008, 28, 1515–1530. [Google Scholar] [CrossRef] [Scilit]
- Lin, C.J.; Cheng, L.-Y. An integrated model of service experience design improvement. Serv. Ind. J. 2015, 35, 62–80. [Google Scholar] [CrossRef] [Scilit]
- Hsieh, Y.-H.; Yuan, S.-T. Toward a theoretical framework of service experience: Perspectives from customer expectation and customer emotion. Total Qual. Manag. Bus. Excell. 2021, 32, 511–527. [Google Scholar] [CrossRef] [Scilit]
- Tynan, C.; McKechnie, S.; Hartley, S. Interpreting value in the customer service experience using customer-dominant logic. J. Mark. Manag. 2014, 30, 1058–1081. [Google Scholar] [CrossRef] [Scilit]
- Tynan, C.; McKechnie, S. Experience marketing: A review and reassessment. J. Mark. Manag. 2009, 25, 501–517. [Google Scholar] [CrossRef] [Scilit]
- Grönroos, C.; Voima, P. Critical service logic: Making sense of value creation and co-creation. J. Acad. Mark. Sci. 2013, 41, 133–150. [Google Scholar] [CrossRef] [Scilit]
- Katz, E.; Lazarsfeld, P.F.; Roper, E. Personal Influence: The Part Played by People in the Flow of Mass Communications; Routledge: Milton Park, UK, 2017. [Google Scholar]
- De Matos, C.A.; Rossi, C.A.V. Word-of-mouth communications in marketing: A meta-analytic review of the antecedents and moderators. J. Acad. Mark. Sci. 2008, 36, 578–596. [Google Scholar] [CrossRef] [Scilit]
- Rosen, E. The Anatomy of Buzz Revisited: Real-life Lessons in Word-of-Mouth Marketing; Crown Currency: New York, NY, USA, 2009. [Google Scholar]
- Hu, H.-h.; Wang, L.; Jiang, L.; Yang, W. Strong ties versus weak ties in word-of-mouth marketing. BRQ Bus. Res. Q. 2019, 22, 245–256. [Google Scholar] [CrossRef] [Scilit]
- Narayan, V.; Rao, V.R.; Saunders, C. How peer influence affects attribute preferences: A Bayesian updating mechanism. Mark. Sci. 2011, 30, 368–384. [Google Scholar] [CrossRef] [Scilit]
- Trusov, M.; Bucklin, R.E.; Pauwels, K. Effects of word-of-mouth versus traditional marketing: Findings from an internet social networking site. J. Mark. 2009, 73, 90–102. [Google Scholar] [CrossRef] [Scilit]
- Chevalier, J.A.; Mayzlin, D. The effect of word of mouth on sales: Online book reviews. J. Mark. Res. 2006, 43, 345–354. [Google Scholar] [CrossRef] [Scilit]
- Bao, T.; Chang, T.-l.S. Finding disseminators via electronic word of mouth message for effective marketing communications. Decis. Support Syst. 2014, 67, 21–29. [Google Scholar] [CrossRef] [Scilit]
- Joshi, Y.V.; Musalem, A. When consumers learn, money burns: Signaling quality via advertising with observational learning and word of mouth. Mark. Sci. 2021, 40, 168–188. [Google Scholar] [CrossRef] [Scilit]
- Huang, N.; Sun, T.; Chen, P.; Golden, J.M. Word-of-mouth system implementation and customer conversion: A randomized field experiment. Inf. Syst. Res. 2019, 30, 805–818. [Google Scholar] [CrossRef] [Scilit]
- Godes, D. Product policy in markets with word-of-mouth communication. Manag. Sci. 2017, 63, 267–278. [Google Scholar] [CrossRef] [Scilit]
- Xiao, S.; Chen, Y.-J.; Tang, C.S. Knowledge sharing and learning among smallholders in developing economies: Implications, incentives, and reward mechanisms. Oper. Res. 2020, 68, 435–452. [Google Scholar] [CrossRef] [Scilit]
- Li, S.; Chen, J.; Chen, B. Offering a downgraded service to enhance profit? J. Oper. Res. Soc. 2016, 67, 302–311. [Google Scholar] [CrossRef] [Scilit]
- Aviv, Y.; Pazgal, A. Optimal pricing of seasonal products in the presence of forward-looking consumers. Manuf. Serv. Oper. Manag. 2008, 10, 339–359. [Google Scholar] [CrossRef] [Scilit]
- Ching, A.T.; Osborne, M. Identification and estimation of forward-looking behavior: The case of consumer stockpiling. Mark. Sci. 2020, 39, 707–726. [Google Scholar] [CrossRef] [Scilit]
- Pistoni, A.; Songini, L. Strategic managerial control for the servitization strategy. In Servitization Strategy and Managerial Control; Emerald Publishing Limited: Leeds, UK, 2017; Volume 32, pp. 111–224. [Google Scholar]
- Coreynen, W.; Matthyssens, P.; De Rijck, R.; Dewit, I. Internal levers for servitization: How product-oriented manufacturers can upscale product-service systems. Int. J. Prod. Res. 2018, 56, 2184–2198. [Google Scholar] [CrossRef] [Scilit]
- Anderson, S.W.; Dekker, H.C. Management control for market transactions: The relation between transaction characteristics, incomplete contract design, and subsequent performance. Manag. Sci. 2005, 51, 1734–1752. [Google Scholar] [CrossRef] [Scilit]
- Dou, G.; He, P. Value-added service investing and pricing strategies for a two-sided platform under investing resource constraint. J. Syst. Sci. Syst. Eng. 2017, 26, 609–627. [Google Scholar] [CrossRef] [Scilit]
- Gahler, M.; Klein, J.F.; Paul, M. Customer experience: Conceptualization, measurement, and application in omnichannel environments. J. Serv. Res. 2023, 26, 191–211. [Google Scholar] [CrossRef] [Scilit]
- Landers, V.M.; Gabler, C.B.; Hardman, H.E.; Northington, W.M. Can you ask “too much” of your customers? J. Serv. Mark. 2023, 37, 531–546. [Google Scholar] [CrossRef] [Scilit]
- Sheth, J.N.; Jain, V.; Ambika, A. The growing importance of customer-centric support services for improving customer experience. J. Bus. Res. 2023, 164, 113943. [Google Scholar] [CrossRef] [Scilit]
- Guadalupi, C. Learning quality through prices and word-of-mouth communication. J. Econ. Manag. Strategy 2018, 27, 53–70. [Google Scholar] [CrossRef] [Scilit]
- Berry, L.L.; Seltman, K.D. Building a strong services brand: Lessons from Mayo Clinic. Bus. Horiz. 2007, 50, 199–209. [Google Scholar] [CrossRef] [Scilit]
- Gallus, J. Fostering public good contributions with symbolic awards: A large-scale natural field experiment at Wikipedia. Manag. Sci. 2017, 63, 3999–4015. [Google Scholar] [CrossRef] [Scilit]
- Dekimpe, M.G.; van Heerde, H.J. Retailing in times of soaring inflation: What we know, what we don’t know, and a research agenda. J. Retail. 2023, 99, 322–336. [Google Scholar] [CrossRef] [Scilit]
- Miller, K.M.; Hofstetter, R.; Krohmer, H.; Zhang, Z.J. How should consumers’ willingness to pay be measured? An empirical comparison of state-of-the-art approaches. J. Mark. Res. 2011, 48, 172–184. [Google Scholar] [CrossRef] [Scilit]
- Vaughan, S. Practical Zendesk Administration: Best Practices for Setting up Your Customer Service Platform; O’Reilly Media, Inc.: Sebastopol, CA, USA, 2012. [Google Scholar]
- Rajani, R.L.; Heggde, G.S.; Kumar, R.; Bangwal, D. Demand management approaches in services sector and influence on company performance. Int. J. Product. Perform. Manag. 2023, 72, 2808–2837. [Google Scholar] [CrossRef] [Scilit]
- Odhe, J.; Padhi, P.; Witell, L. Strategies for Service Growth. In Service Innovation and Management: Digitalization, Service Infusion and Customer Experience; Springer: Berlin/Heidelberg, Germany, 2025; pp. 45–58. [Google Scholar]

Disclaimer/Publisher’s Note: The statements, opinions and data contained in all publications are solely those of the individual author(s) and contributor(s) and not of MDPI and/or the editor(s). MDPI and/or the editor(s) disclaim responsibility for any injury to people or property resulting from any ideas, methods, instructions or products referred to in the content. |
© 2025 by the authors. Licensee MDPI, Basel, Switzerland. This article is an open access article distributed under the terms and conditions of the Creative Commons Attribution (CC BY) license (https://creativecommons.org/licenses/by/4.0/).