Charging Decision Optimization Strategy for Shared Autonomous Electric Vehicles Considering Multi-Objective Conflicts: An Integrated Solution Process Combining Multi-Agent Simulation Model and Genetic Algorithm
Abstract
1. Introduction
2. Literature Review
3. Design of a Multi-Agent Simulation Framework for Shared Autonomous Electric Vehicle Charging Decision-Making
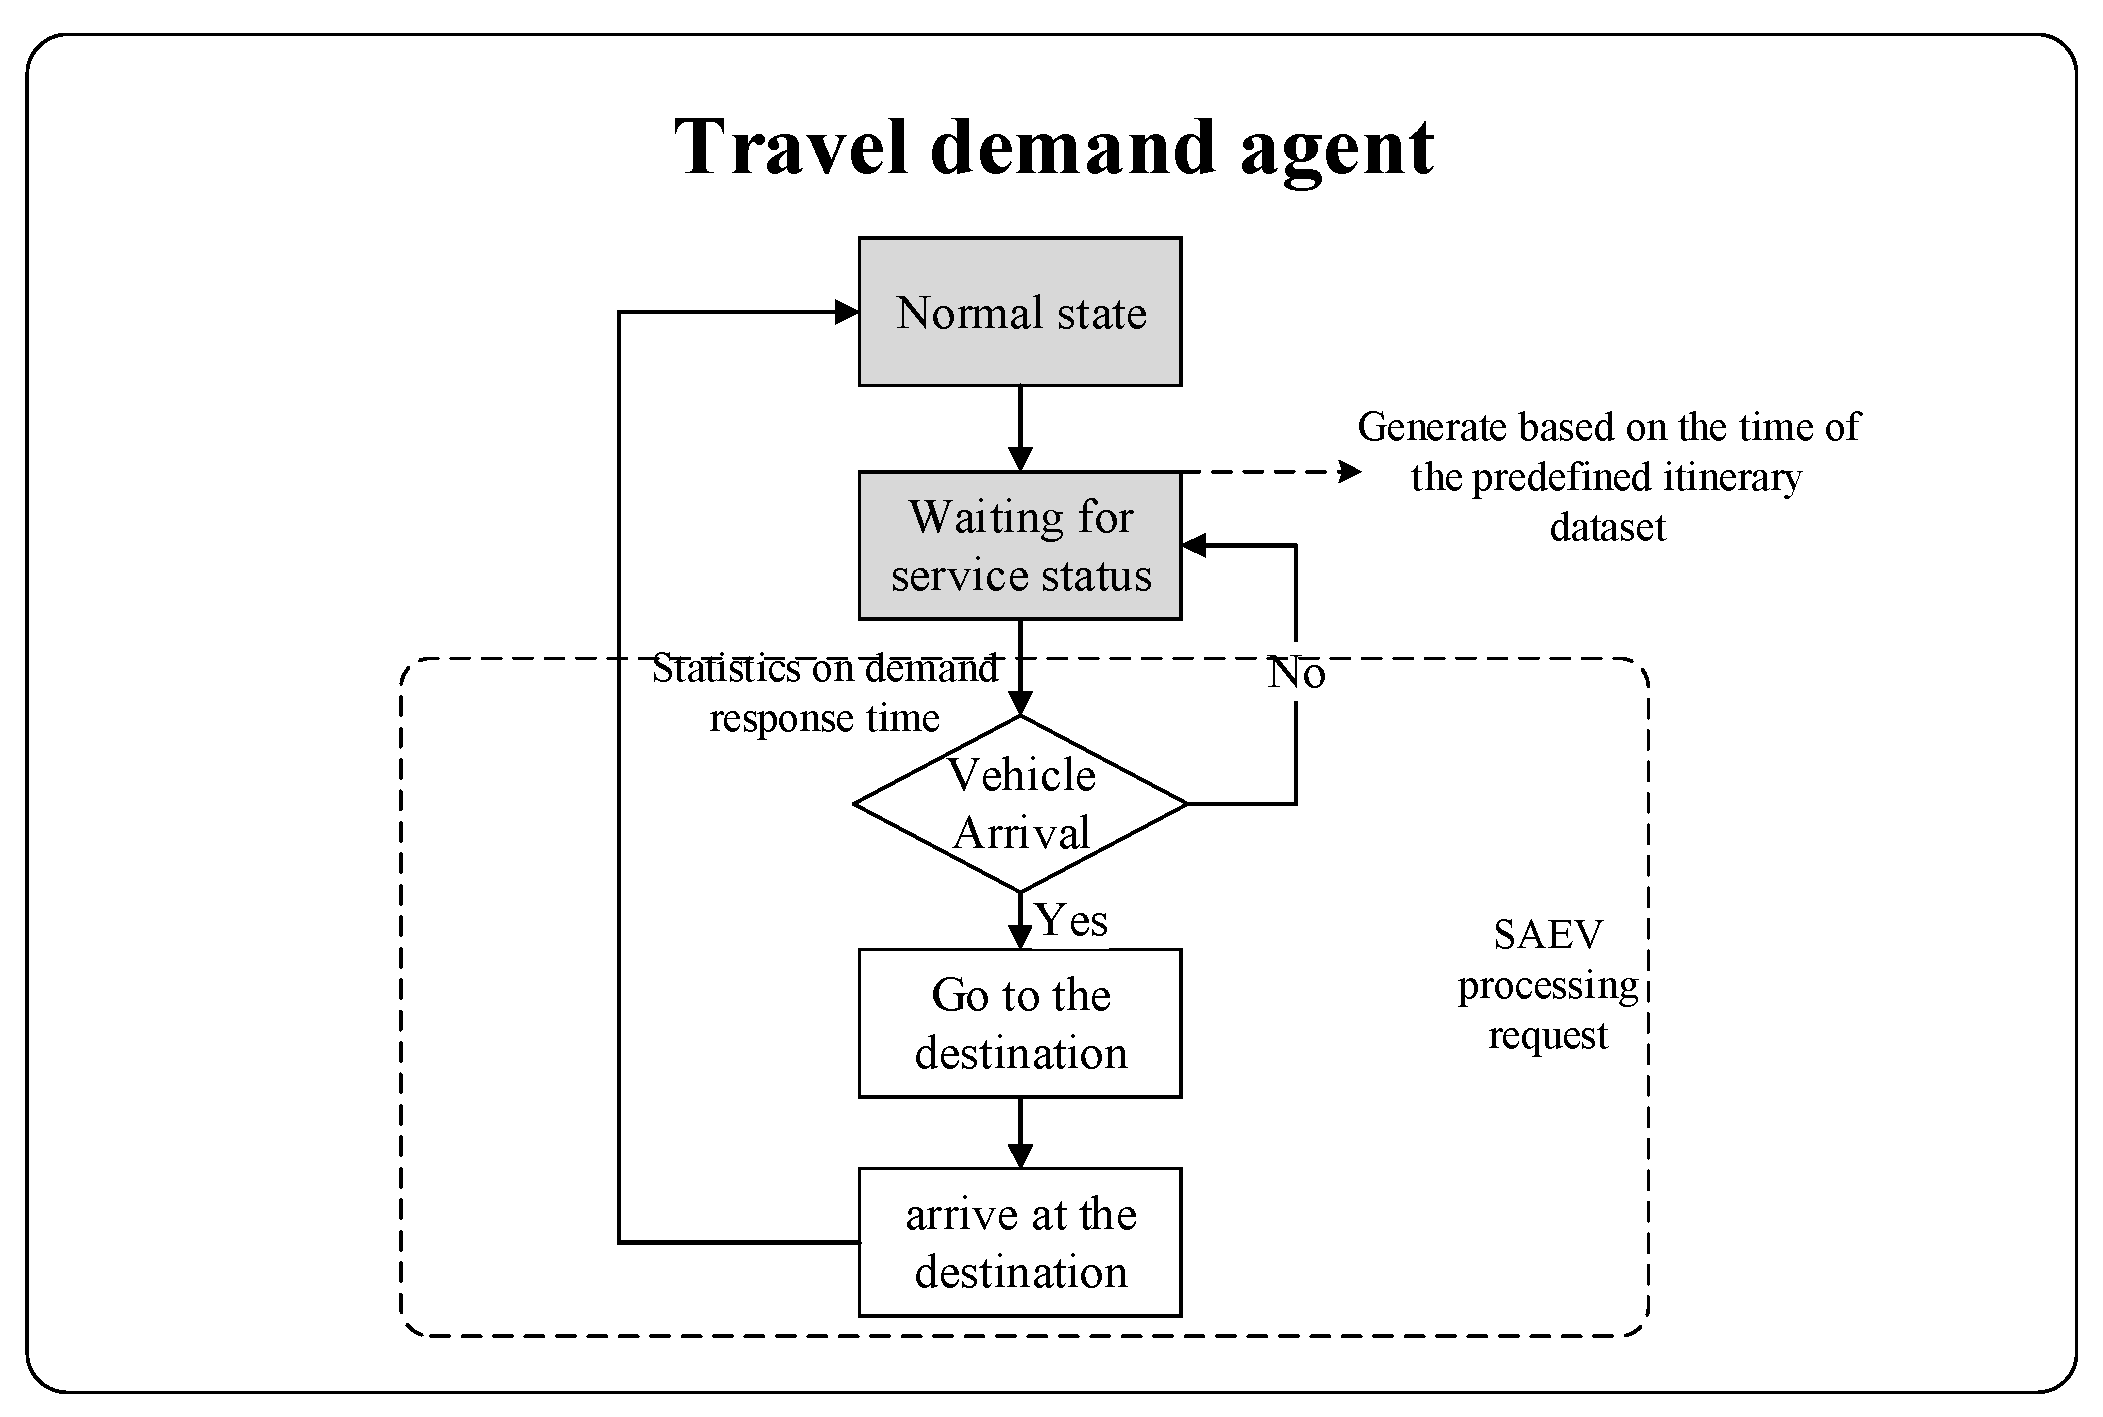
3.1. Travel Demand Agent
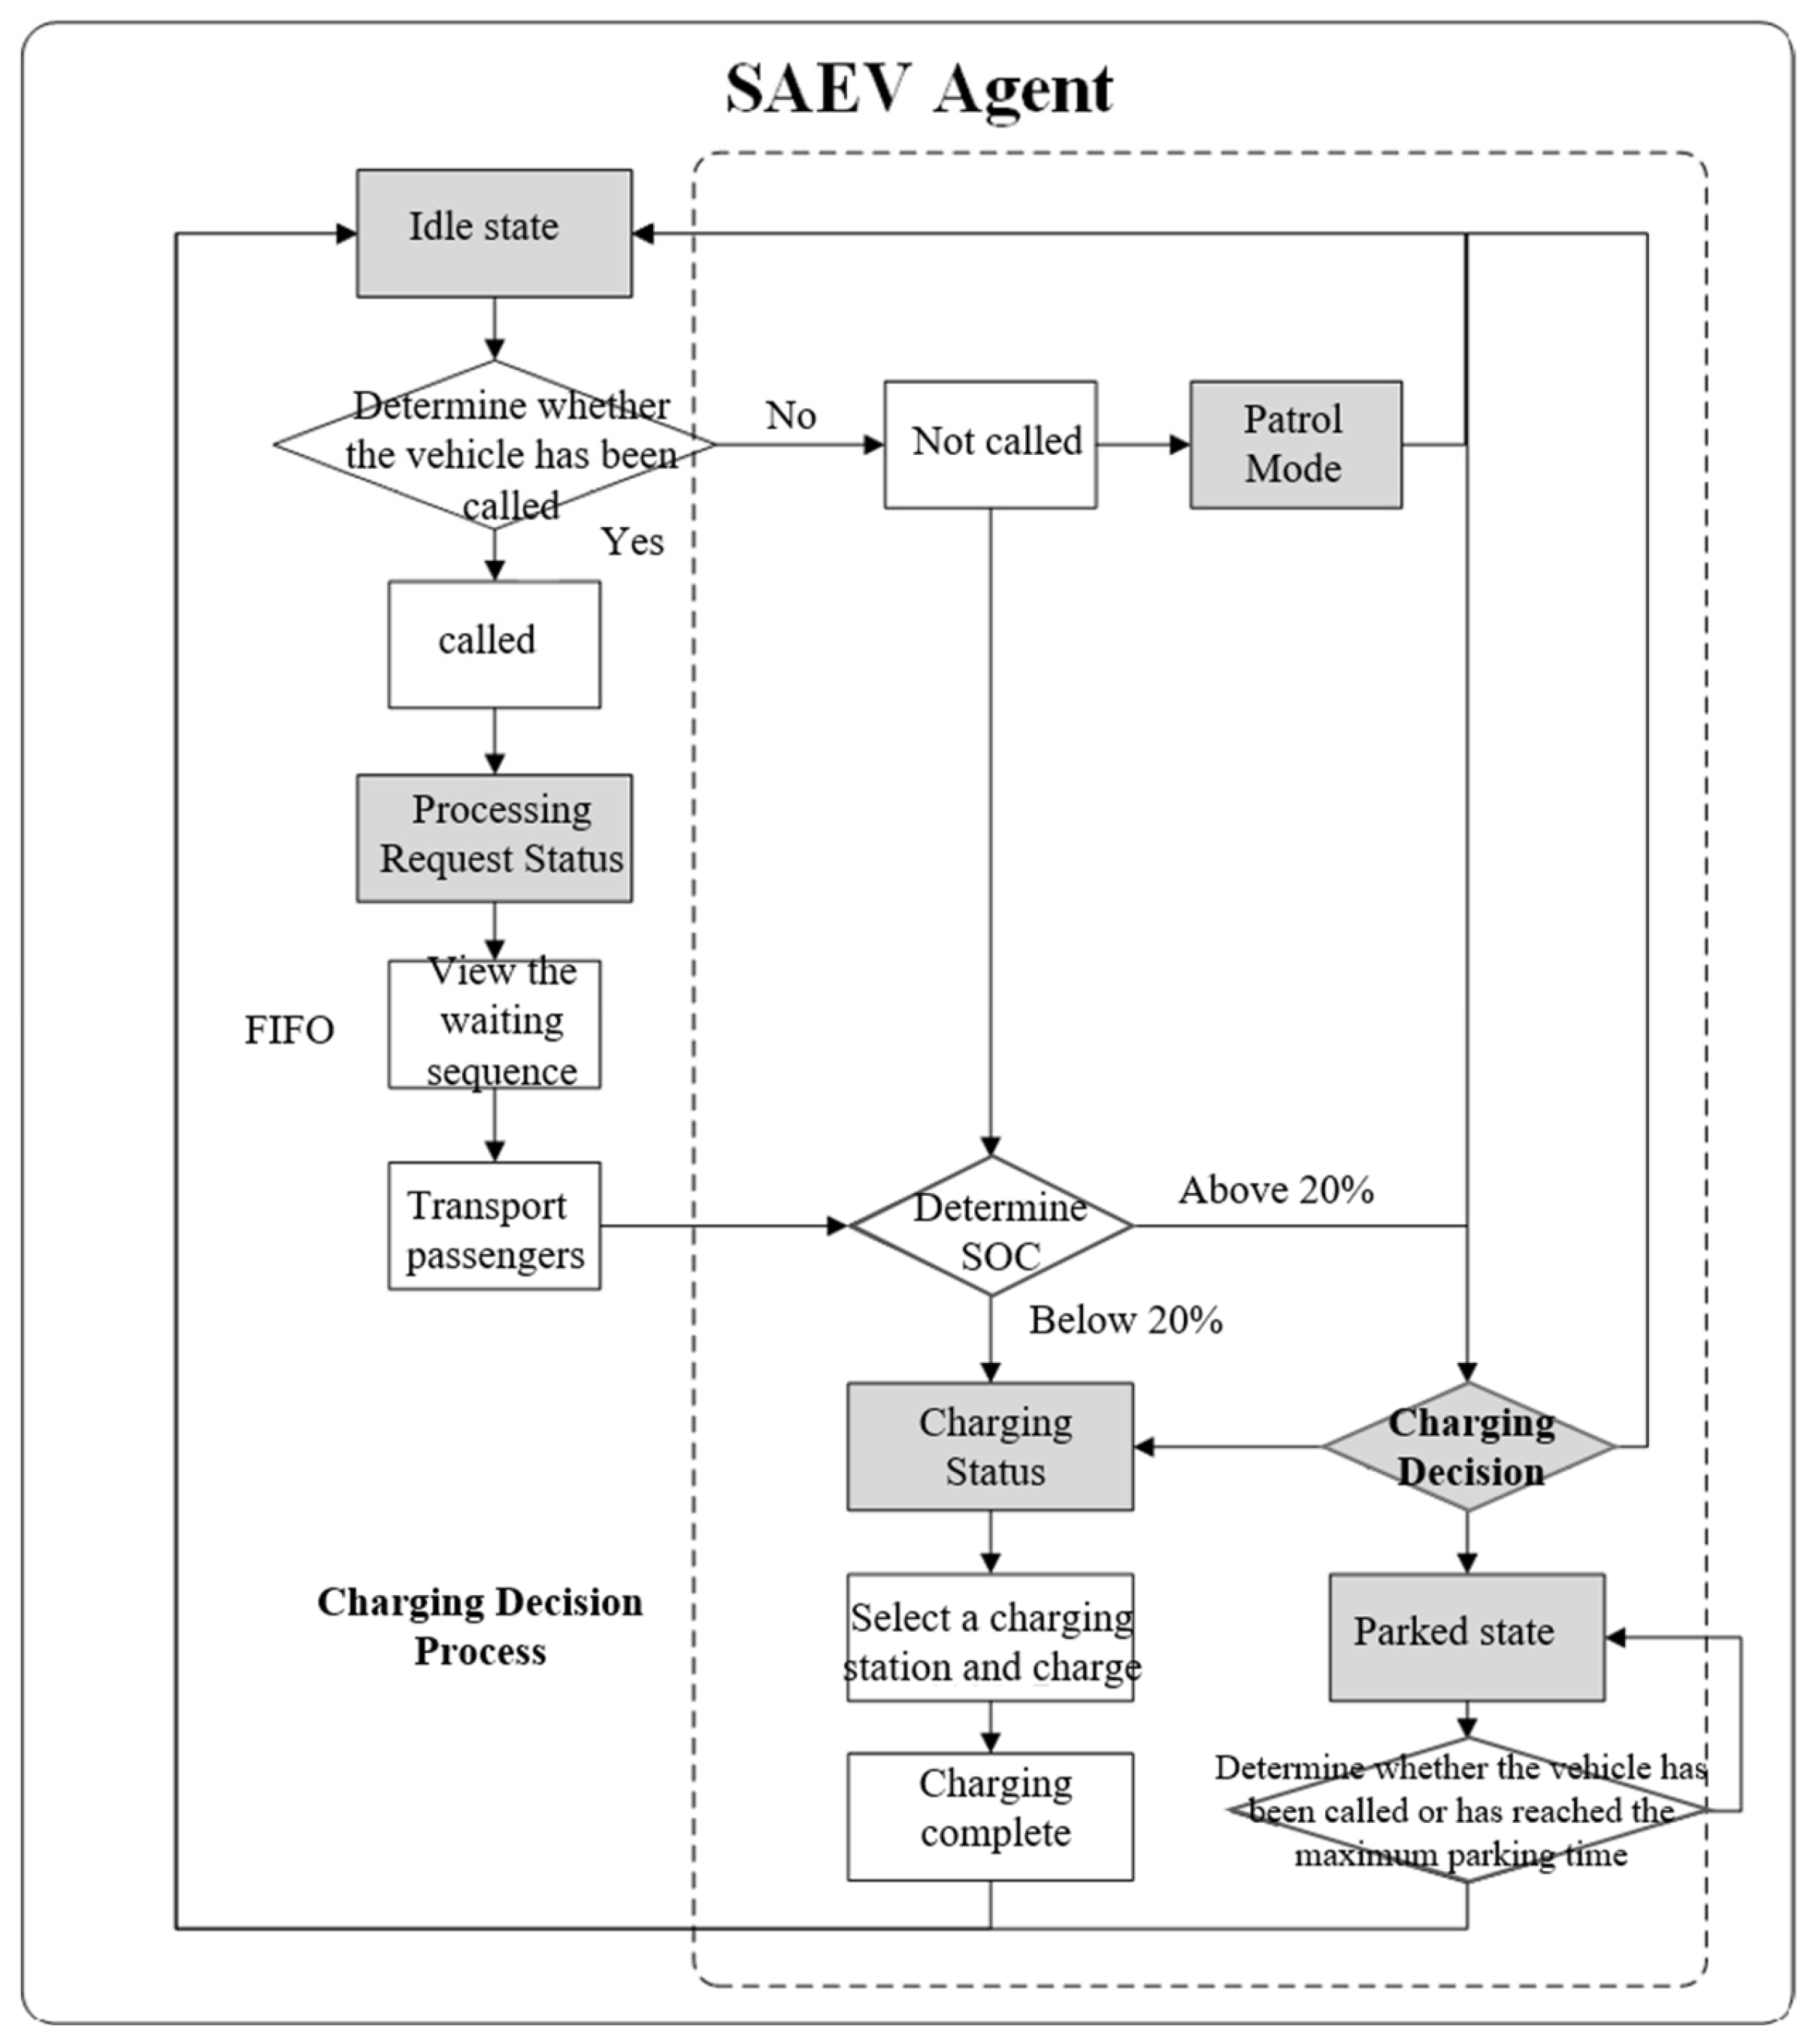
3.2. SAEV Agent
- (1)
- Distance Minimization
- (2)
- Time Minimization
- (3)
- Minimization of integrated charging cost
- (4)
- Demand Response Time Minimization
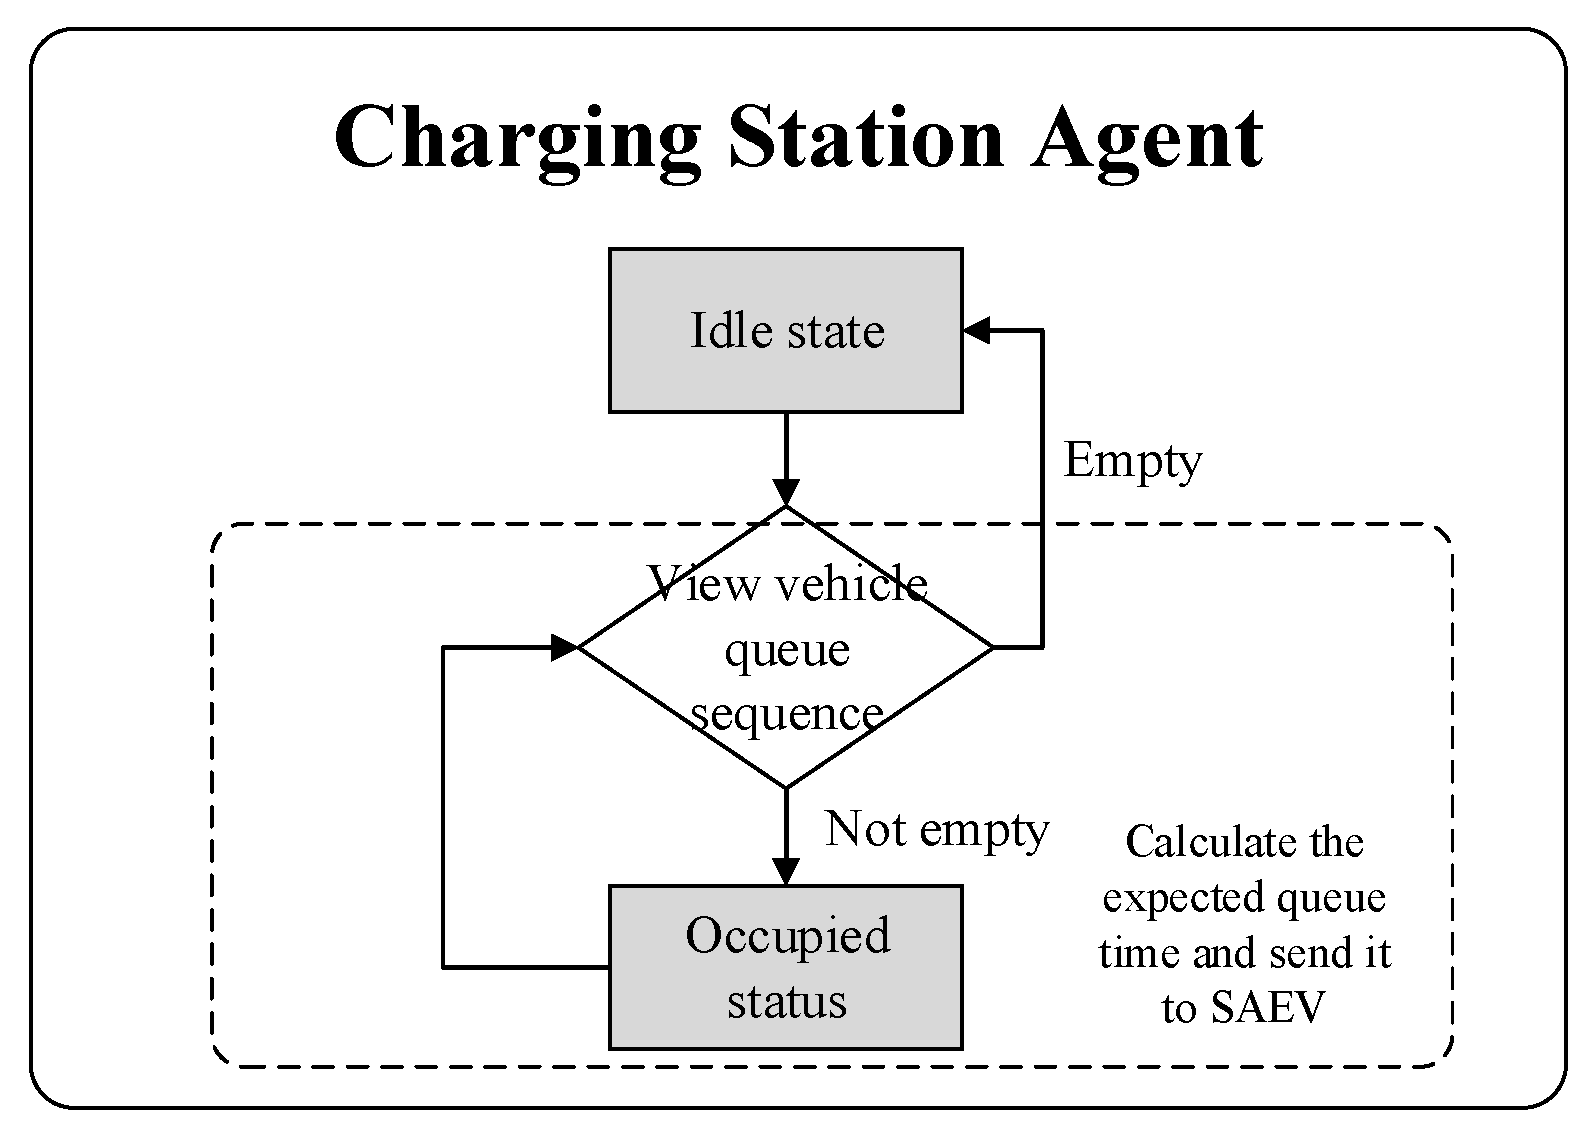
3.3. Charging Station Agent
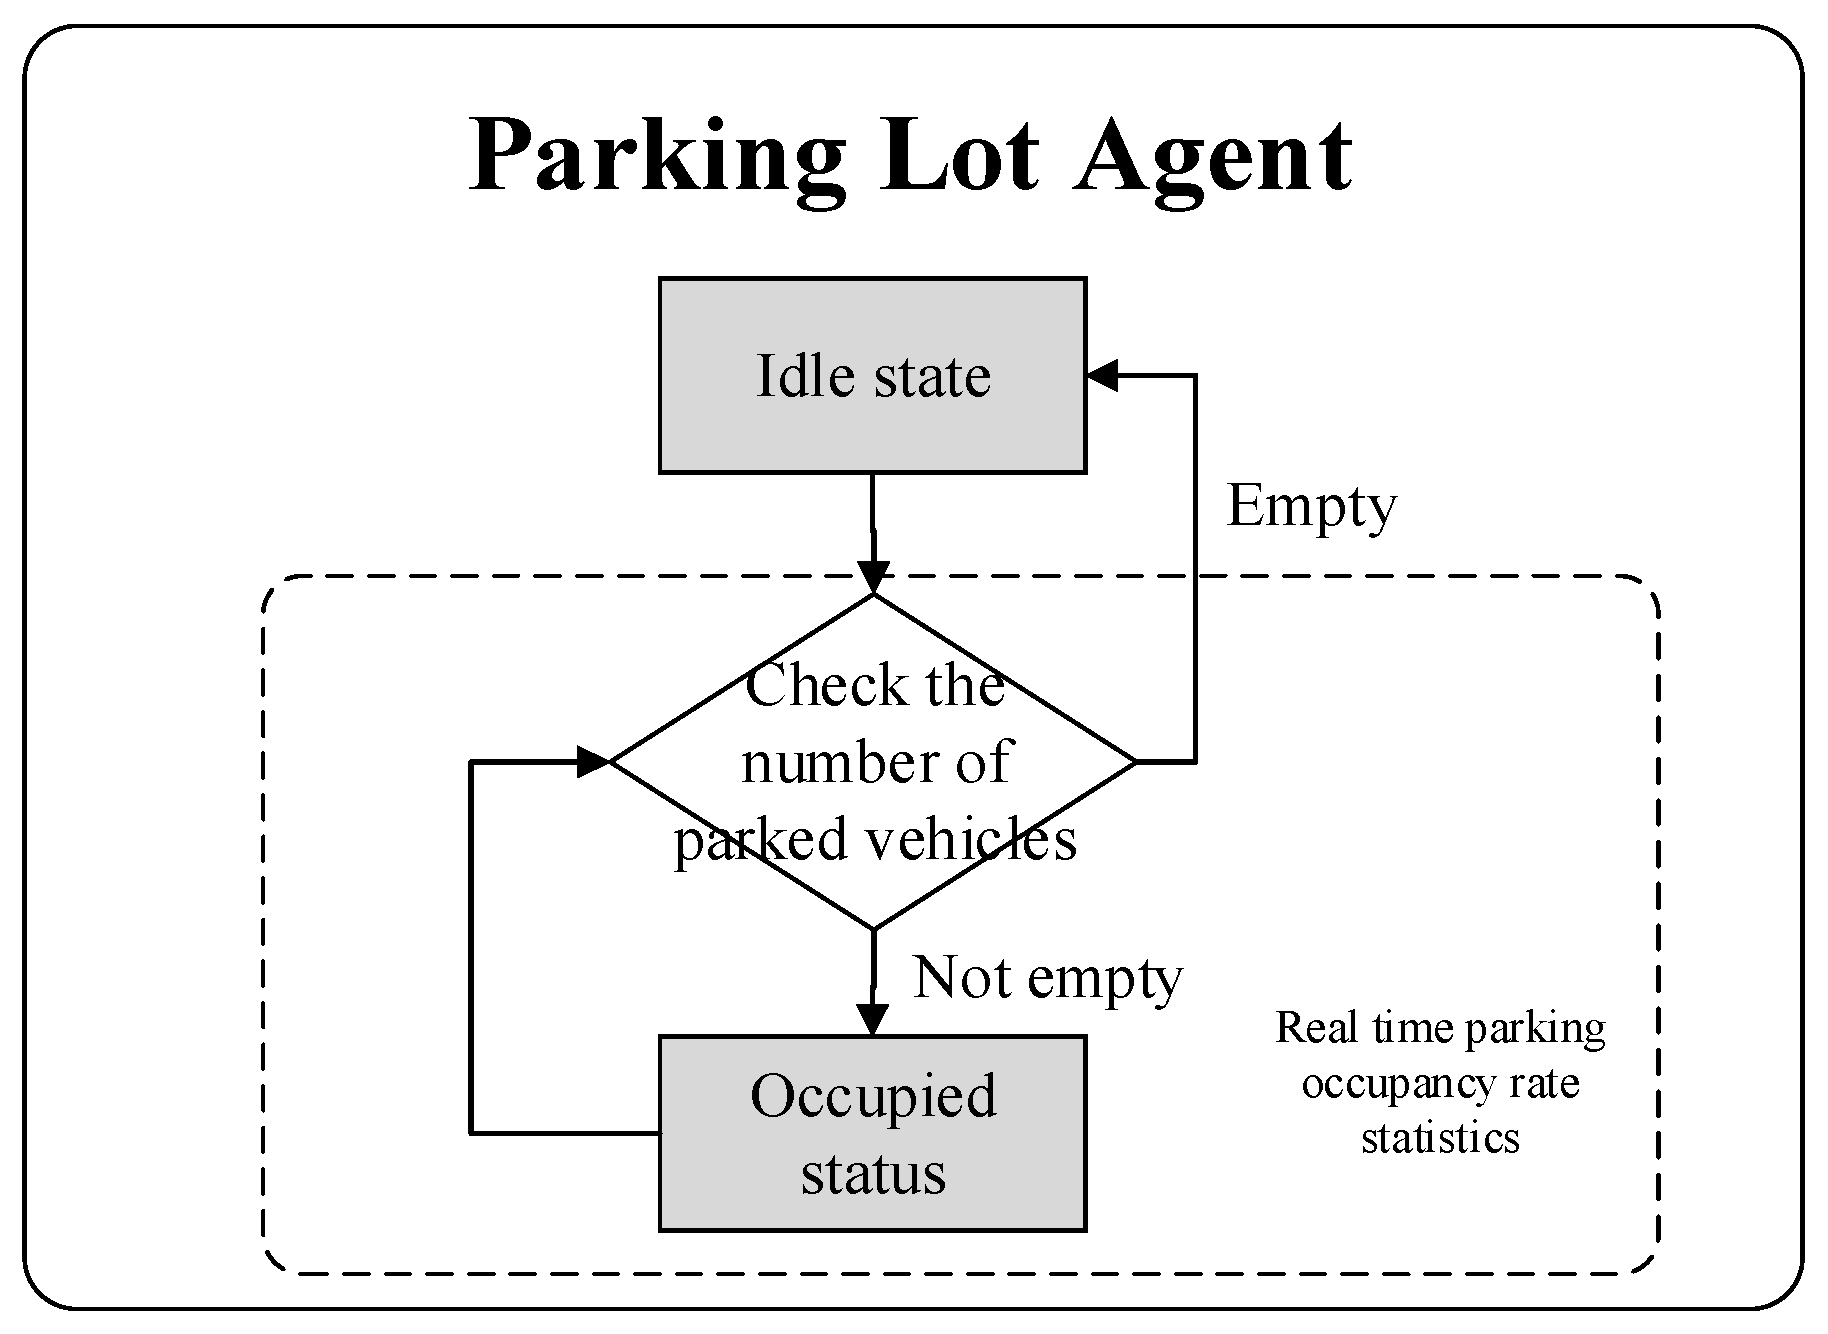
3.4. Parking Lot Agent
4. Construction of the Multi-Objective Optimization Model for Charging Decision Strategy
4.1. Objective Function for Maximizing Average Remaining Battery Level
4.2. Objective Function for Minimizing Average Demand Response Time
4.3. Objective Function for Minimizing Average Empty Vehicle Mileage
4.4. Objective Function for Minimizing Total Charging Cost
4.5. Multi-Objective Optimization Function
5. Integrated Solution Process Combining Multi-Agent Simulation Models and Genetic Algorithms
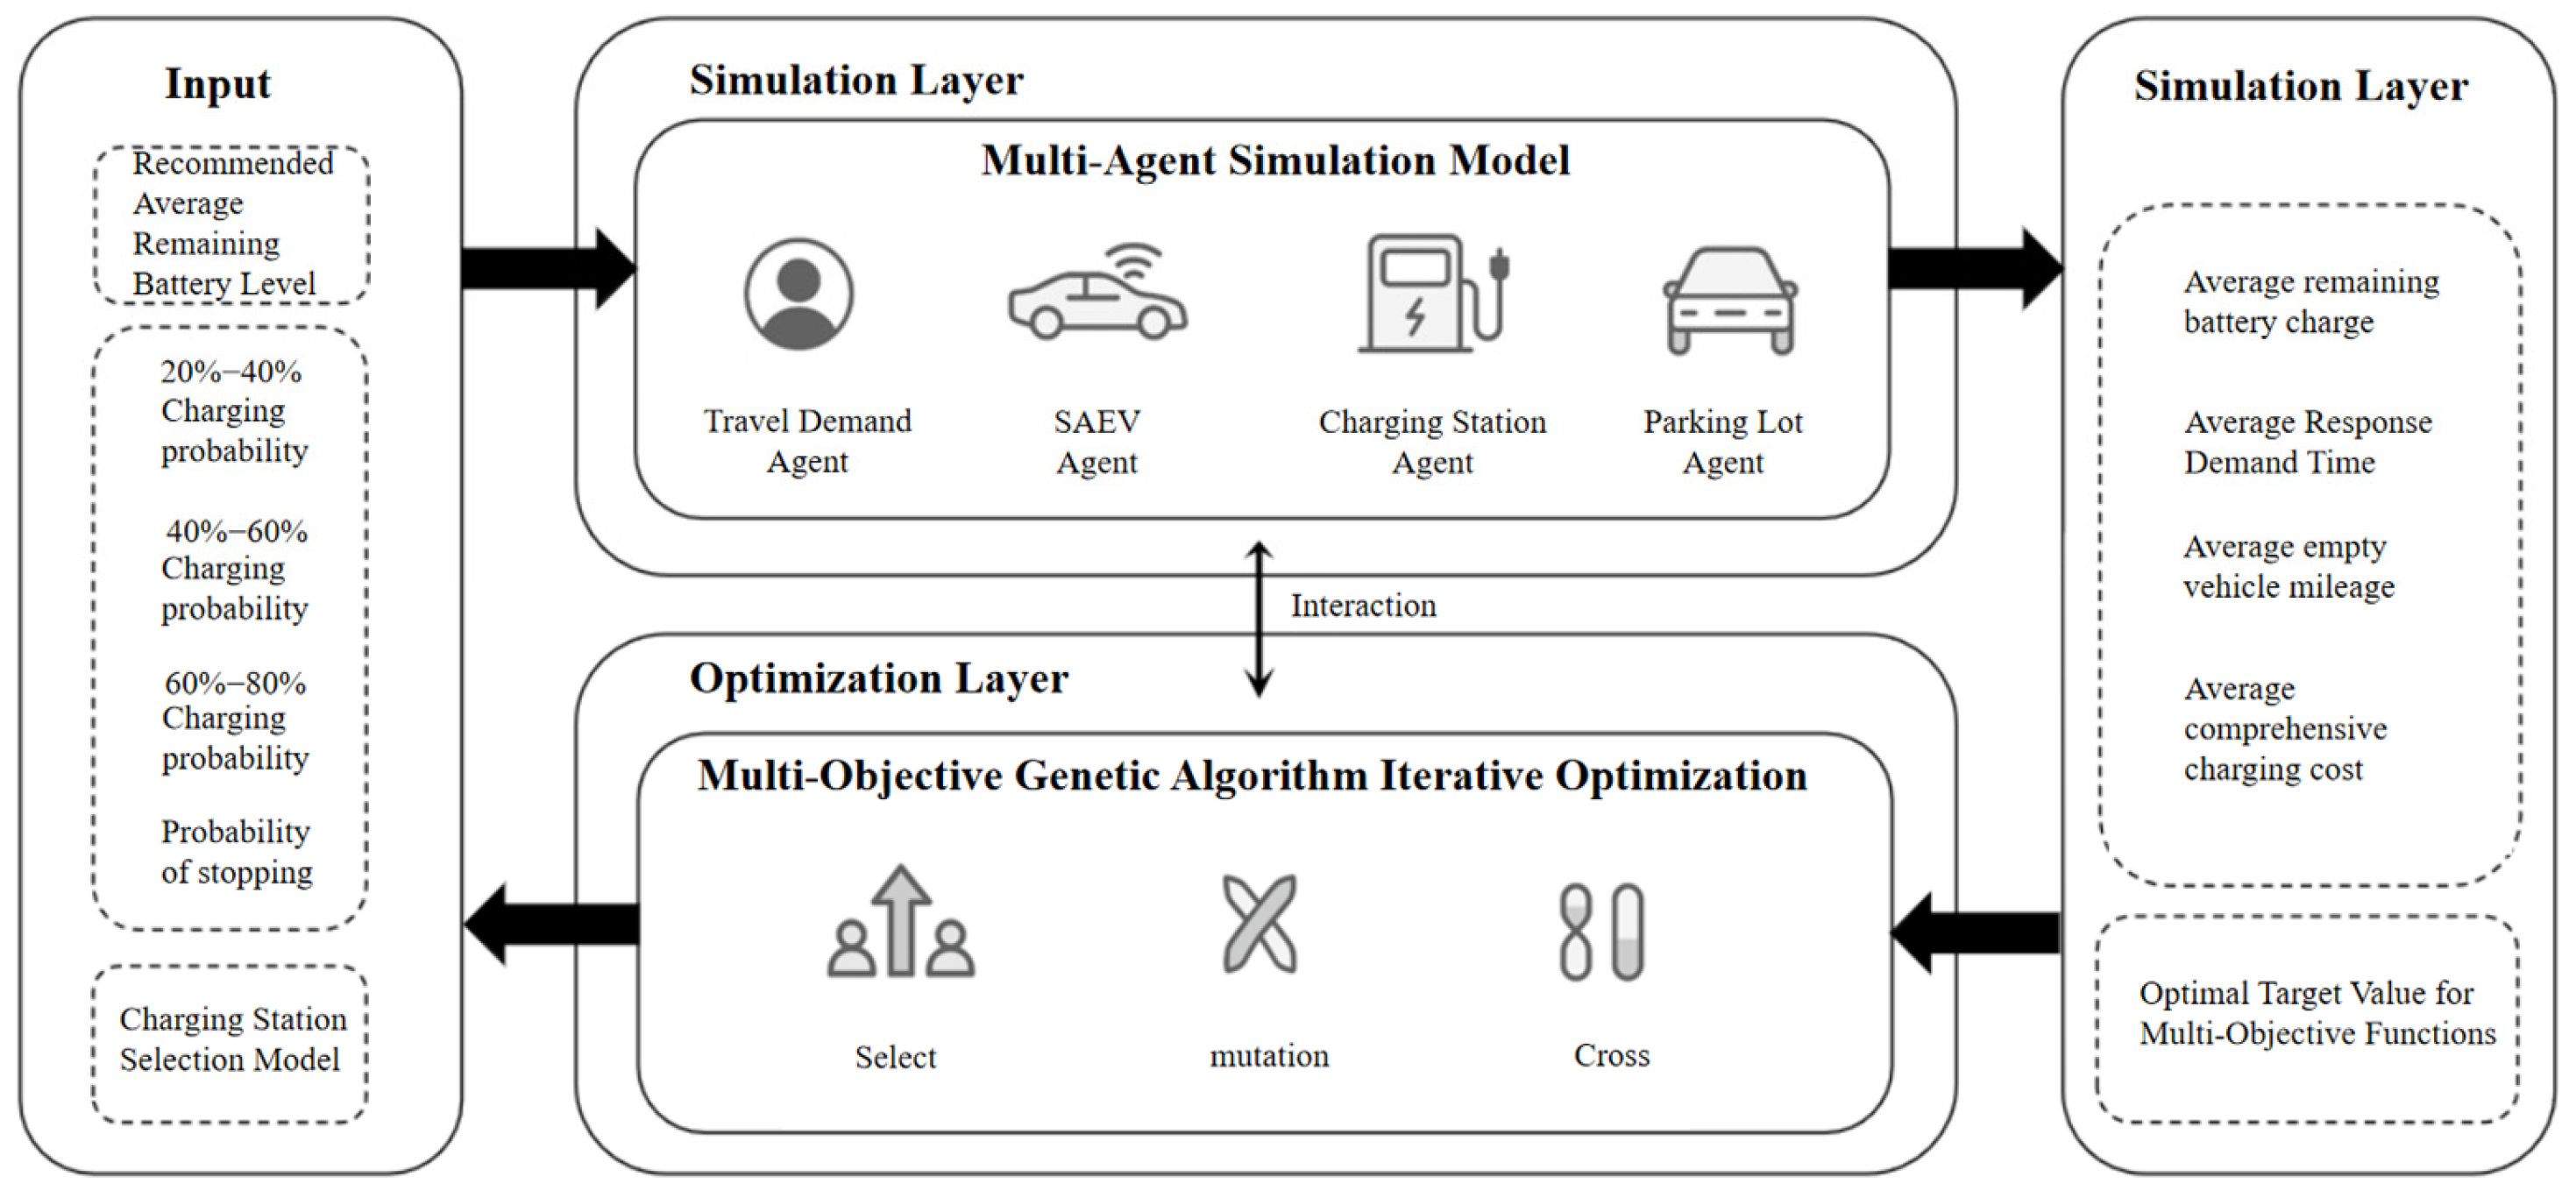
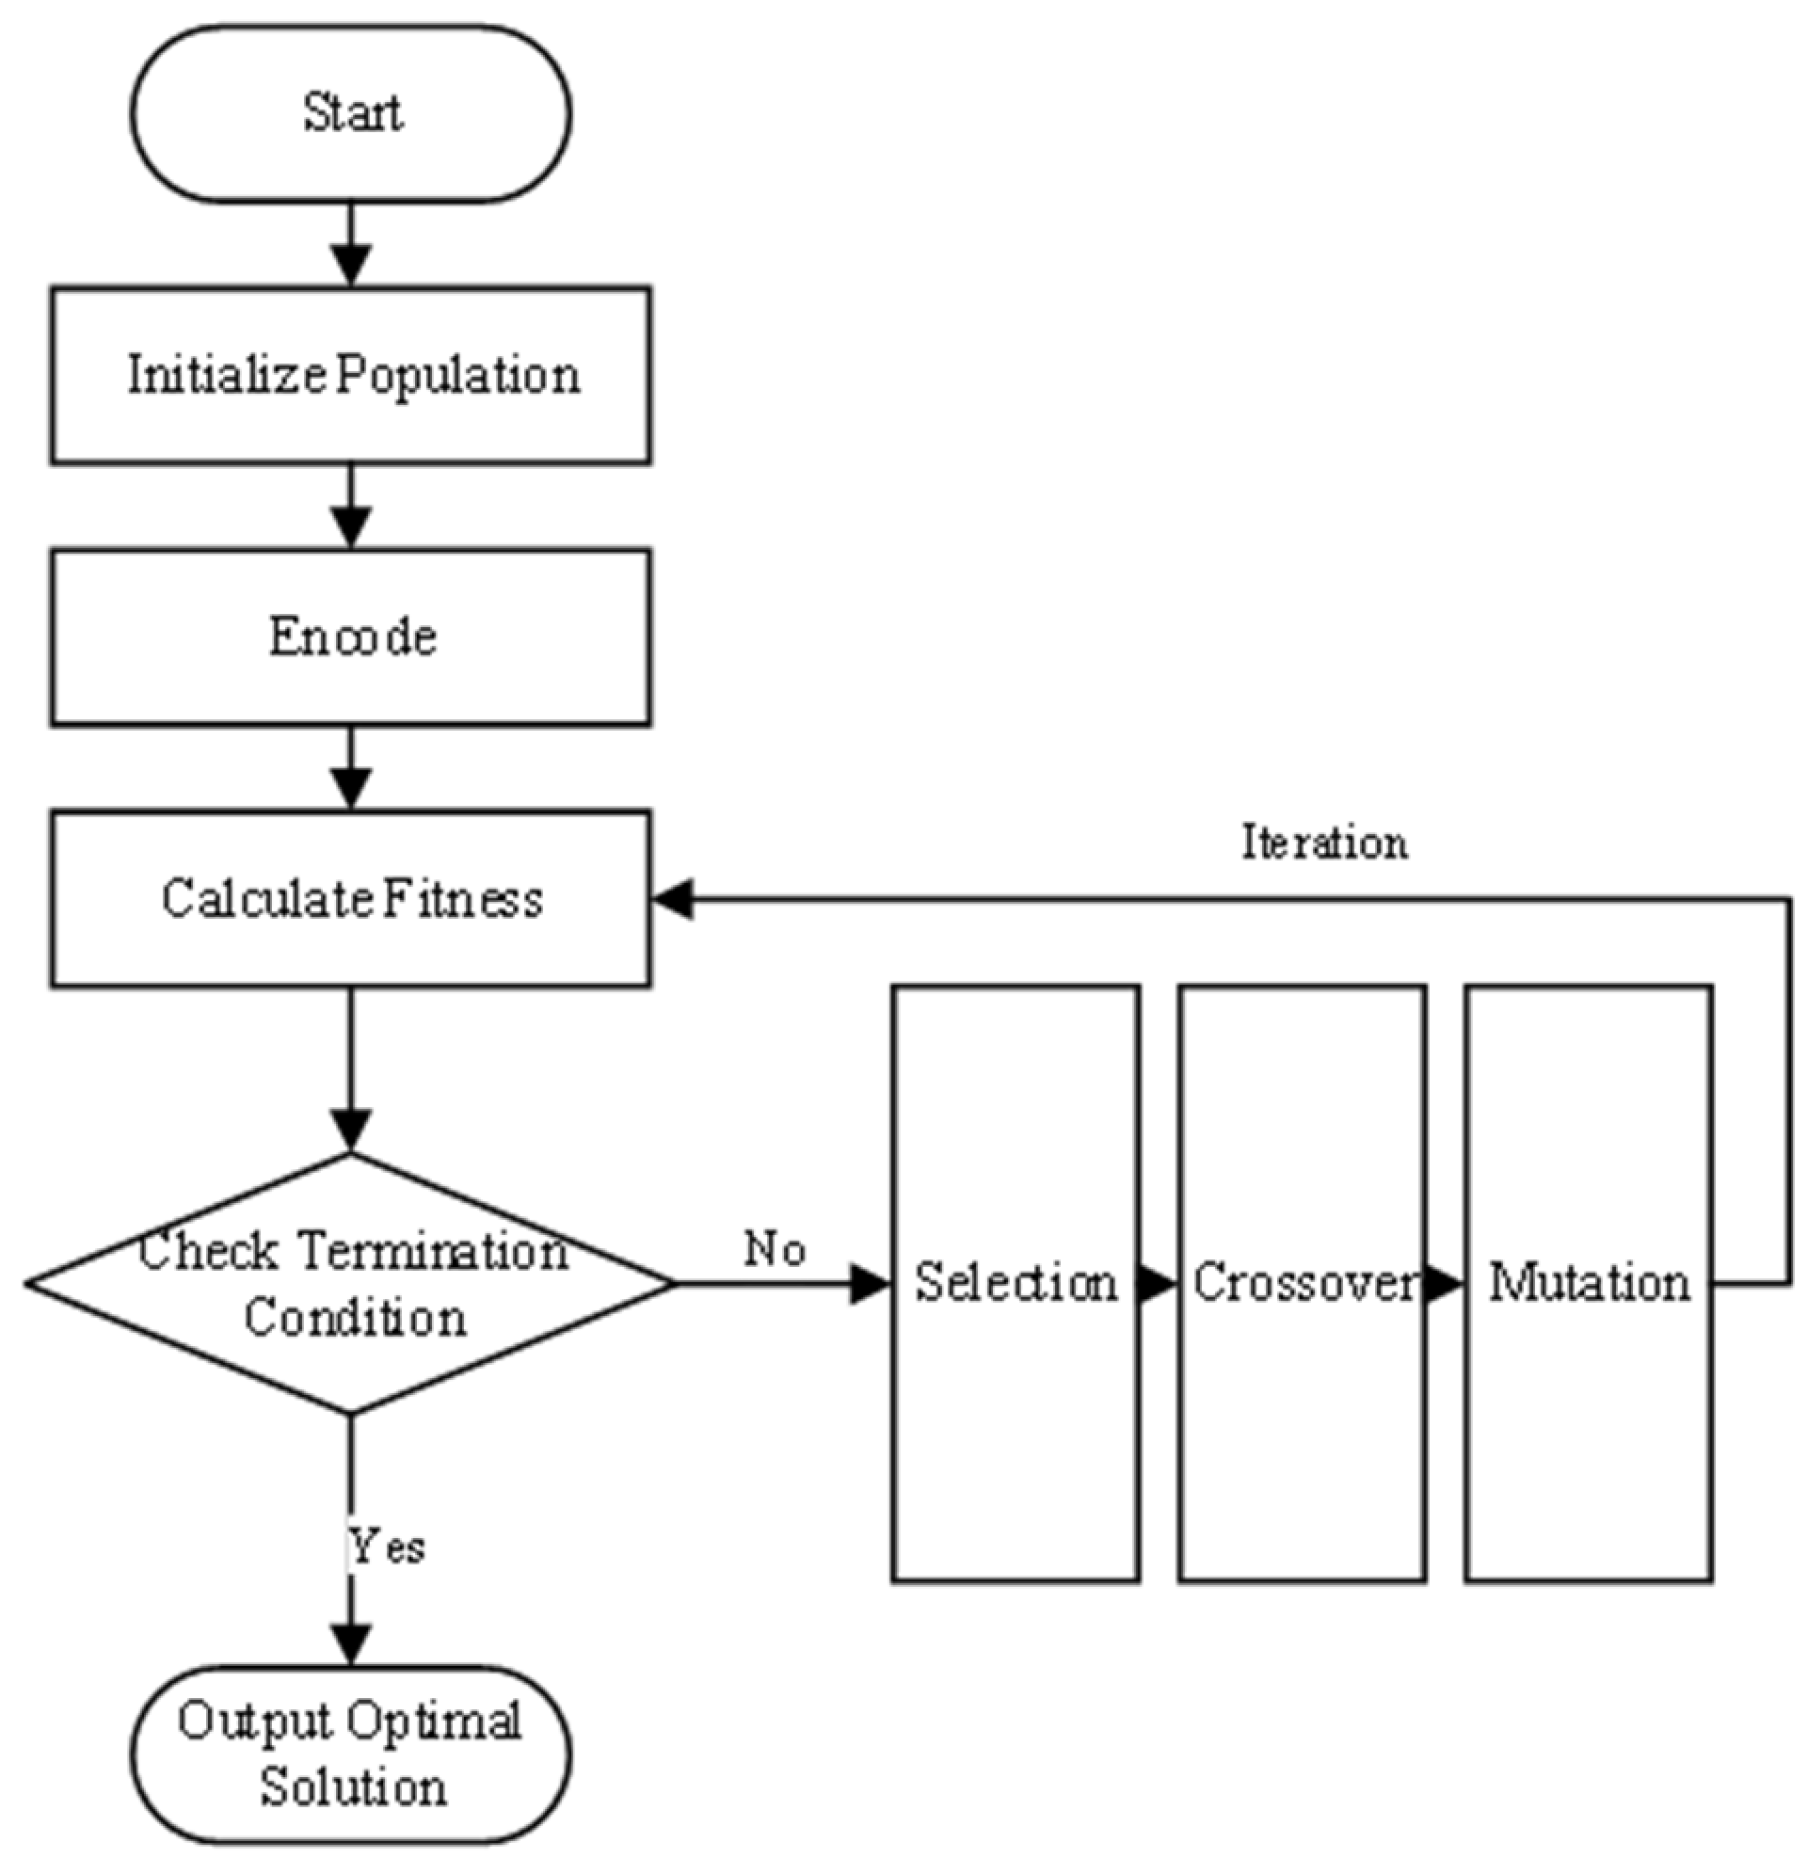
5.1. Agent Simulation Model and Genetic Algorithm Joint Solution
| Algorithm 1 Optimal solution update process. |
| Input: Current solution, optimal solution Output: optimal solution if (isBestSolutionFeasible()) then datasetBestFeasibleObjective.update(); end if if (!isCurrentSolutionFeasible()) then bestInfeasibleObjective = min(bestInfeasibleObjective, getCurrentObjectiveValue()); end if |
5.2. Experimental Design
- (1)
- The recommended average residual power level is set to ensure that the overall power of the fleet is maintained within a reasonable range through global coordination to avoid a concentrated outbreak of large-scale charging demand. This is because in the simulation process, each SAEVs is an independently operating intelligence that is able to make decisions autonomously based on its own state, such as choosing to charge, take orders, or cruise. This independence allows each vehicle to respond flexibly to dynamic travel demands and changes, thus improving the overall efficiency of the system. However, the independence of vehicles is not completely unconstrained; so, in this paper, the recommended average remaining power level is used as a global optimization aspect objective, which exerts a certain amount of influence on the charging decisions of vehicles. For example, when the system detects a low overall average residual power level, it may prioritize the charging behavior of vehicles to ensure the overall operational continuity of the fleet. The recommended range of values for average residual power is limited to between 3.6 kWh and 14.4 kWh (set according to SAEVs parameters).
- (2)
- Setting the charging probability in segments can finely control the charging decision of vehicles at different power levels, avoiding the waste of resources or service interruption caused by charging too early or too late. The power interval is divided into low power interval (20–40%), medium power interval (40–60%), and high power interval (60–80%), and the charging behavior of the vehicle is precisely regulated by setting differentiated charging probabilities for different power intervals. Charging in the low power interval avoids stopping driving due to low power; charging in the medium power interval is more flexible, which can better respond to future demand and also charge in advance to avoid large power consumption; charging in the high power interval is preventive charging. The value range of charging probability is set between 0 and 1.
- (3)
- As a variable of auxiliary charging behavior, parking probability directly affects vehicle idle time and empty vehicle mileage, balancing power consumption and order-taking behavior, which is the key to reducing vehicle charging frequency and optimizing charging resource utilization. The value range of parking probability is set between 0 and 1.
- (4)
- The role of the charging station selection model is to be able to join the charging station selection behavior under the decision-making of the probability parameter, to be able to make the whole charging decision-making process more complete, and to select the most appropriate charging station selection model under the current scenario, so as to make the optimization strategy more complete, to strengthen the analysis of the multi-dimensional factor changes in charging decision-making, and to explore the optimal strategy under different scenarios. The charging station selection model is the charging station selection set in Section 3.2.
5.3. Simulation Data Preprocessing
- (1)
- Simulation Environment Initialization: Load road network, charging station locations, and travel demand data. Initialize operational parameters, including charging prices, queuing rules, and service capacity. Reset simulation time with a total duration of 120 h and a time step size of one minute.
- (2)
- Vehicle Model Initialization: Configure initial vehicle parameters, positions, speeds, and behavioral patterns, including fleet size, battery capacity, maximum driving range, and energy consumption rate.
- (3)
- Data Logging System Initialization: Initialize the data recording system comprising statistical, storage, and analytical modules. Configure the system to capture critical simulation data (e.g., vehicle status, charging station states, charging events), preload real-time monitoring datasets and post-processing tools, and deploy visualization modules for live simulation monitoring and result analysis.
5.4. Additional Simulation Assumptions
- (1)
- Real-time Information Exchange. SAEVs maintain seamless connectivity with all charging stations, enabling dynamic sharing of critical operational data, including station locations, available charging points, charging prices, real-time queue lengths, and estimated waiting times.
- (2)
- Charging Station Facilities. All stations are publicly accessible and equipped with infrastructure meeting SAEV charging requirements, including compatible charging interfaces and adequate power supply. Each station is configured such that the number of vehicle parking spaces matches that of charging points.
- (3)
- Road Network Assumptions. The road network is assumed to operate under ideal free-flow conditions, with traffic signals, congestion phenomena, and other external disturbances explicitly excluded from the simulation scope.
- (4)
- Charging Protocol. SAEVs adopt a “Full-Charge Departure” policy at charging stations, immediately vacating the station upon reaching full battery capacity.
- (5)
- Parking Behavior Policy. SAEVs implement a flexible parking strategy, immediately departing the parking facility when either the parking duration reaches a preset threshold or a new mobility request is received.
6. Optimization Results Analysis
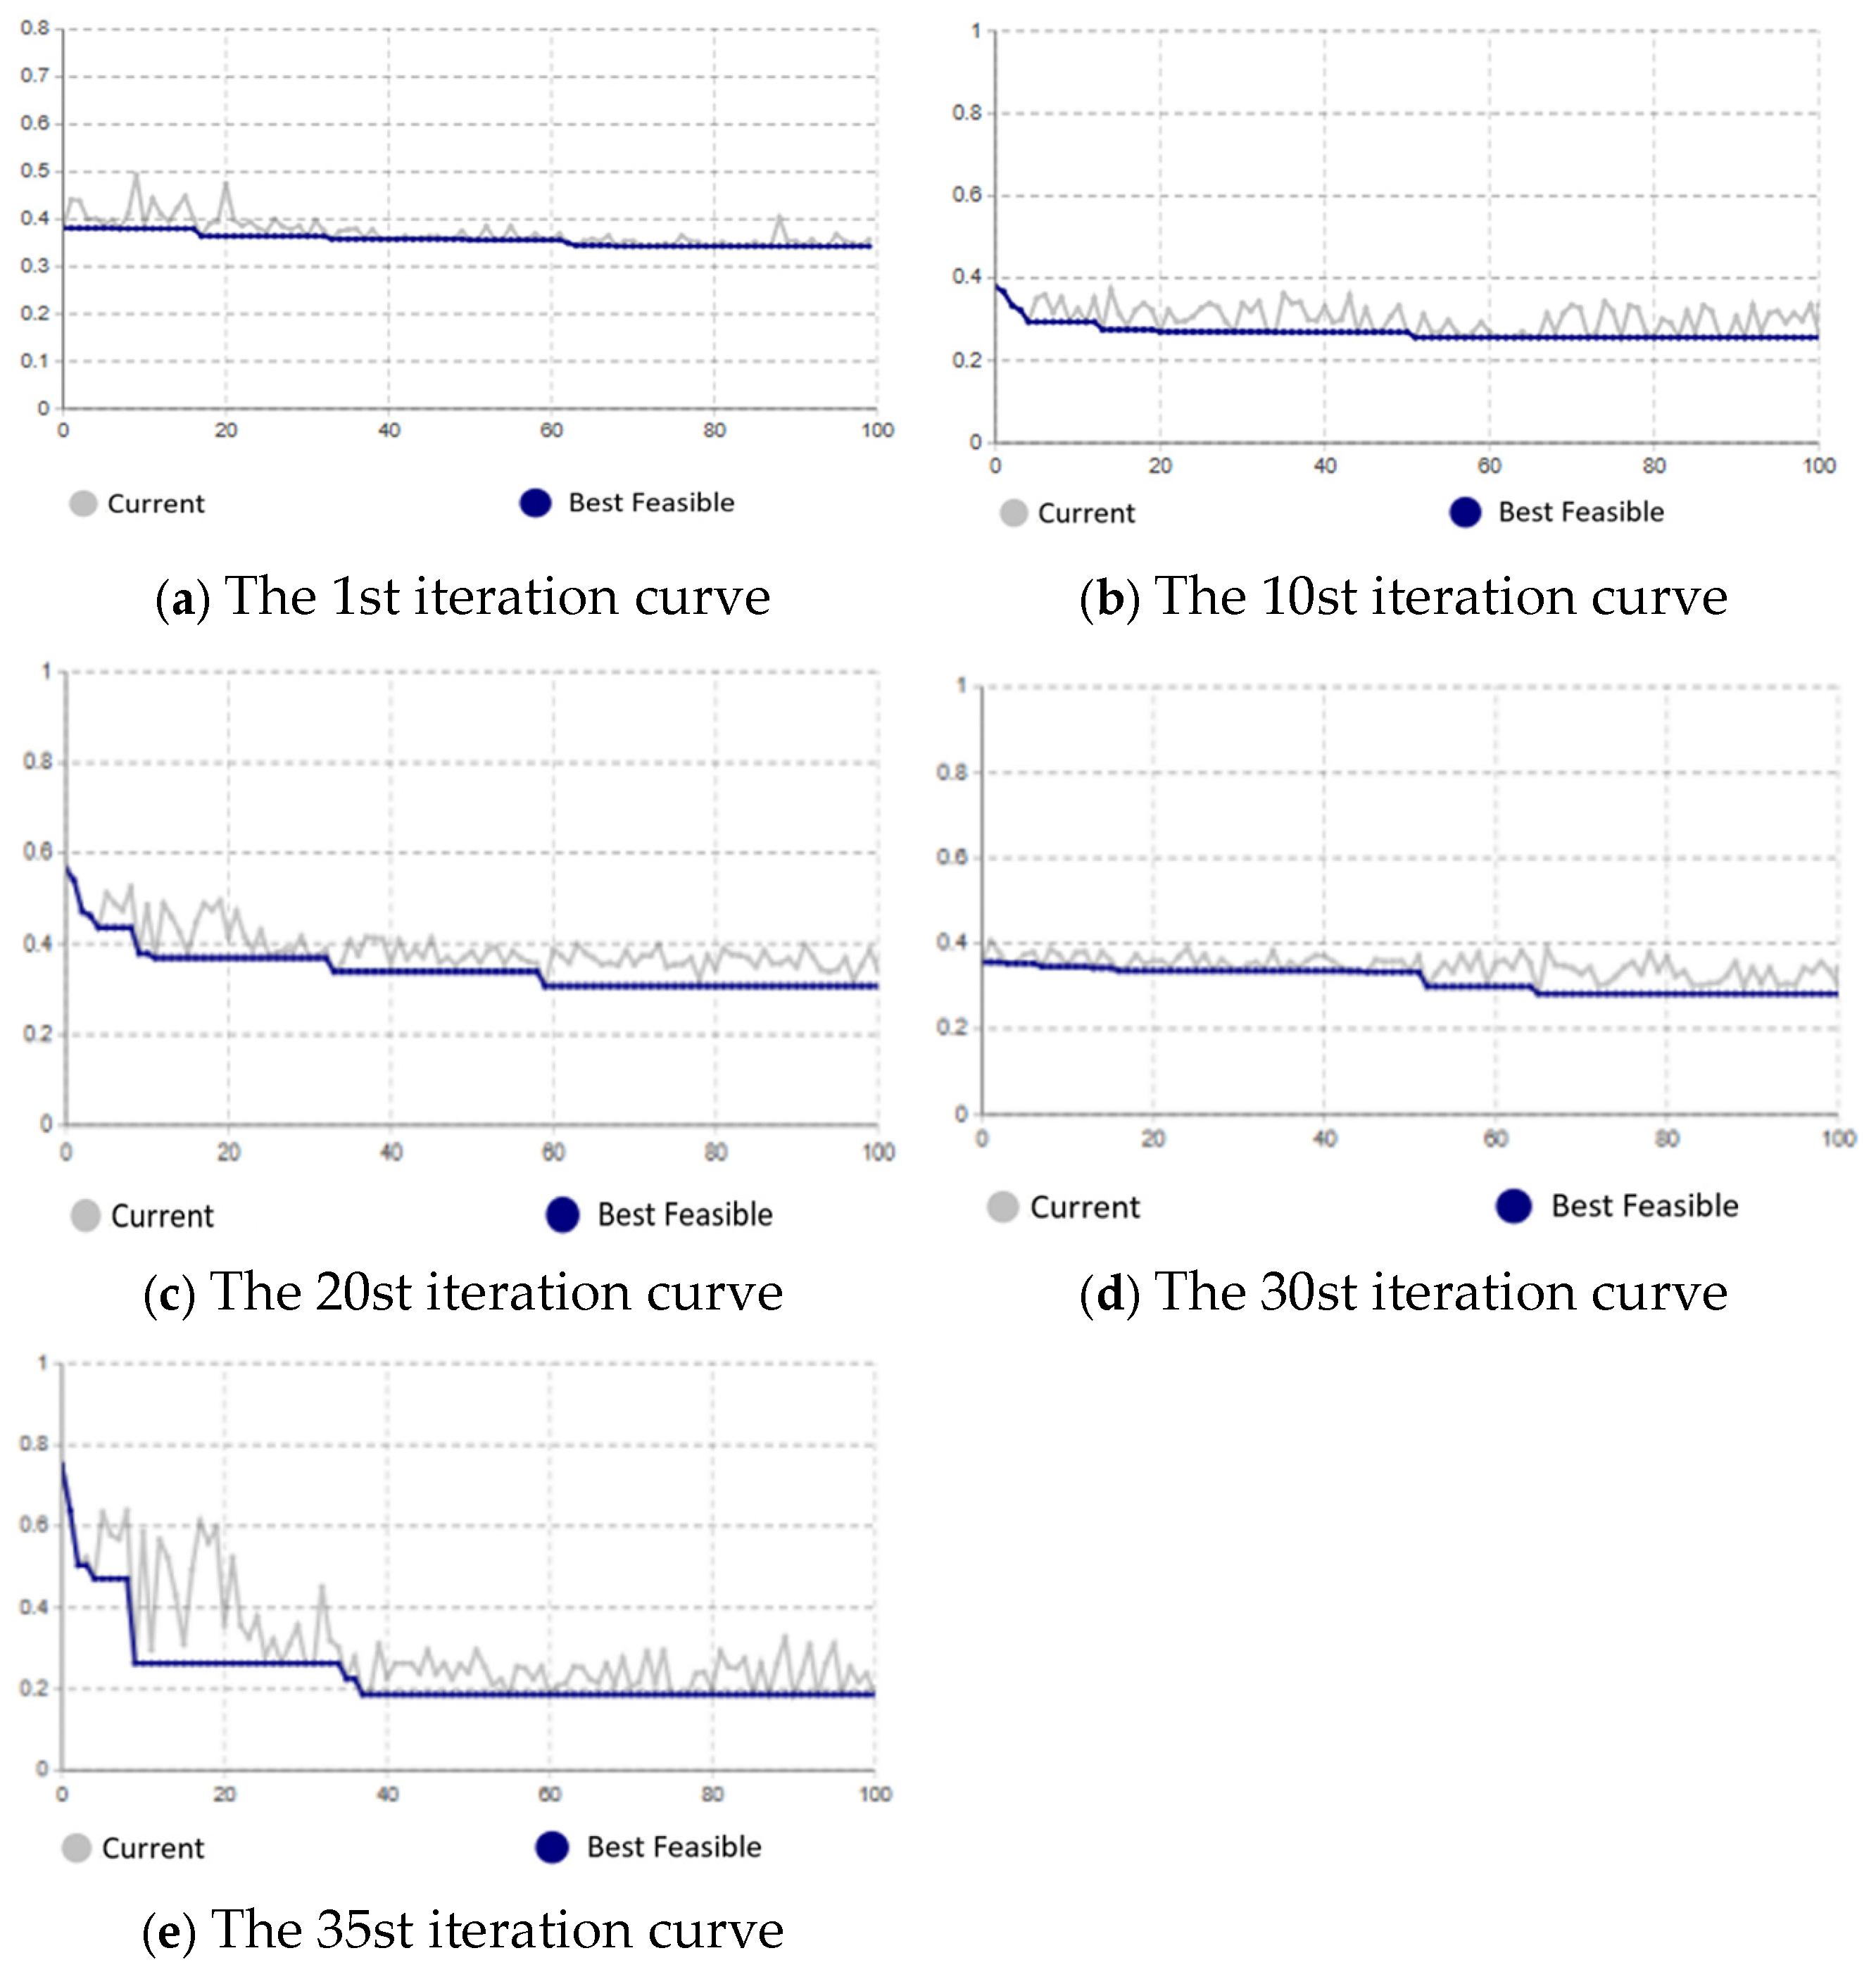
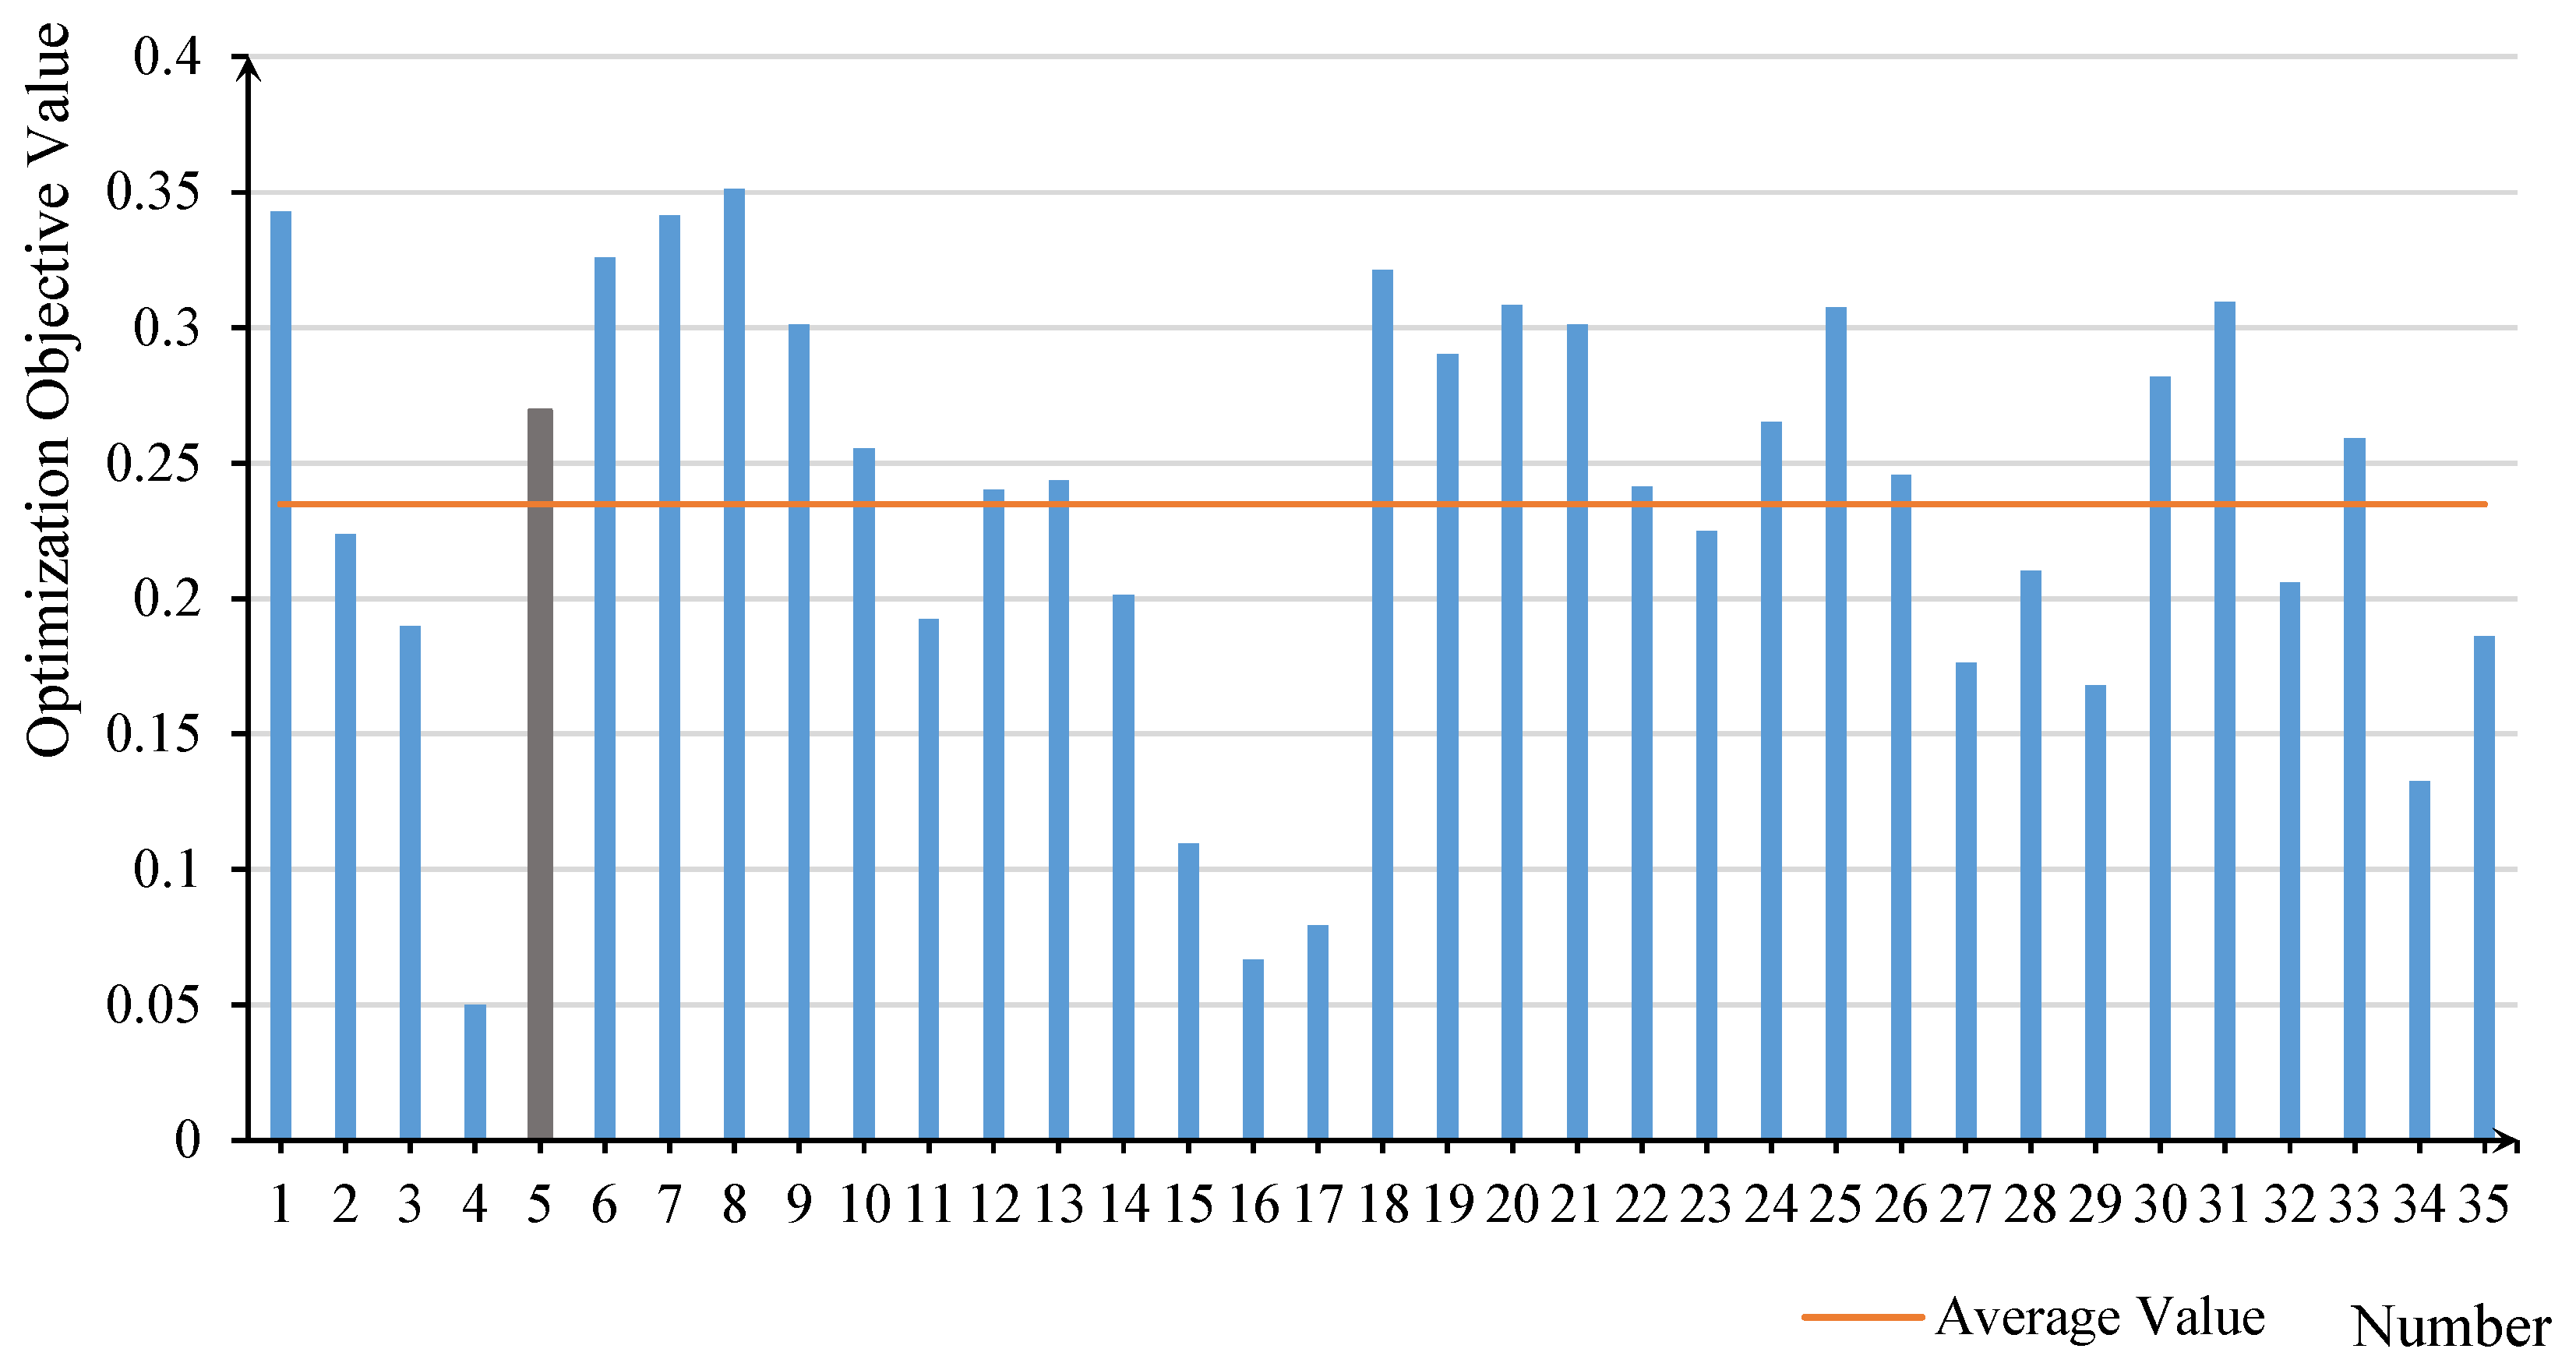
6.1. Analysis of the Variation Pattern of Optimal Objective Values Under Different Scenarios
6.2. Analysis of Conflicting Sub-Objectives
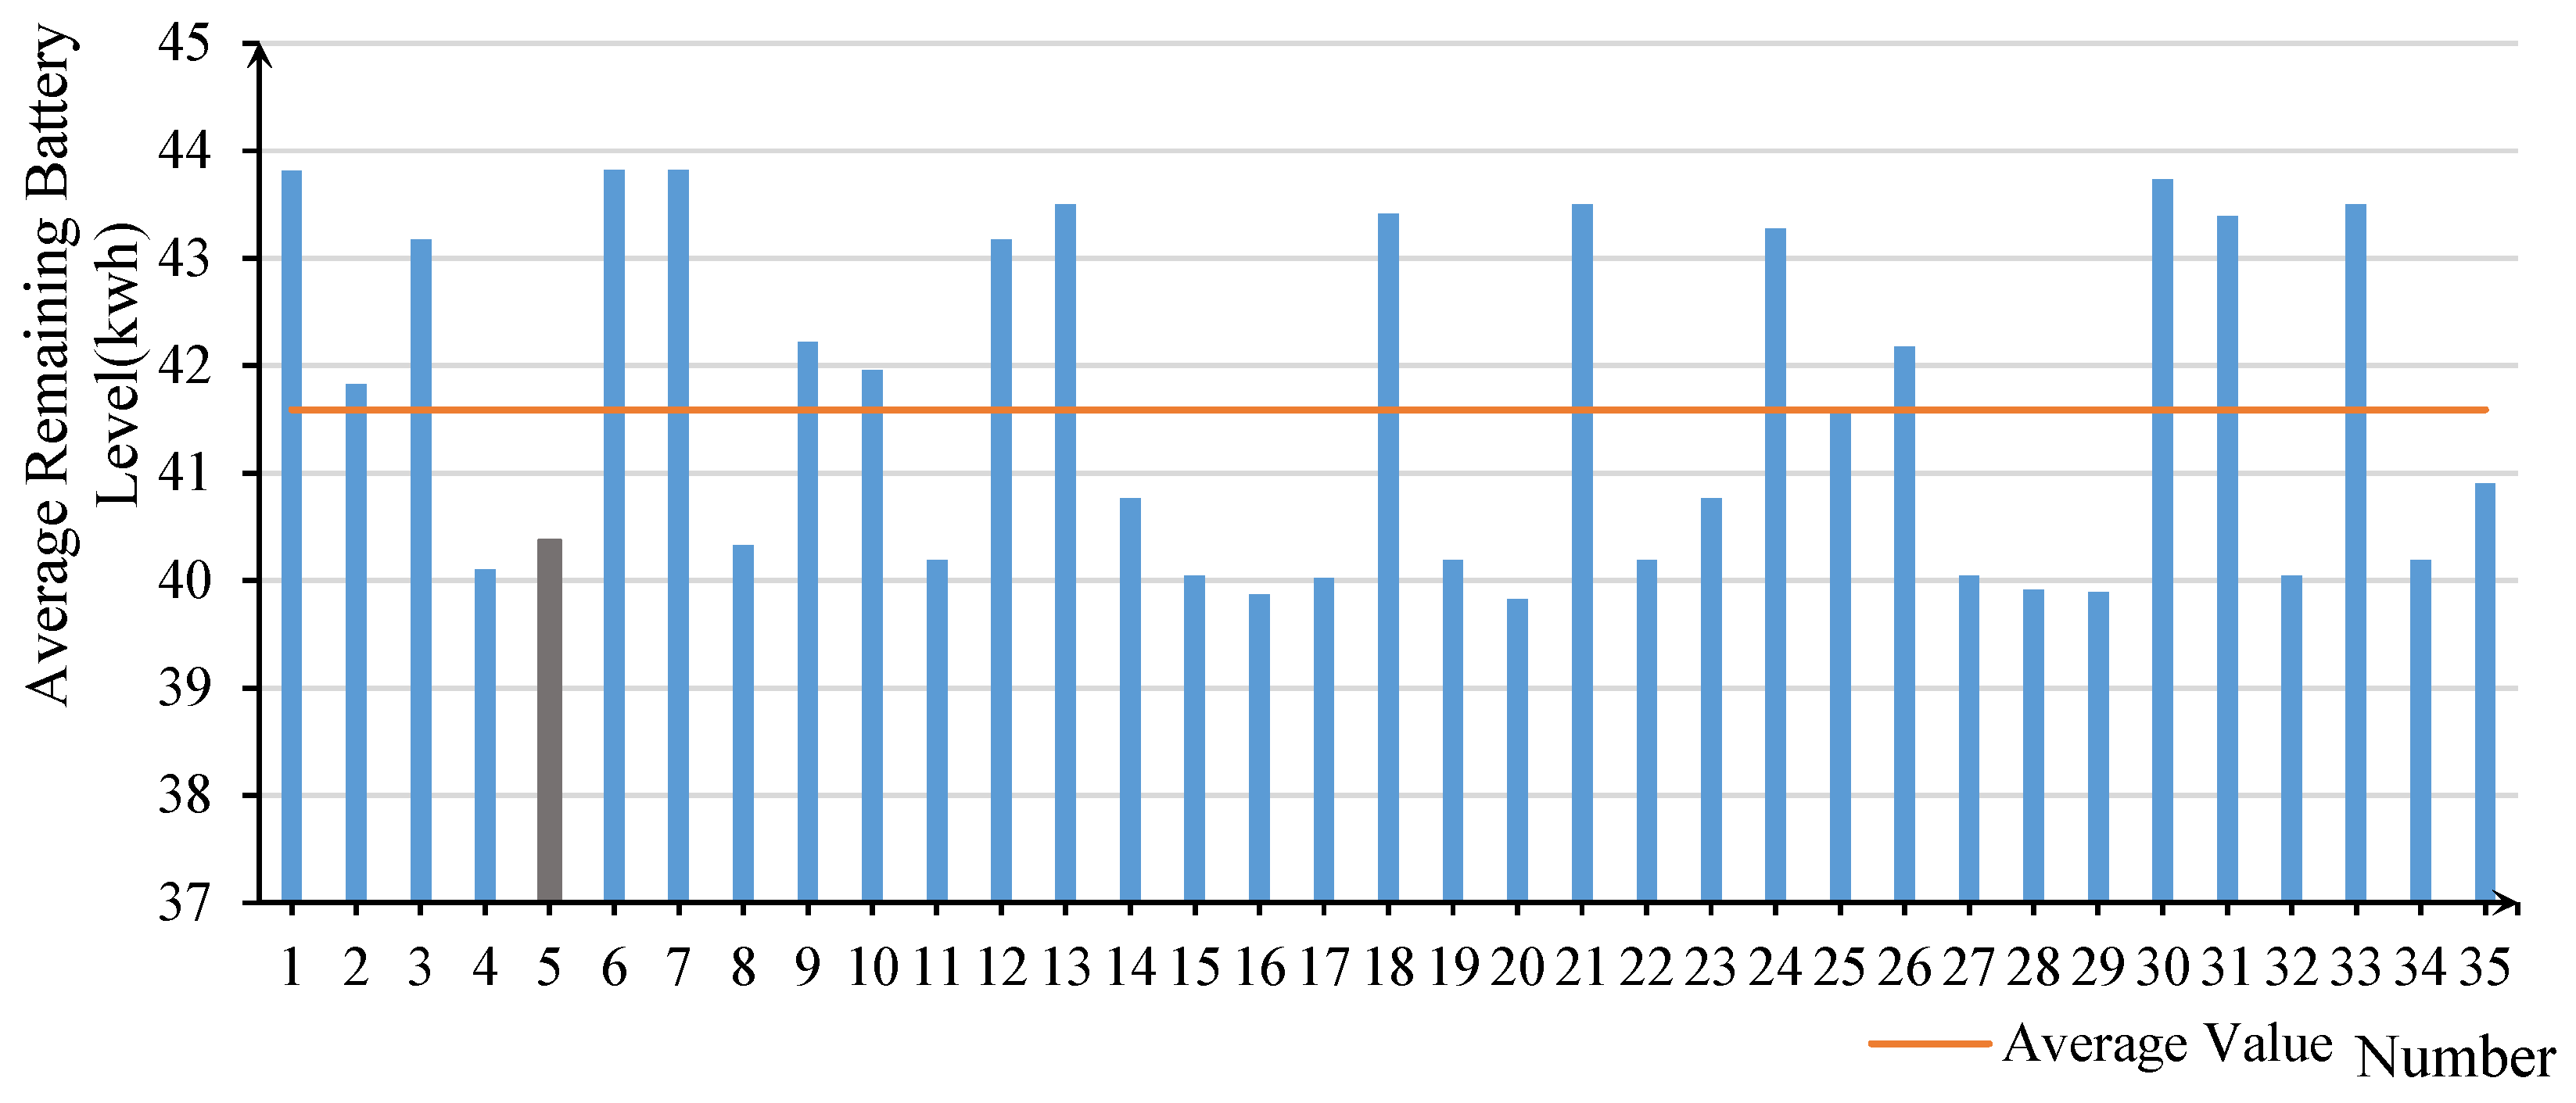
6.2.1. Average Remaining Battery Level
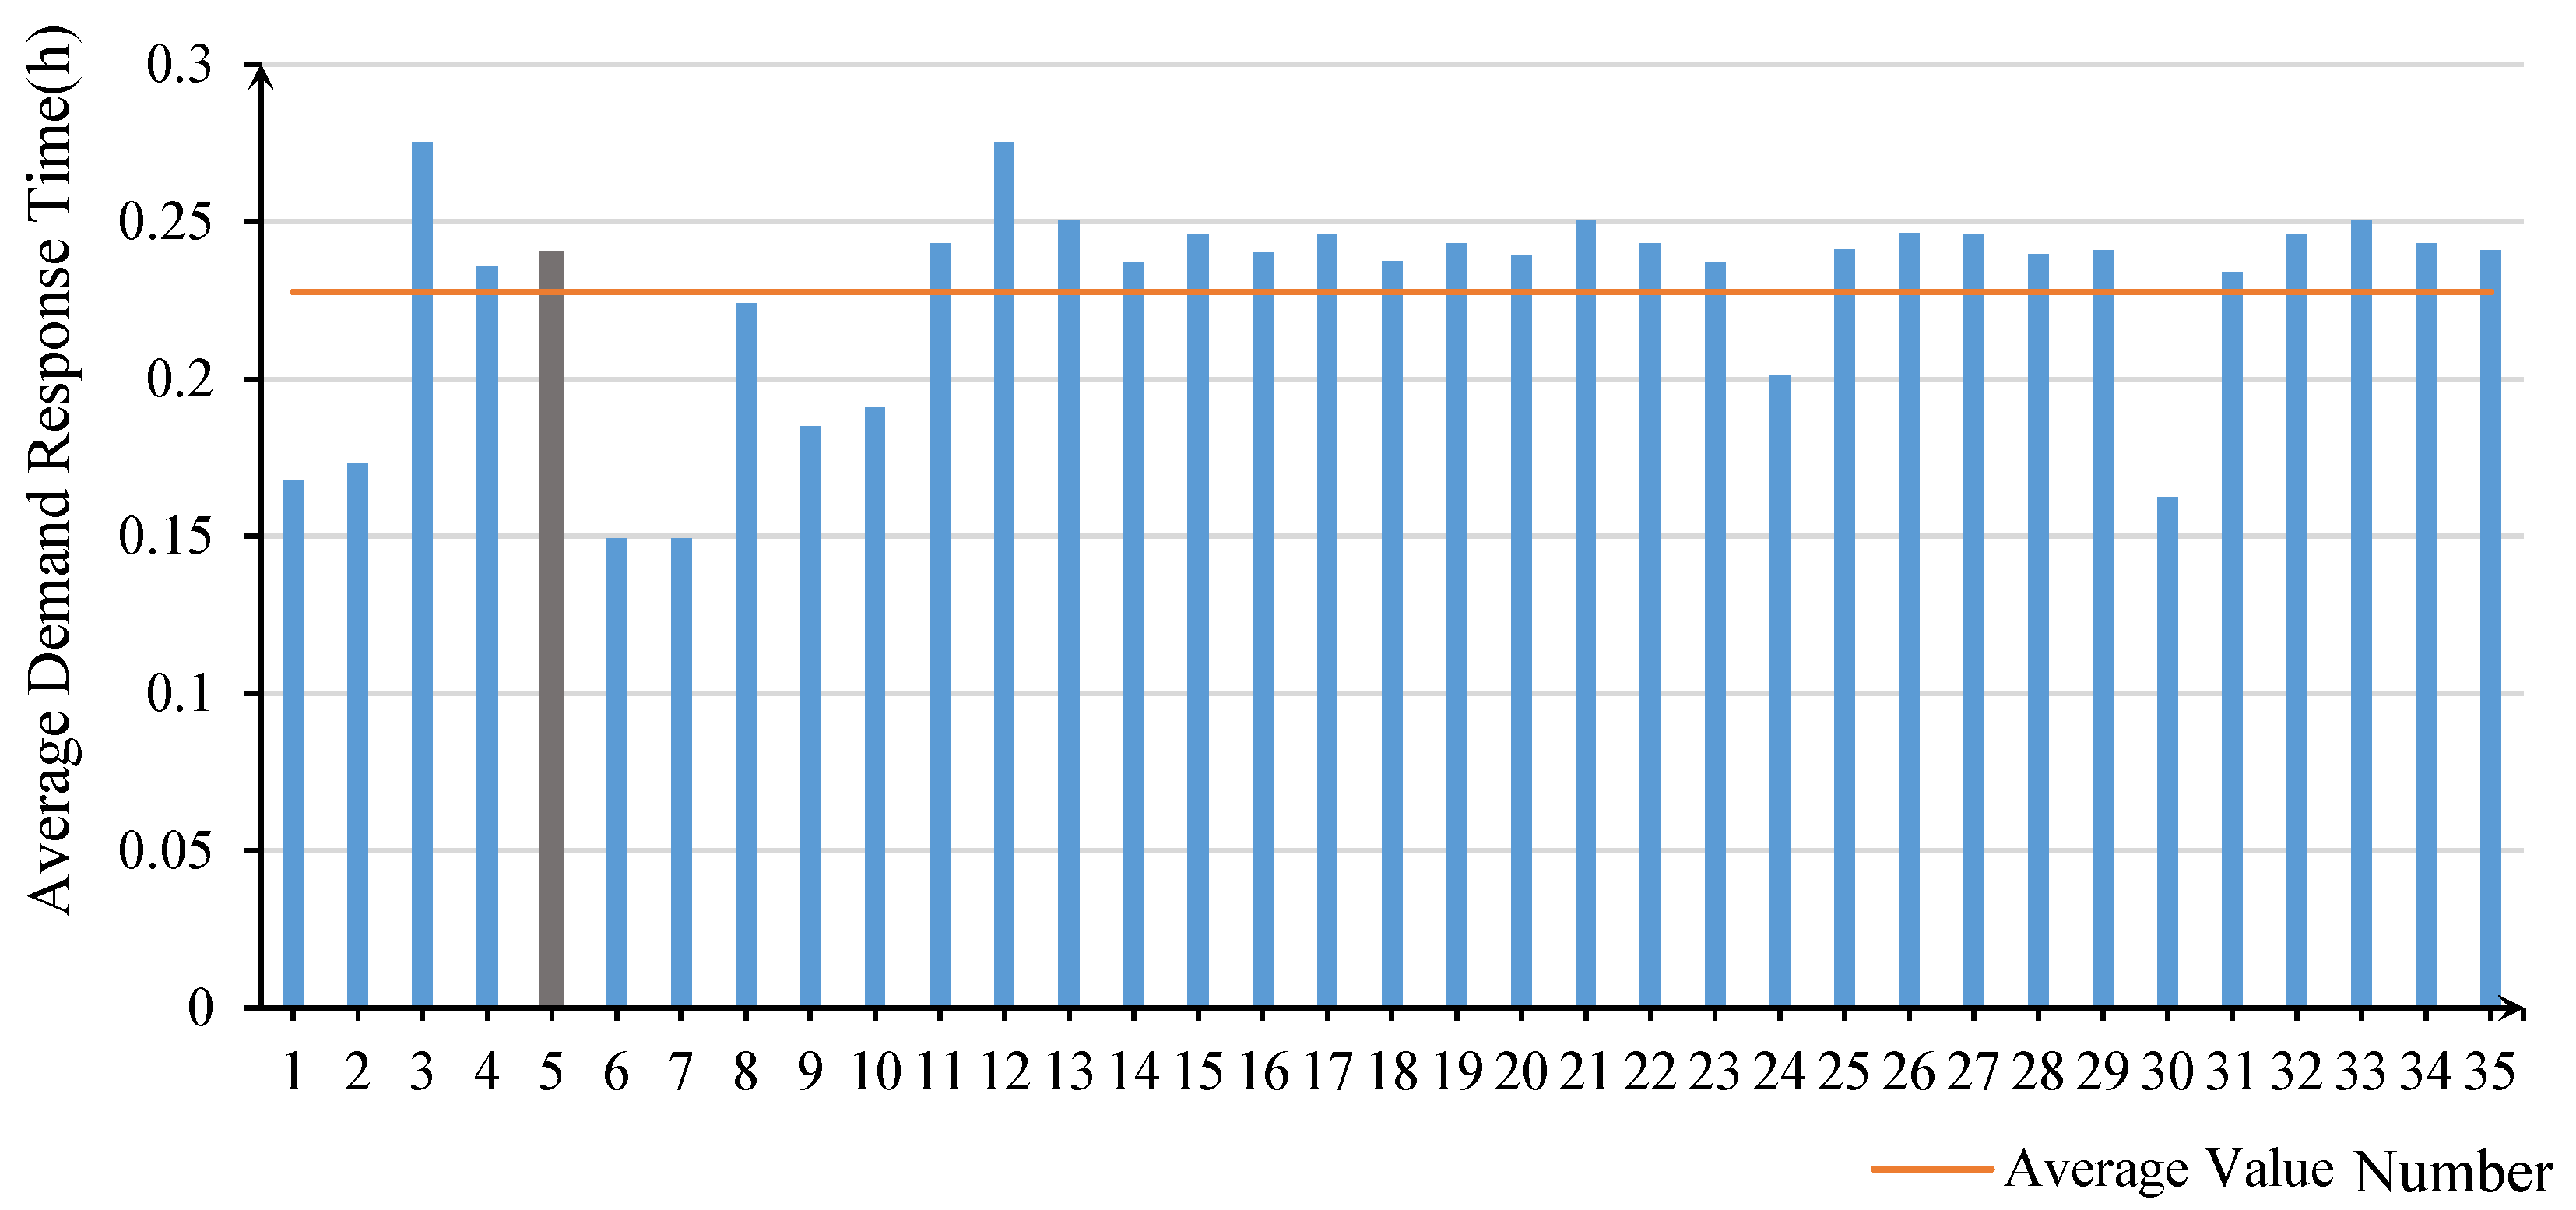
6.2.2. Average Demand Response Time
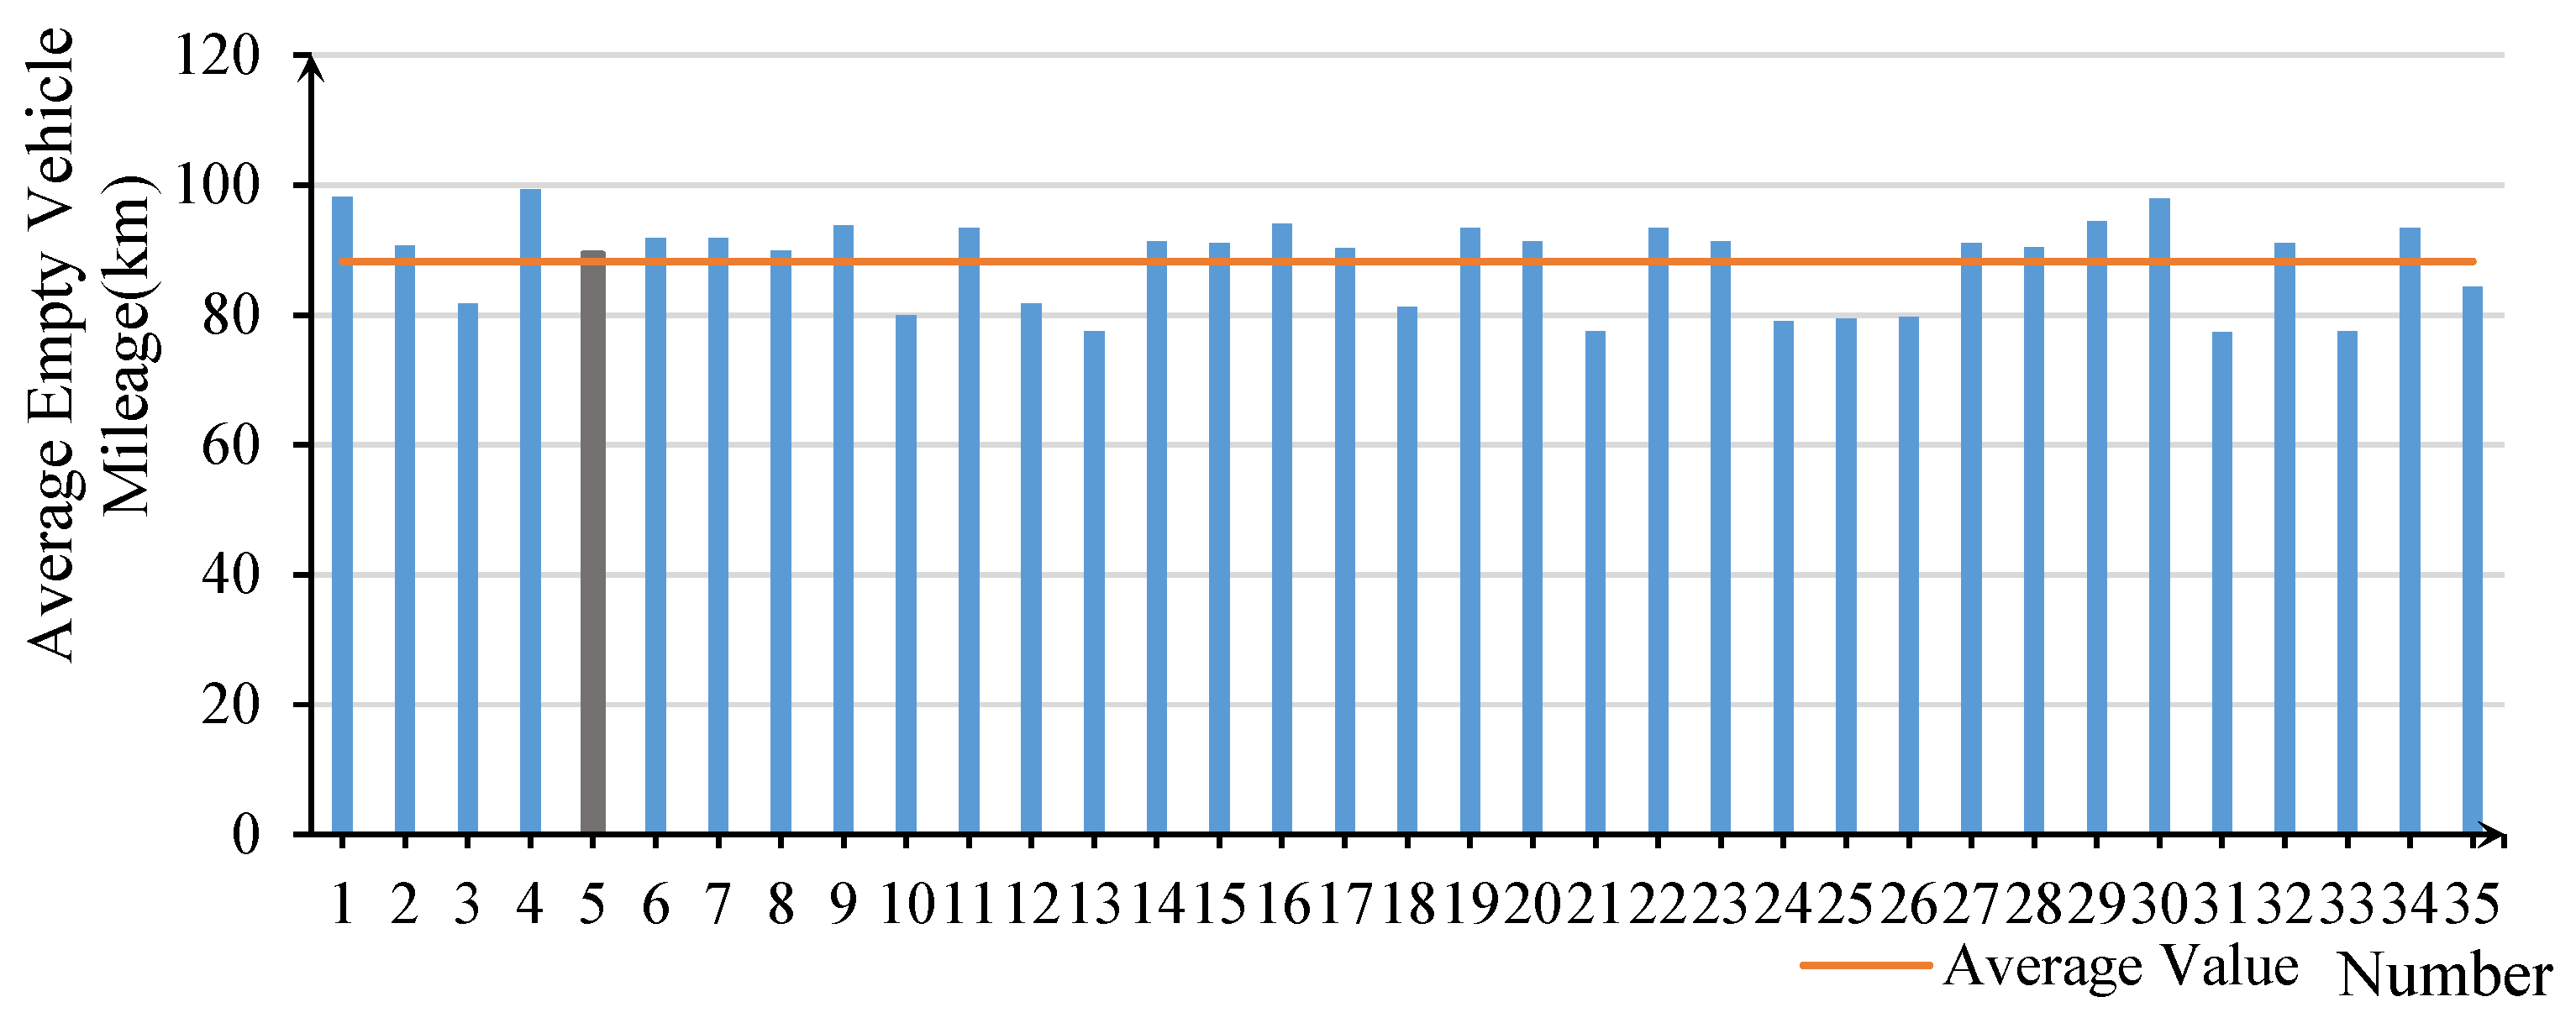
6.2.3. Average Empty Vehicle Mileage
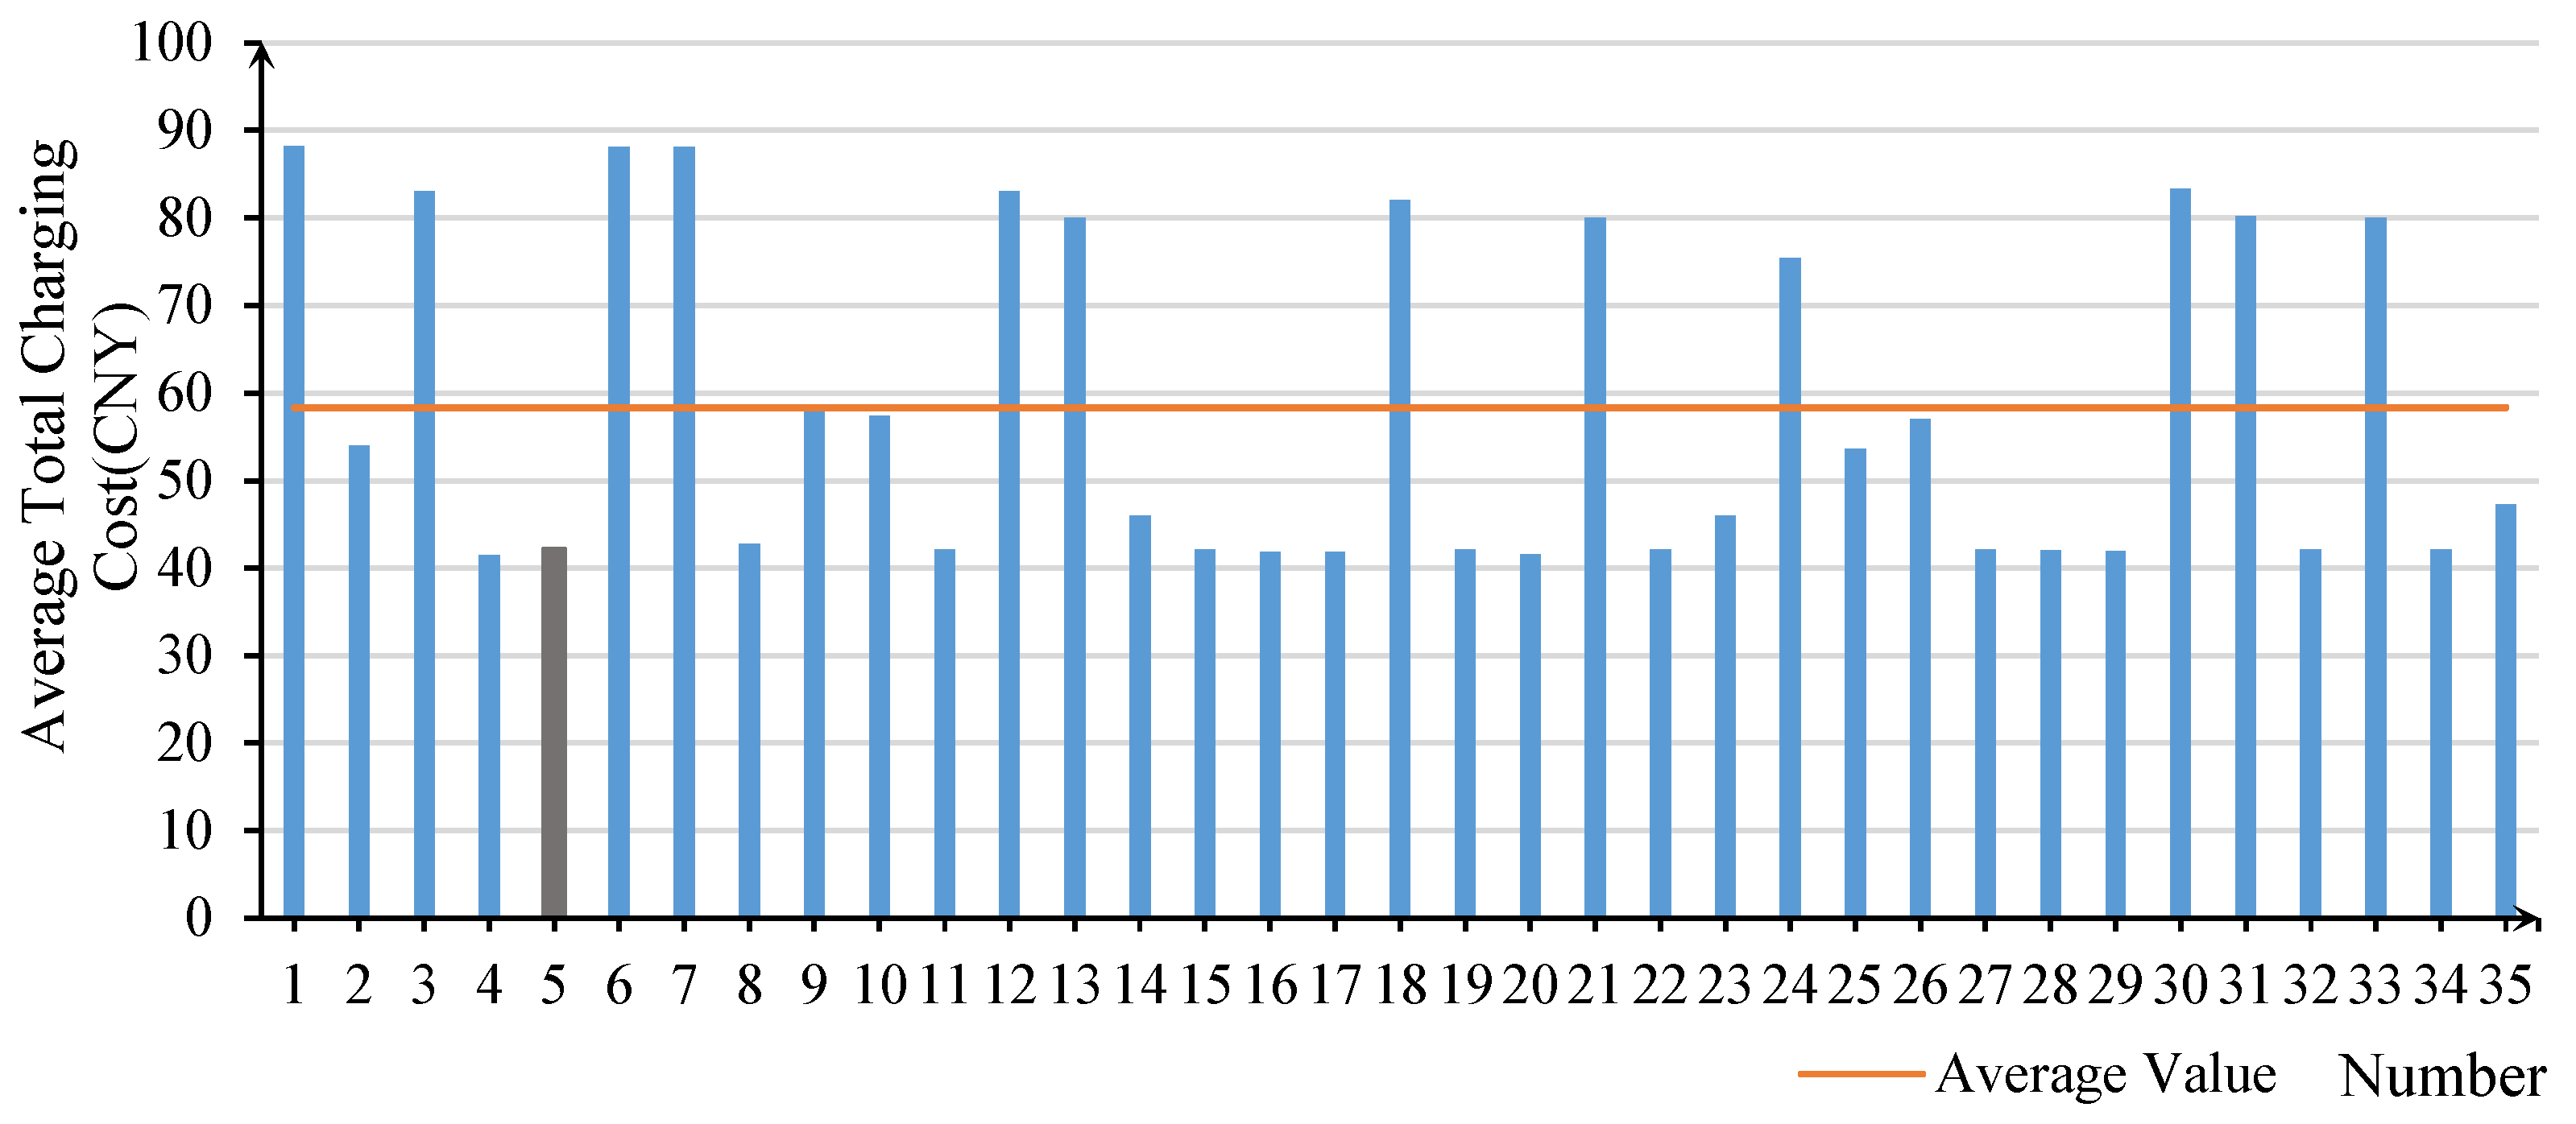
6.2.4. Average Total Charging Cost
6.2.5. Sub-Objective Relationships
- (1)
- Trade-off Between Surplus Power And Charging Costs
- (2)
- Trade-off Between Demand Response Time and Empty Vehicle Mileage
- (3)
- Recommended Multi-Objective Optimization Strategies
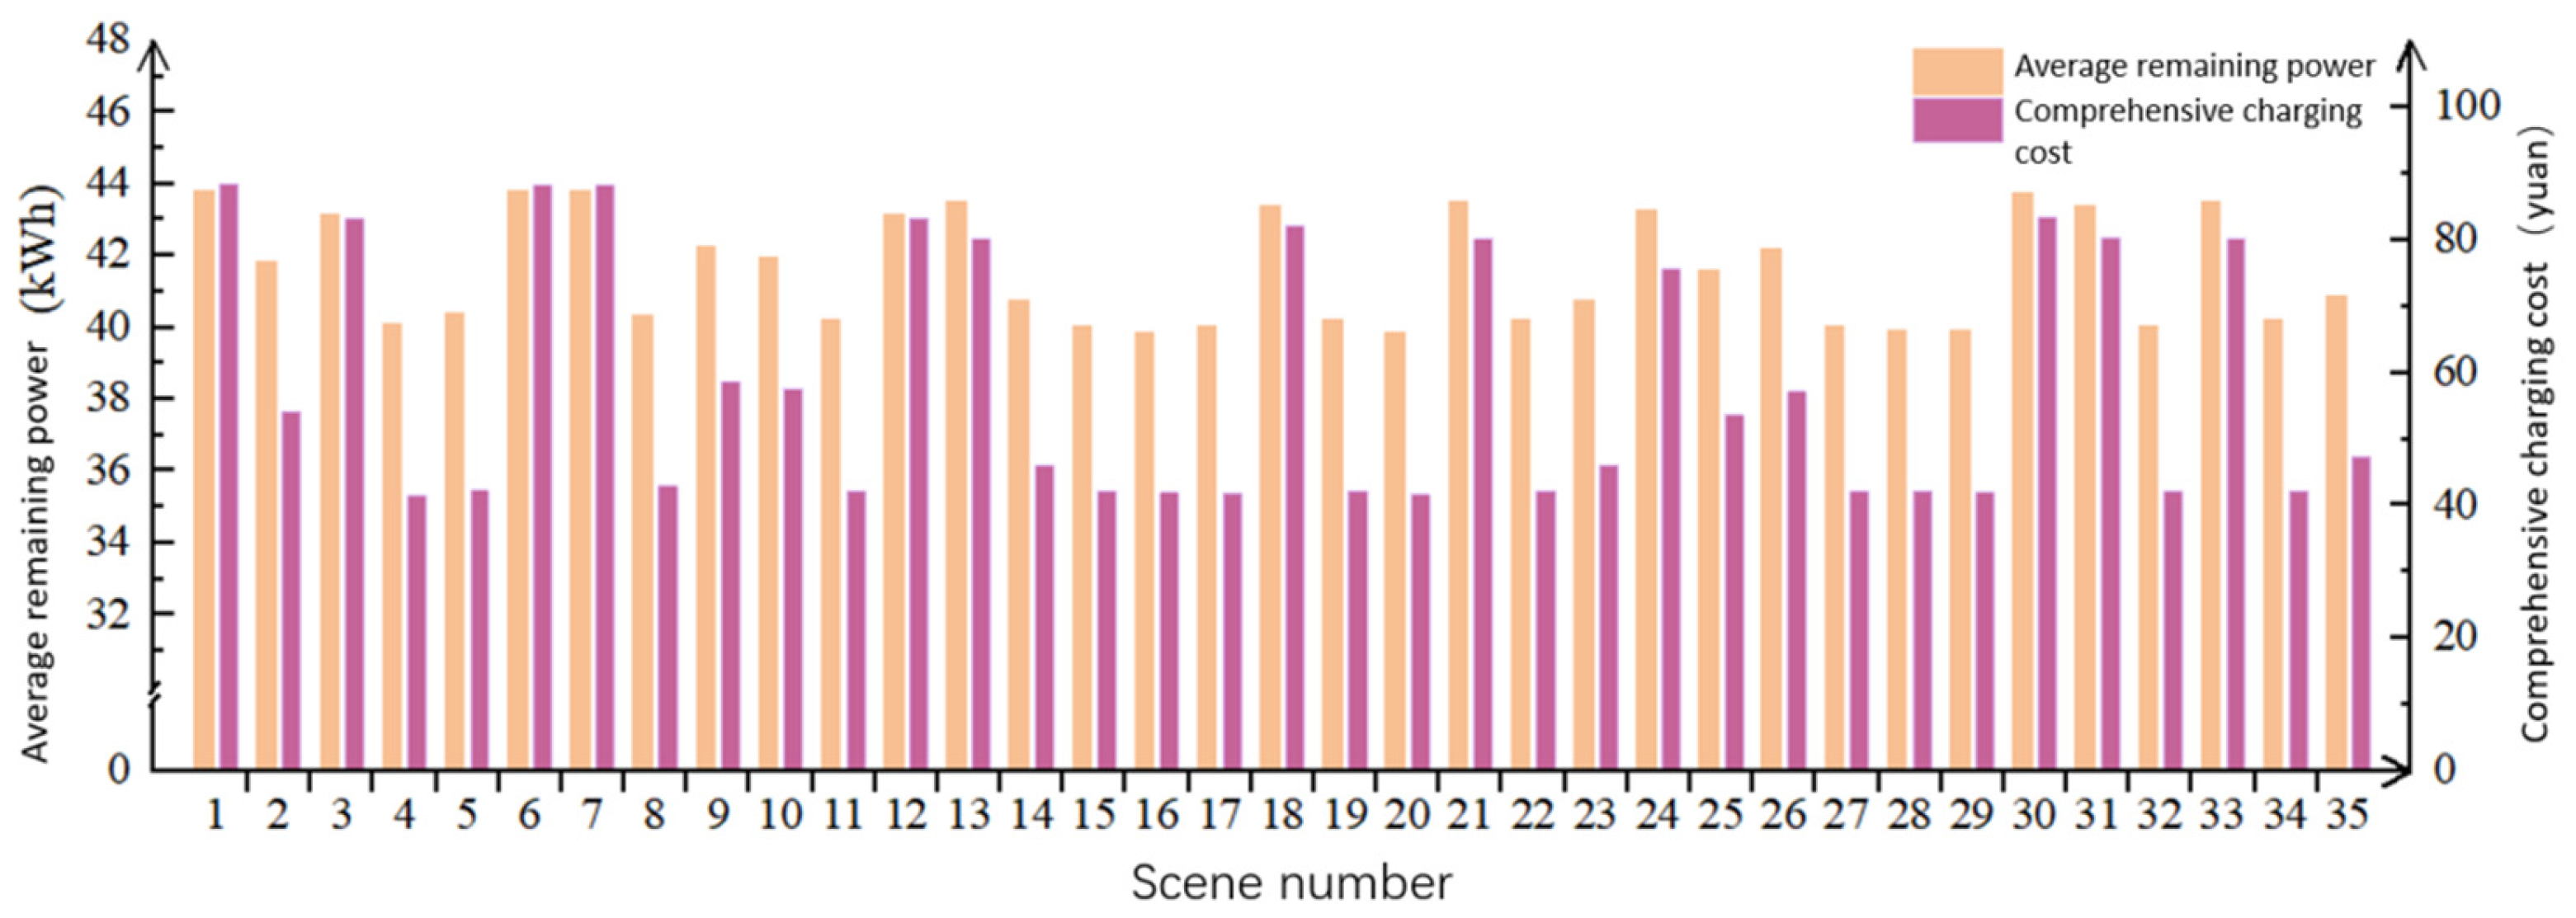
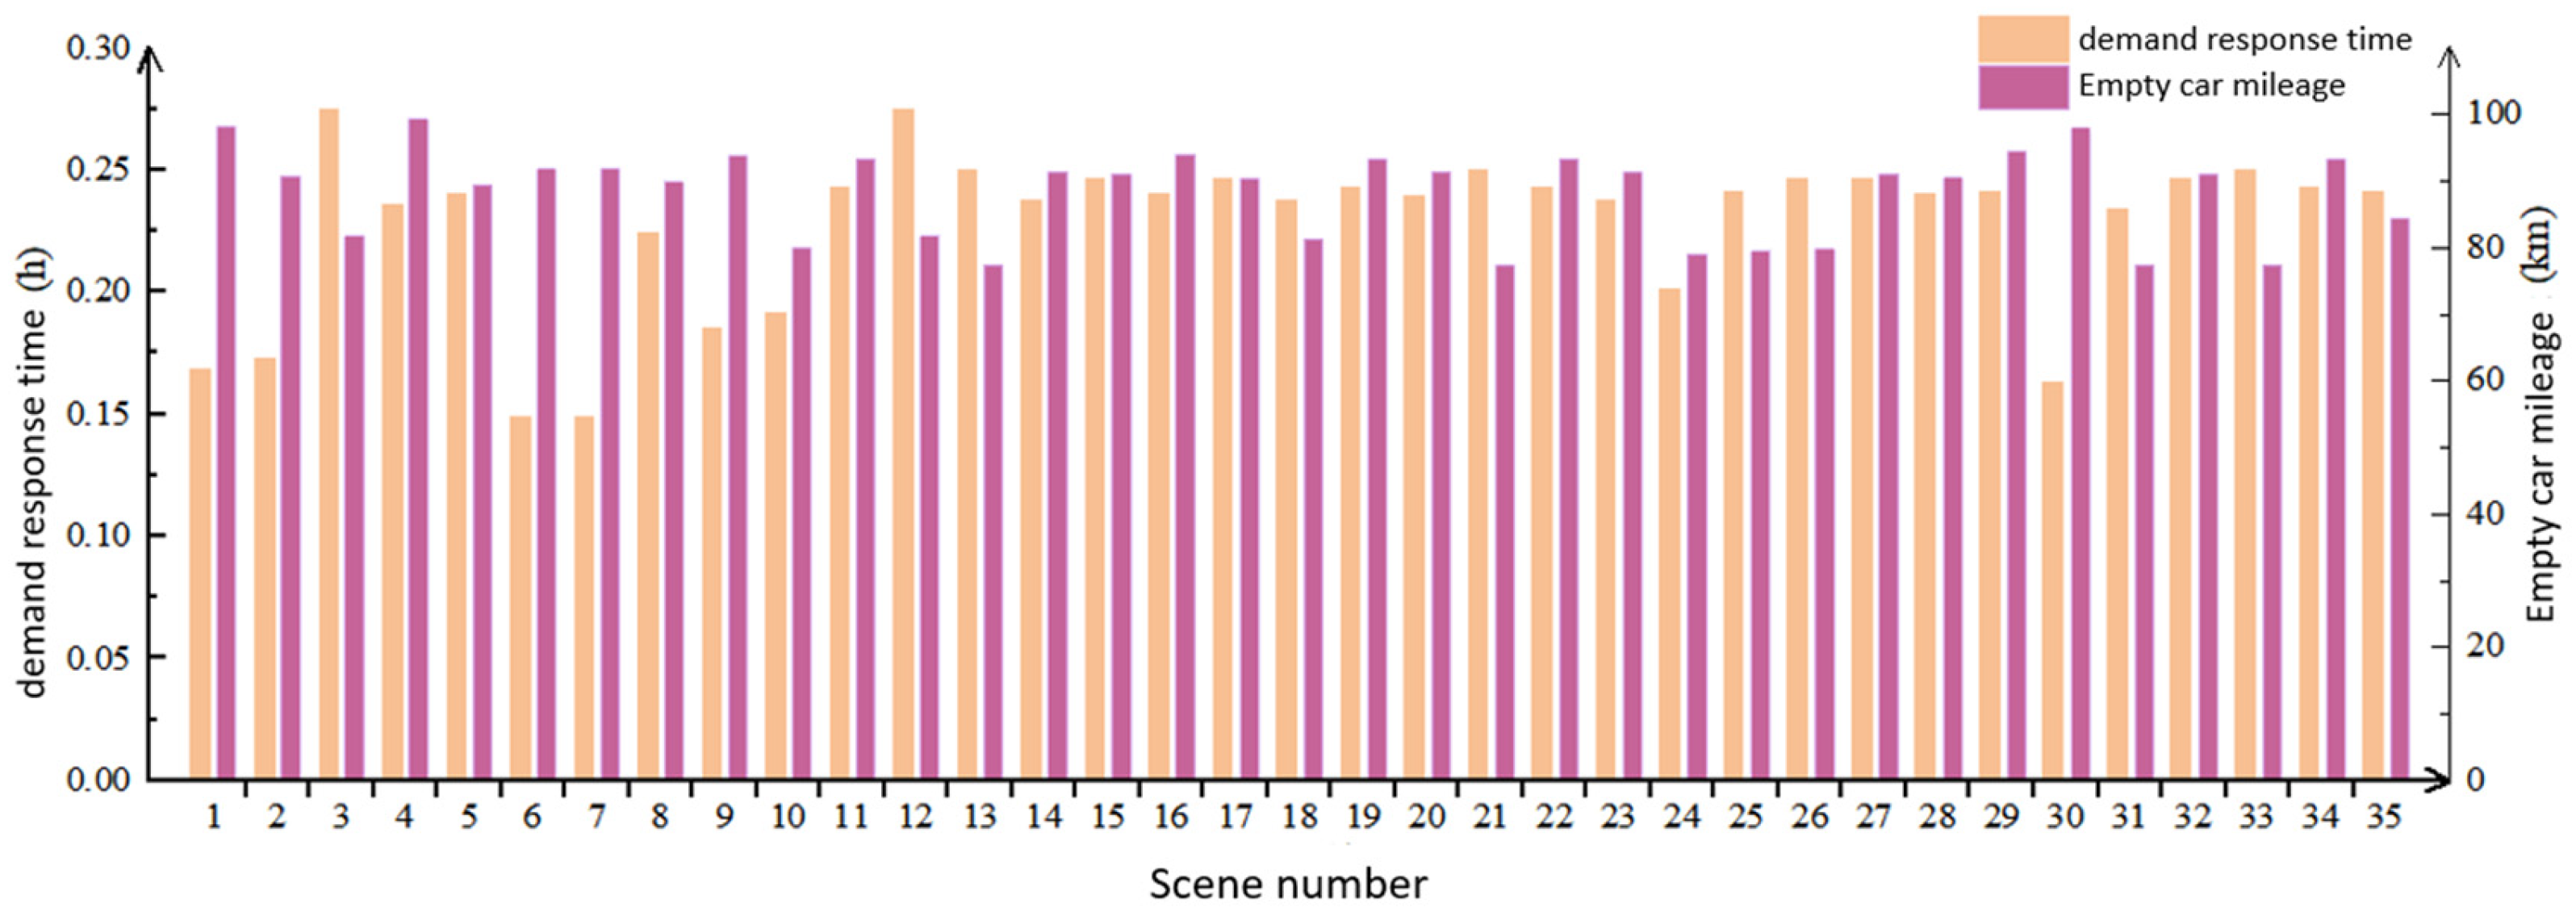
- Cost-Control Strategy (Scenario 17, weights: 0, 0, 0.25, 0.75): Achieves the second-lowest cost of 41.810 CNY but at the expense of higher empty vehicle mileage (90.327 km, 10.5% higher than the optimal value). Suitable for peak electricity price periods.
- Emergency Response Strategy (Scenario 10, weights: 0, 0.75, 0.25, 0): Ensures a low demand response time of 0.191 h (third lowest across all scenarios) while maintaining relatively optimal empty vehicle mileage of 79.944 km. Suitable for peak travel demand periods.
- Balanced Strategy (Scenario 5, weights: 0.25, 0.25, 0.25, 0.25): All objectives deviate less than 15% from their optimal values, making it a viable baseline strategy.
6.3. Decision Variable Sensitivity Analysis and Optimal Strategy Analysis
- (1)
- Charging Probability:
- (2)
- Parking Probability:
- (3)
- Recommended Average Remaining Battery Level:
- (4)
- Charging station selection model
7. Conclusions and Discussions
- (1)
- In single-objective optimization, the goal of minimizing comprehensive charging costs best balances overall fleet performance. In multi-objective optimization, adjusting its weight to 0.5–0.75 effectively coordinates passenger demand with operator requirements.
- (2)
- Significant trade-offs exist between sub-objectives: increasing average remaining battery level raises charging costs, while shortening demand response time may increase empty-run mileage.
- (3)
- For different operational scenarios, weight distributions, charging probabilities, parking probabilities, and recommended charge levels must be adjusted. In general scenarios, the recommended charging probability for the medium charge range is 0.5–0.7. During short-term peak periods prioritizing response speed, the charging probability for the low charge range should be increased to above 0.7. During off-peak or low-tariff periods, cost-effectiveness takes precedence, recommending a medium-level charging probability of 0.8. In areas with sustained long-term demand or uneven charging infrastructure distribution, appropriately increase the high-level charging probability while maintaining average remaining energy above 30 kWh.
Author Contributions
Funding
Data Availability Statement
Acknowledgments
Conflicts of Interest
References
- Zhen, L.; Xu, Z.; Ma, C.; Xiao, L. Hybrid electric vehicle routing problem with mode selection. Int. J. Prod. Res. 2019, 58, 562–576. [Google Scholar] [CrossRef]
- Szinai, J.K.; Sheppard, C.J.R.; Abhyankar, N.; Gopal, A.R. Reduced grid operating costs and renewable energy curtailment with electric vehicle charge management. Energy Policy 2020, 136, 111051. [Google Scholar] [CrossRef]
- Liu, L.; Zhou, K. Electric vehicle charging scheduling considering urgent demand under different charging modes. Energy 2022, 249, 123714. [Google Scholar] [CrossRef]
- Yi, Z.; Smart, J. A framework for integrated dispatching and charging management of an autonomous electric vehicle ride-hailing fleet. Transp. Res. Part D Transp. Environ. 2021, 95, 102822. [Google Scholar] [CrossRef]
- Kim, S.; Lee, U.; Lee, I.; Kang, N. Idle vehicle relocation strategy through deep learning for shared autonomous electric vehicle system optimization. J. Clean. Prod. 2022, 333, 130055. [Google Scholar] [CrossRef]
- Kullman, N.D.; Cousineau, M.; Goodson, J.C.; Mendoza, J.E. Dynamic Ride-Hailing with Electric Vehicles. Transp. Sci. 2021, 56, 775–794. [Google Scholar] [CrossRef]
- Yang, X.; Niu, D.; Sun, L.; Ji, Z.; Zhou, J.; Wang, K.; Siqin, Z. A bi-level optimization model for electric vehicle charging strategy based on regional grid load following. J. Clean. Prod. 2021, 325, 129313. [Google Scholar] [CrossRef]
- Dean, M.D.; Gurumurthy, K.M.; de Souza, F.; Auld, J.; Kockelman, K.M. Synergies between repositioning and charging strategies for shared autonomous electric vehicle fleets. Transp. Res. Part D Transp. Environ. 2022, 108, 103314. [Google Scholar] [CrossRef]
- Loeb, B.; Kockelman, K.M. Fleet performance and cost evaluation of a shared autonomous electric vehicle (SAEV) fleet: A case study for Austin, Texas. Transp. Res. Part A Policy Pract. 2019, 121, 374–385. [Google Scholar] [CrossRef]
- Strati, F.; Trussoni, L.G. Genetic algorithm-based selection of optimal Monte Carlo simulations. Comput. Oper. Res. 2025, 176, 106958. [Google Scholar] [CrossRef]
- Qian, Q.; Gan, M.; Yang, X. Empirical analysis of intelligent charging Decisions: Boosting efficiency for electric trucks. Transp. Res. Part D Transp. Environ. 2025, 139, 104572. [Google Scholar] [CrossRef]
- Qian, K.; Zhou, C.; Allan, M.; Yuan, Y. Modeling of Load Demand Due to EV Battery Charging in Distribution Systems. IEEE Trans. Power Syst. 2011, 26, 802–810. [Google Scholar] [CrossRef]
- Vasconcelos, A.S.; Martinez, L.M.; Correia, G.H.A.; Guimarães, D.C.; Farias, T.L. Environmental and financial impacts of adopting alternative vehicle technologies and relocation strategies in station-based one-way carsharing: An application in the city of Lisbon, Portugal. Transp. Res. Part D Transp. Environ. 2017, 57, 350–362. [Google Scholar] [CrossRef]
- Zhong, Z.; Zeng, Y.; Zhao, X.; Zhang, S. The social benefits resulting from electric vehicle smart charging balancing economy and decarbonization. Transp. Policy 2024, 147, 113–124. [Google Scholar] [CrossRef]
- Yi, Z.; Smart, J.; Shirk, M. Energy impact evaluation for eco-routing and charging of autonomous electric vehicle fleet: Ambient temperature consideration. Transp. Res. Part C Emerg. Technol. 2018, 89, 344–363. [Google Scholar] [CrossRef]
- Sahu, P.C. Impact and integration of electric vehicles on renewable energy based microgrid: Frequency profile improvement by a-SCA optimized FO-Fuzzy PSS approach. Green Energy Intell. Transp. 2025, 4, 100191. [Google Scholar] [CrossRef]
- Athira, I.C.; Muneera, C.P.; Krishnamurthy, K.; Anjaneyulu, M.V.L.R. Estimation of Value of Travel Time for Work Trips. Transp. Res. Procedia 2016, 17, 116–123. [Google Scholar] [CrossRef]
- Chandra, M.; Sekhar, C.R.; Madhu, E. Estimation of value of travel time based on mixed land use of trip origin and destination. Case Stud. Transp. Policy 2022, 10, 1207–1222. [Google Scholar] [CrossRef]
- Zhu, Y.; Ye, X.; Yan, X.; Wang, T.; Chen, J.; Zheng, P. Exploring the Impact of Charging Behavior on Transportation System in the Era of SAEVs: Balancing Current Request with Charging Station Availability. Systems 2024, 12, 61. [Google Scholar] [CrossRef]

| References | Core Methodology | Optimization Objective | Similarities and Differences with This Study |
|---|---|---|---|
| [5] Idle vehicle relocation strategy through deep learning for shared autonomous electric vehicle system optimization. Journal of Cleaner Production | Deep Learning | Vehicle downtime, system efficiency | Focus on SAEV scheduling but emphasize idle vehicle scheduling through deep learning. |
| [6] Mendoza (2021) Dynamic Ride-Hailing with Electric Vehicles. | Dynamic Optimization | Operating profit | Regarding the optimization of electric vehicle operations, the core challenge lies in dynamic ride-hailing, with operational profitability as the primary objective. |
| [8] Synergies between repositioning and charging strategies for shared autonomous electric vehicle fleets | Agent-based Simulation | Fleet performance | The SAEV fleet conducts simulation studies to explore the synergistic effects of repositioning and charging. |
| [9] Fleet performance and cost evaluation of a shared autonomous electric vehicle (SAEV) fleet: A case study for Austin, Texas | Simulation | Cost, service metrics | Evaluate the performance and cost of SAEV fleets through simulation, focusing on case study assessments of cost and service metrics. |
| [14] The social benefits resulting from electric vehicle smart charging balancing economy and decarbonization. Transport Policy | Multi-objective Optimization | Cost, response time, empty mileage, fleet power consumption (multi-objective trade-off) | The study considers multiple objectives but adopts a macro-level model, examining the societal benefits of smart charging for electric vehicles from the perspective of system operators. |
| Charging Decision Optimization Strategy for Shared Autonomous Electric Vehicles Considering Multi-Objective Conflicts: An Integrated Solution Process Combining Multi-Agent Simulation Model and Genetic Algorithm | Integrated Simulation-Optimization | Trade-offs under multiple conflicting objectives (e.g., charging cost, remaining battery capacity, demand response time, empty-running mileage) | This study proposes an integrated solution process combining multi-agent simulation models and genetic algorithms to approximate global optimal solutions across 35 scenarios. It specifically addresses trade-offs between different objectives—such as passenger demand and operator requirements—and provides optimal charging decision strategies for diverse scenarios. |
| Parameter Name | Value |
|---|---|
| Speed | 60 km/h |
| Maximum Driving Range | 300 km, 5 h (60 kWh consumption) |
| 80% State of Charge (SOC) | 240 km, 4 h (48 kWh consumption) |
| 20% State of Charge (SOC) | 60 km, 1 h (12 kWh consumption) |
| Number | Weight | Number | Weight | ||||||
|---|---|---|---|---|---|---|---|---|---|
| Maximizing Remaining Battery | Minimizing Demand Response Time | Minimizing Empty Vehicle Mileage | Minimizing Total Charging Cost | Maximizing Remaining Battery | Minimizing Demand Response Time | Minimizing Empty Vehicle Mileage | Minimizing Total Charging Cost | ||
| 1 | 1 | 0 | 0 | 0 | 19 | 0.5 | 0.25 | 0 | 0.25 |
| 2 | 0 | 1 | 0 | 0 | 20 | 0.5 | 0 | 0.25 | 0.25 |
| 3 | 0 | 0 | 1 | 0 | 21 | 0.25 | 0.5 | 0.25 | 0 |
| 4 | 0 | 0 | 0 | 1 | 22 | 0.25 | 0.5 | 0 | 0.25 |
| 5 | 0.25 | 0.25 | 0.25 | 0.25 | 23 | 0 | 0.5 | 0.25 | 0.25 |
| 6 | 0.75 | 0.25 | 0 | 0 | 24 | 0.25 | 0.25 | 0.5 | 0 |
| 7 | 0.75 | 0 | 0.25 | 0 | 25 | 0.25 | 0 | 0.5 | 0.25 |
| 8 | 0.75 | 0 | 0 | 0.25 | 26 | 0 | 0.25 | 0.5 | 0.25 |
| 9 | 0.25 | 0.75 | 0 | 0 | 27 | 0.25 | 0.25 | 0 | 0.5 |
| 10 | 0 | 0.75 | 0.25 | 0 | 28 | 0.25 | 0 | 0.25 | 0.5 |
| 11 | 0 | 0.75 | 0 | 0.25 | 29 | 0 | 0.25 | 0.25 | 0.5 |
| 12 | 0.25 | 0 | 0.75 | 0 | 30 | 0.5 | 0.5 | 0 | 0 |
| 13 | 0 | 0.25 | 0.75 | 0 | 31 | 0.5 | 0 | 0.5 | 0 |
| 14 | 0 | 0 | 0.75 | 0.25 | 32 | 0.5 | 0 | 0 | 0.5 |
| 15 | 0.25 | 0 | 0 | 0.75 | 33 | 0 | 0.5 | 0.5 | 0 |
| 16 | 0 | 0.25 | 0 | 0.75 | 34 | 0 | 0.5 | 0 | 0.5 |
| 17 | 0 | 0 | 0.25 | 0.75 | 35 | 0 | 0 | 0.5 | 0.5 |
| 18 | 0.5 | 0.25 | 0.25 | 0 | — | —— | —— | —— | —— |
| Number | Decision Variables | ||||||
|---|---|---|---|---|---|---|---|
| Recommended Average Remaining Battery Level (kwh) | Charging Probability for the Battery Level Between 20% and 40% | Charging Probability for the Battery Level Between 40% and 60% | Charging Probability for the Battery Level Between 60% and 80% | Parking Probability | Charging Station Selection Model | ||
| 1 | 13.2 | 0.75 | 0.7 | 0.4 | 0 | Time Minimization | |
| 2 | 30 | 0.3 | 0.65 | 0.2 | 0.4 | Demand Response Time Minimization | |
| 3 | 36.6 | 0.2 | 0.65 | 0.85 | 0.65 | Distance minimization | |
| 4 | 38.4 | 0.25 | 0.75 | 0.1 | 0.85 | Minimize comprehensive Charging Costs | |
| 5 | 31.8 | 0.25 | 0.9 | 0.1 | 0.9 | Minimize Comprehensive Charging Costs | |
| 6 | 16.2 | 0.9 | 0.75 | 0.35 | 0 | Time Minimization | |
| 7 | 12 | 0.8 | 0.75 | 0.35 | 0 | Time Minimization | |
| 8 | 30 | 0.15 | 0.85 | 0.1 | 0.75 | Time Minimization | |
| 9 | 18.6 | 0.3 | 0.65 | 0.25 | 0.45 | Demand Response Time Minimization | |
| 10 | 27.6 | 0.3 | 0.5 | 0.25 | 0.45 | Demand Response Time Minimization | |
| 11 | 33.6 | 0.1 | 0.9 | 0.1 | 0.9 | Demand Response Time Minimization | |
| 12 | 36.6 | 0.2 | 0.65 | 0.85 | 0.65 | Distance Minimization | |
| 13 | 12.6 | 0.7 | 0.7 | 0.65 | 0.45 | Distance Minimization | |
| 14 | 22.2 | 0.1 | 0.8 | 0.15 | 0.85 | Distance Minimization | |
| 15 | 39.6 | 0.1 | 0.8 | 0.1 | 0.95 | Minimize Comprehensive Charging Costs | |
| 16 | 34.2 | 0.1 | 0.6 | 0.1 | 0.9 | Minimize Comprehensive Charging costs | |
| 17 | 28.2 | 0.2 | 0.85 | 0.1 | 0.95 | Minimize Comprehensive Charging Costs | |
| 18 | 35.4 | 0.25 | 0.7 | 0.65 | 0.3 | Time Minimization | |
| 19 | 32.4 | 0.1 | 0.9 | 0.1 | 0.9 | Minimize Comprehensive Charging Costs | |
| 20 | 13.2 | 0.7 | 0.6 | 0.1 | 0.85 | Minimize Comprehensive Charging Costs | |
| 21 | 18.6 | 0.7 | 0.7 | 0.65 | 0.45 | Demand Response Time Minimization | |
| 22 | 39.6 | 0.1 | 0.9 | 0.1 | 0.9 | Minimize Comprehensive Charging Costs | |
| 23 | 30.6 | 0.1 | 0.8 | 0.15 | 0.85 | Minimize Comprehensive Charging costs | |
| 24 | 18 | 0.2 | 0.55 | 0.45 | 0.3 | Distance Minimization | |
| 25 | 30.6 | 0.1 | 0.6 | 0.25 | 0.9 | Minimize Comprehensive Charging Costs | |
| 26 | 15 | 0.7 | 0.7 | 0.3 | 0.9 | Minimize Comprehensive Charging Costs | |
| 27 | 42.6 | 0.1 | 0.8 | 0.1 | 0.95 | Minimize Comprehensive Charging Costs | |
| 28 | 31.2 | 0.15 | 0.85 | 0.1 | 0.9 | Minimize Comprehensive Charging Costs | |
| 29 | 17.4 | 0.1 | 0.7 | 0.1 | 0.9 | Minimize Comprehensive Charging Costs | |
| 30 | 16.2 | 0.25 | 0.75 | 0.35 | 0 | Demand Response Time Minimization | |
| 31 | 26.4 | 0.7 | 0.7 | 0.65 | 0.4 | Time Minimization | |
| 32 | 39.6 | 0.1 | 0.8 | 0.1 | 0.95 | Minimize Comprehensive Charging Costs | |
| 33 | 40.2 | 0.7 | 0.7 | 0.65 | 0.45 | Time Minimization | |
| 31 | 26.4 | 0.7 | 0.7 | 0.65 | 0.4 | Time Minimization | |
| 32 | 39.6 | 0.1 | 0.8 | 0.1 | 0.95 | Minimize Comprehensive Charging Costs | |
| 33 | 40.2 | 0.7 | 0.7 | 0.65 | 0.45 | Time Minimization | |
| 34 | 13.2 | 0.1 | 0.9 | 0.1 | 0.9 | Minimize Comprehensive Charging Costs | |
| 35 | 18 | 0.15 | 0.75 | 0.15 | 0.9 | Minimize Comprehensive Charging Costs | |
| Strategy Type | Charging Probability Range | Advantages and Disadvantages | Representative Scenarios |
|---|---|---|---|
| Passive Charging | High probability in low battery interval (>0.7) | Short response time but extremely high cost | 1, 6, 7 |
| Conservative Charging + High Parking | High probability in medium battery interval (~0.8) + high parking probability (≥0.9) | Lowest cost but long response time | 15, 27, 32 |
| Balanced | Moderate charging probability in medium battery interval(0.5–0.7), moderate parking probability (0.4–0.6) | Balanced cost, response time, and empty mileage | 10, 26 |
| Preventive Charging | High probability in high battery interval (≥0.8) | Stable battery interval but potential overcharging | 3, 12, 18 |
| Strategy Type | Parking Probability Range | Advantages and Disadvantages | Representative Scenarios |
|---|---|---|---|
| Zero Parking | 0 | Short response time, but high cost | 1, 6, 7 |
| High Parking + Low Charging | ≥0.8 | Lowest cost, but long response time | 4, 15, 27 |
| Balanced | 0.4–0.6 | Balanced cost, response time, and empty mileage | 2, 9, 26 |
| High Parking + High Charging | ≥0.8 + High charging probability | Stable battery interval but cost may increase | 3, 12 |
| Strategy Type | Recommended Average Remaining Battery Level Range (kwh) | Advantages and Disadvantages | Representative Scenarios |
|---|---|---|---|
| Low Battery | ≤18 | High charging cost, but the shortest response time | 1, 6, 7 |
| High Battery | ≥36 | Low cost, but long response time and stable battery level | 15, 27, 32 |
| Balanced | 18–30 | Balanced cost, response time, and battery level | 2, 9, 10 |
| Preventive Charging | ≥30 + High Charging Probability | Maintains high battery level, but may increase empty driving distance and cost | 3, 12, 18 |
| Type of Strategy | Selection Criteria | Advantages and Disadvantages | Representative Strategy |
|---|---|---|---|
| Distance minimization | Applicable to high empty mileage weights | Reduces operational losses, but may be more costly | 3, 12, 13 |
| Time minimization | Applicable to high residual power weights | Fast response but high cost, suitable for emergency power replenishment | 1, 6, 18 |
| Minimize comprehensive charging costs | Suitable for high consolidated cost weights | Minimal cost, limited response time | 4, 15, 17 |
| Demand response time minimization | Suitable for high response time weighting | Good user experience at the expense of some economics | 2, 9, 30 |
Disclaimer/Publisher’s Note: The statements, opinions and data contained in all publications are solely those of the individual author(s) and contributor(s) and not of MDPI and/or the editor(s). MDPI and/or the editor(s) disclaim responsibility for any injury to people or property resulting from any ideas, methods, instructions or products referred to in the content. |
© 2025 by the authors. Licensee MDPI, Basel, Switzerland. This article is an open access article distributed under the terms and conditions of the Creative Commons Attribution (CC BY) license (https://creativecommons.org/licenses/by/4.0/).
Share and Cite
Guo, S.; Ye, X.; Pei, S.; Yan, X.; Wang, T.; Chen, J.; Cheng, R. Charging Decision Optimization Strategy for Shared Autonomous Electric Vehicles Considering Multi-Objective Conflicts: An Integrated Solution Process Combining Multi-Agent Simulation Model and Genetic Algorithm. Systems 2025, 13, 921. https://doi.org/10.3390/systems13100921
Guo S, Ye X, Pei S, Yan X, Wang T, Chen J, Cheng R. Charging Decision Optimization Strategy for Shared Autonomous Electric Vehicles Considering Multi-Objective Conflicts: An Integrated Solution Process Combining Multi-Agent Simulation Model and Genetic Algorithm. Systems. 2025; 13(10):921. https://doi.org/10.3390/systems13100921
Chicago/Turabian StyleGuo, Shasha, Xiaofei Ye, Shuyi Pei, Xingchen Yan, Tao Wang, Jun Chen, and Rongjun Cheng. 2025. "Charging Decision Optimization Strategy for Shared Autonomous Electric Vehicles Considering Multi-Objective Conflicts: An Integrated Solution Process Combining Multi-Agent Simulation Model and Genetic Algorithm" Systems 13, no. 10: 921. https://doi.org/10.3390/systems13100921
APA StyleGuo, S., Ye, X., Pei, S., Yan, X., Wang, T., Chen, J., & Cheng, R. (2025). Charging Decision Optimization Strategy for Shared Autonomous Electric Vehicles Considering Multi-Objective Conflicts: An Integrated Solution Process Combining Multi-Agent Simulation Model and Genetic Algorithm. Systems, 13(10), 921. https://doi.org/10.3390/systems13100921


