Article

Evaluating Potential E-Bike Routes in Valparaíso’s Historic Quarter, Chile: Comparative Human and AI Street Auditing and Local Scale Approaches

by
Vicente Aprigliano
1,2,
Mitsuyoshi Fukushi
1,
Catalina Toro
1,3,
Gonzalo Rojas
1,3,*,
Emilio Bustos
1,
Iván Bastías
4,
Sebastián Seriani
1 and
Ualison Rébula de Oliveira
5
1
Escuela de Ingeniería de Construcción y Transporte, Pontificia Universidad Católica de Valparaíso, Avda. Brasil 2147, Valparaíso 2362804, Chile
2
Centro de Acción Climática, Pontificia Universidad Católica de Valparaíso, Avda. Brasil 2147, Valparaíso 2362804, Chile
3
Instituto de Geografía, Pontificia Universidad Católica de Chile, Avda. Vicuña Mackenna 4860, Santiago 7820436, Chile
4
Instituto de Geografía, Pontificia Universidad Católica de Valparaíso, Avda. Brasil 2241, Valparaíso 2362807, Chile
5
Departamento de Administração e Administração Pública de Volta Redonda, Universidade Federal Fluminense (UFF)/MPA-ICHS, MSG-TCE and DSG-TCE, 783 Des. Ellis H. Figueira St. Volta Redonda, Rio de Janeiro 27213-145, RJ, Brazil
*
Author to whom correspondence should be addressed.
Systems 2025, 13(10), 894; https://doi.org/10.3390/systems13100894 (registering DOI)
Submission received: 14 August 2025 / Revised: 15 September 2025 / Accepted: 8 October 2025 / Published: 10 October 2025
(This article belongs to the Special Issue Data-Driven Urban Mobility Modeling)

Abstract

This study evaluates potential routes for electric bicycles (E-Bikes) in Valparaíso, Chile, using street audits performed by both humans and artificial intelligence (AI). Audit methods were compared to identify routes connecting the Puerto metro station with Avenida Alemania (a strategic city avenue), prioritizing criteria such as street infrastructure, habitability, and street coexistence. The results show that the human audit gives higher scores in subjective variables, such as the perception of security and urban dynamism, while AI penalizes infrastructure deficiencies more severely, especially in areas with steep slopes and low tree cover. Despite these differences, both methods highlight the inadequacy of current infrastructure to promote the use of E-Bikes in the city. This work provides a novel perspective by evaluating human and AI-assisted methodologies, suggesting that an integration between the two could improve accuracy and reduce subjectivity in urban audits. In addition, the results underline the need for public policies that prioritize accessibility, safety, and equity in urban mobility, especially in vulnerable areas. Future research should explore training AI algorithms with human audit data to strengthen AI’s ability to interpret contextual variables and dynamics in complex urban environments.

1. Introduction

A promising approach to overcoming the limitations of traditional, resource-intensive street auditing is the use of artificial intelligence (AI) and publicly available street view imagery (SVI). Recent advancements demonstrate that AI can automate the creation of detailed mobility evaluations in complex urban environments. For instance, AI-driven methods can now automatically key infrastructure features such as sidewalk characteristics for wheelchair users [1]. Furthermore, specialized models show high accuracy in detecting critical accessibility components like curb ramps, helping to address gaps in officially available data [2]. This technological shift is not limited to feature extraction; multimodal AI systems like StreetViewAI can interpret complex streetscapes to provide rich, context-aware descriptions that aid navigation for people with visual impairments, showcasing AI’s growing capacity for nuanced environmental understanding [1,2,3,4,5].
However, despite the clear potential of AI in automating urban audits, its widespread adoption by planners and municipalities is hindered by concerns regarding the quality, reliability, and validity of the generated data. A critical research gap remains in understanding how AI-driven assessments compare to traditional human-led audits, particularly in capturing the subjective and contextual elements of urban experience. As Askari et al. [3] argue, validating data from emerging sources against established methods is essential for building “data trust” and ensuring their legitimacy for official planning purposes.
Therefore, this study seeks to answer the following question: How do the assessments of potential e-bike routes in Valparaíso differ when conducted through a human-led, in situ street audit versus an automated, AI-driven audit using street imagery? To answer this question, it is important first to understand the context of the case study, which is the city of Valparaíso. Furthermore, it is relevant to put into context how this study is related to the sustainable mobility concerns.
Previous mobility studies applied to the city of Valparaíso, Chile, have evidenced the complex socioeconomic, urban, and topographic of the city [6,7,8]. Fernandes and Tirado [6], for example, identified that vulnerable populations that live in the hills of Valparaíso, regarding mode of transport, are sustainable because they tend to walk or use public transport. However, they are exposed to poor urban and transport infrastructure, which reflects the socioeconomic gap in the city. In addition, Aprigliano, Toro et al. [8] highlighted that internal trips by car in the city of Valparaíso have an average distance of approximately 800 m. Also, the authors note that most car users live near the city’s central business district. Considering the city’s complex geography, it is relevant to explore local scale analysis of the streets of the city in order to potentially promote electric bicycles to reduce the inequality in accessibility evidenced by Aprigliano, Toro et al. [8], contributing to the sustainable mobility.
It is interesting to note the alternative approach regarding sustainable mobility proposed by Banister [9]. This author highlights the relevance of focusing on the social dimension, accessibility, people instead of vehicles, street as a space, local scale, etc. However, exploring sustainable mobility from a local and geographical perspective, as well as from an academic perspective, is still timid, considering that this concern has been highlighted since the beginning of the end of the 20th century, for example, through the 1992 conference of the United Nations in Rio de Janeiro [10]. A search was conducted in the Web of Science database on 11 November 2024, using the keywords “sustainable mobility” and “local scale” in all fields, filtering Web of Science categories to transportation and geography, the system delivers five documents [11,12,13,14,15].
Regarding the relationship between sustainable mobility and the local scale approach, Lucas [11] highlights that the local scale approach allows the promotion of specific policies to confront the public transport deficit and ease the mobility and accessibility of vulnerable populations. With a focus on shared mobility issues, Coll et al. [12] affirm that local factors, such as density and access to services, favor promoting shared and sustainable mobility. Examining parking issues, Wang and Liu [13] indicate that local policy perspectives are required to promote sustainable mobility, with a specific focus on equity between urban centers and suburbs. With an environmental focus, Singh et al. [14] suggest the need to align local solutions to global concerns to better tackle the impact of the environment, such as noise pollution, to promote sustainable mobility. Interestingly, focusing on implementing cycleways, Ploegmakers and Lagendijk [15] identified that external financing and local collaboration are key to promoting sustainable infrastructure at a regional scale.
From studies that relate the use of bicycles and local scale perspective, it is possible to evidence five themes of concern: infrastructure and urban design [16,17,18]; safety and risk assessment [19]; access and spatial equity [20]; community collaboration and local governance [15,16]; built environment and social context [16,18]. In terms of E-bike research and its potential promotion in urban areas, it is relevant to mention Aprigliano et al. [21], which evaluated, with secondary data, potential routes for E-bikes in Valparaíso, in addition to developing experimental studies that evidence the potential of E-bike users to overcome steep slopes of the city.
Regarding the objective, within the context of promoting E-Bike use in the city of Valparaíso and exploring local scale assessment, this study seeks to compare the results of human and AI-driven street auditing methods directed at identifying adequate routes for E-Bikes in the city that connect the metro station Puerto to Alemania Avenue, a key street that connects different hills of Valparaíso. In addition, through AI-driven auditing methods, this research expands the audited streets to other potential routes connecting other metro stations of the city to Alemania Avenue. In terms of the research gap, by comparing human and AI-driven auditing, there may be the possibility of reducing subjectivity delivered by human evaluation, as mentioned by Grabow et al. [22], and also the possibility of validating AI-driven audits, which was one of the pointed-out limitations of Ito and Biljecki [23].
It is important to point out that other studies related to E-Bike use and spatial analysis have identified different challenges regarding the promotion of this mode of transportation, such as infrastructure that allow safe use of E-Bikes [24], psychological and social limitations regarding safety perceptions and environmental awareness [25], initial cost and lack of incentives to promote a shift towards E-Bikes [26], and battery maintenance and recycling [24]. Regarding the slope criterion, the previously mentioned papers affirm that E-Bikes allow reductions in physical effort [25], may induce cyclists to prefer routes with slopes compared to conventional cyclists [26] and increases the possibility of people seeing the E-Bike as a viable mode compared to cars or public transport, especially in a city with a hilly landscape [24,26]. For these reasons, it is valid to make effort in evaluating potential routes for E-Bikes in the city of Valparaíso, where approximately 94% of the population resides in the hills of the city [27] and 57.29% of the city has an average slope higher than 6%, calculated from a digital elevation model obtained from the Spatial Data Infrastructure of Chile [28].
Concerning the structure of the paper, besides this introduction, it consists of five other sections. Section 2 (literature review) explores different approaches to street auditing for bicycles. Section 3 (materials and methods) focuses on describing the research planning and design, the audit tool applied, the human street audit procedure, AI-driven auditing methods, and the analysis methods. Section 4 (results) presents the results of each audit method and the expanded results of the AI-driven auditing in the city of Valparaíso. Section 5 (discussion) develops a discussion about the results, and the Section 6 (conclusions and final considerations) discuss the applications, practical and policy implications, limitations of the study and further opportunities to explore the research developed here.

2. Literature Review

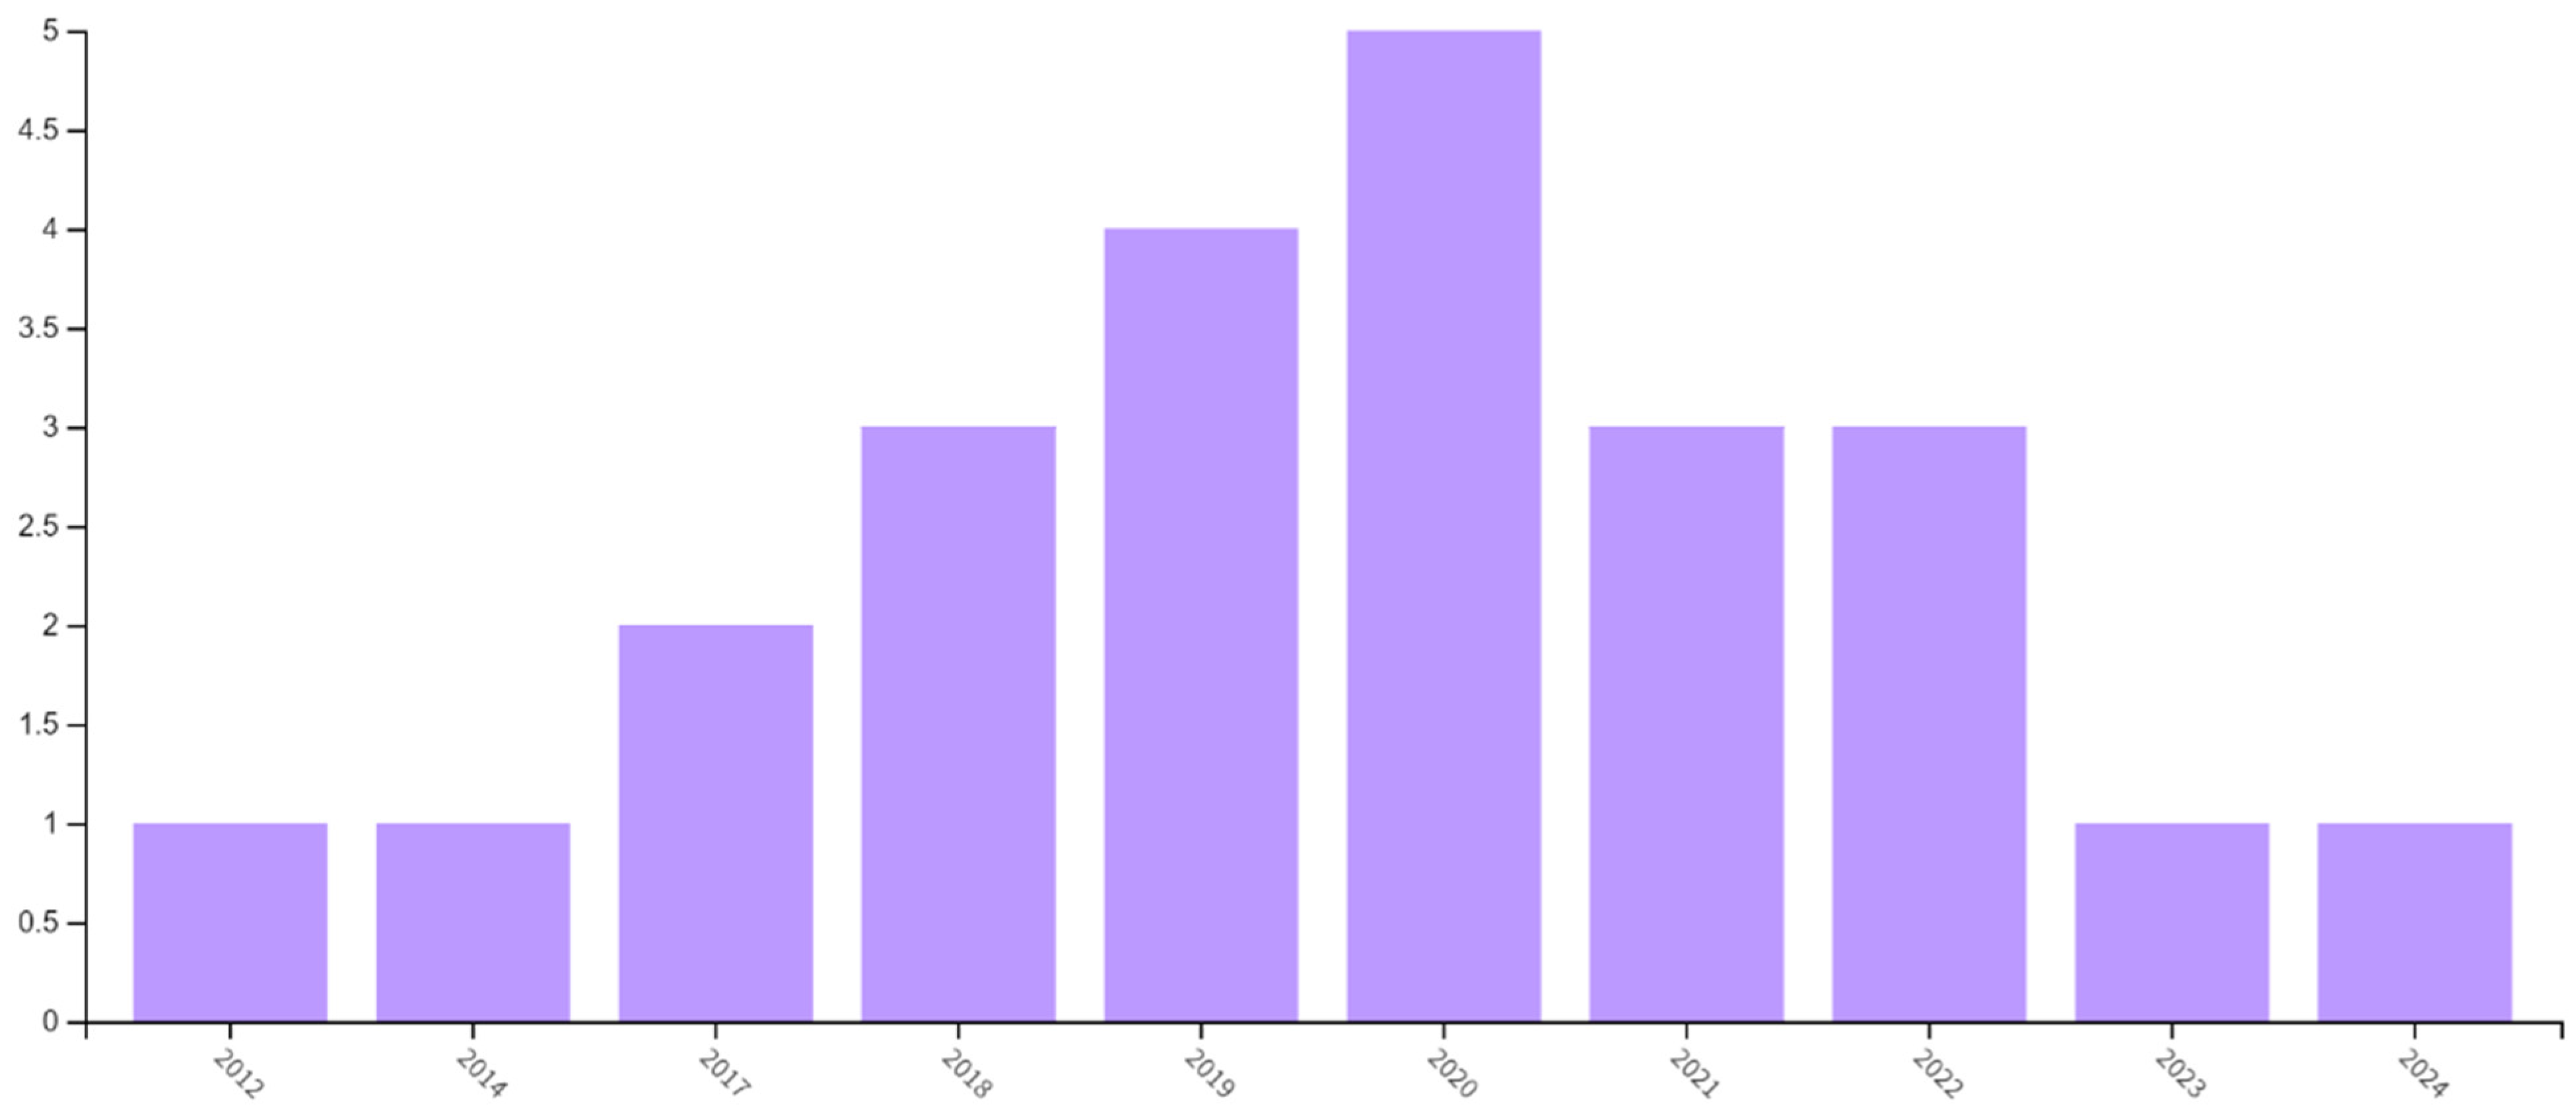
Seeking in the Web of Science Database, 07 November 2024, with the keywords “street audit” and “Bicycle”, the output was 27 papers, and 7 of them were closely related to the application of street audit methods related to bicycle use in cities, which are further explored in this Section 2, focusing on audit methods, variables and results obtained. Interestingly, it is possible to observe that publications related to street audits and bicycles reached a peak between 2019 and 2020, possibly related to the growing concerns about COVID-19 and the agglomeration in urban spaces (see Figure 1).
Aiming to identify built environmental factors associated with cycling in different regions of Europe, Mertens et al. [29] apply a virtual neighborhood audit through the Google Street View tool, gathering information on speed limits, the existence of bicycle lanes, traffic calming features, presence of trees, litter, and parked cars. Results of this study pointed out, for example, that places with speed limits under 30 km/h and more cycle lanes present lead to higher cycling levels. Similarly, Auchincloss et al. [30] focus on assessing physical activity changes after implementing greenways in low-income neighborhoods and use methods related to systematic observation and environmental audits. Regarding the variables for the audit process, the authors focus on the design, amenities, and esthetics dimensions of the Path Environment Audit Tool (PEAT) [31]. Unlike Mertens et al. [29], Auchincloss et al. [30] did not find a significant relationship between greenways and increased physical activity, such as cycling.
Figure 1. Publications by year delivered by Web of Science Database. Search keywords are street audit (All Fields) AND bicycle (All Fields) [32,33].
Systems 13 00894 g001
On the other hand, instead of developing in loco auditing, Antonakos et al. [34] examine GigaPan imagery for environmental audits. The audit variables included elements such as pedestrian amenities, recreation facilities, presence of services and commerce, physical activity venues, presence of crosswalks, etc. Results of this study demonstrate that a lower body mass index of people is associated with pedestrian-friendly features. In the same direction, Desjardins et al. [35] compare objective route attributes measured through a street audit of Google Street View images and the perception of cyclists collected through a semi-structured interview of cyclists. Variables of the street audit were divided into two dimensions. The first is predominant buildings/features, including transport infrastructure, housing, office, retail, etc. The second is bicycle infrastructure, including specific characteristics of the cycle lanes, slope, road conditions, traffic calming devices, etc. This study mainly indicates that cyclists preferred routes with dedicated bike lanes and lower traffic levels.
Still, with the support of digital images for auditing, Cleland et al. [36] developed a micro-level audit tool to evaluate urban and mobility factors influencing neighborhoods through Google Street View. For the audit, the authors consider several variables related to livability, safety, sustainability, health, and bicycle infrastructure indicators. The presented results indicate that livability relates to factors like pedestrian activity, overall car presence, the number of parked cars, and bicycle rack counts. In addition to digital imagery audits and different from previously reviewed papers, Ito and Biljecki [23] also implemented automated auditing of street view imagery to measure the bikeability of places. Variables in this automated audit process involve amenities, the built environment, and transport infrastructure. Results delivered interesting auditing results. However, the authors affirm that there is a need for further stages for validating results. On the other hand, Maddock et al. [37] with the objective of assessing pedestrian and bicycling environmental friendliness apply in loco street auditing measuring aspects related, for example, to sidewalks, crossing aid and pedestrian/bicyclist traffic.
Table 1 presents information on the criteria, variables, and references of studies that used each variable. It is interesting to identify that safety, infrastructure conditions and accessibility presented more relevance to most of the studies, while it is relevant to highlight the concerns with esthetics and comfort. Regarding comfort with the emergence of E-Bikes in recent years, the consideration of this variable in future studies may increase for the next years.
Table 1. Criteria and Variables Considered in Street Audit Procedures Focused on Bicycle. Source: Elaborated by authors.
CriteriaVariableReferences
SafetyPresence of bicycle lanes[29,34,37]
Traffic-calming devices[23,29]
Bicycle lane separation[29,35]
Signalized crosswalks[37]
Infrastructure ConditionCondition of bicycle lanes[23,31]
Surface quality[31,35]
Maintenance of road and lanes[34,37]
Street lighting[35,36]
AccessibilityConnectivity to bike paths[30,31]
Availability of bike parking[36,37]
Ease of access to destinations[31,35,36]
Esthetic EnvironmentPresence of greenery[23,29]
Street cleanliness[23,36]
ComfortShade along paths[31,36]
Slope/grade[23,31]
Beyond imagery-based virtual audits, other technology-driven approaches leverage real-time sensor data to evaluate cyclist behavior and infrastructure interaction. For example, Puyol et al. [38] proposed a Bicycle Sharing System (BSS) using an Internet of Things (IoT) network where bicycles are equipped with sensors to transmit real-time position and speed data. Their system’s novel contribution is its ability to monitor user behavior, such as slowing for intersections, and automatically reward compliance with traffic rules through discounts on rental costs. While this represents an innovative approach for real-time BSS management and user incentivization, its methodology and objectives are distinct from the present study. In contrast, this current research focuses not on live-tracking individual cyclists but on a pre-emptive, scalable assessment of fixed street infrastructure using AI to analyze pre-existing, static street imagery for urban planning purposes.

3. Materials and Methods

3.1. Research Planning and Design

This study was designed to conduct a comparative analysis between a human street audit and one assisted by Artificial Intelligence (AI) to evaluate potential routes for electric bicycles (E-Bikes) in Valparaíso. The research was structured around the following central question:
What are the key differences in the evaluations of E-Bike routes when using an in situ human audit versus an AI-assisted audit based on images?
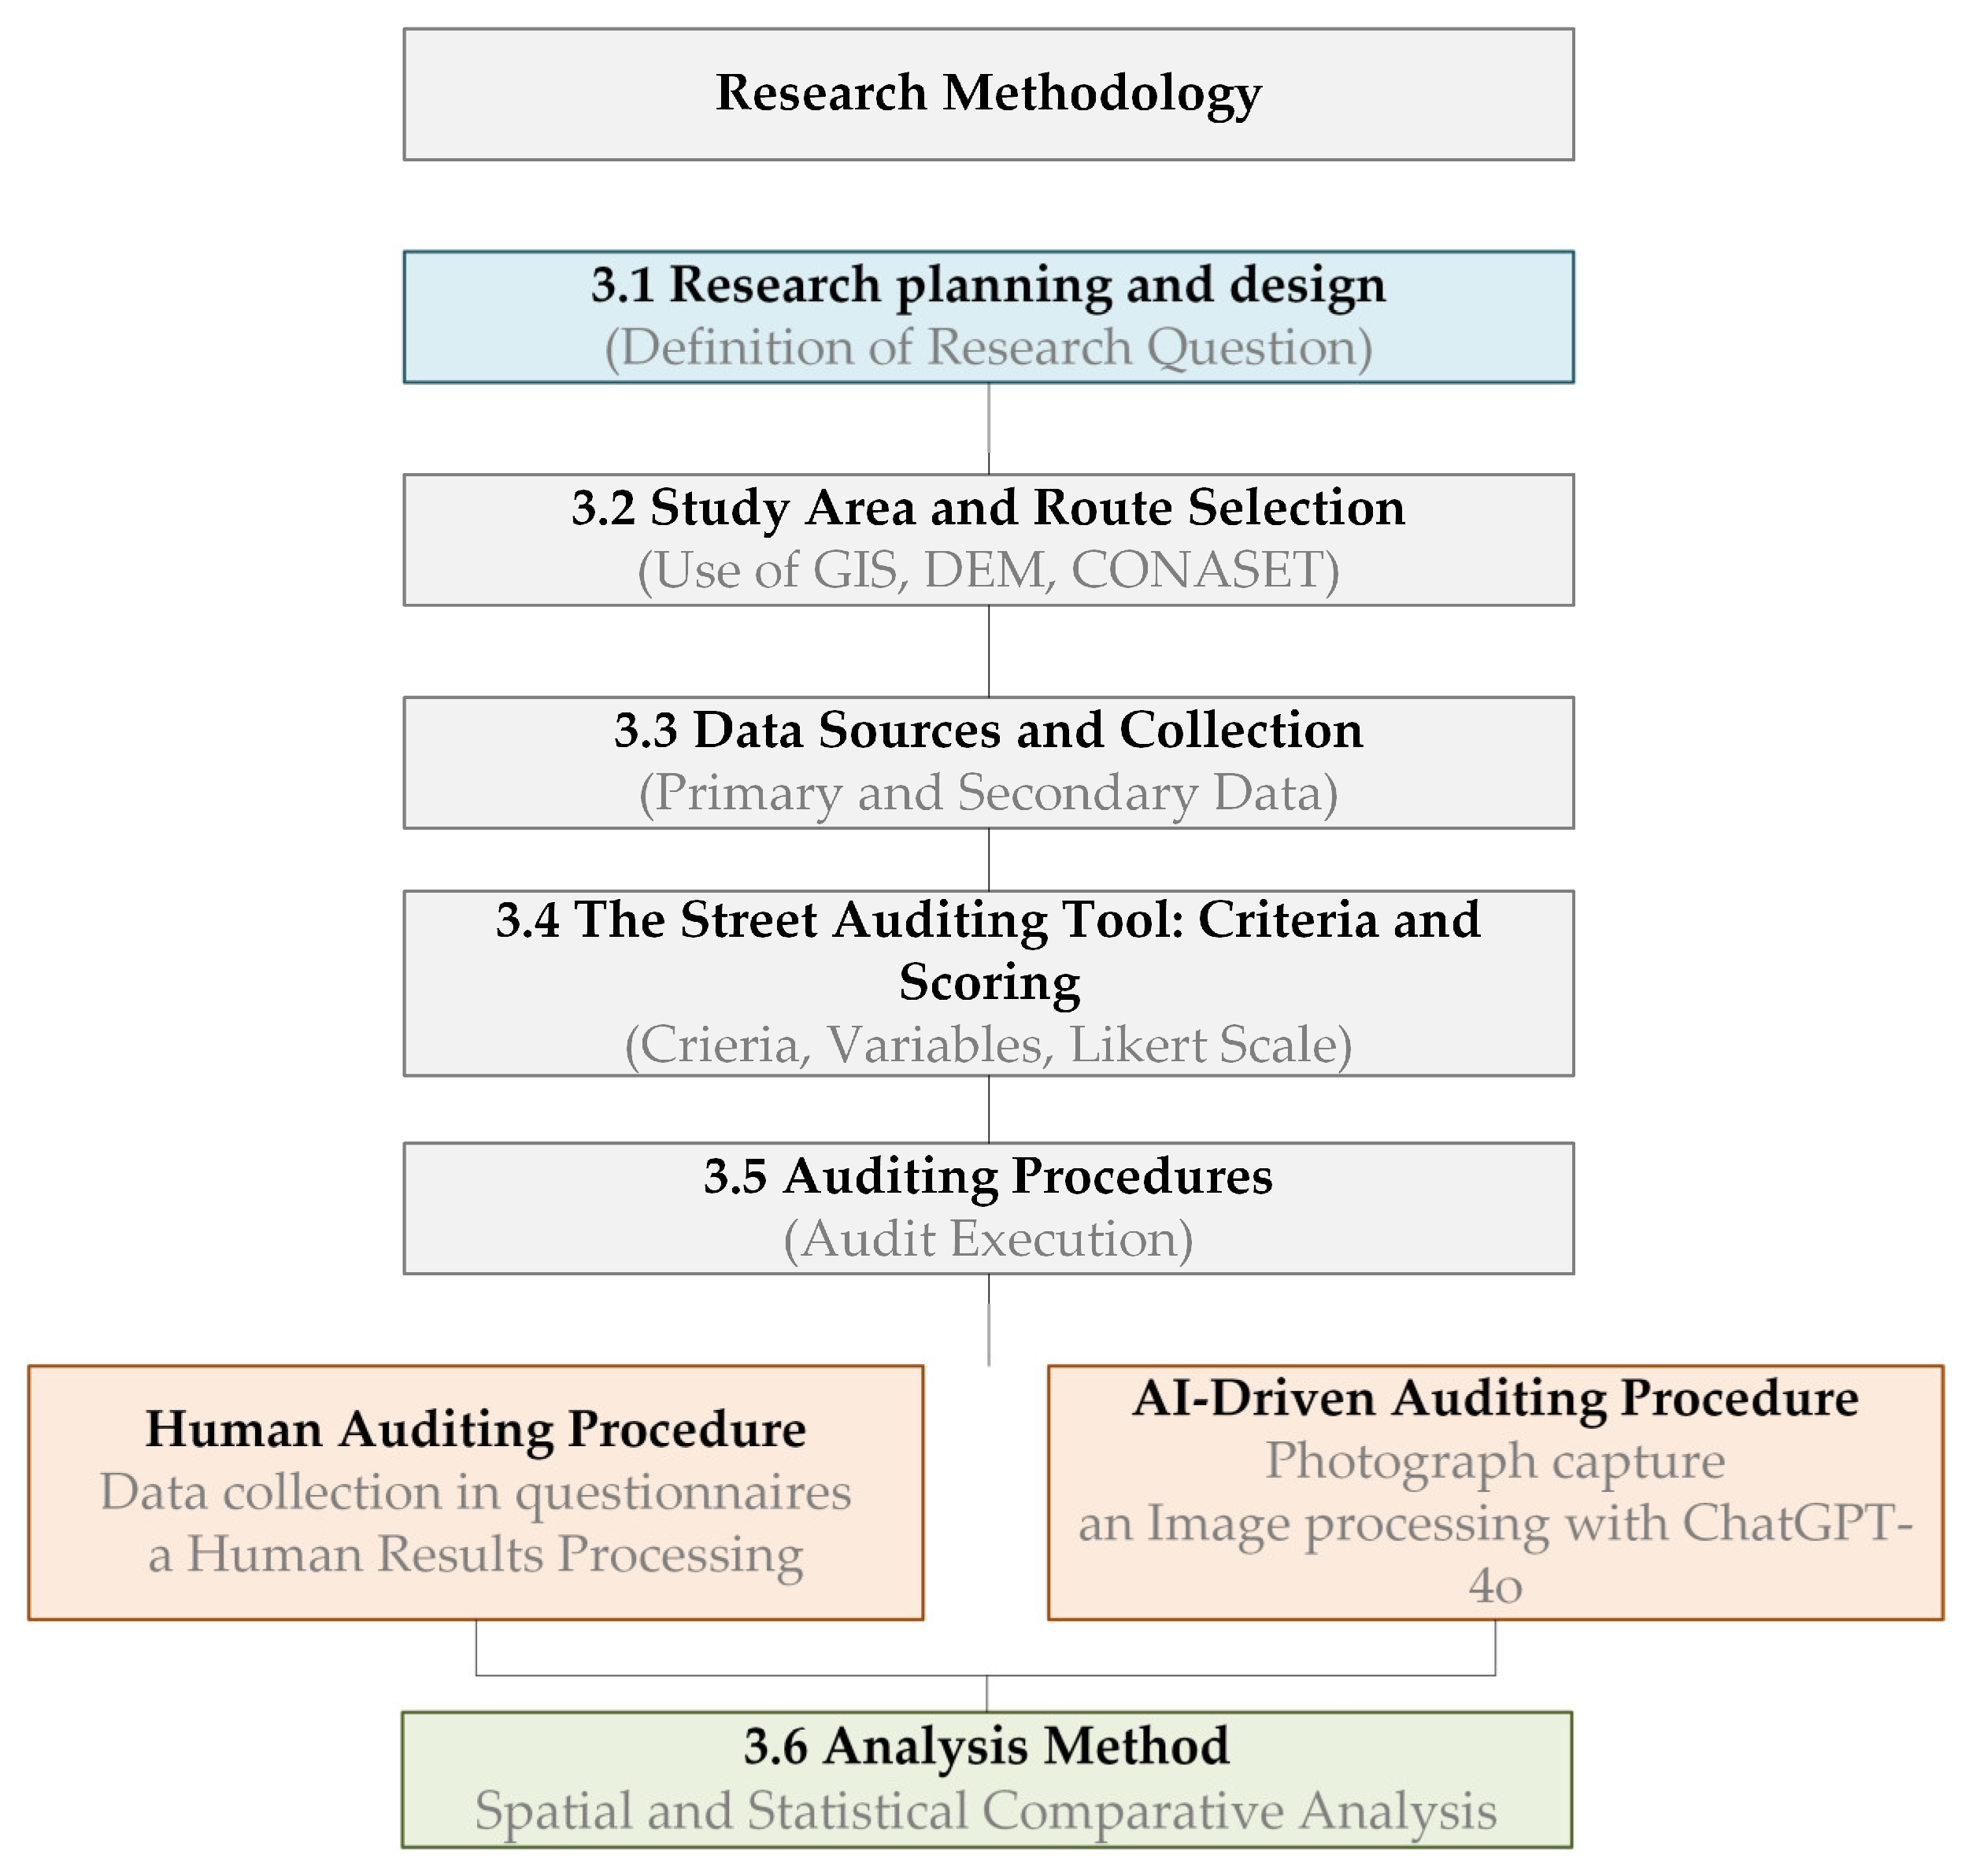
To answer this question, a multi-stage methodological framework was designed, which is visually summarized in Figure 2. This framework is organized into five main stages detailed in this section: The process begins with the definition of the study area and data sources (Section 3.2 and Section 3.3). This is followed by a detailed description of the street audit tool and the distinct procedures for the human and AI audits (Section 3.4 and Section 3.5). Finally, the framework concludes by outlining the comparative analysis method used to synthesize the results (Section 3.6).

3.2. Study Area and Route Selection

The study takes place in the city of Valparaíso, Chile, which has 284,938 inhabitants according to the 2024 Census [39]. According to the 2014 Origin-Destination Survey (ODS) [40], 34.5% of households own at least one car, and 23.2% of internal trips in Valparaíso are made by this means of transport. In contrast, 0.8% of households report owning at least one bicycle [40].
In this city, there is an area recognized by UNESCO as a World Heritage Site (WHS) since 2003 [41], which covers approximately 44.5 ha and concentrates various urban functions such as leisure, work, and residence, among others. According to ODS data [40], in 2014, 52,042 trips were registered with the WHS as their destination: 28.6% for the purpose of “returning home,” 27.1% related to “leisure,” 22.9% to “work,” and 9.5% to “personal administrative activities.” Since this sector concentrates a significant part of urban travel and represents a space with a high density of activities, the potential study routes are located mainly within the WHS, with some sections extending beyond this perimeter.
The test routes were designed based on streets considered potentially suitable for cycling, starting at the Puerto metro station. Part of the route runs through the Historic Centre of Valparaíso or WHS, a busy, touristic and heritage area, and extends to Avenida Alemania, located at 115.5 m above sea level (masl), the main connecting street between the city’s hills.
The criteria for selecting the pilot routes were based on a Geographic Information System (GIS), which allowed the calculation of the average slope of the sections of each route using a Digital Elevation Model (DEM) [28], as well as the total distance from the metro station and from elevation 30 to the end of the route. Regarding street safety, information on the number of accidents on the routes was collected using georeferenced data from CONASET [42], and intersections were identified using QGIS, following the methodology employed by Aprigliano et al. [21]. Finally, with the help of Google Maps, the directionality of each route was verified.
Based on the results obtained, routes with low variation in their values and/or compensation between the different criteria were verified. For example, the Tomás Ramos route has a considerable distance from elevation 30, but has no accident records, which compensates for the longer distance (see Table 2). This analysis allowed the routes to be evaluated more equitably in the street audit.
Measurement points were determined based on significant changes in the pavement, variations in lane width, intersections with streets, pedestrian crossings, and important landmarks. These points were used in both the human street audit and the street audit assisted by artificial intelligence (AI) (see Figure 3).

3.3. Data Sources and Collection

The data for this study was collected from primary and secondary sources:
  • Primary Data: The main data consists of the on-site audit evaluations and the photographs collected during the fieldwork. The evaluations were recorded by three auditors on printed forms derived from the audit tool’s questionnaire. A GoPro Hero 11 Black camera was used to capture photographs at each measurement point, which served as a backup for the human audit and as the primary input for the AI-assisted audit.
  • Secondary Data: To aid in route selection, secondary data was utilized, including a Digital Elevation Model (DEM) from the Spatial Data Infrastructure of Chile [28] and georeferenced accident data provided by the National Traffic Safety Commission (CONASET) [42].

3.4. The Street Auditing Tool: Criteria and Scoring

For the development of the street audit, which was approached from a quantitative perspective, three main criteria were selected: Street infrastructure, Street coexistence, and Habitability. Each criterion was accompanied by descriptions and scores ranging from a minimum of 1 to a maximum of 5, forming a Likert-type scale to guide the auditors’ structured judgment, with 5 being the most favorable condition for E-bike cyclability. The structure of the street audit was based on the table generated by Pais et al. [43].
The first criterion, Street Infrastructure, describes the current physical state of the infrastructure, allowing its visualization and evaluation [44]. To this end, variables were defined that facilitate the identification and weighting of this criterion. The variables considered are: the pavement, focusing on the type, condition and slip resistance [45,46,47]; the lighting, focusing on its operation and visibility [46,48]; the street crossing, evaluating the beginning of the route [49]; the sewerage system, observing the design characteristics [46]; signage, with an emphasis on legibility [46,50,51]; demarcation, also assessed for legibility [46,48]; and finally, bicycle parking, analyzed in terms of condition and use [52]. For further details on each variable, description, and characteristics, see Table A1.
The second criterion, Street Coexistence, focuses on evaluating social behaviors and compliance with regulations or laws in relation to the use of existing infrastructure [52]. Specific variables related to speed reduction aspects were selected, considering their existence, type, and functionality [45,53,54]. Likewise, the use of parking lots was evaluated, including aspects such as the availability of infrastructure [50,51], the existence of signage [44,47,55], and respect for its use [55]. Finally, the use of public and private transport was analyzed to understand how they interact and affect street coexistence [51,56,57]. For the ‘Use of bus stops’ variable, a clear distinction was established: a stop was considered ‘Formal’ (score of 5) if it had official signage, while it was classified as ‘Informal’ (score of 1) when auditors observed public transport stopping in unmarked locations. For a detailed breakdown, see Table A2.
Finally, the third criterion, Habitability, allows us to assess whether people feel comfortable and safe in an environment, identifying characteristics that make these spaces friendly or mitigate feelings of insecurity [52]. To do this, Urban Dynamism variables [53,55] were used, which facilitates the identification and evaluation of the conditions of facades, places of interest and shops [53,55,58]. In addition, heat management of the area was considered, through the presence of parks and trees [51,53,55,58]. Finally, security was analyzed, addressing aspects such as lighting [53,59], police presence [53] and surveillance cameras [51,52]. See Table A3 for a full list of variables and scoring.

3.5. Auditing Procedures

3.5.1. Human Auditing Procedure

To prepare for the field audit, a user-friendly and efficient questionnaire was designed by coding the criteria, variables, and descriptions previously defined in the audit tool (see Table A1, Table A2 and Table A3 in Appendix A). In addition, a specific coding of the information collection points was carried out. For this process, tools such as the developed questionnaire and a GoPro Hero 11 Black camera were used, which was used to capture photographs at each measurement point, in the north, south, east and west directions. These images serve as backup and will be used in the AI-assisted street audit stage.
To dynamically measure traffic volume—a variable the AI could not assess from static images—the human auditors applied a quantitative procedure at each analysis point. The assessment was based on a 10 min in situ observation, during which a vehicle count was conducted. To classify traffic frequency, thresholds from the Manual de Carreteras, Volumen N°3 of the Ministry of Public Works of the Government of Chile were used, specifically table 3.102.802(2).A, obtained from a request on https://mc.mop.gob.cl/ accessed on 12 September 2025 [60], which defines the Levels of Service (LOS). Since these values are bidirectional, half of the thresholds were considered for each direction of traffic, and levels D and E were omitted as they correspond to freeway conditions not applicable to this study. Finally, these quantitative data were converted to the audit’s ordinal (Likert-type) scale to classify flow intensity into comparable categories: LOS A (≈3.5 veh/min per direction), LOS B (≈6.5 veh/min per direction), and LOS C (≈10 veh/min per direction).
To ensure consistency and reliability in the judgments of the three auditors, a joint training session was held to unify the interpretation of each criterion. The questionnaire was then subjected to preliminary tests in the vicinity of the School of Construction and Transportation Engineering of the Pontifical Catholic University of Valparaíso (PUCV), which allowed not only for the correction of deficiencies but also for the calibration of evaluations among the auditors before its final implementation. While these steps were taken to standardize judgments, it is acknowledged that a formal statistical metric for inter-rater reliability was not calculated, which constitutes a limitation of the study.
The first audit day was carried out on 30 October 2024, and the second day was carried out on 19 November 2024. Measurements were carried out on two different days, but at similar times, in order to maintain consistency in the analysis conditions. The street audit was carried out by three auditors, who recorded the data using a printed form.

3.5.2. AI-Driven Auditing Procedure

This section presents the AI-driven street auditing methodology used to assess the suitability of e-bike routes in Valparaíso. The procedure evaluates street conditions by dividing the analysis into basic units, each defined by a specific set of criteria, variables, and descriptions. These units are examined individually through a multi-stage AI system that combines visual and analytical processing to generate evaluations. The goal of this procedure was not to validate the AI against human assessments, but rather to apply it as an independent methodology for comparative analysis.

3.5.3. AI System Details

As shown in Figure 4, the system operates through three main stages: input, processing, and output. The auditing framework relies on a multimodal architecture capable of processing both text and images. At its core, the system uses ChatGPT-4o, a large language model developed by OpenAI [61]. The workflow is managed through LangGraph [62], a Python (version 3.10.11) library that structures the process into modular and traceable nodes. These nodes define the connections between data preprocessing, AI inference, and result interpretation, ensuring a transparent and reproducible auditing pipeline.

3.5.4. Image Processing and Limitations

To handle visual inputs efficiently, images are converted to Base64 format. High-resolution images initially created bottlenecks, so to mitigate this, images are downscaled to 500 × 600 pixels. A key concern is that this reduction, while beneficial for processing efficiency, may lead to the loss of critical visual details and compromise evaluation accuracy. Furthermore, the system’s dependence on standardized input configurations makes it susceptible to errors in initial configurations, and it relies on clean, well-structured data.

3.6. Analysis Method

It is essential to clarify that the focus of this study is not to validate the AI’s results against a human ‘ground-truth’. Instead, the objective is to conduct a comparative analysis of two distinct methodologies: one based on in situ human evaluation and another based on the analysis of static images by an AI. Therefore, discrepancies between the two methods are not interpreted as AI ‘errors’ but as central findings that reveal the inherent strengths, weaknesses, and biases of each approach.
The analysis of the different methods was based on data mining applied to both sets of results. First, the imputation of null values (corresponding to descriptions that could not be analyzed or that were identified as outliers) was considered. Subsequently, the values of each description were normalized using the MinMaxScaler() method. A spatial analysis of the sum of each point was performed, both in the east and west measurements, using cartography and descriptive measures for the criteria and variables corresponding to each area. In addition, the average of the points per route was calculated in order to obtain an overview of the results for each route and for each method. Finally, a comparative and in-depth analysis of the spatial and statistical results of each method was carried out, identifying relevant patterns and criteria, variables, and descriptions critical for the street audit.

4. Results

This section presents the results of the street audits carried out by both humans and artificial intelligence, based on photographs taken at each measurement point. The objective is to compare the results obtained through the human street audit with those generated by the automated audit based on AI.
The results are organized in maps that show the total score obtained at each measurement point, both in the east and west direction. In addition, tables are included with the descriptive measures corresponding to the criteria evaluated on each route, such as “Street Infrastructure”, “Street Coexistence” and “Habitability”. Finally, a table is presented with the average score of the points, calculated by adding the variables of each one and then averaging the results obtained at all the points evaluated.

4.1. Human Street Audit

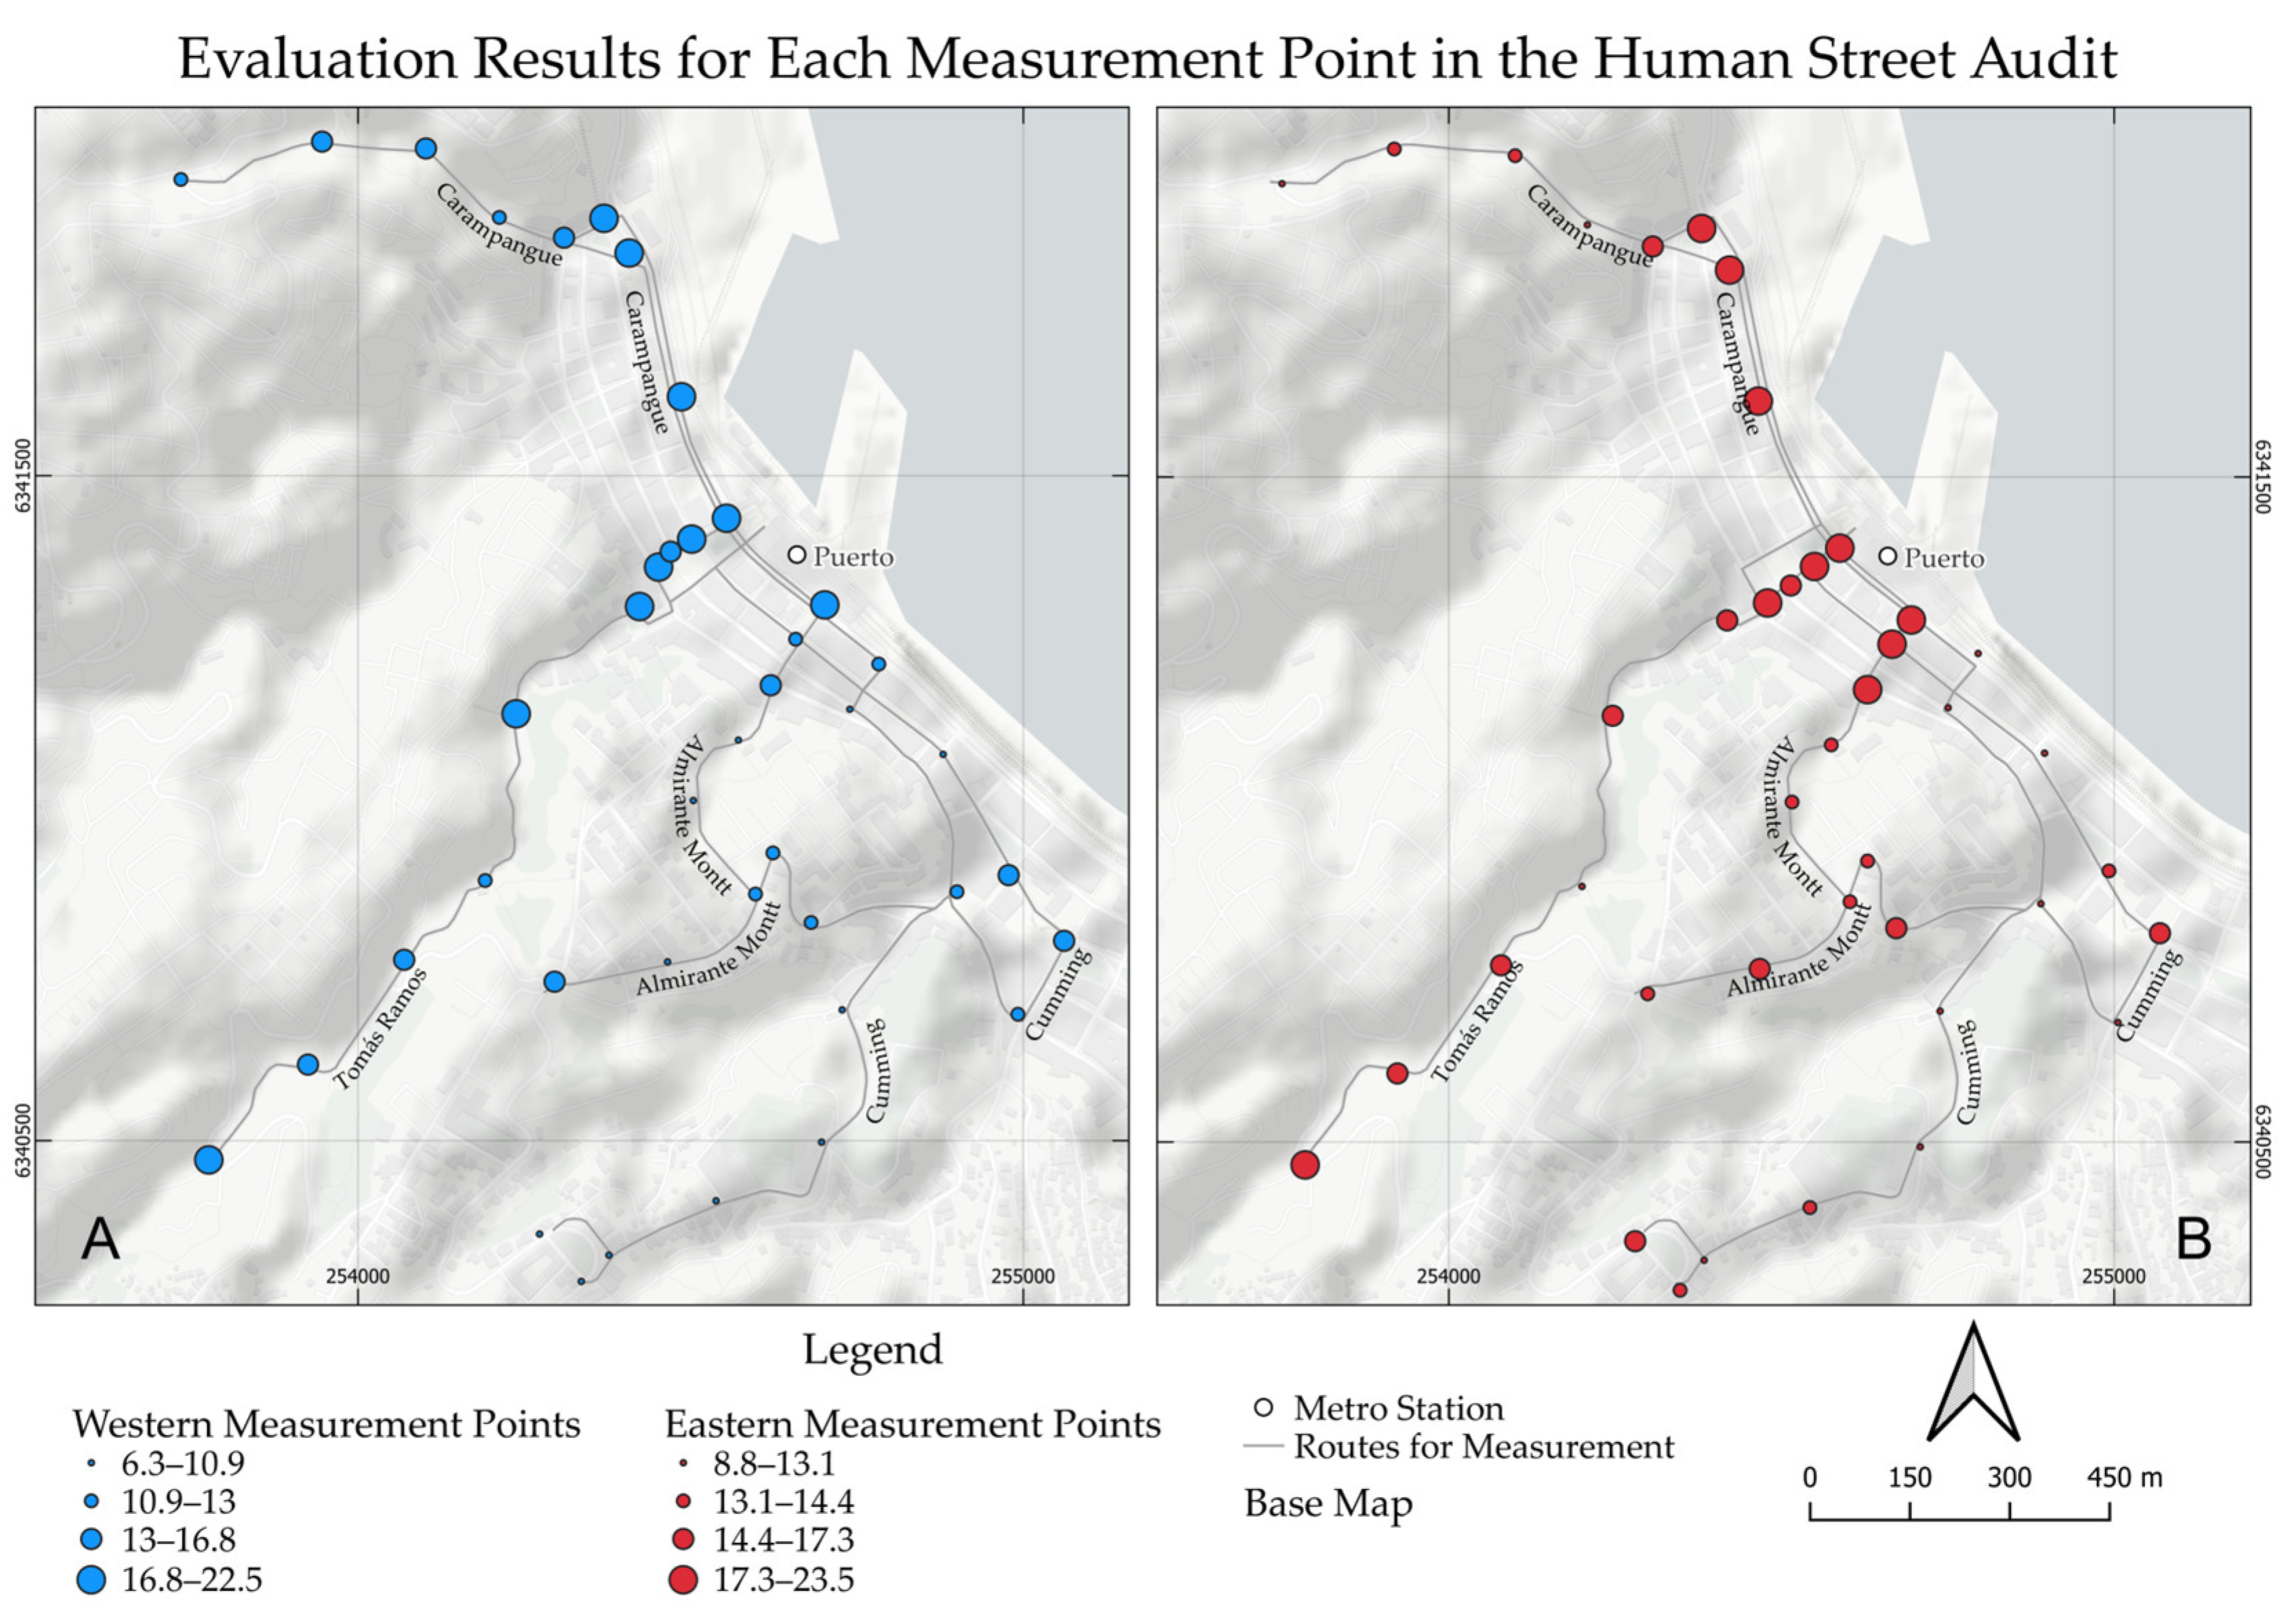
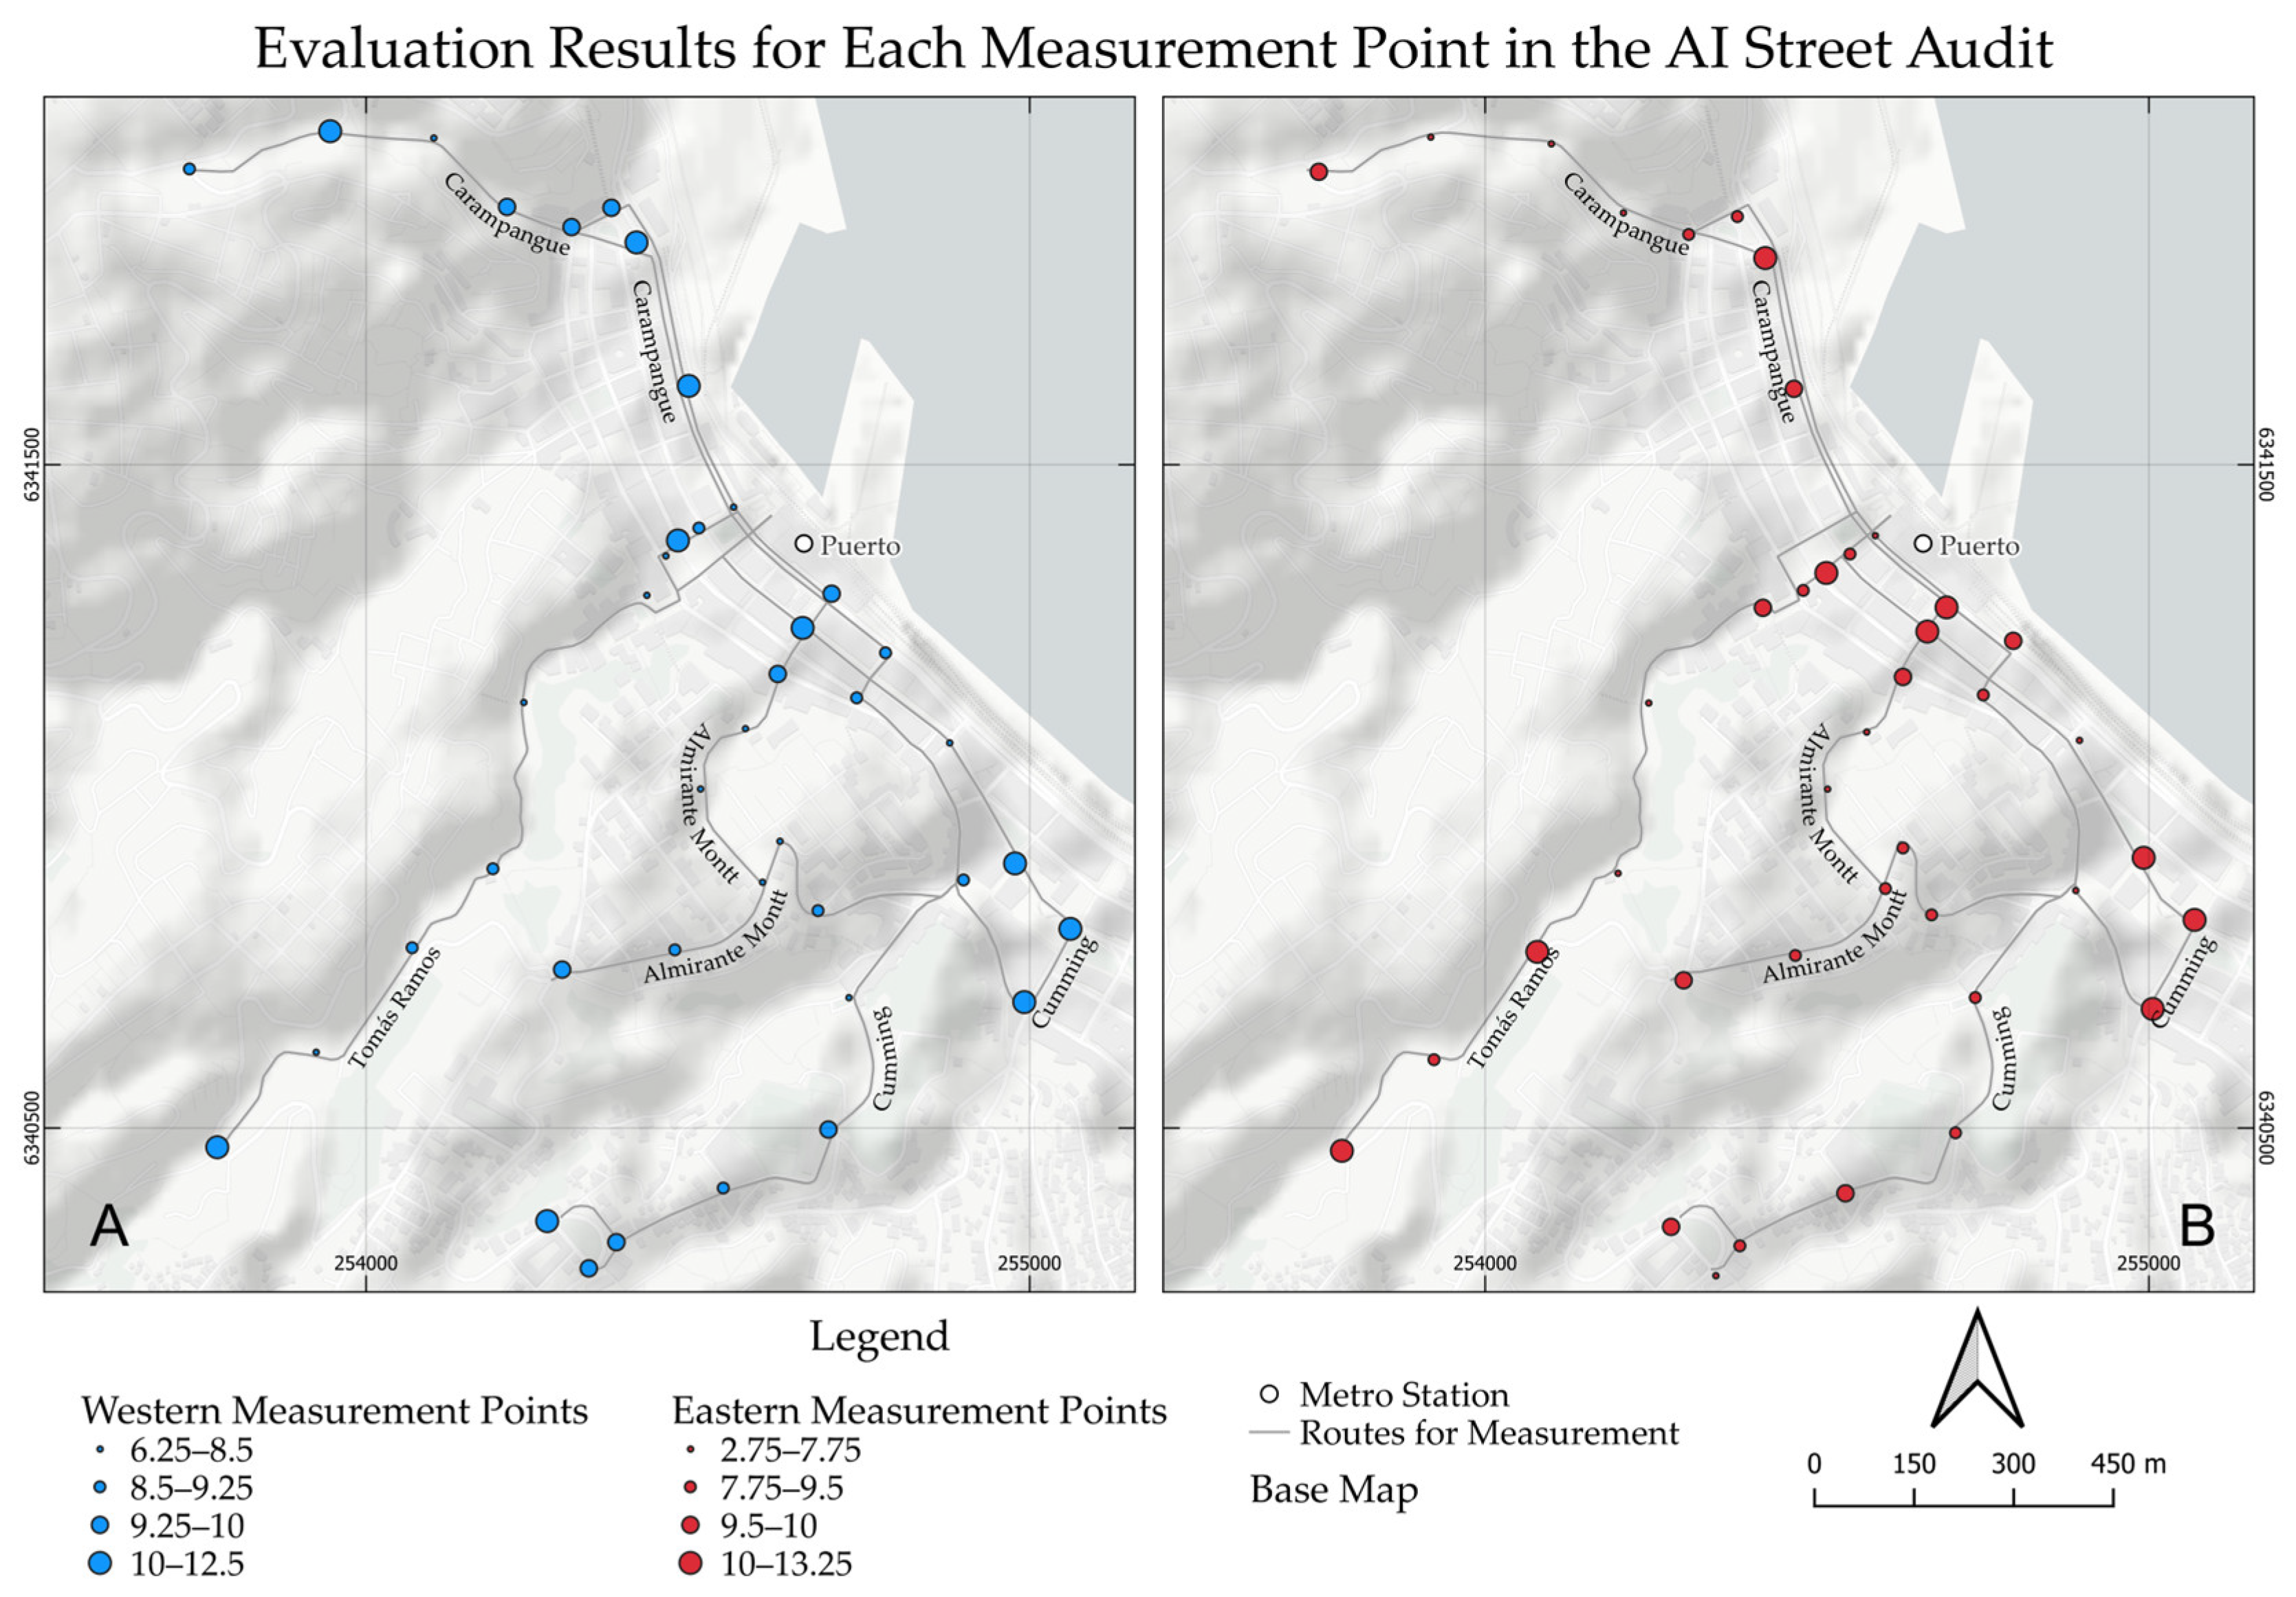
The results of each evaluated point are presented in Figure 5, which correspond to the normalized sum of each description in Table 3, Table 4 and Table 5. In this figure, it can be observed that the distribution of the sum of the measurement points is similar between the west and east measurements, with slightly higher values in the east zone, which also shows a greater range, with a higher minimum and maximum compared to the west zone. Spatially, the measurement points are distributed in a similar way in both cases, although differences are observed in the quantiles, especially in the highest altitude areas of the Carampangue and Cumming routes, where the east zone presents better results.
The criteria in the eastern zone (Table 3) show a better performance in habitability, since they present the highest average and the highest maximum values, with the exception of Tomás Ramos. In this criterion, the Cumming route stands out, with an average of 9.1 and a maximum value of 13, where the variables with the best evaluation correspond to Signage, Urban Dynamism and Security (Table A4). On the other hand, it is observed that the lowest performance in all the routes corresponds to the street infrastructure criterion, with the variables with the lowest scores being Bicycle Rack, Sewer and Street Crossing (Table A4). On the other hand, the highest standard deviation is observed in the Cumming route (4.43) in the street infrastructure criterion, which indicates a variability in the conditions of the streets present in said route. In this same criterion, the Almirante Montt and Tomás Ramos routes are those that present the lowest performance.
In the western direction (Table 4), a similar pattern to that of the eastern zone is observed, with the habitability criterion standing out again, which presents the highest averages in the four routes. The Cumming route registers the best habitability conditions, with an average of 9.05 points, while Carampangue shows the lowest standard deviation in this criterion, with a value of 1.7. In contrast, the criterion with the lowest performance in the first three routes is street coexistence. However, in the Tomás Ramos route, the lowest performance corresponds to the street infrastructure criterion, due to its average of 3.3 points and its lowest maximum value. As in the eastern zone, the variables with the best scores were Signage, Urban Dynamism and Pavement (Table A5). The highest standard deviation is found, again, in the Cumming route, although in a different criterion than that observed in the east, where the highest standard deviation corresponded to the street infrastructure criterion. In the west, the highest standard deviation is found in the street coexistence criterion.
The final scores of the human street audit are presented in Table 5 for both route orientations. On the eastern routes, the scores are mostly similar, except for Cumming, which obtained the lowest score with 12.91 points. Carampangue and Almirante Montt vary only by a tenth, while Tomás Ramos has the highest score with 17.23 points. In contrast, in the western orientation, greater variability is observed. Again, Cumming records the lowest score, with 11.72 points. In this case, Tomás Ramos remains the highest scoring route with 16.74 points.

4.2. AI-Driven Street Audit from Puerto Metro Stations

This section presents the results of the street audit carried out using artificial intelligence. Figure 6 shows the results at each point, obtained from the normalized sum of the values resulting from the AI, based on the descriptions given in Table 3, Table 4 and Table 5. The distribution of these data is heterogeneous in the territory, unlike the results of the human street audit. Furthermore, in this case, the maximum values reached are 12.5 in the west and 13.25 in the east, which are mostly concentrated in the flatter areas of the city, while in the higher areas, lower values predominate, mainly in the east.
Table 6 presents the descriptive measures of the criteria for each route in the east direction of the street audit using the artificial intelligence method. In general, the “Street Infrastructure” criterion stands out with the highest average score across all routes, indicating that the infrastructure conditions in the east direction are mostly favorable. The Carampangue route obtained the highest score, with 4 points on average. On the other hand, the criterion with the lowest performance is “Street coexistence” on all routes, with Almirante Montt being the route with the lowest average score of 1.81 points, except for Tomás Ramos, where the lowest score is for the “Habitability” criterion with 2.5 points on average. This may indicate a difficulty in the interaction of different street users, such as pedestrians, vehicles, and bicycles. The most variable criterion is habitability since all routes register the highest standard deviations. Within this criterion, the highest score is for the Cumming route, with 3.35 points, which indicates better living conditions on this route compared to the others. In this direction, the variables that stand out with the highest average score are Signage, Pavement, and Street Crossing (Table A6).
In the western direction (Table 7) as well as in the eastern direction, the criterion with the best performance is “Street Infrastructure” in all routes, especially Cumming with the highest average score of 5.42 points, suggesting better infrastructure conditions on this route. On the other hand, the criterion with the lowest performance varies according to the route, since in Almirante Montt and Tomás Ramos it is “Habitability” (1.55 and 1.6 points on average, respectively), possibly indicating deficiencies in the urban environment. On the other hand, the criterion with the lowest performance in Carampangue and Cumming is “Street Coexistence” (2.31 and 3.25 points on average, respectively), reflecting difficulties in the interaction of the different road users. Generally, the variables with the best performance in this direction correspond to Signage, Pavement, and Street Crossing (Table A7).
Table 8 shows the final results of the street audit carried out by artificial intelligence. Unlike the human street audit, the scores obtained in this case are lower. The highest score is recorded on the Carampangue route in the western orientation (9.8 points), with this value being lower than the lowest score recorded in the human street audit, corresponding to the Cumming route in the western orientation, with 11.72 points (Table 5). Regarding the eastern orientation, the highest score corresponds to the Cumming route, with 9.45 points. It should be noted that the scores do not show significant differences within each orientation, with a variation of 0.55 points on the eastern routes and 1.1 points on the western routes.

4.3. A Comparative Human and AI Street Auditing

To compare the results of the human and artificial intelligence (AI) street audit methods, the normalized sum of the scores recorded at each measurement point was used. With this data, histograms were created to observe the behavior of both methods in the west and east orientations (Figure 7). In the west orientation, graph A (Figure 7) shows a more favorable evaluation, evidenced by the distribution of the data, which reaches values higher than 22 points, with a higher frequency at 11 and 18 points. In contrast, graph B (Figure 7, AI method) shows a lower evaluation, concentrating its values between 6 and 13 points, with a maximum frequency of around 9 points. This suggests that AI tends to penalize the criteria analyzed through the photographs more than the human method.
In the east orientation, the human method (Figure 7, graph C) shows a higher evaluation, concentrating the scores mainly around 8 and 24 points, with the most frequent value at 14 points. In comparison, graph D (Figure 7, AI method) presents a lower evaluation with values ranging between approximately 2 and 14 points. This could indicate that the AI method tends to penalize the variables more severely in this orientation.
The comparative analysis of the average result between the Human and AI methods in the Tomás Ramos route reveals significant variations (Table 9), with differences reaching up to 47.5%, particularly highlighting the Habitability criterion. This indicates that the results obtained by the Human method in Tomás Ramos are 47.5% higher than those obtained by the AI method. The Heat Management and Security variables present the greatest discrepancies, with a total absence of registration in Heat Management by the AI method and notable differences of 86.96% in East and 95.24% in West with respect to the Human method, suggesting substantial methodological divergences (East–West) in the evaluation of the parameters studied.
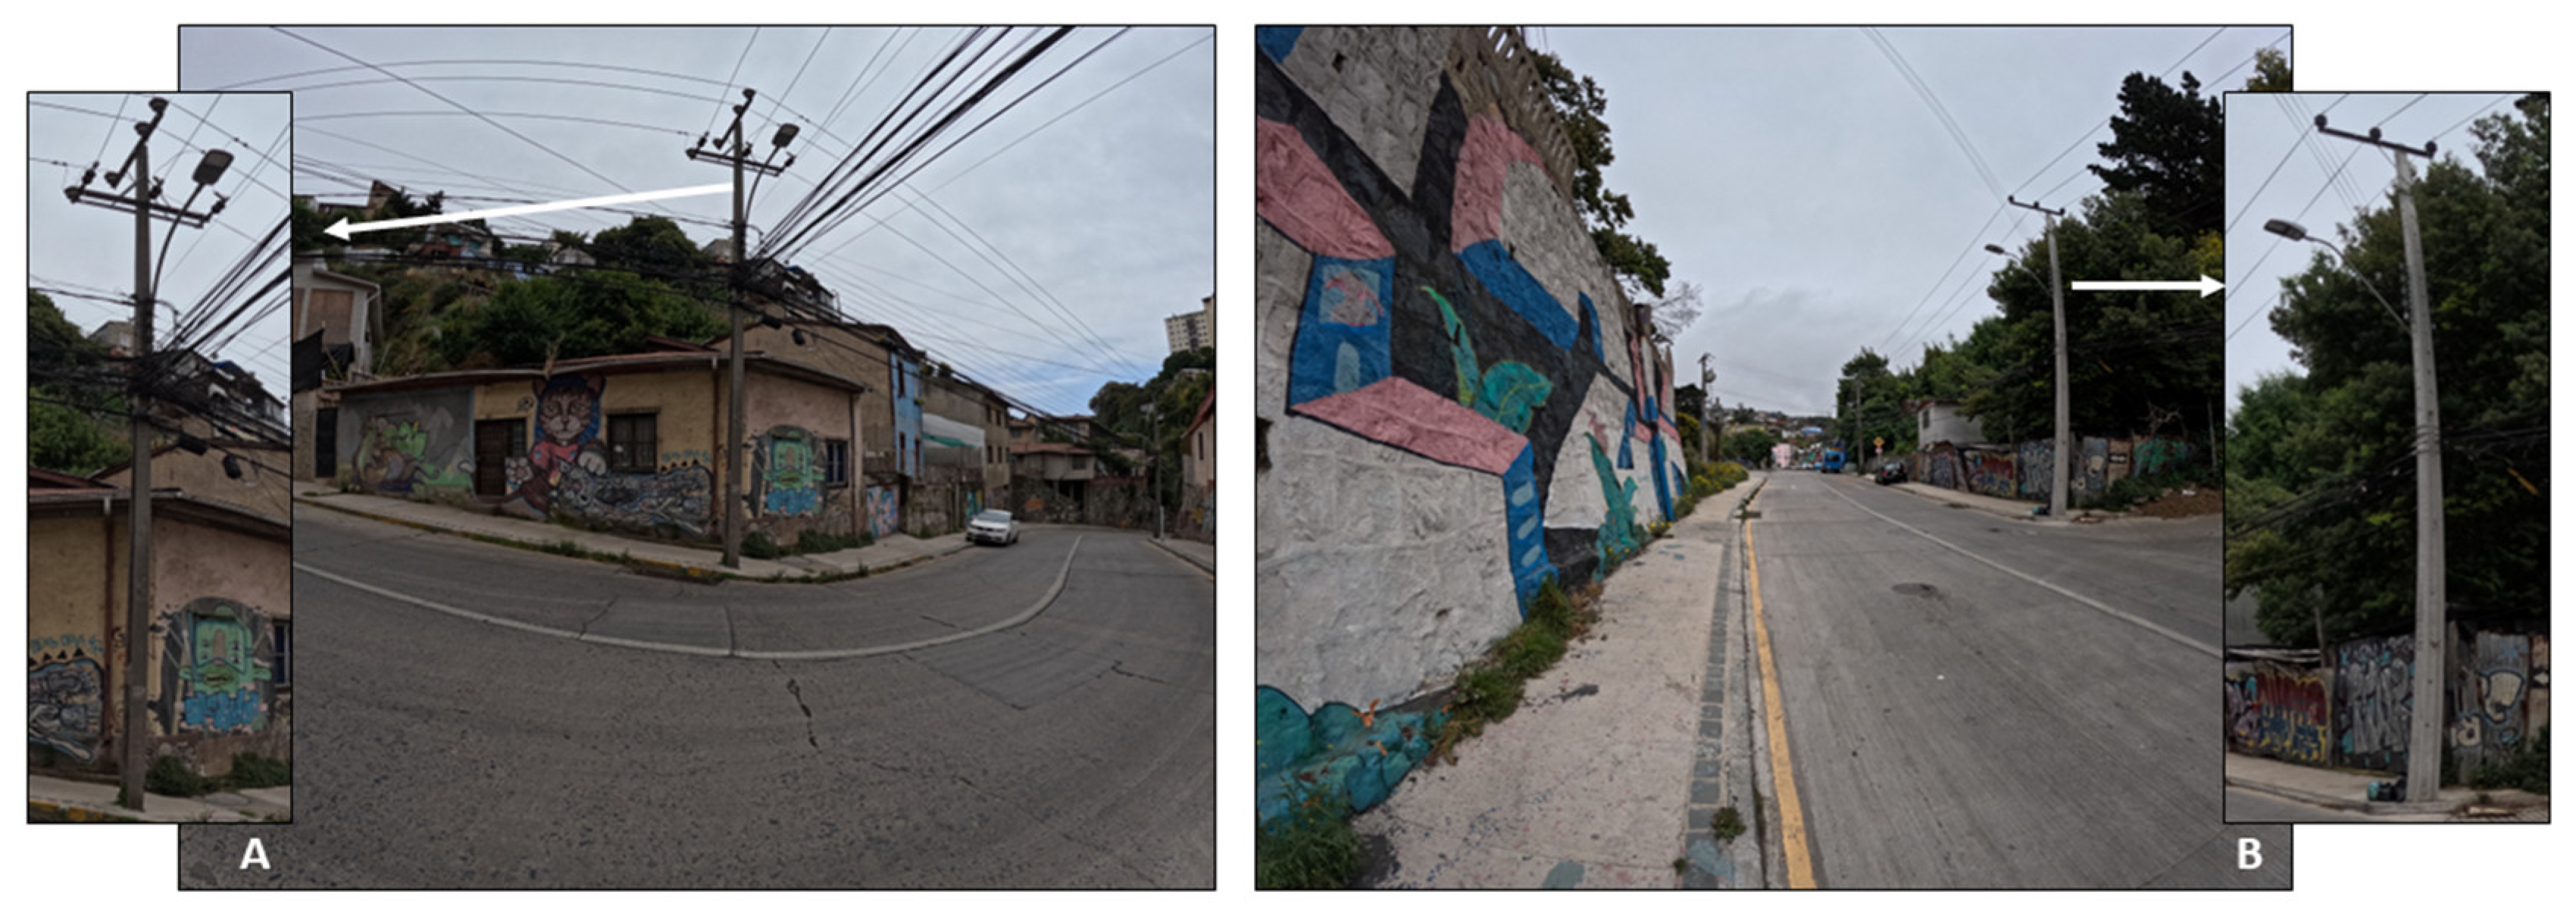
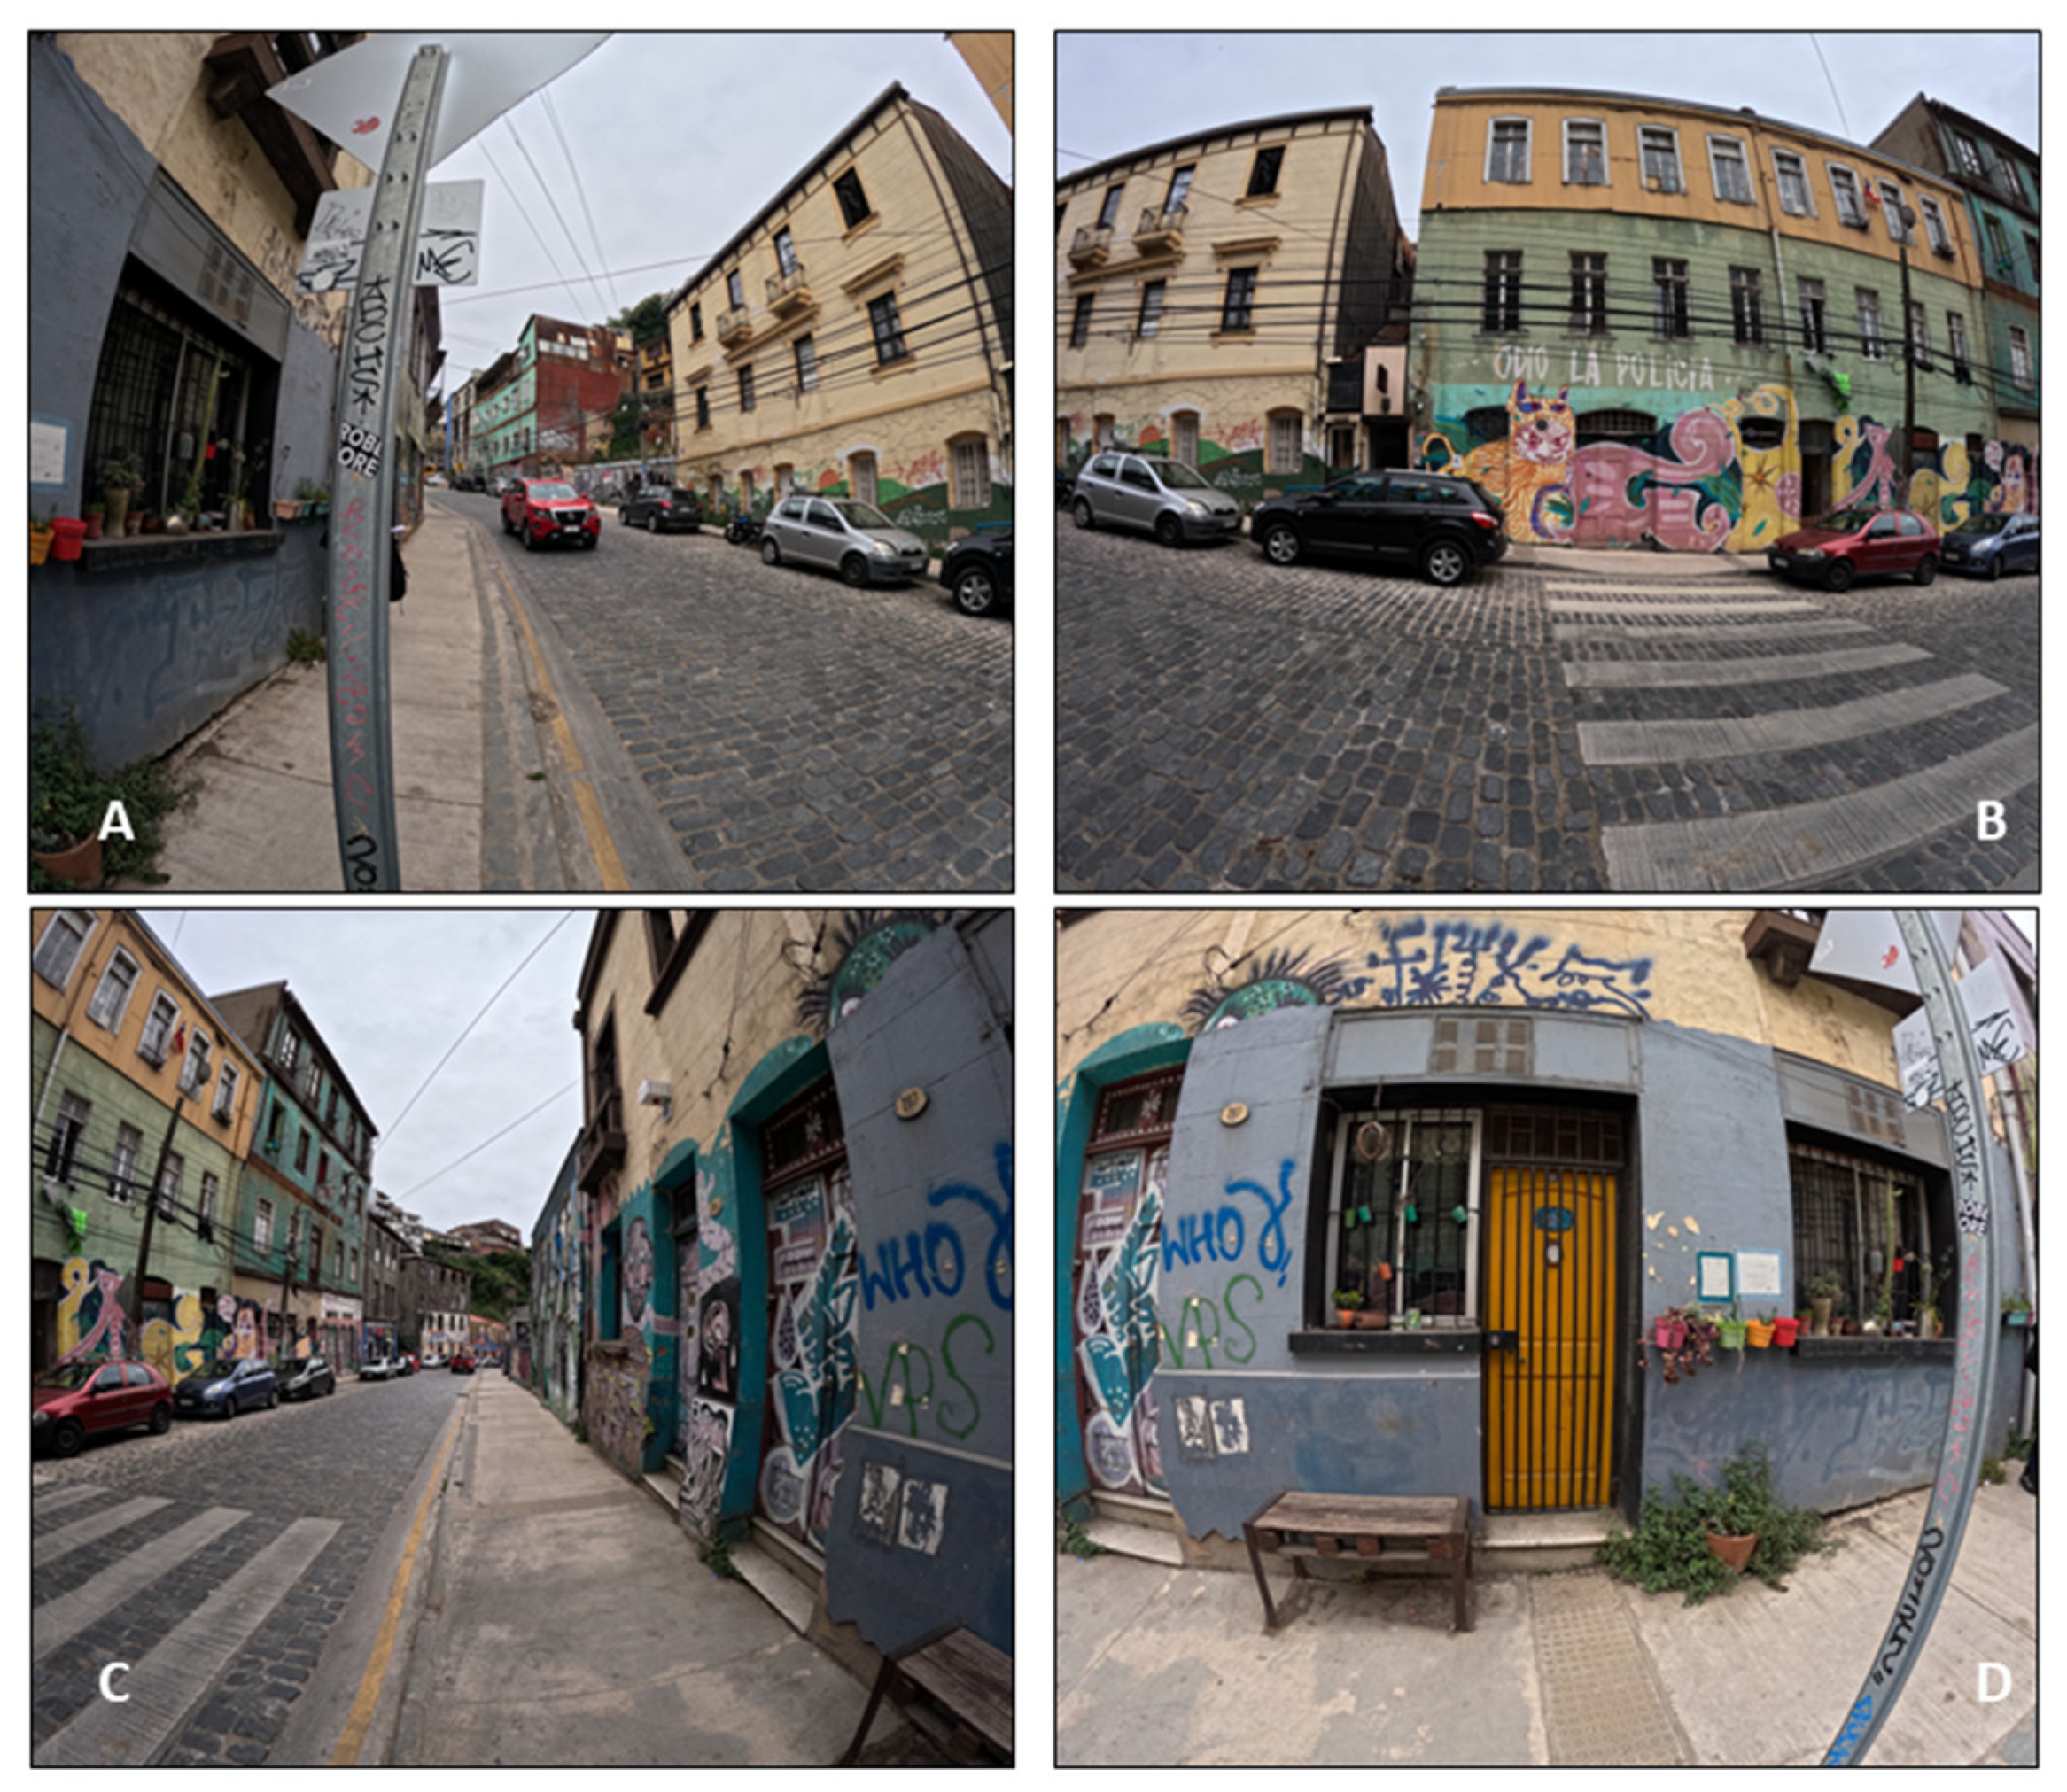
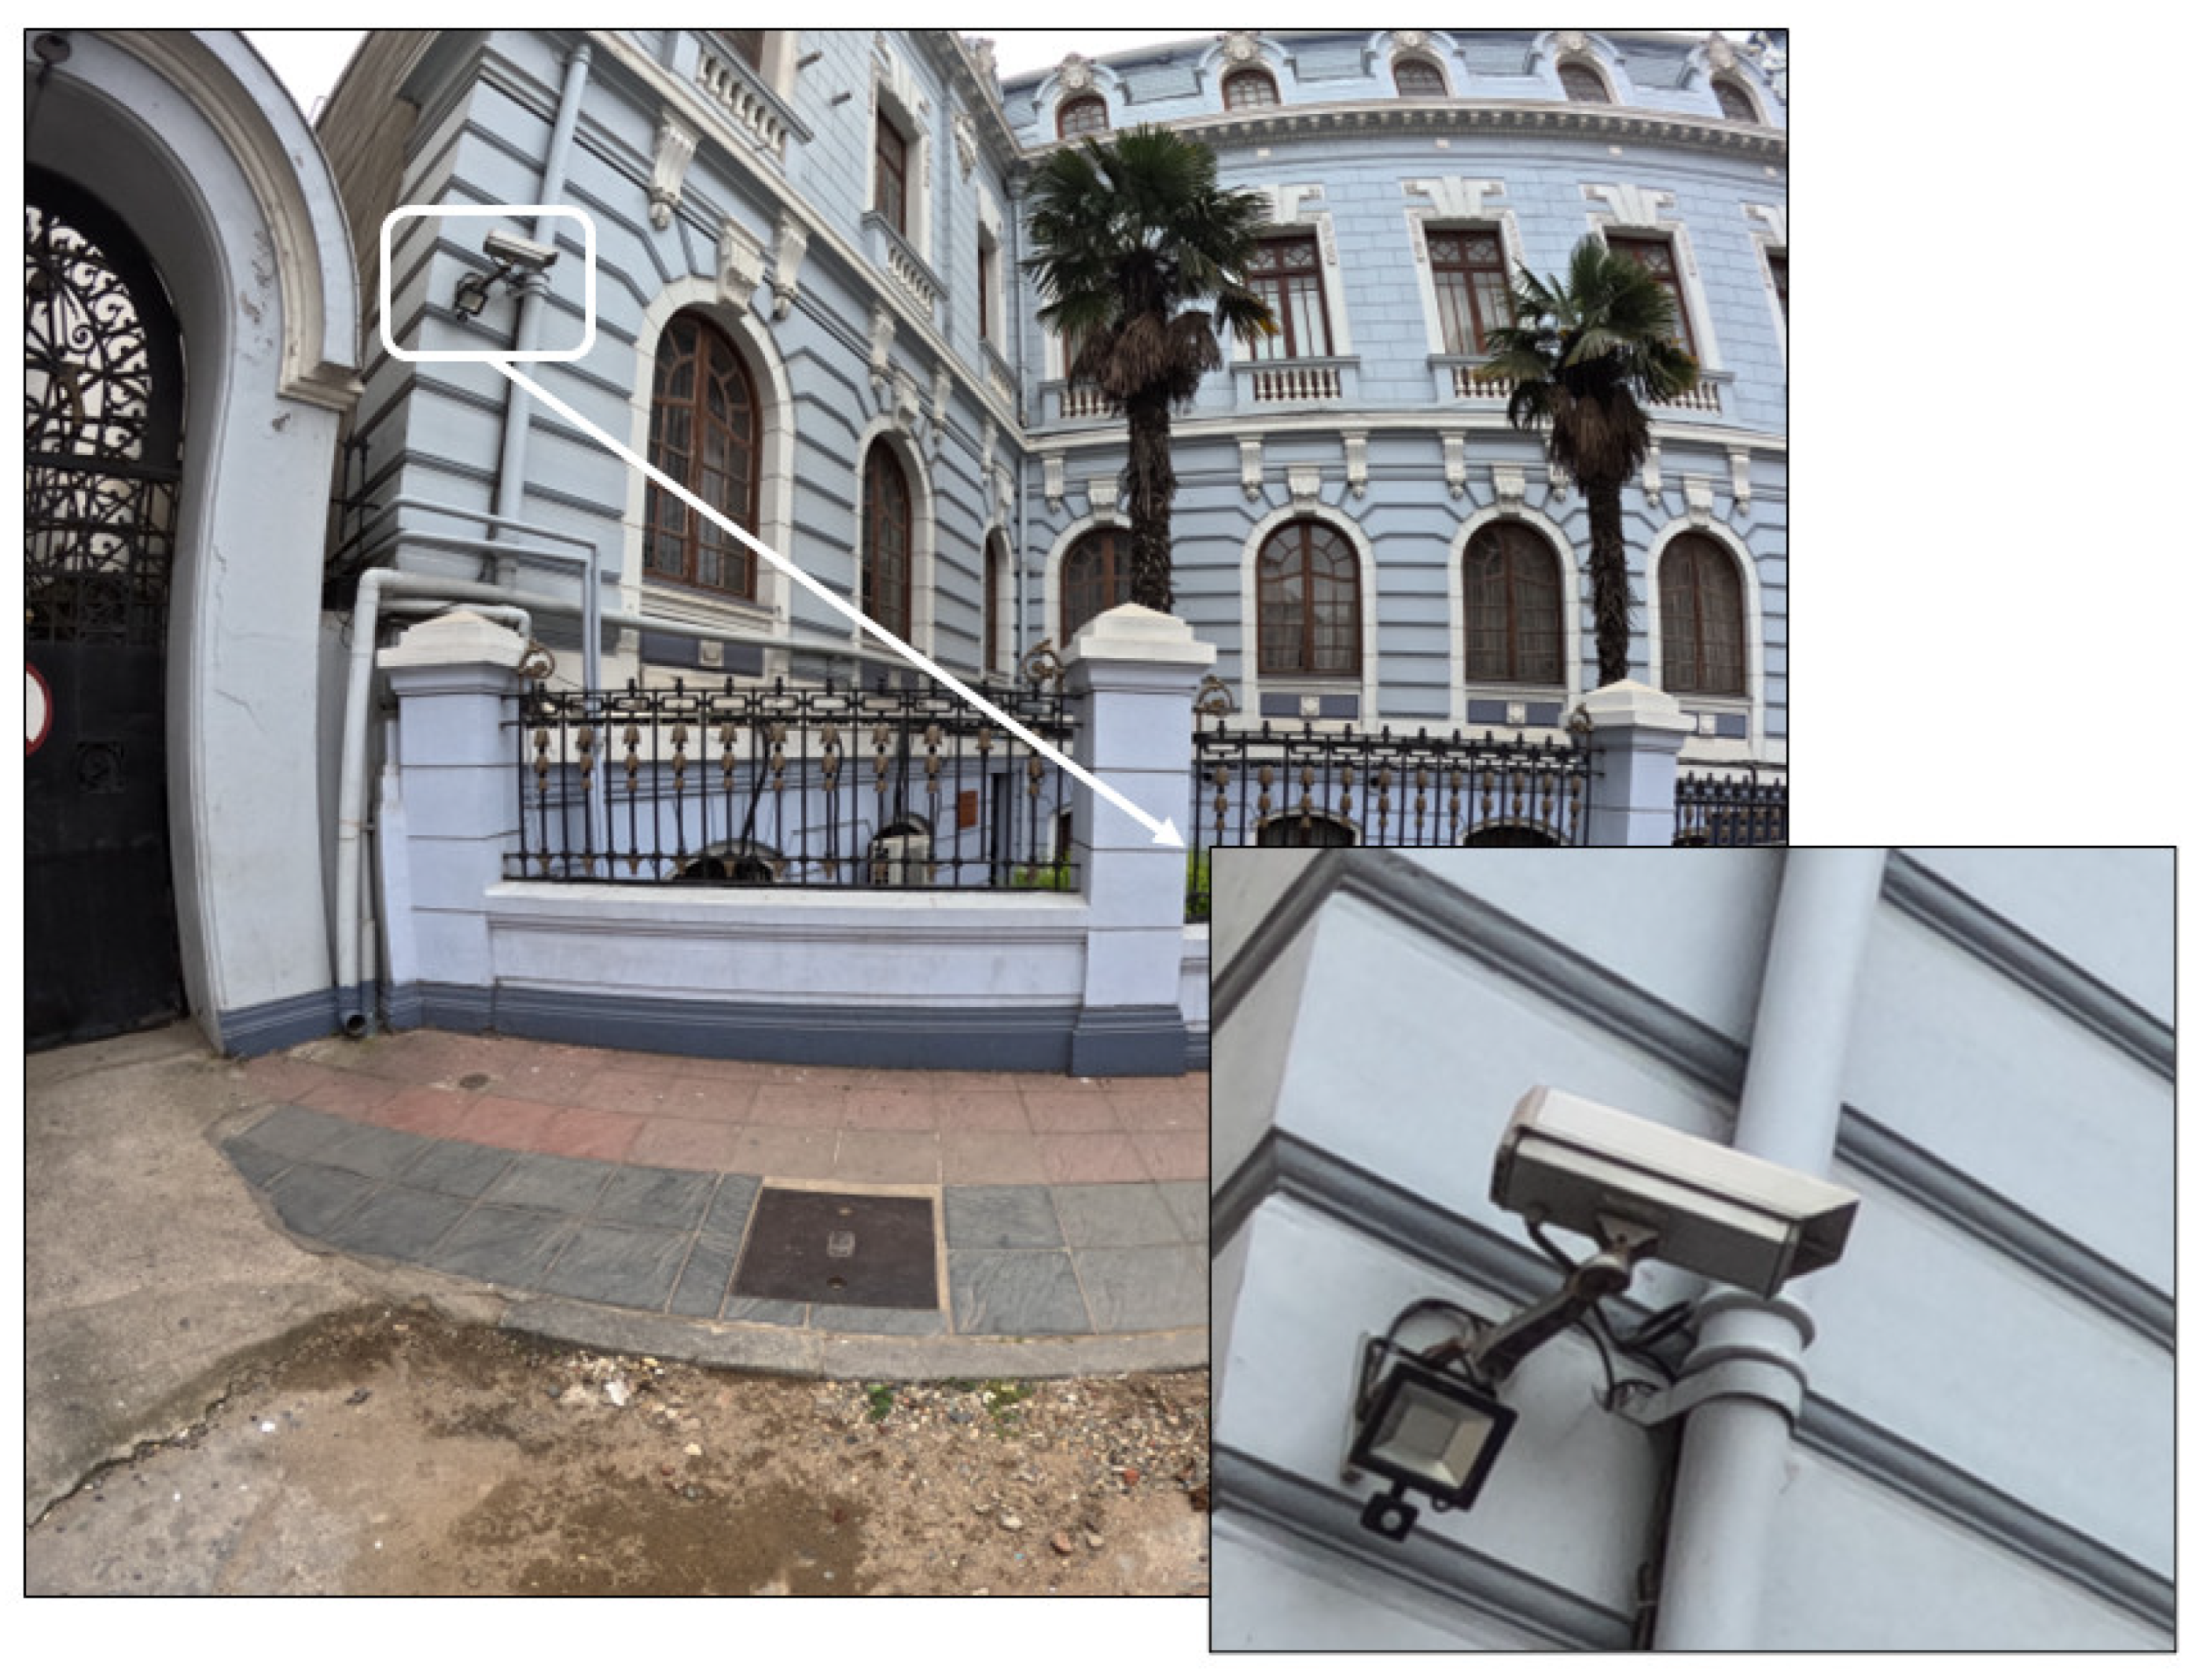
The security variable revealed critical discrepancies, particularly in surveillance cameras, where the AI method recorded no results but human verification confirmed their presence (Figure A1) as well as in lighting (Figure A2). Additionally, variables such as police presence (with a 50% difference between methods) present inherent comparative challenges, as they are dynamic and do not necessarily capture the same time point between human assessment and image capture. Significant inconsistencies were also observed when scoring the presence of such descriptions when no actual presence existed (Figure A3).
Regarding Heat Management, the importance of auditor objectivity is evident when assessing tree cover and shadow projection. When analyzing the low score of the AI method, Figure A4 shows the presence of trees; however, no shadow was projected at the time of capture, which could potentially exist at different times.
Additionally, the human method may induce subjectivity based on individual perceptions of the auditors, which could result in limitations in interpretation or automated photo analysis, depending on the image characteristics. These findings underline the imperative need for methodological improvements in the AI approach, particularly in quality, extent, saturation, distortion, illumination, lens and camera angle.

5. Discussion

This study provides a direct comparative analysis of human-led and AI-driven street auditing methodologies for evaluating e-bike infrastructure in the complex urban environment of Valparaíso. The findings reveal a fundamental divergence between the two approaches: the human audit excels at capturing the subjective, experiential qualities of a route, while the AI audit provides a more critical and objective assessment of physical infrastructure. This divergence is not a limitation but rather a key insight into the distinct roles each methodology can play in urban planning.
The AI-driven audit demonstrated its strength in systematic and objective detection, penalizing deficiencies like steep slopes and poor pavement with a consistency that is difficult to achieve with human auditors. While the AI penalized variables associated with habitability, particularly in areas with reduced tree cover, it effectively identified consistent patterns of street infrastructure, a finding aligned with previous studies on the importance of pavement conditions and street signaling for promoting non-motorized mobility [23,29]. This capability makes it a powerful tool for creating reliable, large-scale inventories of physical assets, a process shown to be scalable in other urban contexts [1,2].
Conversely, the human audit proved indispensable for evaluating habitability and perceived safety. The results from the human audit indicate that areas with better habitability, signage, and urban dynamism coincide with the more developed, flatter zones of the routes. Human auditors integrated nuanced contextual factors essential for creating inviting mobility corridors, which aligns with broader research showing that while AI can describe a scene, human perception is still required to assess its quality and subjective impact [3,4]. In contrast, both methods highlighted significant deficiencies in street infrastructure, such as the lack of bicycle racks and the low quality of sewer systems.
As argued by Lucas [11], a local-scale approach is effective for identifying spatial inequalities in infrastructure and accessibility. This study confirms that while e-bikes can overcome the steep slopes of Valparaíso [21,24,26], the primary limitation for their adoption remains the existing mobility infrastructure. This reinforces the need for targeted policies to implement dedicated lanes and secure parking to promote sustainable mobility in topographically challenging cities.
Ultimately, this study is a first approach to comparing these distinct methods and argues that the future of effective urban auditing lies not in choosing one over the other, but in developing a hybrid model. By leveraging AI for objective, scalable infrastructure assessment and complementing it with targeted human audits for qualitative insights, planners can create a more robust evaluation framework. This addresses the validation challenges noted by Ito & Biljecki [23] by clarifying the specific strengths and biases of AI. Future research should focus on refining this hybrid approach, potentially by training AI algorithms with human audit data to strengthen the AI’s ability to interpret complex contextual variables, thereby balancing objective analysis with subjective insight.

6. Conclusions and Final Considerations

A primary outcome of this research is the clear, data-driven evidence that most of the evaluated routes in Valparaíso currently lack the necessary conditions to safely promote e-bike use, particularly concerning habitability and security. This finding indicates an urgent need for public policies aimed at improving cycling infrastructure. The comparative results provide a powerful tool for policymakers; for instance, the consensus between both audit methods in identifying routes like Almirante Montt and Cumming as severely deficient provides a strong, evidence-based mandate for the targeted investment of public resources. To foster equitable mobility, policies must extend beyond the well-developed central business district to address longstanding infrastructure deficits in the vulnerable hillside communities where most of the population resides and accessibility challenges are most acute.
While these findings offer a clear path for policy, their application must be tempered by an acknowledgment of the study’s methodological limitations. The AI-driven audit, while objective and consistent, is fundamentally constrained by its data source. It analyzes static, pre-selected images and therefore cannot assess dynamic, real-time conditions such as traffic volume, pedestrian density, or temporary obstructions, all of which heavily influence a cyclist’s perception of safety. Furthermore, technical aspects like image resolution and the specific angles captured by the human operator can introduce biases. Conversely, while the in situ human audit captures this rich, multi-sensory “real experience,” it is inherently subjective, prone to inter-auditor variability, and is not a scalable solution for city-wide analysis due to significant time and cost constraints.
These complementary limitations lead directly to the most critical avenue for future research: advancing the proposed hybrid auditing model. The most promising next step is to use the detailed, perception-based data from human audits as a training set to teach AI algorithms to better recognize and score the nuanced variables that human auditors deem important, such as perceived safety and urban dynamism. The goal would be to create an AI that can serve as a scalable proxy for human perception, moving it beyond simple detection. Future work could also explore applying this comparative methodology to other micro-mobility modes or expanding the analysis to different urban typologies. Furthermore, integrating additional data layers, such as real-time traffic data or crowdsourced citizen reports, could help overcome the limitations of static imagery, leading to a more dynamic and comprehensive tool for automated urban mobility assessment.
Author Contributions

Conceptualization: V.A.; methodology: V.A., M.F., C.T., G.R. and I.B.; software: M.F., C.T. and G.R.; validation: V.A., S.S. and U.R.d.O.; formal analysis: V.A., M.F., C.T. and G.R.; investigation: V.A., S.S. and U.R.d.O.; resources: E.B., I.B.; data curation: M.F., C.T. and G.R.; writing—original draft preparation: V.A., C.T., G.R., E.B., S.S. and U.R.d.O.; writing—review and editing: V.A., C.T., G.R. and E.B.; visualization: C.T. and G.R.; supervision: V.A. and S.S.; project administration: V.A.; funding acquisition: V.A. All authors have read and agreed to the published version of the manuscript.

Funding

This research was funded by Agencia Nacional de Investigación y Desarrollo (ANID), Fondecyt 11230050.

Data Availability Statement

The raw data supporting the conclusions of this article will be made available by the authors on request.

Acknowledgments

The authors gratefully acknowledge the research support provided by Agencia Nacional de Investigación y Desarrollo (ANID), Chile.

Conflicts of Interest

The authors declare no conflicts of interest.

Appendix A

Table A1. Description of the Street Infrastructure variables of the street audit. Source: Elaborated by authors.
CriteriaVariableDescriptionScoreCharacteristicsSource
Street
Infrastructure
PavementType5Concrete[45,46,47]
4Asphalt
3Cobble
2Stone
1Dirt
Condition 5Good condition[45,46,47,55]
4Good condition, but needs maintenance
3Solvable deficiencies
2Deplorable road, presenting many irregularities
1Without any type of pavement
Slip Resistance5It presents resistance[45,46]
1It does not present resistance
Traffic LightsOperation5The traffic lights are working properly[46,48]
3Impaired or partial operability
1There are no traffic lights
Visibility5Good visibility[46,48]
3Mild visibility
1There is no visibility
Street crossingStart of the journey5At-grade crossing[49]
3At-grade crossing and pedestrian bridge
1Pedestrian bridge
SewerDesign Features5Sealed and clean[46]
3Open, dirty, with warning signs
1Open and without signage
SignageLegibility of signage5It is visible day and night (Reflective)[46,50,51]
4It is visible day and night (non-reflective)
3It is visible only during the day (Not reflective)
2Not visible day or night (non-reflective)
1There is no signage
DemarcationGeneral scope5There is visible and reflective demarcation[46,48]
4There is demarcation, not reflective
2Unmaintained demarcation, difficult to visualize
1Without demarcation
Bicycle rackCondition and use5Present and in good condition, with frequent use[52]
3Present, but in poor condition, or with occasional use
1Missing or unused
Table A2. Description of the Street Coexistence criterion of the street audit. Source: Elaborated by authors.
CriteriaVariableDescriptionScoreCharacteristicsSource
Street
coexistence
Speed reducersSignage5There is a speed limit marking[45,53,54]
1There are no speed limit signs
Physics5There is infrastructure to control speed (speed reducers)
1There is no infrastructure
ParkingInfrastructure5There is designated parking space in the area[50,51]
1There is a restriction on parking use.
Parking area signage5There is visible and clear parking demarcation[44,47,55]
3There is ambiguity in the demarcation
1There is no demarcation
Respect for use5Parking space is respected[55]
3Unused parking lot
1Parking in an inappropriate place
Restriction of use5There is a marked restriction on parking restrictions[55]
1There is restriction, but there is no adequate demarcation
Public transportBus/Microbus5There is no presence of route[51,56,57]
1There is a presence of a route
Shared taxi5There is no presence of route
1There is a presence of a route
Bus stops5Presence[63]
1Absence
Use of bus stops5Formal[63]
1Informal
Elevators/Funicular access5Direct[9]
1Indirect
5Accepts bicycle transport[9]
1Does not accept bicycle transport
Private transportHeavy vehicle5The street has restrictions for heavy vehicles (e.g., Trucks)[56]
3The street has no restrictions for heavy vehicle
1There is presence of heavy vehicle
Light vehicle5There is little volume[56,64]
3There is a regular volume
1There is a high volume
Cyclists5There is a presence of cyclists[46]
1Absence of cyclists
Pedestrians5Pedestrian compliance at crossings[64]
1Pedestrian non-compliance at crossings
Table A3. Description of the Habitability criterion of the street audit. Source: Elaborated by authors.
CriteriaVariableDescriptionScoreCharacteristicsSource
HabitabilityUrban DynamismFacades5The environment has active facades (doors, windows, services towards the public space)[53,58]
3The environment has blind walls where no type of opening is seen.
1The area has abandoned land
5The state of the facades is well maintained and beautified.[53,55]
3The state of the facades is untidy
1The state of the facades is ruined
Sites of Interest5There is a presence of health services, education or museums[53,55]
1No health, education or museum services are displayed
Commerce5There is a marked presence of commerce (or Commercial District), shops and services[53,55,58]
3There is a presence of commerce, but mainly retail.
1There is no presence of commerce activities
Thermal comfort/shade from trees and parksParks5There are parks nearby, with the possibility of rest.[51,53,55,58]
1There are no parks nearby that allow you to rest.
Trees5There are trees that cast shadows[53,55]
3There are trees or bushes, but they do not cast shade.
1There are no trees
SecurityLightning5Sufficient public lighting[53,59]
3Insufficient Public Lighting
1Lack of public lighting
Police5There are police stations and police booths[53]
3There is police or citizen security patrol
1There is no visible police or security presence
Surveillance cameras5There are security cameras (public and/or private)[51,59]
1There is no visible police or security presence
  • Code Snippet A1. Example of input used for street audit with artificial intelligence.
  • {
  • “Criteria”: “\” Street Infrastructure\”“,
  • “Variable”: “\”Pavement—Type\”“,
  • “Description”: “\”Determines the type of pavement in the evaluated street infrastructure.\”“,
  • “Item”: “\”Pavement\”“,
  • “Codigo”: “\”C1V1D1\”“,
  • “exp_Criteria”: “\”The criterion focuses on evaluating the physical condition and quality of street infrastructure.\”“,
  • “exp_Variable”: “\”The variable analyzes the type of pavement used on the street, such as concrete, asphalt, or dirt.\”“,
  • “exp_Item”: “\”It is assessed based on the type of pavement present: concrete, asphalt, cobblestone, stone-paved, or dirt.\”“,
  • “exp_Description”: “(\n \”The pavement is categorized into specific levels with scores assigned according to its quality:\n\”\n \”- 5: Concrete\n\”\n \”- 4: Asphalt\n\”\n \”- 3: Cobblestone\n\”\n \”- 2: Stone-paved\n\”\n \”- 1: Dirt\”\n)”,
  • “photo1”: “./img/mod_2.JPG”
  • }
  • Code Snippet A2. Example of the Output Used for Street Audit with Artificial Intelligence
  • {
  • “visual_answers”: [
  • “The pavement observed in the image is concrete.”,
  • “The physical condition of the pavement seems acceptable, as no cracks, potholes, or significant wear can be identified in the image.”,
  • “No differences in the type of pavement along the street shown in the image are observed; it appears to be homogeneous.”,
  • “The quality of the pavement in the image can be classified as good, meeting the standards for concrete.”,
  • “Yes, there are additional elements such as street markings on the pavement that could influence the assessment of the pavement type.”
  • ],
  • “questions”: [
  • “1. What type of pavement is observed in the image: concrete, asphalt, cobblestone, stone-paved, or dirt?”,
  • “2. What is the physical condition of the pavement visible in the image? Can cracks, potholes, or significant wear be identified?”,
  • “3. Are there differences in the type of pavement along the street shown in the image? If so, what are they and where are they located?”,
  • “4. How does the quality of the pavement in the image compare to the classification standards (concrete, asphalt, cobblestone, stone-paved, dirt)?”,
  • “5. Are there additional elements in the image, such as street markings or curbs, that could influence the assessment of the pavement type?”
  • ],
  • “Score”: 5,
  • “Justification”: “The pavement observed is concrete, which is the highest-quality type of pavement according to established standards. Additionally, the physical condition of the pavement is acceptable, with no visible cracks or potholes, further reinforcing its good condition. The homogeneity of the pavement along the street also contributes to its positive evaluation.”
Table A4. Descriptive measures of the variables evaluated on each route at the measurement points in the eastern direction in the human street audit. Source: Elaborated by authors.
RouteCriteriaVariableMeanStdMin25%50%75%Max
Almirante MonttStreet InfrastructurePavement4.061.433.64.674.85
Traffic Lights3.251.132.93.253.64
Street Crossing0-00000
Sewer0-00000
Signage7.75-87.87.757.87.8
Demarcation3-33333
Bicycle Rack0-00000
Street coexistenceSpeed Reducers2.53.501.32.53.85
Parking3.832.502.944.87.5
Public Transport3.22.203346
Private Transport5.43.604689
HabitabilityUrban Dynamism6.33.31588.59
Heat Management3.5-43.53.53.53.5
Security64.414.588.59
CarampangueStreet InfrastructurePavement5.111.644.24.335.77
Traffic Lights41.433.544.55
Street Crossing0-00000
Sewer0-00000
Signage7-77777
Demarcation3.25-33.33.253.33.3
Bicycle Rack0-00000
Street coexistenceSpeed Reducers2.50.722.32.52.83
Parking3.421.322.634.55
Public Transport2.42.300345
Private Transport6.22.235.5688.5
HabitabilityUrban Dynamism61.945669
Heat Management1-11111
Security4.332.52345.57
CummingStreet InfrastructurePavement9.722.288.69.51112
Traffic Lights7.832.666.97.838.89.7
Street Crossing2-22222
Sewer0-00000
Signage10-1010101010
Demarcation3.13-33.13.133.13.1
Bicycle Rack0-00000
Street coexistenceSpeed Reducers42.823456
Parking7.253.126.47.758.811
Public Transport5.74.12266.512
Private Transport7.23.5357912
HabitabilityUrban Dynamism8.92.367.591012
Heat Management9-99999
Security7.881.767.17.758.510
Tomás RamosStreet InfrastructurePavement4.330.64444.55
Traffic Lights32.812345
Street Crossing0-00000
Sewer0-00000
Signage6-66666
Demarcation5.67-65.75.675.75.7
Bicycle Rack0-00000
Street coexistenceSpeed Reducers4.53.523.34.55.87
Parking6.423.423.96.758.511
Public Transport3.23.600277
Private Transport2.83.600158
HabitabilityUrban Dynamism71.566779.5
Heat Management6-66666
Security5.753.913.36.599
Table A5. Descriptive measures of the variables evaluated on each route at the measurement points on the western direction in the human street audit. Source: Elaborated by authors.
RouteCriteriaVariableMeanStdMin25%50%75%Max
Almirante MonttStreet InfrastructurePavement3.671.52344.55
Traffic Lights3.52.122.83.54.35
Street Crossing4-44444
Sewer5.5-65.55.55.55.5
Signage6-66666
Demarcation4.25-44.34.254.34.3
Bicycle Rack0-00000
Street coexistenceSpeed Reducers2.53.501.32.53.85
Parking2.922.301.42.754.56
Public Transport2.22.500236
Private Transport3.12.9012.557
HabitabilityUrban Dynamism5.052.133.5577.3
Heat Management0-00000
Security3.082.11234.15.3
CarampangueStreet InfrastructurePavement5.111.644.24.335.77
Traffic Lights41.433.544.55
Street Crossing0-00000
Sewer0-00000
Signage7.5-87.57.57.57.5
Demarcation3.5-43.53.53.53.5
Bicycle Rack0-00000
Street coexistenceSpeed Reducers2022222
Parking3.832.1223.557
Public Transport2.42.500255
Private Transport4.12.703566.5
HabitabilityUrban Dynamism5.11.144566.5
Heat Management4.5-54.54.54.54.5
Security42.622.5357
CummingStreet InfrastructurePavement7.671.56788.59
Traffic Lights6.750.476.66.756.97
Street Crossing7-77777
Sewer7-77777
Signage10.3-101010.31010
Demarcation3.88-43.93.883.93.9
Bicycle Rack0-00000
Street coexistenceSpeed Reducers32.812345
Parking6.082.915.16.7589
Public Transport5.24.4124712
Private Transport7.43.7447.51012
HabitabilityUrban Dynamism9.2198.59911
Heat Management9-99999
Security7.252.56667.311
Tomás RamosStreet InfrastructurePavement5144.555.56
Traffic Lights32.812345
Street Crossing0-00000
Sewer0-00000
Signage6-66666
Demarcation5-55555
Bicycle Rack0-00000
Street coexistenceSpeed Reducers3.53.512.33.54.86
Parking4.833.411.857.59
Public Transport2.522.5002.655
Private Transport2.22.700146
HabitabilityUrban Dynamism5.41.934668
Heat Management4-44444
Security5.253.3145.56.89
Table A6. Descriptive measures of the variables evaluated on each route at the measurement points in the eastern direction in the AI street audit. Source: Elaborated by authors.
RouteCriteriaVariableMeanStdMin25%50%75%Max
Almirante MonttStreet InfrastructurePavement5.332.534.56.56.87
Traffic Lights2.751.122.42.753.13.5
Street Crossing7-77777
Sewer0-00000
Signage5.67-65.75.675.75.7
Demarcation1.33-11.31.331.31.3
Bicycle Rack0-00000
Street coexistenceSpeed Reducers0000000
Parking0.170.400001
Public Transport3.84.800199
Private Transport1.8200144
HabitabilityUrban Dynamism3.74.1002.579
Heat Management0-00000
Security1.752.40012.85
CarampangueStreet InfrastructurePavement5.331.944.34.567.5
Traffic Lights3.251.822.63.253.94.5
Street Crossing5.5-65.55.55.55.5
Sewer2-22222
Signage8-88888
Demarcation2-22222
Bicycle Rack0-00000
Street coexistenceSpeed Reducers0000000
Parking1.171.9000.515
Public Transport33.300267
Private Transport1.92.200225.5
HabitabilityUrban Dynamism5.54.401.5899
Heat Management0-00000
Security11.200122
CummingStreet InfrastructurePavement6.51.365.8678
Traffic Lights2.251.811.62.252.93.5
Street Crossing3-33333
Sewer2-22222
Signage7-77777
Demarcation1.67-21.71.671.71.7
Bicycle Rack0-00000
Street coexistenceSpeed Reducers0000000
Parking0.671.600004
Public Transport3.42.801466
Private Transport2.83.2001.566.5
HabitabilityUrban Dynamism4.74.31138.510
Heat Management0-00000
Security2.52.400.82.54.35
Tomás RamosStreet InfrastructurePavement7.332.4666.58.310
Traffic Lights2.251.121.92.252.63
Street Crossing3-33333
Sewer0-00000
Signage6-66666
Demarcation2.33-22.32.332.32.3
Bicycle Rack0-00000
Street coexistenceSpeed Reducers0000000
Parking1.582.4000.52.16
Public Transport3.84.4011710
Private Transport2.43.300228
HabitabilityUrban Dynamism4.44.9003811
Heat Management0-00000
Security0.751000.51.32
Table A7. Descriptive measures of the variables evaluated on each route at the measurement points on the western direction in the AI street audit. Source: Elaborated by authors.
RouteCriteriaVariableMeanStdMin25%50%75%Max
Almirante MonttStreet InfrastructurePavement5.52.244.34.56.38
Traffic Lights2.250.422.12.252.42.5
Street Crossing6-66666
Sewer3-33333
Signage9-99999
Demarcation6-66666
Bicycle Rack0-00000
Street coexistenceSpeed Reducers0.50.700.30.50.81
Parking0.920.900.3112.5
Public Transport44.600299
Private Transport3.64.3002610
HabitabilityUrban Dynamism2.43.400138
Heat Management0-00000
Security0.881000.751.62
CarampangueStreet InfrastructurePavement5.612.634.256.88.5
Traffic Lights2.750.432.62.752.93
Street Crossing6-66666
Sewer0-00000
Signage9-99999
Demarcation3.67-43.73.673.73.7
Bicycle Rack0-00000
Street coexistenceSpeed Reducers0.50.700.30.50.81
Parking1.52.300.3116
Public Transport3.64.900099
Private Transport22.400226
HabitabilityUrban Dynamism3.64.3001.588.5
Heat Management0-00000
Security1.752.40012.85
CummingStreet InfrastructurePavement9.783.577.99.331114
Traffic Lights32.812345
Street Crossing4-44444
Sewer1-11111
Signage12.5-131312.51313
Demarcation1.33-11.31.331.31.3
Bicycle Rack0-00000
Street coexistenceSpeed Reducers0000000
Parking0.83200005
Public Transport5.24.3025910
Private Transport4.24.50128.59.5
HabitabilityUrban Dynamism7.254.7246.759.514
Heat Management0-00000
Security2.530024.56
Tomás RamosStreet InfrastructurePavement3.172.80244.85.5
Traffic Lights2.250.422.12.252.42.5
Street Crossing3-33333
Sewer0-00000
Signage4.5-54.54.54.54.5
Demarcation2-22222
Bicycle Rack0-00000
Street coexistenceSpeed Reducers0000000
Parking0.831.60000.84
Public Transport3.23.101267
Private Transport2.42.90015.55.5
HabitabilityUrban Dynamism33.3002.557.5
Heat Management0-00000
Security0.250.50000.31
Figure A1. Photograph of the Tomás Ramos route, westward orientation, taken on 30 October 2024, showing the presence of a security camera. Source: Elaborated by authors.
Systems 13 00894 g0a1
Figure A2. Examples of street lighting found on the Tomás Ramos route (eastward orientation), taken on 30 October 2024. (A) shows a streetlight fixture at a street corner within the route, while (B) shows another example of lighting along a different section of the same road. Source: Elaborated by authors.
Systems 13 00894 g0a2
Figure A3. Photographic evidence showing the absence of police presence at various points along the Tomás Ramos route (eastward orientation), taken on 30 October 2024. The subfigures show different perspectives of the route: (A) a general street view; (B) a street corner with a crosswalk; (C) a view along the sidewalk; and (D) a close-up of a building facade. No police were visible in any of the captured scenes. Source: Elaborated by authors.
Systems 13 00894 g0a3
Figure A4. Photograph of the Tomás Ramos route, westward orientation, taken on 30 October 2024, showing the presence of trees and their potential to cast shade. Source: Elaborated by authors.
Systems 13 00894 g0a4

References

  1. Ning, H. Neighborhood Mobility Auditing and Assessment for Wheelchair Users Based on Street View Imagery and Artificial Intelligence. Ph.D. Thesis, The Pennsylvania State University, University Park, PA, USA, 2025. [Google Scholar]
  2. O’Meara, J.S.; Hwang, J.; Wang, Z.; Saugstad, M.; Froehlich, J.E. RampNet: A Two-Stage Pipeline for Bootstrapping Curb Ramp Detection in Streetscape Images from Open Government Metadata 2025. arXiv 2025, arXiv:2508.09415. [Google Scholar]
  3. Askari, S.; Snyder, D.; Li, C.; Saugstad, M.; Froehlich, J.E.; Eisenberg, Y. Validating Pedestrian Infrastructure Data: How Well Do Street-View Imagery Audits Compare to Government Field Data? Urban Sci. 2025, 9, 130. [Google Scholar] [CrossRef]
  4. Froehlich, J.E.; Fiannaca, A.; Jaber, N.; Tsaran, V.; Kane, S. StreetViewAI: Making Street View Accessible Using Context-Aware Multimodal AI 2025. arXiv 2025, arXiv:2508.08524. [Google Scholar]
  5. Lee, J.; Aleotti, F.; Mazala, D.; Garcia-Hernando, G.; Vicente, S.; Johnston, O.J.; Kraus-Liang, I.; Powierza, J.; Shin, D.; Froehlich, J.E.; et al. ImaginateAR: AI-Assisted In-Situ Authoring in Augmented Reality 2025. arXiv 2025, arXiv:2504.21360. [Google Scholar]
  6. Fernandes, V.A.; Tirado, H.M. Sustainable mobility in valparaíso, chile, and its relationship with topography and socio-spatial conditions. J. Sustain. Sci. Manag. 2021, 16, 122–134. [Google Scholar] [CrossRef]
  7. Aprigliano, V.; Seriani, S.; Toro, C.; Rojas, G.; Fukushi, M.; Cardoso, M.; Silva, M.A.V.D.; Cucumides, C.; De Oliveira, U.R.; Henríquez, C.; et al. Built Environment Effect on Metro Ridership in Metropolitan Area of Valparaíso, Chile, under Different Influence Area Approaches. ISPRS Int. J. Geo-Inf. 2024, 13, 266. [Google Scholar] [CrossRef]
  8. Aprigliano, V.; Toro, C.; Rojas, G.; Barros, G.; Fukushi, M.; Seriani, S. Effects of the Built Environment and Sociodemographic Factors on Accessibility in the City of Valparaíso, Chile. J. Transp. Geogr. 2024, 118, 103931. [Google Scholar] [CrossRef]
  9. Banister, D. The Sustainable Mobility Paradigm. Transp. Policy 2008, 15, 73–80. [Google Scholar] [CrossRef]
  10. United Nations Conferencia de las Naciones Unidas sobre Medio Ambiente y Desarrollo, Río de Janeiro, Brasil, 3-14 de junio de 1992|Naciones Unidas. Available online: https://www.un.org/es/conferences/environment/rio1992 (accessed on 9 December 2024).
  11. Lucas, K. Making the Connections between Transport Disadvantage and the Social Exclusion of Low Income Populations in the Tshwane Region of South Africa. J. Transp. Geogr. 2011, 19, 1320–1334. [Google Scholar] [CrossRef]
  12. Coll, M.-H.; Vandersmissen, M.-H.; Thériault, M. Modeling Spatio-Temporal Diffusion of Carsharing Membership in Québec City. J. Transp. Geogr. 2014, 38, 22–37. [Google Scholar] [CrossRef]
  13. Wang, S.; Liu, Y. Parking in Inner versus Outer City Spaces: Spatiotemporal Patterns of Parking Problems and Their Associations with Built Environment Features in Brisbane, Australia. J. Transp. Geogr. 2022, 98, 103261. [Google Scholar] [CrossRef]
  14. Singh, A.; Baalsrud Hauge, J.; Wiktorsson, M.; Upadhyay, U. Optimizing Local and Global Objectives for Sustainable Mobility in Urban Areas. J. Urban Mobil. 2002, 2, 100012. [Google Scholar] [CrossRef]
  15. Ploegmakers, H.; Lagendijk, A. Explaining the Diffusion of Dutch Express Bikeways through QCA: The Importance of Pilots, Collaboration and External Funding. J. Transp. Geogr. 2024, 115, 103800. [Google Scholar] [CrossRef]
  16. Nakamura, H.; Abe, N. The Role of a Non-Profit Organisation-Run Public Bicycle-Sharing Programme: The Case of Kitakyushu City, Japan. J. Transp. Geogr. 2014, 41, 338–345. [Google Scholar] [CrossRef]
  17. Nielsen, T.A.S.; Skov-Petersen, H. Bikeability—Urban Structures Supporting Cycling. Effects of Local, Urban and Regional Scale Urban Form Factors on Cycling from Home and Workplace Locations in Denmark. J. Transp. Geogr. 2018, 69, 36–44. [Google Scholar] [CrossRef]
  18. Hu, S.; Chen, M.; Jiang, Y.; Sun, W.; Xiong, C. Examining Factors Associated with Bike-and-Ride (BnR) Activities around Metro Stations in Large-Scale Dockless Bikesharing Systems. J. Transp. Geogr. 2022, 98, 103271. [Google Scholar] [CrossRef]
  19. Wang, H.; De Backer, H.; Lauwers, D.; Chang, S.K.J. A Spatio-Temporal Mapping to Assess Bicycle Collision Risks on High-Risk Areas (Bridges)—A Case Study from Taipei (Taiwan). J. Transp. Geogr. 2019, 75, 94–109. [Google Scholar] [CrossRef]
  20. Mooney, S.J.; Hosford, K.; Howe, B.; Yan, A.; Winters, M.; Bassok, A.; Hirsch, J.A. Freedom from the Station: Spatial Equity in Access to Dockless Bike Share. J. Transp. Geogr. 2019, 74, 91–96. [Google Scholar] [CrossRef]
  21. Aprigliano, V.; Toro, C.; Rojas, G.; Bastías, I.; Cardoso, M.; Santos, T.; Da Silva, M.A.V.; Bustos, E.; De Oliveira, U.R.; Seriani, S. Mapping the Dream: Designing Optimal E-Bike Routes in Valparaíso, Chile, Using a Multicriteria Analysis and an Experimental Study. ISPRS Int. J. Geo-Inf. 2025, 14, 38. [Google Scholar] [CrossRef]
  22. Grabow, M.L.; Bernardinello, M.; Bersch, A.J.; Engelman, C.D.; Martinez-Donate, A.; Patz, J.A.; Peppard, P.E.; Malecki, K.M.C. What Moves Us: Subjective and Objective Predictors of Active Transportation. J. Transp. Health 2019, 15, 100625. [Google Scholar] [CrossRef]
  23. Ito, K.; Biljecki, F. Assessing Bikeability with Street View Imagery and Computer Vision. Transp. Res. Part C Emerg. Technol. 2021, 132, 103371. [Google Scholar] [CrossRef]
  24. Van Lierop, D.; Soemers, J.; Hoeke, L.; Liu, G.; Chen, Z.; Ettema, D.; Kruijf, J. Wayfinding for Cycle Highways: Assessing e-Bike Users’ Experiences with Wayfinding along a Cycle Highway in The Netherlands. J. Transp. Geogr. 2020, 88, 102827. [Google Scholar] [CrossRef]
  25. Plazier, P.A.; Weitkamp, G.; Van Den Berg, A.E. “Cycling Was Never so Easy!” An Analysis of e-Bike Commuters’ Motives, Travel Behaviour and Experiences Using GPS-Tracking and Interviews. J. Transp. Geogr. 2017, 65, 25–34. [Google Scholar] [CrossRef]
  26. Dane, G.; Feng, T.; Luub, F.; Arentze, T. Route Choice Decisions of E-Bike Users: Analysis of GPS Tracking Data in the Netherlands. In Geospatial Technologies for Local and Regional Development; Kyriakidis, P., Hadjimitsis, D., Skarlatos, D., Mansourian, A., Eds.; Lecture Notes in Geoinformation and Cartography; Springer International Publishing: Cham, Switzerland, 2020; pp. 109–124. ISBN 978-3-030-14744-0. [Google Scholar]
  27. Instituto Nacional de Estadísticas Instituto Nacional de Estadísticas|REDATAM Procesamiento y Diseminación. Available online: https://redatam-ine.ine.cl/redbin/RpWebEngine.exe/Portal?BASE=CENSO_2017&lang=esp (accessed on 24 April 2024).
  28. IDE Geoportal de Chile—DEM Alos Palsar Región de Valparaíso 2024. Available online: https://www.geoportal.cl/geoportal/catalog/35435/DEM%20Alos%20Palsar%20Regi%C3%B3n%20de%20Valpara%C3%ADso (accessed on 10 December 2024).
  29. Mertens, L.; Compernolle, S.; Deforche, B.; Mackenbach, J.D.; Lakerveld, J.; Brug, J.; Roda, C.; Feuillet, T.; Oppert, J.-M.; Glonti, K.; et al. Built Environmental Correlates of Cycling for Transport across Europe. Health Place 2017, 44, 35–42. [Google Scholar] [CrossRef]
  30. Auchincloss, A.H.; Michael, Y.L.; Kuder, J.F.; Shi, J.; Khan, S.; Ballester, L.S. Changes in Physical Activity after Building a Greenway in a Disadvantaged Urban Community: A Natural Experiment. Prev. Med. Rep. 2019, 15, 100941. [Google Scholar] [CrossRef]
  31. Troped, P.J.; Cromley, E.K.; Fragala, M.S.; Melly, S.J.; Hasbrouck, H.H.; Gortmaker, S.L.; Brownson, R.C. Development and Reliability and Validity Testing of an Audit Tool for Trail/Path Characteristics: The Path Environment Audit Tool (PEAT). J. Phys. Act. Health 2006, 3, S158–S175. [Google Scholar] [CrossRef]
  32. Clarivate Clarivate—Leading Global Transformative Intelligence. Available online: https://clarivate.com/ (accessed on 10 December 2024).
  33. Web of Science Document Search—Web of Science Core Collection. Available online: https://www.webofscience.com/wos/woscc/basic-search (accessed on 10 December 2024).
  34. Antonakos, C.; Baiers, R.; Dubowitz, T.; Clarke, P.; Colabianchi, N. Associations between Body Mass Index, Physical Activity and the Built Environment in Disadvantaged, Minority Neighborhoods: Predictive Validity of GigaPan® Imagery. J. Transp. Health 2020, 17, 100867. [Google Scholar] [CrossRef] [PubMed]
  35. Desjardins, E.; Higgins, C.D.; Scott, D.M.; Apatu, E.; Páez, A. Using Environmental Audits and Photo-Journeys to Compare Objective Attributes and Bicyclists’ Perceptions of Bicycle Routes. J. Transp. Health 2021, 22, 101092. [Google Scholar] [CrossRef]
  36. Cleland, C.L.; Ferguson, S.; Kee, F.; Kelly, P.; Williams, A.J.; Nightingale, G.; Cope, A.; Foster, C.; Milton, K.; Kelly, M.P.; et al. Adaptation and Testing of a Microscale Audit Tool to Assess Liveability Using Google Street View: MAPS-Liveability. J. Transp. Health 2021, 22, 101226. [Google Scholar] [CrossRef]
  37. Maddock, J.; Ramirez, V.; Heinrich, K.; Zhang, M.; Brunner, I. A Statewide Observational Assessment of the Pedestrian and Bicycling Environment in Hawaii, 2010. Prev. Chronic. Dis. 2011, 9, E14. [Google Scholar] [CrossRef]
  38. Puyol, J.L.M.; Baeza, V.M. Bicycle Sharing System Using an IoT Network. In Proceedings of the 2021 Global Congress on Electrical Engineering (GC-ElecEng), Valencia, Spain, 10–12 December 2021; IEEE: Valencia, Spain, 2021; pp. 131–135. [Google Scholar]
  39. Instituto Nacional de Estadísticas Resultados Dashboard. Available online: https://censo2024.ine.gob.cl/resultados-dashboard/ (accessed on 12 September 2025).
  40. SECTRA Encuestas de Movilidad. Available online: https://www.sectra.gob.cl/encuestas_movilidad/encuestas_movilidad.htm (accessed on 21 November 2024).
  41. UNESCO World Heritage Centre Lista del Patrimonio Mundial. Available online: https://whc.unesco.org/es/list/ (accessed on 15 April 2024).
  42. CONASET Comisión Nacional de Seguridad de Tránsito—Descarga de Capas. Available online: https://mapas-conaset.opendata.arcgis.com/ (accessed on 6 October 2025).
  43. Pais, F.; Monteiro, J.; Sousa, N.; Coutinho-Rodrigues, J.; Natividade-Jesus, E. A Multicriteria Methodology for Maintenance Planning of Cycling Infrastructure. Proc. Inst. Civ. Eng.-Eng. Sustain. 2022, 175, 248–264. [Google Scholar] [CrossRef]
  44. Dourthé, A.; Salamanca, J. Guía Para Realizar Una Auditoría de Seguridad Vial; Comisión Nacional de Seguridad de Tránsito: Santiago, Chile, 2003. [Google Scholar]
  45. Chondrogianni, D.; Stephanedes, Y.J.; Fatourou, P. Assessing Cycling Accessibility in Urban Areas through the Implementation of a New Cycling Scheme. Sustainability 2023, 15, 14472. [Google Scholar] [CrossRef]
  46. Hsu, T.P.; Lin, Y.T. A Model for Planning a Bicycle Network with Multi-Criteria Suitability Evaluation Using GIS. WIR Trans. Ecol. Environ. 2011, 148, 243–252. [Google Scholar]
  47. Zagorskas, J.; Turskis, Z. Setting Priority List for Construction Works of Bicycle Path Segments Based on Eckenrode Rating and Aras-F Decision Support Method Integrated in Gis. Transport 2020, 35, 179–192. [Google Scholar] [CrossRef]
  48. Clifton, K.J.; Livi Smith, A.D.; Rodriguez, D. The Development and Testing of an Audit for the Pedestrian Environment. Landsc. Urban Plan. 2007, 80, 95–110. [Google Scholar] [CrossRef]
  49. Saplıoğlu, M.; Aydın, M.M. Choosing Safe and Suitable Bicycle Routes to Integrate Cycling and Public Transport Systems. J. Transp. Health 2018, 10, 236–252. [Google Scholar] [CrossRef]
  50. Crotte, A.; Arvizu, C. Manual de Calles—Diseño Vial Para Ciudades Mexicanas; Secretaría de Desarrollo Agrario, Territorial y Urbano: México, 2019; p. 347. [Google Scholar]
  51. Van Der Spek, S.C.; Scheltema, N. The Importance of Bicycle Parking Management. Res. Transp. Bus. Manag. 2015, 15, 39–49. [Google Scholar] [CrossRef]
  52. Salazar, A.; Rodríguez, R.; Osuna, J.; Huete, N.; Andrade, S. Manual Para Evaluar Calles Seguras Para Ciclistas 2022. Available online: https://mapasin.org/wp-content/uploads/2022/08/Manual-CSC.pdf (accessed on 26 June 2024).
  53. Ryu, S.; Chen, A.; Su, J.; Choi, K. A Multi-Class, Multi-Criteria Bicycle Traffic Assignment Model. Int. J. Sustain. Transp. 2021, 15, 524–540. [Google Scholar] [CrossRef]
  54. Zuo, T.; Wei, H. Bikeway Prioritization to Increase Bicycle Network Connectivity and Bicycle-Transit Connection: A Multi-Criteria Decision Analysis Approach. Transp. Res. Part A Policy Pract. 2019, 129, 52–71. [Google Scholar] [CrossRef]
  55. Hrncir, J.; Zilecky, P.; Song, Q.; Jakob, M. Practical Multicriteria Urban Bicycle Routing. IEEE Trans. Intell. Transport. Syst. 2017, 18, 493–504. [Google Scholar] [CrossRef]
  56. Hara, K.; Azenkot, S.; Campbell, M.; Bennett, C.L.; Le, V.; Pannella, S.; Moore, R.; Minckler, K.; Ng, R.H.; Froehlich, J.E. Improving Public Transit Accessibility for Blind Riders by Crowdsourcing Bus Stop Landmark Locations with Google Street View: An Extended Analysis. ACM Trans. Access. Comput. 2015, 6, 1–23. [Google Scholar] [CrossRef]
  57. Milakis, D.; Athanasopoulos, K.; Vafeiadis, E.; Vasileiadis, K.; Vlastos, T. Planning of the Athens Metropolitan Cycle Network Using Participative Multicriteria Gis Analysis. Procedia-Soc. Behav. Sci. 2012, 48, 816–826. [Google Scholar] [CrossRef]
  58. Historic England Prepare a Street Audit|Historic England. Available online: https://historicengland.org.uk/advice/caring-for-heritage/streets-for-all/what-you-can-do/street-clutter-audit/ (accessed on 12 August 2024).
  59. Dirección General de Tránsito. Plan Tipo de Movilidad Segura y Sostenible En La Empresa; Ministerio del Interior, Gobierno de España: Madrid, España, 2022; p. 72.
  60. Ministerio de Obras Públicas Manual de Carreteras. Available online: https://mc.mop.gob.cl/ (accessed on 12 September 2025).
  61. OpenAI; Hurst, A.; Lerer, A.; Goucher, A.P.; Perelman, A.; Ramesh, A.; Clark, A.; Ostrow, A.; Welihinda, A.; Hayes, A.; et al. GPT-4o System Card 2024. arXiv 2024, arXiv:2410.21276. [Google Scholar]
  62. Besta, M.; Blach, N.; Kubicek, A.; Gerstenberger, R.; Podstawski, M.; Gianinazzi, L.; Gajda, J.; Lehmann, T.; Niewiadomski, H.; Nyczyk, P.; et al. Graph of Thoughts: Solving Elaborate Problems with Large Language Models. Proc. AAAI Conf. Artif. Intell. 2024, 38, 17682–17690. [Google Scholar] [CrossRef]
  63. Cerny, J.; Daggers, T. Integration of Bicycle Transport in Public Transport, a Study in the Frame-Work of the 2MOVE2 CIVITAS Plus II. 2016. Available online: https://civitas.eu/sites/default/files/bikes_on_board_2move2_di7.02.03.pdf (accessed on 16 August 2024).
  64. Klos, L.; Fiedler, J.; Nigg, C.; Niessner, C.; Wäsche, H.; Woll, A. Walking and Non-Motorized Vehicle Use in Adolescents: The Role of Neighborhood Environment Perceptions across Urbanization Levels. Ger. J. Exerc. Sport Res. 2024, 54, 145–155. [Google Scholar] [CrossRef]
Figure 2. Methodology stages. Source: Elaborated by authors.
Systems 13 00894 g002
Figure 3. Routes and points designated for carrying out the human and AI street audit. Source: Elaborated by authors.
Systems 13 00894 g003
Figure 4. AI System for Auditing Bicycle Routes. Source: Elaborated by authors.
Systems 13 00894 g004
Figure 5. Results of the descriptions evaluated at each measurement point, for western (A) and eastern (B) orientation points in the human street audit. Source: Elaborated by authors.
Systems 13 00894 g005
Figure 6. Results of the evaluations at each measurement point for the western (A) and eastern (B) routes in the AI street audit. Source: Elaborated by authors.
Systems 13 00894 g006
Figure 7. Histogram comparing the score distributions from the human and AI street audits. The subfigures show the score distribution for: (A) the human audit on the Western routes; (B) the AI audit on the Western routes; (C) the human audit on the Eastern routes; and (D) the AI audit on the Eastern routes. Source: Elaborated by Authors.
Systems 13 00894 g007
Table 2. Information used to complement the selection of routes on which the street audit was carried out. Source: Elaborated by authors.
NameSlope per
Section (%)
Total Distance from Metro StationTotal Distance from the Initial Elevation of the HillTotal Number of Accidents by Area of Influence of the RouteTotal
Intersections
Downhill
Almirante Montt16.431105.71871.88317
Carampangue11.221258.99586.46914
Cumming15.122165.09893.741226
Tomás Ramos10.361447.931166.4709
Uphill
Almirante Montt16.471552.71780.71624
Carampangue12.521302.68586.46118
Cumming15.721725.2953.19725
Tomás Ramos12.291536.811166.42011
Table 3. Descriptive measures by criterion for each route in an easterly direction in the human street audit. Source: Elaborated by authors.
Eastern RouteCriteriaMeanStdMin25%50%75%Max
Almirante MonttStreet Infrastructure2.942.5300.622.754.57.75
Street coexistence4.122.7602.88469
Habitability5.893.3413.588.59
CarampangueStreet Infrastructure3.362.6800.753.624.837
Street coexistence3.972.4202.883.55.128.5
Habitability4.892.4714569
CummingStreet Infrastructure64.4302.286.839.6212
Street coexistence6.753.3824.56.75912
Habitability8.51.8967.58.59.7512
Tomás RamosStreet Infrastructure3.072.5200.25456
Street coexistence4.283.700.754711
Habitability6.42.5815.626.58.59.5
Table 4. Descriptive measures by criterion for each route in a westerly direction. Source: Elaborated by authors.
Western RouteCriteriaMeanStdMin25%50%75%Max
Almirante MonttStreet Infrastructure3.781.8802.54.1256
Street coexistence2.752.400.752.557
Habitability3.832.5102.53.55.257.25
CarampangueStreet Infrastructure3.432.7600.753.754.837.5
Street coexistence3.472.3802457
Habitability4.671.64244.567
CummingStreet Infrastructure6.462.8406.1277.7510.25
Street coexistence6.223.5513.886.258.2512
Habitability8.41.8866.628.75911
Tomás RamosStreet Infrastructure3.22.6200.254.556
Street coexistence3.293.0100.753.35.259
Habitability5.22.35145.569
Table 5. Results of the human street audit by orientation. Source: Elaborated by authors.
RouteEastern Route ScoreWestern Route Score
Tomas Ramos17.2316.74
Carampangue16.3816.58
Almirante Montt16.1612.73
Cumming12.9111.72
Table 6. Descriptive measures by criterion for each route in an easterly direction in the artificial intelligence street audit. Source: Elaborated by authors.
Eastern RouteCriteriaMeanStdMin25%50%75%Max
Almirante MonttStreet Infrastructure3.552.801.536.297
Street coexistence1.813.10001.759
Habitability2.553.340014.389
CarampangueStreet Infrastructure42.56024.255.258
Street coexistence1.972.480012.757
Habitability3.153.9001.756.59
CummingStreet Infrastructure3.772.7201.753.255.888
Street coexistence2.192.69000.54.56.5
Habitability3.353.540124.7510
Tomás RamosStreet Infrastructure3.783.1801.7135.8810
Street coexistence2.533.30013.3810
Habitability2.53.89000.52.7511
Table 7. Descriptive measures by criterion for each route in a westerly direction in the artificial intelligence street audit. Source: Elaborated by authors.
Western RouteCriteriaMeanStdMin25%50%75%Max
Almirante MonttStreet Infrastructure4.52.7902.624.2569
Street coexistence2.723.620013.3810
Habitability1.552.5000.51.888
CarampangueStreet Infrastructure4.13.0902.623.55.759
Street coexistence2.313.2600139
Habitability2.53.42000.754.258.5
CummingStreet Infrastructure5.424.9401.084.58.6213.5
Street coexistence3.253.95001.55.8810
Habitability4.624.5900.546.5614
Tomás RamosStreet Infrastructure2.351.9600.52.253.755.5
Street coexistence2.062.590014.387
Habitability1.62.640002.127.5
Table 8. Results of the artificial intelligence street audit by orientation. Source: Elaborated by authors.
RouteEastern Route ScoreWestern Route Score
Cumming9.459.25
Almirante Montt9.28.93
Carampangue8.989.8
Tomas Ramos8.98.7
Table 9. Differences in the average scores (east–west) obtained in both street audit methods. Source: Elaborated by Authors.
RouteDifference (%)
Tomas Ramos47.5
Carampangue43.3
Almirante Montt33.3
Cumming23.0
Disclaimer/Publisher’s Note: The statements, opinions and data contained in all publications are solely those of the individual author(s) and contributor(s) and not of MDPI and/or the editor(s). MDPI and/or the editor(s) disclaim responsibility for any injury to people or property resulting from any ideas, methods, instructions or products referred to in the content.