Article

Digital Transformation Through Virtual Value Chains: An Exploratory Study of Grocery MSEs in Mexico

by
Eva Selene Hernández-Gress
*,
Alfredo Israle Ramírez Mejía
,
José Emmanuel Gómez-Rocha
and
Simge Deniz
Tecnologico de Monterrey, Engineering and Sciences School, Pachuca 42080, Hidalgo, Mexico
*
Author to whom correspondence should be addressed.
Systems 2025, 13(10), 849; https://doi.org/10.3390/systems13100849
Submission received: 1 August 2025 / Revised: 23 September 2025 / Accepted: 25 September 2025 / Published: 27 September 2025
(This article belongs to the Special Issue Systems Methodology in Sustainable Supply Chain Resilience)

Abstract

This study explores the readiness of Micro and Small Enterprises (MSEs) in Mexico, specifically grocery stores, to implement the Virtual Value Chain (VVC) through Information and Communication Technologies for Development (ICT4D). A mixed-methods approach was used, combining diagnostic tools, structured surveys, and interviews. Quantitative data were analyzed using descriptive statistics, correlation analysis, and machine learning to identify digital adoption patterns. The results indicate that limited technology adoption remains the main obstacle to VVC integration. Significant associations were found between digital engagement and the age and educational level of store managers. Key digital gaps persist in inventory control, supplier coordination, and demand forecasting. Although machine learning models did not significantly outperform baseline predictions on willingness to adopt technology, the findings emphasize the potential of targeted training and accessible mobile solutions. The study proposes a new diagnostic and predictive framework to assess VVC readiness in low-resource contexts. It shows that ICT, when strategically aligned with business operations and paired with adequate training, can enhance sustainability and livelihoods. Although the study is limited to one geographic area and one business sector, it offers a foundation for scaling similar initiatives. The findings support context-sensitive strategies and capacity-building efforts tailored to the realities of MSEs in emerging economies.

1. Introduction

Micro and Small Enterprises (MSEs), especially family-owned ones, rely heavily on the entrepreneurial and managerial skills of their owners [1]. In Mexico, enterprises are classified by employee count and annual sales: micro-enterprises have 1–10 employees, while small enterprises have 11–30 in commerce or services and 11–50 in manufacturing, with annual sales limits of 4 million MXN for micro-enterprises and 4–100 million MXN for small enterprises [2]. MSEs face challenges such as limited education, access to technology, capital, and expertise, often needing external support [1,3,4]. Given their prevalence, the study of MSEs is crucial to understanding economic development in emerging economies.
Approximately 90% of companies in Latin America are classified as micro firms, mainly in the wholesale and retail sectors [5]. In 2020, Mexico had around 4.7 million micro businesses. These firms contribute significantly to employment in commerce and services, while large companies dominate manufacturing. However, despite their quantitative importance, research on MSEs, particularly in commerce, remains limited, restricting our understanding of their strategies compared to larger firms.
Following COVID-19, over 50% of Mexican SMEs still relied on traditional sales methods or short-term online strategies. For non-online SMEs, 35% emphasized digital communication (social networks, search engines, ads), and 16% aimed to digitize customer services [6]. Also, more than 60% of businesses in Mexico close within their first three years, largely due to cash flow difficulties, according to the National Institute of Statistics and Geography (INEGI). This evidence highlights persistent barriers to digital adoption, which have become a critical factor in resilience and competitiveness in the post-pandemic context [7].
Despite the growing body of research on Information and Communication Technologies (ICTs) and their role in development, few studies explore how MSEs adopt and benefit from ICTs in their value chains. Existing ICT4D literature often focuses on larger firms, overlooking MSEs, which face unique constraints in technology adoption. Moreover, the Virtual Value Chain (VVC) remains underexplored in MSE contexts, particularly in Latin America. This represents a clear research gap.
This study addresses the gap by asking: How does the adoption of the Virtual Value Chain (VVC) influence the operational practices and digital development of Micro and Small Enterprises (MSEs) in Mexico? By focusing on underrepresented grocery microenterprises, we contribute to ongoing ICT4D debates on digital inclusion, technological capability building, and grassroots innovation.
This research develops and applies a methodology to diagnose the level of VVC integration in MSEs. The methodology assesses essential factors to support these businesses in improving operations and ensuring survival through digital development, focusing on grocery stores in Pachuca, Hidalgo. Although the VVC concept is beneficial for enhancing SME operations, it is underexplored in MSE contexts.
It is important to note that this study is limited in scope to grocery SMEs in Mexico. These businesses primarily operate within downstream segments of the supply chain. The analysis does not extend to the entire value chain, which remains beyond the focus of this research.
This paper offers three main contributions to the ITD literature:
  • To the best of the author’s knowledge, this is the first known empirical study on VVC adoption among MSEs.
  • It introduces an original instrument for assessing VVC stages in low-tech businesses.
  • It presents quantitative findings based on field data, analyzed through statistical and machine learning methods.
Finally, the paper is organized as follows: Section 2 presents the literature review, which covers the theoretical framework, including ICT for Development (ICT4D) and the Virtual Value Chain, as well as an overview of MSEs worldwide, their challenges, opportunities, and models. It also includes research on MSEs in Mexico and concludes with field studies on Virtual Value Chains (VVC). Section 3 outlines the methodology, explaining the context, instrument design, data collection, and analysis. Section 4 presents the results and discussion, and Section 5 provides the conclusions.

2. Literature Review

In recent decades, research in Information and Communication Technologies for Development (ICT4D) has explored how digital technologies can foster economic growth, enhance social inclusion, and support human development in low-resource settings. ICT has enabled small and medium enterprises (SMEs) to become more integrated and operate more efficiently; however, developing economies rarely have access to these resources [8,9,10].
According to Heeks [11], the developmental impact of ICT depends not only on access and infrastructure, but also on the relevance of these technologies to local needs and the capacity of organizations to absorb and integrate them. It also depends on social responsibility rather than the type of technology used. This perspective is particularly important in the context of Micro and Small Enterprises (MSEs), which often operate under significant constraints in capital, knowledge, and digital skills.
ICT4D studies show that technology only makes a real difference when it matches local needs and operates within existing social and institutional structures [12,13]. While early ICT4D literature focused on large-scale infrastructure and e-government programs, more recent studies have shifted attention to bottom-up, grassroots innovation, especially among small firms and informal actors [14,15]. However, little research has addressed issues related to small enterprises adopting ICT [16]. In these contexts, digital technologies can enable new forms of value creation, participation, and resilience.
In the context of ICT4D, the VVC model offers a promising framework for examining how MSEs in emerging economies can leverage ICTs to expand market access, optimize operations, and strengthen customer relationships. The VVC, developed by Weiber and Kollmann [17], provides a conceptual lens to understand how digital information can be used not just to support traditional value chains, but also to transform and virtualize business processes. Unlike the physical value chain, the VVC captures the generation, processing, and distribution of digital content as a source of economic value. This includes activities such as data collection, online interaction with customers and suppliers, and digital service delivery. However, as noted by Thapa and Sæbø [18], empirical studies of ICT use in underprivileged communities and among disadvantaged stakeholder groups remain scarce.
This study positions itself at the intersection of ICT4D theory and VVC research, aiming to investigate whether and how MSEs in Mexico, particularly grocery stores, are adopting elements of the VVC in their daily operations. In doing so, it contributes to ongoing scholarly debates on the developmental role of ICTs and addresses a critical empirical gap in the literature.
As this study focuses on exploring the potential of MSEs in Mexico, the literature review is divided into three sections: (1) MSEs worldwide, (2) MSEs in Mexico, and (3) studies on the Virtual Value Chain. It is important to note that the academic literature specifically addressing MSEs is limited. Therefore, selected studies on SMEs are included when relevant, ensuring that their inclusion does not compromise the generalizability or relevance of this research.

2.1. MSEs Worldwide

MSEs face challenges in adopting technologies. Bag and Pretorius [19] identified technology as a critical barrier, while Culot [20] emphasized data management and production technologies. In Ethiopia, Abagissa [21] highlighted the need for education, credit, and incentives. Funding constraints impact small service businesses [22]. Digitalization holds transformative potential for regional development [23], and technologies like big data, IoT, blockchain, and AI can enable supply chain digitalization in India [24].
In Latin America, Velázquez-Martínez and Tayaksi [8] linked supply chain management to MSE productivity. Chatterjee [25] suggested blockchain and AI for post-COVID-19 performance in India, and Trinugroho [26] found that digital adoption improved business in Indonesia. Mikhaylova et al. [27] examined digital strategies and Fintech, García-Salirrosas [28] presented the PERVAINCONSA Scale for online retail metrics in developing countries, and Garay-Rondero [29] proposed a digital supply chain model for mass customization.
The growing attention to the digital transformation of small businesses in emerging economies aligns with current ICT4D discussions, particularly regarding how technological capabilities contribute to inclusive economic growth [11,12]. A key question in this debate is whether ICTs directly drive development or whether they serve as enablers for operational improvements that create competitive advantages, such as through the implementation of VVC [11]. If ICTs are considered development drivers in themselves, then disparities in access often reflect structural inequalities based on location, age, gender, and other socio-economic factors. Nevertheless, most of these studies focus on SMEs or larger firms, leaving a significant gap in our understanding of how microenterprises engage with and benefit from ICT-based value creation.

2.2. MSEs in Mexico

In Mexico, most research on Small and Medium Enterprises (SMEs) has focused on identifying challenges and success factors, while studies specifically addressing Micro and Small Enterprises (MSEs) remain scarce and lack formal models. Tanoira and Valencia [30] emphasize the importance of knowledge transfer in Yucatan’s support programs, noting finance and sales as key weaknesses [31]. Aguilar [31] also cites customer acquisition, staffing, and financial constraints as major issues. Hernández-Gracia and Duana-Avila [32] call for stronger entrepreneurial orientation and financing access. Success factors include economic knowledge and dynamism [33,34].
Digitalization strategies have been documented mainly for medium-sized enterprises, while MSEs remain underrepresented in both academic studies and national innovation policies. Mexican MSEs face ongoing challenges in innovation, operations, management, marketing, and technology, with no comprehensive studies on their supply chain or technological needs.

2.3. Virtual Value Chain

Technology-based companies are well-positioned for growth in competitive markets. Autio [35] suggests that small tech firms that leverage technology can be seen as smaller versions of large companies. The Virtual Value Chain (VVC), introduced by Weiber and Kollmann [17], allows companies to enhance their traditional market presence through effective digital activities. The VVC involves similar activities to the traditional value chain but uses digital information to unlock new market opportunities [17], as can be observed in Figure 1. Global market access enables small companies to compete with large firms by sharing information across suppliers, distributors, manufacturers, and retailers [36,37]. The Internet supports this information exchange, bolstering B2B and B2C relationships [38].
The Virtual Value Chain (VVC) offers advantages such as increased efficiency, ease in offering products and services, and better insights into customer needs [36,37]. It also helps businesses predict trends [37]. However, challenges include the need for creativity, flexible payment options, customer integration, and internet access [38]. Other issues involve knowledge management [39], security and privacy concerns, cultural factors, and complex software applications. Various case studies on VVC, as shown in Table 1, examine methodologies across micro, small, and medium enterprises.
Table 1 shows that the studies primarily focus on SMEs, with sample sizes ranging from 1 to 429 companies. Some studies aim to understand the client’s perspective, while others explore factors influencing the Virtual Value Chain (VVC). Berrone [54] focuses on MSEs, examining whether human capital, innovation, and the use of own capital affect company performance. However, this study does not specifically address these factors in the context of the VVC.

2.4. Research Gaps and Objectives

All previous studies have focused on the Virtual Value Chain (VVC) in SMEs, with limited attention to MSEs or Mexico’s retail sector. García-Salirrosas [28] included Mexico in their research alongside Peru and Colombia, concentrating on online clothing stores. Gupta and Ramachandran [55] studied retailers in emerging economies, suggesting that differences between traditional and tech-focused retailers require further investigation. Others, such as Hwang and Kim [56] and Roth and Rosenzweig [57], highlighted a gap in quantitative and empirical studies on the topic. Moreover, Sharma and Dutta [58] found that the COVID-19 pandemic shifted retail strategies toward omnichannel models, requiring technological convergence, customer focus, and internal reorganization. Compared to previous studies, this study investigates the digital transformation and processes within the VVC, particularly for MSEs in the retail sector.
Although digitalization has been highlighted as a key element of the ITC4D [11], most frameworks focus on national or large-firm adoption, not the micro-level experiences of small grocery businesses. The studies that examined grocery retailing within the Virtual Value Chain (VVC) framework are scarce. This is particularly relevant given that digital transformation has been shown to positively influence business models [59], and digitalization further enhances that flexibility, enabling the company to better adapt to a changing or uncertain environment [60]. Weyer [61] observed that, due to the broad spectrum of available technological innovations and the limited resources characteristic of small businesses, it remains unclear which technologies should be prioritized or at which stages of the VVC they should be implemented. Similarly, Bierganz [62], in his doctoral dissertation, analyzed the challenges associated with leveraging the VVC in the UK grocery retail sector.
These gaps underscore the need to better understand how ICTs can promote development at the microenterprise level. This research aims to diagnose MSEs, with a particular focus on grocery stores in Mexico, to assess whether they are currently integrating technology into their business operations and whether they possess the necessary resources to implement the VVC. Our review of the existing literature revealed a lack of studies addressing the application of the VVC in the context of MSEs in Mexico, with emphasis on the retail grocery sector. As our main contribution, we have developed diagnostic tools and a survey instrument specifically designed to fill this gap. These tools not only support the evaluation of technological adoption among Mexican MSEs but are also adaptable for use in similar MSE contexts internationally.
Based on the identified research gaps, the objectives of this study are captured in the following research questions:
  • RQ1: Do grocery stores in Mexico possess sufficient technological advancements to implement VVC with their suppliers and customers?
  • RQ2: Is the ability to generate VVC positively correlated with the cultural and behavioral issues of grocery store managers in Mexico?
  • RQ3: Given specific characteristics of grocery store managers, can we predict their willingness to adopt technological changes?

3. Methodology

The scope of this research is restricted to grocery MSEs in Pachuca, Hidalgo, Mexico. These enterprises represent downstream actors in the supply chain, and the study does not attempt to cover the entire value chain.
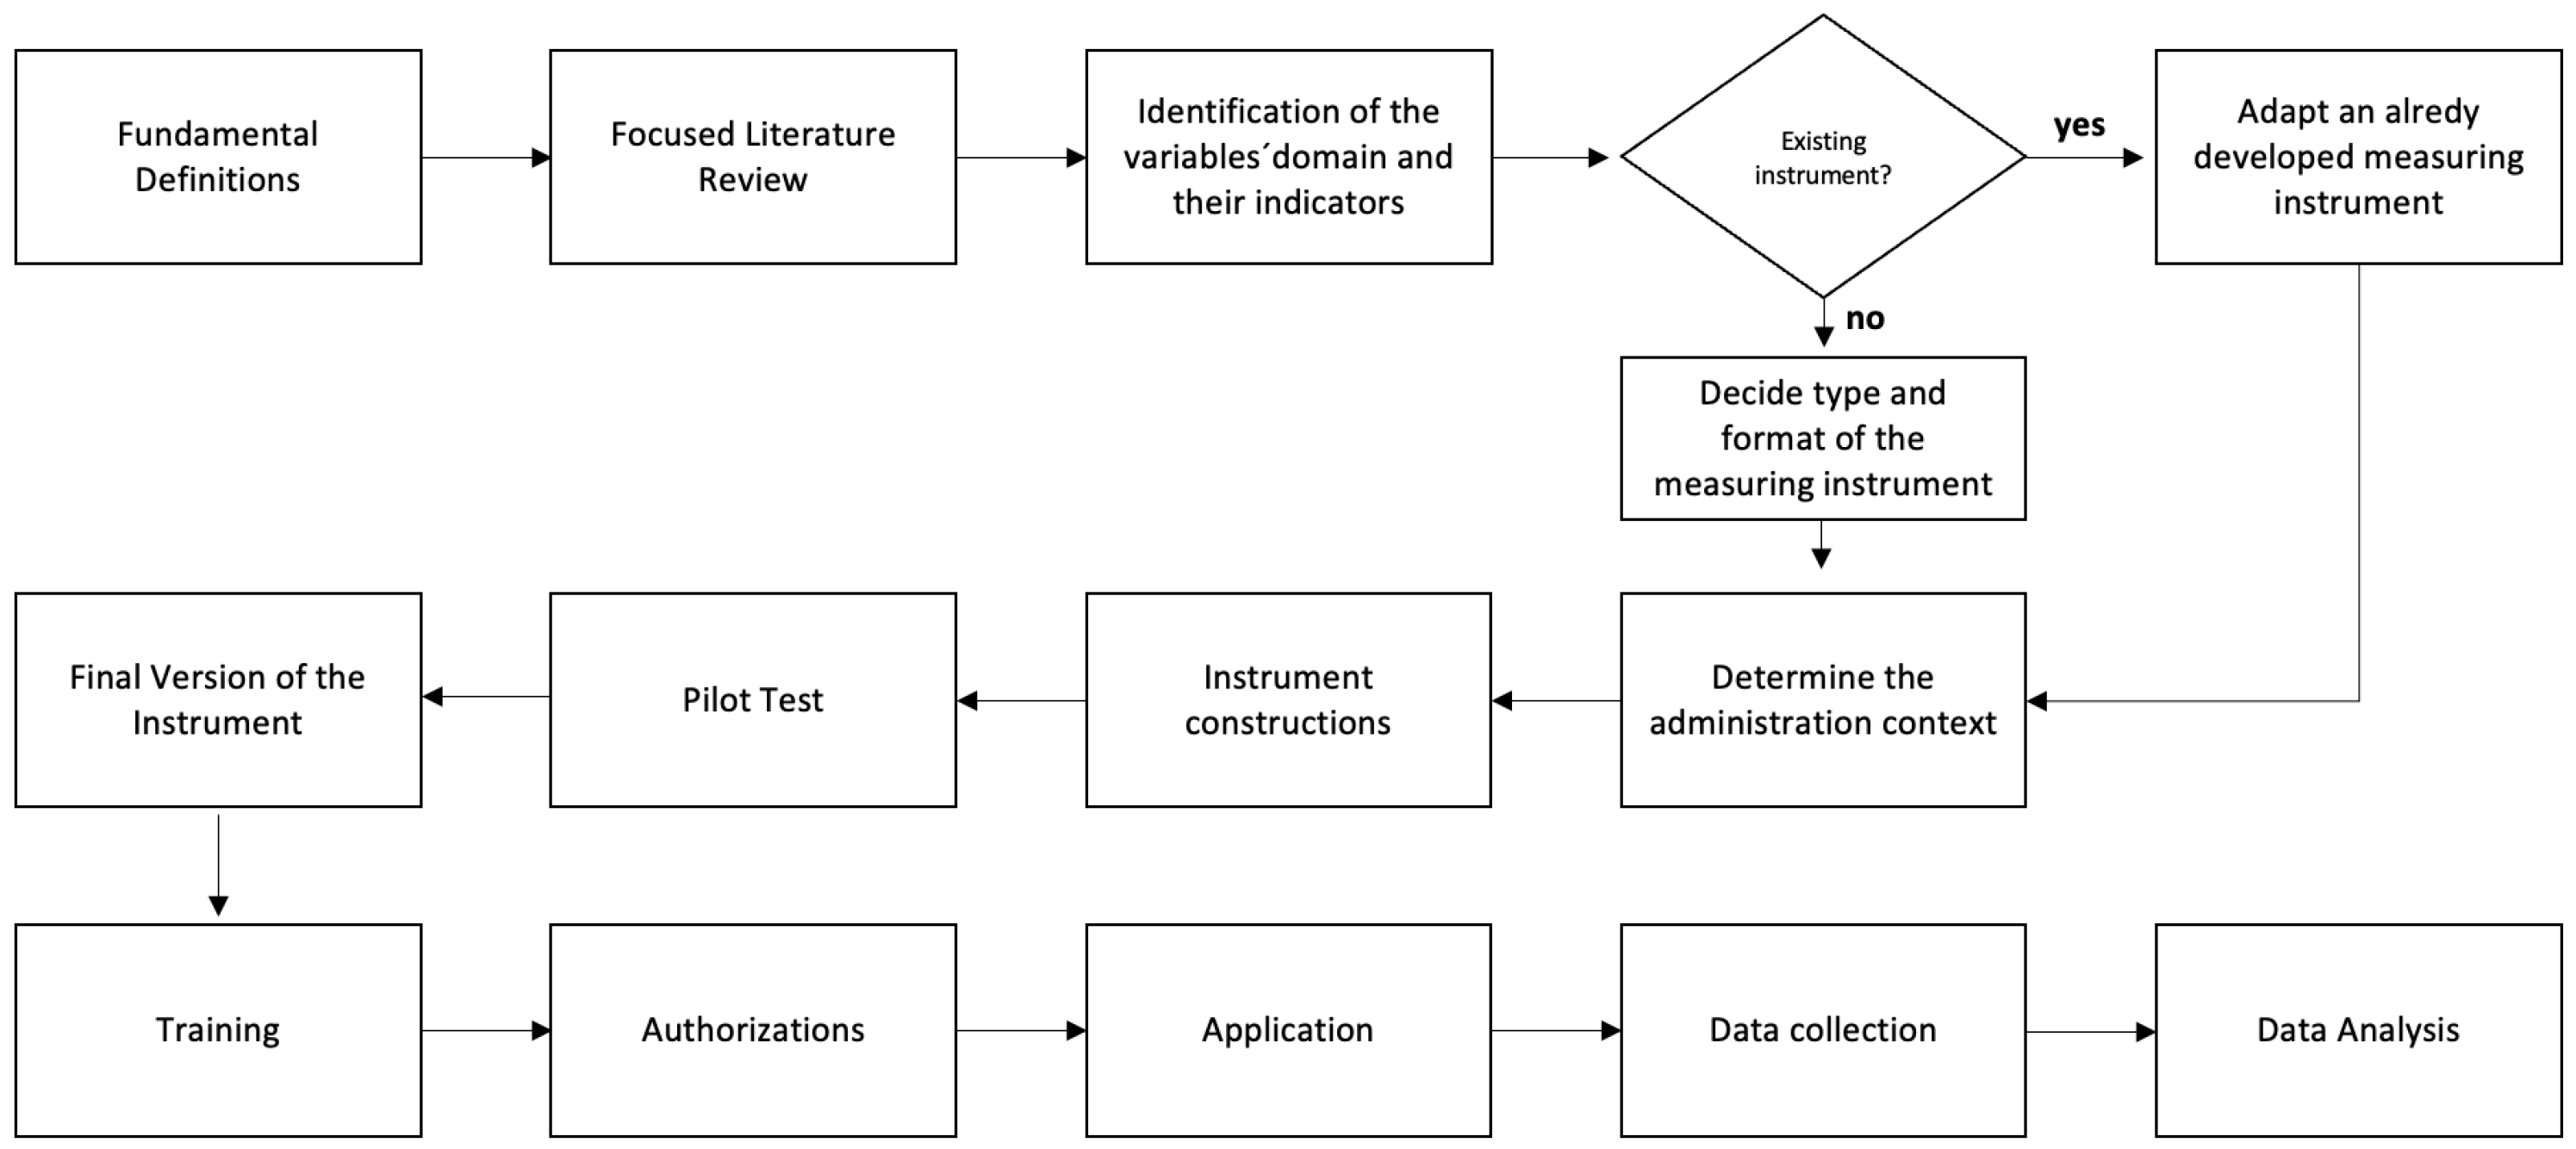
In this study, the methodology developed by Sampieri [63] was adapted to answer the research objectives, as detailed in Figure 2. Summarizing the methodology, from the fundamental redefinitions of the final version, it begins with (1) designing the instrument, followed by (2) data collection, and concludes with (3) data analysis and machine learning predictions. Detailed measurements, estimation methods, and results are provided in the subsequent subsections.

3.1. Design of the Instrument

This design was carried out in two phases. The first phase involved a qualitative analysis, where the study context was reviewed, and 10 MSEs in the retail sector were interviewed to understand their needs. The second phase consisted of a literature review to identify the areas to be included in the survey.

3.1.1. Context of the Study

Pachuca de Soto, the capital of Hidalgo, Mexico, covers 20,813 km2 in the center-east of the country. In 2022, Hidalgo’s economically active population was 1.46 million, with retail trade accounting for 45.6% of economic units, 71.8% of which are in informal employment. According to INEGI [64], there are 14,753 grocery stores in Hidalgo, with 1842 in Pachuca, highlighting their economic significance.
Before the research, 10 businesses were visited for interviews and process observations. Most were newly opened and financially unstable, facing challenges like low shelf fill levels and disorganization. To remain competitive, they sourced products from wholesalers or directly from large companies. Shelf organization was based on expiry dates but adjusted for supplier requests. While some stores used computer systems and barcode readers, inventory tracking was often inaccurate. The customer base primarily consisted of local residents, emphasizing the role of personal relationships in sales and payment methods.
Additionally, inconsistent order quantities made it difficult to predict supplier orders. Most orders were placed in-store or via phone and WhatsApp, with store owners or 1–2 employees managing all operations. Due to a lack of financial support, they aimed to minimize costs, sometimes renting taxis and vehicles to avoid stockouts. Suppliers often faced difficulties finding parking for their vehicles. Figure 3 illustrates the supply chain, while Table 2 summarizes grocery store operations.

3.1.2. Measuring Instrument

To design the survey, a literature review was conducted, particularly focusing on VVC, identifying common areas across various studies. The survey was designed to evaluate eight areas; the questions are presented in Appendix A:
Profile: According to Piscitello and Sgobbi [42] and Gurdur [65], key variables include name, number of employees, working hours, and turnover.
Managerial characteristics: Gurdur [65], Peutz and Post [66], and Bierganz [62] identified name, gender, age, education level, and adaptability to change as important variables.
Personal management: Hongmei and Jincheng [40] and Zumstein et al. [49] highlighted teamwork, adaptability to change, learning, and organizational culture as relevant factors.
Company infrastructure: Merchán [67] emphasized the importance of shelf space, inventory, and transportation (e.g., van, car, motorcycle, bicycle) for SMEs.
Procurement: Gurdur [65], Zumstein et al. [49], and Hongmei and Jincheng [40] stressed the importance of information on top-selling products, inventory, daily sales, demand planning, and access to supplier data.
Technology: Corso et al. [39], Piscitello and Sgobbi [42], Elkhouly et al. [68], and Naimi-Sadigh et al. [69] identified key indicators such as internet access, Wi-Fi, sales and inventory systems, and devices like computers and mobile phones [12].
E-commerce: Zumstein et al. [49], Gyenge [45], Elkhouly et al. [68], and Bierganz [62] emphasized the significance of e-payment methods, websites, social media platforms, telephone sales, and digital marketplaces.
Challenges to introduce technology: Winkler [70], Peutz and Post [66], and Wasan et al. [71] identified challenges in technology adoption, including external support, government assistance, training, and issues related to payments and taxes. Additionally, Heeks [11] emphasized that ICT4D outcomes are influenced by contextual factors such as location, age, gender, and education level.
A self-administered questionnaire was chosen, and a pilot test was conducted with 30 randomly selected grocery stores. The survey achieved a Cronbach’s alpha value of 0.8638, validating its reliability. The final version of the instrument is available in a repository [72] under surveyfinalingles.docx.

3.1.3. Sample Size

To ensure a representative sample, the formula described by Devore [73] was used. Inclusion criteria required grocery stores to be located in Pachuca, with respondents being company owners and of legal age. The formula is presented in Equation (1).
n = z 2 N σ 2 ( N 1 ) e 2 + z 2 σ 2
The sample size n was determined using the formula described by Devore [73], where N is the population size (1842 grocery stores in Pachuca, according to INEGI [64], σ is the standard deviation (typically assumed as 0.5 if unknown), z is the confidence level (1.96 for 95% confidence), and e is the acceptable error limit (5% for this study). Using (1), a sample size of 233 enterprises was obtained.
The sampling procedure was conducted with the support of undergraduate students, each of whom was assigned to distribute approximately 5 surveys. Students were instructed to approach grocery microenterprises located near their place of residence and to select stores in a non-systematic manner, avoiding repeated chains or pre-selected businesses. This procedure introduced a convenience component but also incorporated a random-like element at the local level, since students did not target specific stores a priori. In total, 233 surveys were distributed, of which 187 valid responses were obtained, corresponding to a non-response rate of approximately 19.7%

3.2. Data Analysis

Data analysis will be conducted in four steps: (1) data visualization using bar and pie charts, (2) descriptive statistics for proportion inferences, (3) inferential statistics with confidence intervals to estimate population fluctuations, and (4) relationship analysis between variables using Pearson correlation, chi-square test of independence, and ANOVA.

3.2.1. Data Visualization

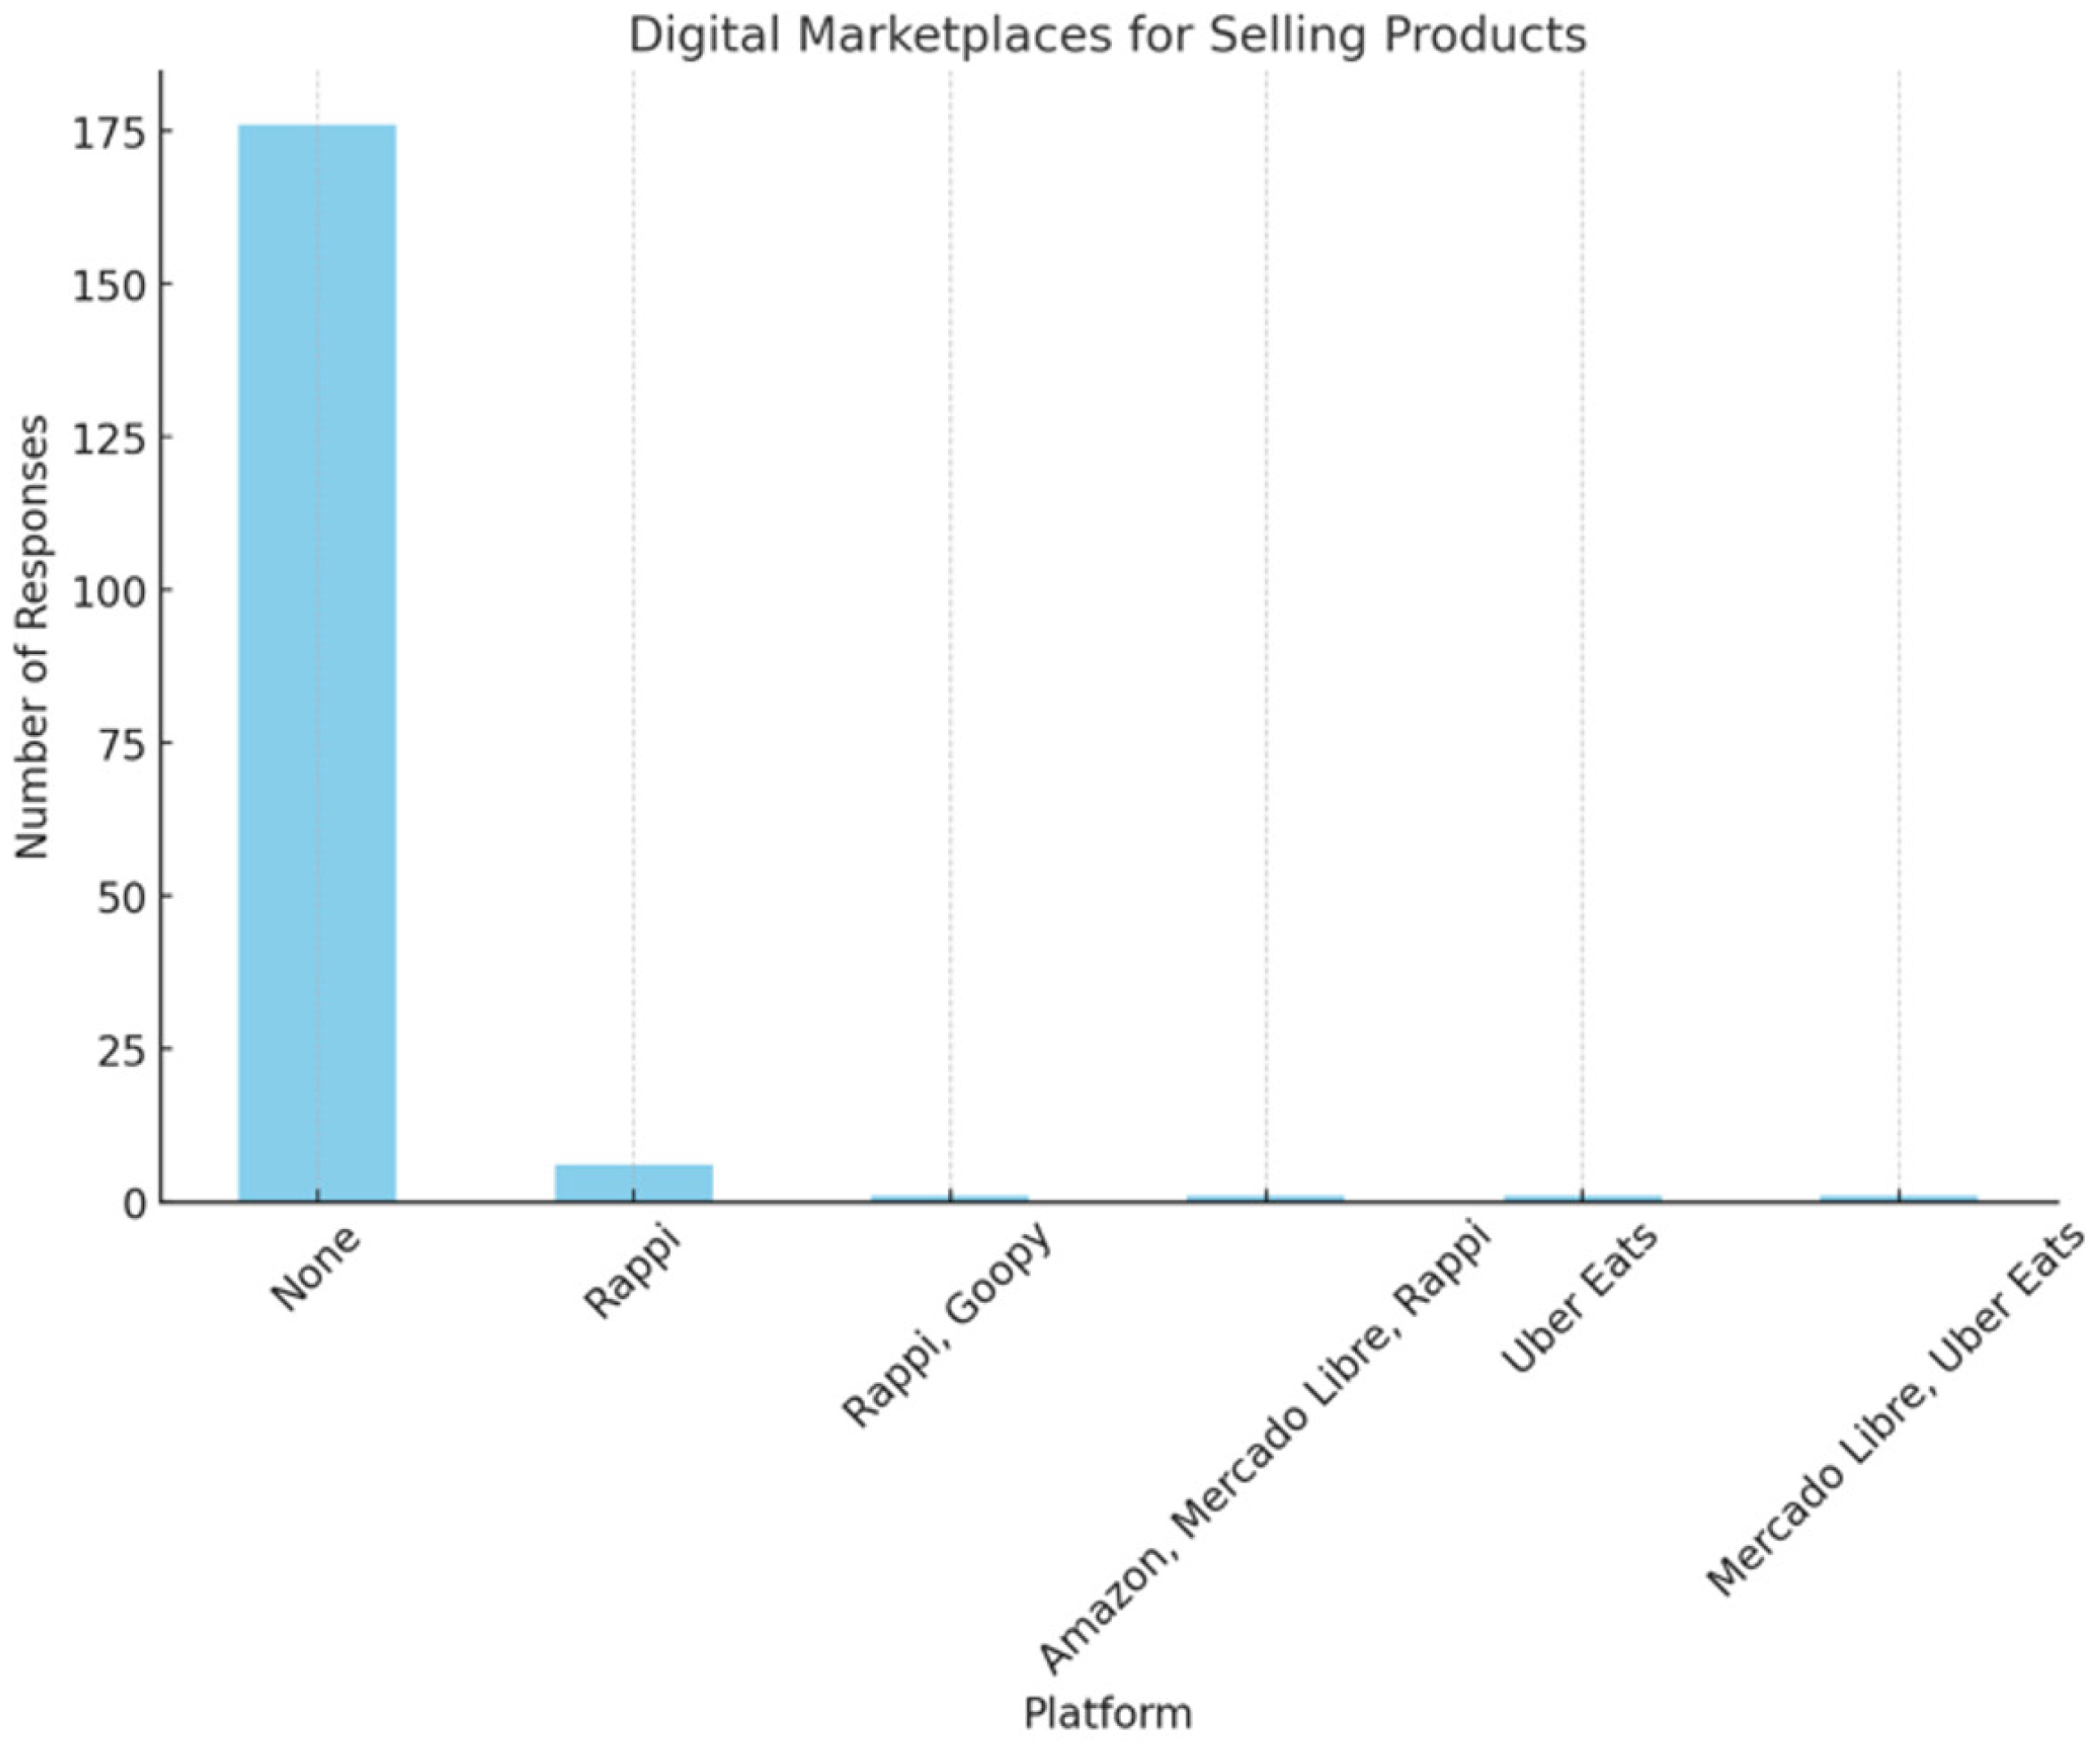
To better understand the collected data, visualizations were created using matplotlib in Python 3.10. An example, shown in Figure 4, corresponds to question 32 in the survey. The complete set of visualizations is available in the repository under surveyresults.docx [72].

3.2.2. Descriptive and Inferential Statistics

The descriptive statistics using Minitab 19.0, for the 187 respondents, reveal the following:
Profile: 60.96% of businesses have been operating for over 5 years (95% CI: 53.97, 67.95). 52.41% operate 8-12 h daily (95% CI: 45.25, 59.56).
Managerial characteristics: 33.16% of managers are aged 30-40 years (95% CI: 26.40, 39.91). 44.39% of managers have a high school education (95% CI: 37.26, 51.50). 47.06% of respondents are men (95% CI: 39.90, 54.21), and 52.94% are women (95% CI: 45.78, 60.09). 62.57% are willing to implement changes (95% CI: 55.63, 69.50). 53.4% expect to make changes within 6 months (95% CI: 46.32, 60.62).
Personnel management: 61% of businesses have staff (95% CI: 53.97, 67.95), with 60.42% having 2-5 employees (95% CI: 53.42, 67.44). 57.75% of employees collaborate (95% CI: 50.67, 64.83), and 57.21% can adapt to changes in under 3 months (95% CI: 50.13, 64.31). 52.94% offer training (95% CI: 45.79, 60.10).
Company infrastructure: 33.16% organize shelves by product type (95% CI: 26.41, 39.90). 57.22% receive merchandise directly (95% CI: 50.12, 64.31), and 29.41% use their own vehicles for transportation (95% CI: 22.88, 35.94). 77.01% have a car or small truck (95% CI: 70.97, 83.04). 68.98% lack a loading area (95% CI: 62.35, 75.61).
Inventory: 47.06% lack additional storage space, and 68.98% do not forecast sales (95% CI: 62.35, 75.61). 42.16% buy 10–30% of items from wholesalers. 55.1% do not track inventory (95% CI: 48.49, 62.73).
Technology: 60.43% have a cell phone (95% CI: 53.42, 67.44), and 36.90% have a computer (95% CI: 29.98, 43.81). 67.91% have internet access (95% CI: 61.22, 74.61). 44.92% lack a system for sales/inventory (95% CI: 37.79, 52.04), and 60.87% record sales manually (95% CI: 53.42, 67.44).
E-commerce: 58.82% accept electronic payments (95% CI: 51.77, 65.87), 66.2% have card terminals (95% CI: 59.53, 73.08), and 31.2% accept bank transfers (95% CI: 24.89, 38.21). 95.18% lack a website (95% CI: 92.11, 98.25), and 93.58% have never sold on platforms like Rappi or Uber Eats (95% CI: 90.07, 97.09). 71.66% have never sold via WhatsApp, phone, or Facebook (95% CI: 65.20, 78.12).
Challenges to introduce technology: 88.2% have never received government support (95% CI: 83.62, 92.85). 51.33% do not need help digitizing (95% CI: 44.17, 58.50), while 48.66% do (95% CI: 41.50, 55.82). The most needed assistance is training (48.96%) and infrastructure (47.92%).

3.2.3. Relationship Between Variables

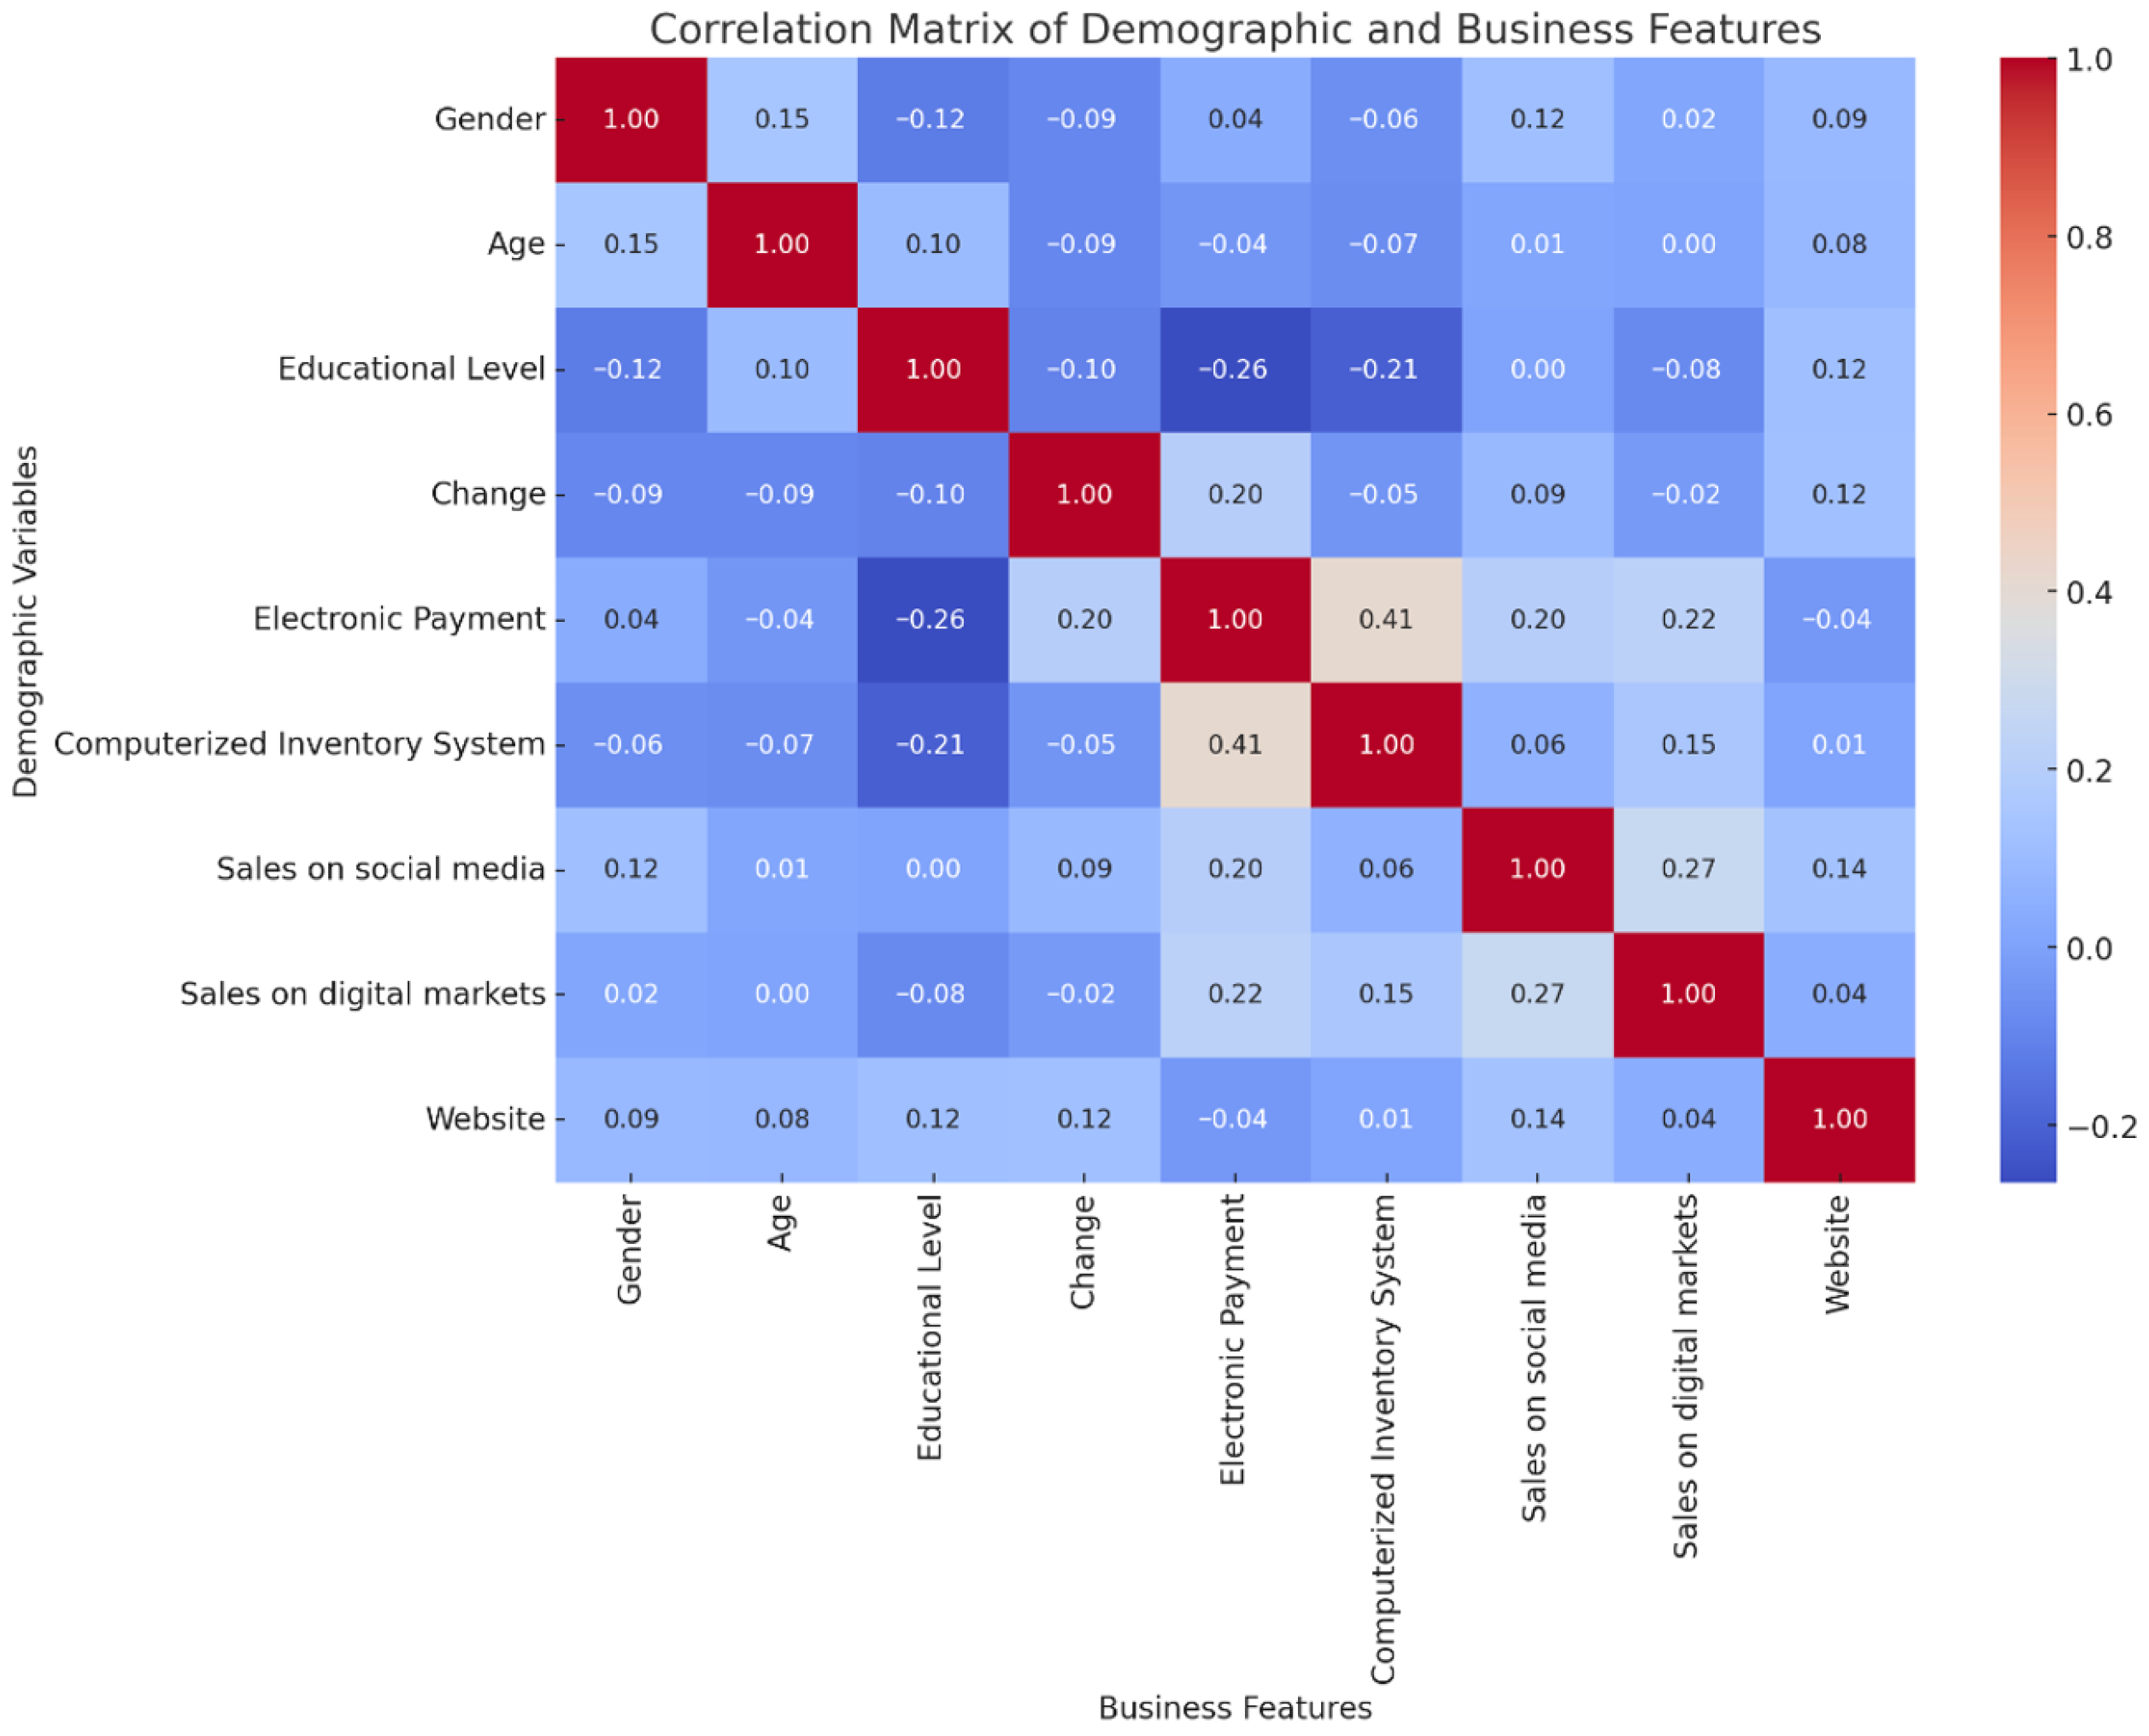
The correlation matrix in Figure 5 highlights key relationships between demographic factors and business attributes. Significant associations (p-value < 0.05) include a strong link between Electronic Payment Methods and Educational Level, as well as between a Computerized Inventory System and Educational Level. Although no high correlations are found, ANOVA is used to explore the impact of the manager’s profile on these variables. Additionally, one of the strongest correlations is observed between Sales on digital media and Sales on social media.
To address RQ2 (Is the ability to generate VVC positively correlated with the cultural and behavioral issues of the MSE’s managers in Mexico?), a variance analysis (ANOVA) was conducted, and the following relationships were tested:
Change vs. gender change and education level: ANOVA was applied to questions 5 (Gender, age, and educational level of the manager) and 6 from the database using Minitab 19). The results can be seen in Table 3. For the ANOVA, we tested the homogeneity of variances assumption using Levene’s test (p = 0.997), which indicated that the groups did not differ significantly in variance. This confirmed that the assumption of homogeneity was met, supporting the validity of the ANOVA results.
In addition to the parametric ANOVA, we performed a robustness check using a rank-based factorial ANOVA (Conover–Iman approach). The response variable was transformed into mid-ranks and analyzed with a three-factor General Linear Model in Minitab 19. The results were consistent with the parametric ANOVA, showing no significant changes in the interpretation of factor effects (Gender: p = 0.110; Age: p = 0.061; Educational Level: p = 0.146). This analysis supports the robustness of our conclusions against violations of normality assumptions. It is important to mention that this analysis was made in every ANOVA.
The analysis indicates no statistically significant association between Educational Level and the willingness to implement Change, with a p-value of 0.324, above the 0.05 alpha level. Similarly, Change is not related to Gender, Age, or Educational Level at the 0.05 alpha level. However, the p-value for Age suggests a potential trend that might become significant with a larger sample size or different age group classification.
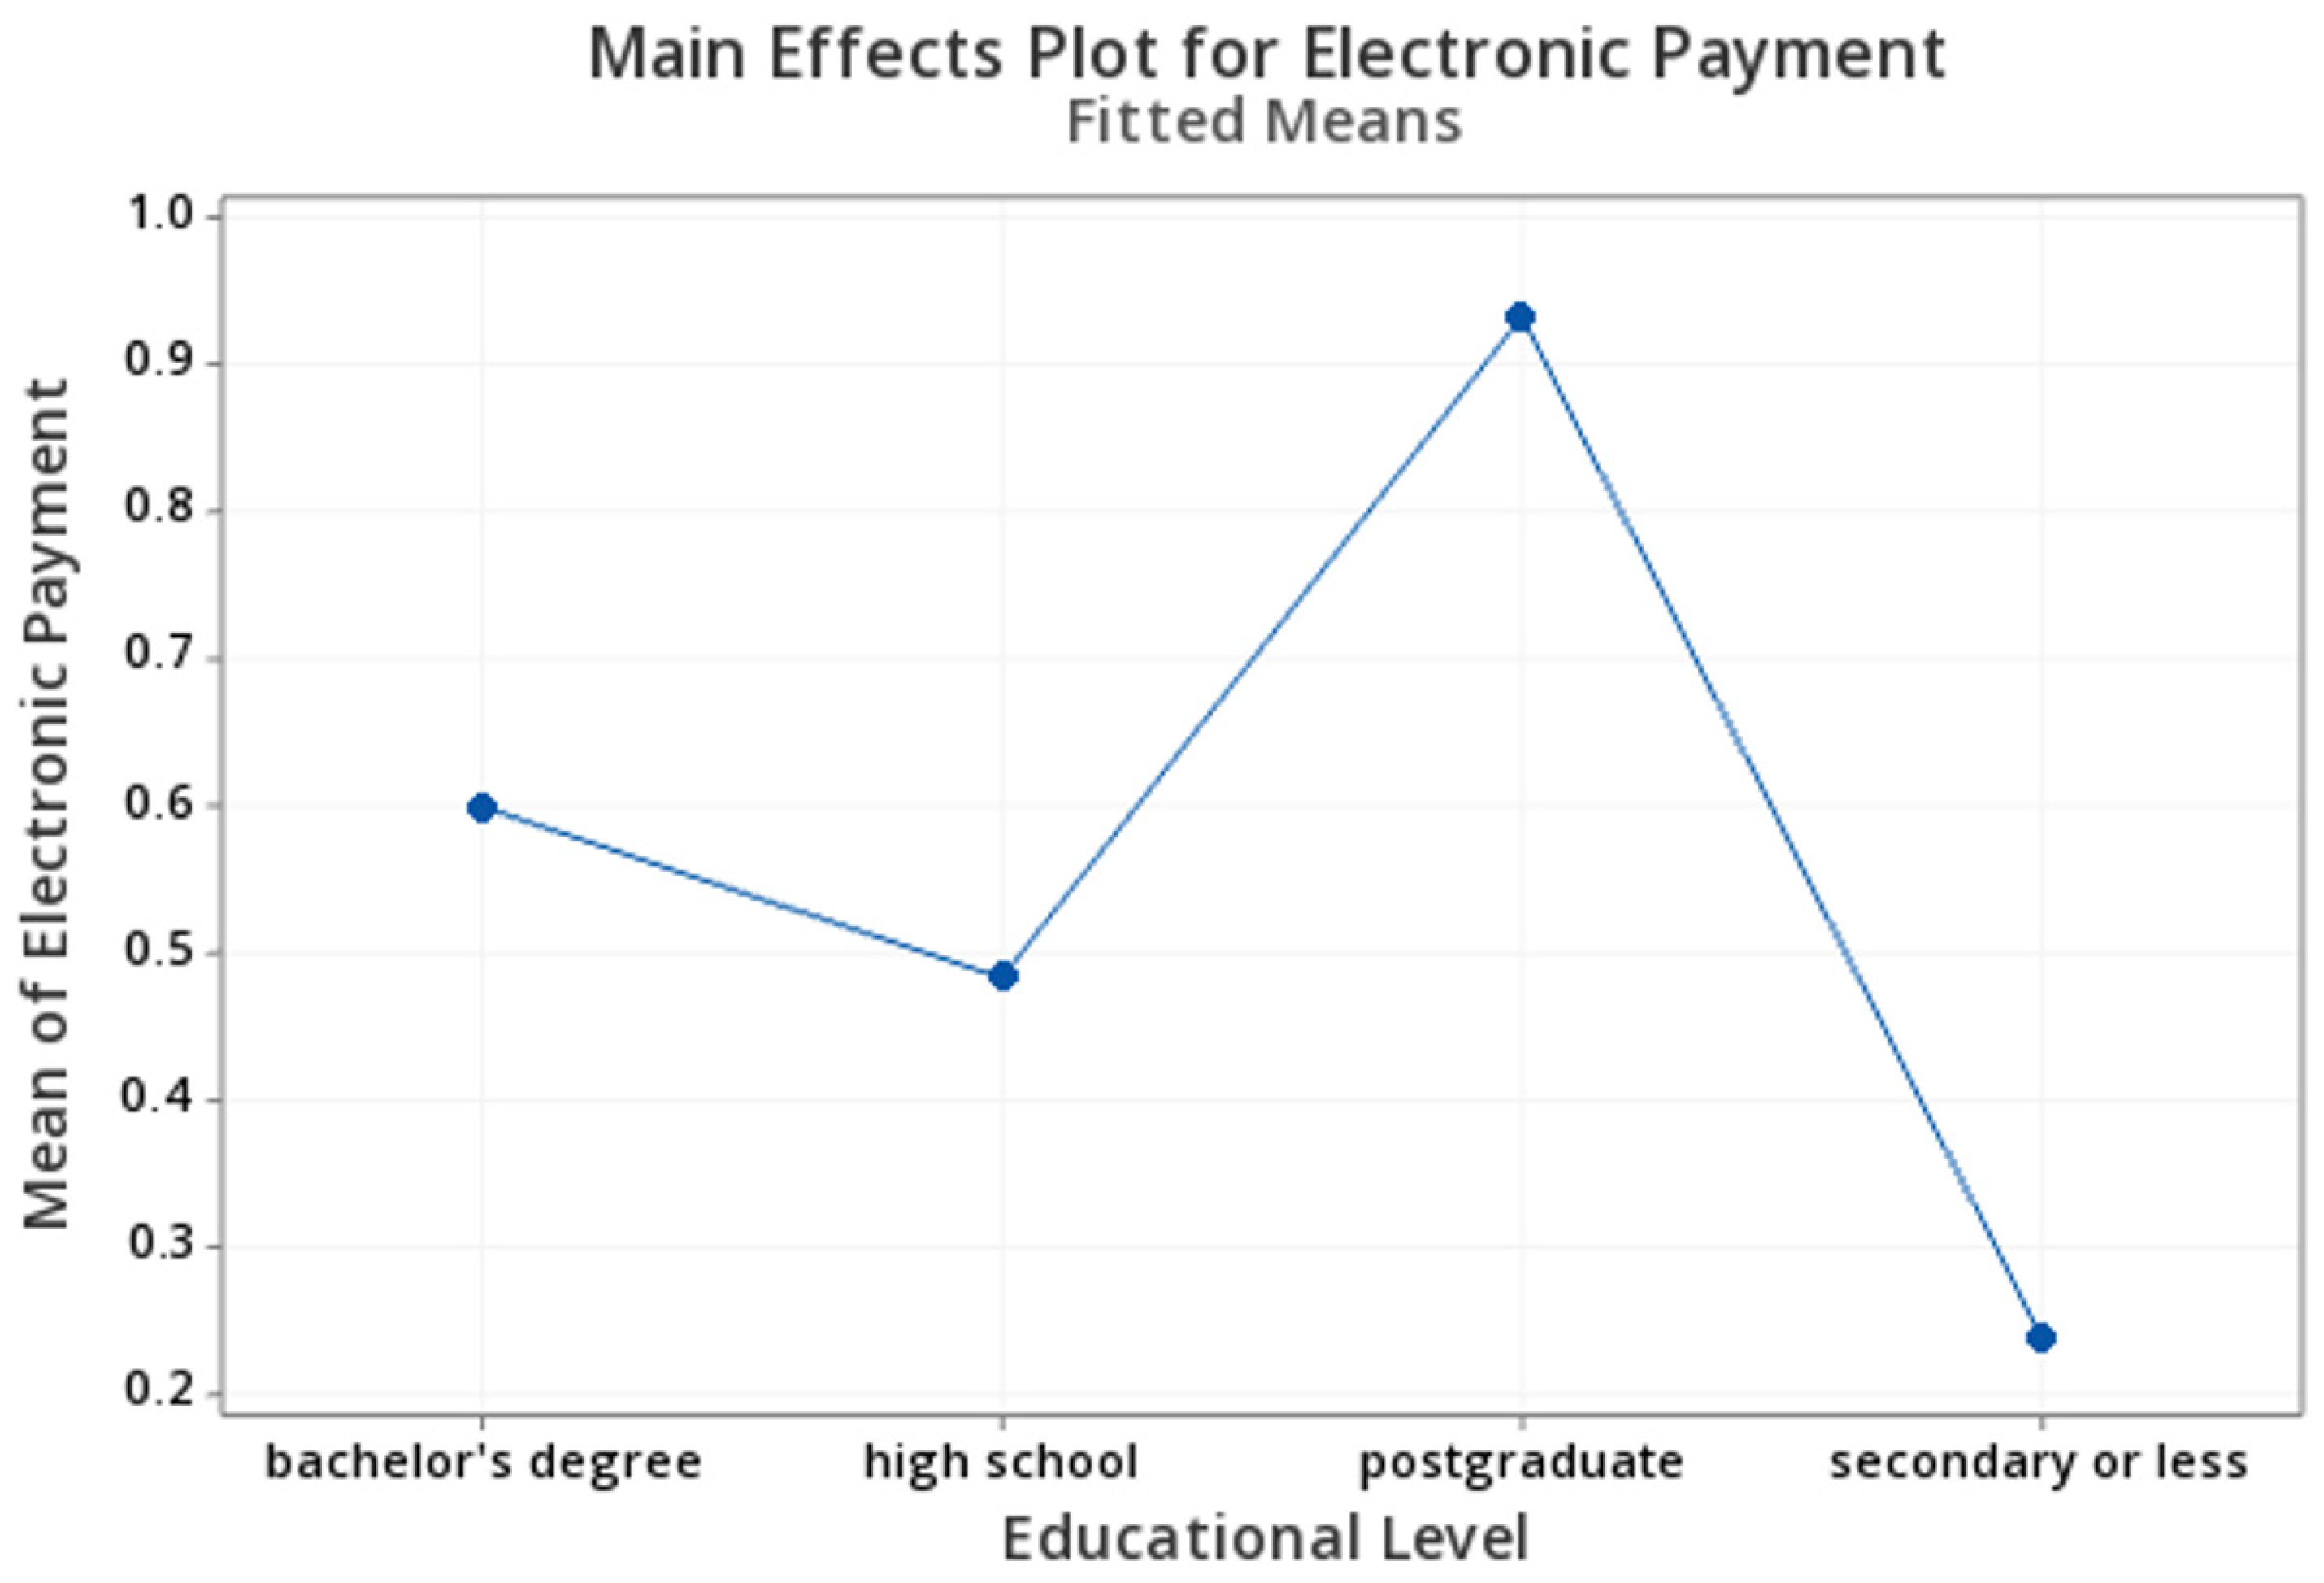
For electronic payments, ANOVA results show that only the manager’s educational level affects the outcome, with a p-value of 0.00, as is observed in Table 4. Neither gender nor age has an impact. The mean effects plot in Figure 6 reveals that managers with a bachelor’s or graduate degree are more willing to adopt electronic payments
The analysis in Table 5 shows that both age and educational level significantly impact the likelihood of having a computerized inventory system (Questions 5 and 26 are utilized for this analysis), with p-values of 0.009 and 0.011, respectively. The main effects plot in Figure 7 reveals that younger individuals are more likely to use technology frequently for managing a computerized inventory.
For sales on social media regarding payment vs. gender, age, and educational level, Table 6 shows that none of the profile variables affect sales on social media platforms like Facebook and WhatsApp. Questions 5 and 31 were used for analysis.
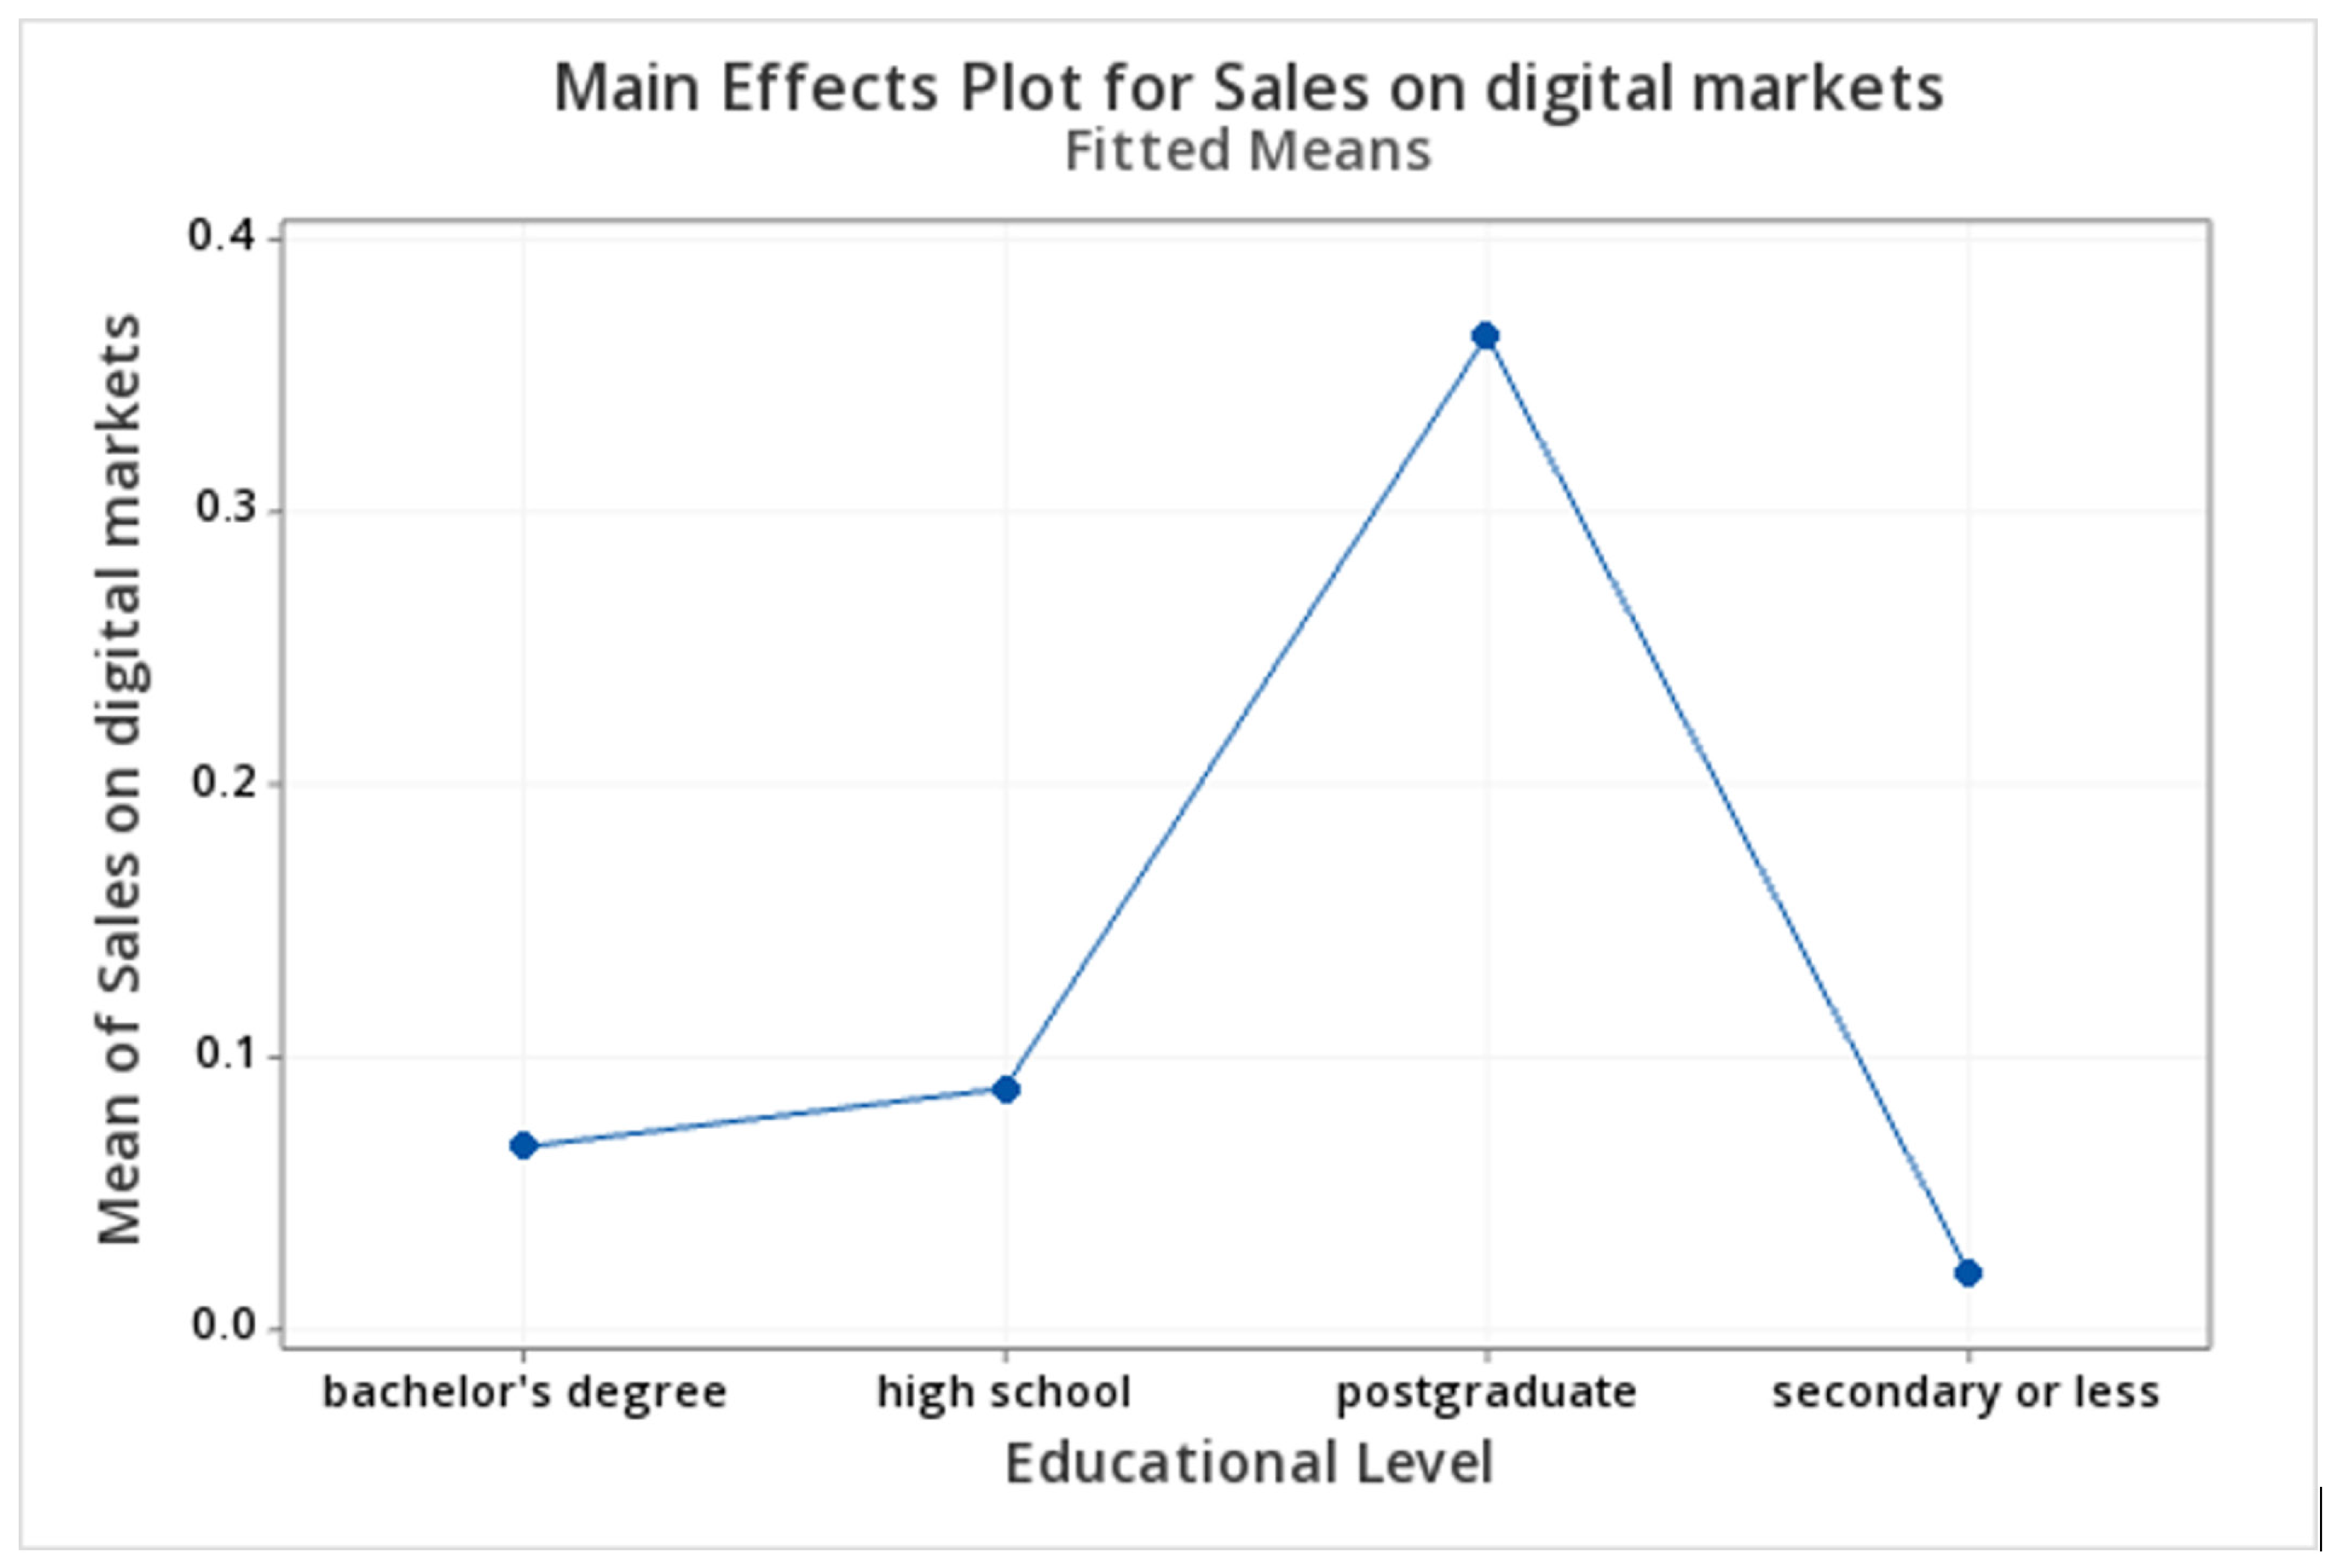
For sales on digital markets vs. gender, age, and educational level, in this case, questions 5 and 32 were used. Again, the level of education is the only variable that affects the outcome variable, as is observed in Table 7. Figure 8 shows that administrators with postgraduate degrees are the most determined to make sales on platforms like Rappi, Uber, etc.
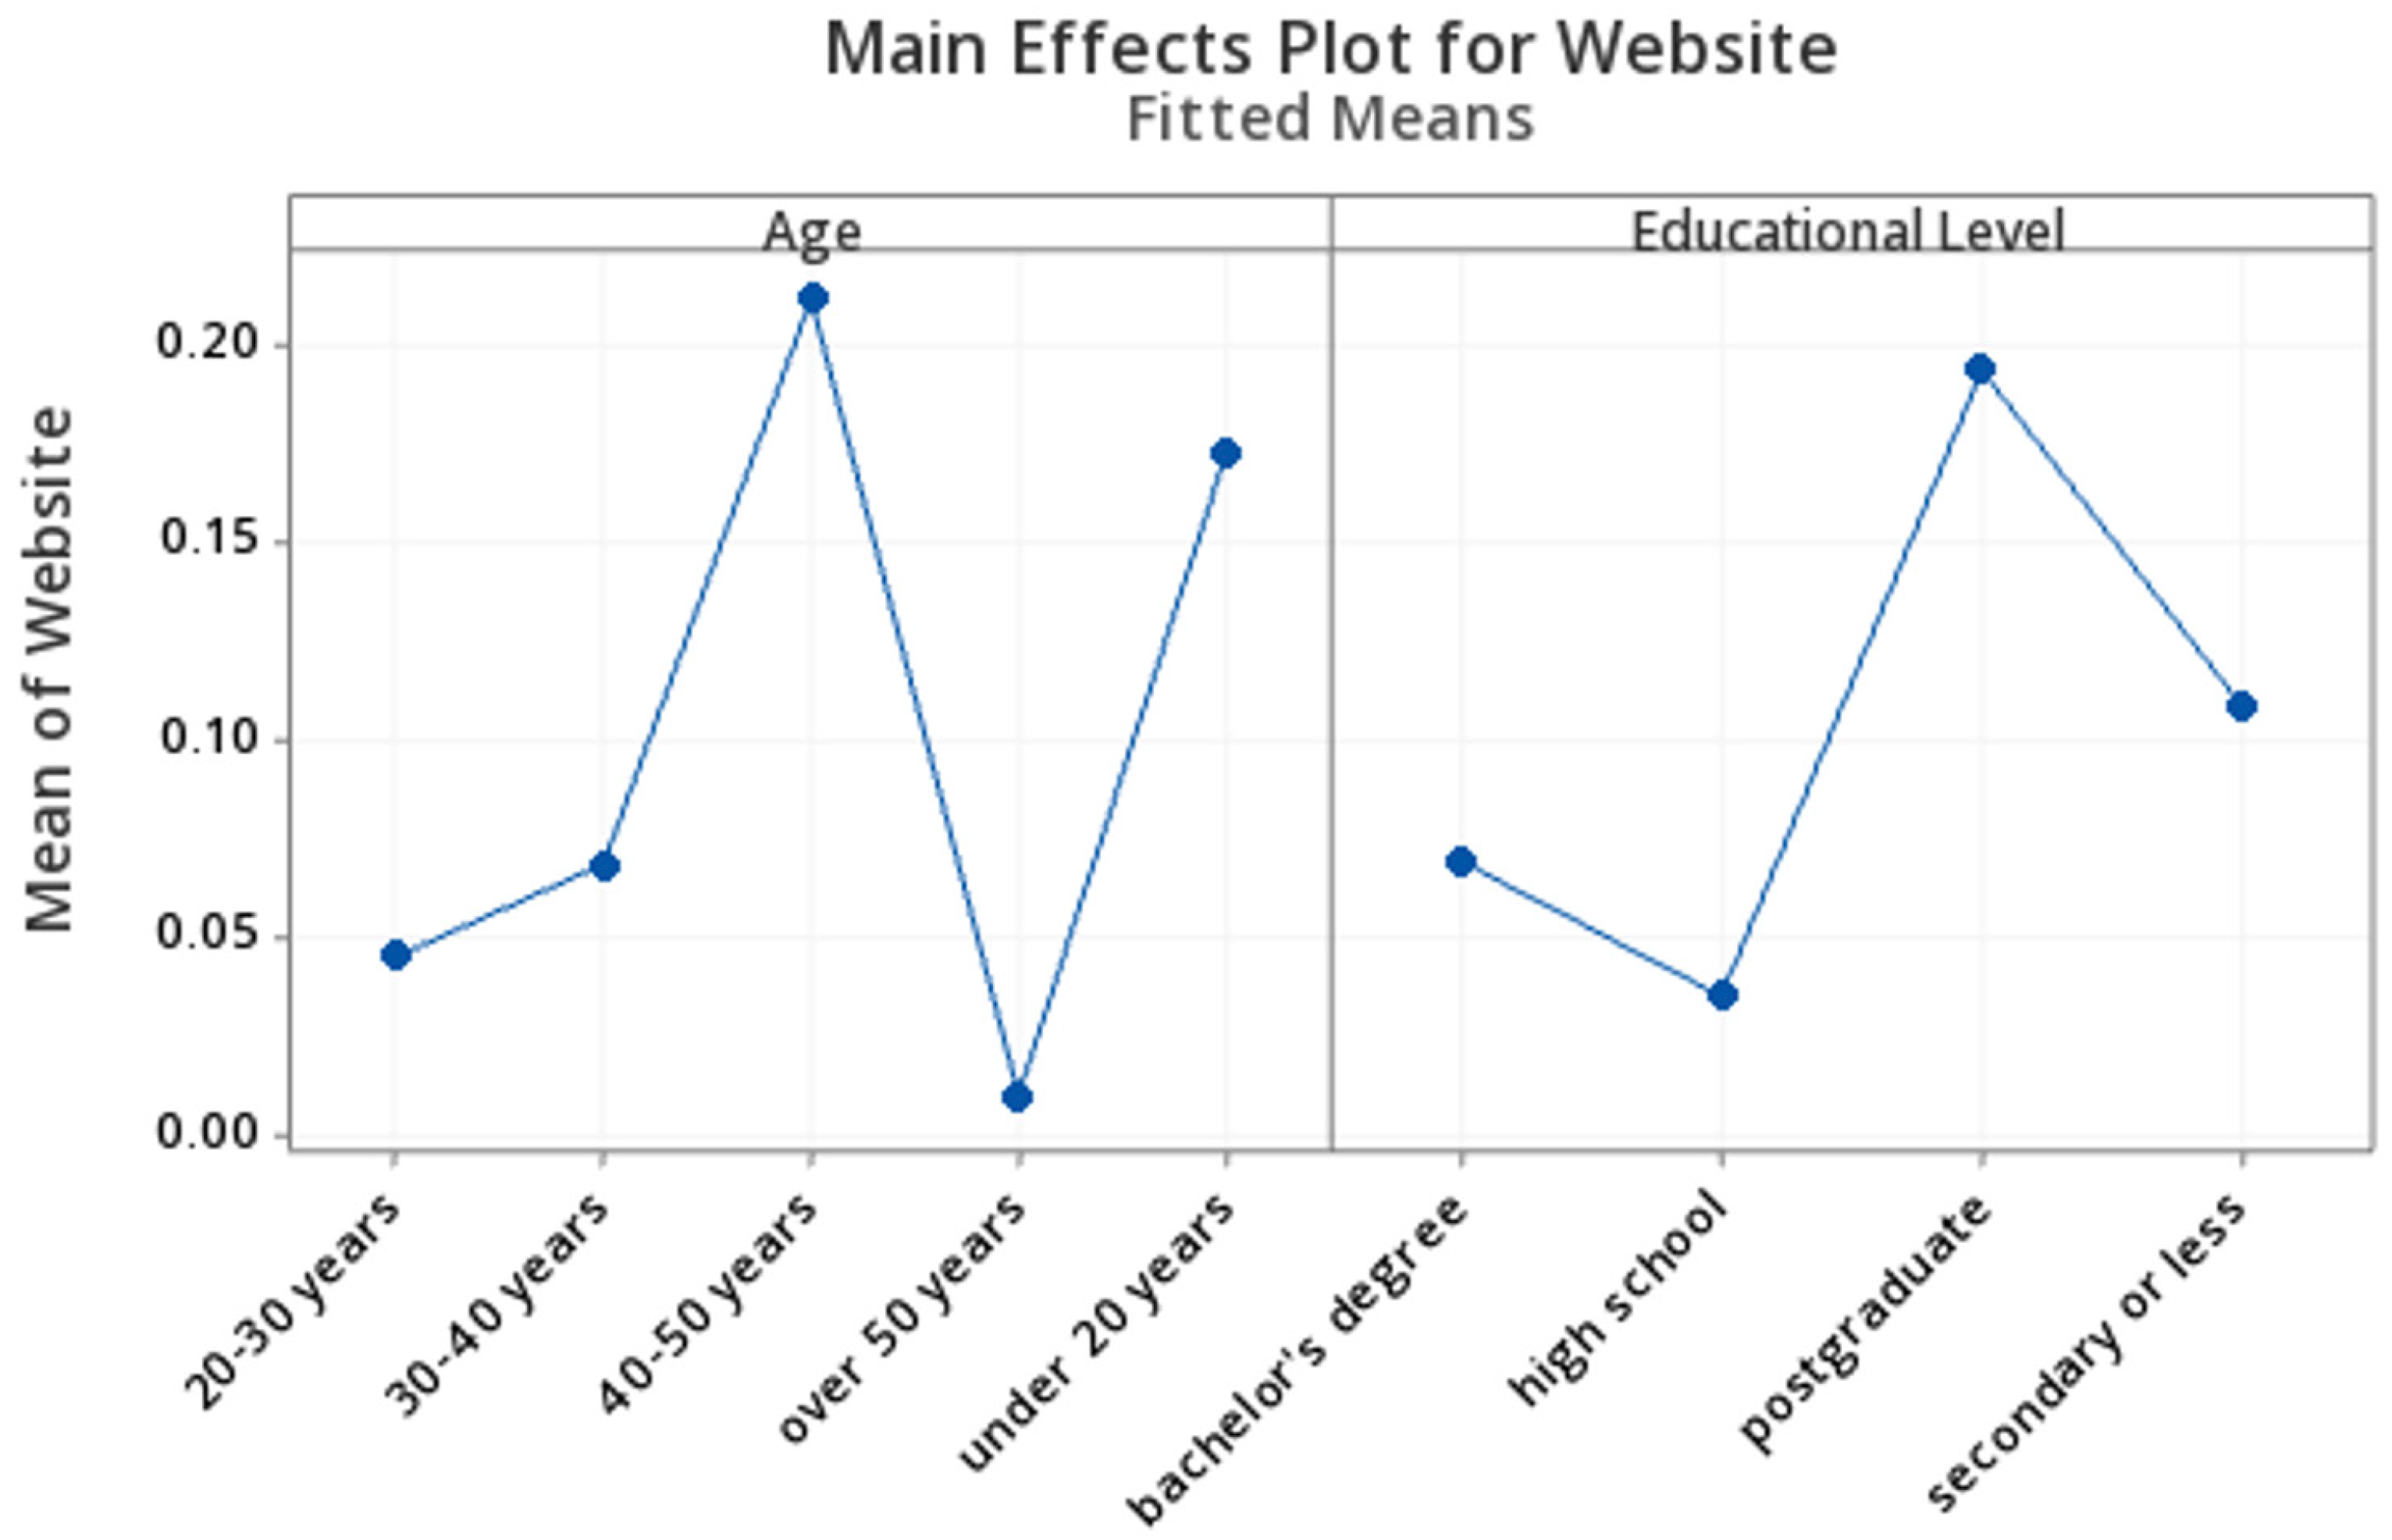
The analysis of the website variable, using questions 5 and 30, shows that both age and educational level significantly affect the likelihood of having a website, with p-values of 0.000 and 0.099, respectively, as is observed in Table 8. The main effects plot in Figure 9 reveals that managers with postgraduate degrees are most likely to have a website. A chi-square test indicates that age is related to both the computerized inventory system and sales on websites, while educational level is associated with the computerized inventory system and sales on digital markets. Gender does not show a significant relation to any variable.

3.2.4. Prediction of VVC Adoption by MSEs

To provide greater methodological clarity, a brief overview of the machine learning techniques employed is included here. Logistic Regression is a linear model commonly used for binary classification tasks. K-Nearest Neighbors (KNN) classifies new observations based on their similarity to nearby cases in the dataset. Support Vector Machines (SVMs) aim to find the optimal boundary that separates classes. Random Forest and Gradient Boosting are ensemble methods that combine multiple decision trees to improve prediction accuracy and reduce overfitting. Finally, neural networks are flexible models capable of capturing non-linear relationships in the data. These techniques were selected because they represent a balance of interpretability, robustness, and predictive power in classification problems.
In this section, we detail the implementation of machine learning techniques to evaluate whether it is possible to predict, based on certain managerial features, their willingness to adopt a VVC. To address this, we first analyze the dataset obtained from the survey using visualizations, descriptive statistics, and a correlation matrix. It is important to note that the dataset is unbalanced, and since this is a binary classification problem, the F1 score is the most suitable metric for evaluating the performance of the tested models.
A pipeline was used using scikit-learn [74], in order to evaluate if the use of machine learning has value to predict if a manager adopts a VVC, and a set of baseline models was used. Scikit-learn uses a dummy classifier with some easy strategies to generate predictions. The most frequent strategy always predicts the most frequent class from the training set. The stratified strategy generates predictions while respecting the class distribution of the training set. The uniform strategy makes random predictions for each class with a uniform distribution. Finally, the constant strategy always predicts a specific class, which must be defined beforehand, in our case, the constant value of 1 in change label prediction.
The machine learning (ML) models used included Logistic Regression, K-Nearest Neighbors, Support Vector Machine, Random Forest, Gradient Boosting, and a neural network. Stratified random sampling was applied due to the unbalanced dataset, with an 80% training and 20% validation split. Cross-validation was performed using five folds. Finally, hyperparameter optimization was conducted using Optuna [75].
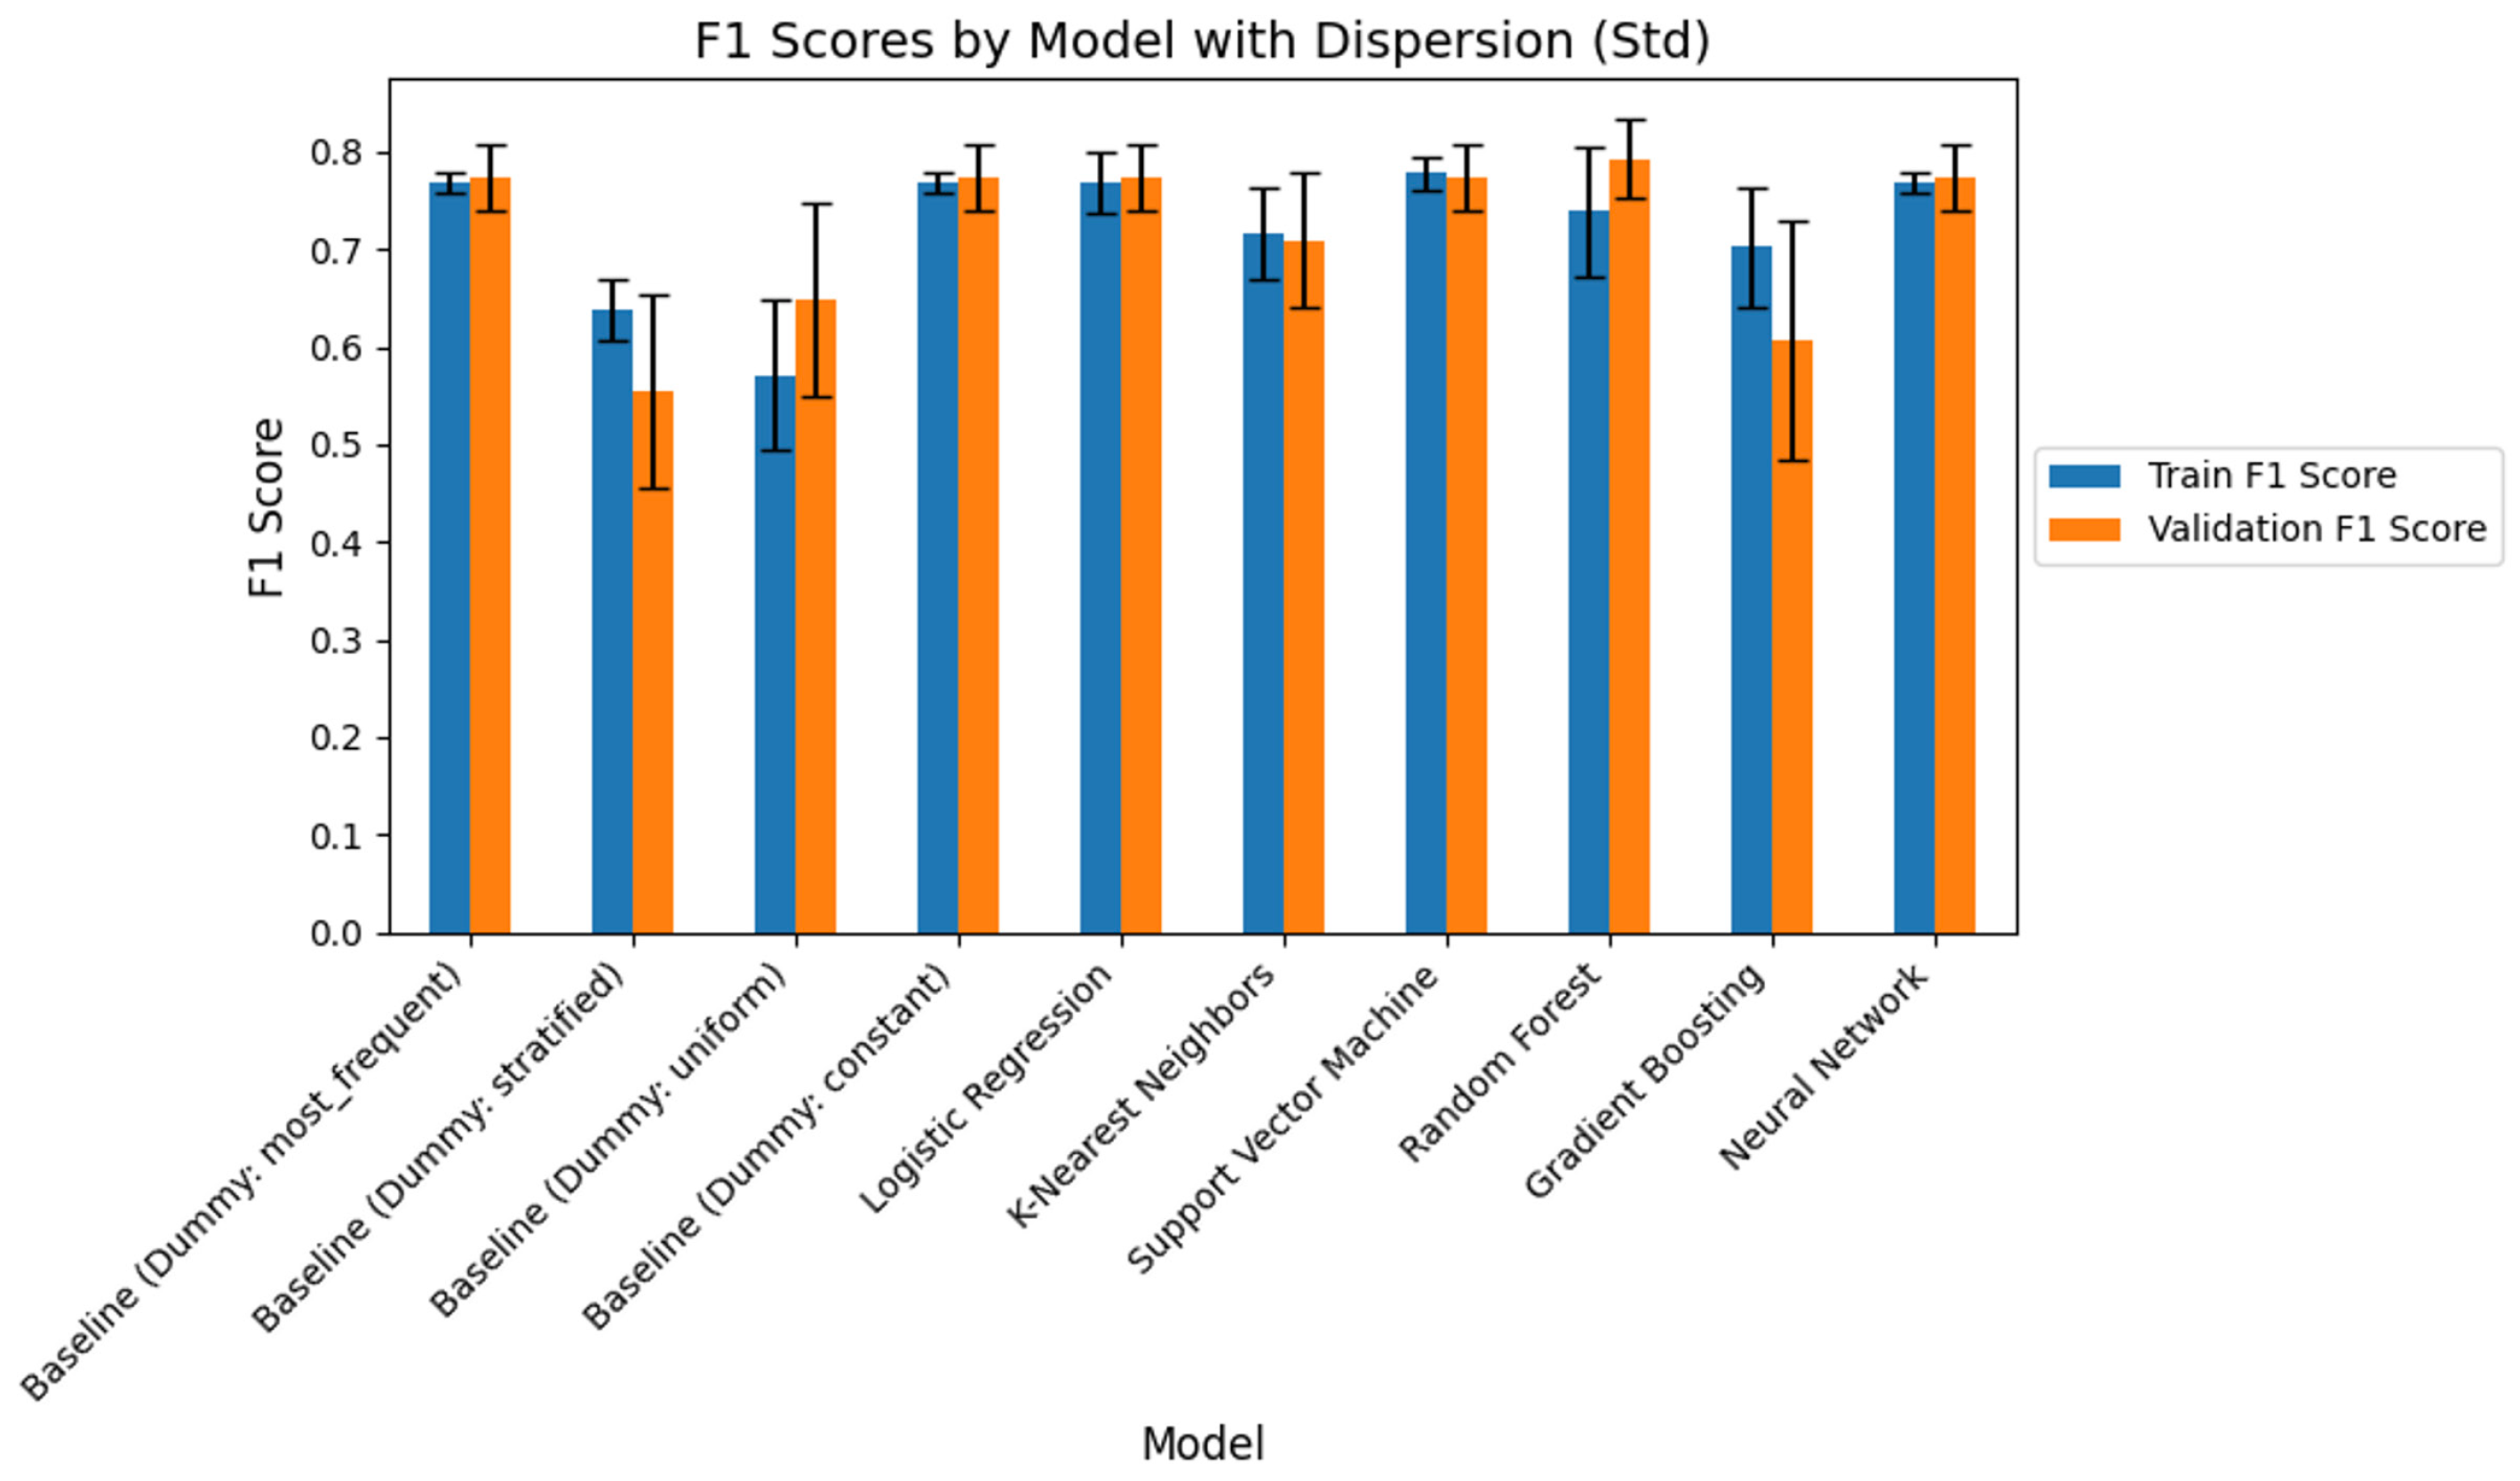
The results shown in Figure 10 show the F1 Score values for both the training and validation sets across different models, including the Dummy classifiers and ML algorithms. In general, the baseline models exhibit consistently high performance in both the training and validation sets, with an F1 Score close to 0.77 and a low standard error. This suggests that these models are consistent, as they rely on trivial predictions. However, more sophisticated models, such as Logistic Regression, K-Nearest Neighbors, Random Forest, and neural networks, achieve similar or slightly better validation results. Notably, Random Forest stands out with a validation F1 Score of 0.79, indicating superior generalization performance compared to other algorithms. In summary, perhaps Random Forest appears to be the most robust option, offering a good balance between a strong validation F1 Score and a moderate standard error; some dummy models maintain good F1 Scores, and it is thus concluded that, at least for this dataset generated, the use of ML models does not notably increase the performance metric (F1 Score).

4. Results and Discussion

Regarding the first research question (RQ1), which explores whether grocery stores in Mexico possess the technological capabilities necessary to implement Virtual Value Chains (VVCs) with suppliers and customers, the analysis of the collected data indicates that they do not. Between 60.43% and 67.44% of stores only have access to a mobile phone, and between 53.42% and 67.4% still record sales manually in notebooks, lacking clear insight into their inventory levels. Only 18.43% to 30.77% of stores use an inventory system, which makes it currently unfeasible to implement a demand forecasting system that would enable timely orders from suppliers.
Between 50.12% and 64.31% receive products directly from suppliers; however, these deliveries mostly consist of beverages and soft drinks, which account for only 17.39% of their top-selling items. In contrast, their best-selling products, perishables (32.3%), are typically self-procured and transported in store-owned vehicles. Additionally, while 54.03% to 73.03% of stores have card payment terminals, only 31.2% accept electronic transfers.
The analysis revealed that most grocery stores lack the technological infrastructure needed to implement a Virtual Value Chain. A majority of businesses rely on mobile phones and manual sales recording, with only a small portion using inventory systems or accepting digital payments beyond card terminals. This limited technological maturity constrains both data generation (input) and information dissemination (output), two critical stages in the VVC model.
The findings align with global challenges in digitalizing small retailers, particularly in logistics and infrastructure [76]. However, the widespread access to mobile phones presents a viable entry point for digital integration. Designing a user-friendly mobile app, complemented by digital skills training (between 83.92% and 92.85% of managers have never received any), could enable store managers to initiate VVC processes incrementally, starting with inventory tracking and supplier communication. As Heeks [11] points out, MSEs only require access to a mobile device to benefit effectively from ICT4D initiatives.
Despite these technological gaps, most micro-stores have been operating for more than five years (60.96%), indicating strong market resilience. While large grocery chains dominate urban areas, small stores remain competitive due to their flexibility: they sell individual items, offer fresh and less-processed goods, remain open late, and are located in convenient neighborhoods, factors that continue to attract customers. Future analyses will examine the drivers that lead customers to prefer small stores over larger chains.
Regarding the second research question (RQ2), the results suggest that the age and education of store managers are significant determinants of digital tool adoption. Younger and more educated managers are more likely to use digital platforms and engage with external systems (e.g., delivery apps, websites), thus enabling data flow across the value chain. In contrast, resistance among older managers, often due to a lack of training or fear of technology, creates informational bottlenecks.
These behavioral barriers inhibit the input–mediation–output cycle of the VVC. Without reliable digital data (input), insight generation (mediation) and online customer/supplier interaction (output) are severely limited. These insights reinforce existing ICT4D literature that highlights the critical role of local agency, digital literacy, and managerial mindset [11,13].
These findings are consistent with Weyer [61], who argues that beyond resource scarcity, managerial mindset plays a critical role in determining which technologies are adopted and how effectively they are integrated into the value chain. In the context of Mexican MSEs, a limited technological mindset hinders the transformation of traditional supply chain operations into digital flows of information and value, the essence of the VVC concept.
Finally, regarding the third research question (RQ3), machine learning models applied to predict a manager’s likelihood of adopting digital tools yielded inconclusive results. The lack of predictive power suggests that additional variables, such as managerial attitudes, trust in digital systems, or prior exposure, may be necessary for accurate modeling. This reinforces the complexity of behavioral dynamics in ICT adoption and indicates the need for more qualitative or mixed-methods approaches in future studies, exploring dimensionality reduction techniques or feature-label discrimination using covariance analysis to enhance data quality and model performance.

5. Conclusions

This research demonstrates that while grocery MSEs in Mexico exhibit operational resilience and social embeddedness, their potential for digital development through the VVC remains largely untapped. Despite some progress in payment technologies, there is a substantial gap in digitalizing supply chain operations, particularly in the areas of inventory management, supplier coordination, and data-driven decision-making like demand forecasting.
Our findings suggest that education and training are pivotal for enabling the VVC in microenterprise contexts. A mobile-based application, combined with capacity-building programs (over 80% of store managers have never received any form of technology training), could empower MSEs to engage more actively in digital value networks. Additionally, community-based logistics models, such as shared delivery services or app-enabled cooperatives, may offer scalable solutions in low-resource environments [77,78]. These alternatives align with the four key characteristics of ICT4D proposed by Heeks [11]: readiness, availability, sustainability (uptake), and impact.
This study contributes to ICT4D discourse by illustrating how VVC theory can be operationalized in the context of urban retail microenterprises in Mexico. It highlights the dual importance of technological enablers and behavioral readiness, bridging the gap between macro-level ICT policy and micro-level business practice.

Limitations of the Study and Future Research

The study is limited in geographic scope and does not incorporate consumer perspectives directly. Future work should explore how consumer trust, digital behavior, and generational preferences shape the success of digitalization strategies. Factors such as personalized service, proximity, and product flexibility appear to contribute to their sustained relevance [79].
Additionally, the sampling relied on surveys distributed by undergraduate students to nearby grocery stores, which introduces a convenience component. Out of 233 surveys distributed, 187 valid responses were obtained (a non-response rate of 19.7%). While this dataset provides valuable insights, the findings should be interpreted with caution and cannot be generalized to the more than 1,000,000 grocery stores that exist nationwide. Future studies should aim to apply stricter random sampling methods across a wider geographical scope.
Another limitation of this study is that the survey instrument did not incorporate items related to policy and regulatory changes, which can play a significant role in shaping MSEs’ supply chains. While the present research prioritized operational and technological readiness, future work should integrate institutional and regulatory dimensions to provide a more comprehensive understanding of the factors influencing VVC adoption.
Although this study employed machine learning techniques to explore managers’ willingness to adopt digital tools, the predictive power of the models was limited and yielded inconclusive results. This indicates that additional variables, such as managerial attitudes, trust in digital systems, or prior exposure to technology, may be required to improve accuracy. Furthermore, while Artificial Intelligence (AI) was not fully implemented in this study, we recognize its potential as a smart tool for future research. AI techniques could support dimensionality reduction, feature-label discrimination, and advanced behavioral modeling to enhance the analysis of Virtual Value Chain adoption. Future studies should explore these avenues to complement mixed methods approaches and strengthen predictive insights.
While technology and digital services play a crucial role in shaping consumer experiences and offer retailers the potential to enrich in-store engagement [80], a deeper understanding of consumer preferences remains essential. In some cases, habitual shopping practices and age-related factors prevent customers from feeling comfortable with alternatives to face-to-face purchasing [81].
Ultimately, this research reinforces the idea that development through ICT is not solely a matter of infrastructure, but of human capability, strategic design, and context-aware innovation. In the case of grocery MSEs, ICT does not inherently lead to development; however, when it is used to strengthen operations through the VVC, it can effectively support their growth. Importantly, complex technologies are not always required; access to a mobile phone, combined with proper training, can be sufficient to initiate meaningful digital engagement.

Author Contributions

Conceptualization, E.S.H.-G. and S.D.; methodology, A.I.R.M., J.E.G.-R. and E.S.H.-G.; software, A.I.R.M., J.E.G.-R. and E.S.H.-G.; validation, A.I.R.M.; formal analysis, E.S.H.-G.; investigation, E.S.H.-G.; data curation, E.S.H.-G., J.E.G.-R. and S.D.; writing—original draft preparation, E.S.H.-G. and J.E.G.-R. writing—review and editing methodology, A.I.R.M. and E.S.H.-G.; visualization, E.S.H.-G.; supervision, E.S.H.-G. All authors have read and agreed to the published version of the manuscript.

Funding

This research received no external funding.

Data Availability Statement

The data are available at the repository https://doi.org/10.6084/m9.figshare.25977001.v1 [65] and can be requested from the corresponding author when necessary.

Acknowledgments

We would like to thank Andrés Tellez for his valuable comments.

Conflicts of Interest

The authors declare no conflicts of interest.

Appendix A

Table A1. Questions included in the survey.
AreaQuestion
ProfileWhat is the name of your business?
How many personnel have you employed?
Please provide your working hours per day.
How much can your business earn monthly?
Managerial characteristicsPlease provide your full name.
Please select your gender, age, and highest level of education.
Are you interested in making some changes in your business? If so, how long does it take for you to get familiar with these changes
Personnel managementDo your personnel collaborate with each other during work?
How long does it take for your personnel to adapt to a new condition or a new decision in your business?
How long does it take for your personnel to learn and apply new ways of doing operations?
Are your personnel act as a part of your business with others?
Company infrastructureHow do you manage space in your shelves?
Do you have a specific place for loading/unloading?
Which types of vehicles do you prefer when transporting your products?
ProcurementWhich products are sold more than others?
How much space do your stocks occupy in your store?
Do you know the average sales number for the next periods?
Do you inform your suppliers about your orders? /If so, in which way?
ICT4DDo you have a convenient internet connection in your store?
Do you have an IT/paper-based system to monitor your sales and inventory?
Which devices do you use to track your orders?
E-commerceDo you receive electronic payments from customers?
Do you have a website to introduce your business or to sell your products online?
Do you sell your products via Facebook, WA, or other social media channels?
Do you receive orders via phone calls?
Do you sell your products via digital marketplaces (e.g., Mercado Libre, Amazon, etc.)?
Challenges to introducing technologyDo you receive any financial/technical/educational support from the government?
Do you need external support to engage with digitalization and political changes?
Do you distribute products provided by NGOs?

References

  1. Tarmidi, L.T. Strategies for HRM of SMEs in Indonesia. Human Resource Management Symposium on SMEs. 1999. Available online: https://www.apec.org/docs/default-source/Publications/1999/10/Human-Resource-Management-Symposium-on-Small-and-Medium-Enterprises-SMEs-Volume-1-and-Volume-2-1999/TOC/Volume-2.pdf#page=5 (accessed on 26 March 2025).
  2. Ministry of Economy in Mexico. Acuerdo por el que se Establece la Estratificación de las Micro, Pequeñas y Medianas Empresas. 2009. Available online: https://www.economia.gob.mx/files/marco_normativo/A539.pdf (accessed on 19 February 2025).
  3. Marett, K.; Niu, Z.; Barnett, T.R. Professionalizing the information security of family firms: A family essence perspective. J. Small Bus. Manag. 2020, 58, 390–408. [Google Scholar] [CrossRef]
  4. Saavedra, M.L.; Hernández, Y. Caracterización e importancia de las MIPYMES en Latinoamérica: Un estudio comparativo. Actual. Contab. Faces 2008, 11, 122–134. [Google Scholar]
  5. OECD. Latin American Economic Outlook 2013: SME Policies for Structural Change; OECD Publications: Paris, France, 2012. [Google Scholar]
  6. Leading Short-Term Digital Strategies from Small and Medium-Sized Enterprises (SMEs) to Get Through the COVID-19 Crisis in Mexico in 2020, by Type of Company [Graph], Statista. Available online: https://www.statista.com/statistics/1176417/short-term-digital-strategies-small-medium-enterprises-coronavirus/ (accessed on 3 July 2024).
  7. Cash Flow Challenge in Mexico, Mexico Business. Available online: https://mexicobusiness.news/finance/news/cash-flow-challenge-mexico (accessed on 9 July 2024).
  8. Velázquez-Martínez, J.C.; Tayaksi, C. Supply chain management for micro and small firms in Latin America. In Supply Chain Management and Logistics in Emerging Markets: Selected Papers from the 2018 MIT SCALE Latin America Conference; Emerald Publishing Limited.: Leeds, UK, 2020; pp. 197–214. [Google Scholar] [CrossRef]
  9. Chacko, J.G.; Harris, G. Information and communication technology and small, medium, and micro enterprises in Asia-Pacific—Size does matter. Inf. Technol. Dev. 2006, 12, 175–177. [Google Scholar] [CrossRef]
  10. Andaregie, A.; Astatkie, T. Determinants of technology adoption by micro and small enterprises (MSEs) in Awi Zone, Northwest Ethiopia. Afr. J. Sci. Technol. Innov. Dev. 2022, 14, 997–1006. [Google Scholar] [CrossRef]
  11. Heeks, R. Do information and communication technologies (ICTs) contribute to development? J. Int. Dev. 2010, 22, 625–640. [Google Scholar] [CrossRef]
  12. Avgerou, C. Theoretical framing of ICT4D research. Inf. Technol. Int. Dev. 2017, 13, 52–64. [Google Scholar] [CrossRef]
  13. Walsham, G. ICT4D research: Reflections on history and future agenda. Inf. Technol. Dev. 2017, 23, 18–41. [Google Scholar] [CrossRef]
  14. Duncombe, R. Using the livelihoods framework to analyze ICT applications for poverty reduction through microenterprise. Inf. Technol. Int. Dev. 2006, 3, 81–100. [Google Scholar] [CrossRef]
  15. Donner, J. Microentrepreneurs and mobiles: An exploration of the uses of mobile phones by small business owners in Rwanda. Inf. Technol. Int. Dev. 2004, 2, 1–21. [Google Scholar] [CrossRef]
  16. AlBar, A.M.; Hoque, R. Factors affecting the adoption of information and communication technology in small and medium enterprises: A perspective from rural Saudi Arabia. Inf. Technol. Dev. 2019, 25, 715–738. [Google Scholar] [CrossRef]
  17. Weiber, R.; Kollmann, T. Competitive advantages in virtual markets-perspectives of ‘information-based marketing’ in cyberspace. Eur. J. Mark. 1998, 32, 603–615. [Google Scholar] [CrossRef]
  18. Thapa, D.; Sæbø, Ø. Participation in ICT development interventions: Who and how? Electron. J. Inf. Syst. Dev. Ctries. 2016, 75, 1–14. [Google Scholar] [CrossRef]
  19. Bag, S.; Pretorius, J.H.C. Relationships between industry 4.0, sustainable manufacturing and circular economy: Proposal of a research framework. Int. J. Organ. Anal. 2022, 30, 864–898. [Google Scholar] [CrossRef]
  20. Culot, G.; Orzes, G.; Sartor, M.; Nassimbeni, G. The future of manufacturing: A Delphi-based scenario analysis on Industry 4.0. Technol. Forecast. Soc. Change 2020, 157, 120092. [Google Scholar] [CrossRef] [PubMed]
  21. Abagissa, J. The assessment of micro and small enterprises performance and challenges in Addis Ababa, Ethiopia. Int. J. Appl. Econ. Financ. Account. 2021, 9, 8–18. [Google Scholar] [CrossRef]
  22. Chen, C.-L.; Lin, Y.-C.; Chen, W.-H.; Chao, C.-F.; Pandia, H. Role of government to enhance digital transformation in small service business. Sustainability 2021, 13, 1028. [Google Scholar] [CrossRef]
  23. Ozols, A.; Avotins, V. Regional centre development management factors: Case study of Liepaja. In Proceedings of the 20th International Scientific Conference Engineering or Rural Development Proceedings, Jelgava, Latvia, 26–28 May 2021; Latvia University of Life Sciences and Technologies, Faculty of Engineering: Jelgava, Latvia, 2021. [Google Scholar]
  24. Agrawal, P.; Narain, R. Analysis of enablers for the digitalization of supply chain using an interpretive structural modelling approach. Int. J. Prod. Perform. Manag. 2023, 72, 410–439. [Google Scholar] [CrossRef]
  25. Chatterjee, S.; Chaudhuri, R.; Shah, M.; Maheshwari, P. Big data driven innovation for sustaining SME supply chain operationm in post COVID-19 scenario: Moderating role of SME technology leadership. Comput. Ind. Eng. 2022, 168, 108058. [Google Scholar] [CrossRef]
  26. Trinugroho, I.; Pamungkas, P.; Wiwoho, J.; Damayanti, S.M.; Pramono, T. Adoption of digital technologies for micro and small business in Indonesia. Finance Res. Lett. 2022, 45, 102156. [Google Scholar] [CrossRef]
  27. Mikhaylova, A.; Sakulyeva, T.; Shcherbina, T.; Levoshich, N.; Truntsevsky, Y. Impact of digitalization on the efficiency of supply chain management in the digital economy. Int. J. Enterp. Inf. Syst. 2021, 17, 34–46. [Google Scholar] [CrossRef]
  28. García-Salirrosas, E.E.; Acevedo-Duque, Á.; Chaves, V.M.; Henao, P.A.M.; Molano, J.C.O. Purchase intention and satisfaction of online shop users in developing countries during the COVID-19 pandemic. Sustainability 2022, 14, 6302. [Google Scholar] [CrossRef]
  29. Garay-Rondero, C.L.; Martinez-Flores, J.L.; Smith, N.R.; Caballero Morales, S.O.; Aldrette-Malacara, A. Digital supply chain model in Industry 4.0. J. Manuf. Technol. Manag. 2019, 31, 887–933. [Google Scholar] [CrossRef]
  30. Tanoira, F.G.B.; Valencia, R.A.S. Knowledge management entrepreneurial competencies and organizational development in micro and small enterprises in rural regions in the state of Yucatan, Mexico. Eur. Sci. J. 2014, 10, 177–193. [Google Scholar]
  31. Aguilar, O.; Posada, R.; Peña, N. La Micro y Pequeña Empresa Como Objeto de Estudio; Caso San Juan del Río: Querétaro, Mexico, 2015. [Google Scholar]
  32. Hernández-Gracia, T.J.; Duana-Avila, D. Discourse on Entrepreneurial Orientation in Hidalgo State, Mexico. Sustainability 2022, 14, 3205. [Google Scholar] [CrossRef]
  33. Vidal Olivares, J.; Barbero, M.I. Latin American small and medium-sized enterprises: A historical perspective. J. Evol. Stud. Bus. 2022, 7, 1–12. [Google Scholar] [CrossRef]
  34. Ramírez-Angulo, N.; Mungaray-Lagarda, A.; Aguilar-Barceló, J.G.; Flores-Anaya, Y. Microemprendimientos como instrumento de combate a la pobreza: Una evaluación social para el caso mexicano. Innovar 2017, 27, 63–74. [Google Scholar] [CrossRef]
  35. Autio, E. ‘Atomistic’ and ‘systemic’ approaches to research on new, technology-based firms: A literature study. Small Bus. Econ. 1997, 9, 195–209. [Google Scholar] [CrossRef]
  36. Fariselli, P.; Oughton, C.; Picory, C.; Sugden, R. Electronic commerce and the future for SMEs in a global marketplace: Networking and public policies. Small Bus. Econ. 1999, 12, 261–275. [Google Scholar] [CrossRef]
  37. Zhu, L. Optimization and Simulation for E-Commerce Supply Chain in the Internet of Things Environment. Complexity 2020, 2020, 8821128. [Google Scholar] [CrossRef]
  38. Graham, G.; Hardaker, G. Supply-chain management across the Internet. Int. J. Phys. Distrib. Logist. Manag. 2000, 30, 286–295. [Google Scholar] [CrossRef]
  39. Corso, M.; Martini, A.; Pellegrini, L.; Paolucci, E. Technological and organizational tools for knowledge management: In search of configurations. Small Bus. Econ. 2003, 21, 397–408. [Google Scholar] [CrossRef]
  40. Hongmei, W.; Jincheng, F. Research on virtual value chain model of smart travel agency under the background of digital media. In Proceedings of the 2021 2nd Artificial Intelligence and Complex Systems Conference, Hangzhou, China, 26–28 June 2021; ACM: New York, NY, USA, 2021. [Google Scholar]
  41. Ramantoko, G.; Fatimah, L.V.; Pratiwi, S.C.; Kinasih, K. Measuring Digital Capability Maturity: Case of Small-Medium Kampong-Digital Companies in Bandung. Pertanika J. Soc. Sci. Humanit. 2018, 26, 215–230. [Google Scholar]
  42. Piscitello, L.; Sgobbi, F. Globalisation, E-business and SMEs: Evidence from the Italian district of Prato. Small Bus. Econ. 2004, 22, 333–347. [Google Scholar] [CrossRef]
  43. Ariffin, A.S.; Hashom, H.; Abas, Z.; Ali, A.H.M.; Ramli, M.F. Empowering Kedah as the northern national hub for sustainable beef-cattle supply chain and production. E3S Web of Conferences 2021, 316, 01007. [Google Scholar] [CrossRef]
  44. Fromhold-Eisebith, M.; Marschall, P.; Peters, R.; Thomes, P. Torn between Digitized Future and Context Dependent Past—How Implementing ‘Industry 4.0’ Production Technologies Could Transform the German Textile Industry. Technol. Forecast. Soc. Chang. 2021, 166, 120620. [Google Scholar] [CrossRef]
  45. Gyenge, B.; Máté, Z.; Vida, I.; Bilan, Y.; Vasa, L. A new strategic marketing management model for the specificities of E-commerce in the supply chain. J. Theor. Appl. Electron. Commer. Res. 2021, 16, 1136–1149. [Google Scholar] [CrossRef]
  46. Hermawan, I.; Hindrawati, G.; Amid, J.; Suwondo, A. Designing internet shopping mall in the customer behavior perspective. Conf. Ser. 2021, 3, 537–551. [Google Scholar] [CrossRef]
  47. Hu, K.; Xu, X.; Qu, A. The psychology of virtual queue: When waiting feels less like waiting. Vanderbilt Owen Graduate School of Management Research Paper Forthcoming. 2021. Available online: https://ssrn.com/abstract=3933040 (accessed on 20 March 2025).
  48. Taherinia, M.; Nawaser, K.; Shariatnejad, A.; Saedi, A.; Moshtaghi, M. The evolution of the e-business value cycle through value co-creation during the COVID-19 pandemic: An empirical study from Iran. J. Asian Financ. Econ. Bus. 2021, 8, 19–28. [Google Scholar]
  49. Zumstein, D.; Oswald, C.; Brauer, C. Online Retailer Survey 2021: Empirical Findings on the E-Commerce Boom in Switzerland and Austria; ZHAW Zurich University of Applied Sciences: Winterthur, Switzerland, 2021. [Google Scholar]
  50. Liu, Y.; Zhang, J.Z.; Jasimuddin, S.; Babai, M.Z. Exploring servitization and digital transformation of manufacturing enterprises: Evidence from an industrial internet platform in China. Int. J. Prod. Res. 2024, 62, 2812–2831. [Google Scholar] [CrossRef]
  51. Eng, T.Y.; Mohsen, K.; Wu, L.C. Wireless information technology competency and transformational leadership in supply chain management: Implications for innovative capability. Inf. Technol. People 2023, 36, 969–995. [Google Scholar] [CrossRef]
  52. Omoruyi, O.; Makaleng, M.S.M. SMEs COVID-19 supply chain resilience strategies in South Africa. J. Contemp. Manag. 2022, 19, 299–319. [Google Scholar] [CrossRef]
  53. Sharma, M.; Raut, R.D.; Sehrawat, R.; Ishizaka, A. Digitalisation of manufacturing operations: The influential role of organisational, social, environmental, and technological impediments. Expert Syst. Appl. 2023, 211, 118501. [Google Scholar] [CrossRef]
  54. Berrone, P.; Gertel, H.; Giuliodori, R.; Bernard, L.; Meiners, E. Determinants of performance in microenterprises: Preliminary evidence from Argentina. J. Small Bus. Manag. 2014, 52, 477–500. [Google Scholar] [CrossRef]
  55. Gupta, S.; Ramachandran, D. Emerging market retail: Transitioning from product-centric to a customer-centric approach. J. Retail. 2021, 97, 597–620. [Google Scholar] [CrossRef]
  56. Hwang, W.-S.; Kim, H.-S. Does the adoption of emerging technologies improve technical efficiency? Evidence from Korean manufacturing SMEs. Small Bus. Econ. 2022, 59, 627–643. [Google Scholar] [CrossRef] [PubMed]
  57. Roth, A.; Rosenzweig, E. Advancing empirical science in operations management research: A clarion call to action. Manuf. Serv. Oper. Manag. M SOM 2020, 22, 179–190. [Google Scholar] [CrossRef]
  58. Sharma, N.; Dutta, N. Omnichannel retailing: Exploring future research avenues in retail marketing and distribution management. Int. J. Retail. Distrib. Manag. 2023, 51, 894–919. [Google Scholar] [CrossRef]
  59. Ciacci, A.; Penco, L. Business model innovation: Harnessing big data analytics and digital transformation in hostile environments. J. Small Bus. Enterp. Dev. 2024, 31, 22–46. [Google Scholar] [CrossRef]
  60. Matalamäki, M.J.; Joensuu-Salo, S. Digitalization and strategic flexibility—A recipe for business growth. J. Small Bus. Enterp. Dev. 2022, 29, 380–401. [Google Scholar] [CrossRef]
  61. Weyer, J.; Tiberius, V.; Bican, P.; Kraus, S. Digitizing grocery retailing: The role of emerging technologies in the value chain. Int. J. Innov. Technol. Manag. 2020, 17, 2050058. [Google Scholar] [CrossRef]
  62. Bierganz, M. Delivering Virtual Value: The Role of Virtual Value Creation in e-Grocery Business Models and Resulting Implications for Today’s Grocery Retail Firms. Ph.D. Dissertation, Universidad Católica Portuguesa, Lisbon, Portugal, 2021. [Google Scholar]
  63. Sampieri, R.H. Metodología de la Investigación: Las Rutas Cuantitativa, Cualitativa y Mixta; McGraw-Hill: México City, Mexico, 2018. [Google Scholar]
  64. INEGI: National Directory of Economic Units. Directorio Estadístico Nacional de Unidades Económicas. 2024. Available online: https://www.inegi.org.mx/app/mapa/denue/default.aspx (accessed on 9 July 2024).
  65. Gurdur, D.; Ei-Khoury, J.; Torngren, M. Digitalizing Swedish industry: What is next? Data analytics readiness assessment of Swedish industry, according to survey results. Comput. Ind. 2019, 105, 153–163. [Google Scholar]
  66. Peutz, M.M.; Post, G. A Shared Digital Twinning Facility for SMEs. In Proceedings of the XXXIII ISPIM Innovation Conference "Innovating in a Digital World", Copenhagen, Denmark, 5–8 June 2022; ISPIM: Manchester, UK, 2022; pp. 1–11. [Google Scholar]
  67. Merchán, D.; Arora, J.; Pachon, J.; Konduri, K.; Winkenbach, M.; Parks, S.; Noszek, J. 2021 Amazon Last Mile Routing Research Challenge: Data set. Transp. Sci. 2022, 58, 8–11. [Google Scholar] [CrossRef]
  68. Elkhouly, P.R.O.; Elsayed, S.M.; Hamid, R.M. Effect of Artificial Intelligence on End-to-End Customer Centric. Bus. Model 2022, 13, 121–142. [Google Scholar]
  69. Naimi-Sadigh, A.; Asgari, T.; Rabiei, M. Digital transformation in the value chain disruption of banking services. J. Knowl. Econ. 2022, 13, 1212–1242. [Google Scholar] [CrossRef]
  70. Winkler, M.; Moltenbrey, F.; Tilebein, M. Business Model Scenarios for Digital Textile Microfactories. Conf. Prod. Syst. Logist. CPSL 2022, 574–582. [Google Scholar] [CrossRef]
  71. Wasan, P.; Kumar, A.; Luthra, S. How can banks and finance companies incorporate value chain factors in their risk management strategy? The case of agro-food firms. Bus. Strat. Environ. 2023, 32, 858–877. [Google Scholar] [CrossRef]
  72. Hernández-Gress, E.S.; Ramírez-Mejia, A.I. Virtual value chains in Micro and Small Enterprises: An evidence for grocery stores in Mexico. Figshare J. Contrib. 2024. [Google Scholar] [CrossRef]
  73. Devore, J. Probability and Statistics for Engineering and the Sciences, 9th ed.; CENGAGE Learning: Boston, MA, USA, 2019; Available online: https://cdn.prexams.com/9441/Devore (accessed on 8 June 2024).
  74. Pedregosa, F.; Varoquaux, G.; Gramfort, A.; Michel, V.; Thirion, B.; Grisel, O.; Duchesnay, É. Scikit-learn: Machine Learning in Python. J. Mach. Learn. Res. 2011, 12, 2825–2830. [Google Scholar]
  75. Akiba, T.; Shotaro, S.; Toshihiko, Y.; Takeru, O.; Koyama, M. Optuna: A Next-generation Hyperparameter Optimization Framework. In Proceedings of the 25th ACM SIGKDD International Conference on Knowledge Discovery and Data Mining, Anchorage, AK, USA, 4–8 August 2019. [Google Scholar]
  76. Piroth, P.; Rüger-Muck, E.; Bruwer, J. Digitalisation in grocery retailing in Germany: An exploratory study. Int. Rev. Retail. Distrib. Consum. Res. 2020, 30, 479–497. [Google Scholar] [CrossRef]
  77. Escamilla, R.; Fransoo, J.C.; Tang, C.S. Improving agility, adaptability, alignment, accessibility, and affordability in nanostore supply chains. Prod. Oper. Manag. 2021, 30, 676–688. [Google Scholar] [CrossRef]
  78. Yang, Y.; Kobbacy, Y.; Onofrei, G.; Nguyen, H. Entrepreneurial strategies for coping with supply chain disruptions in the grocery-retail sector. J. Small Bus. Enterp. Dev. 2022, 30, 213–233. [Google Scholar] [CrossRef]
  79. Duh, H.I.; Pwaka, O. Grocery retailer’s brand performances from brand personalities and marketing offerings. Int. J. Retail. Distrib. Manag. 2023, 51, 101–122. [Google Scholar] [CrossRef]
  80. Berg, H.; Nilsson, E.; Liljedal, K.T. Consumer-facing technology in retailing: How technology shapes customer experience in physical and digital stores. Int. Rev. Retail. Distrib. Consum. Res. 2024, 34, 123–127. [Google Scholar] [CrossRef]
  81. Stenius, M.; Eriksson, N. What can we learn from non-adopters of online grocery shopping? Insights from Finland. Int. Rev. Retail. Distrib. Consum. Res. 2024, 35, 480–499. [Google Scholar] [CrossRef]
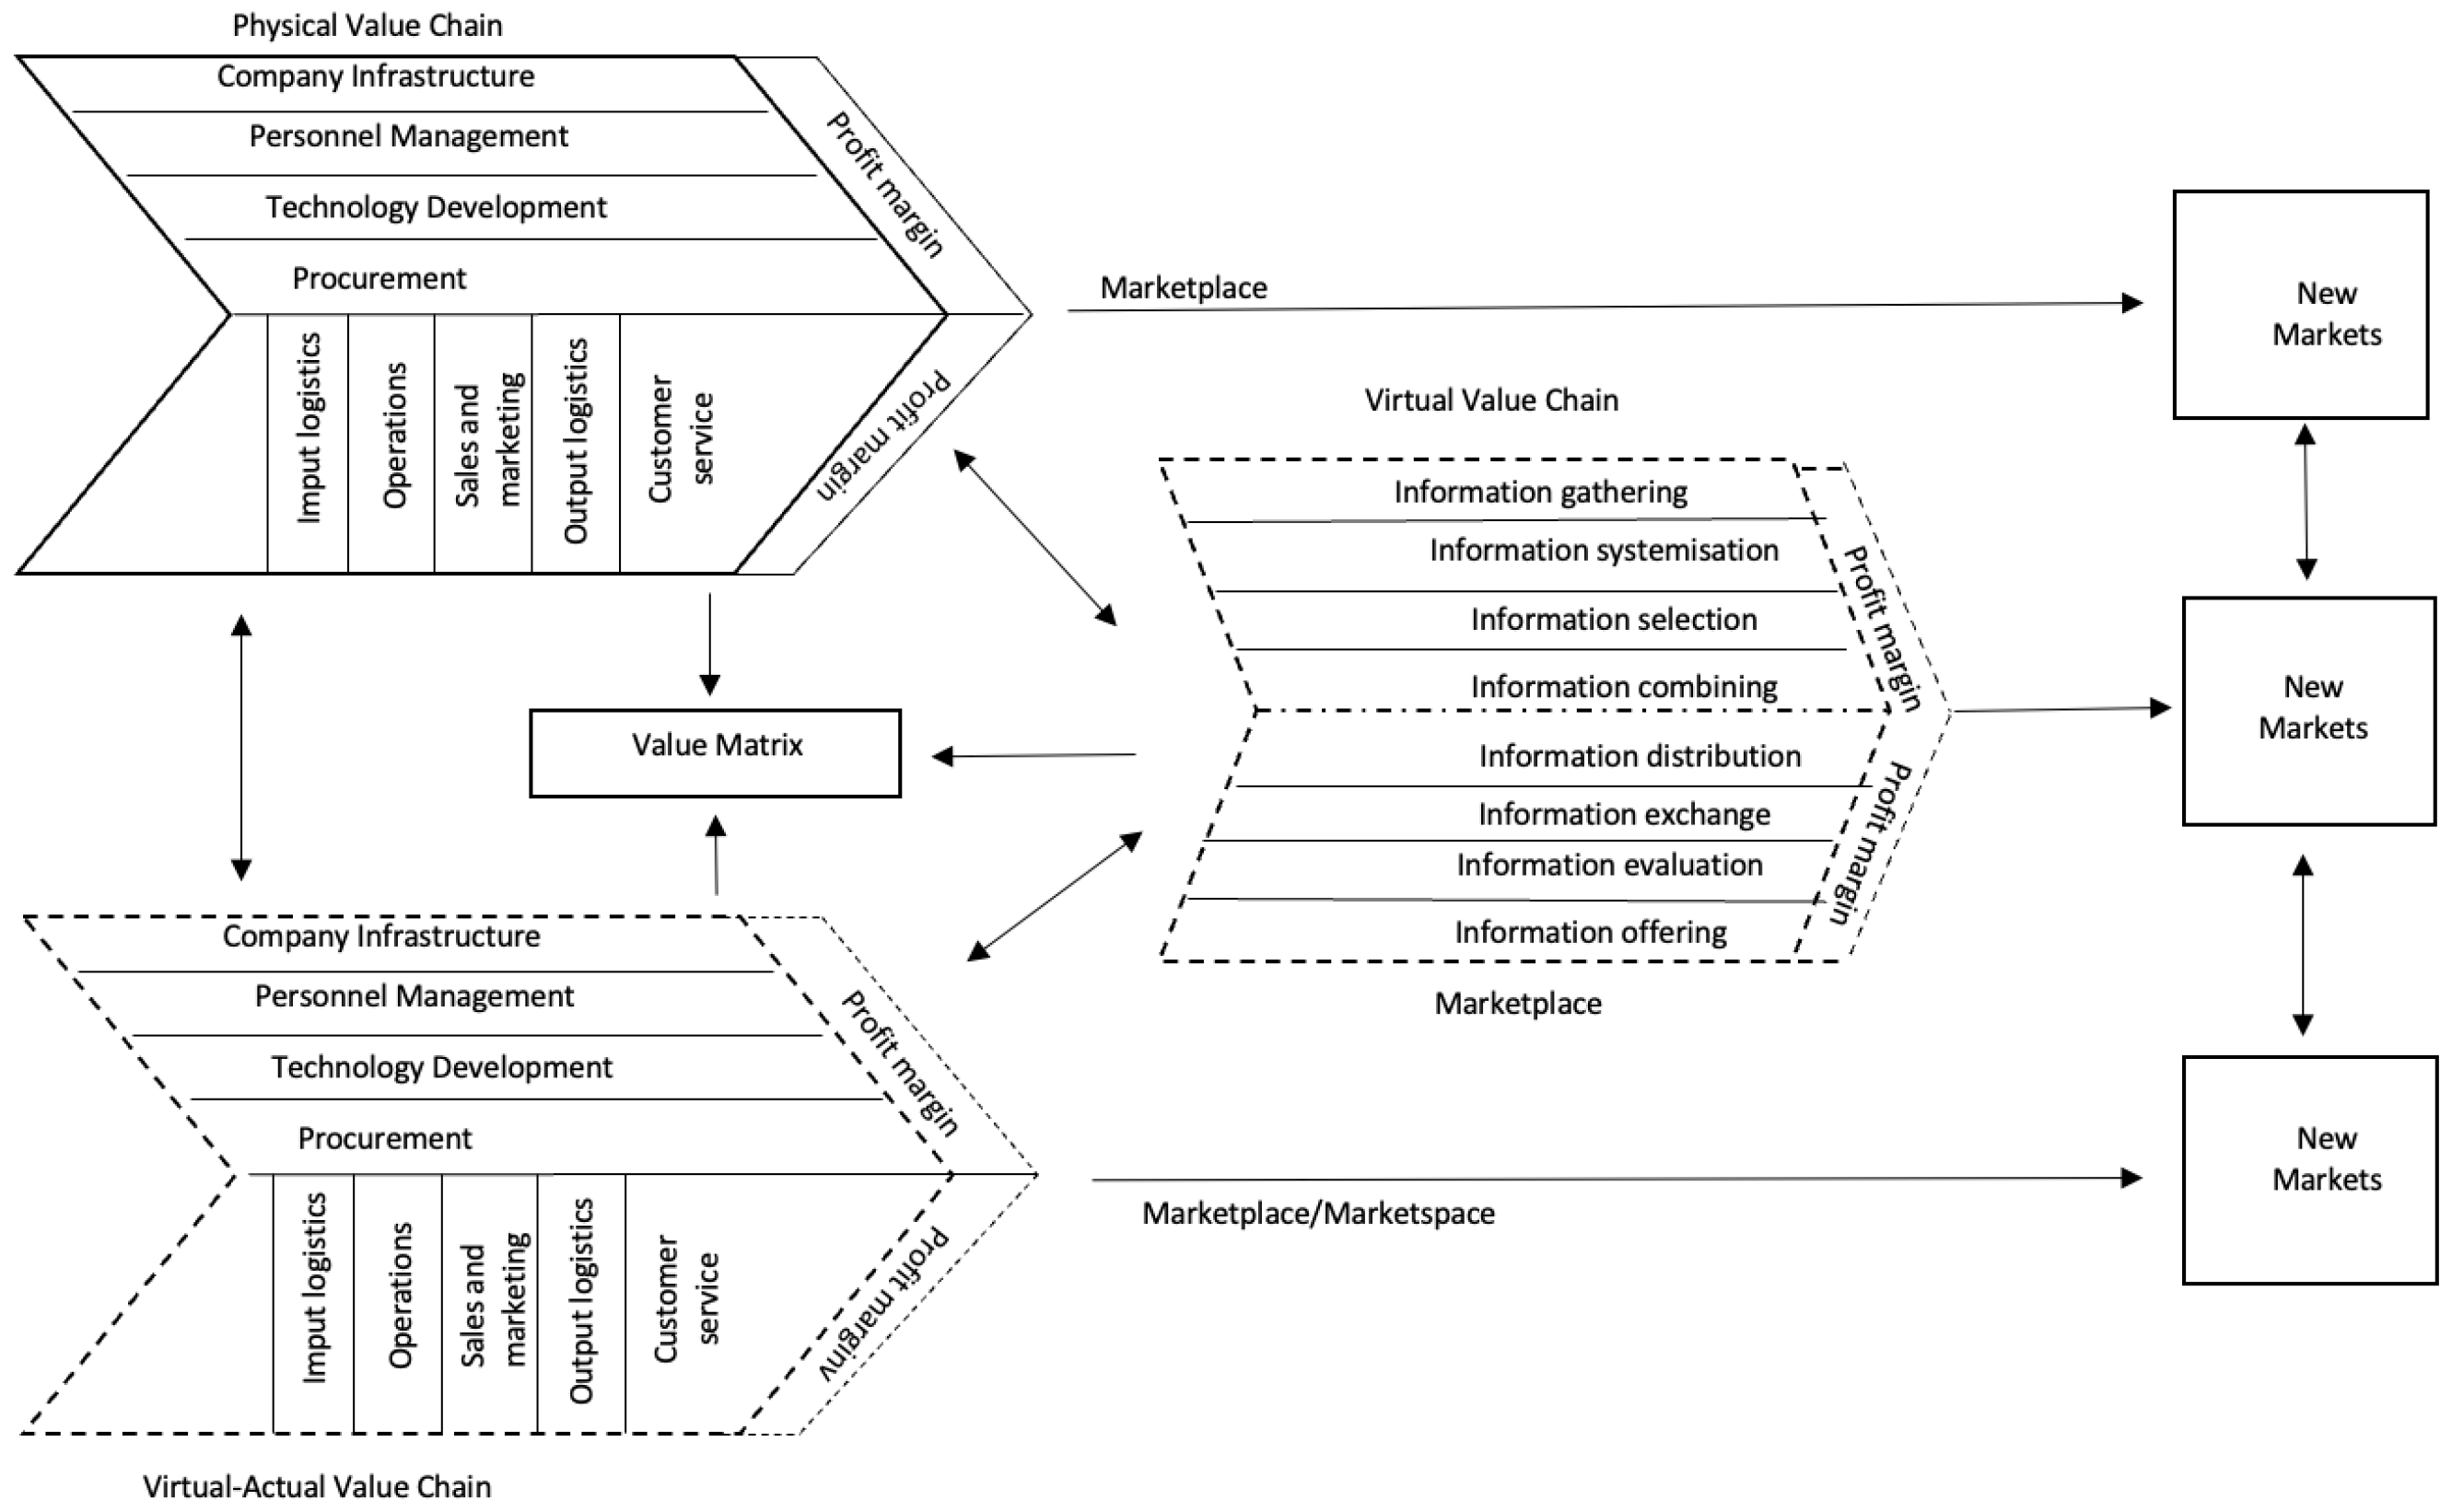
Figure 1. Virtual Value Chain. Source: Weiber and Kollmann [17].
Systems 13 00849 g001
Figure 2. Methodology for study. Source: Adapted from Sampieri [63].
Systems 13 00849 g002
Figure 3. Supply chain network diagram of a micro store. Source: Own elaboration.
Systems 13 00849 g003
Figure 4. Data visualization. Source: Own elaboration.
Systems 13 00849 g004
Figure 5. Matrix correlation. Source: Own elaboration.
Systems 13 00849 g005
Figure 6. Main effect plot: electronic payment vs. educational level.
Systems 13 00849 g006
Figure 7. Main effect plot: computerized inventory vs. age and educational level.
Systems 13 00849 g007
Figure 8. Main effect plot: sales on digital markets vs. educational level.
Systems 13 00849 g008
Figure 9. Main effect plot: website vs. age and educational level.
Systems 13 00849 g009
Figure 10. Results of the ML models and the baselines.
Systems 13 00849 g010
Table 1. Field studies in VVC.
AuthorLocationMethodologyCase StudyPurpose
Hongmei and Jincheng [40]ThailandSurvey and analytic hierarchy processTravel agencies (SMEs)Build a VVC for travel agencies
Ramantoko et al. [41]Indonesia340 questionnaires with 9 dimensionsSMEs in three different regions in Indonesia.Build a digital capability model, using the value chain analysis framework.
Corso et al. [39]Piedmont and LombardyQuestionnaire and cluster analysis127 Italian SMEs Contribute to sustainable organizations in terms of technology
Piscitello and Sgobbi [42]Prato ItalyEmpirical analysis and interviewingTextile industry (12 SMEs)Examining whether the industries are taking advantage of the e-business opportunities.
Arrifin et al. [43]MalaysiaFocus Group ApproachCattle beef and halal production (SMEs)The effectiveness of VVC in cattle beef production
Fromhold-Eisebith et al. [44]GermanyWorkshop with 40 textile industries Textile industriesEnablers’ identification of Industry 4.0 in the German textile industry
Gyenge et al. [45]HungarySurveys, clusters, and discriminant analysisSMEsGenerate directions for SMEs to benefit from communications changes
Hermawan et al. [46] IndonesiaMultivariate statistical study 168 consumers of online SMEsTo build an e-mail design concept that elaborates the physical and virtual value chain.
Hu et al. [47]United States of AmericaText mining data approach0.72 million online customer reviewsTo understand the Virtual Queue
Taherinia et al. [48]IranFactor analysis and structural equation modeling50 experts in marketing, management, e-commerce, human resources, and managers in IranEvaluate factors that influence the evolution of VC.
Zumstein et al. [49]SwitzerlandSurveys and descriptive statistics365 online retailersCompare practice before and after the COVID-19 station.
Liu et al. [50]ChinaCollection, processing, transmission, storage, and feedback1 companyUnderstand the path in the Virtual Chain considering digital technology.
Eng et al. [51]America, Europe, Africa, and AsiaSurveys, interviews, and hypothesis tests500 companies of different sizes that use logistic apparel retailers’ supply chains.Understand ambidexterity and wireless information technology (IT) for enhancing innovative capacity.
García-Salirrosas et al. [28]Perú, México and ColombiaKMO and Barlett test238 questionnaires from users of online clothing storesValidate an instrument design to measure Variable Value perception, purchase intention, trust, and satisfaction.
Omoruyi and Makaleng [52]South AfricaQuantitative study and SMART PLS 3.0439 SMEsTo determine if the supply chain has a disruption after COVID-19.
Sharma et al. [53]India30 experts from the electronic manufacturing of SMEsIdentify barriers for SMEs in adapting to the technologies of Industry 4.0Fuzzy analytic hierarchy and PROMETHEE.
Table 2. Details of company infrastructure, personnel management, technology development, and procurement processes.
DimensionAreaDescription
Company infrastructureSpace4 × 5 m2 or less, no additional space
Equipmentrefrigerators and shelves
Parkingno parking area
Personnel managementManagementthe owner themselves or family members
Employment1–2 external employees
Operationsassistance from suppliers (e.g., to accommodate shelves, etc.)
Technology (ICT4D)Inventory trackingcomputers (<10% of stores),
barcode readers,
mobile phones for calls and SMS to suppliers
Paymentelectronic payment with credit card,
bank transfer
CRMmobile phones with Internet connection
ProcurementSales trackingnotebook for tracking sales (<15% of stores)
Purchase trackingno record of available stock quantity
Payment termsmostly defined by large-scale supplier companies
Productspreferably more economical and fresh products
Supplier selectionpreferably wholesalers
(e.g., Walmart, Sam’s, City Club, Central, etc.) or
large-scale enterprises (e.g., Bimbo, Coca-Cola, etc.)
Delivery termsowned vehicles (e.g., automobiles or pick-up trucks),
rented vehicles (e.g., taxi) or
suppliers’ choice (e.g., truck, van, etc.)
Table 3. Analysis of variance change vs. gender, age, and education level.
SourceDFAdj SSAdj MSF-Valuep-Value
Regression83.56450.44561.970.052
    Gender10.58330.58332.580.110
    Age42.07710.51932.300.061
    Educational Level31.23150.41051.820.146
Error17840.23230.2260
    Lack-of-Fit222.81460.12790.530.957
    Pure Error15637.41770.2399
Total18643.7968
Table 4. Analysis of variance, electronic payment vs. gender, age, and educational level.
SourceDFAdj SSAdj MSF-Valuep-Value
Regression86.06730.758423.440.001
    Gender10.00490.004930.020.881
    Age41.39110.347781.580.182
    Educational Level34.73961.579867.170
Error17839.22680.22038
    Lack-of-Fit224.39140.199610.890.603
    Pure Error15634.83540.2233
Total18645.2941
Table 5. Analysis of variance, computerized inventory vs. gender, age, and educational level.
SourceDFAdj SSAdj MSF-Valuep-Value
Regression85.88380.73553.790
    Gender10.19240.19240.990.32
    Age42.71140.67793.50.009
    Educational Level32.21850.73953.820.011
Error17834.50120.1938
    Lack-of-Fit226.28540.28571.580.057
    Pure Error15628.21580.1809
Total18640.385
Table 6. Analysis of variance, sales on social media: payment vs. gender, age, and educational level.
SourceDFAdj SSAdj MSF-Valuep-Value
Regression80.62520.078150.370.934
    Gender10.49520.4952262.360.126
    Age40.02270.0056640.030.999
    Educational Level30.05680.0189260.090.965
Error17837.35340.209851
    Lack-of-Fit225.95940.2708821.350.15
    Pure Error15631.3940.201244
Total18637.9786
Table 7. Analysis of variance, sales on digital markets vs. gender, age, and educational level.
SourceDFAdj SSAdj MSF-Valuep-Value
Regression80.72810.091021.540.145
    Gender10.01270.012680.210.643
     Age40.09120.022810.390.818
    Educational Level30.65140.217143.680.013
Error17810.50180.059
    Lack-of-Fit221.74160.079171.410.117
    Pure Error1568.76020.05615
Total18611.2299
Table 8. Analysis of variance, website vs. gender, age, and educational level.
SourceDFAdj SSAdj MSF-Valuep-Value
Regression81.174060.146763.530.001
    Gender10.073720.073721.780.184
    Age40.889070.222275.350
    Educational Level30.264920.088312.130.099
Error1787.392780.04153
    Lack-of-Fit222.335640.106173.270
    Pure Error1565.057140.03242
Total1868.56684
Disclaimer/Publisher’s Note: The statements, opinions and data contained in all publications are solely those of the individual author(s) and contributor(s) and not of MDPI and/or the editor(s). MDPI and/or the editor(s) disclaim responsibility for any injury to people or property resulting from any ideas, methods, instructions or products referred to in the content.