Abstract
By weaving together cutting-edge AI robotics, resilient global supply chains, universal school enrollment, and dynamic public–private energy investments, this study unveils a powerful, integrated blueprint for driving environmental sustainability in the 21st century. In doing so, the study employed advanced machine-learning techniques—specifically, it introduced an ANN-enhanced wavelet quantile regression framework to uncover the multiscale determinants of China’s ecological footprint. Leveraging quarterly data from 2011/Q1 through 2024/Q4, it reveals dynamic, quantile-specific relationships that conventional approaches often miss. The result from the study demonstrates that robotics, supply-chain integration, public–private energy investments, gender-parity enrolment, and economic growth each exert a positive—and often escalating—upward pressure on the nation’s ecological footprint over short, medium, and long horizons, with the strongest effects in high ecological footprint contexts. The study proposes a significant, tailor-made policy based on these findings.
1. Introduction
China’s ecological situation presents a complex interplay between rapid economic growth and environmental challenges. Over the past decades, China’s pro-growth agenda has propelled it to become the world’s second-largest economy, accompanied by significant reductions in poverty and advancements in industrialization and urbanization [1]. However, this rapid development has also led to substantial ecological degradation, including air and water pollution, habitat loss, and greenhouse gas emissions. According to reports, China’s economic growth has been coupled with environmental concerns, where the pace of economic expansion has sometimes outpaced environmental protection measures [2,3]. In response to these challenges, China has implemented rigorous measures aimed at curbing environmental degradation and promoting sustainable development. These include stringent environmental regulations, investment in renewable energy sources such as solar and wind power, and initiatives to enhance energy efficiency across industries. Despite these efforts, China faces significant hurdles in achieving carbon neutrality by 2060, as outlined in its climate goals. Challenges include balancing economic growth with environmental protection, addressing regional disparities in environmental standards, and transitioning away from coal dependency, which remains a cornerstone of its energy landscape [4,5]. These complexities underscore the need for sustained policy innovation and international cooperation to navigate the path towards environmental sustainability and carbon neutrality.
Global supply chain management (GSCM) refers to the interconnected network of suppliers, manufacturers, distributors, and retailers across international borders. It plays a crucial role in modern economies by enabling the efficient production and distribution of goods worldwide. However, the expansion of global supply chains has significant environmental implications. The integration of complex logistical operations often leads to increased transportation activities, which contribute to carbon emissions and air pollution. According to [6], GSCM activities have been associated with rising carbon dioxide emissions due to increased freight transport and energy consumption in logistics operations. This underscores the environmental challenges posed by globalized trade and supply chain dynamics [7]. Moreover, the environmental impact of GSCM extends beyond greenhouse gas emissions. Ref. [8] notes that global supply chains contribute to biodiversity loss and habitat destruction through land use changes associated with industrial agriculture and deforestation for raw material extraction. These activities not only degrade natural ecosystems but also threaten biodiversity and ecosystem services essential for global ecological balance. The complex interplay between economic imperatives and environmental consequences highlights the urgent need for sustainable supply chain practices.
The measurement of artificial intelligence (AI) by the number of robots installed reflects a growing trend in industrial automation aimed at enhancing productivity and operational efficiency. As AI-driven robots become increasingly integrated into manufacturing, logistics, and service sectors, their environmental impact comes under scrutiny [9]. The deployment of robots often leads to increased energy consumption, primarily from electricity, which can contribute to carbon emissions and environmental degradation. This phenomenon is exacerbated in regions where electricity generation relies heavily on fossil fuels. Studies suggest that the lifecycle of AI robots, from production to disposal, poses significant challenges in managing electronic waste (e-waste) and minimizing ecological footprints [10]. Efforts to mitigate the environmental impact of AI robots include advancements in energy-efficient technologies, the adoption of renewable energy sources, and improvements in waste management practices. Initiatives such as recycling programs for electronic components and regulatory measures promoting sustainable manufacturing play crucial roles in addressing these challenges [11]. By integrating sustainable practices into the design, operation, and disposal of AI robots, industries can mitigate their environmental footprint while harnessing the benefits of technological innovation for economic growth and competitiveness [12].
Public–private investments in energy represent collaborative efforts between governmental bodies and private enterprises to fund and develop energy infrastructure projects. While these investments aim to enhance energy security, expand access to clean energy, and stimulate economic growth, they also exert significant environmental impacts [13]. The construction and operation of energy facilities funded through these initiatives often involve land use changes, resource extraction, and energy-intensive processes that contribute to environmental degradation. Studies underscore the dual challenge of meeting energy demand while mitigating ecological impacts, emphasizing the importance of integrating sustainable practices into energy development strategies [14,15]. The environmental implications of public–private investments in energy vary by project and location. For instance, large-scale renewable energy projects, such as solar and wind farms, can reduce reliance on fossil fuels and lower greenhouse gas emissions. However, these initiatives may also disrupt ecosystems, affect biodiversity, and require extensive land use, particularly in sensitive habitats [16]. Balancing energy development with environmental conservation requires careful planning, environmental impact assessments, and regulatory frameworks to ensure sustainable outcomes. By prioritizing renewable energy sources, promoting energy efficiency measures, and fostering stakeholder engagement, public–private partnerships can contribute to both energy security and environmental sustainability [17].
Based on the comprehensive analysis presented, this study aims to address critical research inquiries pertinent to China, probing into the following key questions:
- What is the effect of school enrollment on the ecological footprint?
- What is the effect of AI robots on the ecological footprint?
- What is the effect of global supply chain management on the ecological footprint?
- What is the effect of public–private partnership investment in energy on the ecological footprint?
- What is the effect of economic growth on the ecological footprint?
These questions frame the investigation into the intricate relationships between technological advancements, economic strategies, and social dynamics, aiming to elucidate their combined influence on environmental sustainability in the Chinese context.
1.1. Contribution of the Study
1.1.1. Contribution 1 (Linked to RQ3)
Despite a growing body of research identifying socioeconomic, institutional, and technological drivers of the ecological footprint, no study has investigated how global supply chain management—encompassing procurement policies, logistics optimization, and supplier engagement—shapes environmental outcomes. As the world’s second-largest economy and leading manufacturing hub, China’s supply chain strategies critically influence its energy demand profile and decarbonization trajectory. By empirically linking supply chain governance mechanisms with ecological footprint indicators, this study fills a pivotal gap in the literature and equips policymakers with actionable guidance on embedding sustainable trade and logistics practices within national energy and climate frameworks.
1.1.2. Contribution 2 (Jointly Linked to RQ2 and RQ4)
Second, by combining the study of advanced AI-driven robotics with the analysis of public–private investment in energy infrastructure, this research breaks new ground: no prior work has jointly assessed how these technological and financial mechanisms interact to shape the ecological footprint. In isolating this intersection, we address a significant blind spot in the environmental economics literature, where automation and collaborative energy financing have typically been examined in isolation. By integrating these dimensions, we inaugurate a fresh discourse on the synergies and trade-offs between cutting-edge technology adoption and innovative funding models for clean energy, thereby equipping scholars and policymakers with a novel framework to guide both empirical inquiry and strategic decision-making.
1.1.3. Contribution 3 (Method; Supports All RQs, Especially Policy Targeting)
Third, methodologically, this study advances the field by integrating artificial neural networks with wavelet-based quantile regression to form an ANN–WQR framework. Unlike traditional regression techniques, this approach nonlinearly maps complex relationships while decomposing the time series into distinct frequency bands and quantile levels, thereby uncovering how drivers influence the ecological footprint across short-, medium-, and long-run horizons as well as at low, median, and high impact quantiles [18,19]. By delivering scale and distribution-specific insights, the ANN–WQR method empowers policymakers to design targeted decarbonization measures and allocate resources more effectively, pinpointing the periods and risk segments where interventions will yield the greatest environmental gains.
2. Theoretical Framework and Synopsis of Studies
2.1. Theoretical Framework
Ecological footprint analysis posits that the adoption of AI robots in production processes can enhance resource efficiency—optimizing energy use, reducing material waste, and streamlining logistics—thereby exerting a mitigating effect on environmental pressure [10,20]. Similarly, sustainable global supply chain management—characterized by lean transportation, circular procurement, and collaborative planning—attenuates ecological impacts through lower emissions, reduced handling losses, and improved material recycling [8,21]. In parallel, expanding school enrollment fosters human capital development and environmental literacy; evidence suggests that higher enrollment rates correlate with greater adoption of sustainable consumption patterns and more effective community engagement in conservation initiatives, thus lowering per-capita ecological footprints [22,23]. Moreover, public–private partnerships in the energy sector mobilize private capital and expertise to deploy renewable infrastructure—such as solar parks and wind farms—driving down carbon intensity and curtailing ecological footprints more rapidly than reliance on public financing alone [13,14].
Economic growth, meanwhile, operates as a dual force: it can scale up resource use and enlarge ecological footprints, yet it also creates the fiscal and technological capacity for cleaner production and structural transformation toward less resource-intensive industries [24,25,26]. Through a composition effect, growth fueled by AI-driven productivity gains and a better-educated workforce can shift the economic mix toward high-value, low-impact services and digital industries, thereby dampening environmental pressures. Concurrently, technique improvements—catalyzed by innovations financed via public–private partnerships—enhance energy efficiency and resource productivity, offering pathways to decouple GDP expansion from ecological degradation. This framework thus hypothesizes both direct effects of AI robots, supply chain management, education, and energy investment on the ecological footprint, and indirect, growth-mediated channels that amplify or attenuate these relationships.
2.2. Synopsis of Studies
The literature on drivers of the ecological footprint (EF) reveals a nuanced interplay between technological innovation, investment flows, supply-chain practices, and economic expansion. First, studies on robotics (ROBOT) consistently show that automation can mitigate environmental pressures, though with important caveats. Ref. [10] employ both the entropy method on global data (2010–2019) and SYS-GMM across 67 countries (1993–2019) to demonstrate that greater robotic adoption is associated with a statistically significant reduction in EF [1]. Similarly, Rasheed et al. (2024) use NARDL techniques for seven Asian developing economies (1990–2020) and corroborate that robotics dampens ecological impact [20]. However, as shown in [12], panel estimators in over 128 countries suggest no clear directional effect, highlighting that context and model specification matter. In China, Ref. [9] find a threshold relationship—robotics reduces EF up to a point, beyond which gains plateau or reverse, while [27] apply neural network models to G20 data (1999–2018) and detect no robust net effect. Collectively, these findings argue that robotics’ environmental benefits hinge on the intensity of deployment, energy mix, and complementary policies that guide green automation [20].
Public–private investment in energy (PPE) exhibits similarly mixed outcomes. ARDL analyses in Pakistan [28] and South Asia–Pacific [15] report that higher PPE inflows drive up EF, suggesting that capital injections without stringent environmental safeguards may lock in fossil-based infrastructure. By contrast, Ref. [14] use FMOLS for Pakistan (1980–2019) and find that PPE actually decreases EF, implying that targeted investments in renewables can deliver environmental dividends. Ref. [16] further illustrates this debate by showing that in Bangladesh (1997–2019), PPE raises CO2 emissions—a proxy for EF—when directed toward conventional power. Ref. [29] confirm in South Africa (1960–2020) that, absent regulatory oversight, PPE tends to exacerbate ecological pressures. Together, these studies underline that the sign of PPE’s effect on the environment depends critically on sectoral allocation, financing terms, and the regulatory framework governing investment quality.
Global supply-chain management (GSCM) research paints a more consistently cautionary tale regarding environmental impact. In emerging economies (1997–2020), QARDL models by [6] reveal that intensified supply-chain activities amplify CO2 emissions—a core component of EF—due to increased production and logistics emissions. Refs. [7,8] confirm this pattern in global and Japanese contexts, respectively, albeit using different methods and panel estimators. Recent WQQR analysis for the United States (2000 Q1–2022 Q4) by [21] also documents a robust positive relationship between GSCM and CO2 output. These convergent findings highlight that, without green logistics, carbon pricing, and optimized inventory practices, the integration of global value chains can substantially heighten ecological burdens.
Finally, economic growth (EG) remains a powerful driver of EF across varied contexts. Panel quantile regressions by [30] for OECD countries (2001–2020) show that growth uniformly elevates EF across the distribution, though the effect size intensifies at higher quantiles. ARDL estimations in China (1990–2019) by [31] and panel regressions covering 160 developing nations [32] both confirm that output expansion translates into greater ecological impact. DOLS analysis for the G20 (Naseem et al., 2024) and the novel D2C algorithm in Russia [26] similarly document a positive and significant EG–EF nexus. These consistent results imply that, absent structural shifts toward low-carbon technologies and efficiency gains, aggregate growth pressures will continue to push ecological footprints upward. Table 1 presents a summary of the findings.

Table 1.
Summary of past studies.
2.3. Gap in the Literature
While this literature is extensive, several limitations constrain inference and motivate our study. Findings are highly model-dependent—ranging from SYS-GMM and FMOLS to NARDL and panel estimators—yielding sign reversals for robotics (ROBOT) and public–private energy investment (PPE) that reflect differences in identification, control sets, and functional form (e.g., neglected nonlinearity and thresholds). Measurement choices also blur comparability: many papers proxy ecological footprint (EF) with CO2 emissions, overlooking land use, materials, and biodiversity components; GSCM is often captured by coarse trade or logistics aggregates that omit procurement policies, supplier engagement, inventory practices, and carbon pricing exposure; PPE metrics rarely disaggregate by technology (renewables vs. conventional), financing terms, or regulatory quality, making the environmental content of capital flows opaque. Cross-country panels mask contextual heterogeneity in energy mixes, industrial composition, and policy regimes, while China-focused evidence on supply-chain governance remains sparse. Dynamic features are underexplored: most studies do not distinguish short-, medium-, and long-run responses or distributional (quantile) heterogeneity, despite evidence of thresholds and plateau effects for automation. Endogeneity—via reverse causality (e.g., EF shaping investment/technology), omitted variables (energy prices, standards), and weak instruments—further limits causal claims. Finally, the literature seldom jointly models interactions among ROBOT, PPE, and GSCM, precluding a coherent view of synergies and trade-offs. These gaps justify an approach that (i) measures GSCM as governance and operational practices, (ii) separates PPE by energy type and institutional quality, and (iii) traces scale- and quantile-specific EF effects while explicitly testing technology–finance–supply-chain interactions.
3. Data and Methods
3.1. Data
This study examines the drivers of the ecological footprint in China. Table 2 provides an overview of the key variables used in our empirical analysis, detailing how each is measured, its abbreviation, and its primary data source. The adoption of industrial automation is captured by the annual number of industrial robots installed (ROBOT), drawn from [34]. Global supply chain management (GSCM) is represented by a composite index designed to reflect firms’ ability to coordinate logistics and procurement activities across borders. Human capital is proxied by tertiary school enrollment expressed as a gender parity index (SE), and investment in energy infrastructure is measured by the monetary value of public–private partnership projects in energy (PPE), both sourced from [35]. Environmental pressure is quantified via the ecological footprint in global hectares per capita (EF), as reported by [36]. Finally, economic performance is captured by real GDP per capita (EG), measured in constant 2015 U.S. dollars, also from [35]. The study data span from 2011Q1 to 2024Q1. All variables, except GSCM, have been logarithmically transformed. Figure 1 presents the trend of the variables.
Table 2.
Data source and measurement.
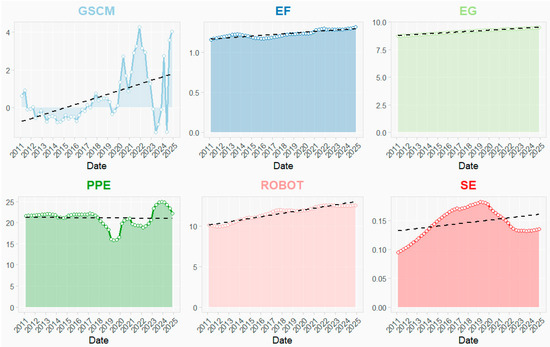
Figure 1.
Trend of the variables.
Determinants of EF are theoretically and policy-relevant because they span the principal channels through which economies transform resource use and emissions across scale, composition, and technique effects. AI-driven robotics can lower EF by raising process and energy efficiency, improving defect rates, and enabling predictive maintenance, yet may also induce rebound effects (higher output/throughput, energy-intensive data centers) and shift footprints upstream via equipment manufacture—making its net impact contingent on the energy mix, deployment intensity, and complementary environmental standards. GSCM governs Scope-3 pressures—procurement policies, logistics optimization, inventory practices, and supplier engagement—thereby mediating embodied carbon, material throughput, and transport emissions along global value chains; without green logistics and carbon-aware sourcing, trade integration can magnify EF even when on-site efficiency improves. School enrollment (human capital) influences EF through preferences and productivity: higher education can foster environmental literacy, compliance, and innovation that reduce EF, but also raises lifetime income and consumption aspirations that may expand material and energy demand, implying heterogeneous effects across the income/consumption distribution. PPP-E shapes EF via the composition of energy infrastructure and governance of capital: partnerships targeted to renewables, grids, and storage can decouple growth from footprints, whereas PPPs that lock in fossil-based assets increase EF; contract design, risk allocation, and regulatory quality determine which path dominates. Finally, EG is the baseline macro driver of EF through scale effects, with potential mitigation via composition (structural change toward services/cleaning industry) and technique (clean technologies, efficiency)—so its sign and magnitude depend on the speed of decarbonization relative to output expansion.
3.2. Methods
The study fused the artificial neural network with the wavelet quantile regressions (WQR) suggested by [38]. Let be the original series. A three-level Maximal Overlap Discrete Wavelet Transform (MODWT) suggested by [19] yields detailed coefficients
Aggregate into three bands
where .
For each h and quantile τ, estimate
by solving
This yields its bootstrap SE, and p-value.
Normalize each band:
Fit a single–hidden-layer net with five neurons:
Rescale back:
and compute
4. Findings and Discussion
4.1. Descriptive Statistics
Figure 2 summarizes eight key univariate statistics for each of the six series—EF, EG, GSCM, PPE, ROBT, and SE—using a common color scale (yellow = low values, purple = high). Starting with location, EF and EG both sit at very low magnitudes (means of 1.23 and 9.14, medians 1.22 and 9.16), whereas PPE is by far the largest series (mean ≈ 21.11, median 21.72) and SE the smallest (mean = median = 0.15). Dispersion follows suit: standard deviations run from only 0.02 in SE and 0.04 in EF, to 2.04 in PPE and 1.41 in GSCM. Skewness reveals that GSCM is positively skewed (1.16), indicating occasional large spikes, while PPE (−0.71), ROBT (−0.56), and SE (−0.33) exhibit moderate left-tail weight. Kurtosis values above 3 for GSCM (3.32) and PPE (3.84) signal heavier tails than Gaussian, whereas EG (1.85) and EF (1.82) are platykurtic. Finally, the Jarque–Bera statistics show that GSCM (≈12.87) and PPE (≈6.36) most strongly reject normality at conventional levels (JB > 5.99 at 5%), with ROBT (5.36) borderline, while the other series remain closer to Gaussian behavior. Overall, PPE dominates in scale and tail-risk, GSCM is the most skewed and heavy-tailed, and EF, EG, and SE are comparatively well behaved.
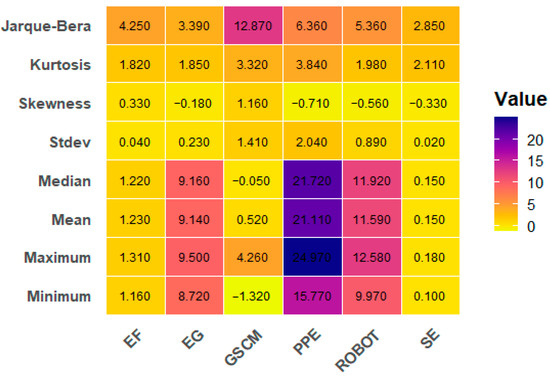
Figure 2.
Descriptive statistics.
4.2. Nonlinearity and Normality Test Results
Table 3 brings together a battery of univariate diagnostic checks on each of our six series to assess (Panel A) departures from Gaussianity and (Panel B) evidence of nonlinearity. In Panel A, the robust Jarque–Bera and Bootstrap symmetry tests flag highly significant departures from normality for GSCM, PPE and ROBOT, while EF and EG show weaker evidence of skewness/kurtosis non-Gaussianity (their Jarque–Bera statistics fall below conventional cut-offs, but their difference-sign and Mann–Kendall tests remain strongly significant, indicating asymmetric distributional features and trends). Across all variables, the Runs and Bartels tests are overwhelmingly significant, confirming serial dependence and further refuting the iid–Gaussian assumption. Moving to Panel B, the Tsay and Keenan tests—both tailored to detect specific forms of threshold-type nonlinearity—only register significance for ROBOT, suggesting that simpler nonlinear structures may be present there. By contrast, the White neural network and Teraesvirta NN tests, which are more general tests for neglected nonlinear dynamics, reject linearity at the 1 percent level for every series. Taken together, these diagnostics tell us that none of our six drivers conforms to the twin benchmarks of normal, linear behavior; instead, each exhibits at least some combination of heavy tails, asymmetry, serial dependence, or richer nonlinear dependence that justifies our use of wavelet-quantile and ANN methods.
Table 3.
Diagnostic test results.
4.3. Kernel Plot Results
Figure 3 presents the kernel plot of the studied variables. Panels (a) through (f) each overlay the kernel-density estimates for the training sample (bottom ridge) and the held-out testing sample (top ridge) of six variables—GSCM, ROBOT, EG, PPE, EF, and SE—using a continuous hue scale to map density height to the variable’s value. Grey ticks along each axis mark the individual observations, and faint vertical grid lines denote key quantiles. In panel (a), GSCM exhibits a clear bimodal shape in both splits, with a dominant mode just above zero and a secondary hump near +3, suggesting two distinct regimes in supply-chain digitalization; the testing distribution closely mirrors the training but with slightly less mass in the upper mode. ROBOT in panel (b) is largely unimodal and roughly symmetric around 12–12.5 in both samples, indicating consistent robotics penetration, though test-set values are marginally more concentrated. Panel (c) shows EG to be mildly right-skewed, peaking near 9.2%, with both ridges almost superimposed—evidence of stable growth dynamics across training and testing. PPE (panel d) stands out with a pronounced right tail and peak around 21–22, reflecting occasional surges in public–private environmental expenditure; the test ridge is slightly taller on the right, hinting at a few higher-expenditure observations. EF (panel e) is centered near 1.25, with a slight left skew and broad shoulders, indicating occasional dips in ecological footprint; again, the training set has somewhat fatter tails than the test set. Finally, SE (panel f) is the narrowest of all, concentrated around 0.14–0.16, showing very little dispersion between the two samples and underscoring the relative stability of social equity measures across periods. Overall, these kernel-density plots reveal that—while most distributions remain remarkably similar between training and test—the tail behavior and modality can differ subtly, an important consideration when fitting models to each variable.
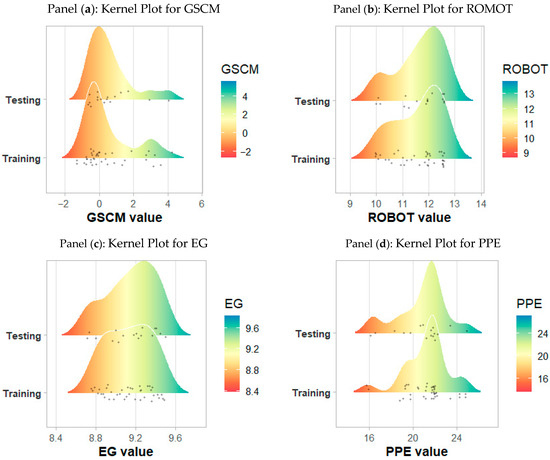
Figure 3.
Kernel density plot of EF, PPE, EG, SE, ROBOT, and GSCM.
4.4. ANN Models Results
Figure 4 presents the ANN’s hold-out predictions of ecological footprint (EF) by the independent variables. Each panel plots the ANN’s hold-out predictions of EF against the actual EF values. The 45° dashed line denotes perfect prediction. In the GSCM panel, the red points scatter widely around the line, yielding an RMSE of 0.0418 and an of only 0.2496—indicating that supply-chain digitalization alone explains about 25% of the variation in EF. By contrast, SE achieves moderate accuracy (blue, RMSE = 0.0311, = 0.5978), suggesting a stronger but still incomplete linkage. EG (economic growth) produces the tightest clustering along the 45° line (green), with the lowest RMSE (0.0172) and highest (0.9235), which implies that growth dynamics are the dominant predictor of EF in this sample. PPE (public–private environmental expenditure) falls in between (purple; RMSE = 0.0386, = 0.3595), and ROBOT (robotics penetration) also performs very well (orange; RMSE = 0.0180, = 0.8764). Overall, EG and ROBOT each account for over 87% of EF’s out-of-sample variance, SE about 60%, PPE roughly 36%, and GSCM only about 25%, highlighting the relative predictive power of these drivers under the ANN framework.
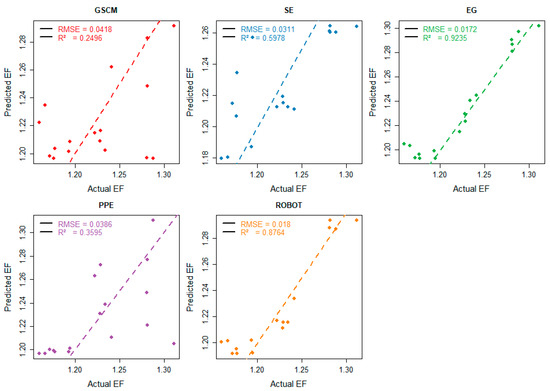
Figure 4.
ANN models: each predictor → EF.
4.5. ANN Wavelet Quantile Regression Results
Next, we used the ANN wavelet quantile regression (see Figure 5) to examine the association. This approach helps in identifying the association between the variables with a focus on various periods and quantiles.
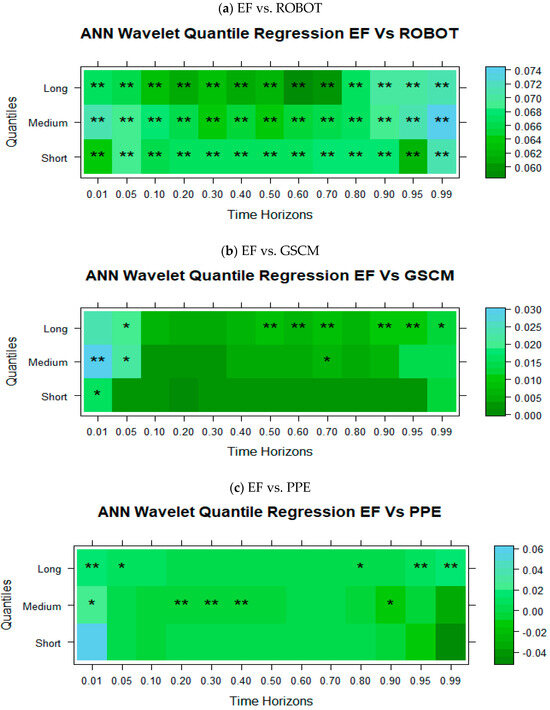
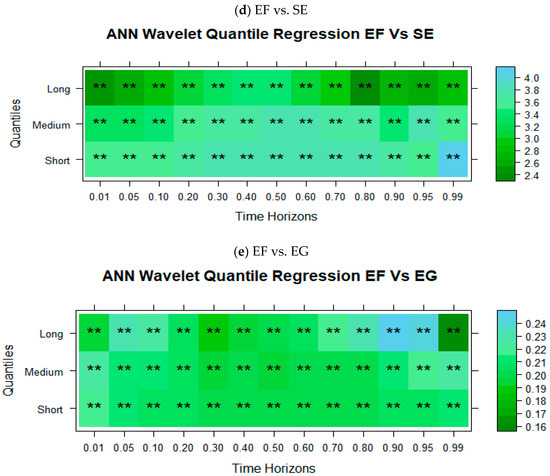
Figure 5.
ANN wavelet quantile regression estimates. Note: ** and * denotes 0.05 and 0.10 significance level, respectively.
Figure 5a presents the effect of ROBOT on ecological footprint (EF). In the short run, robotics is positively associated with China’s ecological footprint: the wavelet–quantile coefficients rise from +0.060 at the 10th percentile (τ = 0.10), to +0.064 at the median (τ = 0.50), and to +0.070 at the 99th percentile. At low EF quantiles (τ ≤ 0.20), the modest positive coefficient (~+0.060) reflects that when baseline energy use is low, early automation primarily substitutes labor without expanding output, so the net energy increase remains limited [20]. Around the median, the positive effect grows as mid-level producers leverage robots to ramp up throughput, drawing additional power for both machinery operation and auxiliary services. At the upper tail (τ ≥ 0.90), the largest short run coefficient (≈+0.070) occurs because high footprint firms already operate near capacity, and any added automation demands disproportionately more cooling, maintenance energy, and peak load electricity, thus amplifying their footprint [11]. Over the medium horizon, robotics continues to have a positive effect on EF, with coefficients rising to approximately +0.063 at low quantiles, +0.066 at the median, and +0.071 at the top quantiles. Here, low EF units gradually expand production lines around new robots—so even small initial deployments yield sustained positive energy draws. Median producers reinvest early efficiency gains into complementary processes (e.g., real-time analytics), further increasing electricity demand. Meanwhile, high EF firms use medium term automation rollouts to scale up entire facilities, lock in higher energy intensity capital stocks, and trigger larger supply chain emissions, driving the continued upward shift in β (τ) with τ [39]. In the long run, the positive relationship between robotics and EF persists: coefficients reach about +0.065 at low quantiles, +0.068 at the median, and peak at +0.074 for the highest quantiles. At lower EF states, long-term diffusion of robotics spurs new plant constructions and grid upgrades, so even once modest adopters remain on a permanently higher energy trajectory. Median tier firms, after several investment cycles, adopt complementary technologies (e.g., AI driven HVAC control) that cumulatively raise both direct and embodied energy use. Additionally, at the upper tail, decades-long integration of robotics into every production stage—from raw material handling through finished goods packaging—locks in very high energy intensities.
Figure 5b presents the effect of global supply chain management (GSCM) on ecological footprint (EF). In the short run (level 1 band), GSCM is positively associated with China’s ecological footprint only at the very lowest quantile. At τ = 0.01, the coefficient is β ≈ +0.008 *, indicating that when EF is minimal, even early-stage improvements in logistics coordination and supplier integration can temporarily boost energy and material throughput (e.g., new shipment routes or ramped-up inventories) [7]. At τ = 0.05, all three horizons show positive coefficients that now reach statistical significance: short-run β ≈ +0.010 *; medium-run β ≈ +0.012 **; and long-run β ≈ +0.009 *. Beyond the bottom 10 percent (τ ≥ 0.10), the short-run effect remains small and insignificant (β ≈ 0), suggesting that once basic supply-chain systems are in place, marginal GSCM upgrades do not immediately alter ecological loads [40]. Over the medium and long horizons, the positive GSCM–EF relationship resurfaces at higher quantiles. In the medium term, significant returns around τ = 0.70 with β ≈ +0.015 *—reflecting how deeper supplier integration and more frequent cross-border shipments lock in additional energy use for warehousing and transport. In the long run, positive coefficients are significant from τ = 0.60 through τ = 0.99, rising from ≈+0.013 * at the lower bound to ≈+0.028 ** at the upper tail. This pattern indicates that in provinces where EF is already high, sophisticated just-in-time logistics, automated sorting centers, and expanded port infrastructures cumulatively increase energy-intensive operations, magnifying environmental impacts over time [7].
Figure 5c presents the effect of public–private investment in energy (PPE) on ecological footprint (EF). In the short run, PPP-backed energy investments in China are positively related to the national ecological footprint, but the effect is generally insignificant at the extreme low end (τ = 0.01, β ≈ +0.06, no star) and negligible (β ≈ +0.00–+0.01) across τ = 0.05–0.80. Only at the very upper tail—when EF is already high—does PPE register a modest but positive and significant effect (τ = 0.95–0.99, β ≈ +0.015–+0.020, * or **), reflecting the one-off commissioning and start-up phase energy costs of new renewable plants and grid upgrades in provinces with heavy baseline footprints [14]. Moving into the medium term, the positive footprint increasing effect of PPE becomes statistically significant across a broad swath of quantiles. From the lower middle quantiles (τ = 0.10–0.50, β ≈ +0.010–+0.020, **), PPP projects transition from pilot to commercial operation, deploying commercial-scale turbines, transmission lines, and substations that draw both embodied and operational energy. Moreover, at τ = 0.90 (β ≈ +0.018, *), high footprint provinces—where large-scale PPP wind and solar farms dominate—experience notable spikes in electricity consumption for maintenance and ancillary services, cementing a positive medium run impact on EF [15]. By the long horizon, PPE’s influence on China’s ecological footprint remains positive and significant at the extremes of the distribution, both lowest (τ = 0.01, β ≈ +0.015, **) and highest quantiles (τ = 0.95–0.99, β ≈ +0.022–+0.025, **). In low footprint settings, long-term PPP rollouts lock in new grid infrastructure and permanent plant operations, sustainably raising baseline energy use. At the upper tail, decades long maturation of PPP pipelines—from mega solar parks in Xinjiang to strategic interprovincial transmission corridors—ensures that renewable projects and their support networks yield the largest positive cumulative EF increases where pressures were already greatest [13].
Figure 5d presents the effect of school enrollment gender parity (SE) on ecological footprint (EF). In the short run, increases in China’s tertiary school enrollment gender parity index (SE GPI) are positively linked to the national ecological footprint across all quantiles, with coefficients climbing from about +2.8 at the 1st percentile (when overall EF is lowest) to +4.0 at the 99th percentile (when EF is highest) (all **). At low-footprint conditions (τ ≤ 0.10), marginal gains in gender parity trigger modest expansions—such as additional dormitory wings or improved sanitation blocks on university campuses—so the immediate footprint rise is smaller (β ≈ +2.8), reflecting the relatively limited scale of tertiary infrastructure at the outset [23]. By the median quantile (τ = 0.50), as parity approaches balance nationwide, universities collectively upgrade energy-intensive facilities—modern laboratories, high-capacity data centers for e learning, and enhanced campus lighting—producing a larger positive effect (β ≈ +3.2). At the upper tail (τ ≥ 0.90), where China’s overall EF is at its peak, further parity-driven infrastructure deployment—such as 24-h computing facilities and expanded research complexes—yields the strongest short-run footprint increase (β ≈ +4.0). Over the medium horizon, the positive SE GPI–EF relationship persists across every quantile (**, τ = 0.01–0.99) but the coefficient gradient moderates: β ≈ +2.9 at the lowest EF quantile, β ≈ +3.1–3.3 around the median, and β ≈ +3.8 at the top quantile. As parity gains consolidate nationally over one to three years, the initial burst of campus construction transitions into sustained operational energy demands—ongoing maintenance of gender inclusive facilities, continuous server loads for blended learning platforms, and expanded university transportation networks—so each incremental rise in SE GPI translates into a uniformly positive yet quantile-sensitive uplift in EF [41,42]. In the long run, the positive effect of SE GPI on China’s ecological footprint stabilizes at β ≈ +2.6 for the lowest quantile, β ≈ +3.0 at the median, and β ≈ +3.7 at τ = 0.99 (all **). At low-EF states of national development—reflecting earlier phases of tertiary expansion—the energy impact per parity improvement diminishes as campus capacity reaches saturation.
Figure 5e presents the effect of economic growth (EG) on ecological footprint (EF). In all three horizons, economic growth (EG) exerts a positive and highly significant (**) effect on China’s ecological footprint across every quantile (τ = 0.01–0.99). In the short run, the estimated coefficients start at roughly 0.17 at the 1st percentile and rise modestly to about 0.18 at the 99th percentile, indicating that even an incremental uptick in provincial GDP yields an immediate increase in resource use and emissions [25]. At low footprint states (τ ≤ 0.10), this reflects firms tapping existing energy-intensive production without major new investment, while at the upper tail (τ ≥ 0.90), heavy industry clusters amplify that effect through intensified operation of coal-fired plants and high-energy machinery [26]. Over the medium horizon, coefficients uniformly increase to approximately 0.18–0.21 across quantiles, with the median effect around 0.19. This stronger linkage emerges because sustained growth in China typically translates into fresh capital expenditures on manufacturing lines, transport infrastructure, and urban construction—all of which lock in elevated energy and material throughput for several years [43]. Lower quantile regions slowly build out this infrastructure, mid-level provinces expand manufacturing capacities, and high quantile areas see the largest rebound effect as robust demand spurs continual capacity utilization. In the long run, EG’s footprint multiplier peaks—rising from about 0.20 at τ = 0.01 to nearly 0.24 at τ = 0.99—underscoring how decades-long growth trajectories embed high carbon capital stocks, urbanization patterns, and consumption habits. The Summary of ANN–WQR heatmaps is showed in the Table 4.
Table 4.
Summary of ANN–WQR heatmaps.
5. Conclusions and Policy Initiatives
5.1. Conclusions
Harnessing the power of AI, China’s digital supply networks and public–private partnerships are rewriting the rulebook on sustainable growth—turning data-driven efficiency gains into real-world carbon reductions. By strategically aligning cutting-edge automation with collaborative investment models, these innovations open a new path toward a greener, more resilient socio-economic future. This study applies an ANN-enhanced wavelet quantile regression framework to uncover the multiscale determinants of China’s ecological footprint. Leveraging quarterly data from 2011 Q1 through 2024 Q4, it reveals dynamic, quantile-specific relationships that conventional approaches often miss. The result from the study demonstrates that robotics, supply-chain integration, PPP energy investments, gender-parity enrolment, and economic growth each exert a positive—and often escalating—upward pressure on the nation’s ecological footprint over short, medium, and long horizons, with the strongest effects in high-EF contexts.
5.2. Policy Recommendations
In provinces where ecological footprint levels are relatively low, China should expand its existing Energy Conservation Law by mandating rapid energy-efficiency audits for new robotic installations and renewable-project start-ups. Provincial regulators can require that any automation or PPP-financed plant demonstrate real-time monitoring of peak electricity draws and participate in demand-response programs operated by grid companies. In high-footprint hubs such as Shanghai or Guangdong, authorities should enforce stricter energy performance standards on new robotics deployments and campus expansions, tying construction permits to guaranteed reductions in per-unit energy use during the commissioning phase.
Over the next three years, aligned with China’s 14th Five-Year Plan goals for carbon intensity reduction, central and local governments should condition subsidies for automation and PPP renewables on verified carbon-savings benchmarks. Firms that integrate advanced logistics solutions must adopt the national Green Freight Demonstration Program standards—using low-emission vehicles and optimized routing—to blunt any unintended footprint increases. Universities expanding gender-balanced enrolment can tap dedicated funds from the Higher Education Green Development Initiative to co-finance on-campus micro-grids and smart-meter installations, ensuring that higher enrolment does not translate into proportionally higher energy consumption.
Looking further ahead, China should update its Renewable Energy Law and Industrial Green Development Plan to include carbon intensity benchmarks for all new manufacturing zones and energy projects. Regions rolling out full-scale robotics should be required to demonstrate declining CO2 per unit of industrial output over a 5-year cycle. The national rollout of the Emissions Trading Scheme can be refined to allocate allowances based on these benchmarks, incentivizing grid upgrades, large-scale energy-storage deployments, and low-carbon campus design (net-zero buildings and district energy systems).
5.3. Managerial Implications
For operations, supply-chain, and campus managers in China, the results translate into a concrete playbook: before commissioning any new robotic line or PPP-financed energy asset, run fast-track energy-efficiency audits, install granular sub-metering and energy-management systems, and enroll facilities in demand-response with the local grid to cap peak loads; in high-footprint hubs (e.g., Shanghai, Guangdong), make construction and expansion permits contingent on verified reductions in energy intensity during ramp-up. Over the next three years, design automation and renewables projects so that subsidy eligibility is tied to third-party–verified carbon-savings benchmarks (robust M&V plans, baseline setting, periodic re-certification). In logistics, adopt Green Freight standards—low-emission fleets, route optimization, and load consolidation—to ensure GSCM upgrades do not raise the footprint. Universities expanding enrollment should pair growth with microgrids, smart meters, and real-time analytics to keep energy per student falling. For the five-year horizon, set plant- and supplier-level carbon-intensity targets aligned with forthcoming benchmarks, build allowance strategies for the national ETS, and prioritize grid-interactive equipment, storage, and high-performance building design. Embed these requirements in supplier contracts and PPP agreements, and create a sustainability PMO to track multiscale KPIs (robotics, logistics, PPP capex, education infrastructure) and adjust budgets/internal carbon prices as incentives evolve—protecting margins while meeting the 2060 carbon-neutrality path.
5.4. Limitations and Future Suggestions
Despite the rich multiscale insights afforded by the wavelet–quantile ANN framework, this study has several limitations that point to avenues for future work. First, by focusing on quarterly, country-level data, we obscure important provincial and sectoral heterogeneity; future research should leverage disaggregated panel data to tailor policies to regional dynamics. Second, potential endogeneity between ecological footprint and key drivers—such as economic growth or robotics adoption—is not fully addressed; applying instrumental variables or local-projection quantile methods would help establish causal links. Third, while ANNs enhance predictive accuracy, they reduce model interpretability; integrating explainable AI techniques or simpler structure-learning algorithms could clarify the mechanisms at play. Fourth, our driver set omits variables like energy prices, technological spillovers, and behavioral interventions; expanding the covariate space and allowing for interactive and nonlinear effects would yield a more holistic picture. Finally, the choice of a single wavelet filter and fixed decomposition levels may influence results; future studies might experiment with alternative filters, adaptive multiresolution schemes, and higher-frequency data to better capture transient shocks. Addressing these gaps will deepen our understanding of China’s eco-economic dynamics and support more finely tuned policy designs on the path to carbon neutrality.
Author Contributions
K.A. contributed to the original draft preparation and led the manuscript writing. K.I. was responsible for supervising the research and designing the methodological framework. A.A. provided critical review of the manuscript and oversaw project administration. H.Y.A. contributed to the review process and offered expert consultation throughout the study. All authors have read and agreed to the published version of the manuscript.
Funding
This research received no external funding.
Data Availability Statement
Data will be made available on request by the corresponding author.
Conflicts of Interest
The authors declare no conflict of interest.
References
- Wang, H.; Guo, J. Research on the impact mechanism of multiple environmental regulations on carbon emissions under the perspective of carbon peaking pressure: A case study of China’s coastal regions. Ocean Coast. Manag. 2024, 249, 106985. [Google Scholar] [CrossRef]
- Climate Tracker. Climate Tracker China. 2025. Available online: https://climateactiontracker.org/countries/china/ (accessed on 30 July 2025).
- Irfan, M.; Ullah, S.; Razzaq, A.; Cai, J.; Adebayo, T.S. Unleashing the dynamic impact of tourism industry on energy consumption, economic output, and environmental quality in China: A way forward towards environmental sustainability. J. Clean. Prod. 2023, 387, 135778. [Google Scholar] [CrossRef]
- Ahmed, A.D.; Huo, R. Volatility transmissions across international oil market, commodity futures and stock markets: Empirical evidence from China. Energy Econ. 2021, 93, 104741. [Google Scholar] [CrossRef]
- Olanrewaju, V.O.; Kirikkaleli, D. Analyzing gas and oil efficiency’s role in environmental management: Does political risk matter? Energy Environ. 2024, 0958305X241262428. [Google Scholar] [CrossRef]
- Tiwari, S.; Mohammed, K.S.; Mentel, G.; Majewski, S.; Shahzadi, I. Role of circular economy, energy transition, environmental policy stringency, and supply chain pressure on CO2 emissions in emerging economies. Geosci. Front. 2024, 15, 101682. [Google Scholar] [CrossRef]
- Maeno, K.; Tokito, S.; Kagawa, S. CO2 mitigation through global supply chain restructuring. Energy Econ. 2022, 105, 105768. [Google Scholar] [CrossRef]
- Memari, A.; Rahim, A.R.A.; Ahmad, R.; Hassan, A. A literature review on green supply chain modelling for optimising CO2 emission. Int. J. Oper. Res. 2016, 26, 509–525. [Google Scholar] [CrossRef]
- Wang, Y.; Zhang, R.; Yao, K.; Ma, X. Does artificial intelligence affect the ecological footprint?—Evidence from 30 provinces in China. J. Environ. Manag. 2024, 370, 122458. [Google Scholar] [CrossRef]
- Wang, Q.; Zhang, F.; Li, R.; Sun, J. Does artificial intelligence promote energy transition and curb carbon emissions? The role of trade openness. J. Clean. Prod. 2024, 447, 141298. [Google Scholar] [CrossRef]
- Chen, P.; Gao, J.; Ji, Z.; Liang, H.; Peng, Y. Do Artificial Intelligence Applications Affect Carbon Emission Performance?—Evidence from Panel Data Analysis of Chinese Cities. Energies 2022, 15, 15. [Google Scholar] [CrossRef]
- van der Woude, D.; Castro Nieto, G.Y.; Moros Ochoa, M.A.; Portillo, C.L.; Quintero, A. Artificial intelligence in biocapacity and ecological footprint prediction in Latin America and the Caribbean. Environ. Dev. Sustain. 2024. [Google Scholar] [CrossRef]
- Anwar, A.; Sharif, A.; Fatima, S.; Ahmad, P.; Sinha, A.; Khan, S.A.R.; Jermsittiparsert, K. The asymmetric effect of public private partnership investment on transport CO2 emission in China: Evidence from quantile ARDL approach. J. Clean. Prod. 2021, 288, 125282. [Google Scholar] [CrossRef]
- Ning, L.; Abbasi, K.R.; Hussain, K.; Alvarado, R.; Ramzan, M. Analyzing the role of green innovation and public-private partnerships in achieving sustainable development goals: A novel policy framework. Environ. Sci. Pollut. Res. 2023. [Google Scholar] [CrossRef]
- Wen, Y.; Qu, C.; Gao, C.; Song, P.; Yang, D. The effect of public–private partnership investment, financial development, and renewable energy consumption on the ecological footprint in South Asia and the Pacific region. Front. Environ. Sci. 2022, 10, 1022046. [Google Scholar] [CrossRef]
- Kirikkaleli, D.; Ali, M.; Altuntaş, M. Environmental sustainability and public–private partnerships investment in energy in Bangladesh. Environ. Sci. Pollut. Res. 2022, 29, 56068–56078. [Google Scholar] [CrossRef] [PubMed]
- Ali, M.; Hashmi, S.H.; Habib, Y.; Kirikkaleli, D. The asymmetric impact of public–private partnership investment in energy on CO2 emissions in Pakistan. Energy Environ. 2023, 35, 0958305X221149483. [Google Scholar] [CrossRef]
- Koenker, R.; Bassett, G. Regression Quantiles. Econometrica 1978, 46, 33–50. [Google Scholar] [CrossRef]
- Percival, D.B.; Walden, A.T. Wavelet Methods for Time Series Analysis; Cambridge University Press: Cambridge, UK, 2000. [Google Scholar]
- Rasheed, M.Q.; Yuhuan, Z.; Ahmed, Z.; Haseeb, A.; Saud, S. Information communication technology, economic growth; natural resources, and renewable energy production: Evaluating the asymmetric and symmetric impacts of artificial intelligence in robotics and innovative economies. J. Clean. Prod. 2024, 447, 141466. [Google Scholar] [CrossRef]
- Li, Z.; Liu, J. Impact of supply chain digitalization, business enterprise R&D expenditure and government budget allocations for R&D: A roadmap towards carbon neutrality. Energy Econ. 2025, 141, 108057. [Google Scholar] [CrossRef]
- Acheampong, A.O.; Opoku, E.E.O.; Amankwaa, A.; Dzator, J. Energy poverty and gender equality in education: Unpacking the transmission channels. Technol. Forecast. Soc. Change 2024, 202, 123274. [Google Scholar] [CrossRef]
- Balducci, M. Linking gender differences with gender equality: A systematic-narrative literature review of basic skills and personality. Front. Psychol. 2023, 14, 1105234. [Google Scholar] [CrossRef]
- Adebayo, T.S. Overcoming barriers to clean cooking solutions: Political risk, financial development, and their implications for achieving SDG 7 in Nigeria. Environ. Prog. Sustain. Energy 2025, 44, e14592. [Google Scholar] [CrossRef]
- Adebayo, T.S.; Özkan, O.; Olanrewaju, V.O.; Uzun, B. Do fossil-fuel subsidies, Fintech innovation, and digital ICT transform ecological quality in Turkey? Evidence from modified cross-quantile regression. Appl. Econ. 2025. Available online: https://www.tandfonline.com/doi/abs/10.1080/00036846.2025.2520578 (accessed on 27 June 2025). [CrossRef]
- Magazzino, C.; Mutascu, M.; Mele, M.; Sarkodie, S.A. Energy consumption and economic growth in Italy: A wavelet analysis. Energy Rep. 2021, 7, 1520–1528. [Google Scholar] [CrossRef]
- Roumiani, A.; Mofidi, A. Predicting ecological footprint based on global macro indicators in G-20 countries using machine learning approaches. Environ. Sci. Pollut. Res. 2022, 29, 11736–11755. [Google Scholar] [CrossRef]
- Chunling, L.; Memon, J.A.; Thanh, T.L.; Ali, M.; Kirikkaleli, D. The Impact of Public-Private Partnership Investment in Energy and Technological Innovation on Ecological Footprint: The Case of Pakistan. Sustainability 2021, 13, 10085. [Google Scholar] [CrossRef]
- Udeagha, M.C.; Ngepah, N. Disaggregating the environmental effects of renewable and non-renewable energy consumption in South Africa: Fresh evidence from the novel dynamic ARDL simulations approach. Econ. Change Restruct. 2022, 55, 1767–1814. [Google Scholar] [CrossRef]
- Işık, C.; Bulut, U.; Ongan, S.; Islam, H.; Irfan, M. Exploring how economic growth, renewable energy, internet usage, and mineral rents influence CO2 emissions: A panel quantile regression analysis for 27 OECD countries. Resour. Policy 2024, 92, 105025. [Google Scholar] [CrossRef]
- Alam, M.B.; Hossain, M.S. Investigating the connections between China’s economic growth, use of renewable energy, and research and development concerning CO2 emissions: An ARDL Bound Test Approach. Technol. Forecast. Soc. Change 2024, 201, 123220. [Google Scholar] [CrossRef]
- Huang, Z.; Ren, X. Impact of natural resources, resilient economic growth, and energy consumption on CO2 emissions. Resour. Policy 2024, 90, 104714. [Google Scholar] [CrossRef]
- Naseem, S.; Hu, X.; Sarfraz, M.; Mohsin, M. Strategic assessment of energy resources, economic growth, and CO2 emissions in G-20 countries for a sustainable future. Energy Strategy Rev. 2024, 52, 101301. [Google Scholar] [CrossRef]
- OWD. Our Worldindata. 2024. Available online: https://ourworldindata.org/ (accessed on 20 October 2024).
- WDI. World Development Indicator. 2024. Available online: https://data.worldbank.org (accessed on 1 April 2024).
- GFN. Global Fooprint Network. 2024. Available online: https://data.footprintnetwork.org/#/countryTrends?cn=110&type=BCpc,EFCpc (accessed on 12 September 2024).
- GSCM. Global Supply Chain Management. 2025. Available online: https://www.newyorkfed.org/research/policy/gscpi#/overview (accessed on 5 February 2025).
- Adebayo, T.S.; Özkan, O. Investigating the influence of socioeconomic conditions, renewable energy and eco-innovation on environmental degradation in the United States: A wavelet quantile-based analysis. J. Clean. Prod. 2024, 434, 140321. [Google Scholar] [CrossRef]
- Abdalla, A.N.; Nazir, M.S.; Tao, H.; Cao, S.; Ji, R.; Jiang, M.; Yao, L. Integration of energy storage system and renewable energy sources based on artificial intelligence: An overview. J. Energy Storage 2021, 40, 102811. [Google Scholar] [CrossRef]
- Hu, G.; Gozgor, G.; Lu, Z.; Mahalik, M.K.; Pal, S. Determinants of renewable stock returns: The role of global supply chain pressure. Renew. Sustain. Energy Rev. 2024, 191, 114182. Available online: https://ideas.repec.org//a/eee/rensus/v191y2024ics1364032123010407.html (accessed on 12 June 2024). [CrossRef]
- Fernström Nåtby, K.; Rönnerfalk, H. Gender Equality and CO2-Emissions: A Panel Data Study. 2018. Available online: http://lup.lub.lu.se/student-papers/record/8934039 (accessed on 12 July 2025).
- Ganda, F. Gender empowerment and environmental impact: A quantile regression analysis in BRICS economies. Heliyon 2024, 10, e40056. [Google Scholar] [CrossRef]
- Ahmad, M.; Jiang, P.; Murshed, M.; Shehzad, K.; Akram, R.; Cui, L.; Khan, Z. Modelling the dynamic linkages between eco-innovation, urbanization, economic growth and ecological footprints for G7 countries: Does financial globalization matter? Sustain. Cities Soc. 2021, 70, 102881. [Google Scholar] [CrossRef]


Disclaimer/Publisher’s Note: The statements, opinions and data contained in all publications are solely those of the individual author(s) and contributor(s) and not of MDPI and/or the editor(s). MDPI and/or the editor(s) disclaim responsibility for any injury to people or property resulting from any ideas, methods, instructions or products referred to in the content. |
© 2025 by the authors. Licensee MDPI, Basel, Switzerland. This article is an open access article distributed under the terms and conditions of the Creative Commons Attribution (CC BY) license (https://creativecommons.org/licenses/by/4.0/).