Article

Knowledge Graph-Enabled Prediction of the Elderly’s Activity Types at Metro Trip Destinations

1
State Key Laboratory of Ocean Engineering, Shanghai Key Laboratory for Digital Maintenance of Buildings and Infrastructure, School of Ocean and Civil Engineering, Shanghai Jiao Tong University, Shanghai 200240, China
2
Department of Transportation Engineering, School of Ocean and Civil Engineering, Shanghai Jiao Tong University, Shanghai 200240, China
3
Shanghai Urban-Rural Construction and Transportation Development Research Institute, Shanghai 200032, China
*
Author to whom correspondence should be addressed.
Systems 2025, 13(10), 834; https://doi.org/10.3390/systems13100834
Submission received: 15 August 2025 / Revised: 17 September 2025 / Accepted: 19 September 2025 / Published: 23 September 2025
(This article belongs to the Special Issue Data-Driven Urban Mobility Modeling)

Abstract

Providing age-friendly metro service substantially enhances the elderly’s mobility and well-being. Despite recent progress in user profiling and mobility prediction, the prediction of the elderly’s metro travel patterns remains limited. To fill this gap, this study proposes a framework integrating user profiling and knowledge graph embedding to predict the elderly’s activity types at metro trip destinations, utilizing 180,143 smart card records and 885,072 points of interest (POI) records from Chongqing, China in 2019. First, an elderly metro travel profile (EMTP) tag system is developed to capture the elderly’s spatiotemporal metro travel behaviors and preferences. Subsequently, an elderly metro travel knowledge graph (EMTKG) is constructed to support semantic reasoning, transforming the activity types prediction problem into a knowledge graph completion problem. To solve the completion problem, the Temporal and Non-Temporal ComplEx (TNTComplEx) model is introduced to embed entities and relations into a complex vector space and distinguish between time-sensitive and time-insensitive behavioral patterns. Fact plausibility within the graph is evaluated by a scoring function. Numerical experiments validate that the proposed model outperforms the best-performing baselines by 13.37% higher Accuracy@1 and 52.40% faster training time per epoch, and ablation studies further confirm component effectiveness. This study provides an enlightening and scalable approach for enhancing age-friendly metro system service.

1. Introduction

Population aging is a global phenomenon. In 2024, the global population aged 65 or over reached 831 million and is projected to double to over 1.6 billion by 2050. Currently, population aging is most pronounced in East Asia, Southeast Asia, Europe, and North America, where the proportion of people aged 65 or over exceeds 15% of the national population, with some countries even reaching 30% [1]. In China, the population aged 65 or over exceeded 220 million in 2024, accounting for 15.60% of the total population. China has entered a moderately aging society and is progressing toward a deeply aging society. By 2057, this group is projected to peak at 425 million, constituting 32.90–37.60% of the total national population [2].
Population aging raises significant social justice and equity issues, such as ensuring adequate and sustainable income security, high-quality healthcare, accessible social services, and suitable transportation for the elderly [3]. As educational levels and physical health improve, the elderly’s willingness to travel has increased significantly. Numerous studies indicate that mobility and accessibility are critical factors influencing their quality of life and well-being [4,5,6,7,8], challenging urban transportation systems. In contrast to Western countries, where the elderly rely heavily on private vehicles, the elderly in China depend more on public transit [9]. In recent years, the expansion of the rail transit network, coupled with its safety and stability, has increased its appeal to the elderly. Consequently, governments at all levels in China have implemented preferential policies to encourage the elderly to utilize the metro system [10].
However, the elderly face multiple travel challenges, including physical decline, information access barriers, and unfriendly transportation facilities, leading to inefficiency and safety risks [11]. Moreover, the relatively rigid supply models and service designs of public transport struggle to meet the increasingly diverse and personalized travel demands of the elderly, leading to structural supply–demand imbalances [12]. These issues not only undermine the equity of urban transportation systems but also constrain social participation and quality of life improvements among the elderly. Consequently, developing policies to address their mobility needs has become a priority for transportation planners and policy-makers.
Many studies have explored demand-side analyses of public transportation systems, encompassing econometric modeling [13] and data-driven prediction [14,15]. However, existing research lacks fine-grained and semantic modeling of the travel behavior of the elderly. Traditional statistical models struggle to accurately predict the complex and personalized spatiotemporal travel behaviors of individuals, limiting transportation operators’ ability to identify differentiated mobility needs and constraining the precise design and dynamic optimization of age-friendly services [16].
This study aims to address this research gap by proposing a modeling and prediction framework for the travel behavior of elderly metro travelers. In this study, the objective of the mobility prediction task is to predict the elderly’s activity types at metro trip destinations in a specific future time bin based on historical trajectories within a pre-defined time window. The main contributions of the study are summarized as follows:
(1)
This study proposes a data-driven framework to develop an elderly metro travel profile (EMTP), including data preprocessing and tag system construction for structured semantic representation of travel characteristics.
(2)
This study constructs an elderly metro travel knowledge graph (EMTKG) that integrates labels in profiles with origin-destination (OD) behavior graphs, forming entities (users, time bins, OD pairs, labels) and relations to support semantic reasoning.
(3)
This study transforms the destination activity types prediction task into a knowledge graph completion problem and introduces the Temporal and Non-Temporal ComplEx (TNTComplEx) model, which embeds entities and relations within the graph into a continuous low-dimensional vector space and captures temporal dynamics for precise activity types prediction. The plausibility of facts within the knowledge graph is evaluated by a scoring function.
(4)
Validated on the elderly metro travel dataset from Chongqing, China, the proposed model achieves a superior performance than the advanced baselines in terms of accuracy and efficiency. Additionally, the ablation experiment results also demonstrate the effectiveness of each component.
The remainder of this paper is organized as follows. Section 2 reviews existing research on travel behavior modeling and prediction. Section 3 describes the metro smart card data and land-use data utilized in this study. Section 4 details the development of the EMTP tag system, proposes the EMTKG construction method, and introduces the destination activity types prediction approach using the knowledge graph. Section 5 presents the experimental results and discussion. Section 6 concludes the study and outlines future research directions.

2. Literature Review

2.1. Complex Travel Behaviors of the Elderly

Studies indicate that the elderly’s travel behaviors differ significantly from other age groups, exhibiting distinct demographic characteristics and complex influencing mechanisms. Travel behavior is generally characterized across multiple dimensions, including travel purpose, frequency, time, distance, and mode choice.
Analyses based on U.S. National Household Travel Survey (NHTS) data reveal that travel frequency and distance of the elderly significantly decrease with age even after controlling for density, gender, race, income, employment, medical condition, car ownership, and having a driver’s license [17]. Research in Beijing indicates that shopping and leisure are primary activities. Notably, cohabitation with school-aged children makes “child pick-up and drop-off” a significant travel activity, potentially influencing their travel time distribution patterns [18]. Urban structure and transportation policies significantly shape the travel patterns of the elderly. A cross-national study highlights that in North America, characterized by low-density transport networks and car-oriented development patterns, the elderly rely more on private cars. In contrast, in European cities (e.g., Denmark, Norway, UK, The Netherlands) and China, which feature more compact urban forms and well-developed transit networks, the elderly more frequently adopt sustainable transport modes such as walking, cycling, bus, and subway [19]. From the perspective of tourism psychology, the elderly trip choices are profoundly shaped by the unique psychological factor of “Future Time Perspective (FTP)”, leading them to prefer “emotionally fulfilling” trips (e.g., visiting relatives and friends, revisiting old places), unlike younger people who tend to favor “knowledge-acquiring” trips (e.g., adventure, visiting new attractions) [20].
Travel behaviors of the elderly are influenced by the interaction of various factors. Factors affecting the elderly’s mobility can be broadly categorized into three aspects: socio-demographic factors, built environment factors, and other factors (e.g., lifestyle and psychological state, policy, culture, service quality).
Analysis based on the National Health and Aging Trends Study (NHATS) data demonstrates that the transition from driving to non-driving travel modes (e.g., walking, public transit) among the elderly is strongly influenced by social networks and the built environment, whereas younger individuals more often choose non-driving modes for convenience and cost [21]. In Mexico City, significant disparities related to gender, income class, and neighborhood-level access to public transportation are more pronounced among the elderly than in other demographics. While public transport and walking dominate elderly travel, with well-developed transit infrastructure increasing utilization, those with lower incomes, women, and residents of peripheral urban areas face greater mobility constraints [22]. GPS-based studies further reveal that the elderly frequently take longer detours to avoid perceived risks (e.g., complex intersections, steep slopes) or to pursue comfort (e.g., greenery, quiet settings), indicating that environmental perception affects their route choices more significantly than other age groups [23]. Research employing Geographically Weighted Regression (GWR) models reveals that the influence of the built environment on the travel behavior of the elderly is not only significant but also exhibits strong spatial heterogeneity, whereby the same environmental factors can have different or even opposite effects in different communities. For instance, increasing bus stop density may significantly encourage public transport use among the elderly in central urban areas, whereas the effect in suburban regions may be minimal [24].

2.2. User Profiling Is Becoming Prominent

Most studies rely on questionnaire data, employing descriptive statistics or traditional discrete choice models to characterize average group-level features, constraining a comprehensive understanding of the elderly travel behavior. To better capture individual travel characteristics, user profiling has been introduced into the transportation domain.
Research on passenger travel profiling primarily targets three objectives. First, characterizing travel patterns or classifying passengers. For example, an improved DBSCAN-based algorithm extracts individual spatiotemporal features to segment passengers [25]. A Knowledge Graph-assisted Mobility User Profiling (KG-MUP) framework integrates knowledge-driven (UrbanKG) and data-driven paradigms to enhance user attribute inference robustness and interpretability [26]. Second, evaluating transportation systems. Passenger profiles built from questionnaire data identify service pain points (e.g., poor punctuality) [27] and capture perceptual differences among diverse user groups [28]. Third, serving as critical inputs for downstream applications. Commuter profiles predict routes and enable personalized real-time traffic information recommendations [29]. Semantic networks establish profiles with spatiotemporal behavior tags for mobility prediction [30]. Passenger profiles derived from smart card data have also been successfully applied to demand-responsive bus optimization [31].

2.3. New Technologies Bring Evolution

Advances in graph computing technology, knowledge graphs and graph embedding have demonstrated broad application prospects in travel behavior modeling and prediction. Knowledge graph, with its robust structured knowledge representation, effectively fuses multi-source heterogeneous information (e.g., user attributes, time, stations, routes, and events) and supports semantic reasoning. Graph embedding techniques map graph entities and relations into low-dimensional vector spaces, transforming structured knowledge into computationally tractable forms. These methods show significant potential in various applications, including travel chain recognition [32], mobility prediction [33,34], demand forecasting [35], and trajectory prediction [36].
In summary, the existing body of research provides a multi-faceted understanding of elderly travel behavior, highlighting its complexity shaped by socio-demographic, environmental, and psychological factors. Furthermore, the emergence of user profiling techniques offers promising avenues for moving beyond aggregate-level analysis to capture individual heterogeneity. Recently, knowledge graphs and graph embedding technologies have shown great potential in integrating multi-source data and enhancing prediction capabilities within the transportation domain. However, a critical gap remains in the seamless integration of these advanced paradigms. Specifically, there is a lack of frameworks that effectively incorporate fine-grained, semantic-rich user profiles into dynamic knowledge graph structures for mobility prediction. Moreover, few models explicitly account for the temporal dynamics inherent in elderly travel, such as the distinction between time-sensitive and time-insensitive behaviors, constraining prediction accuracy and generalization capabilities. This study aims to address these gaps by proposing a novel integrated framework that leverages user profiling and temporal knowledge graph embedding to predict the activity types of the elderly at metro trip destinations.

3. Data Description

3.1. Study Area

This study examines the metro travel behaviors of elderly travelers in Chongqing. In 2021, the elderly aged 65 or above numbered 5.4736 million, accounting for 17.08% of the total population, ranking second nationally and approaching a deeply aging city [37]. This study focuses on the nine central urban areas of Chongqing, including Yuzhong, Jiangbei, Nanan, Jiulongpo, Dadukou, Shapingba, Banan, Yubei, and Beibei, with a total area of approximately 5472.68 square kilometers [38]. Since the inauguration of its first urban rail transit line in 2005, Chongqing’s metro system has undergone a transformative evolution from inception to a comprehensive network. As of 31 December 2019, the network comprises nine operational lines, spanning approximately 328 km with a total of 216 stations [39]. Figure 1 illustrates the layout of the metro lines and stations within the central urban areas of Chongqing.

3.2. Data Sources

This study applies smart card data and points of interest (POI) data collected in Chongqing. The smart card data covers elderly passengers’ travel from 1 December to 31 December in 2019, with a total of 180,143 card swipe records. The data include smart card ID, entry and exit time of each trip, entry and exit metro station ID of each trip, and metro line ID (Table 1).
Land-use functions significantly affect passenger travel behavior [40]. POI data refer to specific points with distinct functional attributes within urban areas and are widely used in travel pattern analysis [41]. Given that elderly travel often relates to health and daily services, and family responsibilities (e.g., child pick-up and drop-off), POIs (e.g., medical facilities, markets, parks, science, culture, and education venues, etc.) are incorporated to analyze travel motivations for downstream tasks such as activity-type prediction.
This study collected POI data within Chongqing for 2019 using the application programming interface (API) of Baidu Map, with a total sample size of 885,072, including name, coordinates, category, and address attributes. Based on China’s national standard Code for classification of urban land use and planning standards of development land (GB50137-2011) [42], POIs are organized into six broad categories, further divided into 15 specific sub-categories. The distribution of these broad categories and their corresponding sub-categories is detailed in Table 2.

4. Methodology

4.1. Workflow Overview

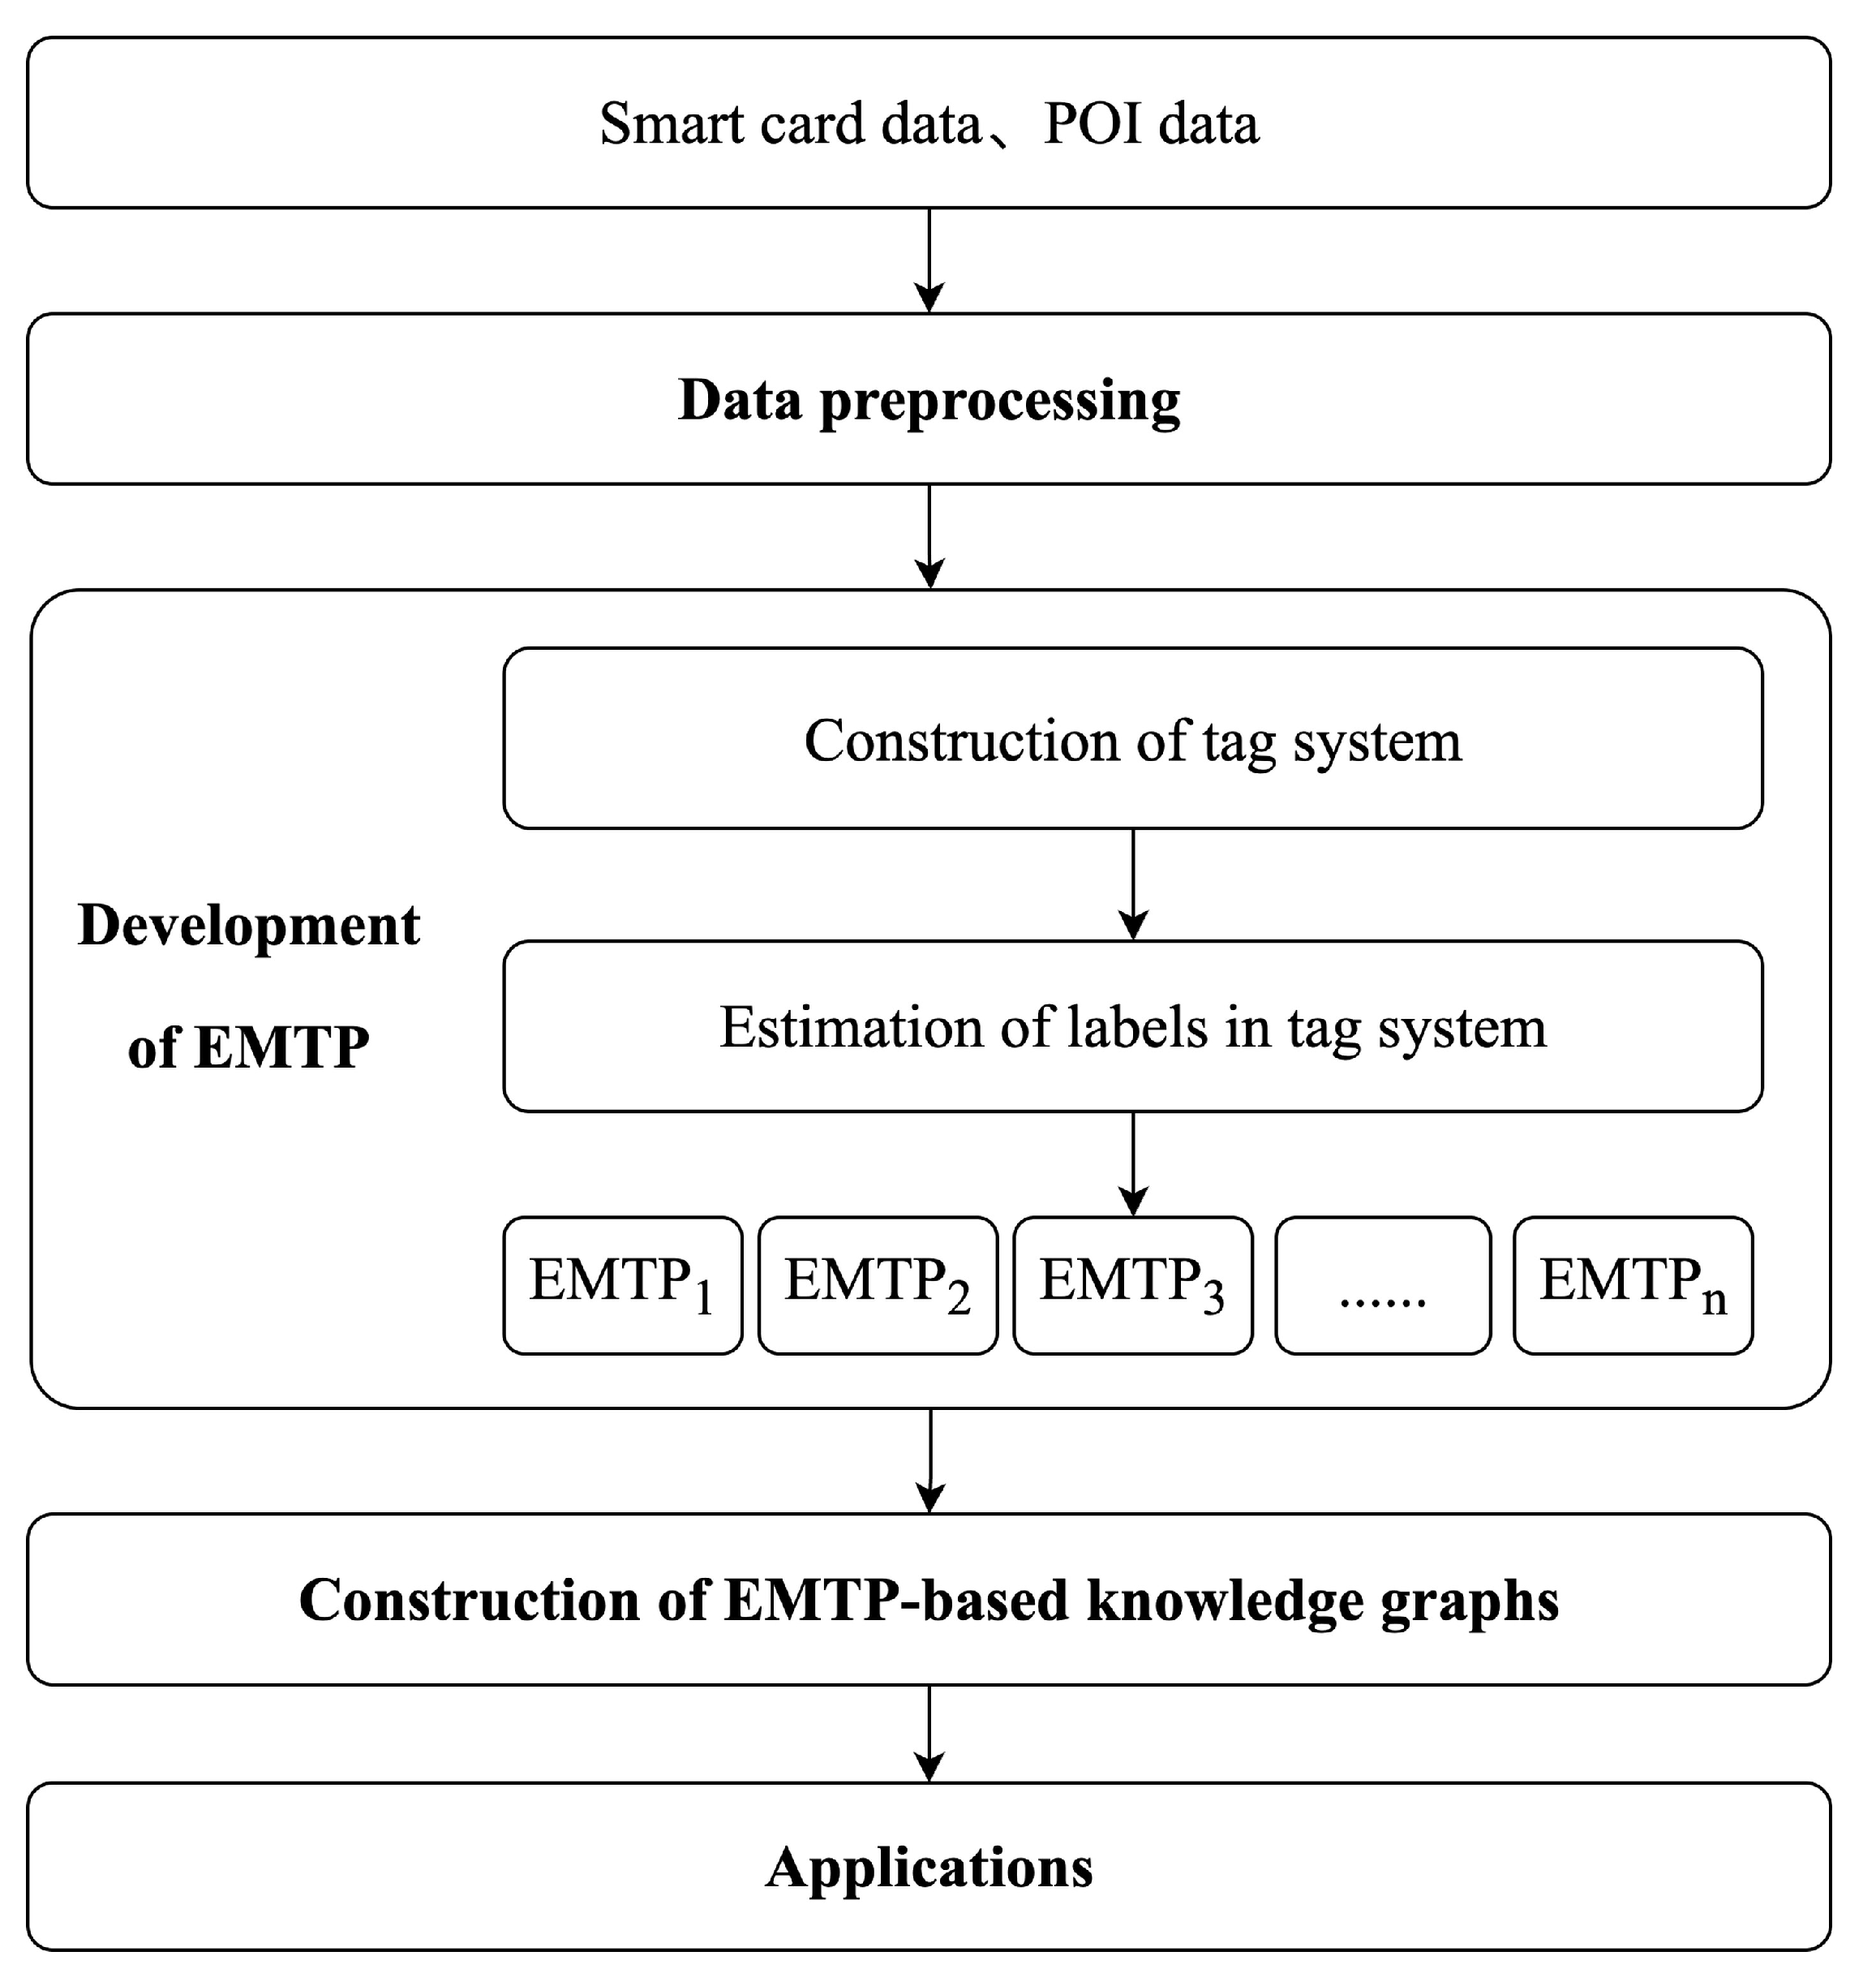
A four-stage integrated framework is proposed to achieve fine-grained modeling and precise prediction of elderly metro travel behaviors. The overall workflow is demonstrated in Figure 2.
During the data preprocessing stage, raw smart card and POI data are subjected to cleaning, temporal discretization, and labeling. Spatiotemporal behavioral and preference feature labels are extracted to generate structured user profiles in the EMTP development stage; n passengers are represented as n EMTP samples, respectively. In the EMTKG construction stage, all extracted EMTPs are semantically linked and stored within a knowledge graph to facilitate structured semantic representation. Finally, the EMTKG is applied to destination activity types prediction tasks. Detailed procedures are explained in subsequent sections.

4.2. Development of Elderly Metro Travel Profiles

4.2.1. Data Preprocessing

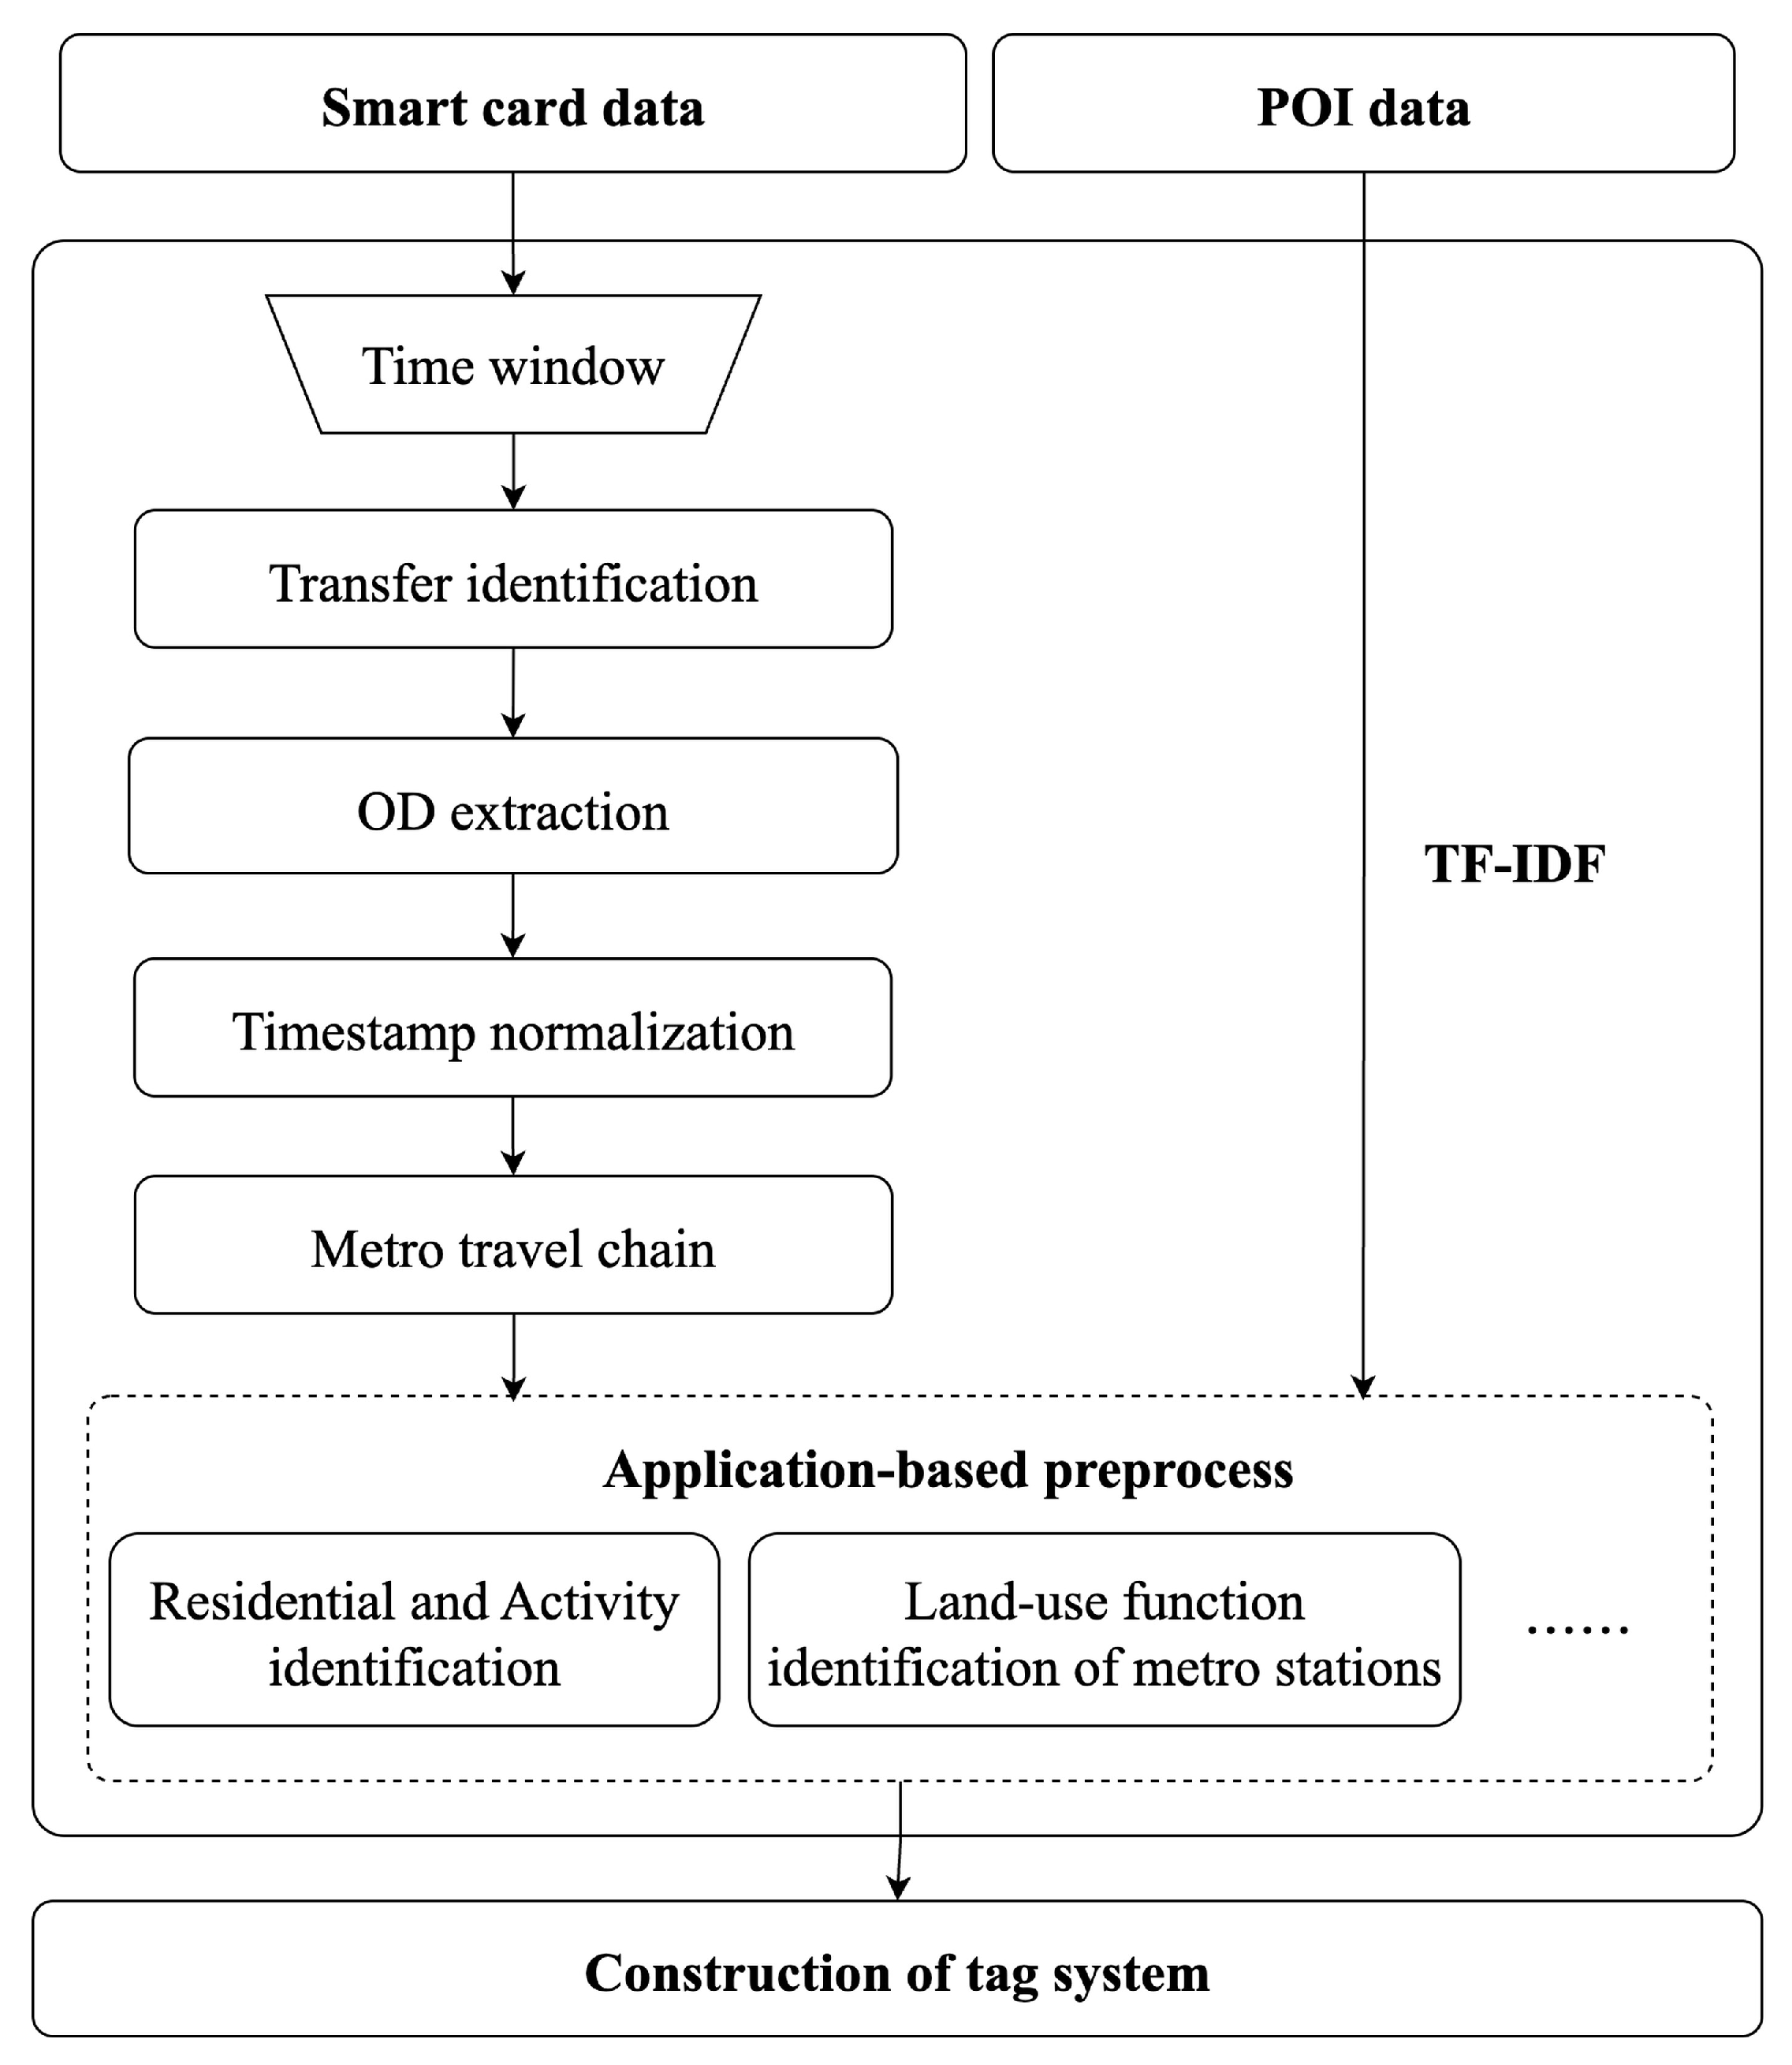
Before the tag system construction, raw data should be preprocessed. The specific workflow is demonstrated in Figure 3.
User profiles exhibit temporal dynamics as passengers’ travel behaviors and preferences change over time [43]. Consequently, a time window approach is applied to filter data. The time window selected for this study is 2 December to 29 December in 2019. Subsequently, smart card data are cleaned by removing records with missing fields, erroneous line/station IDs, or abnormal entry/exit times. Transfer trips are then identified based on spatiotemporal continuity rules, using the timestamp and status fields in each record to establish OD pairs and reconstruct complete travel chains for each smart card ID. During reconstruction, intervals exceeding a maximum transfer threshold of 45 min are regarded as separate trips [44]. Furthermore, considering elderly travelers exhibit more regular travel patterns, which may lead to overfitting and reduce the generalizability of predictive models, data samples with fewer than 30 card swipes and fewer than 5 visited locations are excluded from analysis.
To standardize the temporal scale for label representation and model input, timestamps are discretized into fixed-length time bins following widely adopted preprocessing strategies [45]. Specifically, each day is divided into 48 half-hour time bins, further distinguished between working and non-working days, resulting in a total of 96 time bins (numbered T1 to T96, collectively denoted as set T). All travel records are assigned to the respective time bin based on entry and exit timestamps.
Identifying elderly travelers’ primary activity locations from the preprocessed travel chain data is essential for constructing user profile labels. Algorithm 1 presents the pseudocode of the algorithm used to identify residence and activity locations. In this algorithm, a station is considered a candidate habitual location if the number of visits exceeds one-third of the total trips. This empirical threshold is selected based on a combination of established literature and empirical validation. Existing studies on high-frequency mobility behavior consistently suggest that a significant location should account for a substantial proportion of an individual’s total trips to be robustly identified as a habitual destination [46,47,48]. To determine an appropriate value, we tested multiple thresholds (exceeding 1/3, 1/2, and 2/3 of total trips) during preliminary analysis. The threshold of 1/3 was found to provide the optimal balance between coverage and accuracy. For the dataset in this study, this approach successfully identified at least one residential station for 80.10% of passengers and at least one activity station for 82.63% of passengers, thereby effectively distinguishing between regular and occasional travel behavior.
Algorithm 1. Residential and Activity Area Identification.
Input: Smart card record for each elderly passenger record i ; The number of passengers k
Method:
1. for  i = 0 to k  do
2.   Extract the first record of each day in record i to form O i
3.   Extract the last record of each day in record i to form D i
4.   if the most frequent origin station o in O i exceeds 1/3 of the total do
5.        R i = o
6.   end if
7.   if the most frequent destination station d in D i exceeds 1/3 of the total do
8.        A i = d
9.   end if
10. end for
Output: The metro stations of residential areas R i and activity areas A i
Prior studies [46] generally classify POI data into several categories, assigning the POI category with the maximum number around a metro station directly as its type. However, this method relies on absolute POI counts, neglecting differences in the total number of POI categories. To precisely identify station functions, the Term Frequency-Inverse Document Frequency (TF-IDF) algorithm is employed to calculate weights for each POI category around a metro station. This method considers both the frequency and rarity of POI categories, with the highest-weighted category designated as the station’s primary function.
TF i ,   j = c i ,   j i = 1 n c i ,   j
IDF i = log M s i + 1
TF   -   IDF i ,   j = TF i ,   j   ×   IDF i
In Equations (1)–(3), the Term Frequency TF i ,   j quantifies the relative prevalence of POI type i in the vicinity of metro station j , and the Inverse Document Frequency IDF i measures the general importance or rarity of POI type i across the entire set of metro stations. c i ,   j denotes the count of POIs categorized as type i within the 800 m catchment area of metro station j , while i = 1 n c i ,   j corresponds to the total number of POIs of all types ( n in total) situated in the catchment area of metro station j . M indicates the total number of metro stations, and s i represents the number of metro stations with POI type i located within the catchment area. The constant 1 added in the denominator of Equation (2) serves as a smoothing factor to prevent division by zero.

4.2.2. Development of Tag System

The core of the EMTP framework is the tag system development, which comprises the tag structure and label estimation methods. EMTP enables precise characterization of elderly metro travel behavior, serving as critical input for downstream predictive tasks.
  • Construction of tag system for EMTP
The tag system organizes and stores selected labels. Its design not only determines the structure of EMTP but also directly influences EMTP accuracy. Each label represents a highly refined manual feature tailored to downstream application requirements. The system employs a hierarchical architecture: the lower level contains basic behavioral labels identifying individual travel characteristics, while the upper level comprises abstract label sets revealing inter-label relations. To manage granularity and reduce computational complexity, a few precise numerical indicators are converted into text labels through clustering methods and empirical thresholds.
EMTP aims to capture the travel needs and habits of elderly travelers, with the tag system designed to depict their travel behaviors. Figure 4 illustrates the two-level hierarchical tag system. Theme L1 includes basic features (describing passengers themselves) and travel features (emphasizing metro travel patterns). To facilitate label management, L2 subdivides L1: basic features into card information and passenger classification; travel features into temporal, spatial, and behavioral dimensions. Addressing privacy concerns, the system excludes personal information, ensuring profiles cannot be directly linked to real-world users.
User profiles are established for each Card ID (No. 1). The RFM model (Recency, Frequency, Monetary) [49], a customer value analysis method from database marketing, defines Recency as the most recent purchase time, Frequency as purchase frequency, and Monetary as expenditure amount. Applied to public transportation, within this tag system, RFM (No. 2) is estimated using Recency (No. 4), Travel frequency (No. 13), and Travel distance (No. 6) to classify passengers.
Regarding travel features, differences among elderly travelers primarily manifest in their dependency on public transport (No. 4, No. 13), travel intensity (No. 3, No. 6, No. 7), and travel preferences (No. 5, No. 10, No. 11). Given the relatively stable behavioral patterns of elderly travelers, additional labels include Residential Area (Metro station) (No. 8) and Activity Area (Metro station) (No. 9). An efficient public transportation system should meet elderly travel needs with minimal transfers. Therefore, Transfer times (No. 12) is incorporated as a key label to measure metro network convenience.
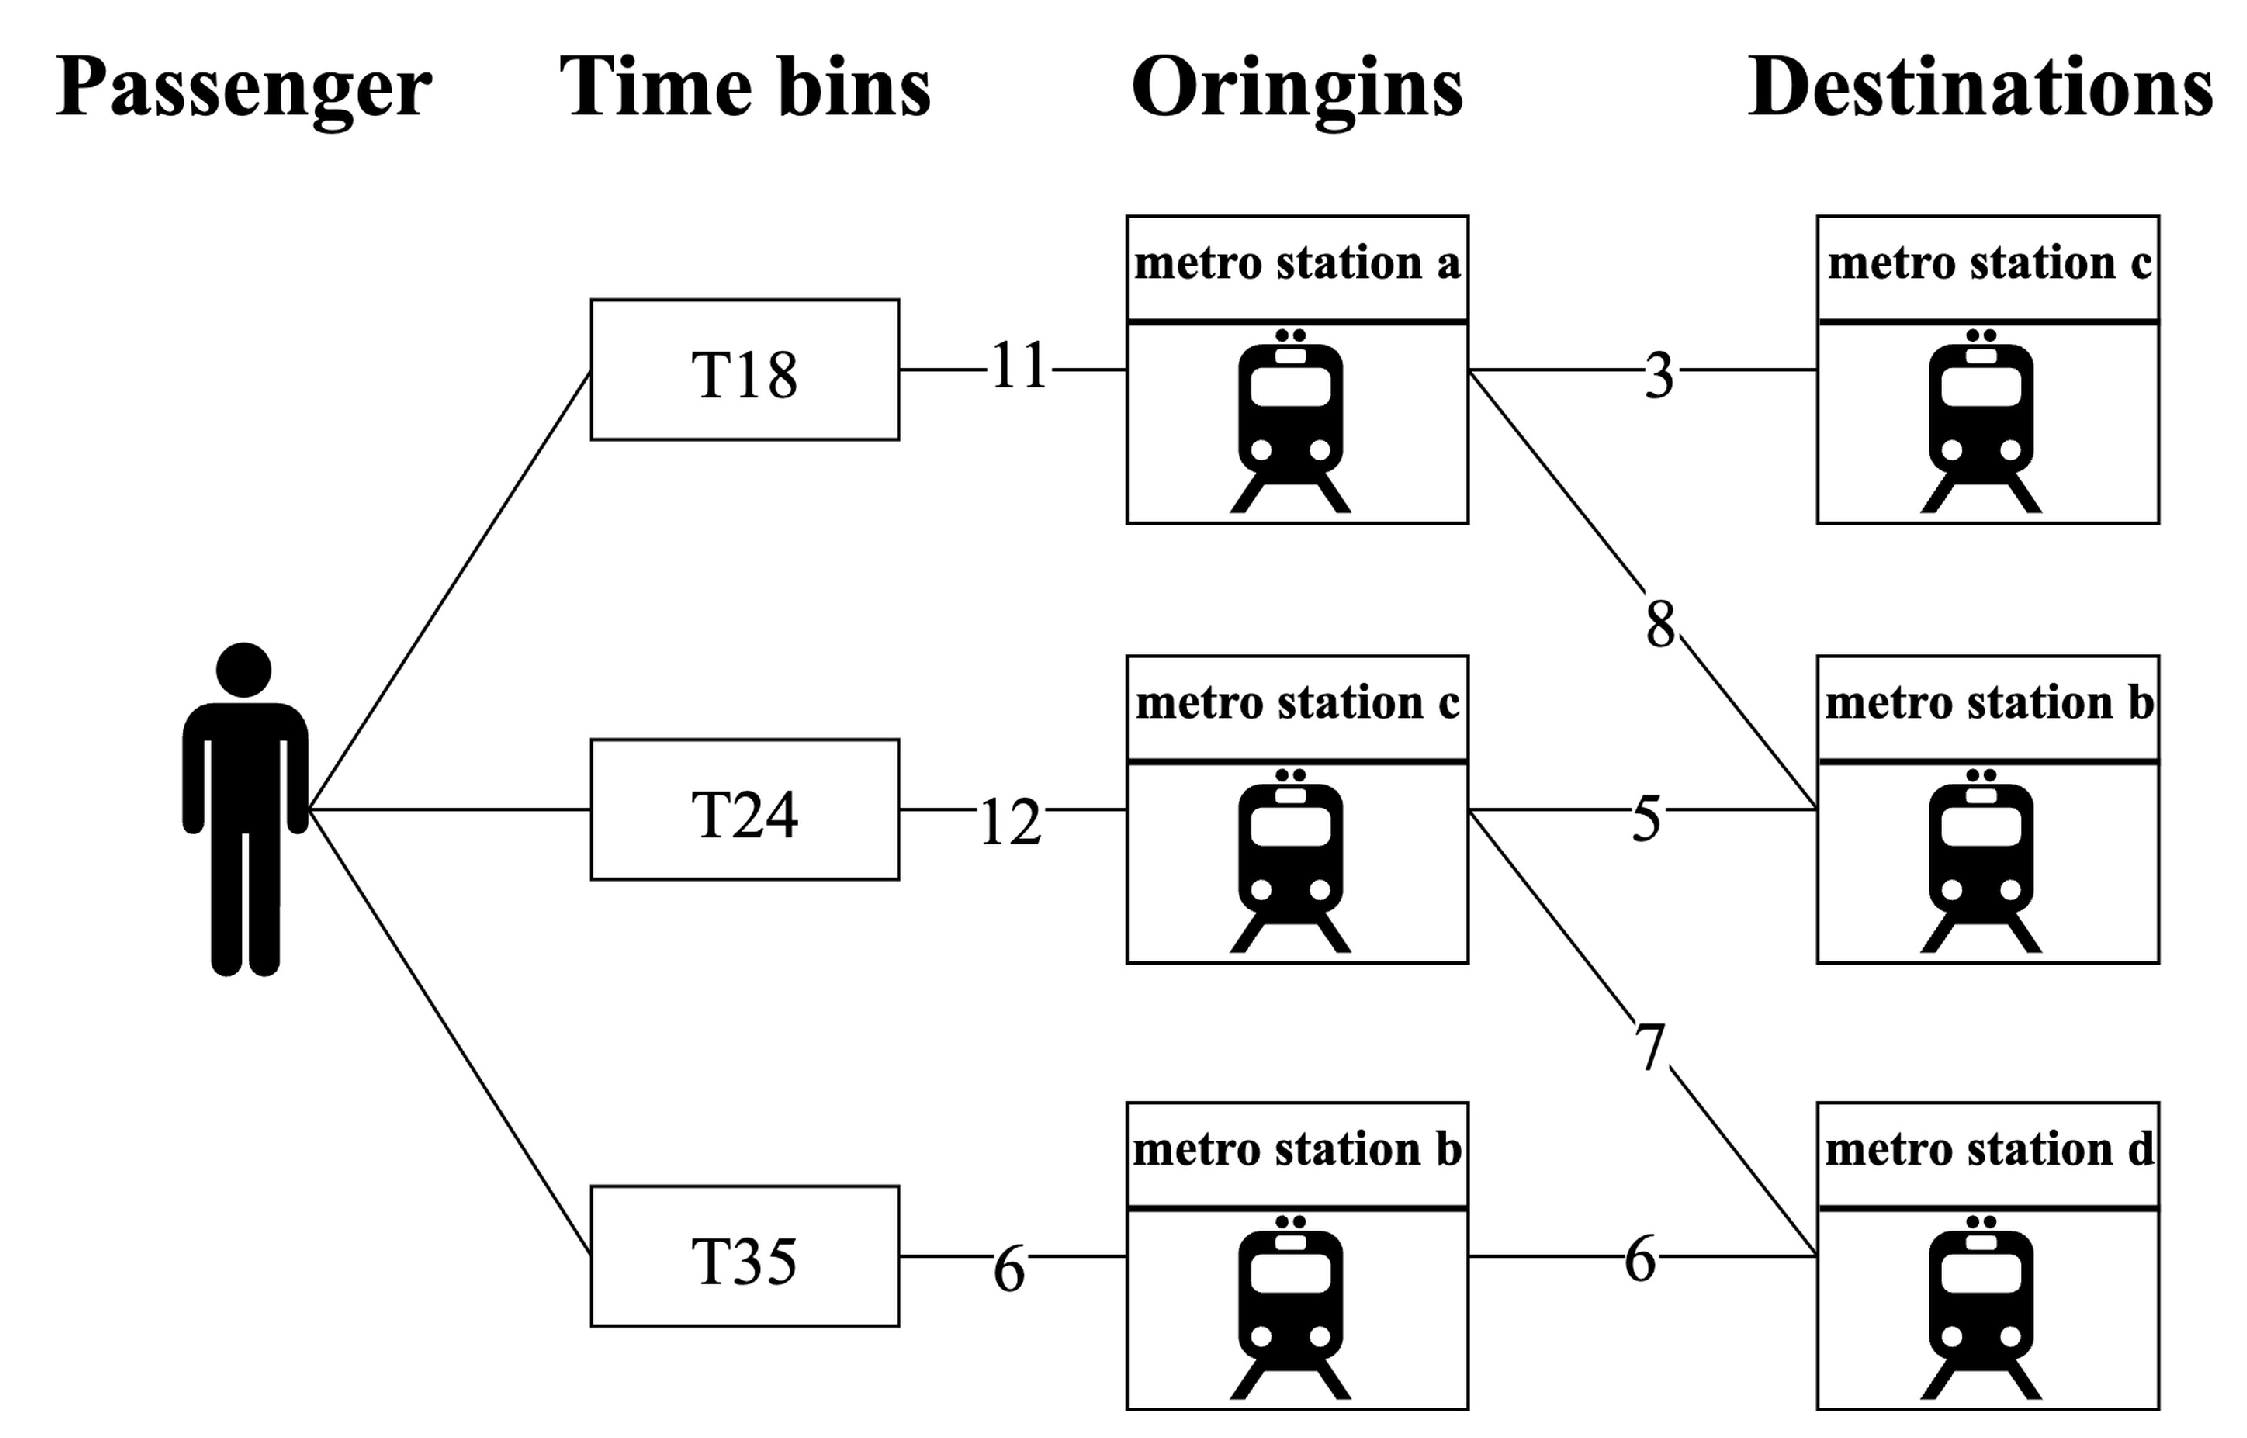
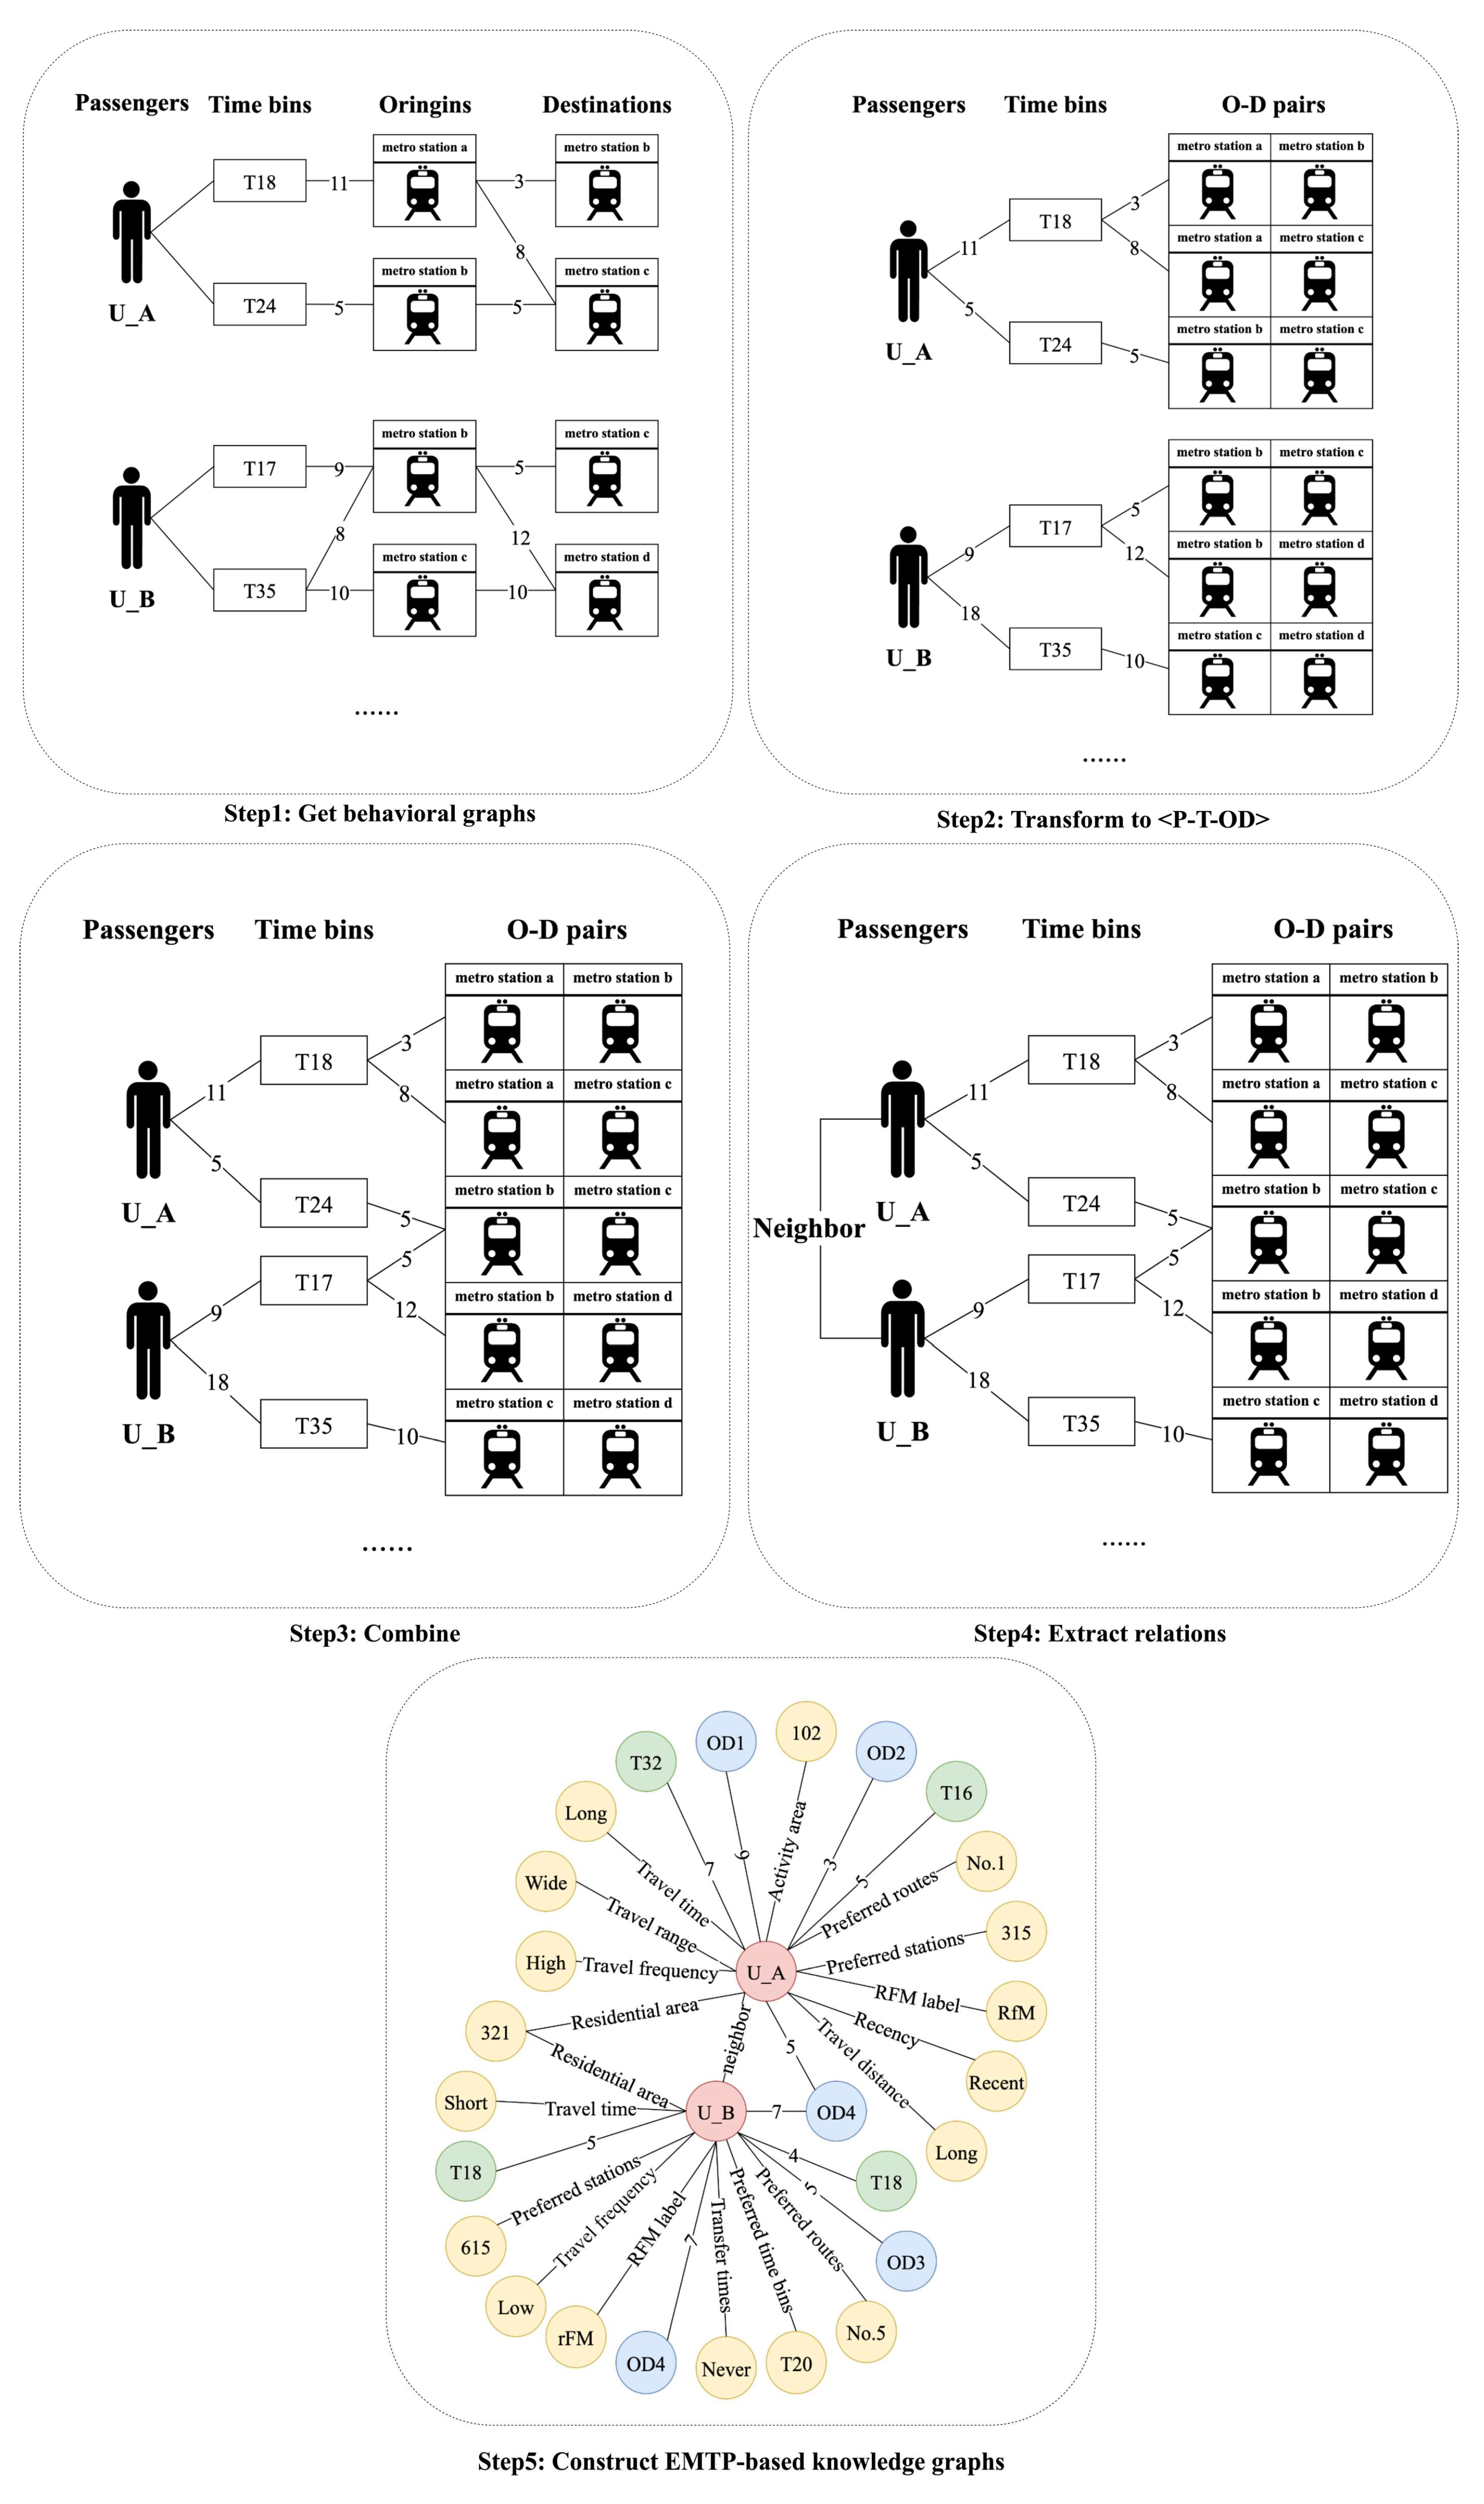
Numeric and text labels often struggle to store unstructured behaviors, such as transition patterns and trip chains. However, topological graphs composed of nodes and edges can store interconnected information. Inspired by research on k-partite graphs [50], this study introduces a graph label (No. 14) to store transition patterns, laying the foundation for the EMTKG construction.
A k-partite graph [50] refers to a heterogeneous weighted graph structure in which nodes are divided into k disjoint subsets, and edges are permitted solely between nodes belonging to adjacent subsets. In the context of metro travel behavior, a typical trip record consists of four fundamental elements: smart card ID, travel time, origin station, and destination station. Given the independence among these sets, it is suitable to represent their relations using a k-partite graph, denoted as G k .
G k =   < N k ,   E k ,   W k >
N k = U     T     O     D
where N k , E k , W k are the set of nodes, edges, and weights, respectively. Weights reflect the frequencies of a passenger ( U ) departing from origin ( O ) during the time bin ( T ) , or the transition frequencies of origins ( O ) and destinations ( D ). Figure 5 illustrates an example of passenger transition patterns, with weights marked in the middle of the edges.
2.
Estimation methods for labels in tag system for EMTP
As illustrated in Table 3, L1 labels are defined and they can be classified by category and exclusivity. Labels are divided into two categories: discrete text labels and precise-valued numeric labels. Each label’s exact value is first estimated based on the outputs of statistical calculations, irrespective of its category. Numeric labels are then stored as exact values, while text labels are discretized based on predefined rules. Label exclusivity refers to whether L2 labels within the same L1 label are mutually exclusive. Considering that passengers may have multiple preferred stations and routes, some labels may contain multiple values (i.e., No. 5, No. 8, No. 9, No. 10, No. 11).
The estimation methods for each label are as follows. Numeric labels (No. 5, No. 8, No. 9, No. 10, No. 11, No. 14) are calculated based on outputs from statistical analysis. For example, for Preferred time bins (No. 5), tallying the occurrence frequency of the elderly passenger traveling during each time bin (T1-T96) and time bins exceeding 10% of the passenger’s total trips are deemed preferred. Similarly, Preferred routes (No. 10) and Preferred stations (No. 11) are derived by extracting the top-k routes and stations based on visit frequency to construct preference sets.
Residential Area (Metro station) (No. 8) and Activity Area (Metro station) (No. 9) are outputs from the residence and activity area recognition model during data preprocessing (Algorithm 1). By calculating departure frequencies from the origin O during time bin T and travel frequencies between OD pairs, Behavioral graph (No. 14) can be constructed.
Furthermore, text labels (No. 2, No. 3, No. 4, No. 6, No. 7, No. 12, No. 13) are estimated according to predefined rules involving discretization methods (e.g., clustering, equal-frequency). This study employs k-means to discretize each label into multiple sub-tags, balancing the preservation of numerical distribution and interpretability. Based on the possible values of text labels (i.e., No. 4, No. 6, No. 13), elderly travelers can be categorized into eight groups: RFM, RFm, RfM, Rfm, rFM, rFm, rfM, and rfm. For example, the label RFM indicates elderly travelers with text labels of Recent for Recency, High for Travel frequency and Long for Travel distance.

4.3. Construction of EMTP-Based Knowledge Graphs

Structured data (e.g., smart card data, floating vehicle data, and cellular signal data) is the mainstream data source in the transportation domain, but it cannot intuitively represent unstructured travel behaviors. This section leverages the robust structured knowledge representation capabilities of knowledge graphs to transform all extracted EMTPs into a knowledge base for downstream applications.
A knowledge graph is a structured semantic network that integrates entities, attributes, concepts, and their relations into a heterogeneous graph model [51]. The knowledge graph G based on EMTP characterizes elderly passenger attributes and their metro travel behaviors (i.e., No. 1–No. 14).
G =   < N ,   E >
N = U     T     OD     A
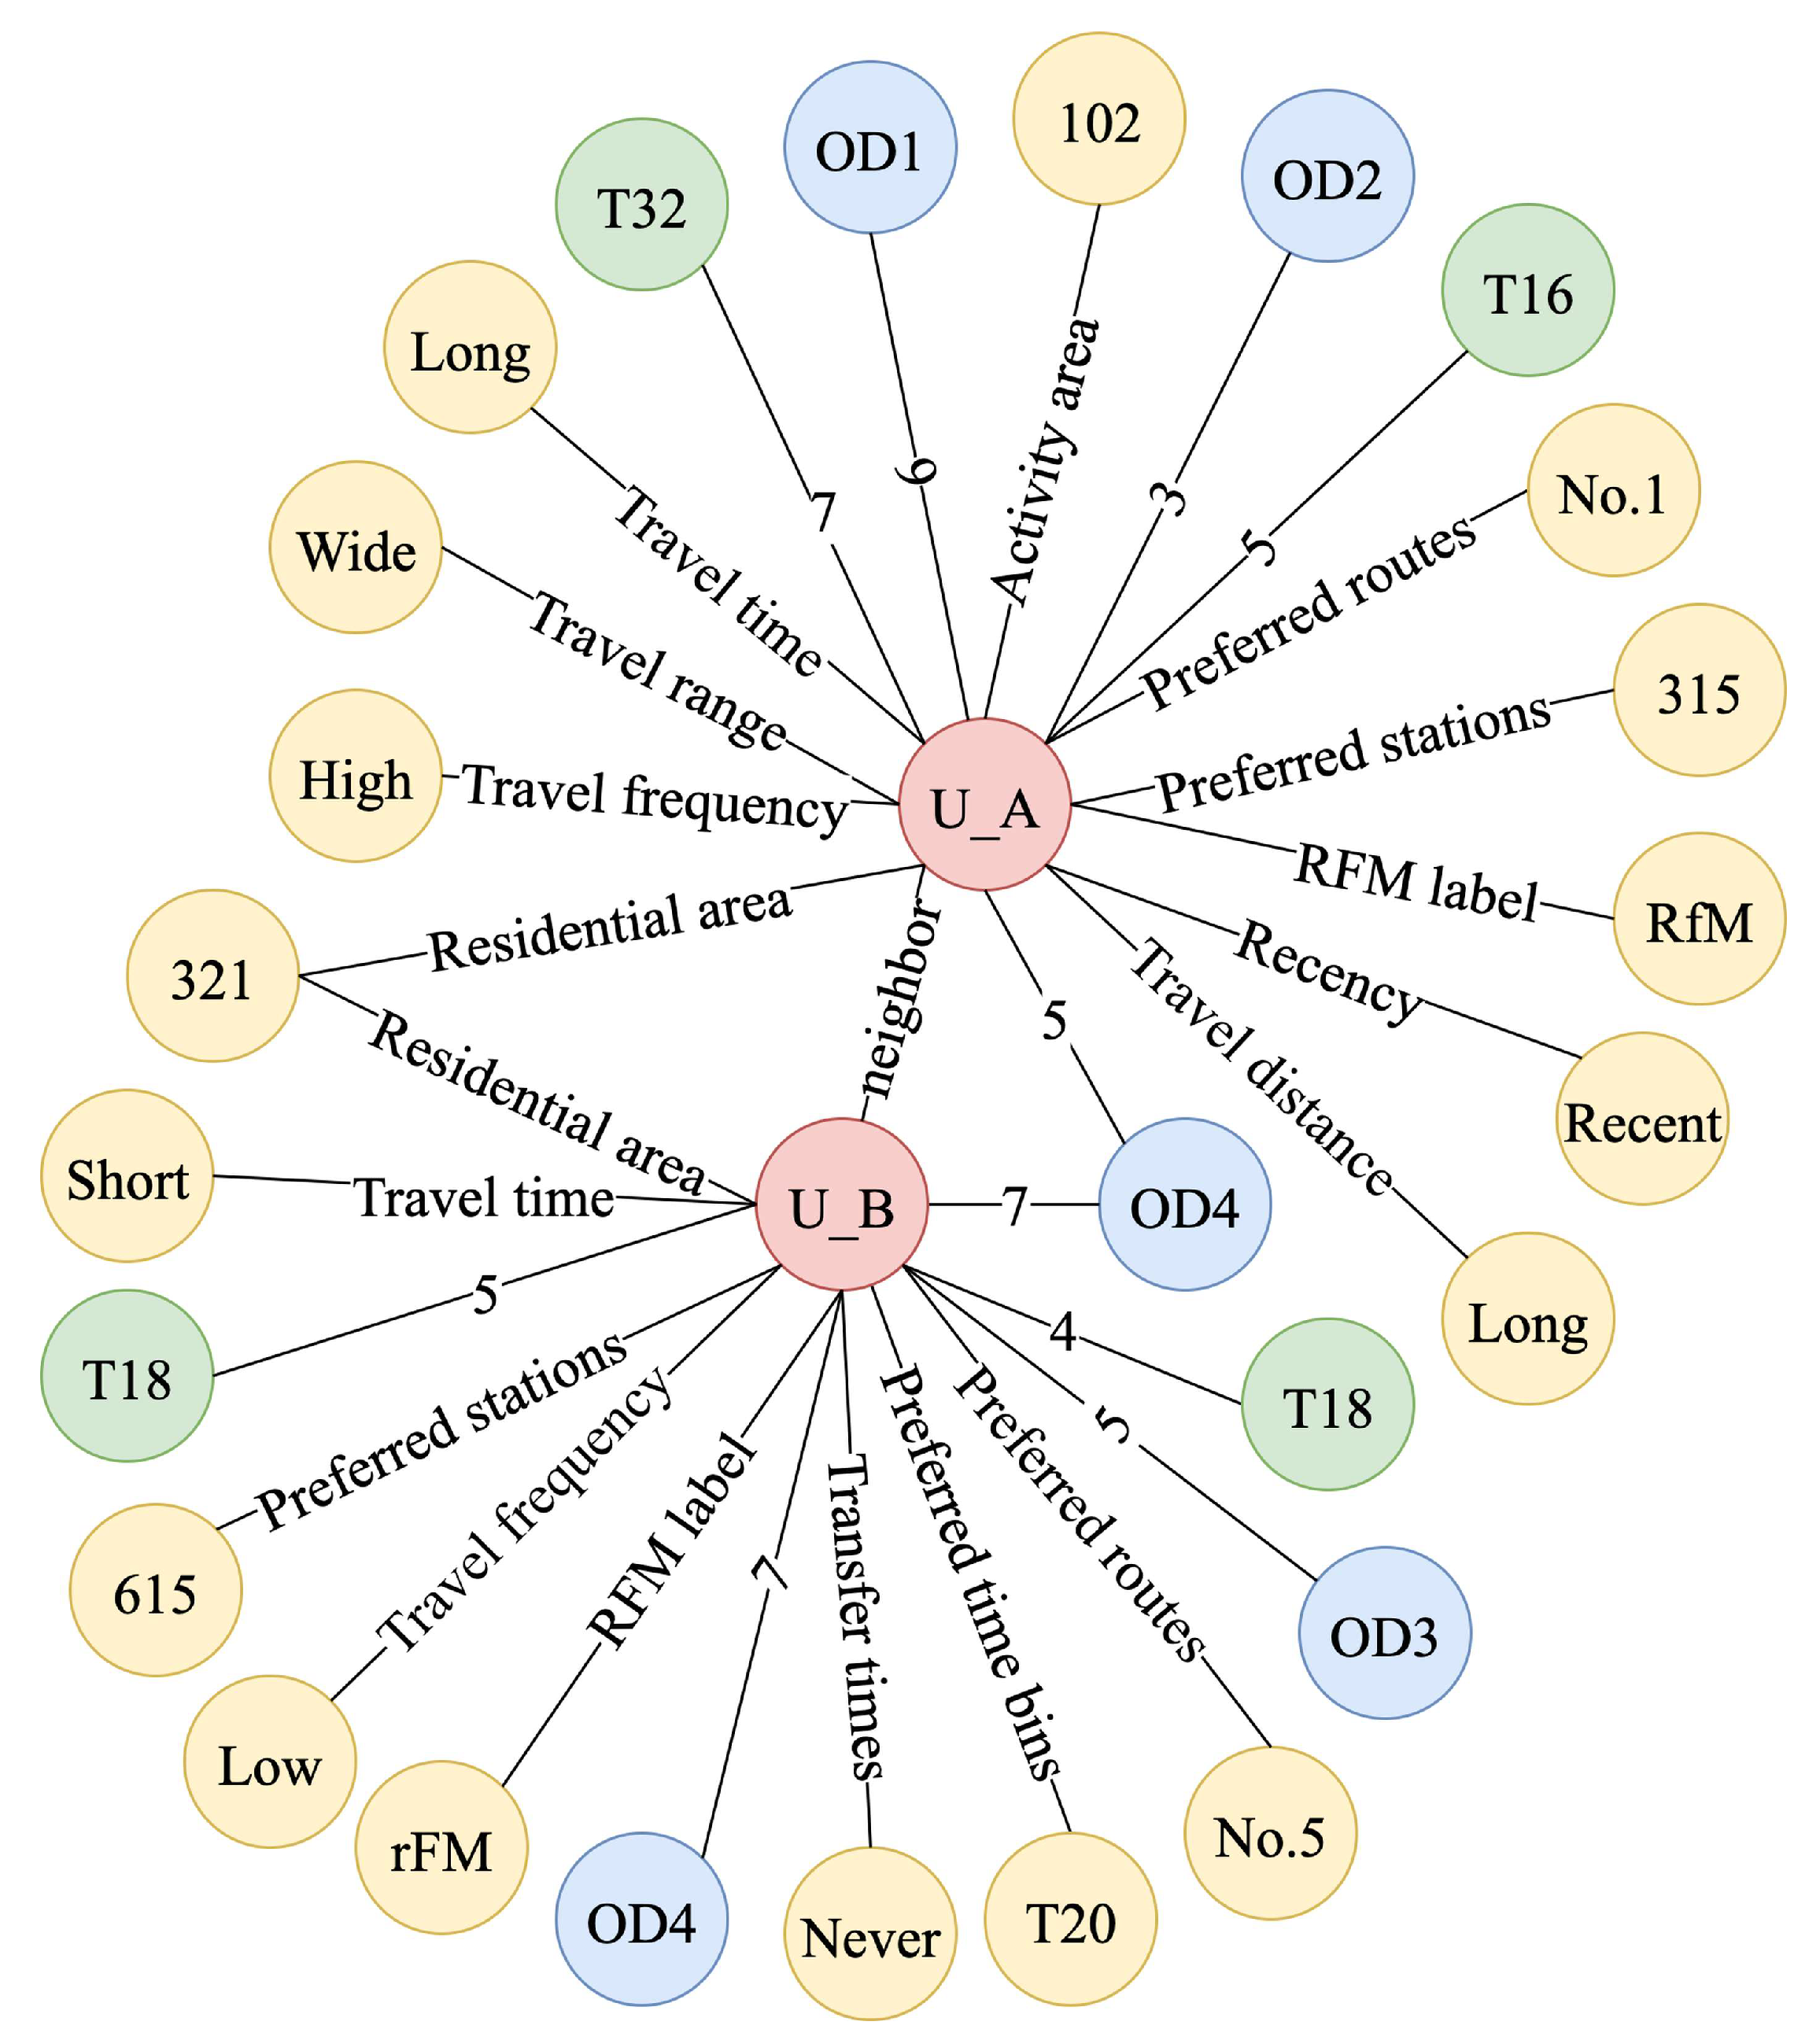
where N denotes the set of nodes, comprising passenger smart card ID ( U ), time bin ( T ), OD pairs ( OD ), and tag values ( A ). E represents the set of semantic edges connecting these nodes. An illustrative example of the EMTP-based knowledge graph, depicting two passengers, is presented in Figure 6. Red, blue, green, and yellow nodes represent U , T ,   OD , and A , respectively. Different node types are interconnected via semantic edges, with numerical weights indicating travel frequency between time bins and OD pairs. Semantic attributes describe tag names and relations between nodes.
As shown in Figure 7, the construction of the EMTKG follows the conventional stages of knowledge graph development: information acquisition, knowledge fusion, and knowledge processing [52]. The process begins by extracting a Behavioral graph (No. 14) from each EMTP as the fundamental component of the knowledge graph, incorporating all passenger labels (No. 1–No. 13). Next, the graph structure is transformed from <P-T-O-D> to <P-T-OD> by aggregating origin and destination sets. Subsequently, semantic connections between nodes are inferred and supplemented to enrich the graph. In this study, different EMTPs are fused by sharing OD pairs to connect different elderly travelers. Specifically, relationships between passengers are inferred based on shared residential area (metro station) identified during data preprocessing. Passengers sharing the same residential metro station are termed “neighbors”. Finally, the entire process concludes with adding all passenger labels (No. 1–No. 14) from the EMTPs into the knowledge graph.

4.4. Applications of EMTP-Based Knowledge Graphs

The EMTKG contains rich semantic information regarding elderly travelers’ basic attributes, travel behaviors, and preferences. As prior knowledge in the transportation field, the EMTKG supports various downstream tasks, such as mobility prediction [40] and passenger flow forecasting [53].
According to the definition of EMTKG, the graph G contains a spatiotemporal mobility pattern relation that describes the fact that an elderly passenger visits a specific POI at a certain time bin. This relation is defined as follows: If the fact that the elderly passenger u     U visited the POI c     I at time bin t     T is true, the spatiotemporal mobility pattern relation r V is defined to exist between u and c . I denotes the set of POI types. The fact is denoted by a tuple u ,   r V ,   c ,   t .
Based on this, the destination activity types prediction problem can be transformed into a knowledge graph completion problem, which is defined as follows: Given the observed elderly metro travel knowledge graph G , for each u     U , the target time bin t * u     T , and a POI c     I , infer whether the fact u ,   r V ,   c ,   t * u is true.
By enumerating all possible candidate POIs c     I and ranking them according to the plausibility of the corresponding facts, the activity type of the elderly passenger u at time bin t * u can be predicted.
However, EMTKG is inherently an unstructured heterogeneous graph, and its symbolic nature hinders its direct application. Graph embedding techniques address this challenge by mapping the graph structure into low-dimensional continuous vector spaces [54].
f   :   N R d
where f is the mapping function from nodes to d -dimension vectors. Similarly, the EMTKG can be embedded into vectors to serve as prior knowledge for destination activity types prediction.
To facilitate effective feature learning from various entities and relations within EMTKG and to accurately infer potential travel facts, the TNTComplEx model is introduced [55]. The model extends the ComplEx model with temporal modeling capabilities while preserving its core strength of embedding entities and relations into a complex vector space. Compared to real embeddings, complex embeddings provide enhanced capacity to capture asymmetric relations through conjugate operations [55], explicitly modeling the semantic interactions between entities and relations and forming the foundation of the model’s decision-making. Furthermore, the TNTComplEx model enhances temporal modeling by explicitly decomposing relation embeddings into “time-insensitive” components that capture persistent behavioral patterns and “time-sensitive” components that model dynamic patterns evolving over time. A temporal dynamic ratio β   =   d 1 / d is introduced, where d indicates the dimensions of the complex vector space, and d 1 indicates the dimensions of the relation embedding vector modulated by temporal dynamics. β quantifies the proportion of temporal variability within the relation embedding, thereby characterizing individual differences in time dependence among elderly travelers.
The embedding vectors are optimized by maximizing the plausibility of all facts, evaluated via a defined scoring function, thereby facilitating knowledge graph completion. Formally, each entity n     G is mapped to a continuous embedding vector n N     C d , where C d denotes the d -dimensional complex vector space. For any elderly passenger u     U , who visited a POI of type c     I during time bin t     T , the scoring function for the fact tuple x = u ,   r V ,   c ,   t is defined as Equation (9).
f   u ,   r V ,   c ,   t = Re < u E ,   r V E ( t ,   A ) ,   c E ¯ > = z = 1 d u z E r V z E c z E ¯
where u E , r V E , and c E denote the embedding vectors of the elderly passenger u , the spatiotemporal relation r V , and the POI type c , respectively, with U z E , r V z E , and c z E represent their z -th components in the complex vector space. < · > indicates the multi-linear dot product. c E ¯ is the complex conjugate of c E , and Re ( o ) is the real part of a complex number o . Additionally, the embedding vector r V E ( t ,   A ) for the spatiotemporal mobility pattern relation is modeled as a dynamic function of the time bin t and label information A , as specified in Equation (10). Elderly travel behavior exhibits significant temporal variability. The elderly who transport grandchildren or regularly visit hospitals show strong time-dependent mobility patterns, while others display more flexibility.
To capture the distinct characteristics of time-sensitive and time-sensitive travel behaviors, the embedding vector for the spatiotemporal mobility pattern relation is decomposed into two complementary components. Time-sensitive subvector r V     C d 1 explicitly interacts with the temporal embedding vector t E ¯     C d 1 to model rigid schedules. Time-insensitive subvector r V     C d - d 1 remains independent of time, capturing flexible behaviors.
r V E ( t ,   A ) = r V t E ¯ ,   r V     A E
A E = e A e E
where denotes the element-wise product. ·   ,   · represents vector concatenation. A E is the embedding vector of the label information A , computed by element-wise multiplication of all entity embeddings within A, as given in Equation (11). Predictions based on the knowledge graph are inherently semantically traceable. For instance, a high-confidence prediction of a “Medical Service” activity type for a passenger can be traced back to behavioral tags in their user profiling, such as “high travel frequency”, and explained through semantic relational paths like (User, frequently_visits, Station_X) and (Station_X, has_land-use function, Medical Service). This explicit association based on the graph structure ensures the transparency and interpretability of the model’s decision process.
For each training tuple x   =   u ,   r V ,   c ,   t , the cross-entropy loss of elderly travelers’ visits to POI categories is employed as the loss function, as shown in Equation (12).
l V ( x ) = f u ,   r V ,   c ,   t + log c I expf u ,   r V ,   c ,   t
To improve computational efficiency, negative sampling is adopted. Specifically, for each positive sample x   =   u ,   r V ,   c ,   t , the number of negative samples N neg is randomly selected, with their categories c sampled based on C n c (i.e., replacing the positive sample’s category c randomly). The loss function is approximated as in Equation (13).
l V ( x )   log σ f u ,   r V ,   c ,   t + h = 1 N neg E c h ~ C n c log σ f u ,   r V ,   c ,   t
where σ is the sigmoid function. The total loss function of the model is the sum over all training tuples, as expressed in Equation (14). Minimizing the total loss enables joint optimization of entity and relation embeddings, thereby improving predictive accuracy. The overall computational complexity during training is given by Equation (15).
L V = x G l V ( x )
O N epoch · G · d · N neg + m
where G is the number of tuples, and m is the number of labels. Updating each fact requires time given by Equation (16).
O d · 1 + m
During the prediction stage, to obtain the top-k results, all candidate POI categories I must be scored comprehensively, precluding the use of negative sampling. The total complexity in this stage is given by Equation (17).
O U · d · m + n
Algorithm 2 shows pseudocode describing the process of learning entity embeddings. In each training epoch, the model performs mini-batch sampling of facts from the dataset and updates embeddings via gradient descent based on the aforementioned loss function.
Algorithm 2: Training algorithm for EMTKG.
Input: Training set G   = u ,   r V ,   c ,   t ; EMTP tag set EMTP u ; N epoch ; N neg .
Initialize: initialize embeddings u E C d , t E C d , c E C d , r V C d 1 , r V C d - d 1 .
Method:
1. for  i 1 , , N epoch  do
2.     S     G
3.    while  S      do
4.       Sample a mini-batch S batch     S
5.        S     S     S batch
6.        L   0
7.       for each u ,   r V ,   c ,   t S batch   do
8.            A     EMTP u
9.            a E   element-wise product of embeddings of tags in A
10.          r V E     r V     t E ¯ ,   r V     a E
11.          s +     Re < u E ,   r V E ,   c E ¯ >
12.         Construct negative sample set N s   =   c 1 , , c k
13.          for each c in negatives do
14.              s -     Re < u E ,   r V E ,   c E ¯ >
15.             L     L   +   log 1 + e s -
16.          end for
17.           L     L   +   log 1 + e - s +
18.      end for
19.      Update parameters of embeddings w.r.t the gradients using L
20.  end while
21. end for
Output: embeddings U E , C E , T E , A E , R V E .
Algorithm 3 presents pseudocode describing the process of destination activity types prediction based on the EMTKG. For each elderly passenger u and the target time bin t * u , the algorithm evaluates the score f u ,   r V ,   c ,   t * u for each candidate POI category c , selecting the category with the highest score as the predicted outcome. Figure 8 further illustrates the workflow for destination activity types prediction utilizing EMTKG.
Algorithm 3: Predicting future movement based on EMTKG.
Input: The set of target time t * u u U , EMTP tag set EMTP u , the embeddings of all entities including U E , C E , T E , A E , R V E .
Method:
1. for  u U  do
2.      A     EMTP u
3.      a E   element-wise product of embeddings of tags in A
4.      t E   embeddings of t * u
5.      r V E     r V     t E ¯ ,   r V a E
6.     for  c C  do
7.          f c   =   f   u ,   r V ,   c ,   t * u     Re < u E ,   r V E ,   c E ¯ >
8.     end for
9.      c * u   =   argmax c   f c
10. end for
Output: c * u u U , where each c * u presents the POI predicted to be visited by u at time t * u .

5. Experiment

5.1. Problem Statement

The objective of mobility prediction is to predict the elderly’s activity types at metro trip destinations for future time bins based on historical trajectories within a pre-defined time window. This study proposes that activity types strongly correlate with the land-use function of each metro station, determined by the dominant POI category in its service area. Accordingly, the mobility prediction problem is outlined as follows:
Problem: Given historical mobility records tr u u U within a one-month window and a target time t * u u U , predict the activity type c * u of each elderly passenger u U at the time bin t * u .

5.2. Compared Algorithms

To evaluate the performance of the proposed model, this study compares it against several recent representative mobility prediction models serving as baselines.
(1)
LSTM: Long short-term memory (LSTM) is a classical Recurrent neural network (RNN) architecture effective at capturing temporal dynamics through gating mechanisms, but limited in modeling spatial dependence [56].
(2)
DeepMove: DeepMove incorporates an attention mechanism into RNN and integrates spatiotemporal, semantic, and contextual information to capture complex spatiotemporal dependences in human mobility patterns [57].
(3)
APHMP: Attention-based personalized human mobility prediction (APHMP) is a trajectory prediction model that combines attention mechanisms with hierarchical spatial modeling. To mitigate potential privacy concerns, this study removes its original decentralized learning module [58].
(4)
ARNN: Attentional recurrent neural network (ARNN) introduces an attention mechanism into RNN and leverages semantic information extracted from knowledge graphs to enhance the understanding of semantic relations between locations and spatial context. In this study, a lightweight knowledge graph is constructed using label information to support this model [59].
While traditional statistical models (e.g., Hidden Markov Models (HMM) [60]) based on probability distributions or macro-level patterns are initially considered, numerous authoritative studies in recent years have demonstrated that deep learning-based models significantly outperform traditional approaches in capturing the complex spatiotemporal dependencies and highly nonlinear characteristics of human mobility behavior [14,32,35,57,60,61]. These studies collectively highlight the inherent limitations of traditional models in representing fine-grained and semantic individual mobility patterns. Furthermore, traditional methods often suffer from high computational complexity and poor scalability, which severely limit their practical application. Consequently, to align with the latest research trends and to enable a direct, state-of-the-art comparison, this study focuses on a comparative analysis of the four most representative deep learning models mentioned above.

5.3. Evaluation Metrics

Model performance is evaluated using mean reciprocal rank (MRR) and accuracy at top-k (Acc@k) metrics, calculated as Equations (18) and (19) [62,63].
MRR = 1 Q q = 1 Q 1 ran k q
Acc @ k = 1 Q q = 1 Q ran k q k
where Q denotes the number of mobility records in the test set; ran k q represents the rank position of the true activity type within the predicted results for the q -th record. MRR reflects the average of the reciprocal ranks of the true activity types, while Acc@k indicates the proportion of true activity types appearing within the top-k predictions. In this study, the values of k are set to 1, 3, and 5, corresponding to the correctness of top-1, top-3, and top-5 activity type predictions, respectively. Both metrics range from 0 to 1, with higher values indicating superior predictive performance.

5.4. Experimental Setting

The datasets are divided chronologically according to the timestamps of card swipe records for each elderly passenger. Specifically, the first 70% records of each elderly passenger are regarded as the training set, the middle 10% records are selected as the validation set, and the last 20% records are used as the test set to evaluate the performance of the prediction model. The partitioning strategy strictly prevents data leakage and ensures a realistic and unbiased evaluation of the model’s ability to generalize to unknown future time bins.
All the experiments are conducted on a Windows 11 workstation (CPU: Intel Core (TM) i9-9900K @ 3.6 GHz, RAM: 32 GB, GPU: NVIDIA GeForce GTX 2080Ti with 11 GB VRAM). The models are implemented based on Python 3.12.6 and PyTorch 2.6.0 frameworks.
In this study, the embedding dimensions for all entities and relations are uniformly set to 100. The learning rate is tuned within the range of 0.01 to 0.1. To enhance model generalization, both the embedding and temporal regularization coefficients are set to 0.01, applied, respectively, to the entity/relation embedding matrices and the temporal dynamic modeling module. Considering the temporal dependency inherent in mobility patterns, the temporal dynamic ratio β is set to 0.5.
The batch size of the mini-batch training strategy is set to 256, and the Adam optimizer is applied for model training. For the TNTComplEx model, the number of negative samples per positive instance is set to 5. An early-stop strategy is employed to prevent overfitting, terminating training if the validation performance does not improve significantly over 10 consecutive epochs.

5.5. Experimental Results

5.5.1. Overall Performance

Table 4 presents that the proposed model significantly outperforms all baselines across four metrics, demonstrating the superiority of integrating user profiles and knowledge graph embeddings for destination activity types prediction. Specifically, it achieves a 13.37% improvement in Acc@1 over ARNN and a 26.01% increase over the traditional LSTM. Unlike conventional temporal models relying solely on historical trajectories, the proposed model overcomes limitations in capturing semantic and spatial relations. Although DeepMove incorporates attention mechanisms to model trajectory context, the proposed model retains attention and leverages structured prior knowledge through the knowledge graph, enhancing generalization capabilities. While APHMP utilizes user profiles, it fails to capture behavioral dynamics effectively. Compared to ARNN with static graph embeddings, the proposed model models the temporal dependencies of travel behaviors, significantly improving adaptability to complex mobility scenarios. In summary, the proposed model exhibits stronger generalization and achieves more accurate human mobility prediction.

5.5.2. Ablation Experiments

According to the proposed model structure, user profile tags, knowledge graph embedding, and temporal dynamic modeling are the vital components of the model. In this subsection, this study further validates the importance of each component through ablation experiments.
As shown in Table 5, the full model outperforms all control variants across four metrics, confirming that the combined contribution of all components enhances prediction accuracy. Removing user profile tags causes a 6.38% decrease in MRR, highlighting the importance of the user profile framework in characterizing long-term preferences and enriching semantic representations. Omitting the temporal dynamic modeling module reduces MRR by 4.52%, demonstrating that distinguishing between time-sensitive and time-insensitive behaviors aids in capturing the evolving nature of mobility patterns. The control model utilizing only user profiles with XGBoost achieves the lowest performance, with an MRR of 71.35%, indicating that the absence of graph-structured and dynamic relation modeling severely impairs complex behavior representation and prediction.
Collectively, the experiments validate the effectiveness and superiority of the modeling paradigm that integrates semantic information and structured temporal knowledge graphs for mobility prediction.

5.5.3. Impact of Temporal Dynamics

To further examine the impact of temporal dynamic modeling, this subsection analyzes the regulatory role of the temporal dynamic ratio β . As depicted in Figure 9, increasing β from 0 initially improves the Acc@1 and MRR metrics, reaching a peak at β = 0.5 (with MRR attaining 89.59%), before declining, forming an inverted U-shaped curve. At low β values, the model overly relies on static user profiles, limiting its capacity to capture temporal dynamics and reducing accuracy. Conversely, high β values excessively emphasize temporal sensitivity, neglecting long-term preferences and diminishing generalization. The results demonstrate that the TNTComplEx model effectively enhances adaptability to diverse behavioral patterns, significantly improving prediction accuracy and robustness.

5.5.4. Computational Efficiency

Table 6 details the computational costs of all predictive models. These comparisons are conducted on the same workstation and batch size to ensure fairness. Results indicate that the proposed model contains fewer parameters, less than 60% of the second-best ARNN, and reduces graphics processing unit (GPU) memory consumption by 36.30%. Additionally, in terms of computational efficiency, the proposed model decreases the training time per epoch by 22.80% compared to LSTM and by 52.40% compared to ARNN. Consequently, the proposed model reduces both resource consumption and training time, offering a technically feasible solution for large-scale deployment in age-friendly mobility services.

6. Discussion and Conclusions

This study proposes a novel knowledge graph to address the modeling and prediction of elderly passengers’ travel behaviors. Here, the mobility trajectories of the elderly are modeled as the facts of spatiotemporal mobility pattern relations, and the mobility prediction task is defined as predicting the elderly’s activity types at metro trip destinations and transformed into a knowledge graph completion problem. Unlike traditional methods relying solely on historical trajectories, this study first develops the EMTP through a data-driven approach, encompassing data preprocessing, OD extraction, temporal discretization, identification of residential and activity locations, as well as land-use function of metro stations, and construction of a hierarchical tag system. This process enables a structured and interpretable characterization of the basic attributes, spatiotemporal features, and travel preferences of elderly individuals. Building upon this, all extracted EMTPs are semantically connected to generate a structured EMTKG, facilitating semantic reasoning about individual preferences and travel patterns. Furthermore, the destination activity types prediction problem is reformulated as a knowledge graph completion task, incorporating TNTComplEx to embed entities and relations into a continuous low-dimensional vector space while explicitly modeling temporal dynamics to distinguish between time-sensitive and time-insensitive behaviors. The plausibility of facts within the knowledge graph is evaluated by a scoring function. The proposed model integrates user profiling, dynamic temporal modeling, and knowledge graph embedding, significantly enhancing prediction accuracy. Experiments conducted on a dataset of elderly metro travel in Chongqing demonstrate that the proposed model outperforms widely used baseline methods, with ablation studies confirming the necessity of each component for accurate activity types prediction.
With regard to how the proposed EMTP and EMTKG framework can serve for transport planning, we hold the following expectations. By utilizing daily updated smart card data, public transport authorities can promptly obtain the travel records of each passenger (i.e., card ID), allowing for the timely updating of the EMTP and the corresponding knowledge graph. This enables the real-time tracking of travel demand patterns for the elderly. Transport planners can then construct group profiles for different regions and obtain the demand distribution, accurately capturing the spatiotemporal dynamics of demand. Through timely operational adjustments, such as optimizing metro timetables and frequencies on specific lines during periods of high elderly travel demand, which can empower a precise supply–demand balance. Furthermore, based on the individualized insights from the EMTP, transportation service providers can deliver personalized information, such as optimal route recommendations and service change notifications, directly to elderly passengers via mobile applications or information displays, enhancing their travel experience. The rich semantic relationships within the EMTKG could also be leveraged to develop novel personalized services, such as facilitating social interactions among elderly travelers with shared travel patterns or destinations, thereby fostering a more supportive and engaging travel environment within the metro system.
There is still much room for future researchers. Firstly, due to data limitations, only observation data from a single month (i.e., metro smart card data from December 2019) were utilized in this study. This limits the analysis of seasonal variations and long-term behavioral patterns in elderly metro travel. Additionally, relying solely on metro smart card data and POI data cannot capture complete door-to-door trip chains of the elderly, which could affect the comprehensiveness and accuracy of activity type predictions at destinations. With the availability of new data sources, future research could focus on developing an improved framework integrating all possible data (e.g., bus IC cards, GPS trajectories, mobile signaling data) in the public transportation system. Thereby enabling the construction of high-quality, user profile-based travel knowledge graphs. Furthermore, external environmental factors are not considered, such as weather and special events, which may influence elderly travel behavior, which could affect prediction robustness in atypical scenarios. Future studies could incorporate dynamic environmental embeddings into the knowledge graph, and state-of-the-art techniques in knowledge graphs could also be adopted to improve the construction process, including information acquisition, knowledge fusion, and knowledge processing to develop knowledge-based solutions tailored to specific problems. These extension works will support the development of more precise urban transportation service supply and dynamic resource allocation in the context of an aging population.

Author Contributions

Conceptualization, J.Y., Y.Z. (Yang Zhang), Q.T., T.W. and Y.Z. (Yi Zhang); Methodology, J.Y.; Software, J.Y.; Validation, J.Y., F.S., X.L. and P.Y.; Formal analysis, J.Y.; Investigation, J.Y., F.S., X.L. and P.Y.; Resources, J.Y., Y.Z. (Yang Zhang), Q.T. and Y.Z. (Yi Zhang); Data curation, J.Y.; Writing—original draft, J.Y.; Writing—review & editing, J.Y.; Visualization, J.Y.; Supervision, Y.Z. (Yang Zhang), Q.T., T.W. and Y.Z. (Yi Zhang); Project administration, F.S. and T.W.; Funding acquisition, Y.Z. (Yang Zhang), Q.T. and Y.Z. (Yi Zhang). All authors have read and agreed to the published version of the manuscript.

Funding

This research was funded by Science and Technology Commission of Shanghai Municipality (Nos. 24511107002, 23dz1203200, 23dz1202400, and 22dz1203200) and Shanghai Planning Office of Philosophy and Social Science (Nos. 2023BSH003 and 2022BSH005).

Data Availability Statement

The data presented in this study are available upon request from the authors.

Acknowledgments

The authors thank all the people who support this research, including anonymous reviewers for their valuable comments that have greatly improved this paper.

Conflicts of Interest

The authors declare no conflicts of interest.

Abbreviations

The following abbreviations are used in this manuscript:
POIpoints of interest
ODorigin-destination
EMTPelderly metro travel profile
EMTKGelderly metro travel knowledge graph
TNTComplExTemporal and Non-Temporal ComplEx
APIapplication programming interface
TF-IDFterm frequency-inverse document frequency
MRRmean reciprocal rank
Acc@kaccuracy at top-k
GPUgraphics processing unit

References

  1. United Nations Department of Economic and Social Affairs. World Population Prospects 2024: Summary of Results; UN DESA/POP/2024/TR/NO.9; United Nations: New York, NY, USA, 2024. [Google Scholar]
  2. State Council of China. National Economy Witnessed Steady Progress Amidst Stability with Major Development Targets Achieved Successfully in 2024. Available online: https://www.stats.gov.cn/english/PressRelease/202501/t20250117_1958330.html (accessed on 31 July 2025).
  3. Ravensbergen, L.; Van Liefferinge, M.; Isabella, J.; Merrina, Z.; El-Geneidy, A. Accessibility by public transport for older adults: A systematic review. J. Transp. Geogr. 2022, 103, 103408. [Google Scholar] [CrossRef]
  4. Ravensbergen, L.; Newbold, K.B.; Ganann, R.; Sinding, C. ‘Mobility work’: Older adults’ experiences using public transportation. J. Transp. Geogr. 2021, 97, 103221. [Google Scholar] [CrossRef]
  5. Acharya Samadarshi, S.C.; Taechaboonsermsak, P.; Tipayamongkholgul, M.; Yodmai, K. Quality of life and associated factors amongst older adults in a remote community, Nepal. J. Health Res. 2022, 36, 56–67. [Google Scholar] [CrossRef]
  6. Maresova, P.; Krejcar, O.; Maskuriy, R.; Bakar, N.A.A.; Selamat, A.; Truhlarova, Z.; Vítkova, L. Challenges and opportunity in mobility among older adults–key determinant identification. BMC Geriatr. 2023, 23, 447. [Google Scholar] [CrossRef]
  7. Kim, S. Effects of perceived accessibility to living infrastructure on positive feelings among older adults. Behav. Sci. 2024, 14, 1025. [Google Scholar] [CrossRef]
  8. Maresova, P.; Komarkova, L.; Truhlarova, Z.; Tomsone, S.; Joukl, M.; Vítková, L.; Horák, J. Influence of mobility and technological factors of mobility on the quality of life of older adults: An empirical study focused on mobility as a mediator. J. Transp. Health 2025, 42, 102015. [Google Scholar] [CrossRef]
  9. Sun, H.; Jing, P.; Wang, B.; Ye, J.; Du, W.; Luo, P. More travel, more well-being of older adults? A longitudinal cohort study in China. J. Transp. Health 2023, 32, 101672. [Google Scholar] [CrossRef]
  10. State Council of China. Railway Offers Discounts for Senior Riders. Available online: https://english.www.gov.cn/news/202503/18/content_WS67d8cea9c6d0868f4e8f0ec0.html (accessed on 31 July 2025).
  11. Schouten, A.; Wachs, M.; Blumenberg, E.A. Cohort analysis of driving cessation and limitation among older adults. Transportation 2022, 49, 841–865. [Google Scholar] [CrossRef]
  12. Remillard, E.T.; Campbell, M.L.; Koon, L.M.; Rogers, W.A. Transportation challenges for persons aging with mobility disability: Qualitative insights and policy implications. Disabil. Health J. 2022, 15, 101209. [Google Scholar] [CrossRef]
  13. Daganzo, C.F.; Ouyang, Y. A general model of demand-responsive transportation services: From taxi to ridesharing to dial-a-ride. Transp. Res. Part B Methodol. 2019, 126, 213–224. [Google Scholar] [CrossRef]
  14. Liang, Y.; Ding, F.; Huang, G.; Zhao, Z. Deep trip generation with graph neural networks for bike sharing system expansion. Transp. Res. Part C Emerg. Technol. 2023, 154, 104241. [Google Scholar] [CrossRef]
  15. Guo, R.; Guan, W.; Vallati, M.; Zhang, W. Modular autonomous electric vehicle scheduling for customized on-demand bus services. IEEE Trans. Intell. Transp. Syst. 2023, 24, 10055–10066. [Google Scholar] [CrossRef]
  16. Shi, Z.; Zhou, C.; Cheng, L.; He, M.; Liu, Y. Examining spatial variations in walking activity among older adults considering the impact of topographical characteristics. Transp. Res. Rec. 2025, 2679, 458–475. [Google Scholar] [CrossRef]
  17. Buehler, R.; Pucher, J.; Wittwer, R.; Gerike, R. Travel behavior of older adults in the USA, 2001–2017. Travel Behav. Soc. 2024, 36, 100783. [Google Scholar] [CrossRef]
  18. Zhang, Y.; Yao, E. Exploring elderly people’s daily time-use patterns in the living environment of Beijing, China. Cities 2022, 129, 103838. [Google Scholar] [CrossRef]
  19. Ozbilen, B.; Akar, G.; White, K.; Dabelko-Schoeny, H.; Cao, Q. Analysing the travel behaviour of older adults: What are the determinants of sustainable mobility? Ageing Soc. 2024, 44, 1964–1992. [Google Scholar] [CrossRef]
  20. Kang, S.; Cole, S.; Choe, Y. The influence of future time perspective on older adults’ travel intention. Curr. Issues Tour. 2023, 26, 1254–1267. [Google Scholar] [CrossRef]
  21. Hansmann, K.J.; Gangnon, R.; McAndrews, C.; Robert, S. Social and Environmental Characteristics Associated With Older Drivers’ Use of Non-driving Transportation Modes. J. Aging Health 2024, 08982643241258901. [Google Scholar] [CrossRef]
  22. Villena-Sanchez, J.; Boschmann, E.E.; Avila-Forcada, S. Daily travel behaviors and transport mode choice of older adults in Mexico City. J. Transp. Geogr. 2022, 104, 103445. [Google Scholar] [CrossRef]
  23. Klein, S.; Brondeel, R.; Chaix, B.; Klein, O.; Thierry, B.; Kestens, Y.; Perchoux, C. What triggers selective daily mobility among older adults? A study comparing trip and environmental characteristics between observed path and shortest path. Health Place 2023, 79, 102730. [Google Scholar] [CrossRef]
  24. Cheng, L.; Shi, K.; De Vos, J.; Cao, M.; Witlox, F. Examining the spatially heterogeneous effects of the built environment on walking among older adults. Transp. Policy 2021, 100, 21–30. [Google Scholar] [CrossRef]
  25. Xue, J.; Si, B.; Cui, H.; Zhu, S. Research on hierarchical clustering method of urban rail transit passengers based on individual portrait. J. Phys. Conf. Ser. 2021, 1883, 012039. [Google Scholar] [CrossRef]
  26. Liu, Y.; Zhou, Z.; Li, Y.; Jin, D. Urban knowledge graph aided mobile user profiling. ACM Trans. Knowl. Discov. Data 2024, 18, 1–30. [Google Scholar] [CrossRef]
  27. Yaakub, N.; Napiah, M. Public bus passenger demographic and travel characteristics: A study of public bus passenger profile in Kota Bharu, Kelantan. In Proceedings of the 2011 National Postgraduate Conference, Perak, Malaysia, 19–20 September 2011; IEEE: Piscataway, NJ, USA, 2011; pp. 1–6. [Google Scholar] [CrossRef]
  28. De Ona, J.; de Oña, R.; Diez-Mesa, F.; Eboli, L.; Mazzulla, G. A composite index for evaluating transit service quality across different user profiles. J. Public Transp. 2016, 19, 128–153. [Google Scholar] [CrossRef]
  29. Liu, S.; Jiang, H. Personalized route recommendation for ride-hailing with deep inverse reinforcement learning and real-time traffic conditions. Transp. Res. Part E Logist. Transp. Rev. 2022, 164, 102780. [Google Scholar] [CrossRef]
  30. Wang, P.; Liu, K.; Jiang, L.; Li, X.; Fu, Y. Incremental mobile user profiling: Reinforcement learning with spatial knowledge graph for modeling event streams. In Proceedings of the 26th ACM SIGKDD International Conference on Knowledge Discovery & Data Mining, San Diego, CA, USA, 6–10 July 2020; ACM: New York, NY, USA, 2020; pp. 853–861. [Google Scholar] [CrossRef]
  31. Wang, L.; Wang, Y.; Sun, X.; Wu, Y.; Peng, F.; Chen, C.H.P.; Song, G. Public transit passenger profiling by using large-scale smart card data. J. Transp. Eng. Part A Syst. 2023, 149, 04023013. [Google Scholar] [CrossRef]
  32. Liu, X.; Wu, M.; Peng, B.; Huang, Q. Graph-based representation for identifying individual travel activities with spatiotemporal trajectories and POI data. Sci. Rep. 2022, 12, 15769. [Google Scholar] [CrossRef] [PubMed]
  33. Zhang, Q.; Ma, Z.; Zhang, P.; Jenelius, E. Mobility knowledge graph: Review and its application in public transport. Transportation 2025, 52, 1119–1145. [Google Scholar] [CrossRef]
  34. Lu, H.; Uddin, S. A parameterised model for link prediction using node centrality and similarity measure based on graph embedding. Neurocomputing 2024, 593, 127820. [Google Scholar] [CrossRef]
  35. Yao, S.; Zhang, H.; Wang, C.; Zeng, D.; Ye, M. GSTGAT: Gated spatiotemporal graph attention network for traffic demand forecasting. IET Intell. Transp. Syst. 2024, 18, 258–268. [Google Scholar] [CrossRef]
  36. Mlodzian, L.; Sun, Z.; Berkemeyer, H.; Monka, S.; Wang, Z.; Dietze, S.; Luettin, J. nuScenes knowledge graph: A comprehensive semantic representation of traffic scenes for trajectory prediction. In Proceedings of the IEEE/CVF International Conference on Computer Vision (ICCV), Paris, France, 1–6 October 2023; IEEE: Piscataway, NJ, USA, 2023; pp. 42–52. [Google Scholar] [CrossRef]
  37. Chongqing Municipal Statistical Bureau. Chongqing Statistical Yearbook; China Statistics Press: Chongqing, China, 2021. [Google Scholar]
  38. Wang, F.; Yuan, X.; Zhou, L.; Zhang, M. Integrating ecosystem services and landscape connectivity to construct and optimize ecological security patterns: A case study in the central urban area Chongqing Municipality, China. Environ. Sci. Pollut. Res. 2022, 29, 43138–43154. [Google Scholar] [CrossRef]
  39. Liu, C.; Su, X.; Wu, Z.; Zhang, Y.; Zhou, C.; Wu, X.; Huang, Y. Exploration of the mountainous urban rail transit resilience under extreme rainfalls: A case study in Chongqing, China. Appl. Sci. 2025, 15, 735. [Google Scholar] [CrossRef]
  40. Su, S.; Zhang, H.; Wang, M.; Weng, M.; Kang, M. Transit-oriented development (TOD) typologies around metro station areas in urban China: A comparative analysis of five typical megacities for planning implications. J. Transp. Geogr. 2021, 90, 102939. [Google Scholar] [CrossRef]
  41. Yuan, N.J.; Zheng, Y.; Xie, X.; Wang, Y.; Zheng, K.; Xiong, H. Discovering urban functional zones using latent activity trajectories. IEEE Trans. Knowl. Data Eng. 2015, 27, 712–725. [Google Scholar] [CrossRef]
  42. GB50137-2011; Code for Classification of Urban Land Use and Planning Standards of Development Land. China Architecture & Building Press: Beijing, China, 2011.
  43. Cheng, Z.; Zhang, X. A novel intelligent construction method of individual portraits for WeChat users for future academic networks. J. Ambient Intell. Humaniz. Comput. 2020, 11, 1–12. [Google Scholar] [CrossRef]
  44. Liu, X.; Zhou, Y.; Rau, A. Smart card data-centric replication of the multi-modal public transport system in Singapore. J. Transp. Geogr. 2019, 76, 254–264. [Google Scholar] [CrossRef]
  45. Xu, F.; Xia, T.; Cao, H.; Li, Y.; Sun, F.; Meng, F. Detecting popular temporal modes in population-scale unlabelled trajectory data. Proc. ACM Interact. Mob. Wearable Ubiquitous Technol. 2018, 2, 1–25. [Google Scholar] [CrossRef]
  46. Tang, J.; Wang, X.; Zong, F.; Hu, Z. Uncovering spatio-temporal travel patterns using a tensor-based model from metro smart card data in Shenzhen, China. Sustainability 2020, 12, 1475. [Google Scholar] [CrossRef]
  47. Alessandretti, L.; Sapiezynski, P.; Sekara, V.; Lehmann, S.; Baronchelli, A. Evidence for a conserved quantity in human mobility. Nat. Hum. Behav. 2018, 2, 485–491. [Google Scholar] [CrossRef]
  48. Xu, Y.; Belyi, A.; Bojic, I.; Ratti, C. How friends share urban space: An exploratory spatiotemporal analysis using mobile phone data. Trans. GIS 2017, 21, 468–487. [Google Scholar] [CrossRef]
  49. Wilbert, H.J.; Hoppe, A.F.; Sartori, A.; Stefenon, S.F.; Silva, L.A. Recency, frequency, monetary value, clustering, and internal and external indices for customer segmentation from retail data. Algorithms 2023, 16, 396. [Google Scholar] [CrossRef]
  50. Long, B.; Wu, X.; Zhang, Z.; Yu, P.S. Unsupervised learning on k-partite graphs. In Proceedings of the 12th ACM SIGKDD International Conference on Knowledge Discovery and Data Mining, Philadelphia, PA, USA, 20–23 August 2006; ACM: New York, NY, USA, 2006; pp. 317–326. [Google Scholar] [CrossRef]
  51. Liu, T.; Shen, H.; Chang, L.; Li, L.; Li, J. Iterative heterogeneous graph learning for knowledge graph-based recommendation. Sci. Rep. 2023, 13, 6987. [Google Scholar] [CrossRef]
  52. Yin, Z.; Chen, Y.; Gu, J.; Ying, S.; Guo, Y. A knowledge graph construction method based on co-occurrence for traffic entity prediction. Int. J. Appl. Earth Obs. Geoinf. 2025, 142, 104717. [Google Scholar] [CrossRef]
  53. Zeng, J.; Tang, J. Combining knowledge graph into metro passenger flow prediction: A split-attention relational graph convolutional network. Expert Syst. Appl. 2023, 213, 118790. [Google Scholar] [CrossRef]
  54. Wang, Q.; Mao, Z.; Wang, B.; Guo, L. Knowledge graph embedding: A survey of approaches and applications. IEEE Trans. Knowl. Data Eng. 2017, 29, 2724–2743. [Google Scholar] [CrossRef]
  55. Lacroix, T.; Obozinski, G.; Usunier, N. Tensor decompositions for temporal knowledge base completion. arXiv 2020, arXiv:2004.04926. [Google Scholar] [CrossRef]
  56. Li, M.; Lu, F.; Zhang, H.; Chen, J. Predicting future locations of moving objects with deep fuzzy-LSTM networks. Transp. A Transp. Sci. 2020, 16, 119–136. [Google Scholar] [CrossRef]
  57. Feng, J.; Li, Y.; Zhang, C.; Sun, F.; Meng, F.; Guo, A.; Jin, D. DeepMove: Predicting human mobility with attentional recurrent networks. In Proceedings of the 2018 World Wide Web Conference, Lyon, France, 23–27 April 2018; ACM: New York, NY, USA, 2018; pp. 1459–1468. [Google Scholar] [CrossRef]
  58. Yu, Q.; Wang, H.; Liu, Y.; Jin, D.; Li, Y.; Zhu, L.; Feng, J. Mobility prediction via rule-enhanced knowledge graph. ACM Trans. Knowl. Discov. Data 2024, 18, 1–21. [Google Scholar] [CrossRef]
  59. Guo, Q.; Sun, Z.; Zhang, J.; Theng, Y.L. An attentional recurrent neural network for personalized next location recommendation. In Proceedings of the AAAI Conference on Artificial Intelligence, New York, NY, USA, 7–12 February 2020; AAAI Press: Palo Alto, CA, USA, 2020; Volume 34, pp. 83–90. [Google Scholar] [CrossRef]
  60. Qiao, Y.; Si, Z.; Zhang, Y.; Abdesslem, F.B.; Zhang, X.; Yang, J. A hybrid Markov-based model for human mobility prediction. Neurocomputing 2018, 278, 99–109. [Google Scholar] [CrossRef]
  61. Feng, J.; Li, Y.; Yang, Z.; Qiu, Q.; Jin, D. Predicting human mobility with semantic motivation via multi-task attentional recurrent networks. IEEE Trans. Knowl. Data Eng. 2022, 34, 2360–2374. [Google Scholar] [CrossRef]
  62. Liu, T.Y. Learning to rank for information retrieval. Found. Trends Inf. Retr. 2009, 3, 225–331. [Google Scholar] [CrossRef]
  63. Madani, O.; Connor, M.; Greiner, W. Learning when concepts abound. J. Mach. Learn. Res. 2009, 10, 2571–2613. [Google Scholar]
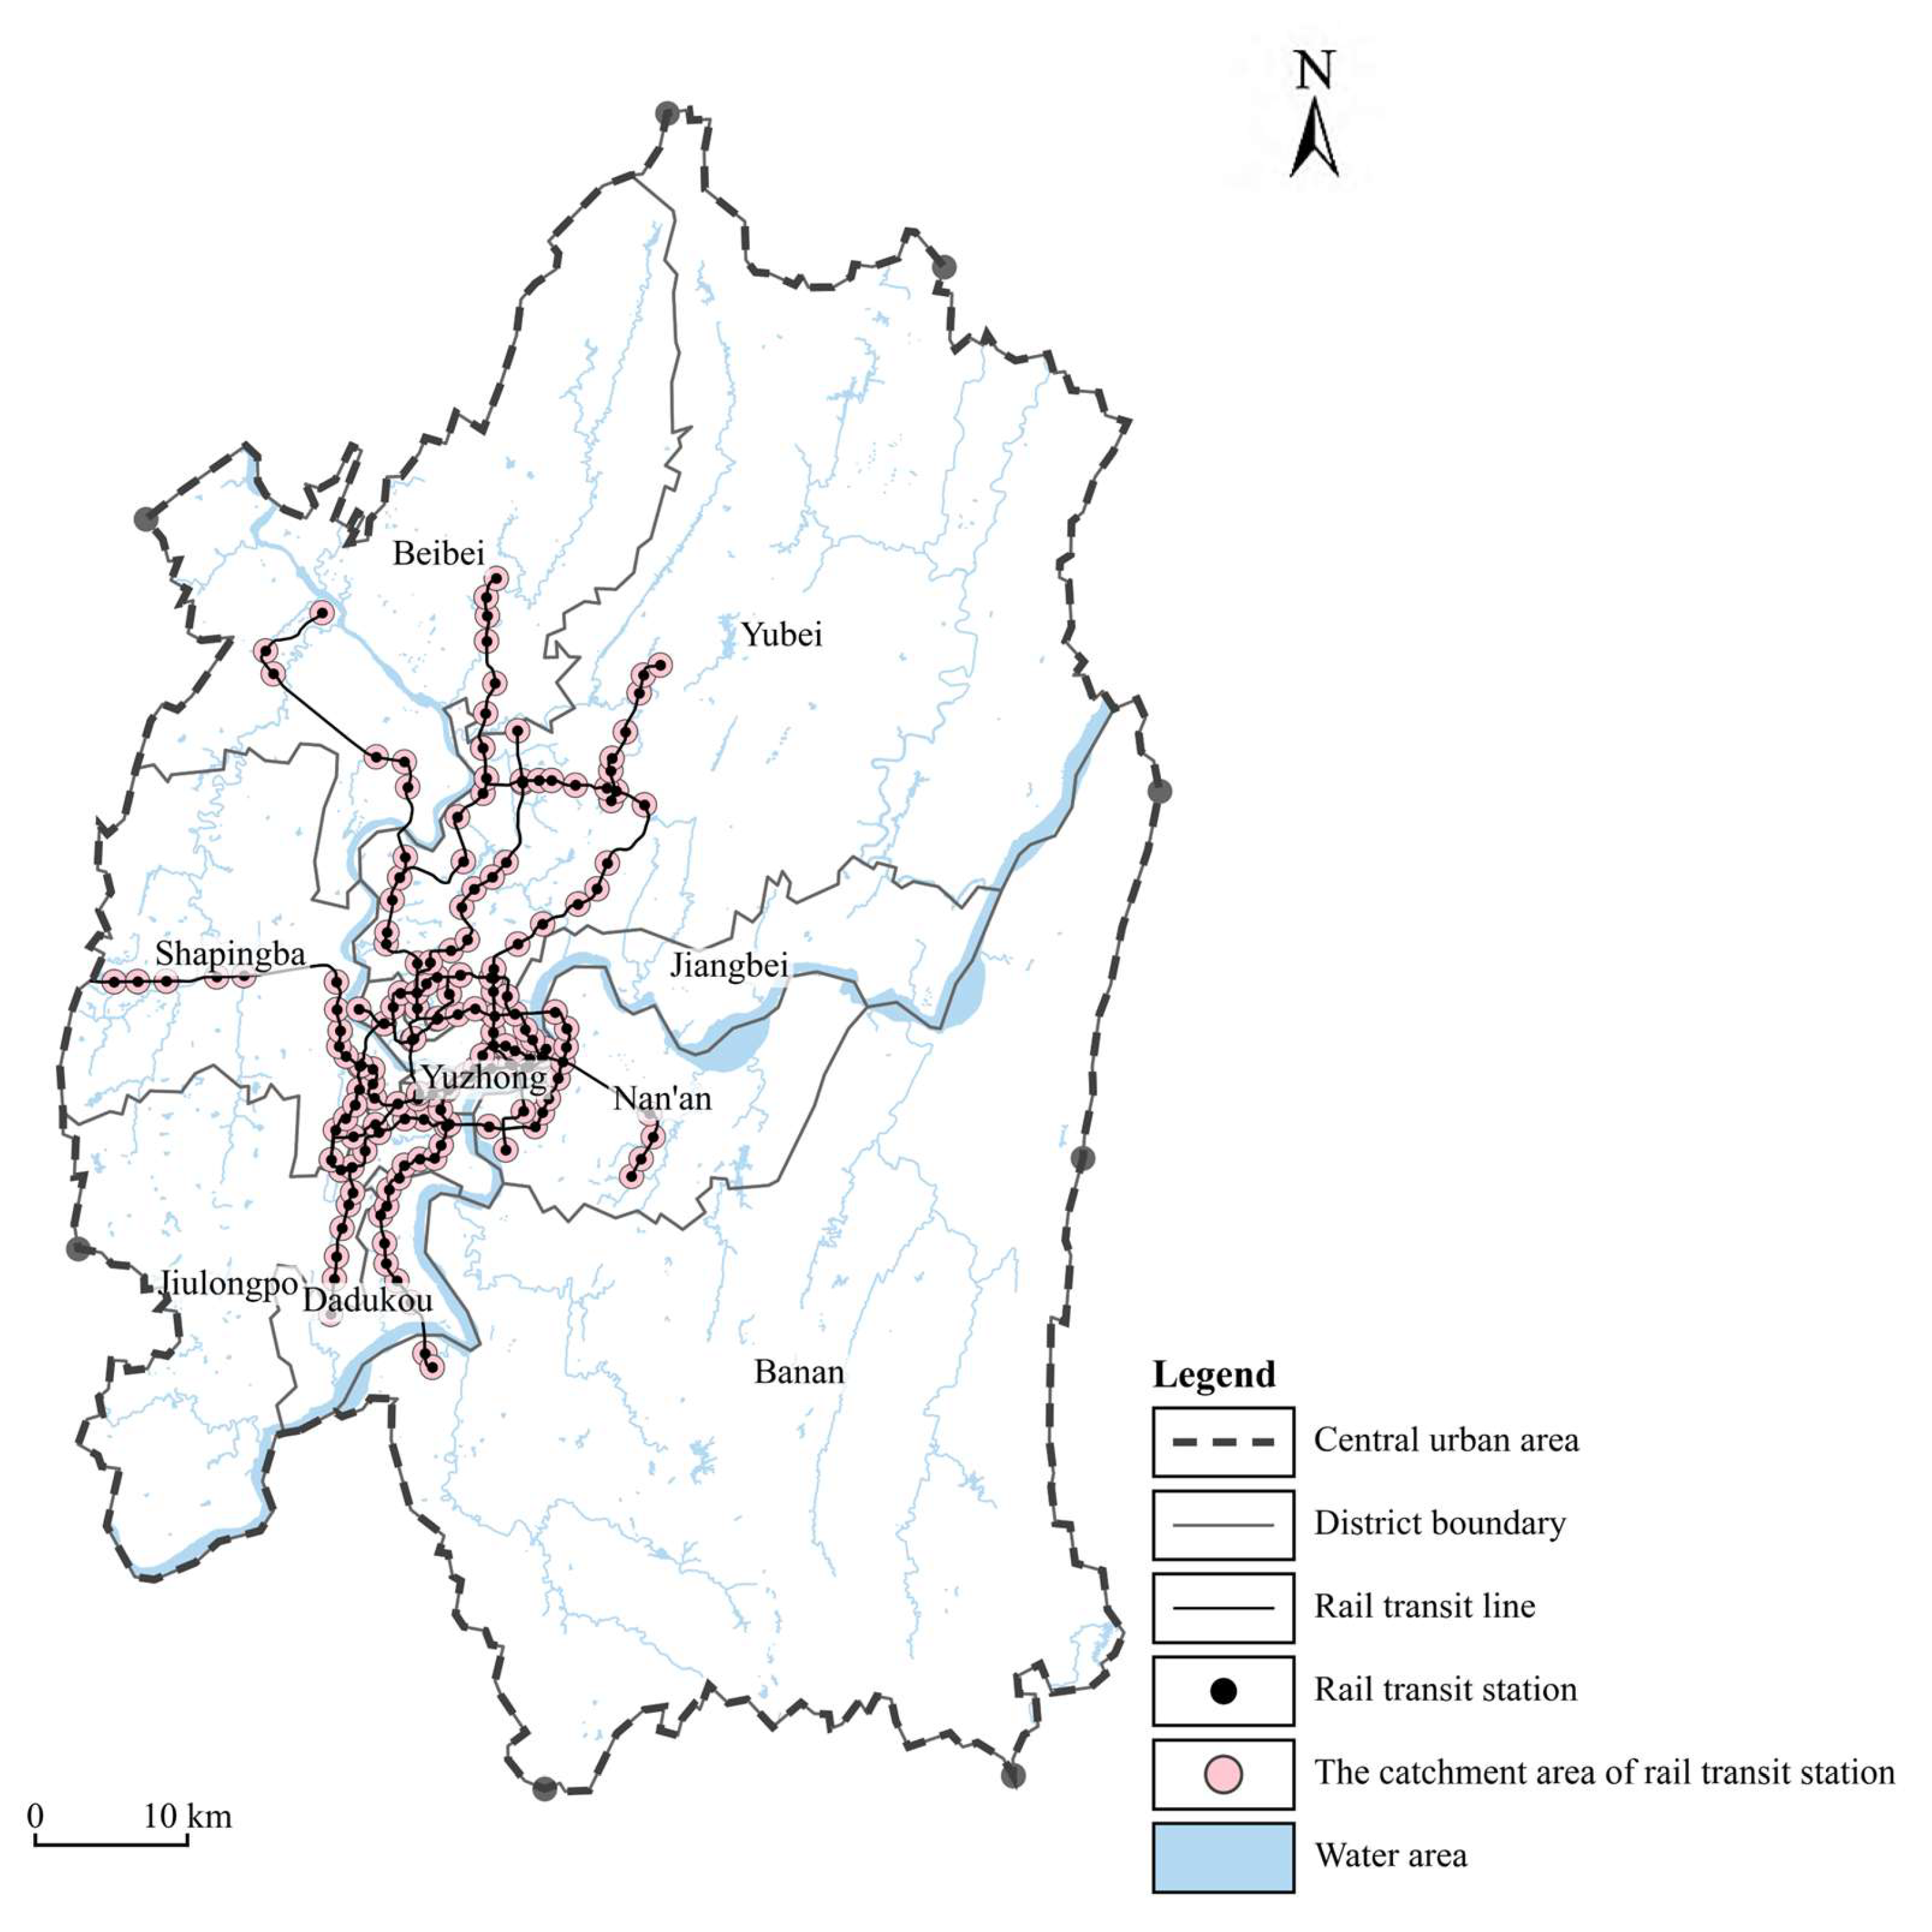
Figure 1. Study area.
Systems 13 00834 g001
Figure 2. Overall workflow of the study.
Systems 13 00834 g002
Figure 3. Workflow of data preprocessing.
Systems 13 00834 g003
Figure 4. Tag system for an elderly metro travel profile (EMTP).
Systems 13 00834 g004
Figure 5. Illustration of behavioral graph label.
Systems 13 00834 g005
Figure 6. Illustration of EMTP-based knowledge graph.
Systems 13 00834 g006
Figure 7. Workflow of EMTP-based knowledge graph construction.
Systems 13 00834 g007
Figure 8. Workflow of the proposed EMTKG-based destination activity types prediction method.
Systems 13 00834 g008
Figure 9. The performance on the Chongqing dataset as a function of the temporal dynamic ratio β .
Systems 13 00834 g009
Table 1. Basic information of a metro trip.
InformationExample
Smart Card ID4,000,000,000,530,598
Entry Time of Metro2 December 2019 08:55:00
Entry Station ID of Metro102
Entry Line ID of Metro1
Exit Time of Metro2 December 2019 09:19:20
Exit Station ID of Metro315
Exit Line ID of Metro3
Table 2. The classification and proportion of Chongqing points of interest (POI) data for 2019.
Land-Use FunctionNo.POI CategoriesProportion
ResidentialC1Residential Area9.25%
Administration and public services (C2–C6)C2Science/Culture and Education Service3.95%
C3Medical Service5.28%
C4Sports Service0.86%
C5Leisure and Entertainment Service1.62%
C6Daily Life Service14.33%
Commercial and business facilities (C7–C12)C7Food and Beverages18.20%
C8Shopping Center25.17%
C9Hotel2.72%
C10Enterprise8.34%
C11Finance and Insurance Service1.37%
C12Vehicle-Related Service2.18%
Transportation facilitiesC13Transportation Hub5.16%
IndustrialC14Industrial Park0.63%
Green space and squaresC15Tourist Attraction0.94%
Table 3. Definitions and classification of L1 labels.
No.Label L1DefinitionsCategories
1-Text Labels
2-Numeric Labels
Exclusivity
0-No
1-Yes
1Card IDCard ID2-
2RFMOutput of RFM model11
3Travel timeAverage time spent on travel days11
4RecencyTime interval from the last ride11
5Preferred time binsFrequently chosen travel time bins20
6Travel distanceStraight-line distance between residential area and activity area11
7Travel rangeDiversity of destinations visited11
8Residential area (Metro station)Frequently used metro stations near residential area20
9Activity area (Metro station)Frequently used metro stations near activity area20
10Preferred routes Frequently chosen metro routes20
11Preferred stations Stations with frequent visits20
12Transfer timesAverage transfer frequencies11
13Travel frequencyAverage frequencies of traveling by metro11
14Behavioral graphWeighted topological graphs storing the information of transition patterns2-
Table 4. Prediction performance of models.
ModelAcc@kMRR
k = 1k = 3k = 5
LSTM56.48%69.13%81.87%58.78%
APHMP60.92%85.33%92.72%74.10%
DeepMove68.93%87.38%93.61%79.57%
ARNN69.12%90.99%94.57%81.06%
the proposed model82.49%92.95%96.33%89.59%
Table 5. Ablation experiments on the Chongqing dataset.
ModelAcc@kMRR
k = 1k = 3k = 5
w/o profile tags A75.80%88.62%92.47%83.21%
w/o temporal dynamics78.33%90.11%94.02%85.07%
Only EMTP (XGBoost)63.20%79.84%85.91%71.35%
the proposed model82.49%92.95%96.33%89.59%
Table 6. Computational efficiency comparisons on the Chongqing dataset.
ModelParameter AmountGPU Occupation (MiB)Average Training Time (s/Epoch)
LSTM0.82 × 1061024 28.15
APHMP1.05 × 1061350 32.87
DeepMove1.38 × 1061680 39.02
ARNN2.85 × 1062910 45.63
the proposed model1.72 × 1061852 21.74
Disclaimer/Publisher’s Note: The statements, opinions and data contained in all publications are solely those of the individual author(s) and contributor(s) and not of MDPI and/or the editor(s). MDPI and/or the editor(s) disclaim responsibility for any injury to people or property resulting from any ideas, methods, instructions or products referred to in the content.