Abstract
Blockchain technology offers a novel solution to address the issue of information silos present in the complex network system of regional logistics service supply chains. Furthermore, enhancing the willingness of participants to engage in this system has emerged as a critical issue requiring urgent resolution. This study assumes bounded rationality and constructs an evolutionary game model to analyze the adoption behaviors of logistics service providers (LSPs) and logistics service integrators (LSIs) in a blockchain environment. The stability theorem of differential equations is employed to elucidate the inherent decision-making mechanisms present in the game. Acknowledging that traditional evolutionary mechanisms often neglect individual heterogeneity and the dynamic changes in the topological structures of complex networks, this study further involves the development of an evolutionary game model tailored for the complex network of a regional logistics service supply chain. After validating the effectiveness of the model, this research investigates how market environmental factors influence the adoption behaviors of LSPs and LSIs. Finally, through case simulations, the effects of key influencing factors on participatory behaviors within the regional logistics service supply chain are analyzed. The findings indicate that, in a blockchain environment, both prior to and following the adoption of complex network technology in the regional logistics service supply chain, the equilibrium stability of the network system is jointly determined by the total revenues of LSPs and LSIs. External factors in the blockchain environment significantly influence technology adoption strategies. Notably, when both the sensitivity coefficients of market demand relative to price and logistics service costs concerning quality enhancement are high, the willingness of supply chain participants to adopt the technology declines rapidly. As the quality elasticity increases, the technology adoption rates of providers and integrators initially stabilize and subsequently increase exponentially. Changes in the revenues of logistics service providers have no significant impact on technology adoption rates within the regional logistics service supply chain.
1. Introduction
As a fundamental, strategic, and leading industry in national economic and social development, the logistics industry holds significant importance for the high-quality development of national economies. Promoting the high-quality development of logistics facilitates the transformation of national industrial structure, enhances the efficiency of economic operations, and fosters the high-quality growth of the economy [1,2]. Logistics is the lifeblood of international trade, whereas trade itself is a powerful driver of economic growth and poverty alleviation. Taking China as a case study, the “Belt and Road” initiative has intensified integration among nations in the region through the construction and enhancement of regional logistics networks. This effort has fostered the effective allocation of resources and deepened market integration, thereby exerting a positive influence on the economic development of nations along its route [3,4]. Strengthening regional logistics systems significantly bolsters global value chains, particularly in the seamless coordination of critical stages such as product development, component production, and final assembly, which are paramount for maintaining the stability and competitiveness of global supply chains. According to data from the China State Railway Group Co., Ltd. in Beijing, China, as of December 2024, the China–Europe Railway Express effectively covers the entire Eurasian continent, serving 227 cities in 25 European countries and over 100 cities in 11 Asian nations. Its operations are further advancing regional logistics networks toward higher levels of sophistication. With the reduction in regional logistics barriers and declining trade costs, the flow of goods and services among nations has accelerated, thereby effectively enhancing international trade.
Regional logistics, serving as a crucial link between production and consumption within a regional economic system, plays a significant role in supporting and ensuring economic development and has emerged as a sustainable driving force for promoting high-quality economic growth. Regional logistics aims to serve regional economic and social development and consists of a regional logistics network system, an information system, and an organizational operation system. It achieves optimal functionality through overall coordination, meticulous planning, and effective control [5,6,7]. As the integrity and complexity of service outsourcing within the regional logistics system improve, various logistics organizations in the region respond to logistics demands and collaborate to establish a comprehensive regional logistics service system characterized by a multi-level supply–demand relationship, thereby forming a regional logistics service supply chain. The two primary participants in this supply chain are logistics service integrators (designers and providers of integrated logistics services) and functional logistics service providers (who supply specific logistics functions to the integrators) [8]. As the market environment evolves alongside industry competition and personalized consumer demand, it becomes challenging for existing single logistics providers to meet increasingly complex regional logistics service demands. The multi-level structure of the regional logistics service supply chain can effectively address this issue; however, in its operation, information in each stage does not reach all participating enterprises in a timely manner. This situation results in information asymmetry between logistics service providers and logistics service integrators, leading to moral hazard issues. Facilitating effective information sharing between providers and integrators constitutes a powerful strategy for addressing the current developmental challenges faced by regional logistics service supply chains.
Effective information sharing within regional logistics service supply chains necessitates a substantial flow of data among multiple entities. However, due to diverse economic development models, significant “information islands” persist between the upstream and downstream sectors. The “2023 Yangtze River Delta Regional Collaborative Innovation Index” report, released by China’s Shanghai Institute for Science of Science, indicates that in the Yangtze River Delta region of China, the absence of effective trust mechanisms and information-sharing platforms among enterprises poses significant challenges for small- and medium-sized enterprises (SMEs) seeking partners. This situation not only escalates transaction costs but also reduces overall logistics efficiency. “The Data Governance Act”, approved by the European Council in May 2022, indicates that the lack of unified information exchange standards and reliable data-sharing mechanisms often leads to delays, cargo losses, and other issues during cross-border transportation [9], severely affecting the operational efficiency of the entire supply chain.
These deficiencies, such as inadequate trust mechanisms and insufficient willingness to share information, result in inefficient logistics cooperation, poor information integration capabilities, and challenges in cross-regional collaboration. This significantly impedes the rational flow of data and inhibits regional economic development. Therefore, determining how networks within regional logistics service supply chains can collaborate through appropriate information-sharing strategies has become a critical issue that urgently requires resolution to collectively address fluctuations in market demand and sustain long-term stable cooperation.
Blockchain technology, characterized by decentralization, transparency, and immutability, ensures the authenticity and credibility of information, providing a novel solution to the “information island” problem within regional logistics service supply chain networks. Numerous countries and regions are actively promoting the development of blockchain technology and its applications in logistics through legislative support, capital investment, and public–private partnerships. For instance, the European Commission published the “Study on Data Sharing Between European Businesses”, which explores how to leverage blockchain to enhance logistics networks within Europe and collaborate with external partners [10]. Singapore’s Infocomm Media Development Authority (IMDA) has collaborated with various enterprises to develop multiple blockchain projects, thereby reinforcing its position as a global logistics hub [11]. Logistics companies are also proactively leveraging blockchain technology to establish information-sharing platforms. For example, Maersk and IBM collaboratively developed the TradeLens platform, which shares real-time data using blockchain technology, thereby enhancing the transparency and efficiency of the entire supply chain [12,13]. These examples clearly illustrate that blockchain technology can effectively address the issues of information asymmetry, inefficiency, and security deficiencies within regional logistics, facilitating the development of more efficient, reliable, and transparent regional logistics service supply chain networks.
Academic research has demonstrated that information sharing can reduce costs and enhance operational efficiency within logistics service supply chains [14]. Researchers have investigated the implementation mechanisms of information sharing in regional logistics and product supply chains in the context of blockchain technology [15,16,17]. However, the existing literature inadequately addresses the willingness of multiple entities within regional logistics service supply chains to share information and lacks studies on the factors influencing participation in these networks under blockchain technology. In light of this and considering the theoretical deficiencies and practical challenges of information sharing in current regional logistics supply chain networks, this study integrates evolutionary game theory into complex network systems, constructing an evolutionary game model for provider and integrator networks. This approach provides a theoretical foundation and practical guidance for establishing efficient information-sharing mechanisms within regional logistics service supply chain networks. This paper focuses on addressing the following key issues:
- Under bounded rationality, when logistics service integrators and providers engage in a game over blockchain adoption behaviors, how do the payoffs of the participating entities vary with different strategy combinations?
- In a blockchain environment, how do logistics service integrators and providers influence the evolutionarily stable strategies of the regional logistics service supply chain system?
- How can a complex network system of regional logistics service supply chains be constructed under blockchain, and how do the game strategies of integrators and providers change within the framework of complex networks?
By addressing these questions, the main contributions of this work are as follows: (1) An evolutionary game model is constructed for the adoption behaviors of logistics service providers and integrators under bounded rationality, elucidating the game decision-making process using the stability theorem of differential equations. (2) The evolutionary game model is integrated into a regional logistics complex network, establishing an evolutionary game model for the complex network of the regional logistics service supply chain and analyzing the Pareto optimal situation. (3) Finally, parameter conditions for influencing factors in realizing regional logistics service supply chain networks are provided, and targeted managerial insights are proposed.
The remainder of this paper is organized as follows: Section 2 reviews the related literature. Section 3 describes the basic problem under bounded rationality and constructs an evolutionary game model of the regional logistics service supply chain. Section 4 analyzes the evolutionary game model and coordination strategies within the complex network of the regional logistics service supply chain. Finally, case simulations are employed to explore the scope and differences in Pareto optimization for influencing factors, verifying the rationality and effectiveness of the proposed model.
2. Literature Review
2.1. Research on Information Sharing of Regional Logistics Supply Chains Under Blockchain Technology
As an important type of service supply chain, the logistics service supply chain has been extensively studied by both domestic and international scholars concerning the relationship between providers and integrators. Firstly, Virum and Persson [18] and Choy et al. [19] conducted preliminary research on the connotation and framework of the logistics service supply chain. Choy et al. [19] concluded that the logistics service supply chain is structured based on “functional logistics service providers → logistics service integrators → logistics customers”. In light of the uncertainties within the logistics service supply chain, an integrated logistics information management system was proposed to enhance management. In recent years, some scholars have proposed a supply chain information-sharing model focusing on product supply chains and analyzed the factors affecting the level of information sharing and the relationship between this level and enterprise performance [20,21]. However, there is limited research on the information-sharing decisions of enterprises within the service supply chain. The moral hazard and adverse selection issues stemming from information asymmetry within the regional logistics service supply chain have further led to a significant trust crisis between both parties, resulting in ineffective cooperative alliances in regional logistics. To achieve optimal scheduling and the automatic identification of information within the port logistics service supply chain, Duan et al. [22] designed contract coordination management for port logistics service chain information, improving the coordination management capabilities of port logistics service information contracts. Li et al. [23] focused on a logistics service supply chain composed of functional logistics service providers (FLSPs) and logistics service integrators (LSIs), constructing an evolutionary game model to discuss the dynamic selection process of enterprise information collaboration strategies. Feng et al. [24] established a port logistics service supply chain model consisting of port enterprises and shipping companies. They proposed that contractual cooperation is a crucial coordination mechanism for reducing costs, sharing information, and allocating risks within the supply chain. By introducing an evolutionary game model, they analyzed the evolution of such contractual cooperation, providing insights into how cooperative strategies develop and stabilize between port enterprises and shipping companies. Blockchain technology offers an effective solution to the challenges associated with information sharing. The benefits of openness, transparency, and decentralization inherent in blockchain technology can address the trust crisis within the regional logistics service supply chain. Tijan et al. [25] found that introducing blockchain technology minimizes the main challenges associated with logistics order delays, cargo damage, and multiple data entry. Yi [26] and Tan et al. [27] proposed a logical blockchain model to protect logistics privacy and implemented logistics blockchain technology on decentralized and distributed platforms. Adopting blockchain technology requires providers and integrators to introduce corresponding hardware, utilize software platforms, and increase management personnel to enhance the efficiency of transportation, warehousing, packaging, and other operations. However, the costs of logistics services utilizing blockchain technology are expected to increase further [28,29]. These studies indicate that the decision made by regional logistics entities to adopt blockchain technology constitutes a game-theoretic process among participants, with profit distribution being a primary concern. However, existing research has not illuminated the adoption behaviors of entities within regional logistics service supply chains in a blockchain environment, nor has it explored how the benefits to logistics service providers and integrators vary under different strategic combinations.
2.2. Research on Application of Evolutionary Game in Regional Logistics Coordination
The players in regional logistics parameters are boundedly rational, and decision-making requires the constant improvement of strategies through imitation and learning to identify the cooperative equilibrium solutions for each main player, thereby enhancing system revenue [30,31,32]. Evolutionary game theory, as a game model for boundedly rational players, serves as an analytical method that combines the game process with dynamic evolution [33]. From the perspective of evolutionary game theory, Zhang et al. [34] indicated that an effective logistics information collaboration strategy can enhance the success of enterprises in forming new partnerships within the supply chain. Centered on the maximization of benefits, they analyzed a strategic evolutionary game involving suppliers, manufacturers, and the collaboration between them. Liu et al. [35] explored the trend of ecological cooperation between logistics platforms and suppliers and employed evolutionary game theory to describe the multi-stage game equilibrium between the two parties and its preconditions. However, considering the interactions among participants in an actual regional logistics system that form a regional logistics service supply chain network with a topological structure, the evolving strategies between providers and integrators constitute an evolutionary game process, with the complex network serving as the medium. Wang et al. [36] noted that, with the progression of information technology, the infrastructure among enterprises and their interrelations exhibit complex network characteristics. The researchers employed evolutionary game theory to explore the dynamics of social returns and average social investment across three models under different network topologies, identifying the threshold ranges for their existence. Similarly, Jia et al. [37], adopting a complex network perspective, investigated the relationships among social capital within public–private partnership (PPP) projects, revealing the evolutionary trends of cooperative behaviors under various influences. Their research found that the network scale displayed varying sensitivities to default penalties and network density; the larger the network scale was, the more pronounced its sensitivity to default penalties was. Conversely, the network density exhibited the opposite effect. From these findings, it can be posited that general evolutionary game theory can reveal the decision-making mechanisms of regional logistics service supply chains; however, the interpersonal interactions within the game group in the network system remain unaddressed [38,39], and the exploration of the application mechanisms in the context of regional logistics service supply chains in a blockchain environment is inadequate.
In summary, the regional logistics service supply chain has garnered significant theoretical and practical attention in recent years, with both domestic and international research focusing on shared value, influencing factors, and operational mechanisms. On the one hand, while some scholars have explored the regional logistics service supply chain model, research on multi-agent games regarding the application of blockchain technology in complex network environments remains insufficient. On the other hand, blockchain has significantly transformed the coordination model of regional logistics; however, research on technology adoption from this perspective is still in an exploratory stage, and related efforts require further advancement.
In view of the current shortcomings, in the context of blockchain technology, a network evolutionary game model is constructed in this study to examine the adoption behaviors of logistics service providers and integrators. The study elucidates the decision-making mechanisms within the game using the stability theorem of differential equations. By employing complex network theory, the study reveals the interactive game behaviors among the system’s individuals. After validating the model’s effectiveness, it explores how relevant market environmental factors influence the blockchain adoption behaviors of providers and integrators. The results of this study not only provide scientific guidance for the promotion of blockchain technology in regional service supply chains but also enrich theoretical research on the implementation of blockchain technology in regional logistics.
3. Evolutionary Game Model of Regional Logistics Service Supply Chain
3.1. Problem Description
The functional logistics service provider and the logistics service integrator within the logistics supply chain maintain a two-way principal–agent relationship, facilitating the flow of logistics and information between the two parties. In the traditional regional logistics service supply chain model, the centralized nature of information interaction between providers and integrators renders the shared information untrustworthy and susceptible to tampering, which intermittently leads to moral hazards and adverse selection during operations. In the new model based on a blockchain environment, blockchain connects data blocks into a chain data structure by linking the nodes of providers and integrators sequentially, enabling the comprehensive transmission of information across the entire network. This technology facilitates immutable and decentralized blockchain information, thus addressing the issue of low reliability in logistics integration information. Under these circumstances, the information across the entire regional logistics service supply chain system is highly transparent. Utilizing a distributed algorithm, each node facilitates the self-verification, transmission, and management of information, thereby avoiding principal–agent moral hazard and adverse selection. As shown in Figure 1.

Figure 1.
Structural model of regional logistics service supply chain based on blockchain environment.
The adoption of blockchain technology within a regional logistics service supply chain is a game process involving two groups. In an uncertain environment, the two groups of providers and integrators engage in a boundedly rational dynamic game process. Evolutionary game theory no longer assumes that participants are completely rational; instead, it combines game theory with a dynamic evolutionary process to address bounded rationality problems. Therefore, this study employs evolutionary game theory to analyze the technology adoption behavior within the regional logistics service supply chain based on blockchain and identify the dynamic and evolutionary stable strategies of imitators. During the evolutionary game process, participants make choices based on expected return strategies.
3.2. Model Assumptions
Assumption 1: In the game process of adopting a regional logistics service supply chain based on blockchain, it is assumed that the probability of providers adopting it is (), and the probability of choosing not to adopt the strategy is . The probability of an integrator adopting it is (), and the probability of choosing not to adopt the strategy is .
Assumption 2: The logistics service price of the provider is , and the prices of logistics services in traditional mode and blockchain mode are and , respectively. Considering that the market demand will change with the price of logistics services, the price sensitivity coefficient is assumed to represent the degree of change in market demand caused by price, with .
Assumption 3: The logistics service quality of the provider is , and the logistics service quality in the traditional mode and blockchain mode are and , respectively. Considering that the market demand will change with the change in the logistics service quality, the quality elasticity coefficient is assumed to represent the sensitivity of changes in the market demand caused by changes in the product quality, with . The quality cost coefficient () represents the sensitivity of the logistics cost changes caused by quality changes.
Assumption 4: The service quality of integrators is , and the service quality of integrators in the traditional mode and blockchain mode are and , respectively. Considering that the market demand will change with the change in the logistics service quality, the service revenue coefficient is assumed to represent the benefits that providers gain from integrator services, with . The integrator service cost is , and the service costs of integrators in the traditional mode and blockchain mode are and , respectively.
Assumption 5: Assume that the market demand function is a linear function of the logistics service quality and price, and the cost is a binary exponential function of logistics service quality, while , , , and represent the basic market demand, demand function, cost function, and profit function ( = C or B).
Assumption 6: and represent the revenue distribution coefficients of providers and integrators, respectively, and meet the requirements , , and . and represent the unilateral adoption costs of providers and integrators, respectively, that is, the sunk costs such as the time cost and opportunity cost paid by the adopting party when one party chooses to adopt the strategy and the other party chooses not to adopt it. The meaning of the model parameters is shown in Table 1.

Table 1.
Meaning of model parameters.
3.3. Game Return Matrix
In the context of blockchain, when integrators and providers play the game of adoption behavior, the participants’ benefits vary depending on the combinations of strategies chosen. To solve the profit matrix of blockchain technology adoption behavior, it is essential to establish the profit function for the logistics service market. Referencing the literature [40,41], the market demand function in this study is set as , the logistics service cost function is , and the profit function is , = C, or B.
If both providers and integrators choose to adopt the logistics service supply chain, blockchain technology is successfully applied; that is, both parties’ strategies are (adopt, adopt), the provider’s service quality benefits from integrators are , and the integrator service cost is . Based on the market profits and income ratio /, providers and integrators receive the incomes and separately. Similarly, if both the provider and the integrator choose not to adopt, that is, the two parties’ strategies are (reject, reject), the provider’s service quality income from the integrator is and integrator service cost is . Based on the market profits and income ratio , , the incomes for providers and integrators are denoted as and , respectively.
In the blockchain setting, if the provider chooses to adopt behavior while the integrator chooses not to adopt, resulting in the strategies (adopt, reject), blockchain technology still cannot be realized. In this case, the provider’s service quality income from the integrator is , the provider unilaterally adopts the cost , and the integrator service cost is . Based on the market profits and income ratio /, providers and integrators receive the incomes and , respectively. Similarly, if the provider chooses not to adopt the behavior while the integrator chooses to adopt it, that is, both parties’ strategies are (reject, adopt), the application of blockchain technology cannot be effectively realized. In this scenario, the provider’s service quality benefits from the integrator are , integrators’ unilateral adoption cost is , and the integrator service cost is . Based on the market profits and income ratio /, the incomes of providers and integrators are represented as and , respectively.
The current evolutionary game revenue matrix between providers and integrators is presented in Table 2.
Table 2.
Evolutionary game return matrix.
3.4. Evolutionary Game Replicates Dynamic Equations
Based on the evolutionary game income matrix displayed in Table 2, when the provider opts to adopt the strategy, the expected income is
When the provider chooses not to adopt the strategy, the expected revenue is
Given the probabilities of the provider implementing the adoption behavior and opting not to adopt the strategy, the resultant average expected income is
Similarly, based on the evolutionary game income matrix presented in Table 2, when the integrator opts to adopt the strategy, the expected income is
When the integrator chooses not to adopt the strategy, the expected revenue is
Given the probabilities of the integrator implementing the adoption behavior and opting not to adopt the strategy, the resultant average expected income is
According to Malthusian’s dynamic equation, the growth rate of a provider or integrator adopting a strategy is calculated as the product of the difference between the expected revenue and the average expected revenue and the strategy probability. Therefore, the population replication dynamic equations for providers and integrators are presented in Equations (7) and (8):
3.5. Evolutionary Game Stability Analysis
When and , the evolutionary game reaches a partial stable equilibrium state; the obtained coordinate values are
Therefore, the partial equilibrium points of the evolutionary game are , , , , and .
, , and represent the change values of the service quality, service cost, and market profit of integrators after applying blockchain, respectively, namely , , ; at this time, and .
According to the replication dynamic equations (Equations (7) and (8)) for the provider and integrator, the Jacobian matrix of the evolutionary game-replicating dynamic system is as follows:
According to the Lyapunov stability analysis method, an equilibrium point is considered a partial stability point of the evolutionary game system if, and only if, all eigenvalues of the Jacobian matrix are negative. Five partial equilibrium points are then substituted into the Jacobian matrix of the system for stability analysis. Among these, four equilibrium points—, , , and —meet the requirements of the evolutionary stability strategy, while one equilibrium point, , does not qualify as an evolutionary stability strategy of the game system. After discussing the stability of the classified evolutionary game system, the following four different scenarios will be examined:
1: When and , that is, after the application of blockchain technology when the difference between the added profit value of the integrator and the added service cost value is less than zero and the sum of the added profit value of the provider and the added service value of the integrator is less than zero, the evolutionary stability strategy of the regional logistics service supply chain game system is (0,0).
2: When and , that is, after the application of blockchain technology when the difference between the added profit value of integrators and the added service cost value is greater than zero and the sum of the added profit value of providers and the added service value of integrators is less than zero, the evolutionary stability strategy of the regional logistics service supply chain game system is (0,0).
3: When and , that is, after the application of blockchain technology when the difference between the added profit value of the integrator and the added service cost value is less than zero and the sum of the added profit value of the provider and the added service value of the integrator is greater than zero, the evolutionary stability strategy of the regional logistics service supply chain game system is (0,0).
4: When and , that is, after the application of blockchain technology when the difference between the added value of providers in terms of profit and the added value of integrators in terms of service cost is greater than zero and the sum of the added value of providers in terms of profit and the added value of integrators regarding service cost is greater than zero, the evolutionary stability strategies of the regional logistics service supply chain game system are thus (0,0) and (1,1).
In summary, the combined influence of the sum of the added value of providers in terms of profit and the added value of integrators in terms of service income, along with the difference between the added value of integrators in terms of profit and service cost, jointly determines the evolutionary stability strategy of the regional logistics service supply chain system. The evolutionary game equilibrium point analysis is presented in Table 3.
Table 3.
Evolutionary game equilibrium point analysis.
The evolutionary game model for technology adoption behavior in the regional logistics service supply chain reveals the decision-making mechanisms of the “provider–integrator” dyad. Although it provides the final evolutionary stable states across five partial equilibrium points within four scenarios, it fails to clarify the specific processes of the evolutionary game between the two groups and the differences in their individual choices. As a result, the conclusions regarding the stability strategies of the “provider–integrator” system, based on the evolutionary game model in a blockchain environment, remain relatively abstract, making it challenging to formulate a macro model with a solid micro-foundation. Within the blockchain context, the transition from individual behavior to group behavior appears random and complementary. Essentially, both sides engage in evolutionary game processes mediated by complex networks, wherein individual strategies are influenced by changes in the network environment and structure. Therefore, relying solely on evolutionary game theory under a nonlinear framework does not effectively capture the intricate network game processes of both sides. To accurately interpret the evolutionary game dynamics in the context of complex networks within regional logistics service supply chains and to realistically represent the diversity and complexity of “provider–integrator” adoption behaviors in blockchain applications, in this study, a complex network evolutionary game model is developed. This model analyzes the evolving rules governing the game strategies of both parties within the network environment and reveals the evolutionary mechanisms underlying the network structure of technology adoption in regional logistics service supply chains. These insights contribute to a theoretical foundation for macro-controlling group behaviors in regional logistics amidst new technology applications.
4. Evolutionary Game Model of Complex Network in Regional Logistics Service Supply Chain
4.1. Complex Network of Regional Logistics Service Supply Chain
With the increasing number of individual nodes in the “provider–integrator” network within regional logistics, the interactions among these nodes lead to continuous structural changes, gradually evolving into various complex networks with distinct characteristics. For instance, in the digital age, regional logistics integrates and allocates resources through internet platforms. Many logistics enterprises lacking robust databases choose to collaborate with these platforms to form an efficient and comprehensive logistics service supply chain network, thus collectively promoting the digital advancement of the regional logistics industry. The regional logistics service supply chain network exhibits statistical characteristics typical of general complex networks, including small-world properties, clustering, and power-law distributions. The small-world nature of the “provider–integrator” network is characterized by strong correlations among individuals within clusters and weak correlations between individuals across clusters. The power-law distribution indicates an extremely uneven capacity for interaction among individuals. Individuals within the network adhere to the principle of “the rich get richer”, meaning that most “ordinary” nodes have few connections, whereas a limited number of “hub” nodes have numerous connections; this type of network is referred to as a scale-free network. Studies have demonstrated that scale-free networks are ubiquitous and that social networks exhibit characteristics of scale-free networks. Therefore, analyzing the evolutionary game of technology adoption behavior within regional logistics service supply chains in the context of complex networks holds significant practical value.
4.2. Complex Network Assumption in Blockchain Environment
According to the complex network structure and evolution law of the regional logistics service supply chain, the following assumptions are put forward.
Assumption 1: Individual nodes within a “provider–integrator” complex network cannot establish connection relationships with all other nodes. In the context of blockchain, complex network nodes select game participants from their local neighborhood. Provider nodes and integrator nodes are directly adjacent to each other, engaging in games solely with connected nodes.
Assumption 2: Given the presence of asymmetric information within the regional logistics service supply chain, individuals are bounded rational players operating in a complex network environment; furthermore, bounded rational interactions under incomplete information may not lead to optimal decision-making. The probability of selecting a “provider–integrator” strategy is positively correlated with the expected benefits associated with that strategy.
Assumption 3: The network nodes within the regional logistics service supply chain make decisions based on fixed rules, and the cross-stage strategy updates of these nodes are determined by comparing the income from the previous stage with the expected income from subsequent stages.
4.3. Evolution Rules of Complex Networks in Blockchain Environment
- (1)
- Evolution game process of complex network
The complex network of the regional logistics service supply chain comprises “provider–integrator” nodes; network connections signify a game relationship between these nodes, where each node possesses strategies for adoption and rejection. During the game process, connected nodes make decisions based on the strategy of their game partners and the expected income derived from the income matrix presented in Table 2. In each round of evolutionary strategy updates, network nodes engage in games with neighboring nodes, with a node’s income being the sum of its games with all neighboring nodes. At the conclusion of a new evolutionary cycle, network nodes assess whether to update their strategies based on the principle of maximum benefit and determine whether to change their game partners according to the height–value priority connection principle. Through the continuous evolution of the “provider–integrator” complex network, it eventually reaches a new stable state. The specific process of complex network evolution within the regional logistics service supply chain, as informed by blockchain technology, is illustrated in Figure 2.
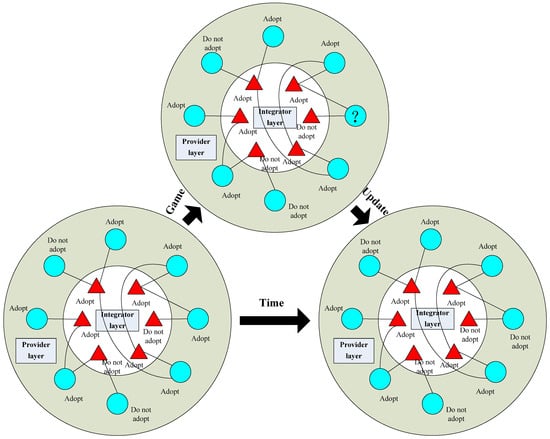
Figure 2.
Evolutionary game of complex network in regional logistics service supply chain.
As illustrated in Figure 2, the regional logistics service supply chain network in a blockchain environment leverages the benefit appreciation of the “provider–integrator” node as its driving force, continually evolving and converging toward the Pareto optimal state of the network system. Within the framework of complex networks, the popularity of blockchain technology has emerged as a critical criterion for assessing the breadth and depth of network evolution. Consequently, this study adopts the technology adoption rate (i.e., the total ratio of blockchain technology selected by system participants) as an effective index for measuring the state of the network game.
- (2)
- Upgrading rules for the complex network game strategy
The network evolutionary game of the regional logistics service supply chain based on blockchain is primarily driven by the upgrading rules associated with each complex network game strategy. Typically, game participants continually adjust their strategies according to the principle of profit maximization while adhering to the principle of preferential connection with high-value nodes. The upgrading rules of the evolutionary game strategy for “provider–integrator” network nodes primarily encompass the following: (1) The optimal upgrading rules, in which a node selects all surrounding nodes to achieve the highest average income strategy in the current round of the game, adopting this strategy as its profit maximization strategy in the subsequent round. (2) The superior upgrading rules, in which the network randomly selects neighboring nodes for income comparison. If its own income exceeds that of the selected node, it retains its own strategy. Conversely, if its own income is lower, it imitates the strategies of neighboring nodes with a probability proportional to the income difference, which then serves as the basis for the strategy in the subsequent round. (3) Policy upgrading rules based on revenue differences, in which network nodes randomly select domain nodes for payoff comparison; the probability of adopting the strategy of a selected node is positively correlated with the difference in revenue. Considering the information asymmetry inherent in the “provider–integrator” framework within a complex network, strategy updating rules based on income differences require knowledge of the income of the comparison node. However, game participants cannot ascertain whether the game object has benefited. Simultaneously, the main entities of the complex network game formulate optimal strategies based on the profit functions of selected nodes and the principle of maximizing benefits, rather than adopting strategies from superior players with the potential to upgrade the rules. Therefore, the upgrading rule for the “provider–integrator” complex network game strategy corresponds to the upgrading rule of the optimal player.
Given the bounded rationality of complex network game participants and the influence of network structure evolution on the strategy upgrades of the “provider–integrator” nodes, each time the network enters a new evolutionary cycle, the nodes first calculate the expected revenue based on the game function. They then determine the optimal revenue strategy for the next stage with a certain probability by comparing the expected revenue to the previous revenue. The Fermi function effectively describes the probability distribution of strategy updates in complex network games. The formula for the Fermi function used in this study is presented as follows:
and are the game strategies of the former stage and the latter stage of the network game players, respectively, while and denote the game income from the previous stage and the expected income for the upcoming stage. represents the noise of the evolutionary game system; when , it indicates that system disturbances have a minimal impact on the strategies of the network game participants, and when , it suggests that system disturbances become a critical factor influencing the strategies of the network game participants.
- (3)
- Connection rules of complex network game relations
In the evolutionary game process regarding the adoption behavior within the regional logistics service supply chain network, the network participant upgrades the policy with the probability and subsequently connects with other network nodes with a certain probability, . Given the scale-free network characteristics of the “provider–integrator” in the blockchain environment, participants tend to establish connections with nodes that possess high-resource endowments. Considering the bounded rationality of network game participants and employing stochastic utility theory with preference as the theoretical foundation for the connection rules in complex network games, in this study, the probability formula for the connection between network nodes, , is derived based on reference [31] and other studies as follows:
indicates the degree value of the network node, represents a complex network node set, indicates the connected node of a complex network, () indicates the network connection preference, and means that the higher the value is, the more significant the preference is.
- (4)
- Model solving
In the context of blockchain, the network nodes of the “provider–integrator” update their strategies according to evolutionary rules such as optimal updating, the Fermi function, and random utility theory with a preference, leading the game system to gradually converge toward a Pareto optimal state. The following outlines the solution steps for designing the game model of complex network evolution within the regional logistics service supply chain.
Step 1: Network construction, initializing the complex network of the regional logistics service supply chain in a blockchain environment.
Step 2: Strategy allocation, randomly allocating game strategies to network nodes.
Step 3: Periodic game, a new round of periodic games for network nodes.
Step 4: Strategy update; in the game cycle, the network node decides whether to update the strategy according to its own income and the expected income of the income function. If the expected income is higher than the obtained game income, the network node chooses to update the strategy with the probability ; otherwise, the original strategy is executed.
Step 5: Breaking edges and reconnecting. Based on the preference rules of complex network game relations, the network nodes reconnect with other nodes using the probability .
Step 6: Repeat the game. If the game system does not reach a stable state, return to Step 3 and repeat the above steps; otherwise, stop the game.
5. Numerical Experiment and Sensitivity Analysis
In this study, we employed numerical simulations to analyze the optimal decisions in the evolutionary game of regional logistics service supply chains within a complex network framework, particularly in the context of blockchain technology. The Pearl River Delta, recognized as one of China’s most economically vibrant and innovative regions, features a robust logistics industry chain and demonstrates a high level of regional integration. Shenzhen, serving as a pivotal hub in this logistics network, emphasizes innovation in blockchain technology and associated industrial layouts and has issued a series of policy documents that encourage supply chain enterprises to innovate and apply blockchain technology. These policies focus on enhancing operational capabilities, capitalizing on advanced technological opportunities, and exploring the demonstration of applications of blockchain in areas such as smart supply chains, digital government, and credit system construction.
We conducted field research and interviews with several representative logistics service supply chain enterprises, focusing on the cooperation dynamics in supply chain networks in a blockchain environment. For instance, the Easipont platform and Kuayue Express have established a global integrated logistics network, adopting a “supply chain + internet + blockchain” model powered by blockchain technology, primarily focusing on international logistics supply chain operations encompassing comprehensive logistics, network freight, and cross-border e-commerce logistics. Chiwan Oriental and Meitai Logistics operate inland logistics supply chain businesses under a “platform + blockchain” model. Both companies have launched enterprise-owned platforms to deliver innovative domestic end-to-end logistics supply chain services, including less-than-truckload logistics, contract logistics, and logistics financial support. Integrators are categorized into two groups, depending on whether they utilize blockchain or not, and the resulting market mechanism and cooperation modes between providers and integrators exhibit distinct features in pricing, service quality, and other factors.
To distinctly compare the impacts of key parameters on the decision-making processes of regional logistics service supply chain networks in a blockchain environment, as well as the sensitivity across different scenarios at varying parameter levels, we employed numerical simulations to validate the feasibility and effectiveness of our model. Consistent with the parameter constraints proposed in assumption 3.2 and grounded in the practical operational context and cost–benefit characteristics of the case enterprises, we established the following specific parameters. The number of integrators was set to 2 and the number of providers was set to 40. The total market demand was ; the service quality of integrators was without blockchain and with blockchain; the logistics service price of the provider was for integrators with blockchain and for those without; the logistics service quality was for integrators with blockchain and for those without; and the unilateral adoption cost was for integrators with blockchain and for those who did not adopt blockchain. The game parameter settings in various scenarios are shown in Table 4.
Table 4.
Game parameter settings in various scenarios.
5.1. Validation of Model Validity
Figure 3 illustrates the evolution path of the system strategy within the regional logistics service supply chain network evolutionary game model across different scenarios in a blockchain environment. Comparing the stability results of the evolutionary game model, presented in Table 3, with the system evolution path depicted in Figure 3 validates both the rationality of the evolutionary game model for the regional logistics service supply chain network and the effectiveness of the parameter assumptions used in this study.
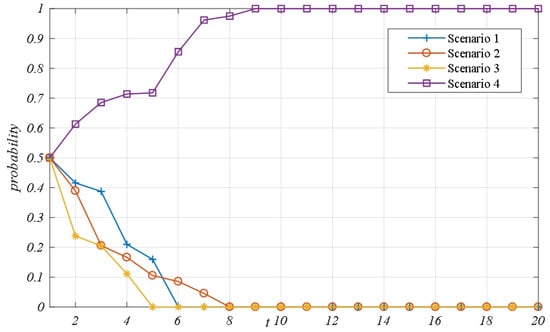
Figure 3.
Evolutionary path of network game system strategy in different scenarios.
When the parameter settings in Table 5 correspond to evolutionary game scenarios 1–3, the evolutionary stability strategy for the regional logistics service supply chain in the blockchain environment is (0,0), leading to a technology adoption rate of 0 in the complex network system. This indicates that the game participants ultimately opt not to adopt the blockchain technology strategy. Conversely, when the variable relationships align with scenario 4, the technology adoption rate in the blockchain context converges to 1. This indicates that the game participants ultimately choose to adopt the blockchain technology strategy, consistent with the evolutionary stability strategy (1,1) of the regional logistics service supply chain. A comparison of Figure 3 and Table 5 reveals that the evolutionary game equilibrium conclusions across various scenarios align with the simulation results. Therefore, the evolutionary game model of the complex network between integrators and functional providers developed in this study within a blockchain context is both reasonable and effective, allowing for further sensitivity analysis. Considering that the evolutionary game scenario 4 in Table 4 has two equilibrium states, (0,0) and (1,1), the numerical experiment based on the method of controlled variables accurately analyzed the price sensitivity coefficient , quality elasticity coefficient , quality cost coefficient , and influence sensitivity of service revenue coefficient on the game system adoption behavior. At the same time, 20 experiments were conducted for each parameter, and the average blockchain technology adoption rate was used to study the evolutionary game law of complex networks so as to ensure the generalizability of the experimental results.
Table 5.
Analysis of game conclusions in various scenarios.
5.2. Influence of Price Sensitivity Coefficient on Network Evolution Game
Under the condition of controlling other parameters, Figure 4 and Figure 5 present the numerical simulation results illustrating the impact of changes in the sensitivity coefficient of basic demand in the logistics service market with respect to the price on the evolutionary game dynamics of the complex network within the regional logistics service supply chain. As illustrated by the network evolution trend in Figure 4, as the price sensitivity coefficient xx increases, the technology adoption rate of the “integrator–provider” within the regional logistics service supply chain gradually converges toward 1. Specifically, the adoption rate converges to 0.9622 when ; to 0.9799 when ; to 1 when , , or ; and to 0 when . This indicates that when xx reaches a certain value within the range (0.8, 1), the adoption rate of the regional logistics service supply chain begins to converge to 0. This finding demonstrates that the proposed game model of complex network evolution in the context of blockchain aligns with the actual dynamics of the system and that the evolution trend accurately reflects the internal changes in the system.
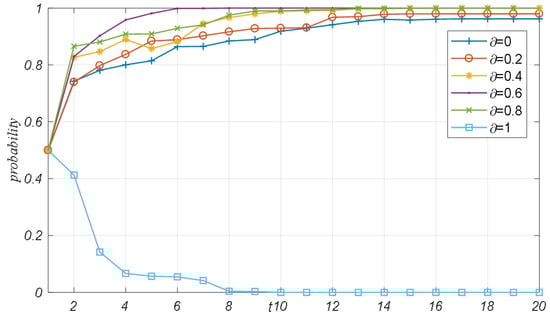
Figure 4.
Influence path of price sensitivity coefficient in network evolution game.

Figure 5.
Influence trend of price sensitivity coefficient in network evolutionary game.
Figure 5 illustrates the average adoption rate for each evolutionary game system with varying price sensitivity coefficients, , where the ordinate represents the adoption rate of blockchain technology and the abscissa represents the price sensitivity coefficient . When and increases, the technology adoption rate of the regional logistics service supply chain fluctuates within the range [0.9, 1]. When it increases to , the technology adoption rate gradually drops to 0. These results indicate that when the price sensitivity coefficient is low—meaning that the demand for logistics services is relatively insensitive to price changes—the adoption of blockchain technology does not significantly harm logistics service demand, leading both providers and integrators to favor this strategy. Conversely, when the price sensitivity coefficient reaches a certain threshold—indicating that market demand for logistics services becomes highly sensitive to price changes—the price increases associated with adopting blockchain technology significantly reduce service demand, leading providers and integrators to opt against this strategy. This substantial reduction in market demand results in the emergence of the Matthew effect within the network’s strategic selection, coupled with a sharp decline in the adoption rate of network technology. In summary, as the price sensitivity coefficient within the regional logistics service supply chain gradually increases, the technology adoption rate for providers and integrators experiences slight fluctuations within higher ranges until it reaches a threshold, at which point it rapidly converges to 0. Therefore, when logistics service market demand becomes more sensitive to price fluctuations, the government should actively promote blockchain technology adoption by encouraging regional logistics service supply chain enterprises to invest in this technology through a subsidy mechanism. As enterprises invest in blockchain technology, the credibility of information sharing within the regional logistics service supply chain improves, thus increasing market demand and benefiting member enterprises, which ensures the long-term, efficient, and stable operation of the supply chain system.
5.3. Influence of Quality Elasticity Coefficient on Network Evolution Game
Figure 6 and Figure 7 present the simulation results illustrating the impact of changes in the elasticity coefficient concerning the quality of basic demand in the logistics service market on the evolutionary game dynamics within the regional logistics service supply chain complex network. According to the network evolution trend depicted in Figure 6, as the quality elasticity coefficient increases, the technology adoption rate gradually transitions from converging to 0 to converging to 1. Specifically, when or , the adoption rate ultimately converges to 0. When , the adoption rate converges to 0.7672. When , the adoption rate converges to 0.9275. Finally, when , the adoption rate converges to 1. This indicates that a higher quality elasticity coefficient, , corresponds to a higher convergence rate of the technology adoption rate.
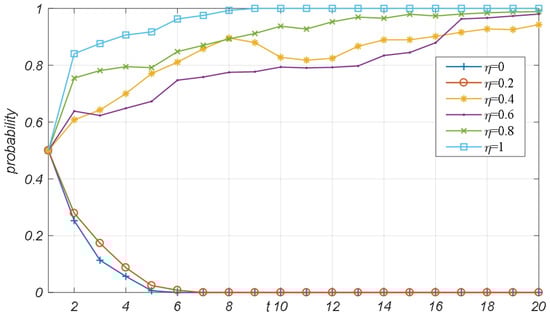
Figure 6.
Coefficient of mass elasticity influence path in network evolution game.
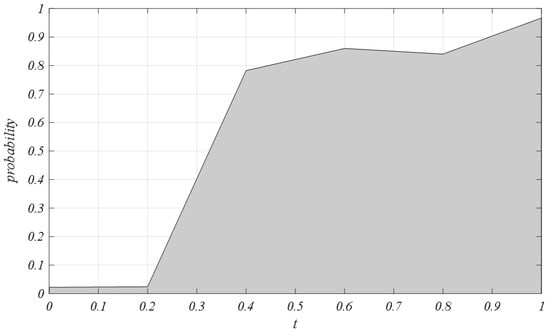
Figure 7.
Influence trend of quality elasticity coefficient in network evolution game.
Figure 7 displays the average adoption rate for each evolutionary game system with varying quality elasticity coefficients, , where the ordinate represents the adoption rate of blockchain technology and the abscissa represents the quality elasticity coefficient . When , both providers and integrators tend to opt against adopting the strategy, resulting in a slightly fluctuating technology adoption rate within the regional logistics service supply chain in the range . When , the technology adoption rate exhibits exponential growth. As the quality elasticity coefficient further increases to , the technology adoption rate steadily converges from 0.7672 to 1. The primary reason for this trend is that when the demand in the logistics service market is highly sensitive to quality elasticity, regional logistics providers and integrators do not necessarily need to adopt blockchain technology to enhance service quality. As the sensitivity of logistics service market demand to quality elasticity increases, the service quality of providers and integrators utilizing blockchain technology can significantly boost market demand. The network system is influenced by both the growth of market scale and the Matthew effect among key players, leading to an exponential increase in the technology adoption rate within the regional logistics context. Simultaneously, considering that the marginal utility related to the sensitivity of logistics service market demand to quality elasticity decreases, when the quality elasticity coefficient changes to a certain critical value within the range [0.4, 1], the technology adoption rate steadily increases within the range [0.7672, 1]. In summary, as the quality elasticity gradually increases, the technology adoption rate for providers and integrators experiences slight fluctuations at lower levels, followed by a rapid transition through an exponential curve. When it reaches a certain critical value, the adoption rate of the system gradually converges to 1.
5.4. Influence of Quality Cost Coefficient on Network Evolution Game
Figure 8 and Figure 9 present the simulation results illustrating the impact of the sensitivity coefficients of logistics service cost with respect to quality changes on the evolutionary game dynamics of the complex network within the regional logistics service supply chain, assuming all other parameters are held constant. According to the network evolution trend depicted in Figure 8, when the values of the quality cost coefficient are 0, 0.2, 0.4, 0.6, and 0.8, the technology adoption rate of the “integrator–provider” in the regional logistics service supply chain converges to 0.9708, 0.9801, 0.9877, 0.9898, and 0.9902, respectively. When the quality cost coefficient exceeds 0.8, the system adoption rate begins to decline sharply, converging to 0 at a certain critical value in the interval [0.8, 1].

Figure 8.
Influence path of quality cost coefficient in network evolution game.
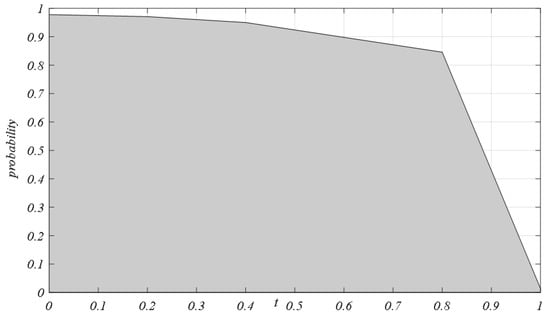
Figure 9.
Influence trend of quality cost coefficient in network evolution game.
Figure 9 illustrates the average adoption rate for each evolutionary game system with varying quality cost factors, , where the ordinate represents the adoption rate of blockchain technology and the abscissa represents the quality cost coefficient . When , the technology adoption rate in the regional logistics service supply chain fluctuates steadily within the interval [0.9, 1]. The primary reason is that when the quality cost coefficient in the blockchain environment is low—meaning that the cost of improving the logistics service quality level is less than the income it generates—providers and integrators are inclined to adopt blockchain technology. Conversely, when , the technology adoption rate drops sharply, ultimately converging to 0.0044. This high quality cost coefficient, , indicates that the cost of enhancing the logistics service quality level exceeds the income generated, resulting in a herding effect among game players, which causes the technology adoption rate to decrease exponentially. In summary, as the quality cost coefficient of the regional logistics service supply chain gradually increases, the technology adoption rate for providers and integrators fluctuates steadily within a higher range, and upon reaching a certain critical value, the system adoption rate decreases exponentially.
5.5. Influence of Service Revenue Coefficient on Network Evolution Game
Figure 10 and Figure 11 present the simulation results illustrating the impact of the changing degree of the provider’s revenue from the platform service implemented by the integrator on the evolutionary game dynamics of the complex network within the regional logistics service supply chain, assuming all other parameters remain constant. As illustrated by the network evolution trend in Figure 10, when the values of the service revenue coefficient are 0, 0.2, 0.4, 0.6, 0.8, and 1, the technology adoption rate of the “integrator–provider” within the regional logistics service supply chain converges to 1, 0.9904, 0.9801, 0.9947, 0.9898, and 0.9902, respectively.

Figure 10.
Influence path of service income coefficient in network evolution game.
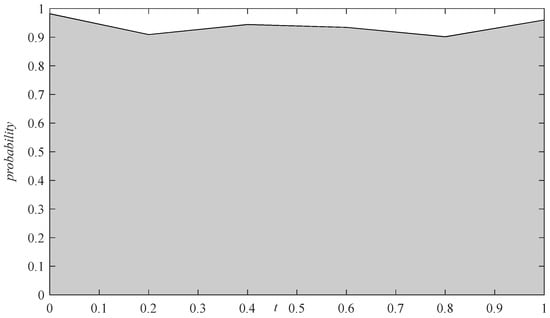
Figure 11.
Influence trend of service income coefficient in network evolution game.
Figure 11 illustrates the average adoption rate for each evolutionary game system with varying service income coefficients, , where the ordinate represents the adoption rate of blockchain technology and the abscissa represents the service revenue coefficient . As the service income coefficient gradually increases, the technology adoption rate of the complex network system within the regional logistics service supply chain fluctuates steadily within the interval (0.901, 0.982). In comparison to traditional networks, blockchain possesses two core characteristics: data tampering is difficult, and it is decentralized. The information recorded with blockchain is more authentic and reliable, addressing the problem of mutual distrust between providers and integrators. In the context of complete trust between the provider and the integrator, the revenue that the provider derives from the logistics integrator’s implementation of platform services does not significantly impact their willingness to adopt blockchain technology. In summary, as the service revenue coefficient gradually increases, it does not have a significant influence on the technology adoption rate within the regional logistics service supply chain. Both providers and integrators consistently favor the adoption of blockchain technology.
6. Conclusions and Future Prospects
6.1. Conclusions
The problem of trust between providers and integrators in the regional logistics service supply chain has always restricted the in-depth development of multi-agent cooperation in regional logistics in China. It is the key to achieving a win–win situation for providers and integrators in adopting effective ways to improve the efficiency of regional logistics cooperation. The advantages of new blockchain storage technology, such as decentralization, unchangeability, transparency, openness, and anonymity, have become innovative solutions to the problem of trust between both parties [42,43]. While existing research primarily focuses on the supply chain domain [44,45,46], this study takes the unique approach of applying blockchain technology to the intricate networks of regional logistics service supply chains. This application facilitates information sharing within these networks, advancing operational coordination and management. By effectively eliminating the “bullwhip effect” in procurement orders and inventories during business operations, an evolutionary decision-making model for these networks was constructed in this study and the collective supervision of the principal entities was achieved throughout the supply chain’s operational processes. Currently, improving the willingness of regional logistics multi-agents to adopt technology is a pressing issue. To thoroughly investigate the dynamic processes of technology adoption strategies employed by participants in the regional logistics service supply chain network and to objectively reveal the evolutionary game relationships among all system players, this study first established an evolutionary game model of the adoption behavior of providers and integrators under the framework of bounded rationality. Subsequently, the game decision-making process was elucidated using the stability theorem of differential equations. Since the evolution mechanism failed to account for individual heterogeneity and changes in the topological structure of complex networks, this study incorporated the evolutionary game model into regional logistics complex networks, establishing a model for regional logistics service supply chain networks. Finally, the influence and incentives of key factors affecting network evolution on the participation behaviors of regional logistics service supply chains were clarified through numerical simulations. The results indicate that both before and after the adoption of complex network technology in the context of blockchain, the net change in market revenue for providers, along with the cooperative gains derived from integrators, and the difference between the market revenue change for the integrator and the costs incurred by the provider during technology implementation determine the equilibrium stability of the network system. Key factors in the blockchain environment significantly influence technology adoption strategies. For instance, when the sensitivity coefficients of logistics service market demand to price and logistics service cost to quality improvement are high, the adoption intentions of the primary players in the regional logistics service supply chain network system decline sharply. With the gradual increase in quality elasticity, the technology adoption rates of providers and integrators initially change steadily and then increase exponentially, ultimately converging to 1. The changes in the revenue generated from integrator services do not significantly affect the technology adoption rate within the regional logistics service supply chain.
6.2. Management Applications
As blockchain technology continues to be explored and expanded, the logistics industry has emerged as a prominent field that can benefit from its innovative applications. Enhancing the application of new technologies in regional logistics to optimize business processes and improve collaboration efficiency has become a significant concern in both academic and industrial circles. Consequently, based on research into the adoption willingness of regional logistics service supply chains within the context of blockchain, we present the following primary recommendations.
Firstly, it is essential to enhance the partnership among the members of the regional logistics service supply chain network. A unified and efficient sharing and cooperation mechanism should be established among the relevant institutions and agencies in both the upstream and downstream nodes of the network. Maritime trade is a typical example where blockchain technology is adopted in the logistics field. The logistics activities involved are lengthy and complex, involving numerous dispersed entities, making it challenging to establish transparent and efficient trust mechanisms among them. To address this challenge, China Merchants Energy Shipping Co., Ltd in Shanghai China. has established the “Silk Road Cloud Chain” platform, an integrated logistics ecosystem built on blockchain technology. This platform reduces collaboration costs between enterprises and facilitates services such as the digitization of bulk commodities, intelligent trade and transportation, and blockchain-based maritime documentation and contract services. Building on this foundation, each member can establish a robust cooperative partnership through information exchange and interaction, thereby achieving the integration of information resources and complementary advantages driven by mutual interests. This facilitates the continuous pursuit of higher efficiency and greater benefits within the regional logistics service supply chain network, promotes the formation of trust and the establishment of cooperative relationships among network members, enhances the motivation for information sharing in various nodes, and fosters an environment conducive to multi-win cooperation.
Secondly, it is essential to establish a well-structured information-sharing incentive mechanism for the regional logistics service supply chain. To enhance the willingness for active information sharing among nodes in the supply chain and to reduce logistics costs, it is crucial to consider the impact of a well-designed incentive mechanism on information-sharing decisions. The Dutch Blockchain Coalition in Logistics (DBC-L) is a cross-industry collaborative initiative that aims to enhance the operational efficiency of the entire logistics system by establishing industry standards and best-practice solutions. To evaluate the effectiveness of different blockchain solutions, the coalition can initiate multiple pilot projects, establish a well-designed incentive mechanism aligned with the information-sharing strategy, monitor the proportion of nodes opting for an active information-sharing strategy on the network platform, and dynamically adjust the incentive coefficient. Additionally, the government should implement relevant policies concerning the application of blockchain technology to enhance information sharing within the regional logistics service supply chain. Organizations can enhance enthusiasm for integrating blockchain information sharing by introducing incentive mechanisms that leverage market dynamics, user feedback, and their own developmental needs. This approach encourages nodes to participate in blockchain security verification, incorporates economic factors into the blockchain system, and incentivizes compliant nodes to engage in record-keeping while penalizing those that do not adhere to protocols.
Finally, it is crucial to establish a security guarantee system for information sharing within the regional logistics service supply chain using blockchain technology. Ensuring that blockchain technology can be applied scientifically, reasonably, and securely within the regional logistics service supply chain requires the support and cooperation of various stakeholders, including participating nodes and government entities. Additionally, it is essential to standardize the legal framework for information sharing within the blockchain network platform, effectively implement the principle of governance by law in blockchain information-sharing management, and clarify the legal rights and responsibilities associated with information sharing. Furthermore, defining the legal operational processes for information sharing, access, and utilization will facilitate the orderly operation of information sharing within the regional logistics service supply chain under the guarantee of a legal system.
6.3. Limitations and Future Research Directions
Given that blockchain technology is continuously evolving and that the corresponding research and products are in preliminary stages, this study can be further expanded and improved. For instance, the regional logistics service supply chain network is a highly complex system. Building on current studies [47,48,49], future research could employ methods such as differential games and dynamic optimal control to further analyze the internal interactions within this complex network. Additionally, in a blockchain environment, large-scale networks or multi-game scenarios may be interesting research topics [50,51], and exploring the effectiveness of model computations, investigating the design of key parameters, and examining the impact of network heterogeneity are directions worthy of in-depth research.
Author Contributions
Conceptualization, G.Z. and Z.Z.; methodology, G.Z.; software, Z.Z.; formal analysis, G.Z.; writing—original draft preparation, G.Z. and Z.Z.; writing—review and editing, G.Z. and Z.Z.; All authors have read and agreed to the published version of the manuscript.
Funding
This work was supported by Social Science Foundation of Shandong Province, grant number 24CJJJ25, 2023 Annual Project of Shenzhen “14th Five-Year” Education Science Plan (cgpy23022), and the Business Administration Discipline Construction Program of Shenzhen Polytechnic University (6022311006S).
Data Availability Statement
The original contributions presented in this study are included in the article; further inquiries can be directed to the corresponding author.
Conflicts of Interest
The authors declare no conflicts of interest.
References
- Babagolzadeh, M.; Zhang, Y.; Abbasi, B.; Shrestha, A.; Zhang, A. Promoting Australian regional airports with subsidy schemes: Optimised downstream logistics using vehicle routing problem. Transp. Policy 2022, 128, 38–51. [Google Scholar] [CrossRef]
- Li, M.; Huang, K.; Xie, X.; Chen, Y. Dynamic evolution, regional differences and influencing factors of high-quality development of China’s logistics industry. Ecol. Indic. 2024, 159, 111728. [Google Scholar] [CrossRef]
- Chhetri, P.; Nkhoma, M.; Peszynski, K.; Chhetri, A.; Lee, P.T.-W. Global logistics city concept: A cluster-led strategy under the belt and road initiative. Marit. Policy Manag. 2018, 45, 319–335. [Google Scholar] [CrossRef]
- Chan, H.K.; Dai, J.; Wang, X.; Lacka, E. Logistics and supply chain innovation in the context of the Belt and Road Initiative (BRI). Transport. Res. t E-Log. 2019, 132, 51–56. [Google Scholar] [CrossRef]
- Guo, H.; Guo, C.; Xu, B.; Xia, Y.; Sun, F. MLP neural network-based regional logistics demand prediction. Neural Comput. Appl. 2021, 33, 3939–3952. [Google Scholar] [CrossRef]
- Chen, H.; Zhang, Y. Regional logistics industry high-quality development level measurement, dynamic evolution, and its impact path on industrial structure optimization: Finding from China. Sustainability 2022, 14, 14038. [Google Scholar] [CrossRef]
- Zhu, T.; Xu, Y.; Zhang, J.; Zhao, B. A Bilevel Programming Model for Designing a Collaborative Network for Regional Railway Transportation and Logistics: The Case of the Beijing-Tianjin-Hebei Region in China. J. Adv. Transp. 2024, 2024, 8905446. [Google Scholar] [CrossRef]
- Liu, W.; Liu, Y.; Chen, L.; Si, C.; Long, S. Relationship among demand updating, decision-making behaviours and performance in logistics service supply chains: An exploratory study from China. Int. J. Logist. Res. Appl. 2019, 22, 393–418. [Google Scholar] [CrossRef]
- Casolari, F.; Buttaboni, C.; Floridi, L. The EU Data Act in context: A legal assessment. Int. J. Law Inf. Technol. 2023, 31, 399–412. [Google Scholar] [CrossRef]
- Koh, L.; Dolgui, A.; Sarkis, J. Blockchain in transport and logistics–paradigms and transitions. Int. J. Prod. Res. 2020, 58, 2054–2062. [Google Scholar] [CrossRef]
- Zhou, Y.; Soh, Y.S.; Loh, H.S.; Yuen, K.F. The key challenges and critical success factors of blockchain implementation: Policy implications for Singapore’s maritime industry. Mar. Policy 2020, 122, 104265. [Google Scholar] [CrossRef] [PubMed]
- Chen, W.; Botchie, D.; Braganza, A.; Han, H. A transaction cost perspective on blockchain governance in global value chains. Strateg. Chang. 2022, 31, 75–87. [Google Scholar] [CrossRef]
- Wong, S.; Yeung, J.K.W.; Lau, Y.-Y.; Kawasaki, T.; Kwong, R. A Critical Literature Review on Blockchain Technology Adoption in Supply Chains. Sustainability 2024, 16, 5174. [Google Scholar] [CrossRef]
- Valashiya, M.C.; Luke, R. Enhancing supply chain information sharing with third party logistics service providers. Int. J. Logist. Manag. 2023, 34, 1523–1542. [Google Scholar] [CrossRef]
- Dong, C.; Huang, Q.; Pan, Y.; Ng, C.T.; Liu, R. Logistics outsourcing: Effects of greenwashing and blockchain technology. Transp. Res. Part E Logist. Transp. Rev. 2023, 170, 103015. [Google Scholar] [CrossRef]
- Patil, K.; Ojha, D.; Struckell, E.M.; Patel, P.C. Behavioral drivers of blockchain assimilation in supply chains—A social network theory perspective. Technol. Forecast. Soc. Chang. 2023, 192, 122578. [Google Scholar] [CrossRef]
- Liu, Y.; Wang, Q. Blockchain for supply chain: Performance implications and contingencies. Ind. Manag. Data Syst. 2025, 125, 364–383. [Google Scholar] [CrossRef]
- Persson, G.; Virum, H. Growth strategies for logistics service providers: A case study. Int. J. Logist. Manag. 2001, 12, 53–64. [Google Scholar] [CrossRef]
- Choy, K.; Li, C.-L.; So, S.C.; Lau, H.; Kwok, S.; Leung, D. Managing uncertainty in logistics service supply chain. Int. J. Risk Assess. Manag. 2007, 7, 19–43. [Google Scholar] [CrossRef]
- Hong, X.; Gong, Y.; Rekik, Y.; Li, Q. Public versus private information: The impact of quality information sharing on competition under different channel structures. Comput. Ind. Eng. 2023, 176, 108937. [Google Scholar] [CrossRef]
- Ma, S.; Dan, B.; Li, M.; Zhou, M. To be traceable and responsive: Blockchain adoption and information sharing in a fresh produce supply chain. Int. Trans. Oper. Res. 2024, 31, 4174–4198. [Google Scholar] [CrossRef]
- Duan, C.; Xiu, G.; Zhang, Y. Coordinated management method of information contract in port logistics service supply chain. J. Coast. Res. 2019, 93 (Suppl. S1), 1047–1052. [Google Scholar] [CrossRef]
- Li, G.; Zhang, Q.; Bai, Z.; Sabeeh, P. Research on logistics service supply chain information sharing mechanism in the belt and road initiative. IEEE Access 2020, 8, 189684–189701. [Google Scholar] [CrossRef]
- Feng, L.; Li, X.; Zhang, X.; Ng, A.K.; Jia, P.; Kuang, H. Modelling the roles of fourth-party logistics (4PL) on the improvements of supply chain stability of port logistics services: The case of Ningbo-Zhoushan Port in China. Int. J. Syst. Sci. Oper. Logist. 2023, 10, 2239137. [Google Scholar] [CrossRef]
- Tijan, E.; Aksentijević, S.; Ivanić, K.; Jardas, M. Blockchain technology implementation in logistics. Sustainability 2019, 11, 1185. [Google Scholar] [CrossRef]
- Yi, H. A secure logistics model based on blockchain. Enterp. Inf. Syst. 2021, 15, 1002–1018. [Google Scholar] [CrossRef]
- Tan, J.; Wong, W.P.; Tan, C.K.; Jomthanachai, S.; Lim, C.P. Blockchain-based Logistics 4.0: Enhancing performance of logistics service providers. Asia Pac. J. Mark. Logist. 2024, 36, 1442–1463. [Google Scholar] [CrossRef]
- Ahmad, R.W.; Hasan, H.; Jayaraman, R.; Salah, K.; Omar, M. Blockchain applications and architectures for port operations and logistics management. Res. Transp. Bus. Manag. 2021, 41, 100620. [Google Scholar] [CrossRef]
- Lu, B.; Lu, H.; Wang, H. Design and value analysis of the blockchain-based port logistics financial platform. Marit. Policy Manag. 2024, 51, 1037–1061. [Google Scholar] [CrossRef]
- Zhang, S.; Wang, C.; Yu, C. The evolutionary game analysis and simulation with system dynamics of manufacturer’s emissions abatement behavior under cap-and-trade regulation. Appl. Math. Comput. 2019, 355, 343–355. [Google Scholar] [CrossRef]
- Zhang, X.; Zhang, S.; Du, B. To Compete or to Collaborate? Logistics Service Sharing and Retailers’ Resale in Competitive Online Channels. Systems 2023, 11, 358. [Google Scholar] [CrossRef]
- Wang, G.; Hu, X.; Wang, T.; Liu, J.; Feng, S.; Wang, C. Tripartite Evolutionary Game Analysis of a Logistics Service Supply Chain Cooperation Mechanism for Network Freight Platforms. Int. J. Intell. Syst. 2024, 2024, 4820877. [Google Scholar] [CrossRef]
- Xiong, L.; Xue, R. Evolutionary game analysis of collaborative transportation of emergency materials based on blockchain. Int. J. Logist. Res. Appl. 2024, 27, 1633–1654. [Google Scholar] [CrossRef]
- Zhang, Y.; Xiang, C.; Li, L.; Jiang, H. Evolutionary game analysis and simulation with system dynamics for behavioral strategies of participants in crowd logistics. Transp. Lett. 2021, 13, 540–554. [Google Scholar] [CrossRef]
- Liu, W.; Long, S.; Wei, S.; Xie, D.; Wang, J.; Liu, X. Smart logistics ecological cooperation with data sharing and platform empowerment: An examination with evolutionary game model. Int. J. Prod. Res. 2022, 60, 4295–4315. [Google Scholar] [CrossRef]
- Wang, Z.; Li, C.; Jin, X.; Ding, H.; Cui, G.; Yu, L. Evolutionary dynamics of the interdependent security games on complex network. Appl. Math. Comput. 2021, 399, 126051. [Google Scholar] [CrossRef]
- Jia, C.; Zhang, R.; Wang, D. Evolutionary game of cooperative behavior among social capitals in PPP projects: A complex network perspective. Ain Shams Eng. J. 2023, 14, 102006. [Google Scholar] [CrossRef]
- Jiang, N.; Feng, Y.; Wang, X. Fractional-order evolutionary game of green and low-carbon innovation in manufacturing enterprises. Alex. Eng. J. 2022, 61, 12673–12687. [Google Scholar] [CrossRef]
- Xue, R.; Xiong, L. Two-stage evolutionary game model on complex networks for emergency logistics based on blockchain platform. Expert Syst. Appl. 2024, 256, 124925. [Google Scholar] [CrossRef]
- Lou, Y.; Feng, L.; He, S.; He, Z.; Zhao, X. Logistics service outsourcing choices in a retailer-led supply chain. Transp. Res. Part E Logist. Transp. Rev. 2020, 141, 101944. [Google Scholar] [CrossRef]
- Liu, C.; Lv, J.; Hou, P.; Lu, D. Disclosing products’ freshness level as a non-contractible quality: Optimal logistics service contracts in the fresh products supply chain. Eur. J. Oper. Res. 2023, 307, 1085–1102. [Google Scholar] [CrossRef]
- Lu, B.; Fan, L.; Tang, Y.; Perera, S.C.; Wang, J.-J. The value of blockchain for shipping platforms: A perspective from multi-homing and network effects. Int. J. Prod. Res. 2024. [Google Scholar] [CrossRef]
- Karakas, S.; Acar, A.Z.; Kucukaltan, B. Blockchain adoption in logistics and supply chain: A literature review and research agenda. Int. J. Prod. Res. 2024, 62, 8193–8216. [Google Scholar] [CrossRef]
- Durach, C.F.; Blesik, T.; von Düring, M.; Bick, M. Blockchain applications in supply chain transactions. J. Bus. Logist. 2021, 42, 7–24. [Google Scholar] [CrossRef]
- Azevedo, P.; Gomes, J.; Romão, M. Supply chain traceability using blockchain. Oper. Manag. Res. 2023, 16, 1359–1381. [Google Scholar] [CrossRef]
- Cui, Y.; Gaur, V.; Liu, J. Supply chain transparency and blockchain design. Manag. Sci. 2024, 70, 3245–3263. [Google Scholar] [CrossRef]
- Yu, C.; Ren, Y.; Archibald, T.W. Differential game model of cooperative advertising in a supply chain with deteriorating items, competing retailers and reference price effects. Enterp. Inf. Syst. 2023, 17, 1941273. [Google Scholar] [CrossRef]
- Pu, H.; Wang, X.; Li, T.; Su, C. Dynamic control of low-carbon efforts and process innovation considering knowledge accumulation under dual-carbon policies. Comput. Ind. Eng. 2024, 196, 110526. [Google Scholar] [CrossRef]
- Wu, A.; Zhang, R.; Sun, Y.; Sun, L.; Wang, S.; Wang, X. Differential games of supply chain on consideration of low-carbon reference effect under different carbon quota allocation methods. Systems 2024, 12, 371. [Google Scholar] [CrossRef]
- Zhang, X.; Du, K.-J.; Zhan, Z.-H.; Kwong, S.; Gu, T.-L.; Zhang, J. Cooperative coevolutionary bare-bones particle swarm optimization with function independent decomposition for large-scale supply chain network design with uncertainties. IEEE Trans. Cybern. 2019, 50, 4454–4468. [Google Scholar] [CrossRef]
- Tu, Y.; Li, W.; Song, X.; Gong, K.; Liu, L.; Qin, Y.; Liu, S.; Liu, M. Using graph neural network to conduct supplier recommendation based on large-scale supply chain. Int. J. Prod. Res. 2024, 8595–8608. [Google Scholar] [CrossRef]
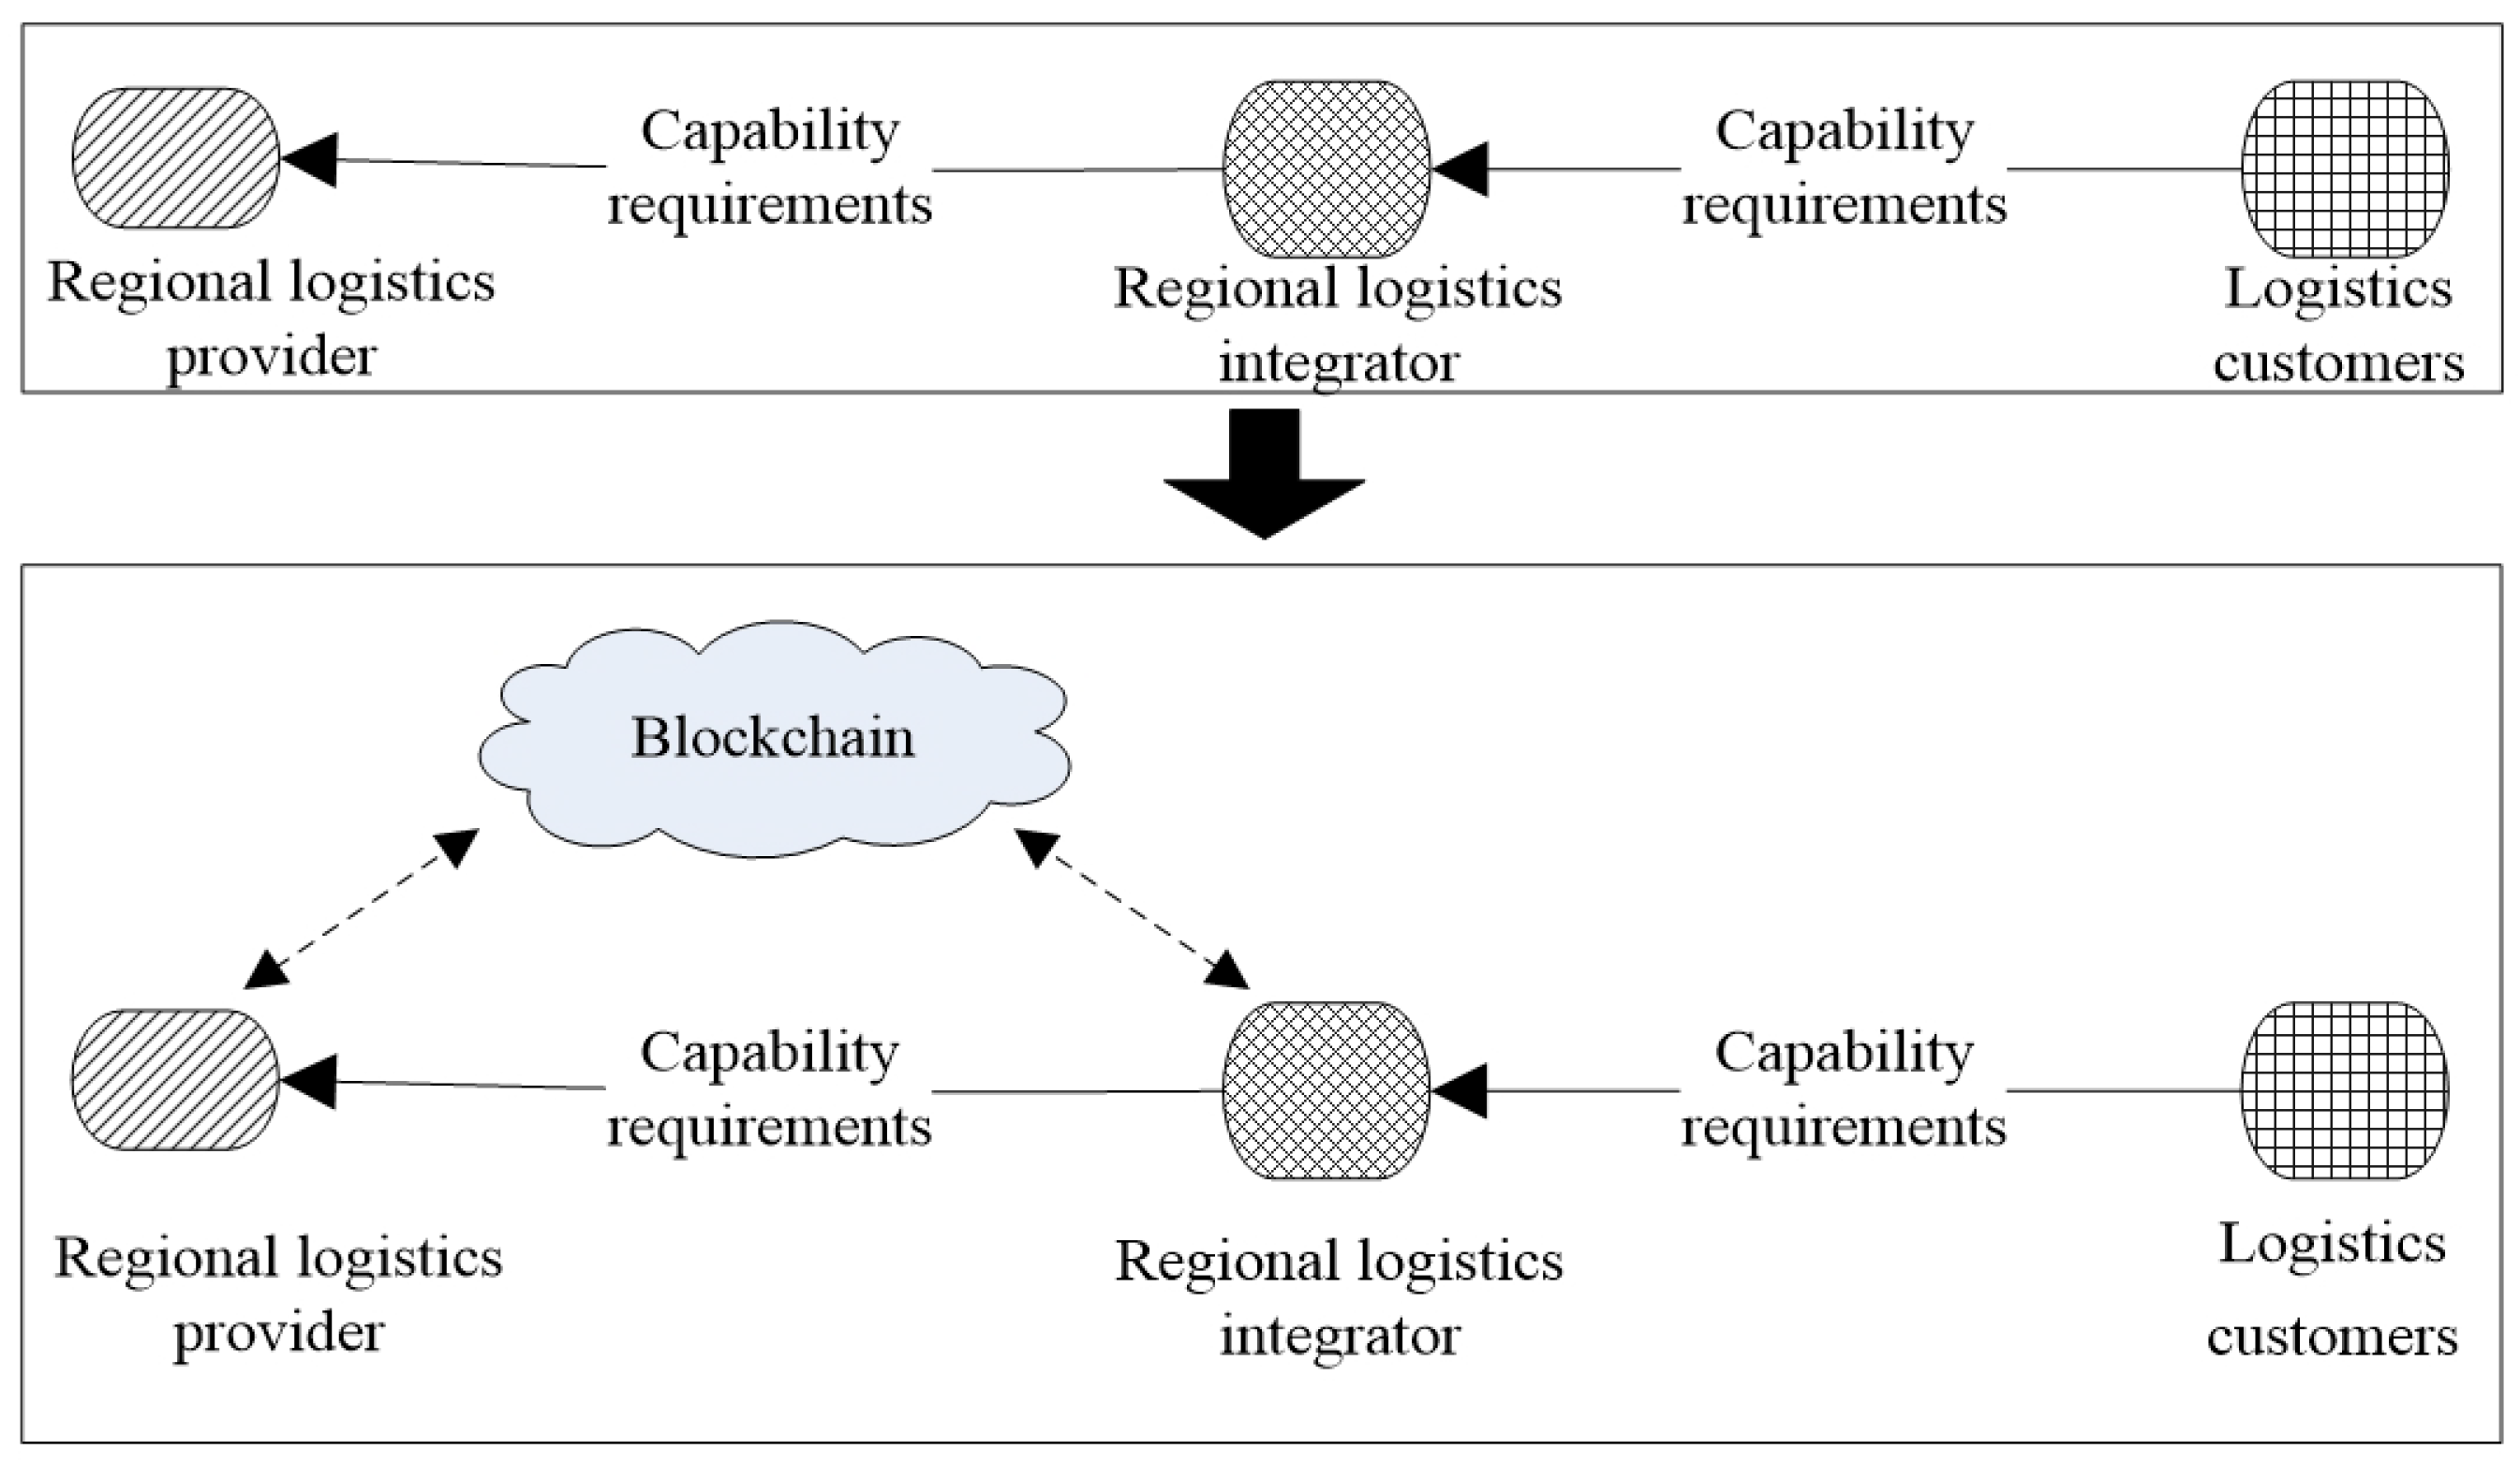
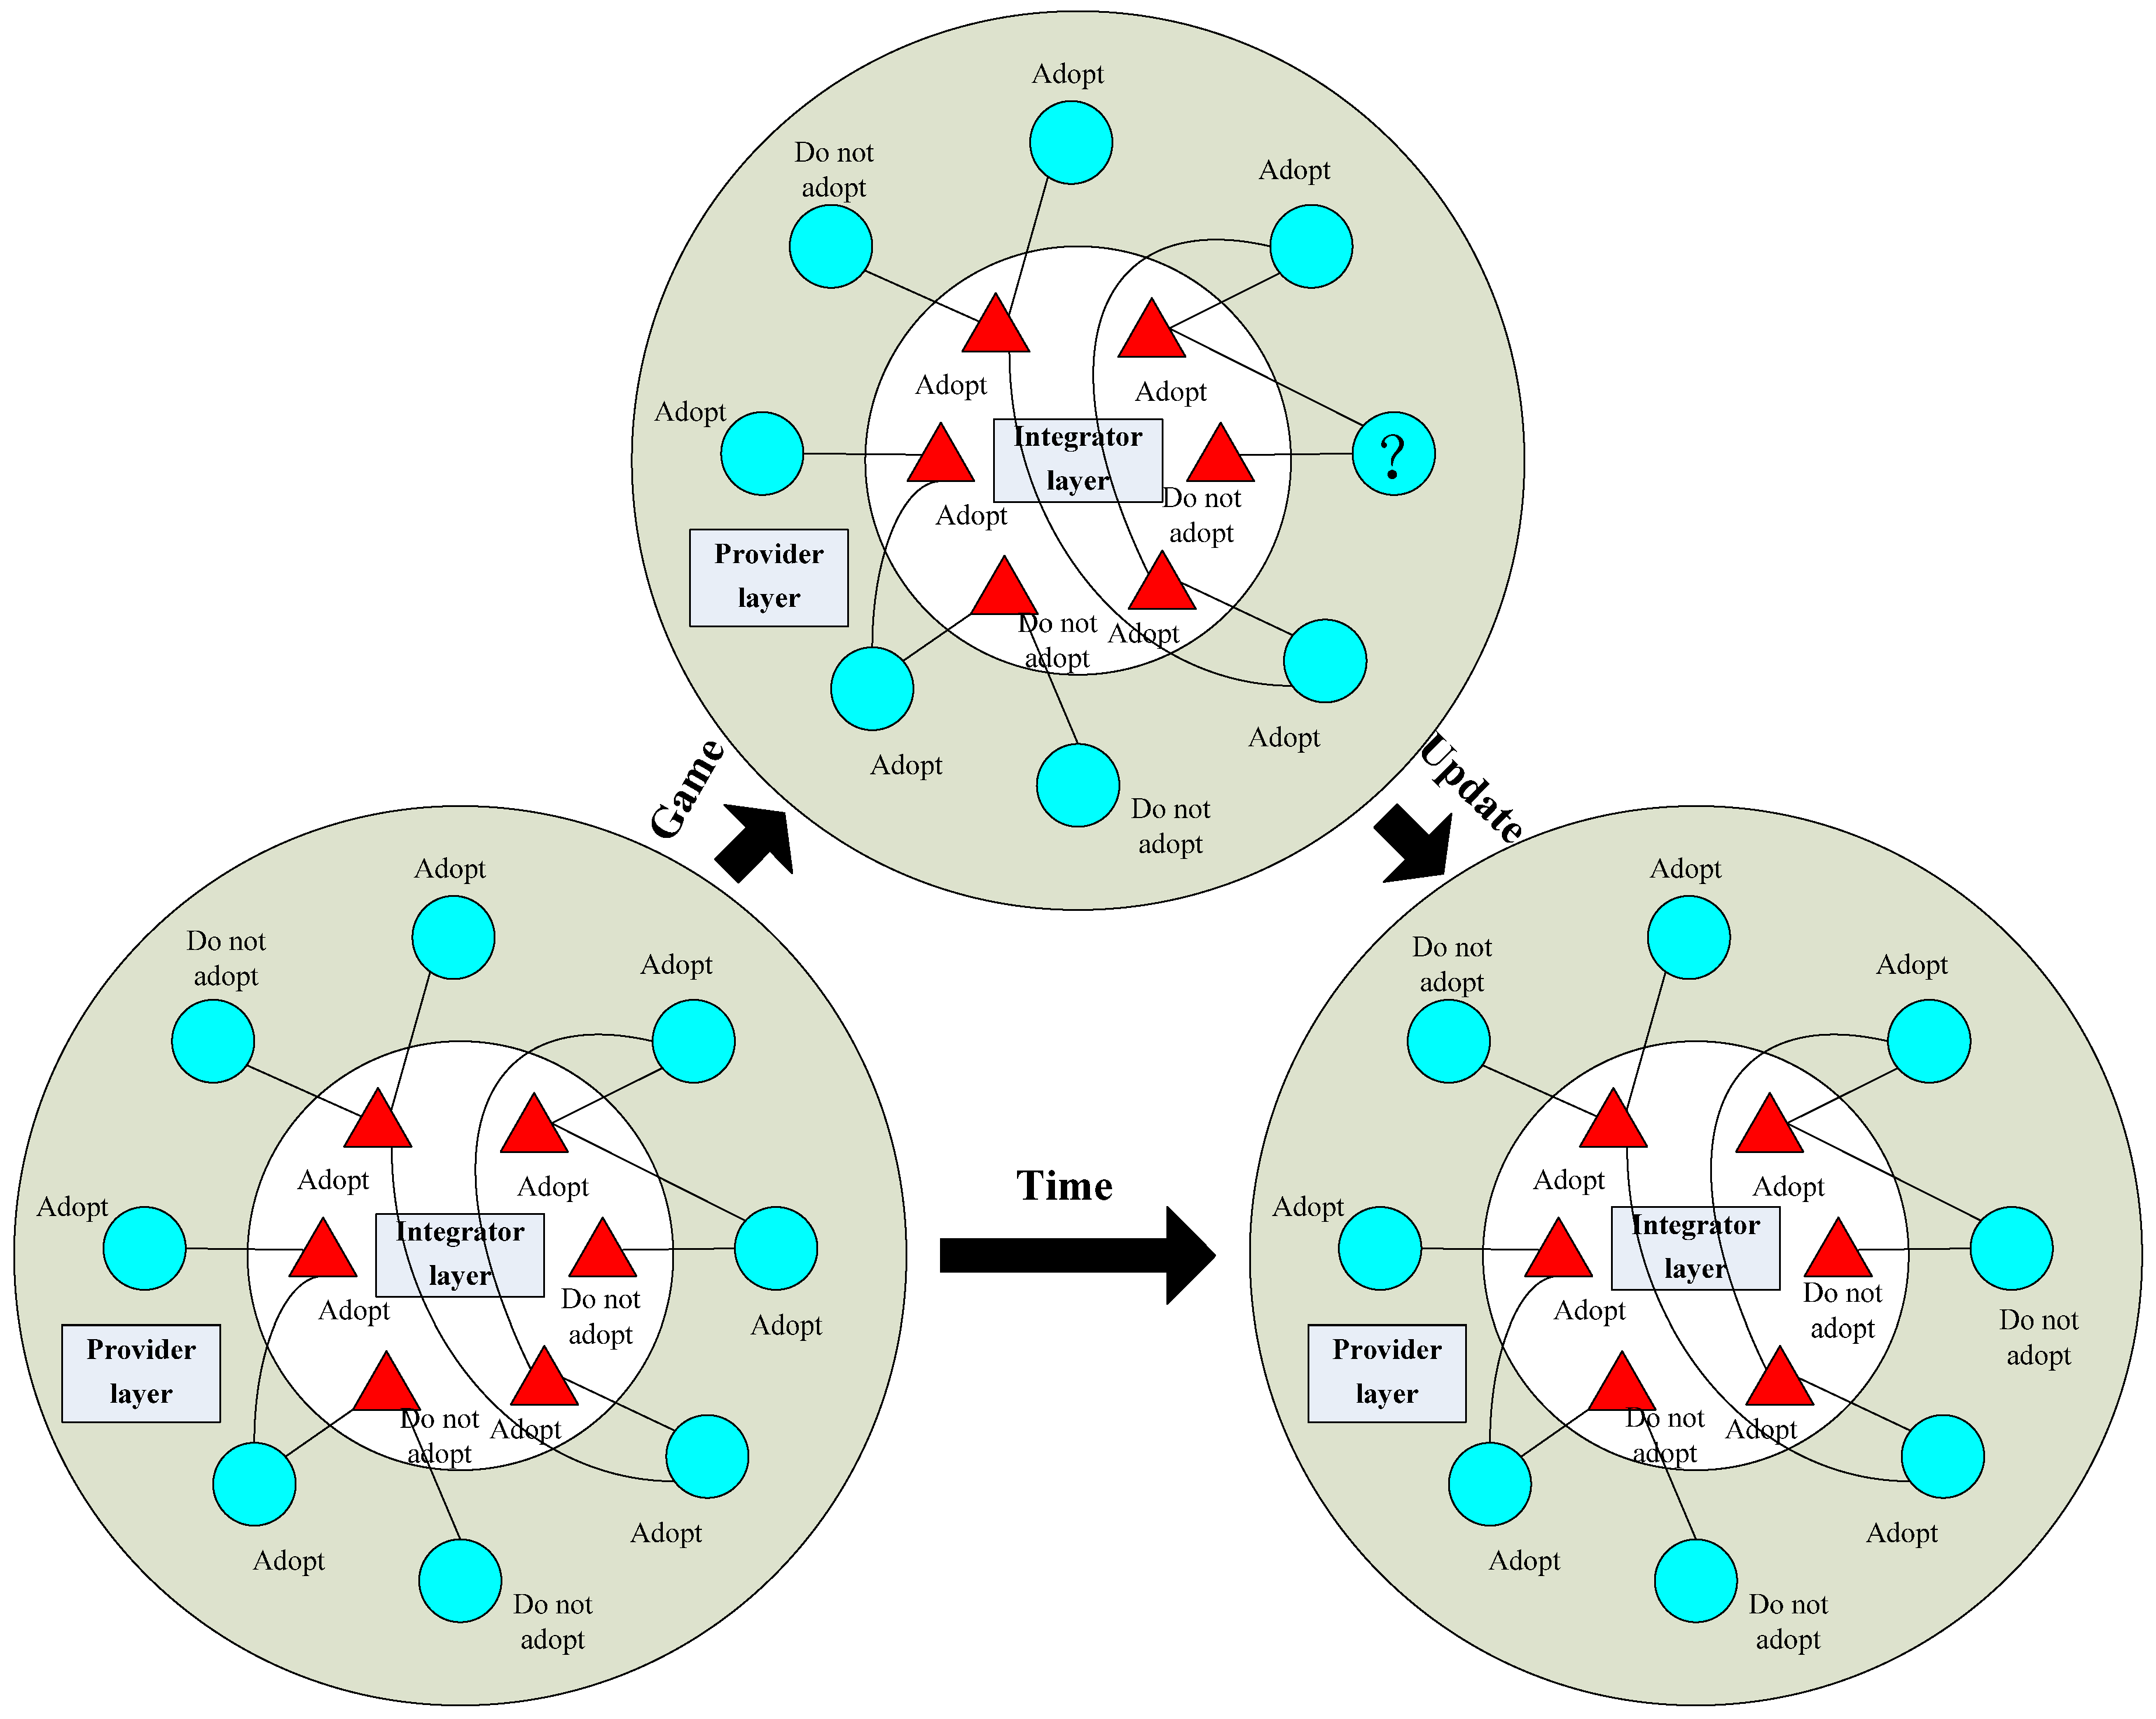
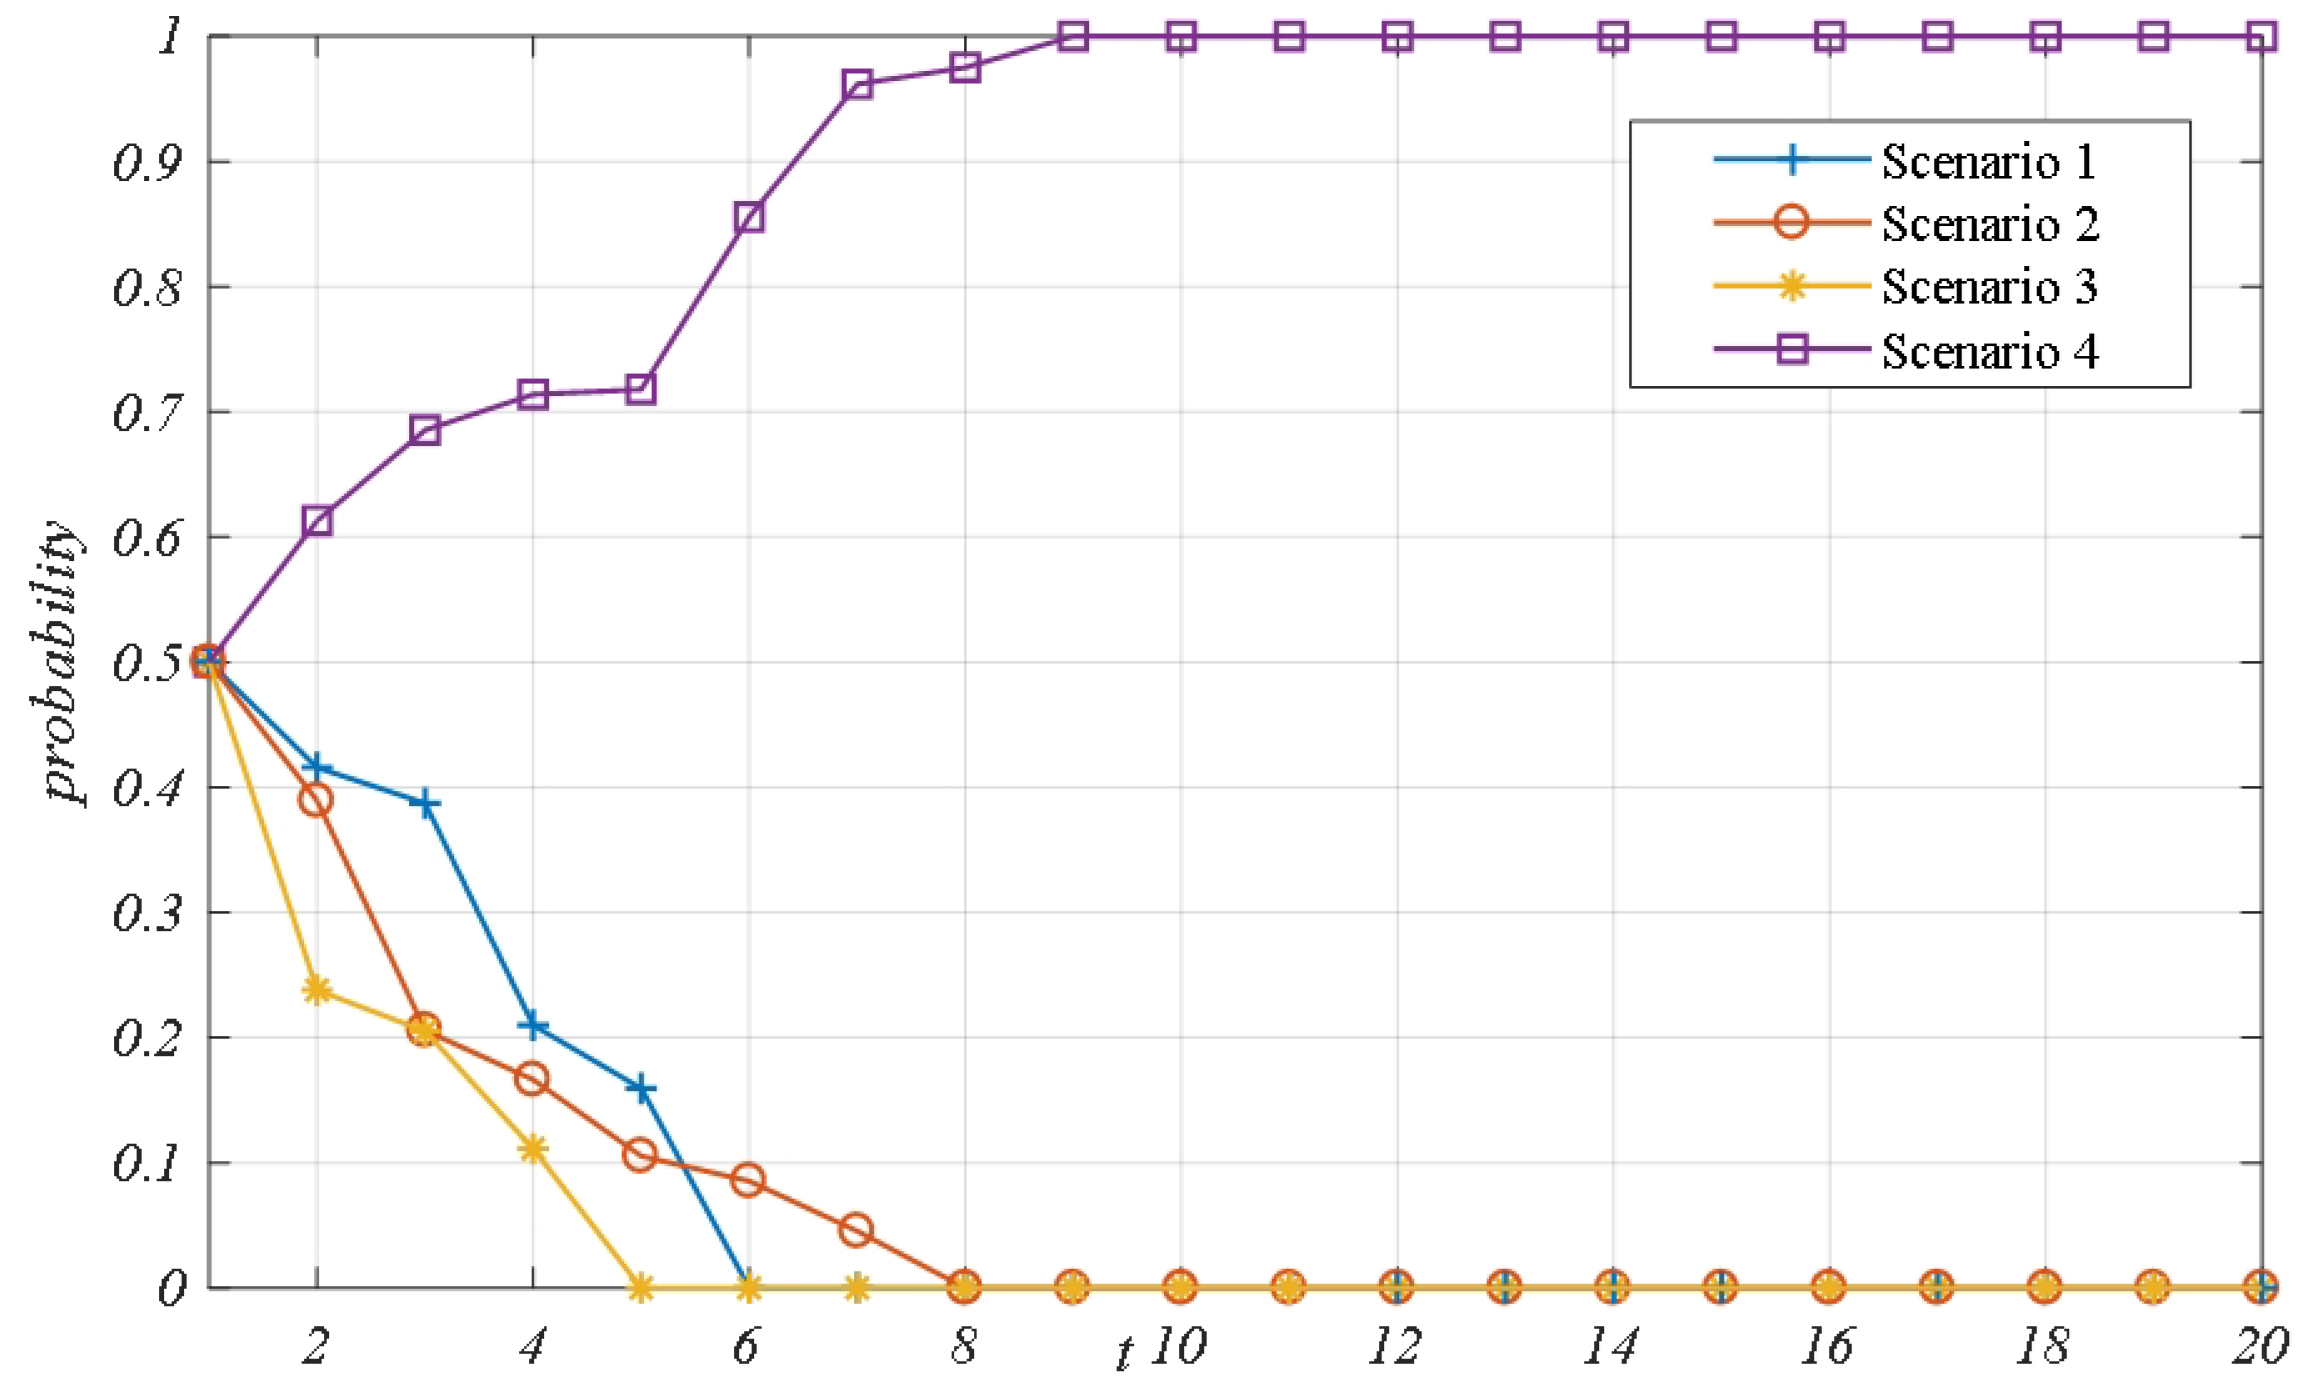
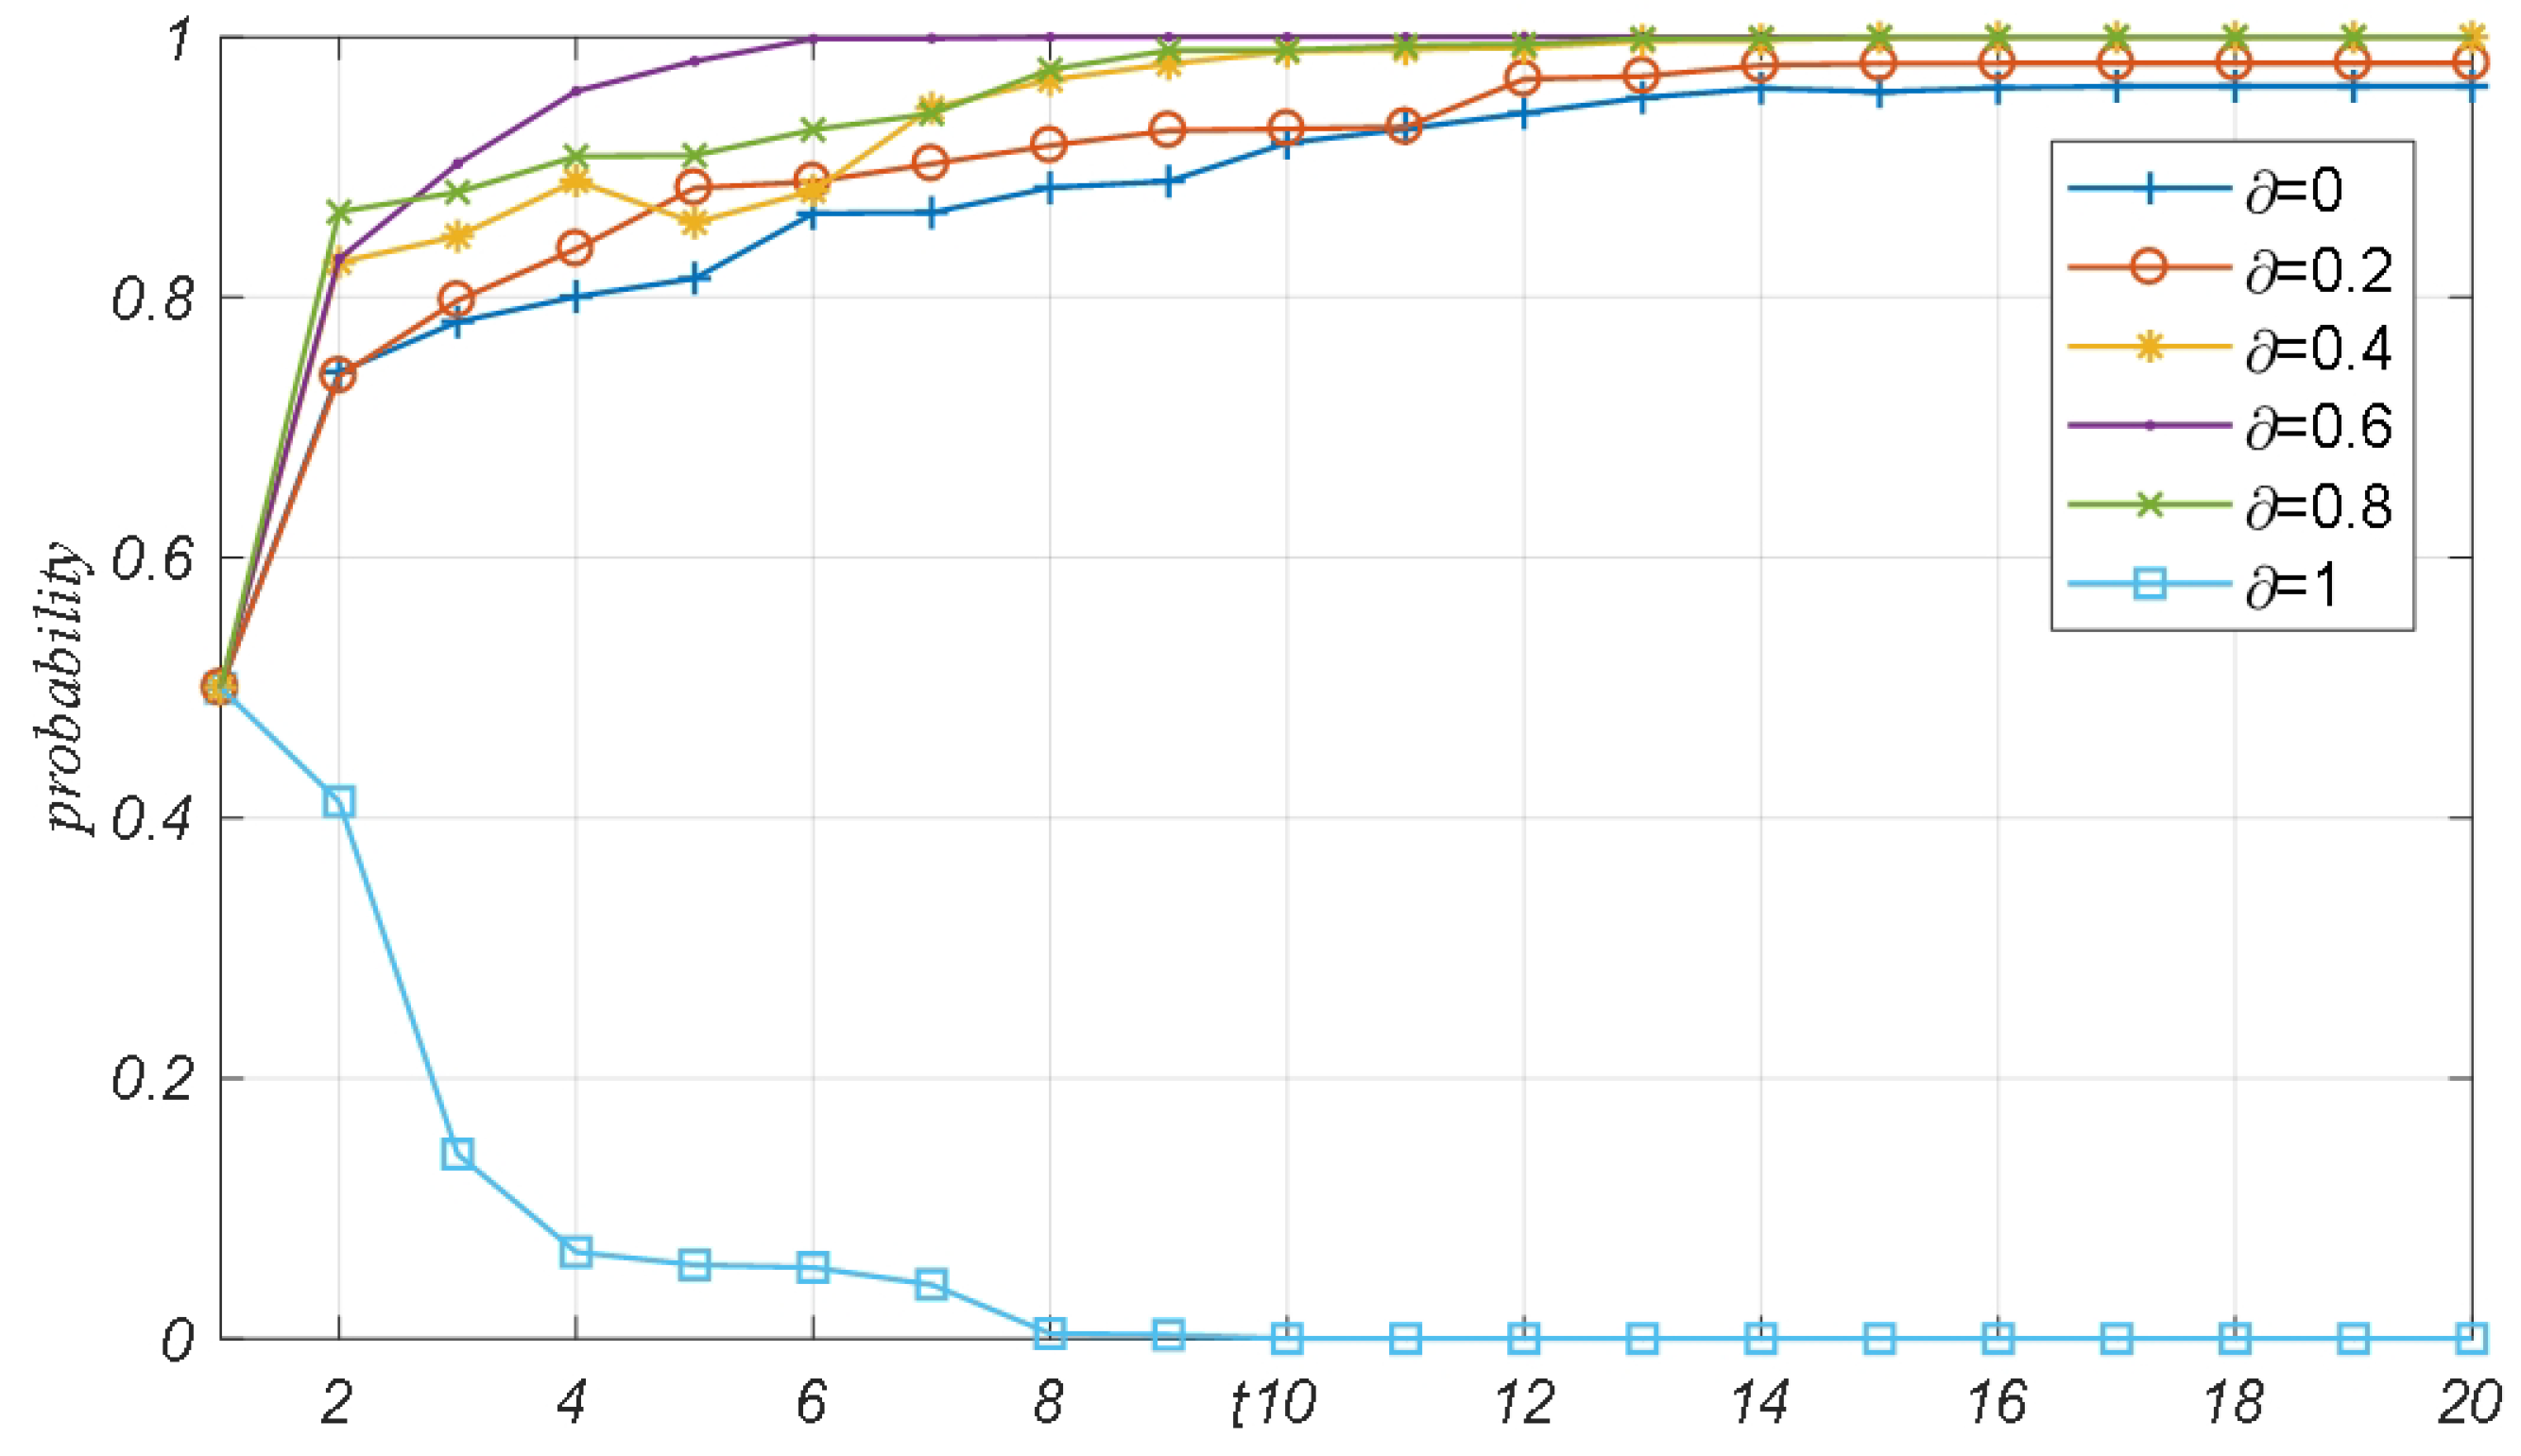
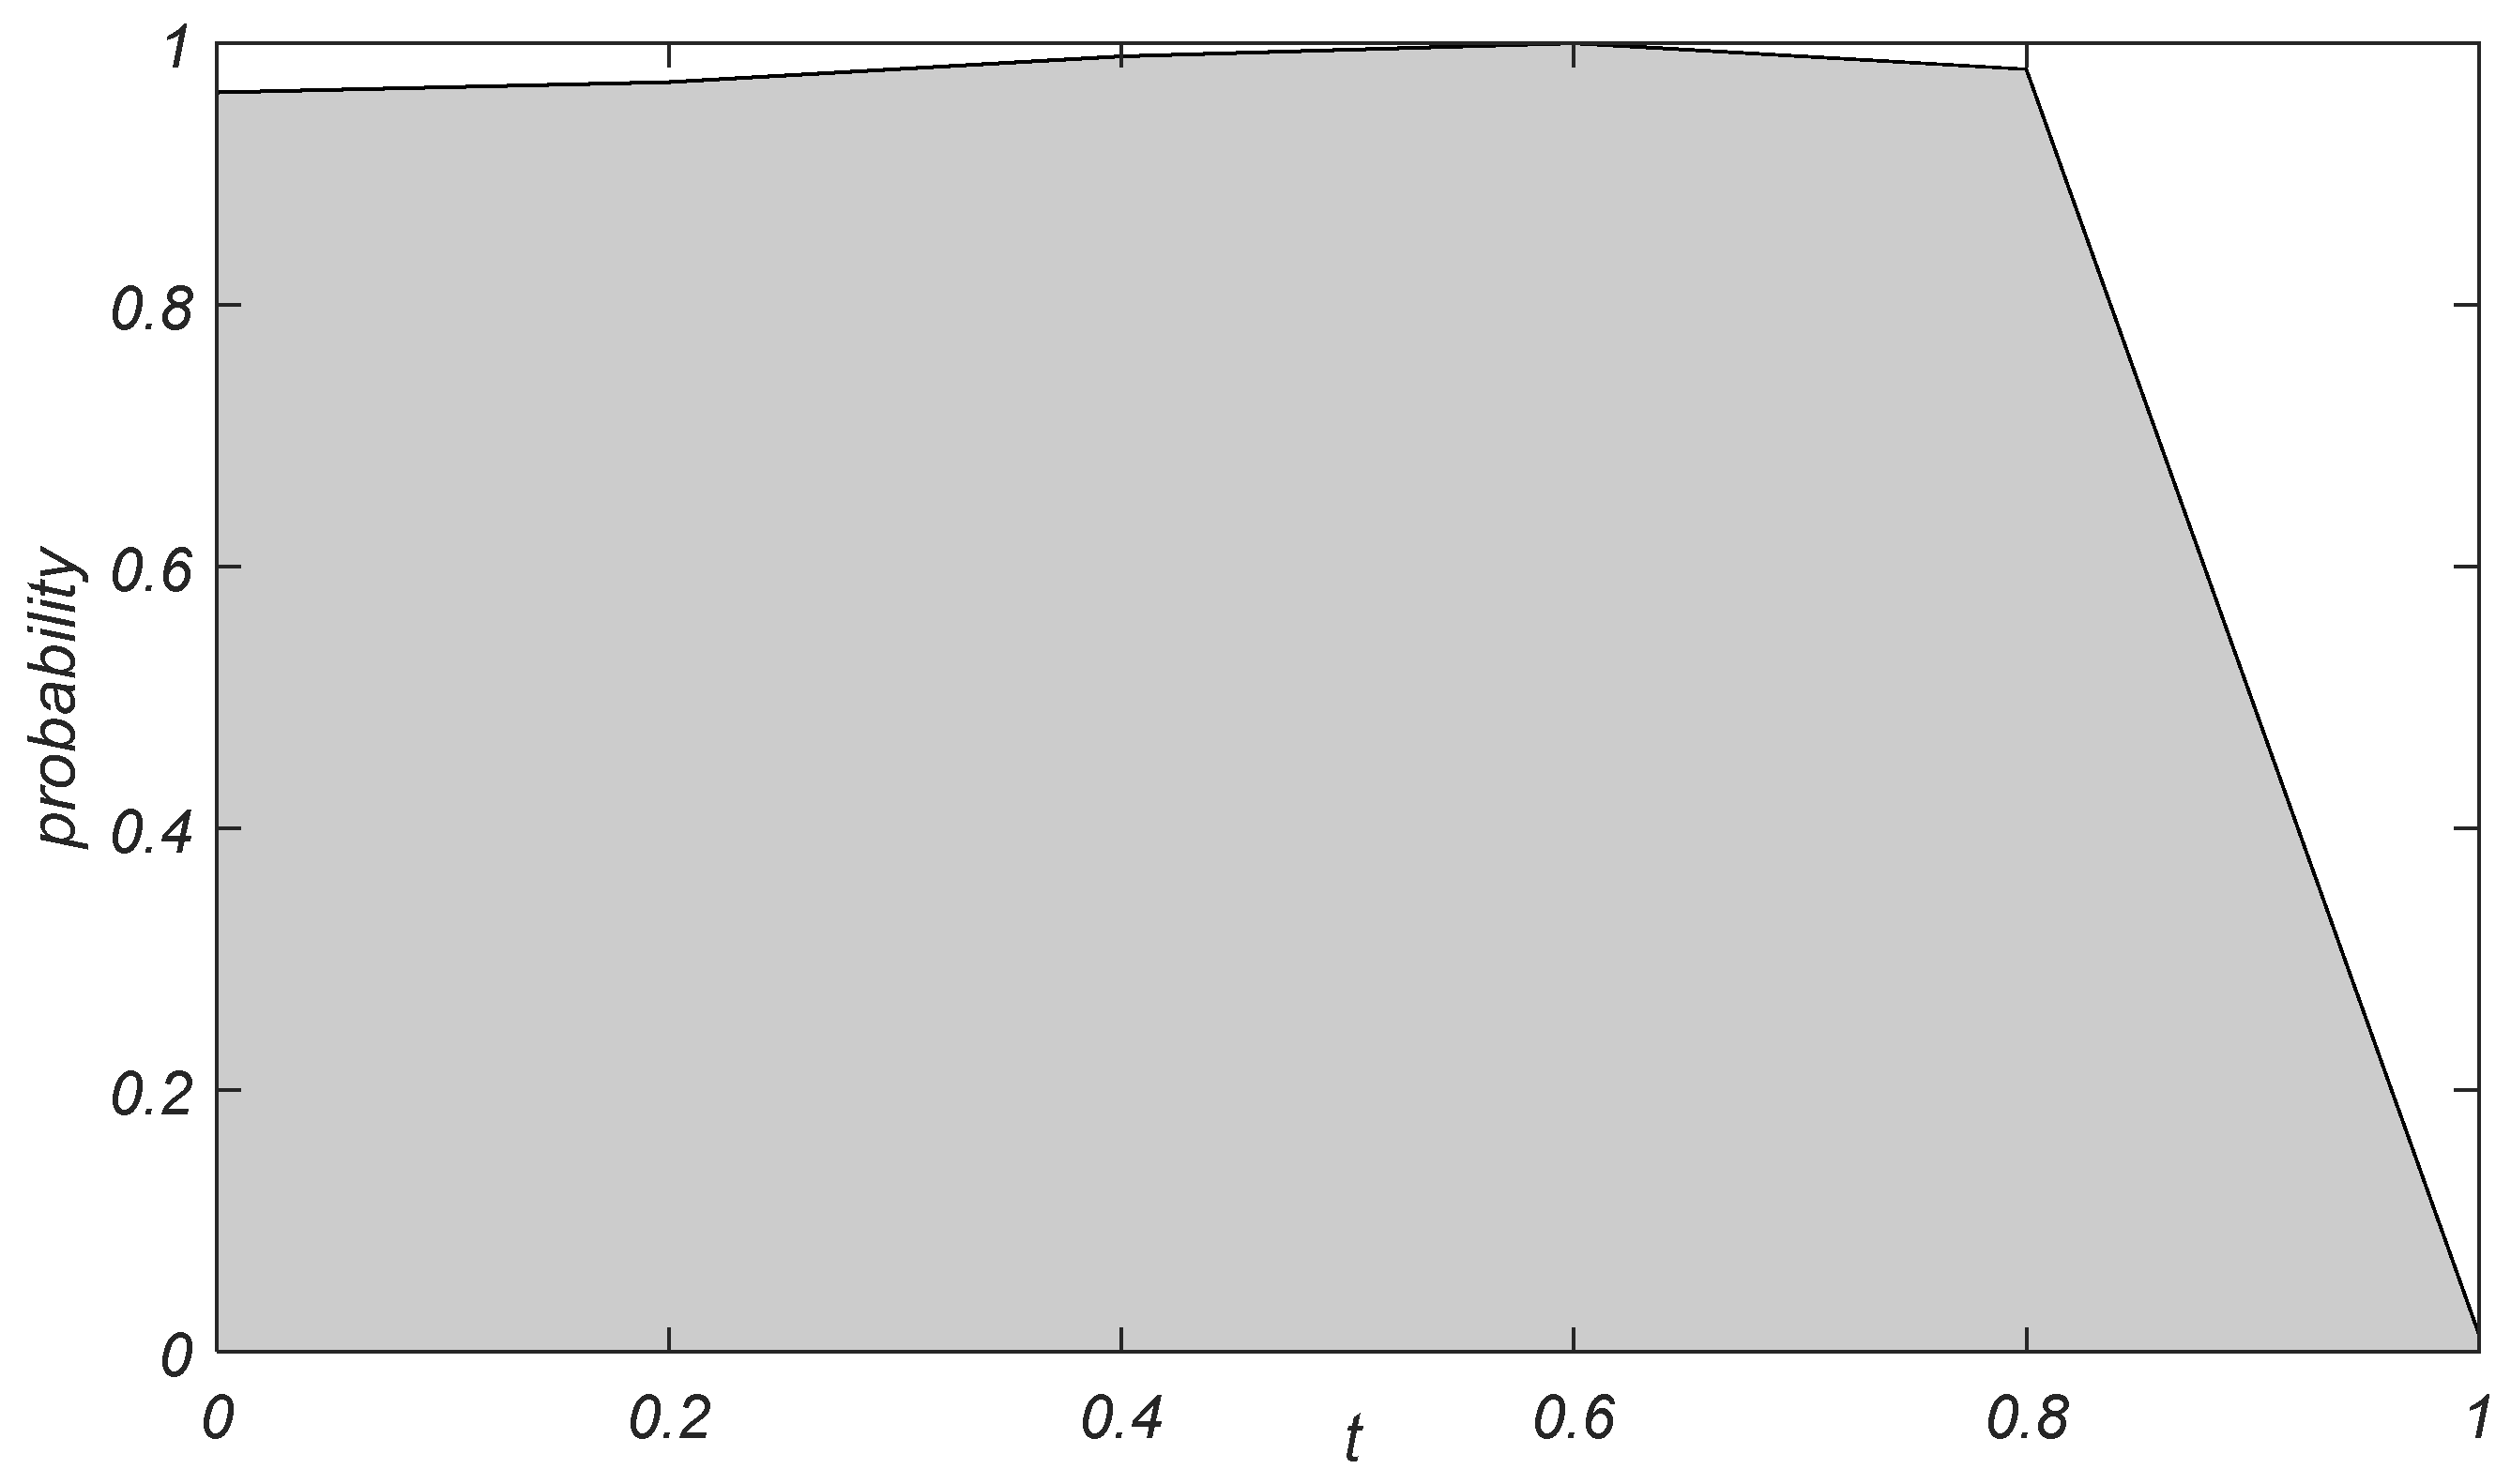
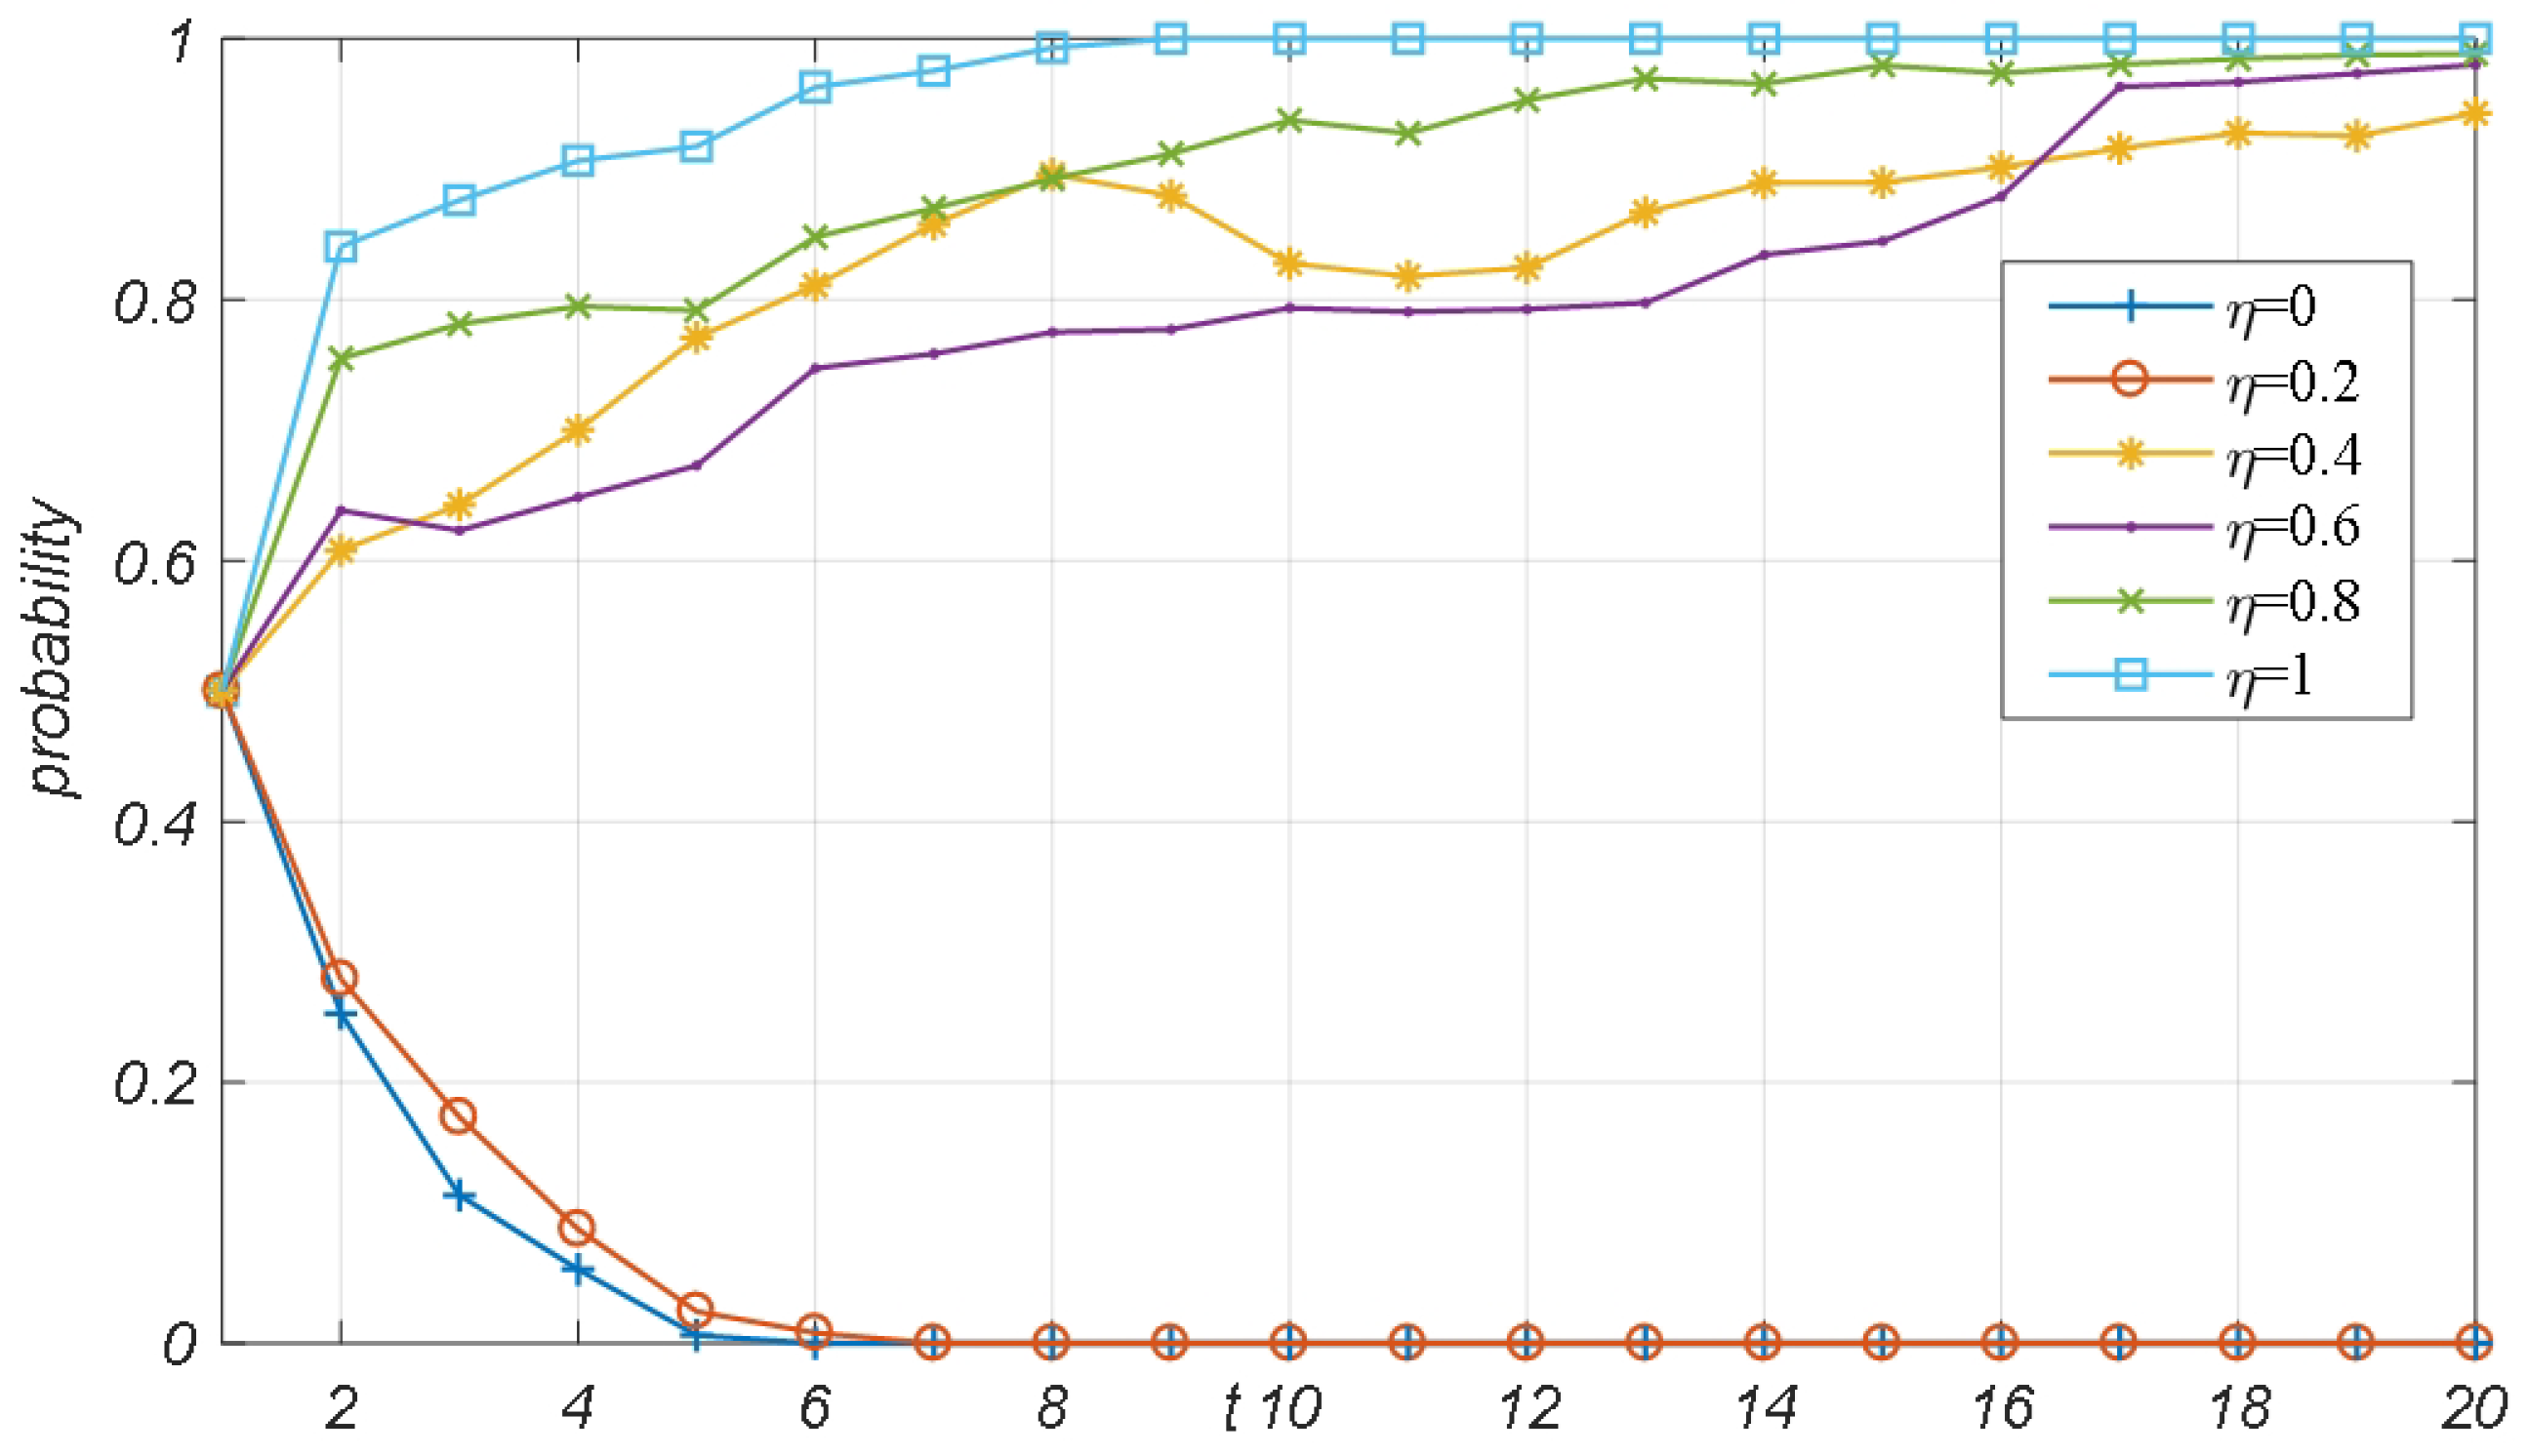
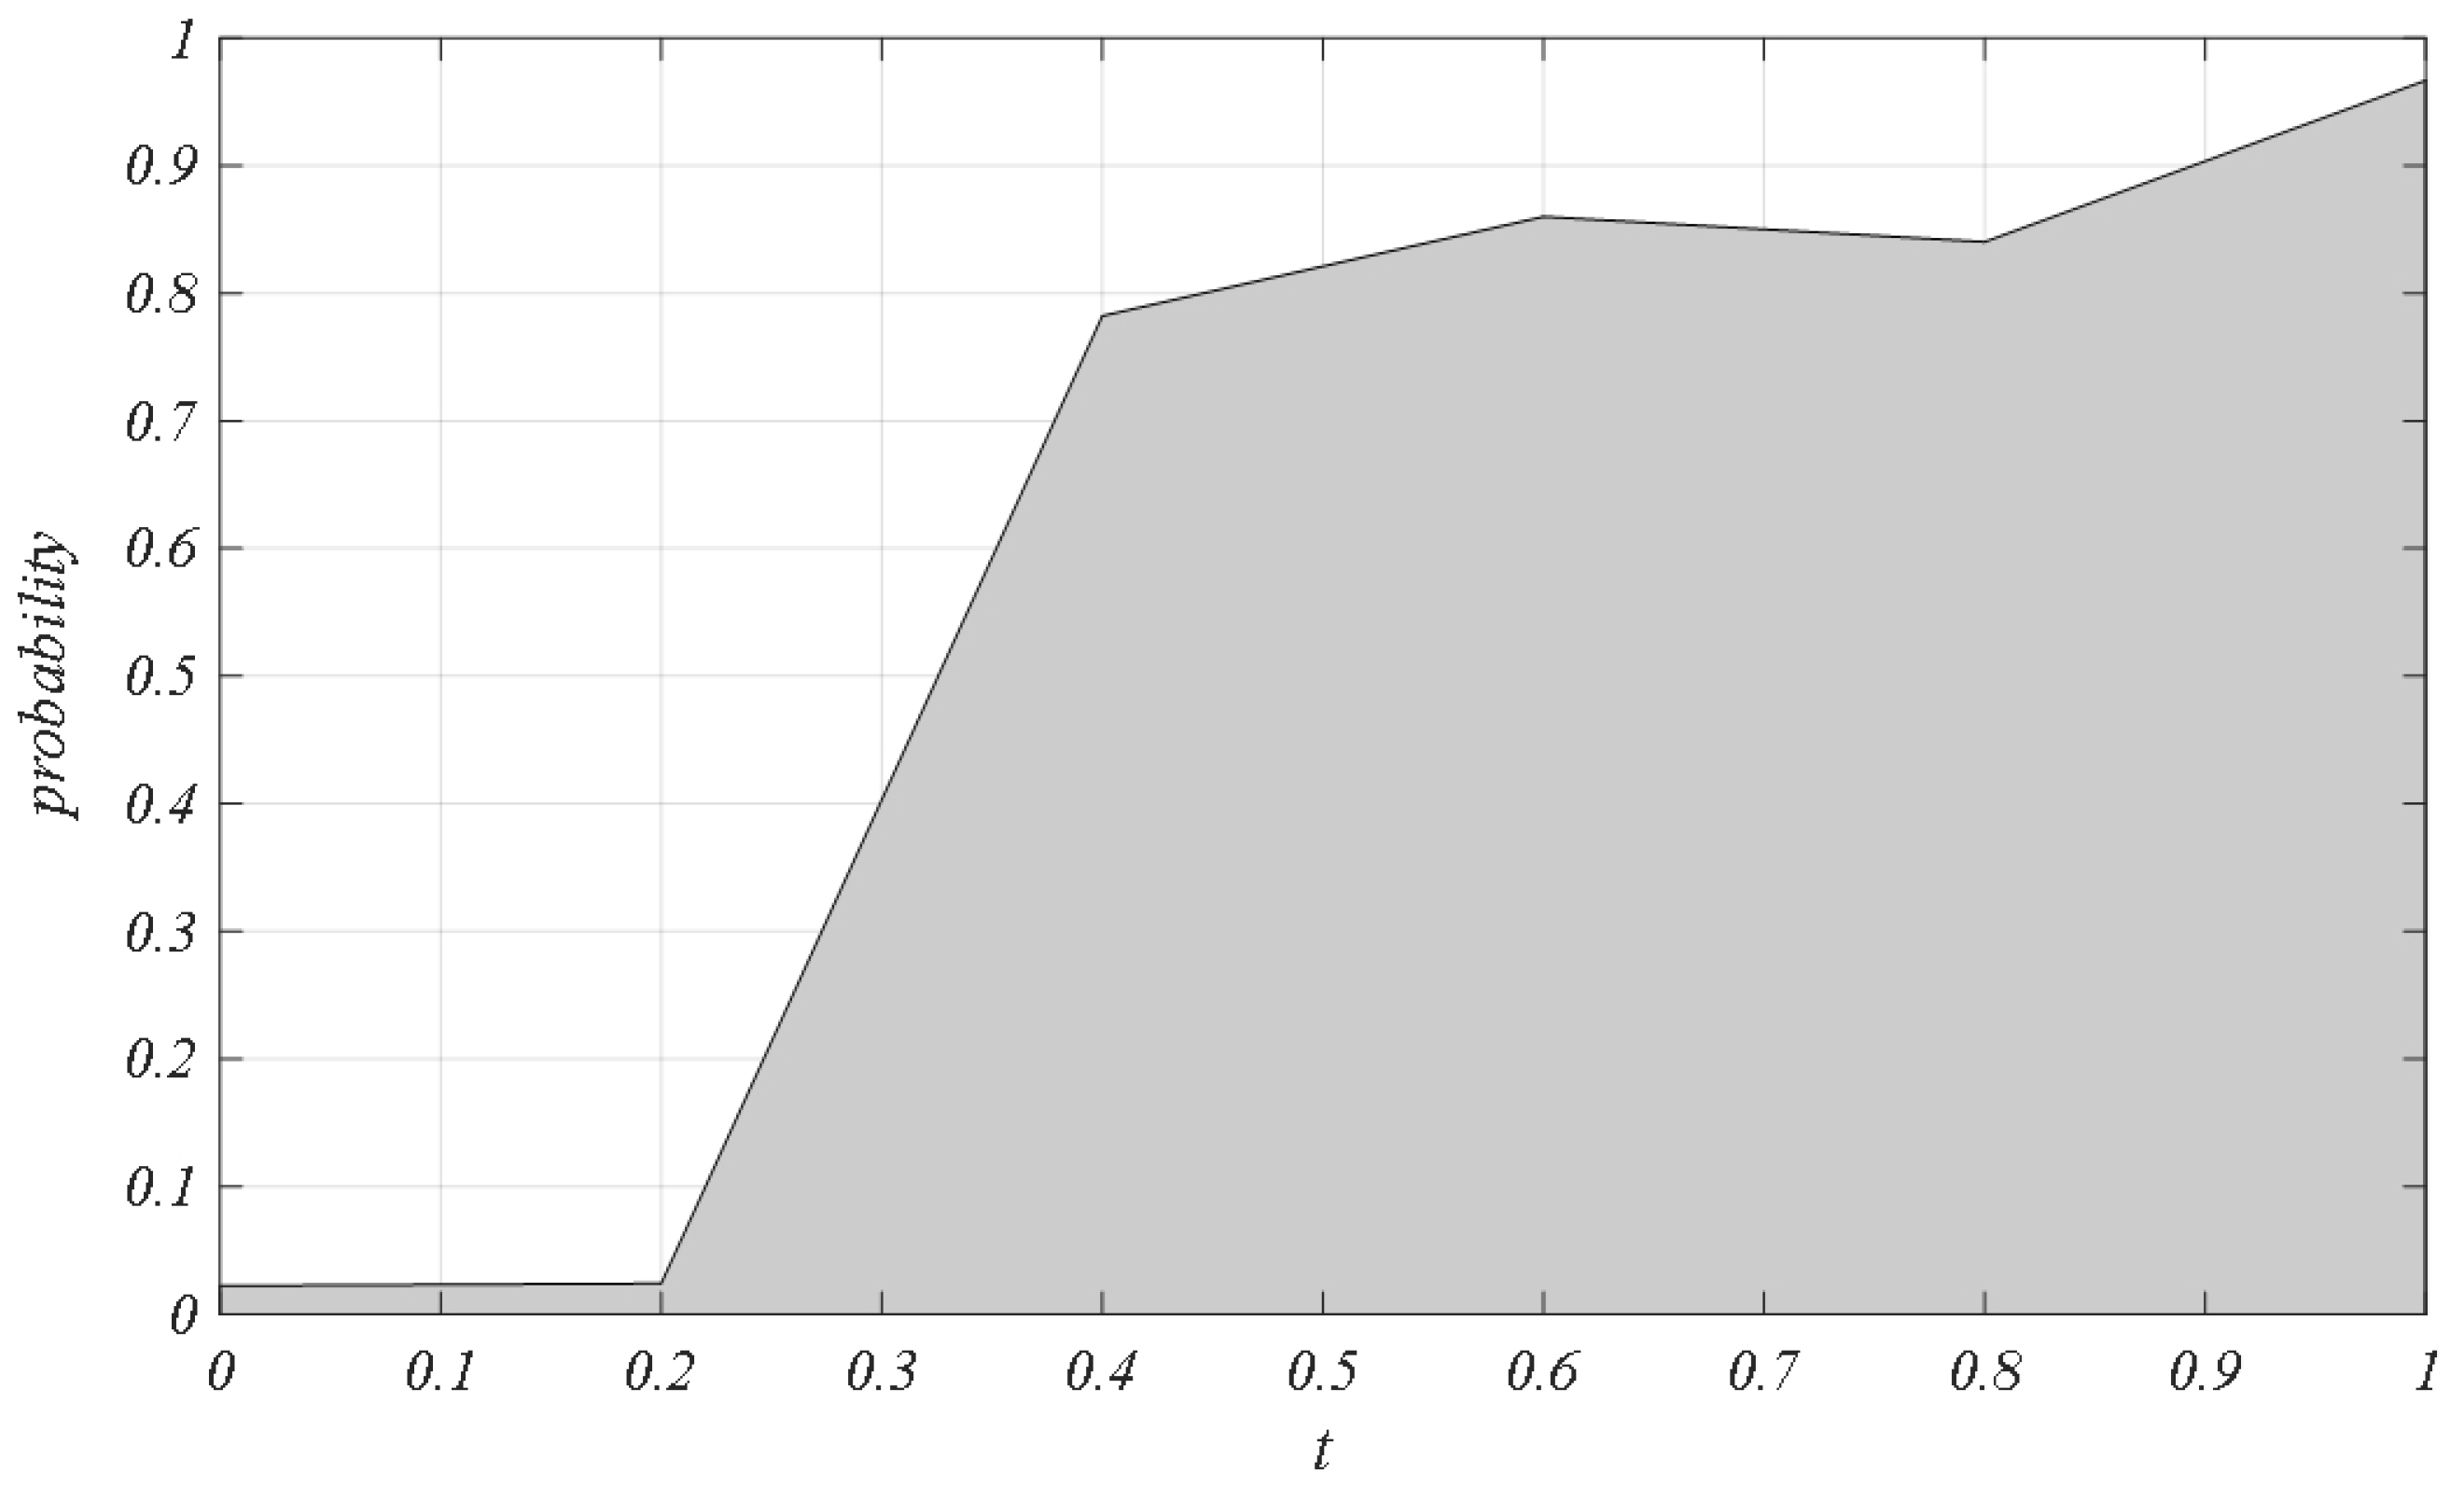
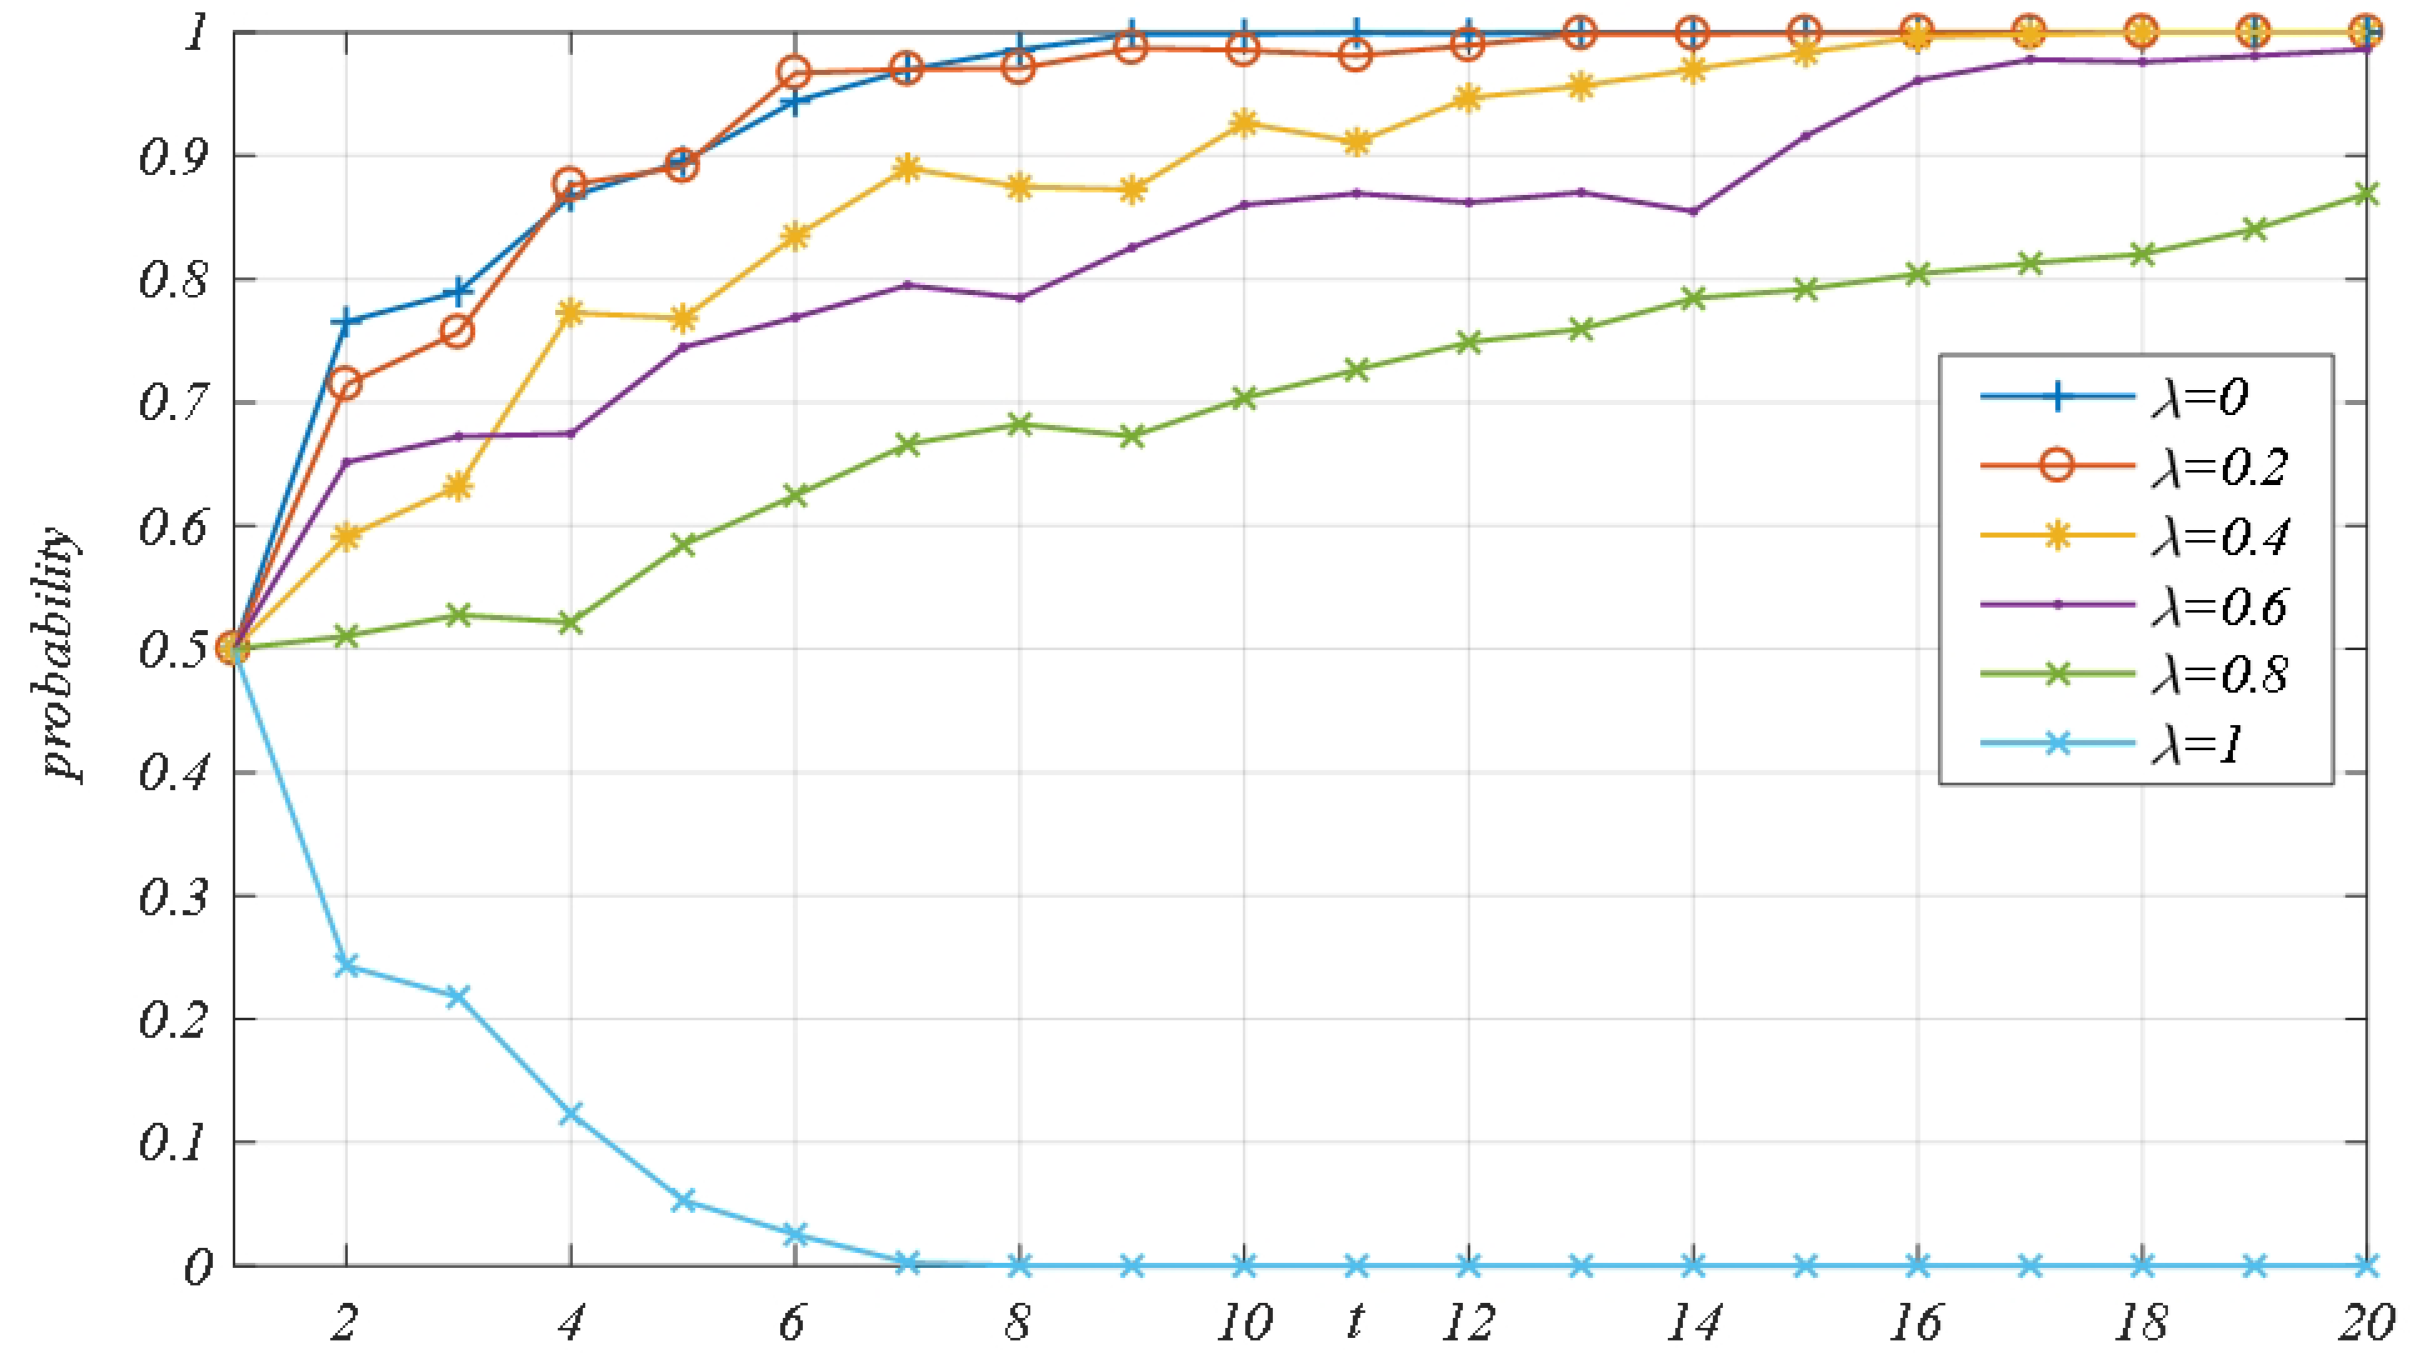
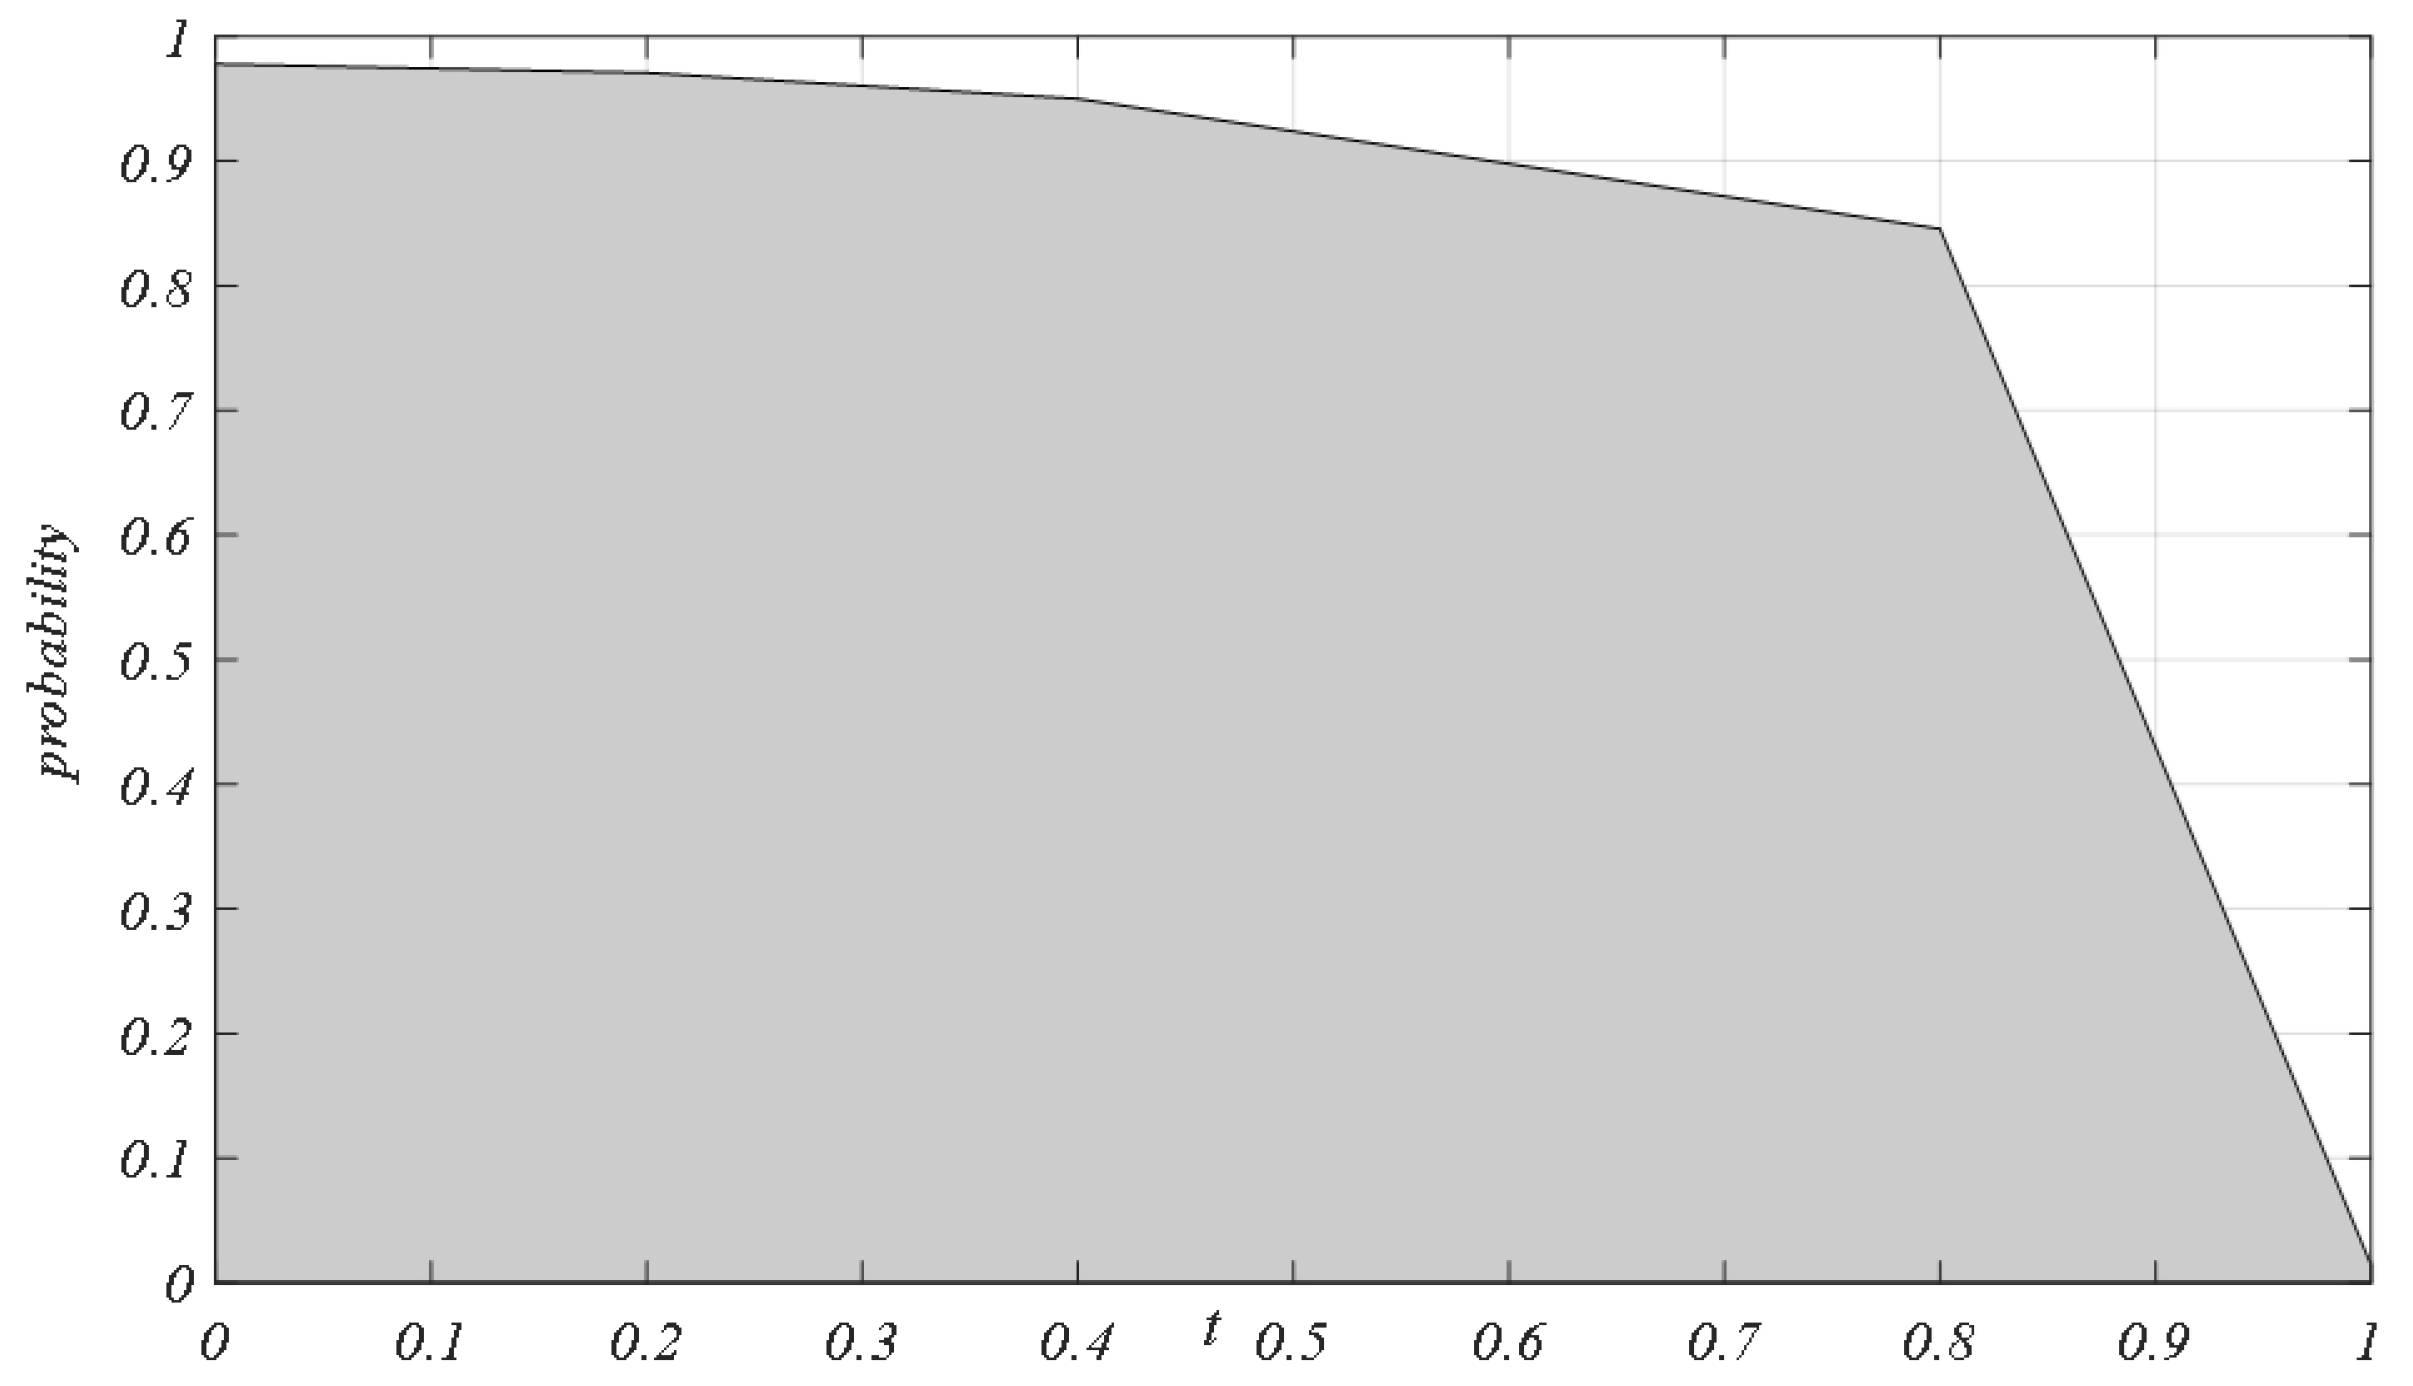
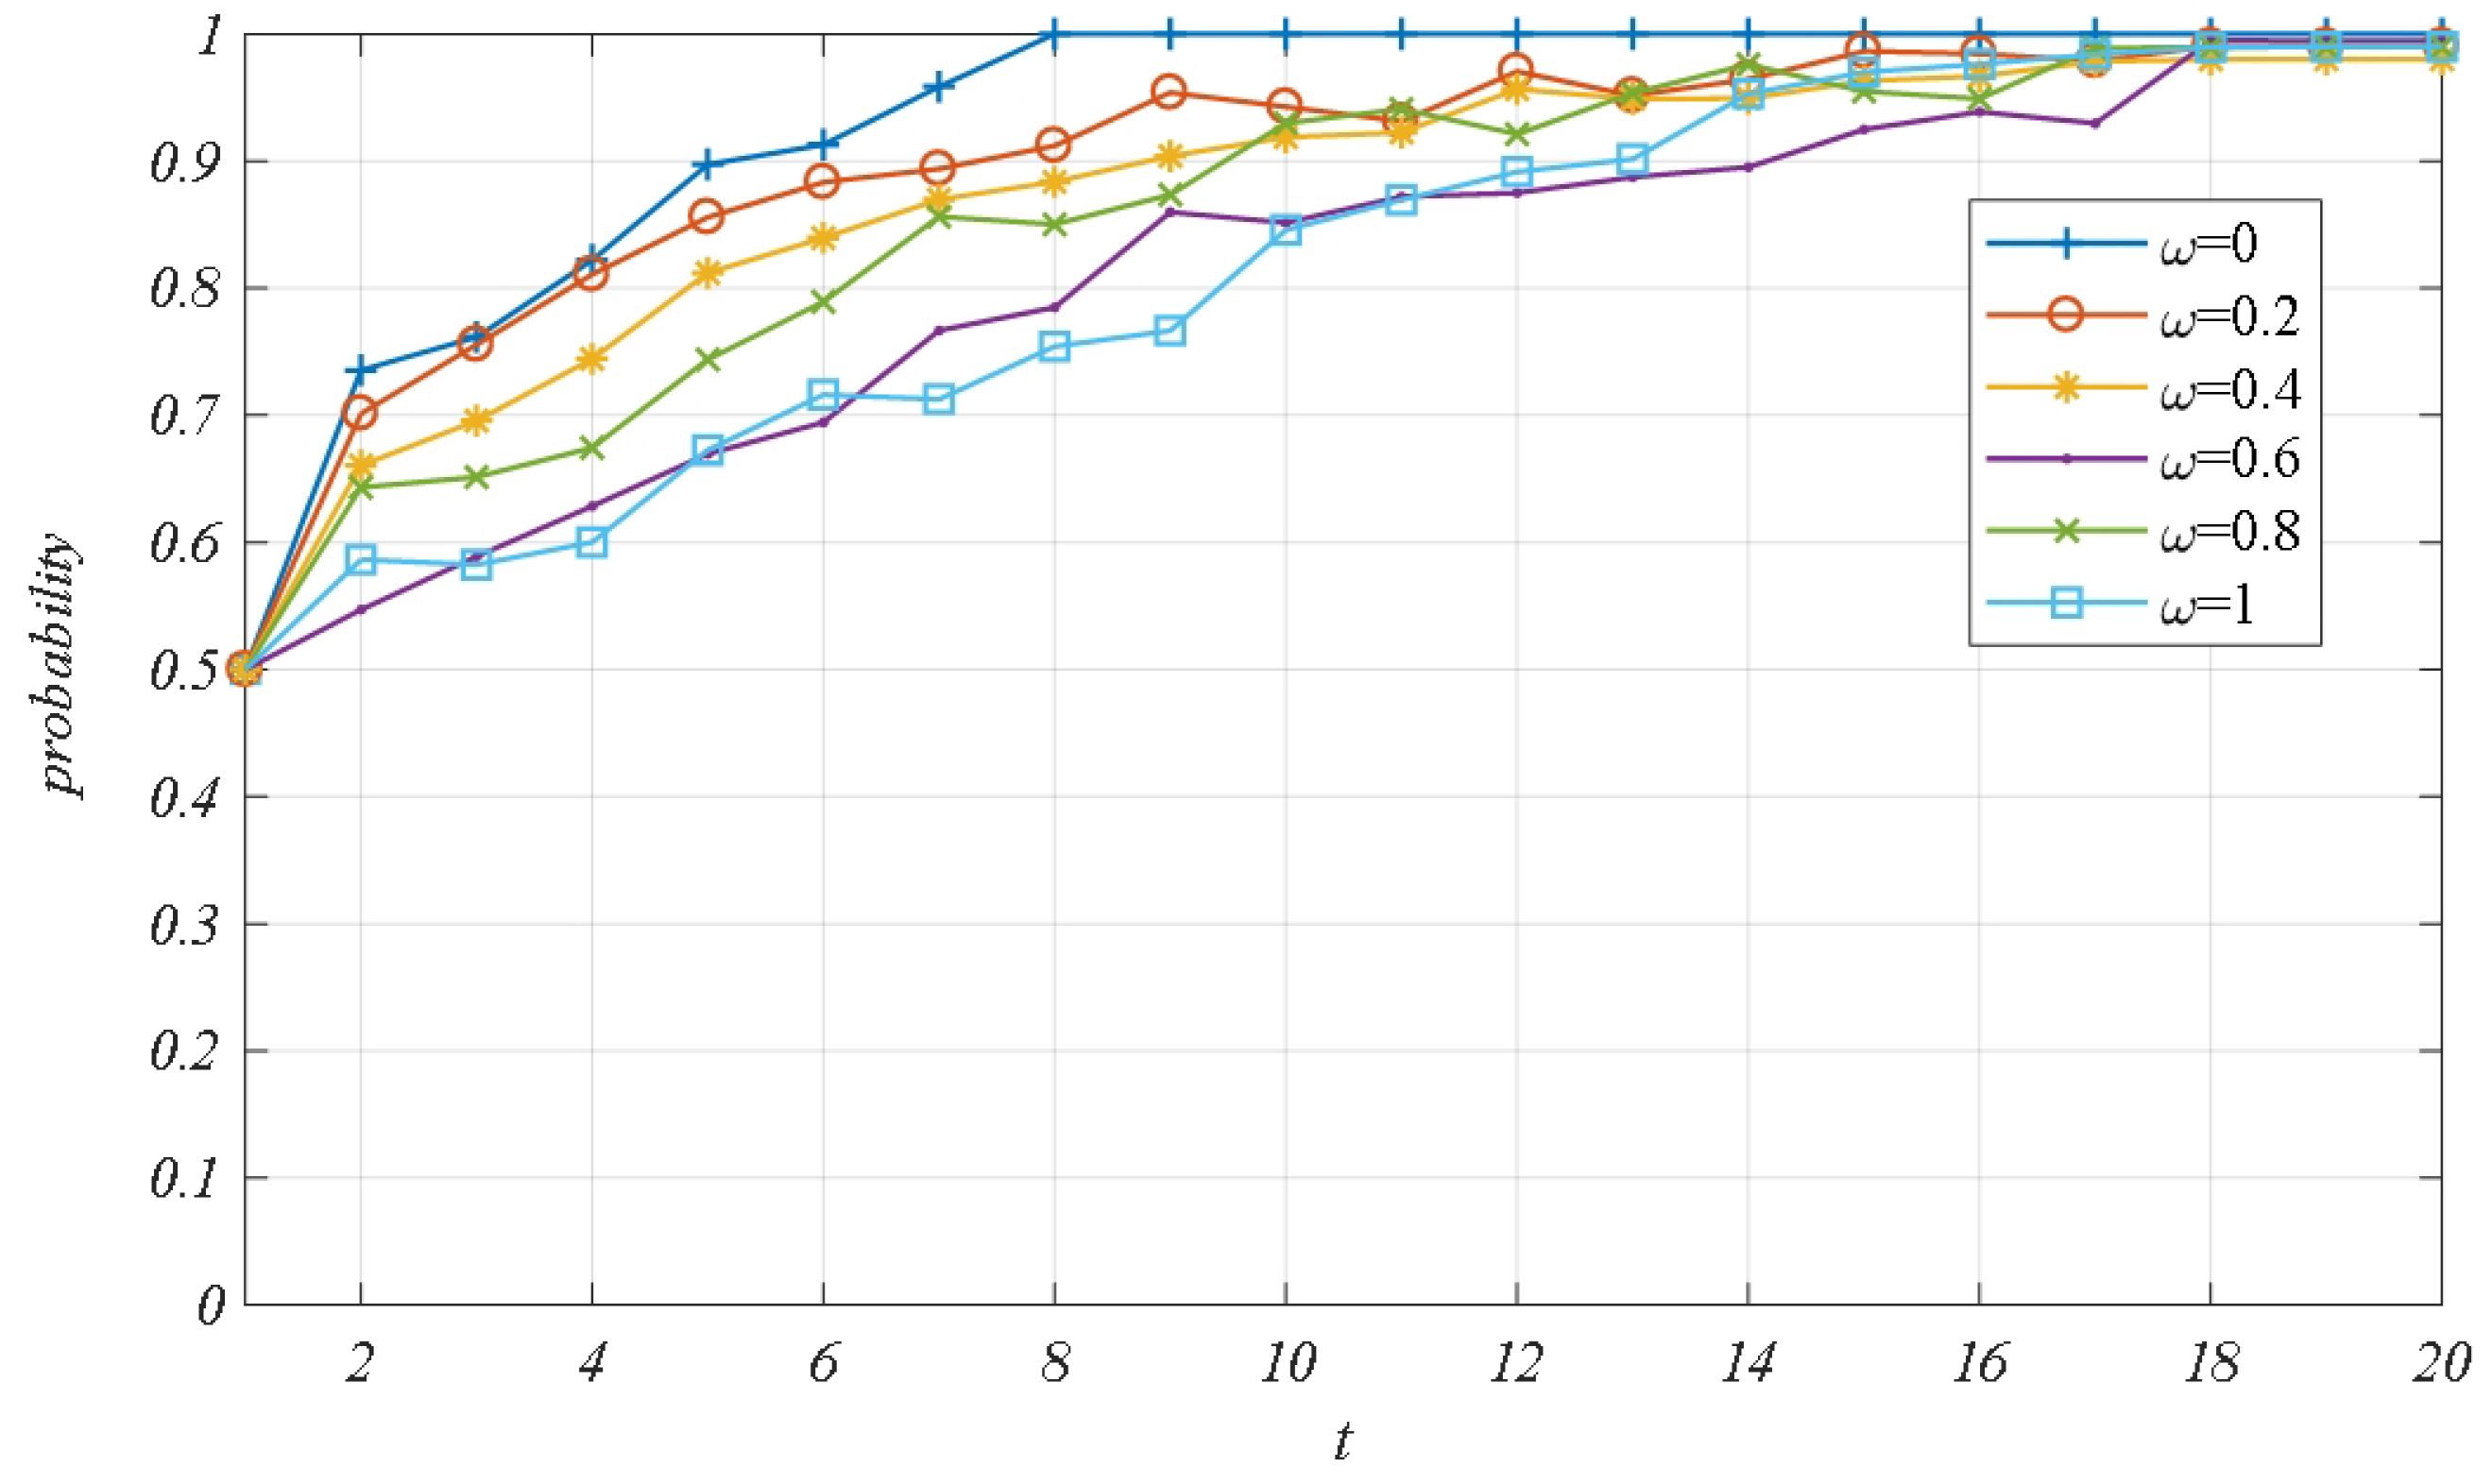
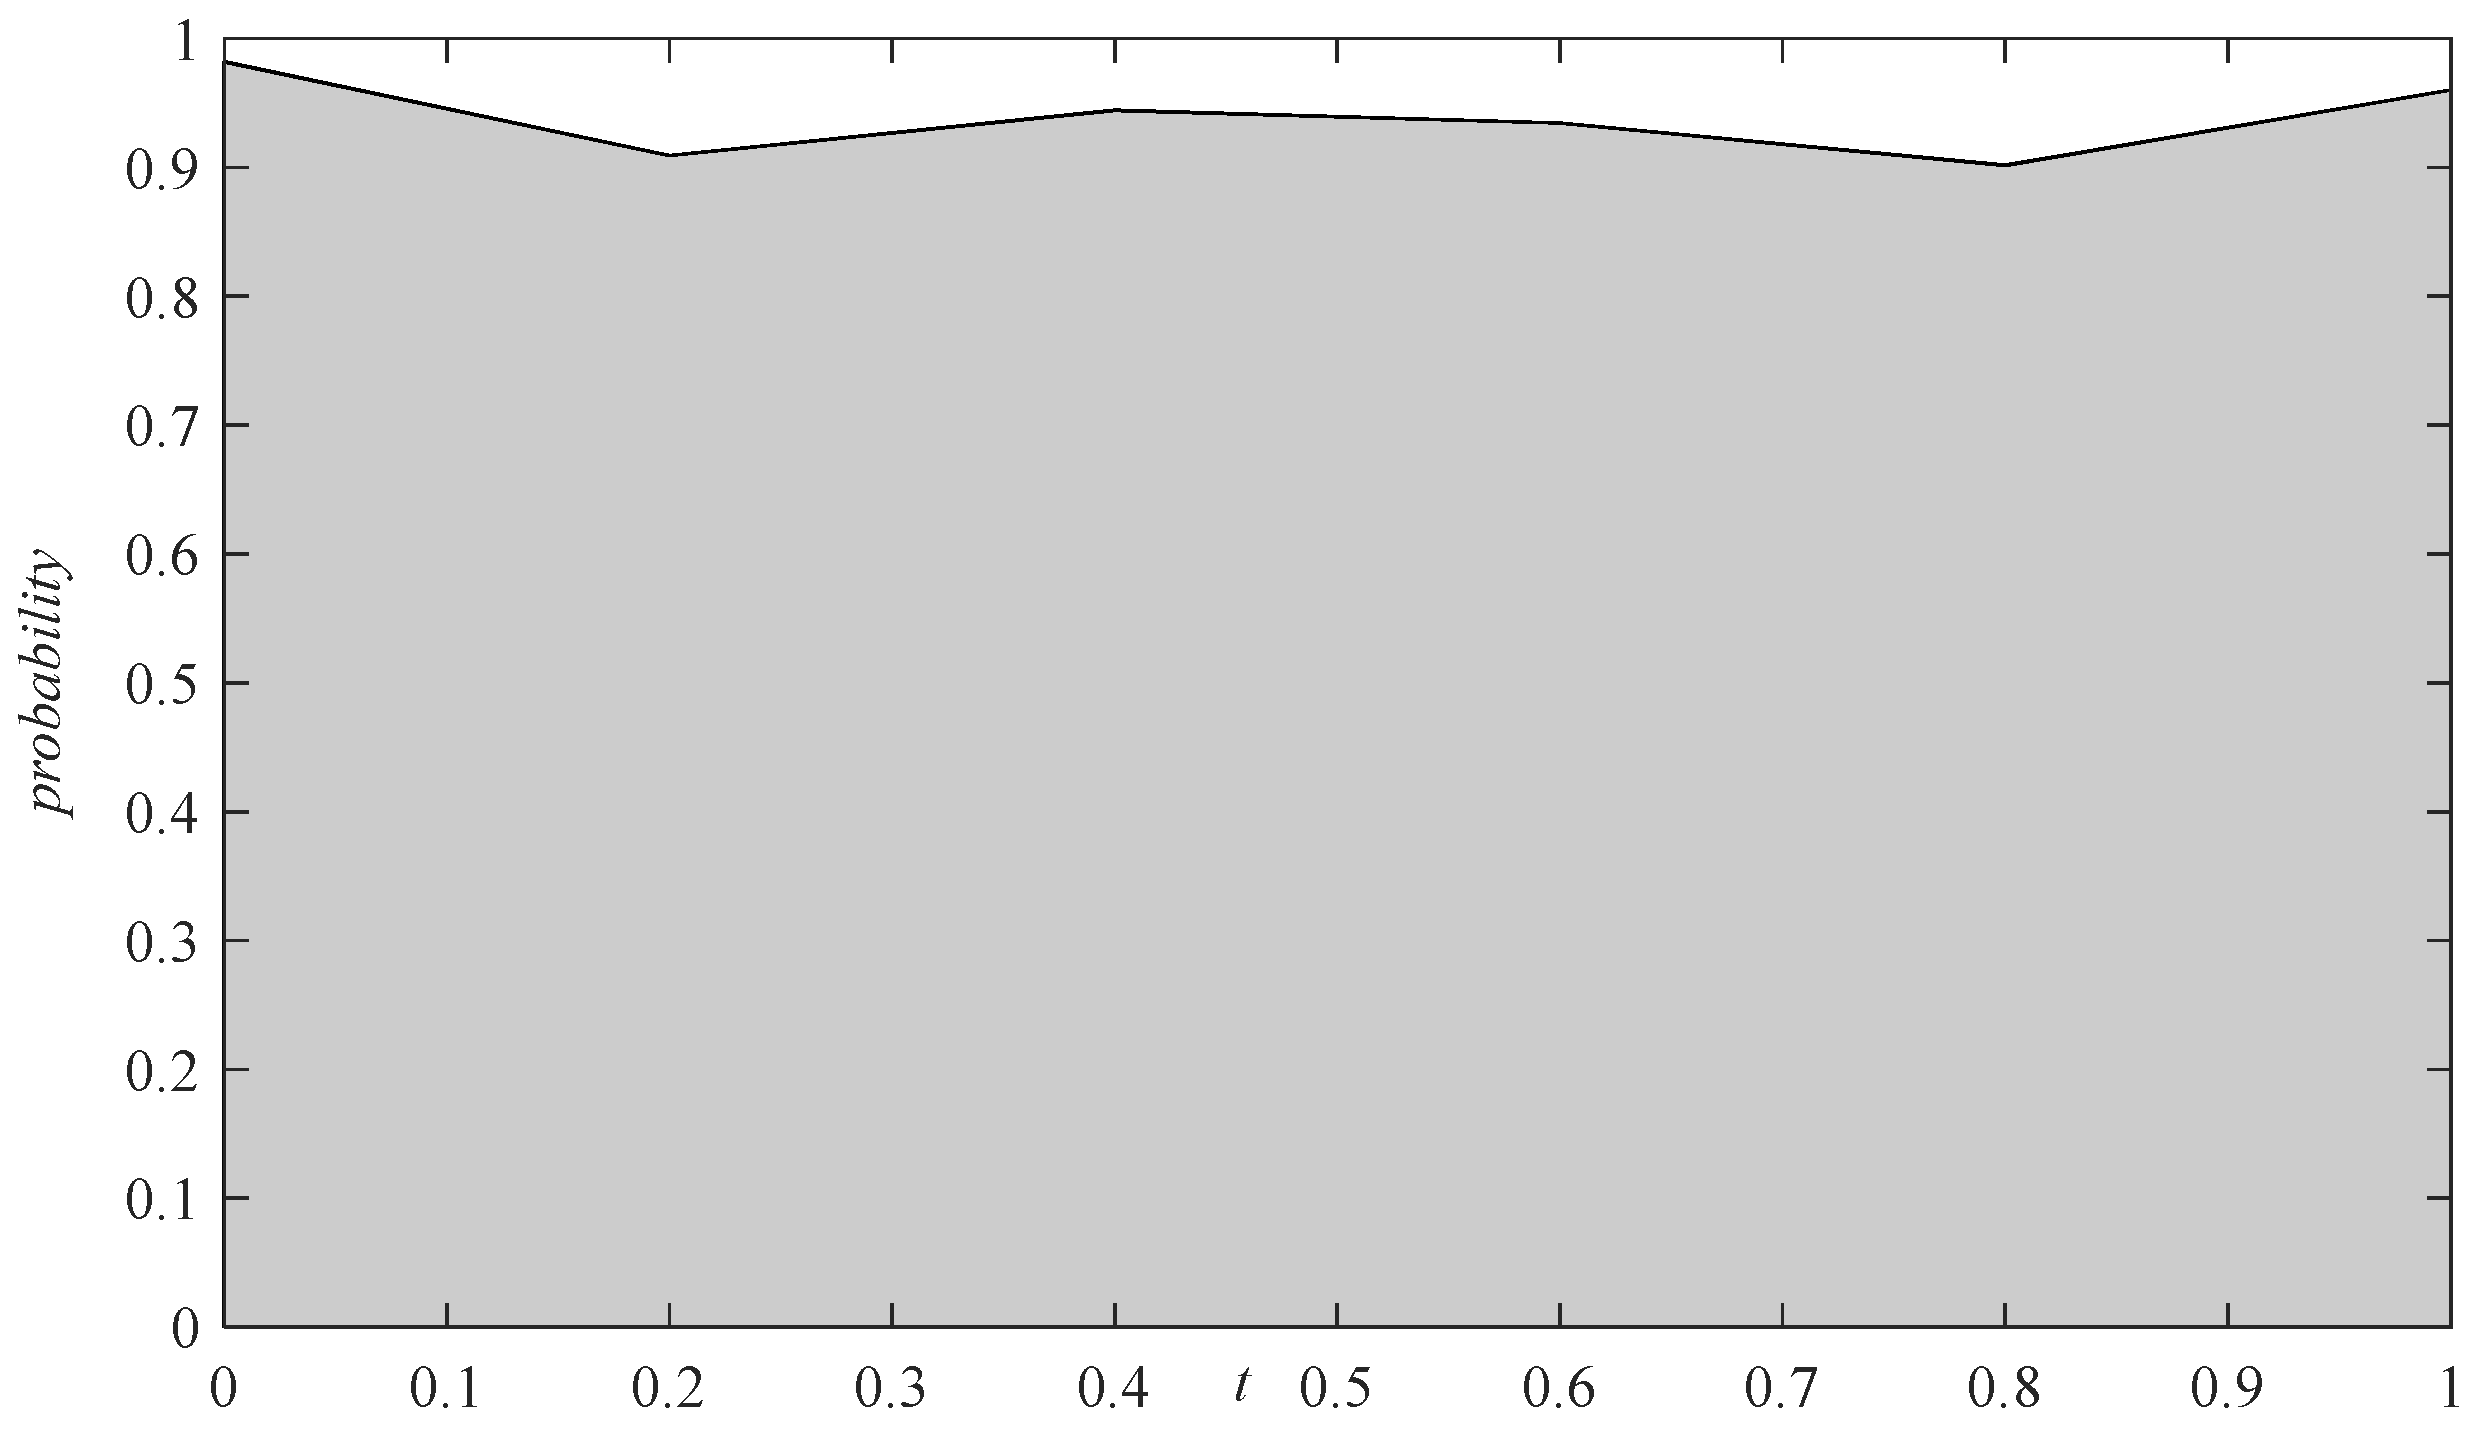
Disclaimer/Publisher’s Note: The statements, opinions and data contained in all publications are solely those of the individual author(s) and contributor(s) and not of MDPI and/or the editor(s). MDPI and/or the editor(s) disclaim responsibility for any injury to people or property resulting from any ideas, methods, instructions or products referred to in the content. |
© 2025 by the authors. Licensee MDPI, Basel, Switzerland. This article is an open access article distributed under the terms and conditions of the Creative Commons Attribution (CC BY) license (https://creativecommons.org/licenses/by/4.0/).