Article

A Dynamic Analysis to Examine Regional Development in the Context of a Digitally Enabled Regional Innovation System: The Case of Western and Central Macedonia (Greece)

1
Department of Accounting and Finance, University of Western Macedonia, 50100 Kozani, Greece
2
Industrial Management Division, Department of Mechanical Engineering, Aristotle University of Thessaloniki, P.O. Box 461, 54124 Thessaloniki, Greece
3
Department of Chemical Engineering, University of Western Macedonia, 50100 Kozani, Greece
*
Author to whom correspondence should be addressed.
Systems 2024, 12(6), 200; https://doi.org/10.3390/systems12060200
Submission received: 17 May 2024 / Revised: 29 May 2024 / Accepted: 4 June 2024 / Published: 7 June 2024
(This article belongs to the Special Issue The Systems Thinking Approach to Strategic Management)

Abstract

:
The significance of Regional Innovation Systems (RIS) as a strategic tool for enhancing a region’s competitiveness has been increasingly recognized. This paper presents a model of RIS that was developed using the system dynamics (SD) methodology. The goal of this model is to amalgamate the systemic approach with computer modeling and simulation disciplines into a comprehensive dynamic framework for analyzing RIS. Within this framework, the paper explores the impact of smart technologies on regional development through the RIS. Specifically, the SD model serves as an ‘experimental tool’ for conducting extensive what-if scenario analyses concerning smart technologies. The efficacy of these technologies is examined in terms of their dynamic influence on regional development, with insights derived from simulation outcomes. Data from two Greek regions provides a strategic analysis over a designated time horizon.

1. Introduction

1.1. Definitions and Context

Innovation is a core driver of national social development. It plays a key role in enhancing the competitive advantages of organizations [1]. With global technological advancements and rapid industrial evolution, scientific and technological innovation has become the foundation of national economic competitiveness. Due to the development of economic globalization, the competition for innovation between different regions has evolved into competition between regional systems [2]. Consequently, a series of regional innovation centers have emerged in different countries. In this context, improving regional innovation capabilities and designing scientific and efficient innovative development models play crucial roles in the current economic development of developed as well as developing countries.
Regional innovation refers to the process of generating new ideas, technologies, and practices within a specific geographic area, typically with the aim of fostering economic growth, competitiveness, and social development. It encompasses various factors of the regional ecosystem, such as research and development (R&D), entrepreneurship, collaboration between academia and industry, infrastructure, and supportive policies tailored to the particular regional characteristics.
In addition to collaboration, infrastructure plays a crucial role in enabling regional innovation. Access to physical infrastructure like transportation networks, communication technologies, and research facilities is essential for facilitating the exchange of ideas and knowledge. Shenzhen, China, provides an example of a region that has transformed from a manufacturing center into a leading innovation hub driven by its focus on technology, entrepreneurship, and government support [3].
However, regional innovation also faces challenges. Access to funding for R&D and startup ventures can be limited in regions with fewer financial resources. Talent retention is another concern, as regions must compete to retain skilled workers and prevent a “brain drain” to more established innovation hubs. Moreover, effective policy coordination among government agencies, industry stakeholders, and educational institutions is essential to create an enabling environment for innovation [4].
Overall, regional innovation is a multifaceted process involving collaboration, infrastructure, entrepreneurship, and supportive policies. By leveraging their unique strengths and addressing challenges, regions can enhance their competitiveness, spur economic growth, and improve quality of life [5,6,7].

1.2. Components of the Regional Innovation System

From the standpoint of innovation systems, a Regional Innovation System (RIS) is an open system made up of innovation resources (technology, knowledge, and information) [8] and innovation actors (government, core businesses, universities, research institutes, and intermediaries) [9,10]. The innovation actors in a regional innovation system foster the diffusion, dissemination, and innovation of knowledge within the region [10,11] under the combined influence of innovation environments (i.e., market environment and social environment), thereby enhancing the evolution and efficiency of knowledge diffusion in the system.
Regional innovation systems are no longer limited by time or location in a digital context. Instead, they reorganize the current innovation resources and processes to create links and interactions across innovation actors, relying on digital technologies, knowledge-sharing platforms, crucial complementary resources, and knowledge-driven innovation.
Overall, the approach put forward in the literature and adopted by this paper views the RIS as comprising six subsystems, which include (i) a Subsystem of Capacity in Information and Communication Technologies (ICT), (ii) a Subsystem of Innovation and Regional Development; (iii) a Subsystem of Institutional Framework; (iv) a Subsystem of Knowledge Implementation/Capitalization; (v) a Subsystem of Knowledge Networking; and (vi) a Subsystem of Knowledge Production/Dissemination. These are briefly explained below.
The characteristics of a Regional Innovation System (RIS) pertaining to contemporary Information Technology (IT), its application, and people’s IT-related abilities are referred to as the Subsystem of Competence in ICT. By bringing individuals together who share interests, encouraging collaborative knowledge generation, and fostering the growth of intelligent learning environments, ICT facilitates the spread of information [12].
The Innovation and Regional Development subsystem includes processes such as product innovation, process innovation, strategic intelligence, cooperative R&D, the emergence of new markets, the drawing of knowledge-intensive industries, and the production of spin-offs [13].
The subsystem of the Institutional Framework focuses on the role of institutions in innovation. Inside an institutional framework, a variety of private and governmental organizations interact and function together. The traditions, customs, human value systems, and social structure of a nation are frequently referred to as the “institutional environment” or “institutional framework” [13]. Particular laws and norms, as well as national and international regulations, make up the institutional framework at the regional level [14].
In the subsystem of Knowledge Implementation/Capitalization, knowledge application and exploitation constitute a significant portion of RISs’ business operations. This subsystem’s primary constituents include clients, contractors, partners, and competitors [15]. A dynamic regional innovation ecosystem revolves around creative enterprises and clusters that possess strong learning capacities and can convert their existing knowledge into commercial success [16].
The Subsystem of Knowledge Networking refers to how supply chain relationships, firms, and networks of practices can create and/or spread knowledge through interaction [17]. Knowledge can be categorized into explicit and tacit forms. “Explicit knowledge” refers to information that is documented, conveyed using formal languages, and stored in databases, archives, and libraries. Conversely, “tacit” information is difficult to formalize and convey through other human communication channels due to its individualized character. The accumulation of innovative activity is facilitated by tacit knowledge that is based on location [5].
Finally, the subsystem of Knowledge Production/Dissemination is concerned with the sharing and transferring of knowledge through formal and informal practices. Knowledge transfer can be acquired through an established knowledge network, which is viewed as a network of connections between actors that facilitates learning between businesses and organizations [18]. An economy’s knowledge base can be described as its capacity to generate and invent novel concepts, ideas, procedures, and goods, as well as how they might be interpreted in relation to economic growth [19].

1.3. Literature Review and Research Aims

Regions play a crucial role in the global economy, being the first to experience the impact of economic changes and thus actively engage in the formulation of research and innovation policies [13]. The Regional Innovation System (RIS) is a key tool for implementing these policies and analyzing the innovation process at the regional level. Since the early 1990s, the European Commission has introduced various policy programs that provide a strategic view of technology and innovation at the regional level [20]. Programs such as the Regional Infrastructures and Strategies for Innovation and Technology Transfer (RITTS), Regional Technology Plans (RTPs), and Regional Innovation Strategies (RIS) have offered co-funding and guidance to regional governments. These programs aim to assess regional innovation potential and define strategies that promote cooperation and capacity building among small businesses, the research and technology community, and public authorities, ultimately achieving regional development [21].
The issue of regional development in Greece has posed a consistent obstacle due to economic imbalances, unequal allocation of resources, and differing degrees of infrastructural development. To address these issues, European strategies such as Regional Innovation Strategies (RIS) and the Entrepreneurial Discovery Process (EDP) have played crucial roles [22]. The Entrepreneurial Discovery Process (EDP) is an iterative process that involves stakeholders from various sectors to identify and exploit new opportunities for innovation and growth. EDP is a cornerstone of the smart specialization strategy, which aims to prioritize investments in key areas where regions have competitive advantages [23]. These strategies are particularly evident in the regional policy frameworks and implementations, such as those seen in the region of Attica, Greece [24].
The development strategy (2014–2020) includes Research and Innovation Strategies for Smart Specialization (RIS3). Based on the principles of the Europe 2020 strategy for smart, sustainable, and inclusive growth, RIS3 aims to achieve high levels of employment, productivity, and social cohesion within the EU and its Member States. Smart specialization is vital for sustainable growth, offering opportunities in both domestic and global markets. It also contributes to inclusive growth among regions, strengthens territorial cohesion, and manages structural changes, creating jobs and fostering social innovation [22].
Additionally, the concept of Smart Cities has gained prominence. Globally, smart cities are seen as fundamental to the sustainable development of urban centers, ensuring their future expansion under sustainable conditions. Smart cities are part of the broader objective of Western societies, which is to transition towards a knowledge-based economy and society. These cities enhance human capacities for creativity, learning, and innovation. According to Komninos [25], smart cities comprise three key components:
1. The innovation system (local/regional) of the reference region guides the development of knowledge and technologies within regional organizations (businesses, universities, technology centers, incubators, etc.).
2. Smart Technologies, including digital information and knowledge management applications that facilitate communication, decision-making, technology transfer, and collaboration in innovation.
3. The reference area, or the city itself, consists of the physical space and its inhabitants.
This research explores how the components of smart cities are linked at the regional level. The literature review identifies specific gaps, particularly in the complexity of policy planning and smart specialization, which involve multiple stakeholders and often insufficient information. Ranga and Etzkowitz [26] highlighted the need for strengthened multi-level policies that require comprehensive evidence to identify and select regional priorities effectively [27].
To address these gaps in strategy development, skills, and methods, the literature suggests leveraging Smart Technologies. Digital platforms are proposed as a solution, providing a dynamic economic structure that can enhance stakeholder engagement and the use of advanced datasets. These platforms enable the creation of ecosystems where users can collaborate across a wide range of activities [28,29,30]. Such environments can be used for dissemination and sharing common goals, enhancing collaboration among stakeholders, and guiding innovation during the RIS3 design process [25,31].
Innovation, collaboration, and coordination can be effectively developed through network relationships [32]. Consequently, online platforms in policy formulation and strategic planning should be considered key components of the Regional Innovation System [25].
This research focuses on the use of New Technologies in Regional Innovation Systems for Regional Development. To this end, we will create a dynamic model capturing the level of Regional Development in relation to the contribution of smart technologies by the actors involved in the Regional Innovation System. This model will be applied to two Greek regions with different Regional Development indicators: the Region of Western Macedonia and the Region of Central Macedonia. It will serve as a guide and methodological tool for formulating appropriate regional policies by identifying strengths and weaknesses within the Regional System and enhancing those that provide multiplier benefits for Regional Development.
The research aims to answer whether the use of new technologies in a Regional Innovation System benefits Regional Development, as defined and measurable by specific indicators. The study focuses on modeling the influence of intelligent technologies on regional development, employing the RIS framework and utilizing the system dynamics technique. The objective is to examine the dynamic impacts of these technologies and offer a strategic analysis based on scenarios within two distinct Greek regions. Specifically, the study analyzed different possible values for:
  • The percentage of home Internet connections;
  • The presence of ICT specialists in the study region;
  • The usage of personal computers; and
  • The extent of ICT programs in the study area.
The model indirectly differentiates the values of the remaining independent variables.

1.4. Overview of the Study Regions

The mathematical model we present allows the empirical evaluation of the operation of a regional innovation system. The model developed is applied to the RISs of two Greek NUTS 2-level regions, Western and Central Macedonia, and various scenarios of changes in the indicators of smart technologies are developed to observe their impact on the two regions under consideration’s regional development.
The Region of Western Macedonia is located in the northwest of the country. It is the only region of Greece that is located far from the sea and is not on main tourist routes. It covers an area of 9451 km2 and has a relatively small population of 250,4531 (2023), which is decreasing due to immigration. The capital of the region is Kozani. The other much smaller population centers are Ptolemaida, Grevena, Florina and Kastoria. The region’s GDP per capita amounts to EUR 5.549262 million PPS (2022), representing only 60% of the EU average [33].
Western Macedonia is a threatened region due to its high dependence on fossil fuel-related industry. For several decades, Western Macedonia was the main energy-producing region in Greece. Home to around 80% of Greece’s lignite industry, the region provided well over 70% of the country’s grid electricity at its peak—resulting in high CO2 emissions and negative health impacts from associated air and water pollution. In the face of increasingly strict EU environmental directives, lignite power generation in the region has been phased out since 2010 [34].
Economic decline and unemployment are the main socioeconomic challenges for the region. Unemployment rates in Western Macedonia hovered around 30% in 2012–2018 and have fallen to around 23% in recent years (16.7% in 20233) as people leave the region to find work elsewhere (Eurostat). Youth unemployment in the region is among the highest in the EU. It is estimated that over 20% of regional businesses have ceased operations since 2008, while the turnover of those that remain, particularly in the trade sector, has fallen by 40% [35].
The region has a weak innovation potential, which is exacerbated by a strong outflow of people, especially among young people. There is almost no private R&D investment. The region’s other main sectors—fur industry and agri-food—are not traditionally knowledge-based. Overall, Western Macedonia—an emerging innovative actor according to the EU’s regional innovation scoreboard [36]—currently does not present a fertile environment for innovation-driven growth [37].
Western Macedonia is leveraging smart technologies to enhance public services, environmental management and energy efficiency. Urban areas implement smart city projects to improve mobility, waste management, and energy efficiency, which support the goals of sustainable and equitable urban development [33,38].
In addition, the region is exploring the application of digital technology in agriculture (precision farming), tourism (digital platforms to improve tourist experiences) and natural resource management. The aim is to utilize ICT to promote economic development, improve the quality of life and maintain environmental sustainability.
Central Macedonia, situated in northern Greece, encompasses the major urban center of Thessaloniki, as well as smaller cities such as Katerini and Serres. Its economy is characterized by diversity, with key sectors including industry, agriculture, tourism, and services [39].
Central Macedonia is a modest innovator. Innovation performance has increased over time [36]. Central Macedonia is a vibrant and diverse region located in the northern part of Greece. It is a focal point in terms of geography, economy, and culture. It is the second most populous region in Greece, and it includes the city of Thessaloniki, which is the second largest city in the country. Thessaloniki itself is a center of cultural activities, historical sites and educational institutions, making it a focal point for tourists and residents alike.
From an economic point of view, Central Macedonia is a power in the Greek context. It has a dynamic economy with diverse sectors such as agriculture, industry and services. The region is an important agricultural producer known for its fruits, vegetables and wine, thanks to its fertile plains. Industrial activity is also important, with an emphasis on areas such as food processing, textiles and heavy industry in the Thessaloniki area [39].
The region boasts a robust industrial base, with manufacturing activities spanning textiles, food processing, chemicals, pharmaceuticals, and automotive sectors. Thessaloniki stands out as a major industrial and commercial hub, attracting businesses and fostering economic activity [40].
Agriculture thrives in Central Macedonia due to its fertile land and favorable climate. The region produces grains, fruits, vegetables, olives, and tobacco, contributing significantly to its economy. Tourism is another vital sector, drawing visitors with its cultural heritage, historical sites, and scenic landscapes. Thessaloniki offers Byzantine monuments and a vibrant cultural scene, while coastal resorts along the Thermaic Gulf and Halkidiki peninsula attract beachgoers and tourists. Services play a crucial role, with Thessaloniki serving as a commercial and financial center, hosting businesses, banks, and service-oriented enterprises. The city’s port and transportation infrastructure facilitate trade and connectivity within the region and beyond.
Central Macedonia faces challenges like unemployment and the need for innovation. However, opportunities for growth exist, including further development of tourism, promotion of entrepreneurship, and leveraging its strategic location. In summary, Central Macedonia’s economy is diverse, supported by its industrial strength, agricultural resources, tourism appeal, and strategic location, positioning it as a significant contributor to Greece’s economic landscape [40].

2. System and Problem Description

2.1. System Description

Figure 1 exhibits a very generic description of the RIS under study. In particular, the conceptualization of the regional innovation system as comprising six subsystems is adopted in light of the aforementioned literature review, focusing on regional innovation systems and the innovative processes occurring within them, prior to evaluating and examining the differences among the Greek regional systems. The subsystems themselves consist of various parts, each of which can be quantitatively assessed. Due to the dynamic nature of the system and its subsystems, the characteristics of each factor impact the others [24]. The subsystems include:
  • The ICT capacity subsystem.
  • The innovation and regional development subsystem considers innovative outcomes.
  • The institutional framework subsystem includes regional governance.
  • The knowledge capitalization and application subsystem (comprising businesses and clusters).
  • The knowledge network subsystem.
  • The knowledge production and dissemination subsystem (involving universities and research centers).
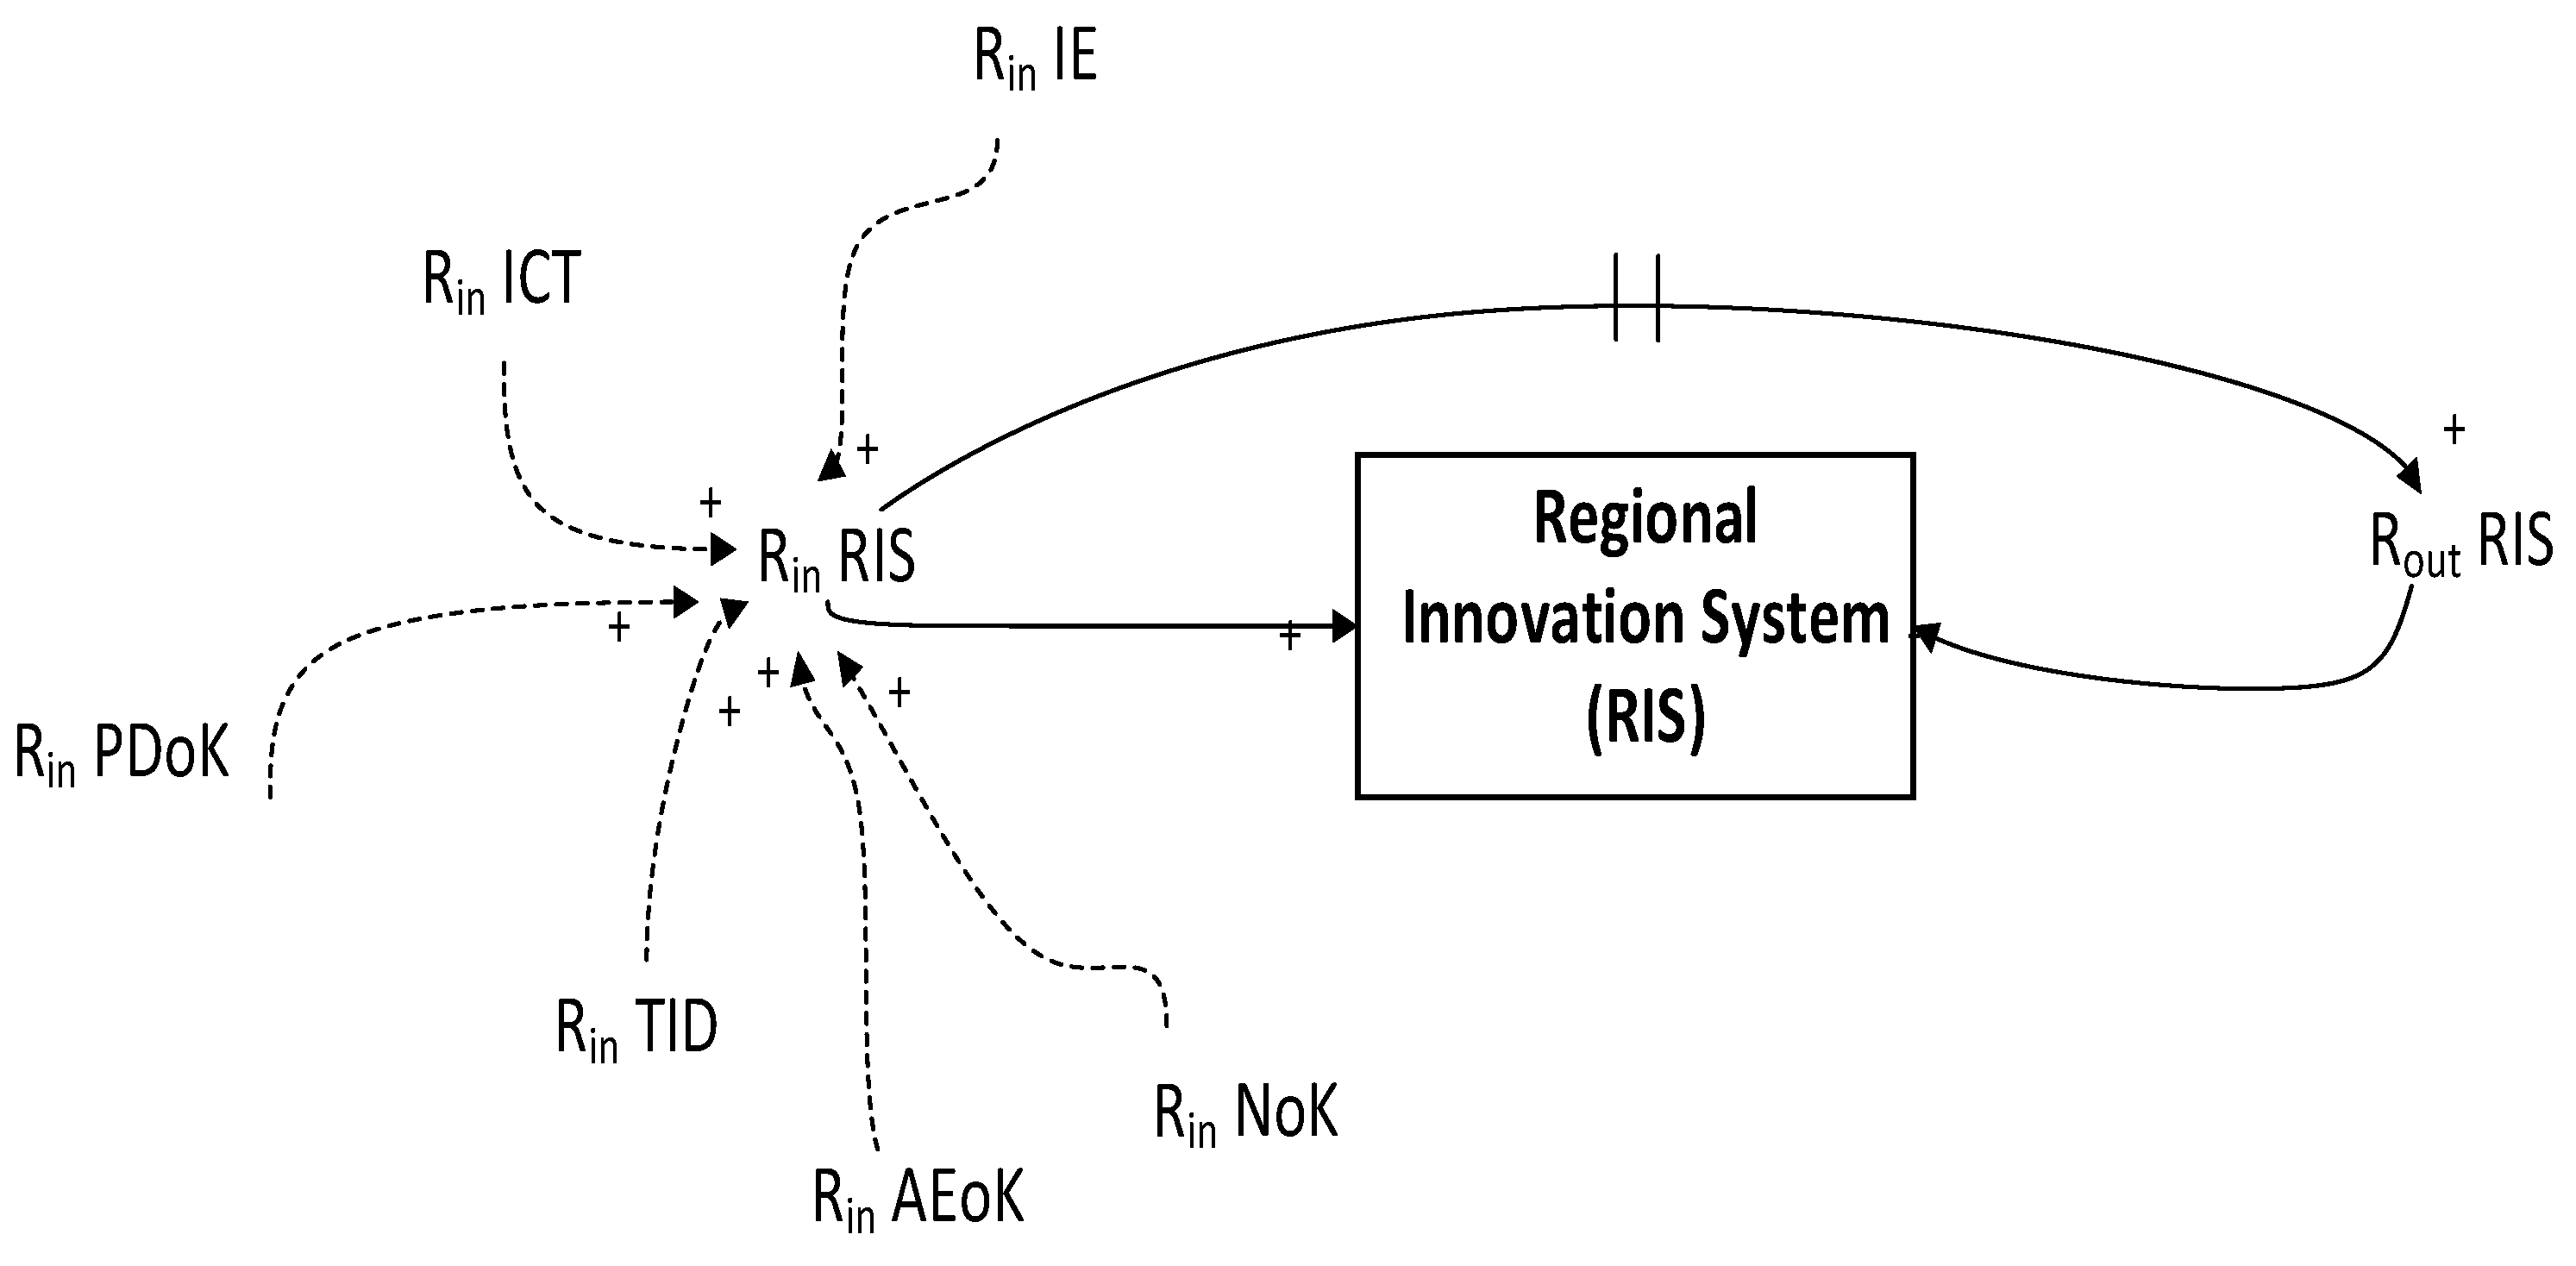
Figure 1. The RIS structure.
Systems 12 00200 g001
As illustrated in Figure 1, the value of the constitutive variable RIS, which represents the RIS, is influenced by the RIS growth rate (Rin RIS) and the temporal depreciation of the RIS (Rout RIS). The Rin RIS rate is derived as the average of the change rates of the subsystems composing the RIS. Specifically, it is affected by the following variables:
  • Rin ICT: Growth rate of the ICT capacity subsystem;
  • Rin TID: Growth rate of the innovation and regional development subsystem;
  • Rin IE: Growth rate of the institutional framework subsystem;
  • Rin AEoK: Growth rate of the knowledge capitalization and application subsystem;
  • Rin NoK: Growth rate of the knowledge network subsystem;
  • Rin PDoK: Growth rate of the knowledge production and dissemination subsystem.
Conversely, the decrease rate Rout RIS refers to the depreciation affecting the entirety of the content of the subsystems that constitute the RIS over the years.
The analysis of the individual subsystems with the help of influence diagrams has been published by Samara et al. [41]. In this paper, we present the mathematical formulation of the model and consider alternative scenarios in terms of the % of home Internet connections, the existence of ICT specialists in the study area, the use of PCs, and the level of existence of ICT programs in the study area. The values of the remaining independent variables are indirectly varied through the model.

2.2. Problem Description

The mathematical model presented allows for the empirical evaluation of the performance of a regional innovation system. The developed model is applied to the RIS of two Greek regions, Western and Central Macedonia, and various scenarios involving changes in the indicators of smart technologies are developed to observe their impact on the regional development of the two regions under examination.

3. The SD Model

Stocks and flows, together with feedback loops, constitute the foundational elements of System Dynamics (SD) theory. In this framework, stocks represent accumulations captured as the net result of inflows and outflows within a system. SD employs a specific diagrammatic notation for representing these elements, where stocks are depicted as rectangles, inflows are denoted by arrows entering stocks, and outflows by arrows exiting stocks [42]. Stocks are quantified through stock equations, which are essentially the time integrals of net flows.
Flows, on the other hand, are characterized by rate equations, which describe them as time-dependent functions of stocks and other system parameters. Within SD models, the portrayal of stocks and flows allows for the representation of time as a continuous variable, facilitating the occurrence of events and changes at any continuous point in time. These stock-flow dynamics are typically converted into a system of differential equations for computational analysis, with simulations generally conducted using sophisticated graphical simulation software such as PowerSim 10®, Vensim®, i-think®, and Stella® [43,44].
The comprehensive stock-flow diagram of the SD model presented here includes 20 stock variables, 39 rate variables, and 131 auxiliary variables. This section aims to elucidate the mathematical modeling involved in such analyses, striving to maintain a level of generality in the description.

3.1. Generic Stock and Flow Structure

The generic stock and flow diagram for the two subsystems—Innovation and Regional Development and ICT Capacity—are displayed in Figure 2a–c, due to the size of the model; the remaining stock and flow diagrams are provided in Appendix A.
The scoring scale for the Innovation and Regional Development subsystem is as follows:
  • 1 → subsystem level incomplete;
  • 7 → excellent.
The performance level of the subsystem is determined by the constitutive variable named Territorial Innovation and Development (TID), which is increased by the Rin TID growth rate and decreased by the Rout TID decay rate, the latter being due to the depreciation of subsystem achievements over time.
The Rin TID rate is increased by the TID inflow variable, divided by the time T TID, which describes the interval required for all factors to alter the subsystem’s profile. The TID inflow variable is calculated as the minimum value between the difference between the actual state of the innovation and regional development subsystem and its desired value (with 7 being the maximum) and the average rating of the factors influencing it, including:
  • Product Innovation (PI), which increases according to the number of researchers, the percentage of those contributing to R&D, and the proportion involved in PI (see Figure 2b).
  • Process Innovation (PI), which changes according to the PI growth rate, influenced by a delay function and the number of researchers engaged in PI (similar to Product Innovation). Both PI and Process Innovation decrease according to a depreciation rate (Depreciation of PI and Process Innovation, respectively), attributed to the knowledge degradation over time (see Figure 2b).
  • Public sector R&D expenditures at the NUTS 2 regional level (GOV) (GERD).
  • The employment rate of the age group 20–64 by NUTS 2 regions (TID1) describes the regional employment rate of the age group 20–64 as a percentage of the population in the same age group.
  • The NUTS 2 unemployment rate representing the unemployed as a percentage of the economically active population (i.e., the labor force or the sum of the employed and unemployed).
The average value of the factors affecting this subsystem (TID average) is obtained by assigning the value of each of them on a scale of 1 to 7. This process is carried out by means of variables called “Grade <variable name>”.
In a manner analogous to the Innovation and Regional Development subsystem scale, the subsystem’s capacity in ICT is graded on a scale from 1 to 7, where 1 indicates an inadequate level and 7 represents an optimal level. The performance of the subsystem is determined by the constitutional variable ICT, which increases due to the Rin ICT rate and decreases due to the Rout ICT rate, the latter being attributed to the depreciation over time.
The Rin ICT rate is augmented by the ICT inflow variable, which is divided by the time T TID. This period describes the interval required for all influencing factors to modify the subsystem’s profile. The ICT inflow variable is calculated as the minimum value between the difference between the actual state of the subsystem and its desired state (7 being the maximum) and the average rating of the factors affecting the subsystem under analysis. These influencing factors include:
  • Businesses employing ICT specialists (National A1I), a factor directly dependent on the GERD index.
  • Individuals with more than basic general digital skills (National C2), where the number decreases with an increase in centrally dictated processes and increases when these are reduced.
  • Digitization—Longitudinal Evolution (National A1W), a factor affected by the per capita value of the GERD index.
  • Percentage of businesses with e-commerce sales (National A1A), which correlates with the population aged 25–34 who have completed tertiary education.
  • Cloud computing services (National A1F) related to the number of researchers engaged in R&D activities.
The average value of the factors influencing this subsystem (ICT average) is derived by mapping each factor’s value to the 1–7 scale through variables named ‘Grade <variable name>’.

3.2. Equations

Innovation and Regional Development subsystem
(a) Stock equations:
process   innovation t = process   innovation t = 0 + 0 t R i n   P R O C I N t D e p r e c i a t i o n   o f   P R O C I N t   dt   [ % ]
product   innovation t = product   innovation t = 0 + 0 t R i n   P I t D e p r e c i a t i o n   o f   P I t   dt   [ % ]
Total   Innovation   and   Development-TID t = Total   Innovation   and   Development-TID t = 0 + 0 t R i n   T I D t R o u t   T I D t   dt   [ undisturbed ]
(b) Flow equations:
D e p r e c i a t i o n   o f   P I ( t ) = D E L A Y M T R ( R i n P I ; 2 ; 3 ; 0 )         % y e a r
D e p r e c i a t i o n   o f   P R O C I N ( t ) = D E L A Y M T R ( R i n P R O C I N ; 2 ; 3 ; 0 )           % y e a r
R i n P I t = M I N ( D i s c r e p a n c y   o f   P I ( t ) / T p i ; P r o d u c t   i n n o v a t i o n   p e r   r e s e a r c h e r R D   c a p a c i t y ( t ) p e r c e n t a g e   o f   r e s e a r c h e r s   f o r   P I %   I C T ( t ) )           % y e a r
R i n P R O C I N t = M I N ( D i s c r e p a n c y   o f   P R O C I N ( t ) / T p r i ; M I N ( P I   t o   P R O C I N t ; 1 p e r c e n t a g e   o f   r e s e a r c h e r s   f o r   P I P r o c e s s   i n n o v a t i o n   p e r   r e s e a r c h e r R D   c a p a c i t y t % I C T )       % y e a r
R i n T I D t = D E L A Y P P L ( T I D   i n f l o w ; T   T I D ; 0 )
R o u t T I D t = D E L A Y M T R ( R i n T I D ; 2 ; 3 ; 0 )         1 y e a r
(c) Auxiliary equations:
D i s c r e p a n c y   o f   P I t = M A X ( 0 ; m a x   P I p r o d u c t   i n n o v a t i o n ( t ) )   [ % ]
D i s c r e p a n c y   o f   P R O C I N t = M A X ( 0 ; M A X ( 0 ; M A X   P R O C I N p r o c e s s   i n n o v a t i o n ( t ) ) )   [ % ]
D i s c r e p a n c y   o f   T I D t = O p t i m a l   T I D T o t a l   I n n o v a t i o n   a n d   D e v e l o p m e n t   ( T I D ) t   [ undisturbed ]
G r a d e   o f   G E R D t C e n t r a l   M a c e d o n i a = G R A P H ( G E R D ( t ) ; 7 ; 5 ; { 1 ; 2 ; 3 ; 4 ; 5 ; 6 ; 7 } ) undisturbed
G r a d e   o f   G E R D t ( W e s t e r n   M a c e d o n i a ) = G R A P H ( G E R D ( t ) ; 5,02 ; 1,5 ; { 1 ; 2 ; 3 ; 4 ; 5 ; 6 ; 7 } )   undisturbed
G r a d e   o f   N U T S   2   u n e m p l o y m e n t   r a t e t = G R A P H N U T S   2   u n e m p l o y m e n t   r a t e t ; 16 ; 2,5 ; 7 ; 6 ; 5 ; 4 ; 3 ; 2 ; 1 undisturbed
ICT subsystem
(a) Stock equations:
ICT ( t ) = ICT ( t = 0 ) + 0 t R i n I C T ( t ) R o u t I C T ( t )   dt   [ undisturbed ]
(b) Flow equations:
R i n I C T t = D E L A Y P P L I C T i n f l o w ; T i c t ; 0
R o u t I C T t = D E L A Y M T R ( R i n I C T ; 2 ; 3 ; 0 )         1 y e a r
(c) Auxiliary equations:
%   o f   g r a d u a t e d   u n i v e r s i t y   s t u d e n t s t = ( g r a d u a t e d   u n i   s t u d e n t s     %   o f   p o p u l a t i o n   25 34 _ n o n   r e t i r e m e n t ) / ( p o p u l a t i o n   %   o f   p o p u l a t i o n   25 34 ) %
B u s i n e s s e s   e m p l o y i n g   I C T   s p e c i a l i s t s N a t i o n a l   A 1 I t = G E R D ( t ) K A 1 I 2 K A 1 I 1 %
D i g i t i z a t i o n N a t i o n a l   A 1 W t = K A 1 W 1 G E R D   p e r   h a b i t a t ( t ) 1000 K A 1 W 2 %
D i s c r e p a n c y   o f   I C T t = M A X ( 0 ; o p t i m a l   I C T I C T ( t ) undisturbed
I C T 1   a v e r a g e t = A V E R A G E G r a d e   N a t i o n a l   A 1 A t ; G r a d e   N a t i o n a l   A 1 F t ; G r a d e   N a t i o n a l   A 1 I t ; G r a d e   N a t i o n a l   A 1 W t ; G r a d e   N a t i o n a l   A 1 W t ; G r a d e   o f   C 2 t   [ u n d i s t u r b e d ]
I C T 2   a v e r a g e t = A V E R A G E I C T   s p e c i a l i s t s ; P C u s a g e ; i n t e r n e t   u s a g e ( t ) ; I C T   p r o j e c t s undisturbed
I C T   i n f l o w t = M I N ( A V E R A G E I C T 1   a v e r a g e   t ; I C T 2   a v e r a g e   t T i c t ; d i s c r e p a n c y   o f   I C T t T i c t + t a r g e t   a d a p t a t i o n   I C T ( t ) undisturbed
G r a d e   N a t i o n a l   A 1 A t = I F ( N a t i o n a l   A 1 A ( t ) < 0,08 ; 1 ; I F ( N a t i o n a l   A 1 A ( t ) < 0,14 ; 2 ; I F ( N a t i o n a l   A 1 A ( t ) < 0,16 ; 3 ; I F ( N a t i o n a l   A 1 A ( t ) < 0,18 ; 4 ; I F ( N a t i o n a l   A 1 A ( t ) < 0,20 ; 5 ; I F ( N a t i o n a l   A 1 A ( t ) < 0,22 ; 6 ; 7 ) ) ) ) ) ) undisturbed
G r a d e   N a t i o n a l   A 1 F ( t ) = I F ( N a t i o n a l   A 1 F ( t ) < 0,10 ; 1 ; I F ( N a t i o n a l   A 1 F ( t ) < 0,12 ; 2 ; I F ( N a t i o n a l   A 1 F ( t ) < 0,14 ; 3 ; I F ( N a t i o n a l   A 1 F ( t ) < 0,16 ; 4 ; I F ( N a t i o n a l   A 1 F ( t ) < 0,18 ; 5 ; I F ( N a t i o n a l   A 1 F ( t ) < 0,22 ; 6 ; 7 ) ) ) ) ) )   undisturbed
G r a d e   N a t i o n a l   A 1 I ( t ) = I F ( B u s i n e s s e s   e m p l o y i n g   I C T   s p e c i a l i s t s N a t i o n a l   A 1 I ( t ) < 1,79 ; 1 ; I F ( B u s i n e s s e s   e m p l o y i n g   I C T   s p e c i a l i s t s N a t i o n a l   A 1 I ( t ) < 1,87 ; 2 ; I F ( B u s i n e s s e s   e m p l o y i n g   I C T   s p e c i a l i s t s N a t i o n a l   A 1 I ( t ) < 1,96 ; 3 ; I F ( B u s i n e s s e s   e m p l o y i n g   I C T   s p e c i a l i s t s N a t i o n a l   A 1 I ( t ) < 2,04 ; 4 ; I F ( B u s i n e s s e s   e m p l o y i n g   I C T   s p e c i a l i s t s N a t i o n a l   A 1 I ( t ) < 2,13 ; 5 ; I F ( B u s i n e s s e s   e m p l o y i n g   I C T   s p e c i a l i s t s N a t i o n a l   A 1 I ( t ) < 2,30 ; 6 ; 7 ) ) ) ) ) )       undisturbed       ( Σ χ έ σ η )
G r a d e   N a t i o n a l   A 1 W   ( t ) = I F ( D i g i t i z a t i o n N a t i o n a l   A 1 W ( t ) < 48,09 ; 1 ; I F ( D i g i t i z a t i o n N a t i o n a l   A 1 W ( t ) < 54,1 ; 2 ; I F ( D i g i t i z a t i o n N a t i o n a l   A 1 W ( t ) < 60,11 ; 3 ; I F ( D i g i t i z a t i o n N a t i o n a l   A 1 W ( t ) < 66,13 ; 4 ; I F ( D i g i t i z a t i o n N a t i o n a l   A 1 W ( t ) < 72,14 ; 5 ; I F ( D i g i t i z a t i o n N a t i o n a l   A 1 W ( t ) < 84,16 ; 6 ; 7 ) ) ) ) ) )       undisturbed
G r a d e   o f   C 2   ( t ) = I F ( P e o p l e   w i t h   a b o v e   b a s i c   g e n e r a l   d i g i t a l   s k i l l s C 2 ( t ) < 15,5 ; I F ( P e o p l e   w i t h   a b o v e   b a s i c   g e n e r a l   d i g i t a l   s k i l l s C 2 ( t ) < 16,8 ; 2 ; I F ( P e o p l e   w i t h   a b o v e   b a s i c   g e n e r a l   d i g i t a l   s k i l l s ( t ) C 2 < 18 ; 3 ; I F ( P e o p l e   w i t h   a b o v e   b a s i c   g e n e r a l   d i g i t a l   s k i l l s   ( t ) C 2 < 19,3 ; 4 ; I F ( P e o p l e   w i t h   a b o v e   b a s i c   g e n e r a l   d i g i t a l   s k i l l s   ( t ) C 2 < 20 ; 5 ; I F ( P e o p l e   w i t h   a b o v e   b a s i c   g e n e r a l   d i g i t a l   s k i l l s   t C 2 < 23 ; 6 ; 7 ) ) ) ) ) )     undisturbed
i n t e r n e t   u s a g e   ( t ) = I F ( % h o m e   i n t e r n e t   c o n n e c t i o n < 0,14 ; 1 ; I F ( % h o m e   i n t e r n e t   c o n n e c t i o n < 0,28 ; 2 ; I F ( % h o m e   i n t e r n e t   c o n n e c t i o n < 0,42 ; 3 ; I F ( % h o m e   i n t e r n e t   c o n n e c t i o n < 0,56 ; 4 ; I F ( % h o m e   i n t e r n e t   c o n n e c t i o n < 0,70 ; 5 ; I F ( % h o m e   i n t e r n e t   c o n n e c t i o n < 0,84 ; 6 ; 7 ) ) ) ) ) )
N a t i o n a l   A 1 A ( t ) = K A 1 A %   o f   g r a d u a t e d   u n i v e r s i t y   s t u d e n t s   ( t ) %
N a t i o n a l   A 1 F ( t ) = R D   c a p a c i t y ( t ) K A 1 F 1 + K A 1 F 2   %
x P e o p l e   w i t h   a b o v e   b a s i c   g e n e r a l   d i g i t a l   s k i l l s C 2 t = 4082 n u m b e r   o f   p r o c e d u r e s + 35,246   [ t h o u s a n d   p e o p l e ]  
t a r g e t   a d a p t a t i o n   I C T ( t ) = D E L A Y I N F ( R o u t   I C T ( t ) ; 2 ; 1 ; 0 )

4. Numerical Experimentation and Discussion

In order to study the impact of Smart Technologies on Regional Development, alternative price scenarios were examined in terms of the percentage of household Internet connections, the existence of ICT specialists in the area under study, the use of PCs, as well as the level of existence of ICT programs in the area under study. The values of the remaining independent variables are indirectly varied through the model. Table 1 shows the different values each of these variables takes, starting from the worst to the best case.
Therefore, the total number of simulations carried out is equal to 7 × 7 × 7 × 5 = 1715 simulations for each region, i.e., 3430 simulations for both regions. Each simulation had a period of 10 years (120 months) with a time step of 0.2 years. The simulation starts in 2024, and findings from the two simulation groups, one for each region under consideration, are presented upon completion of the simulation process.
The purpose of the specific simulations was to identify, for each region separately, the combinations under study of factors of smart technologies to achieve faster development of Regional Development. For this reason, those combinations were sought for which the value of calculating the level of the Regional Development subsystem (TID) balances at the highest values and in the shortest possible time.
Also, the combinations of the parameters under study for which the influence of the subsystem of smart technologies on the subsystem of Regional Development is stronger are sought. For this purpose, the TID_ICTimpact indicator was created, whose value is equal to:
T I D _ I C T i m p a c t = T I D I C T
The higher the value of the specific index, the smaller the impact of smart technologies on Regional Development, and the opposite if the value of the index takes smaller values. Also, when the said indicator receives values smaller than unity, then for each unit of development of the smart technologies’ subsystem (on a scale of 1–7), the development of the Regional Development subsystem receives values greater than unity, while the reverse occurs when the TID_ICTimpact index takes values greater than unity.
Listed below are the worst and best possible combinations of alternative values of the independent variables under investigation, as depicted in Table 1, for each control area separately. In this way, the parameters that should be given special attention are identified, as well as those that are of secondary importance.

4.1. Region of Central Macedonia

To identify the parameters that are critical for the highest possible Regional Development and the maximum possible impact of the smart technologies’ subsystem on it, 1715 simulations were performed with all possible combinations of their values. Table 1 shows the best-case and worst-case scenario combinations of the studied parameters of smart technologies in terms of Regional Development.
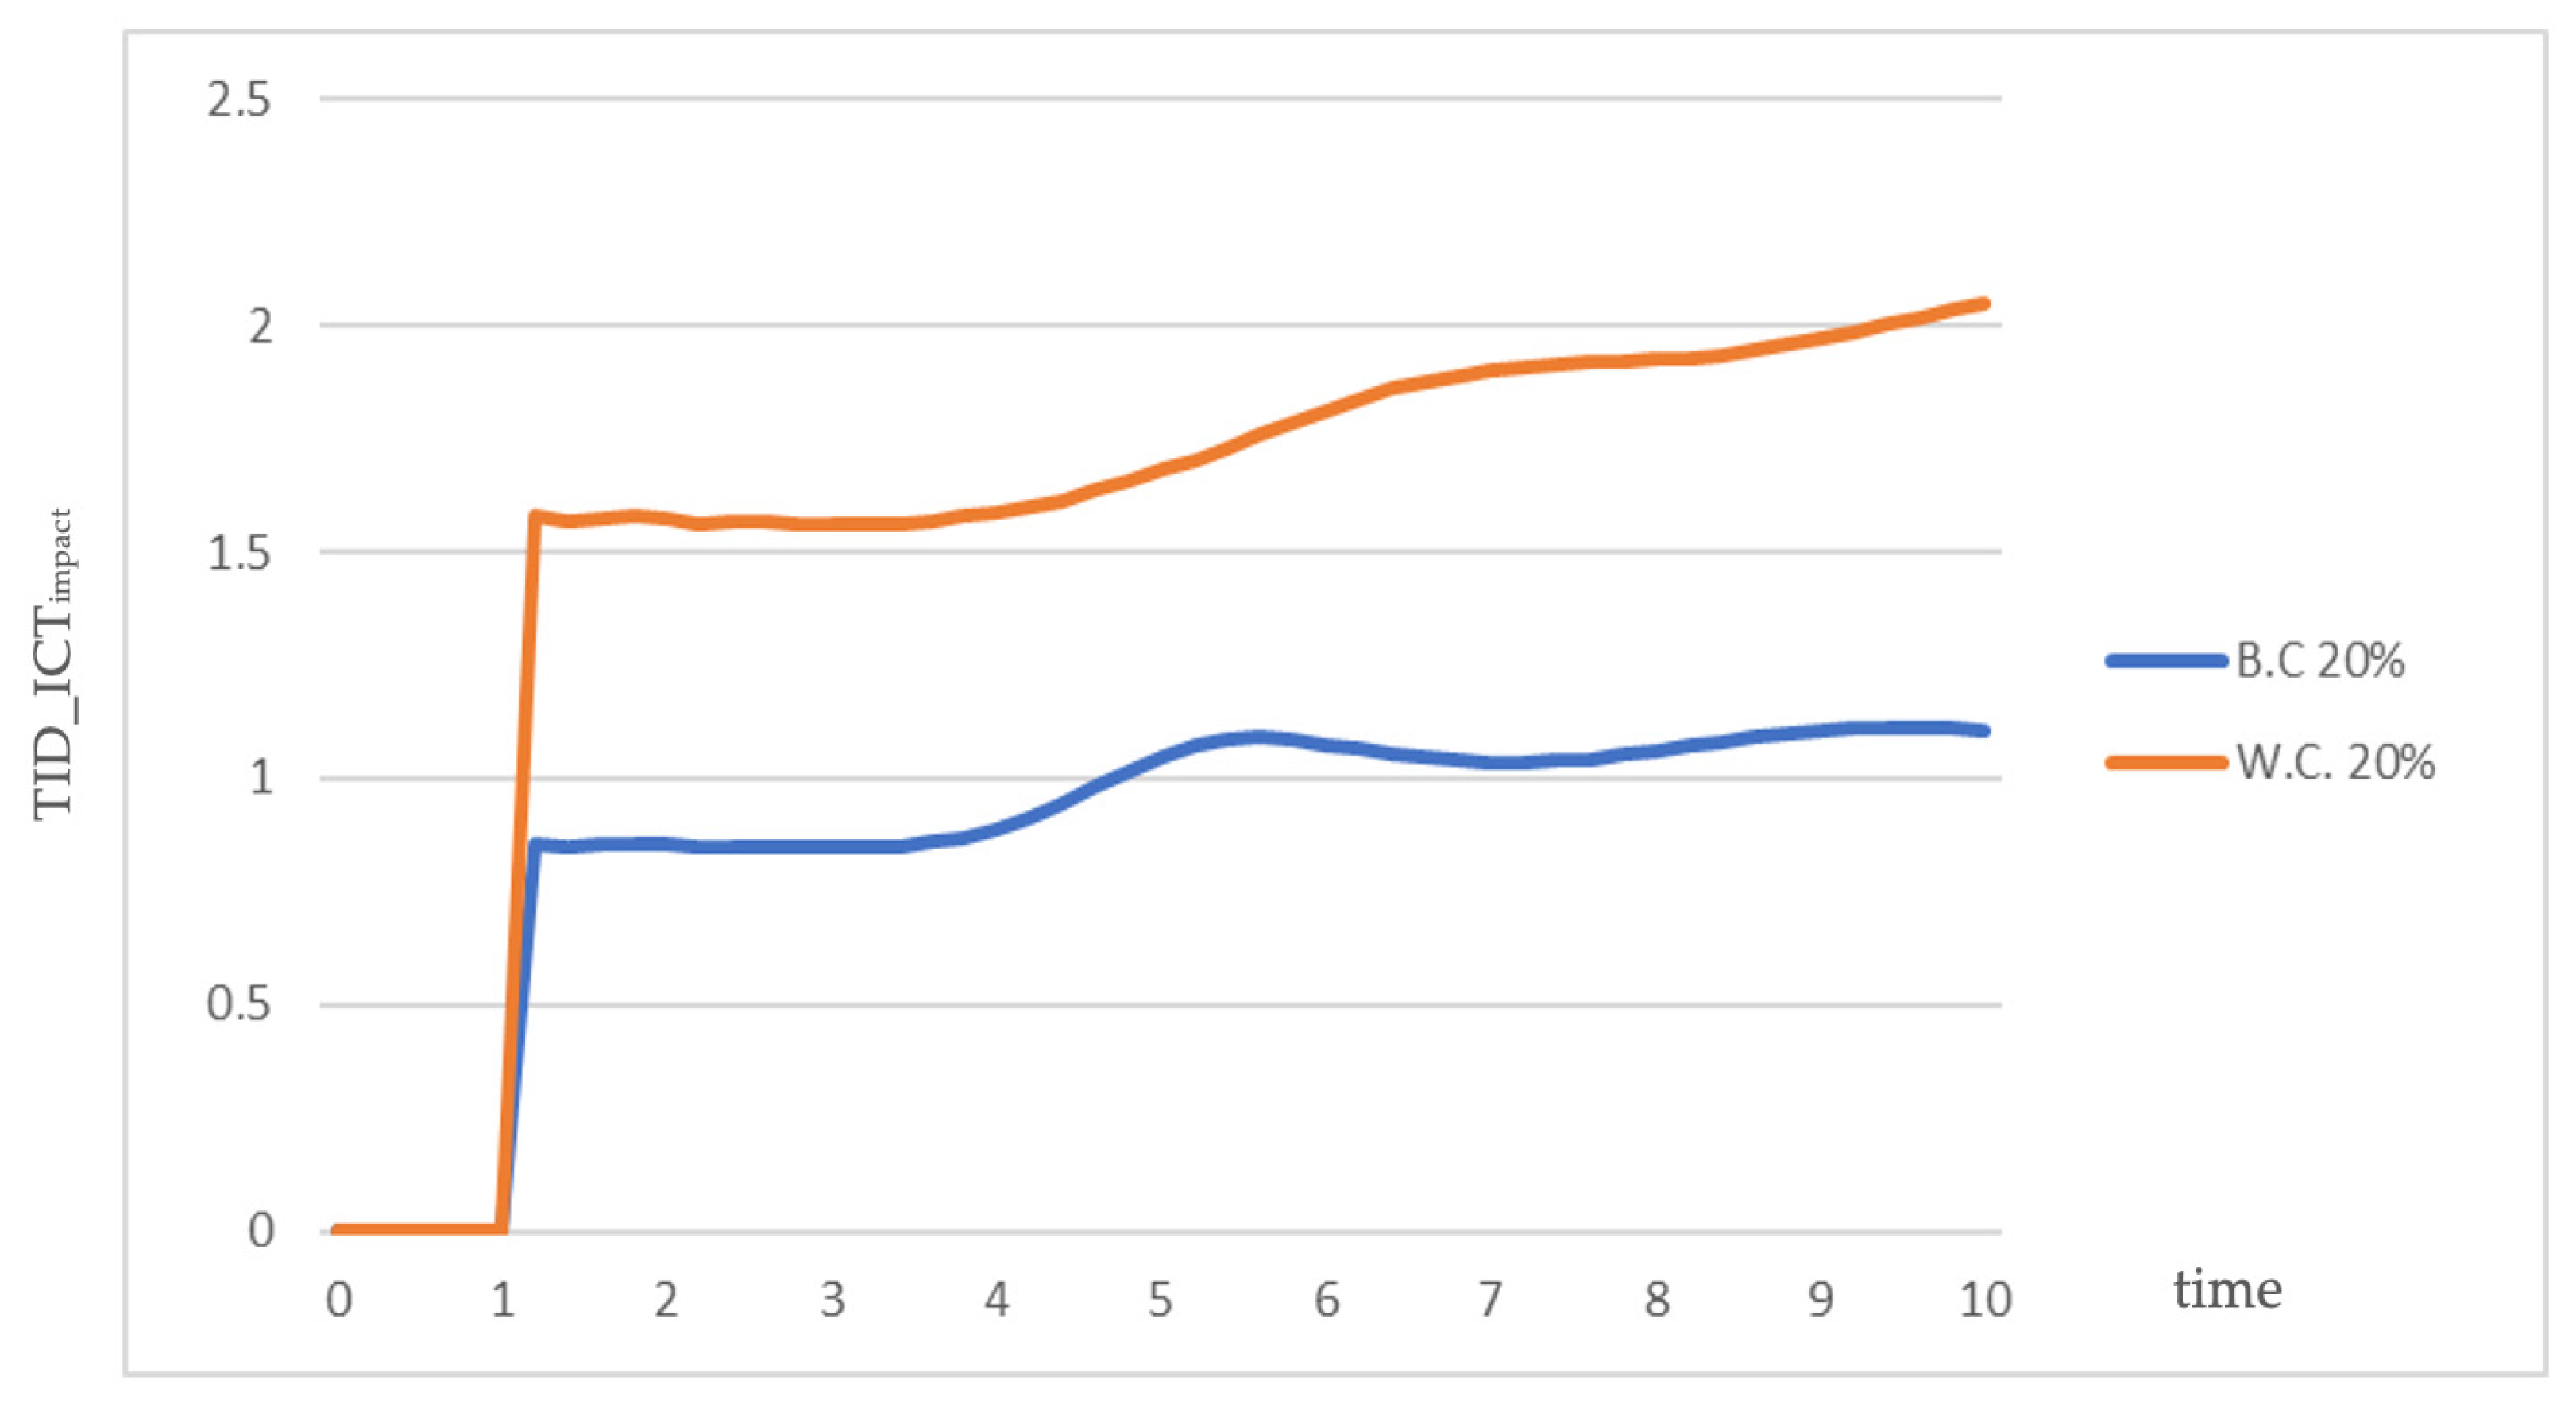
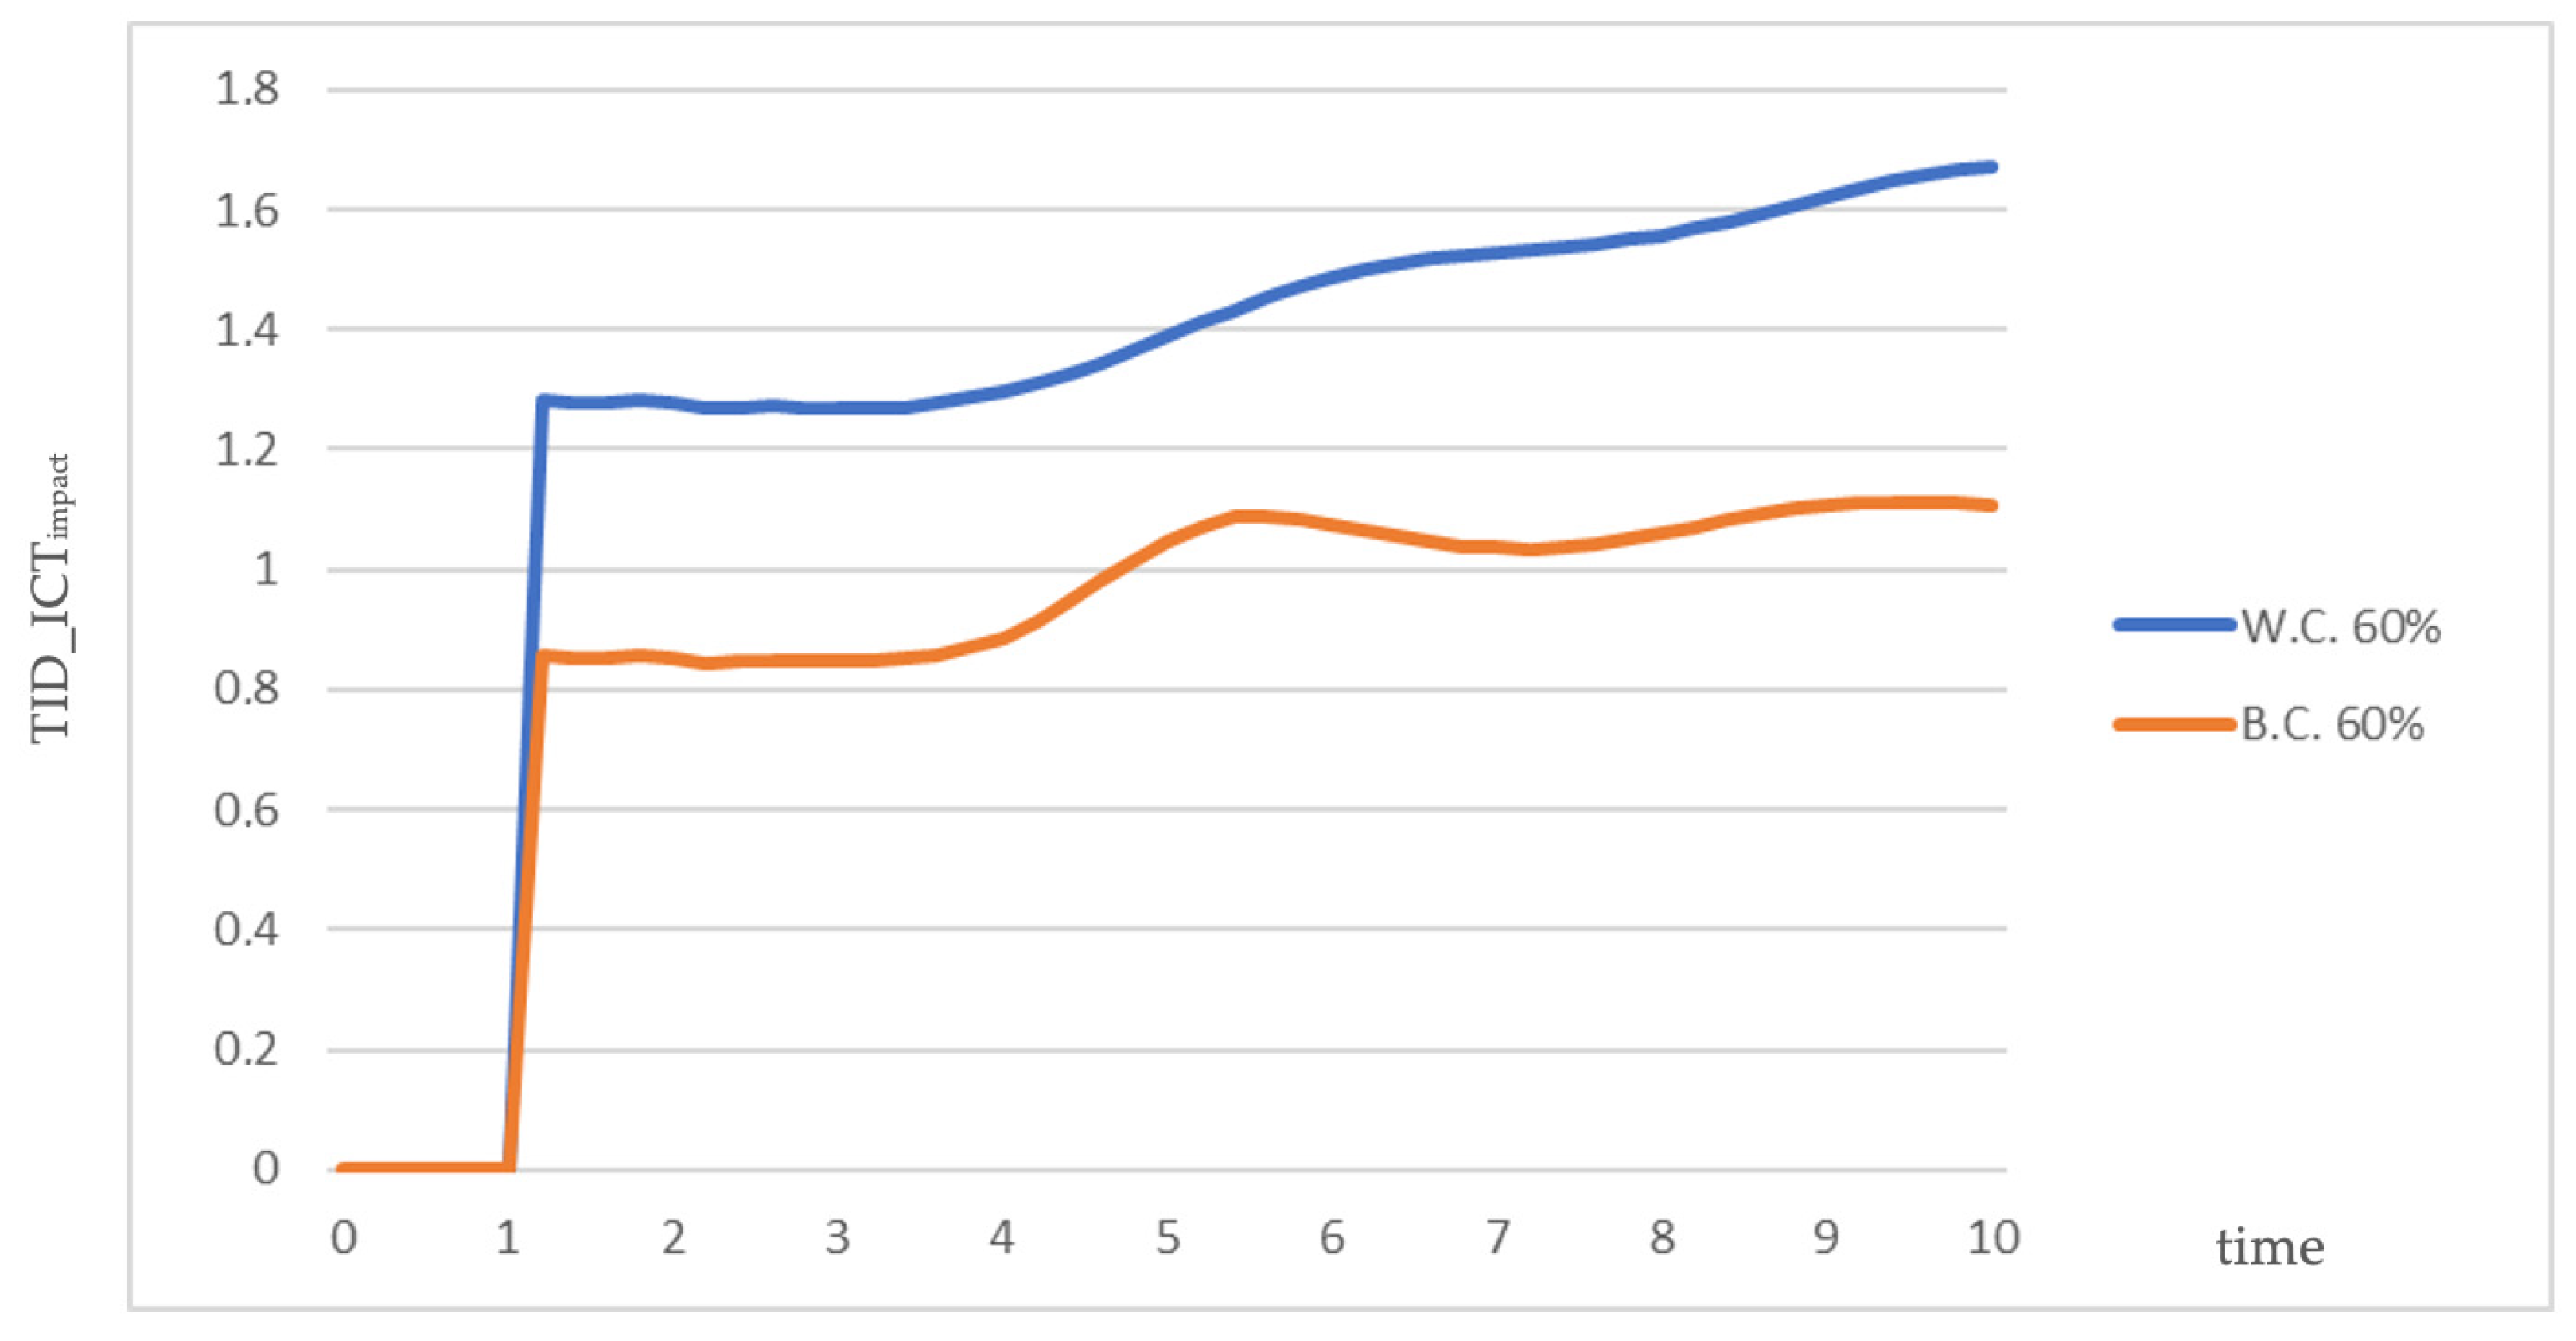
The TID_ICTimpact index is used to identify the best and worst combinations. In particular, the case for which its value is as small as possible and, if possible, less than unity, as well as the fluctuation of the index values, is considered optimal. On the other hand, the cases in which there is a large fluctuation in the index values, and its values are even higher than the unit, are considered the worst. For this reason, Table 2 and Table 3 show the best and worst combinations, respectively, for each possible value of the % of home internet connections, both the variation in the index values and the average value, as well as the maximum value. In addition, Figure 3 and Figure 4 show indicative values of the index for the best and worst combination in the case that the percentage of home internet connections equals 20% and 60%, respectively.
The results demonstrate that, as expected, the worst combinations that result refer to cases where all the factors are in zero growth, as they receive the worst possible value. What is worth noting is the large variation in the maximum value of the TID_ICTimpact index as the percentage of home internet connections decreases from 60% to 20%, compared to the case where there is a decrease from 100% to 60%. We also observe that even in the worst combinations, if the level of the percentage of home internet connections is high, then the average value of the impact index (TID_ICTimpact) of smart technologies in Regional Development is relatively satisfactory as it is close to unity and the variation in its values is satisfactory.
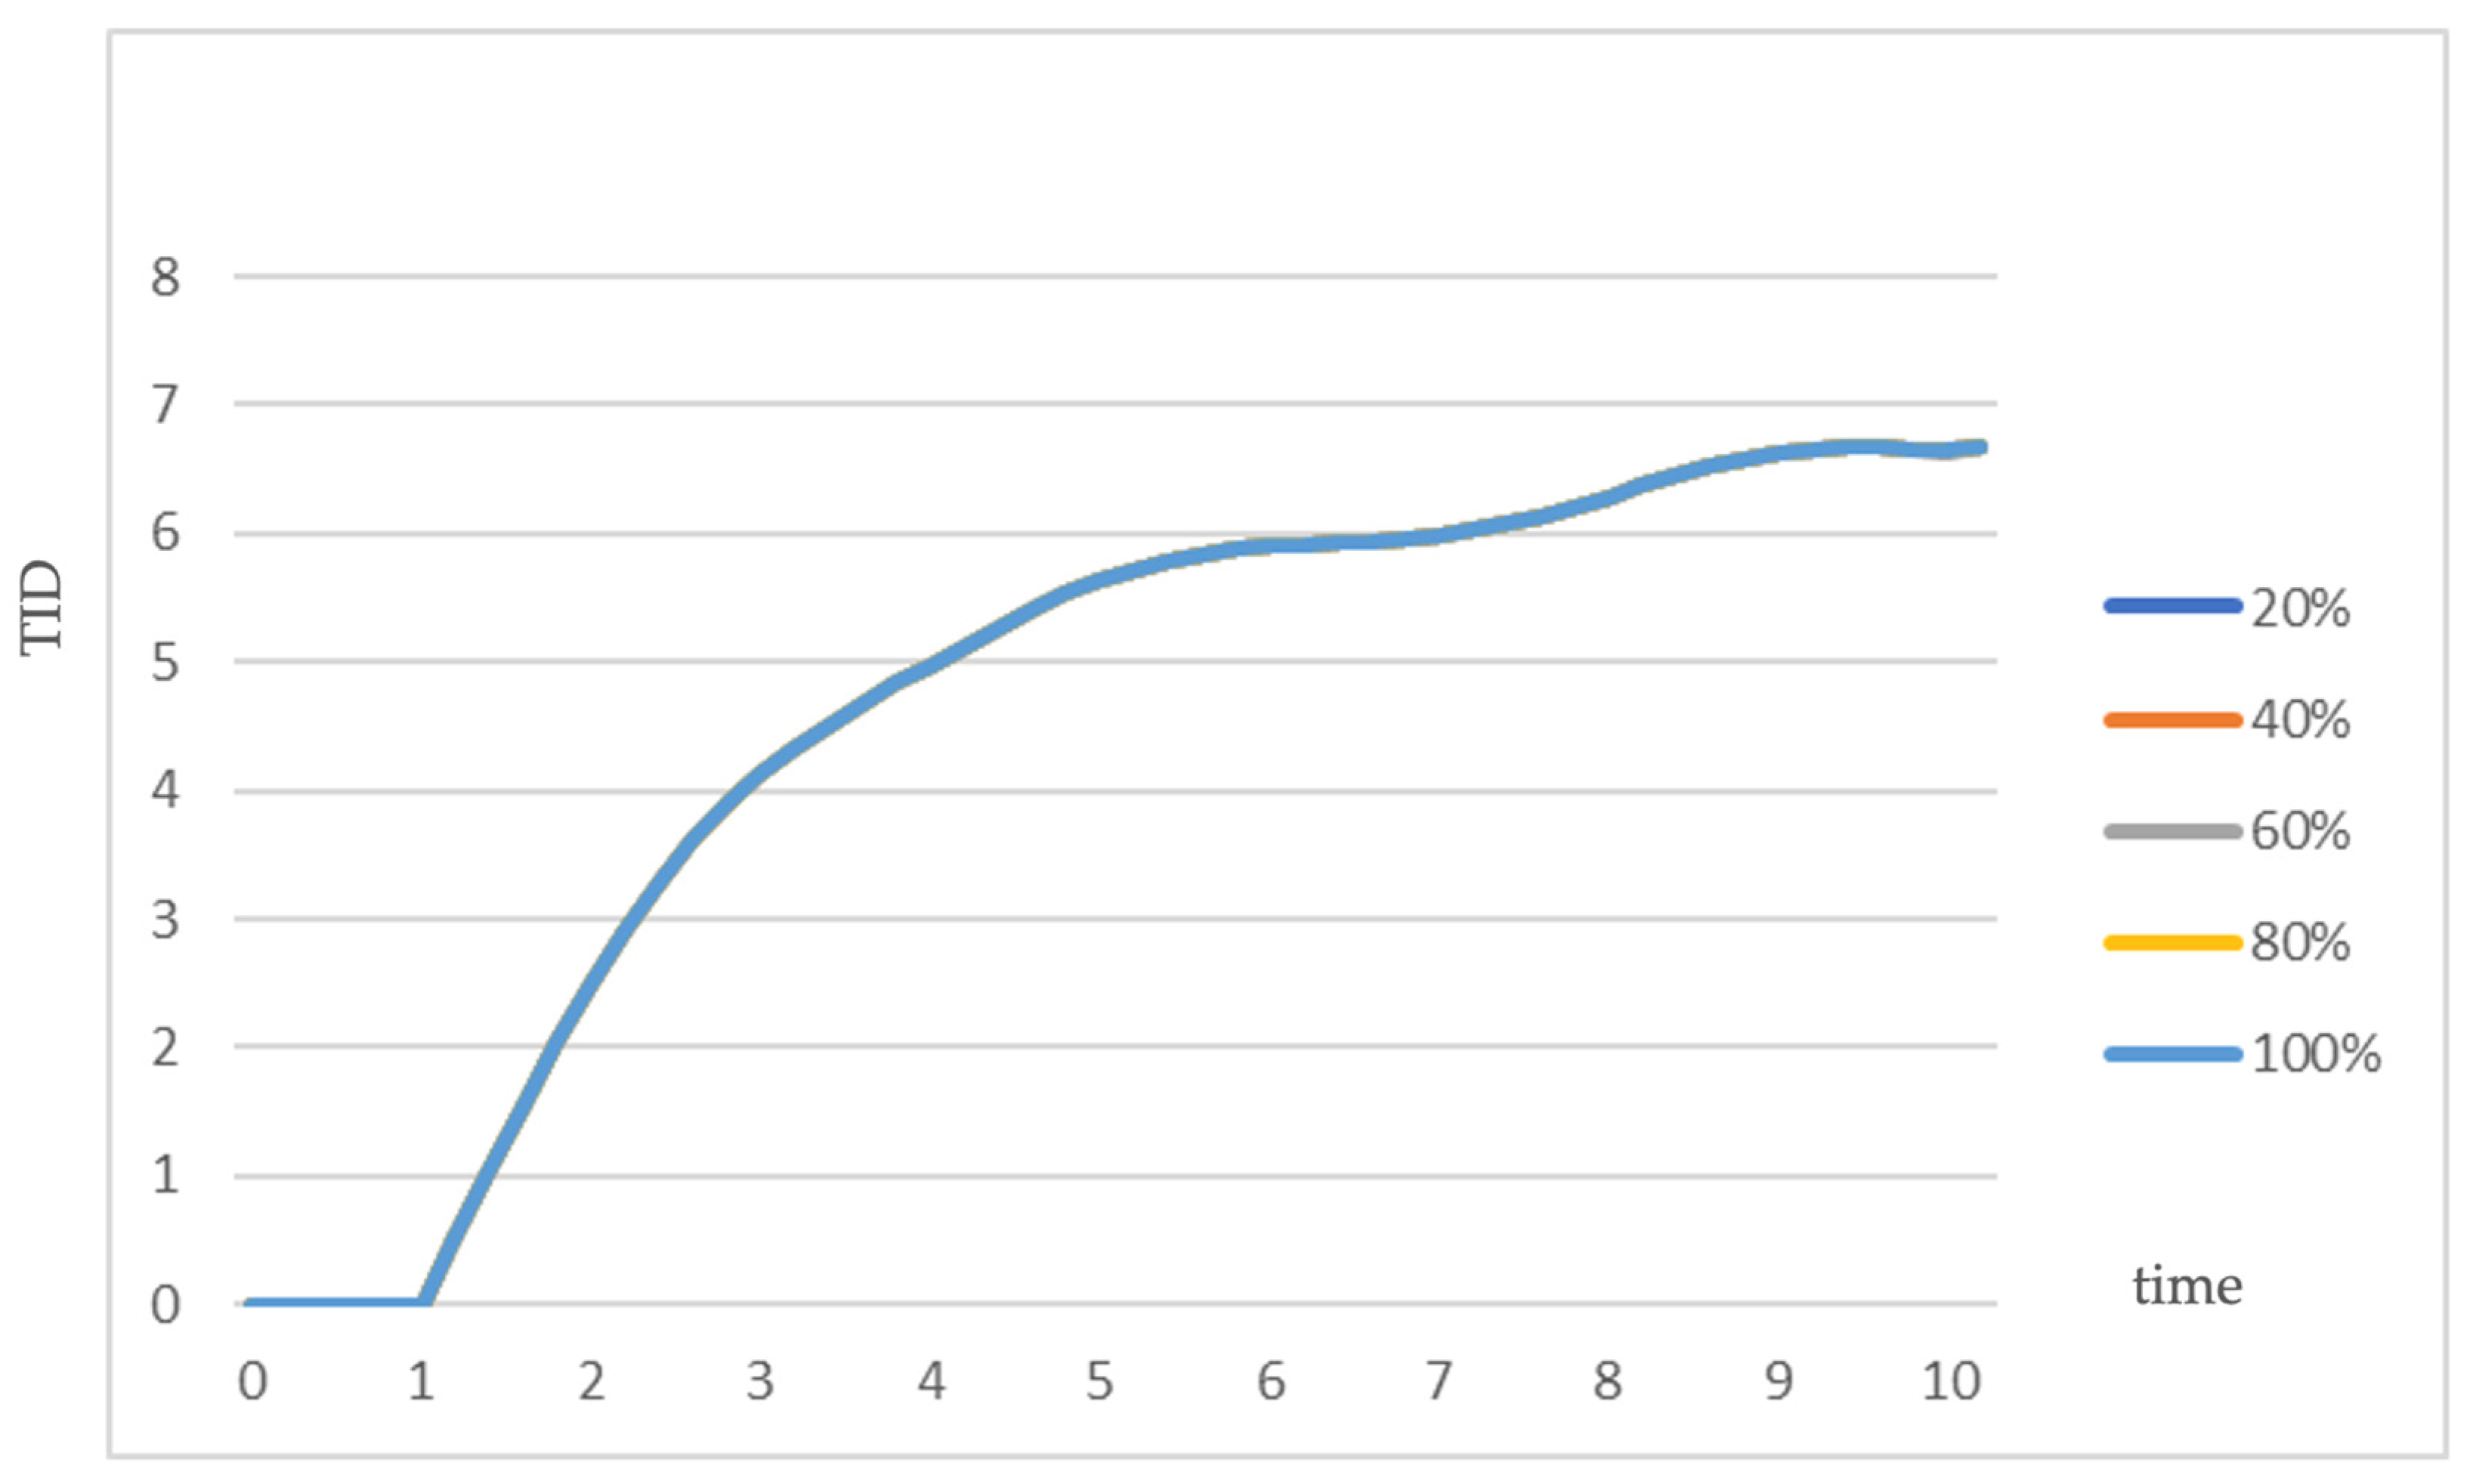
As far as the optimal combinations are concerned, we notice that in all cases, the mode of operation of the system is the same as both the value of the maximum value and the average value, as well as the variation in the values of the influence index, are the same. This fact is also reflected in Figure 5, where the values obtained by the Territorial Development (TID) calculation variable for the optimal combination for each of the possible values of the percentage of home internet connections are collectively noted. We observe that for all cases, the optimal combination has the same impact on the value of Regional Development.
Furthermore, from Table 2, it is observed that in order to be able to achieve the optimal combination if the percentage of home internet connections is low (20% or 40%), there should be the development of ICT programs to the maximum extent possible (7), while the existence of ICT specialists in the area and the use of PCs can vary at medium levels. On the other hand, when the percentage of connections increases, then the existence of ICT programs becomes a factor of secondary importance, and the use of PCs and the existence of ICT specialists in the area now play a primary role. In particular, the use of a PC is considered more important in cases where the percentage of home connections ranges between 40%, 60%, and 80%, while the existence of ICT specialists in the area is more critical in cases where the % of home internet connections reach 100%. It is worth noting that the effect of smart technologies on Regional Development is quite high, and in cases where all factors receive the maximum values. However, the best maximum value of the index is not achieved during the simulation horizon, i.e., the case in which it receives the smallest possible value but also the lowest variation.

4.2. Region of Western Macedonia

Following a similar methodology as in the case of the Region of Central Macedonia, an attempt is also made for the Region of Western Macedonia to identify the parameters that are critical in order to achieve the best possible Regional Development, with the maximum possible impact of the smart technologies’ subsystem on it. For this purpose, 1715 simulations were carried out for all possible combinations of the values of the smart technologies’ parameters under consideration, as shown in Table 1.
After the completion of all the simulations, the results were examined in order to identify the best and worst possible combinations of the studied parameters of smart technologies in terms of Regional Development.
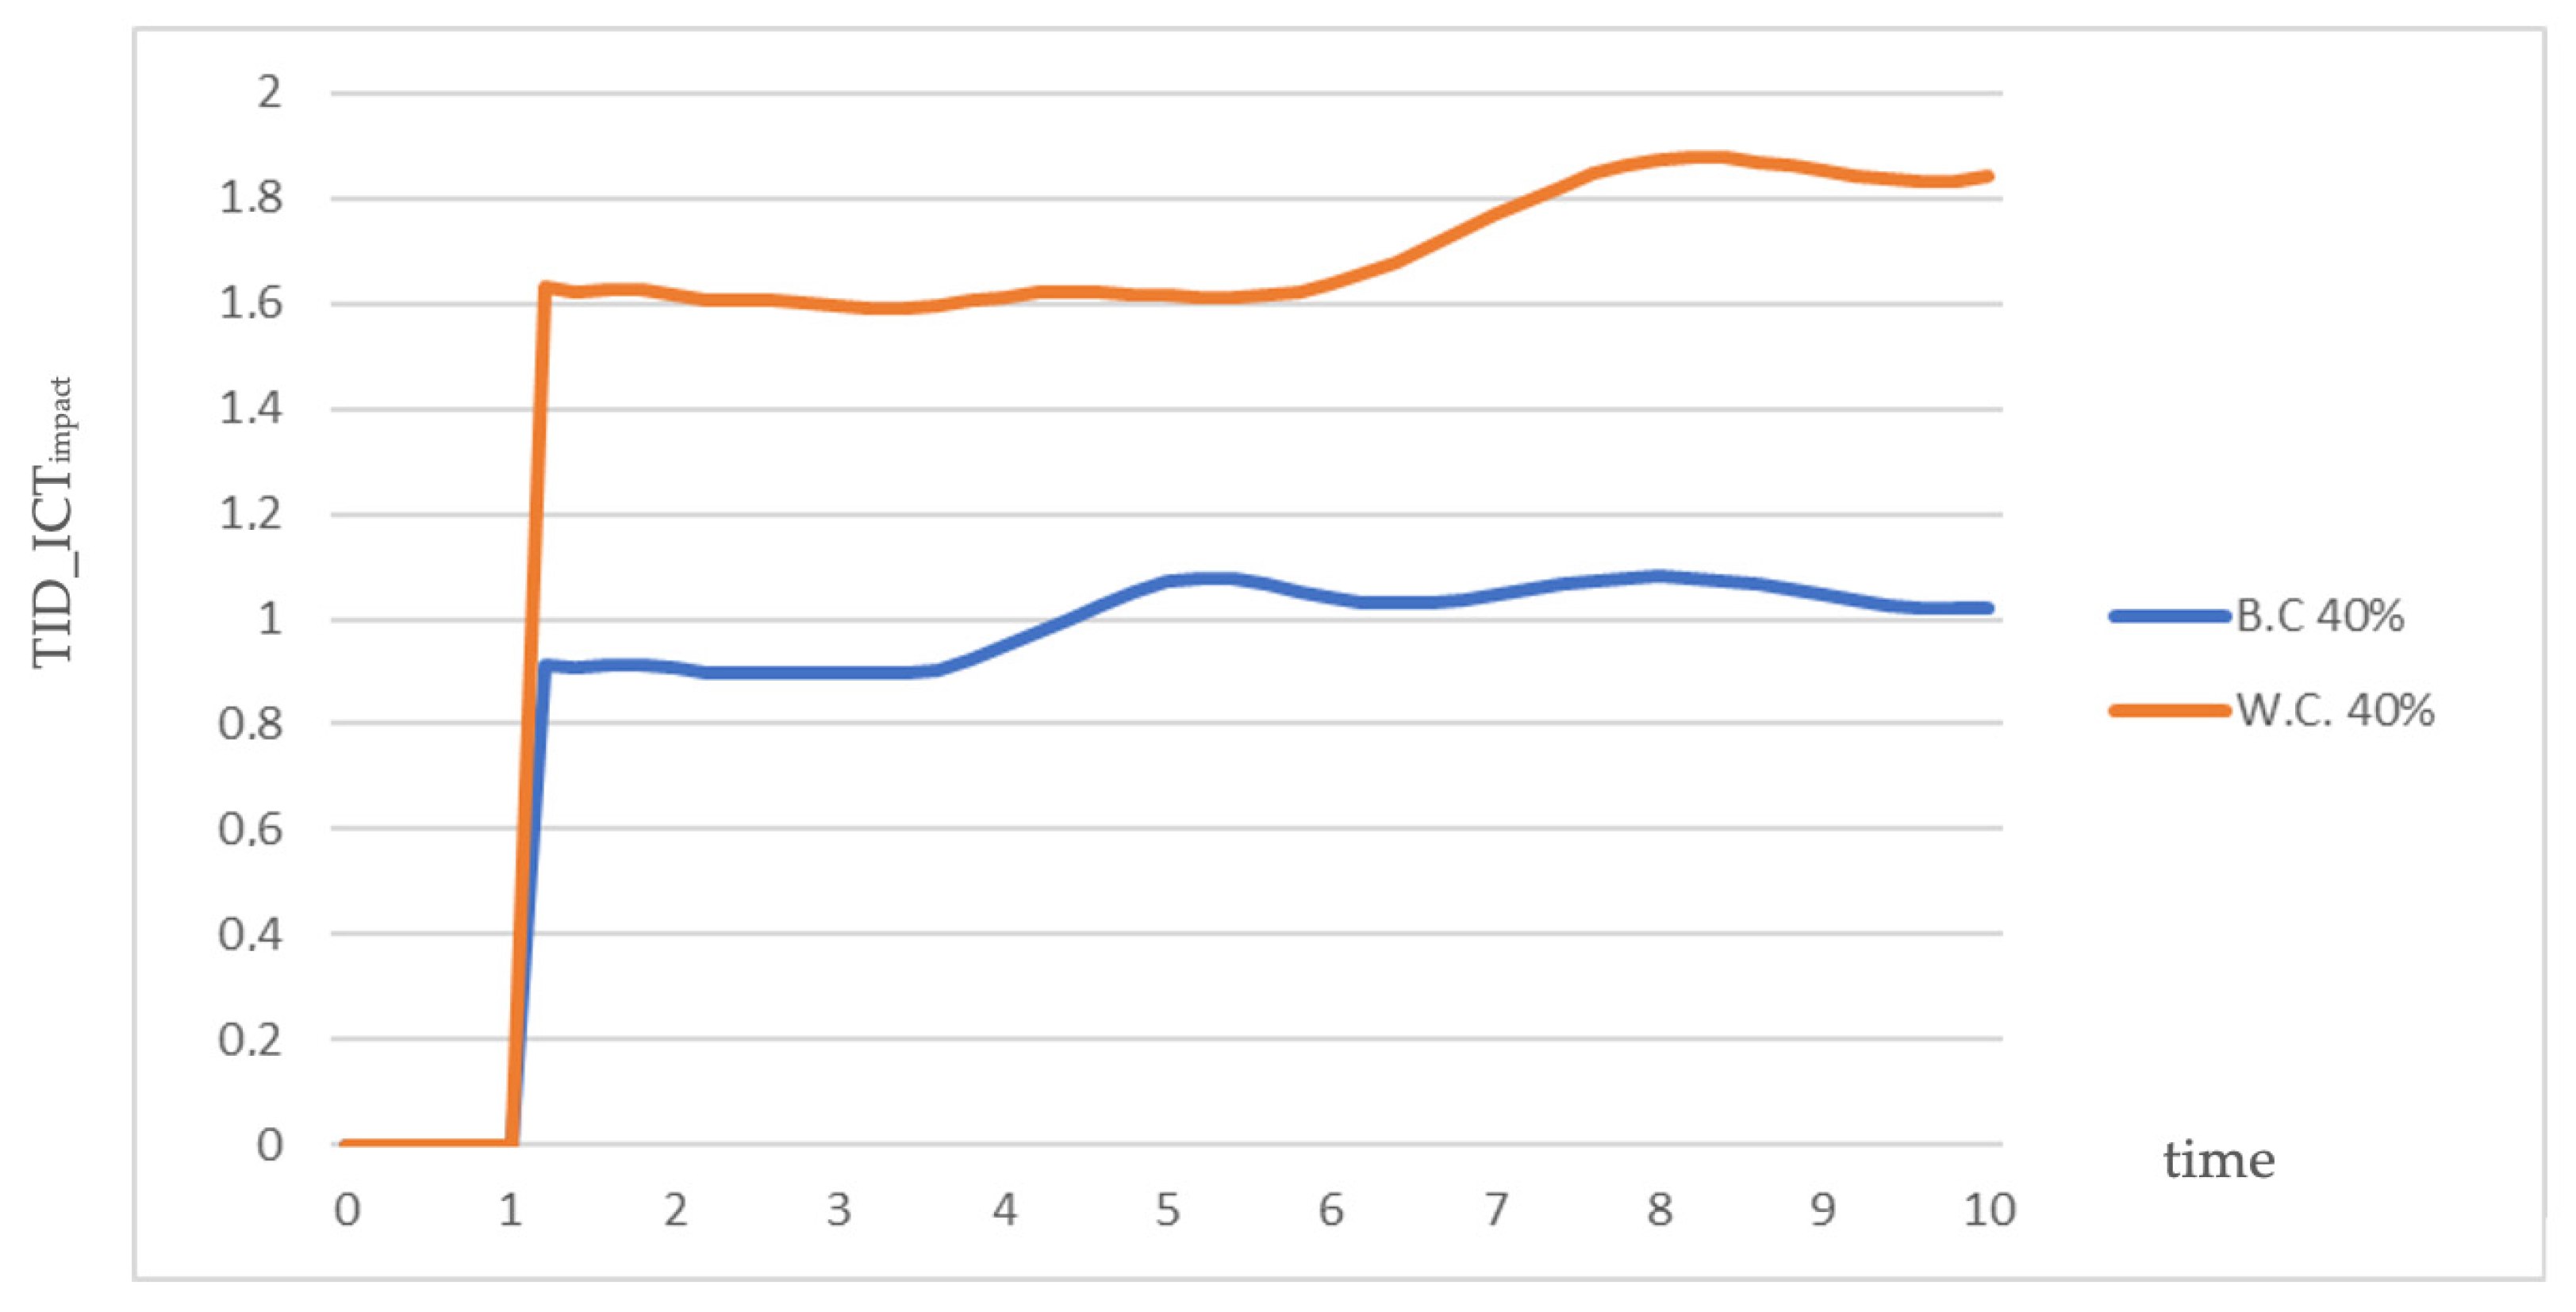
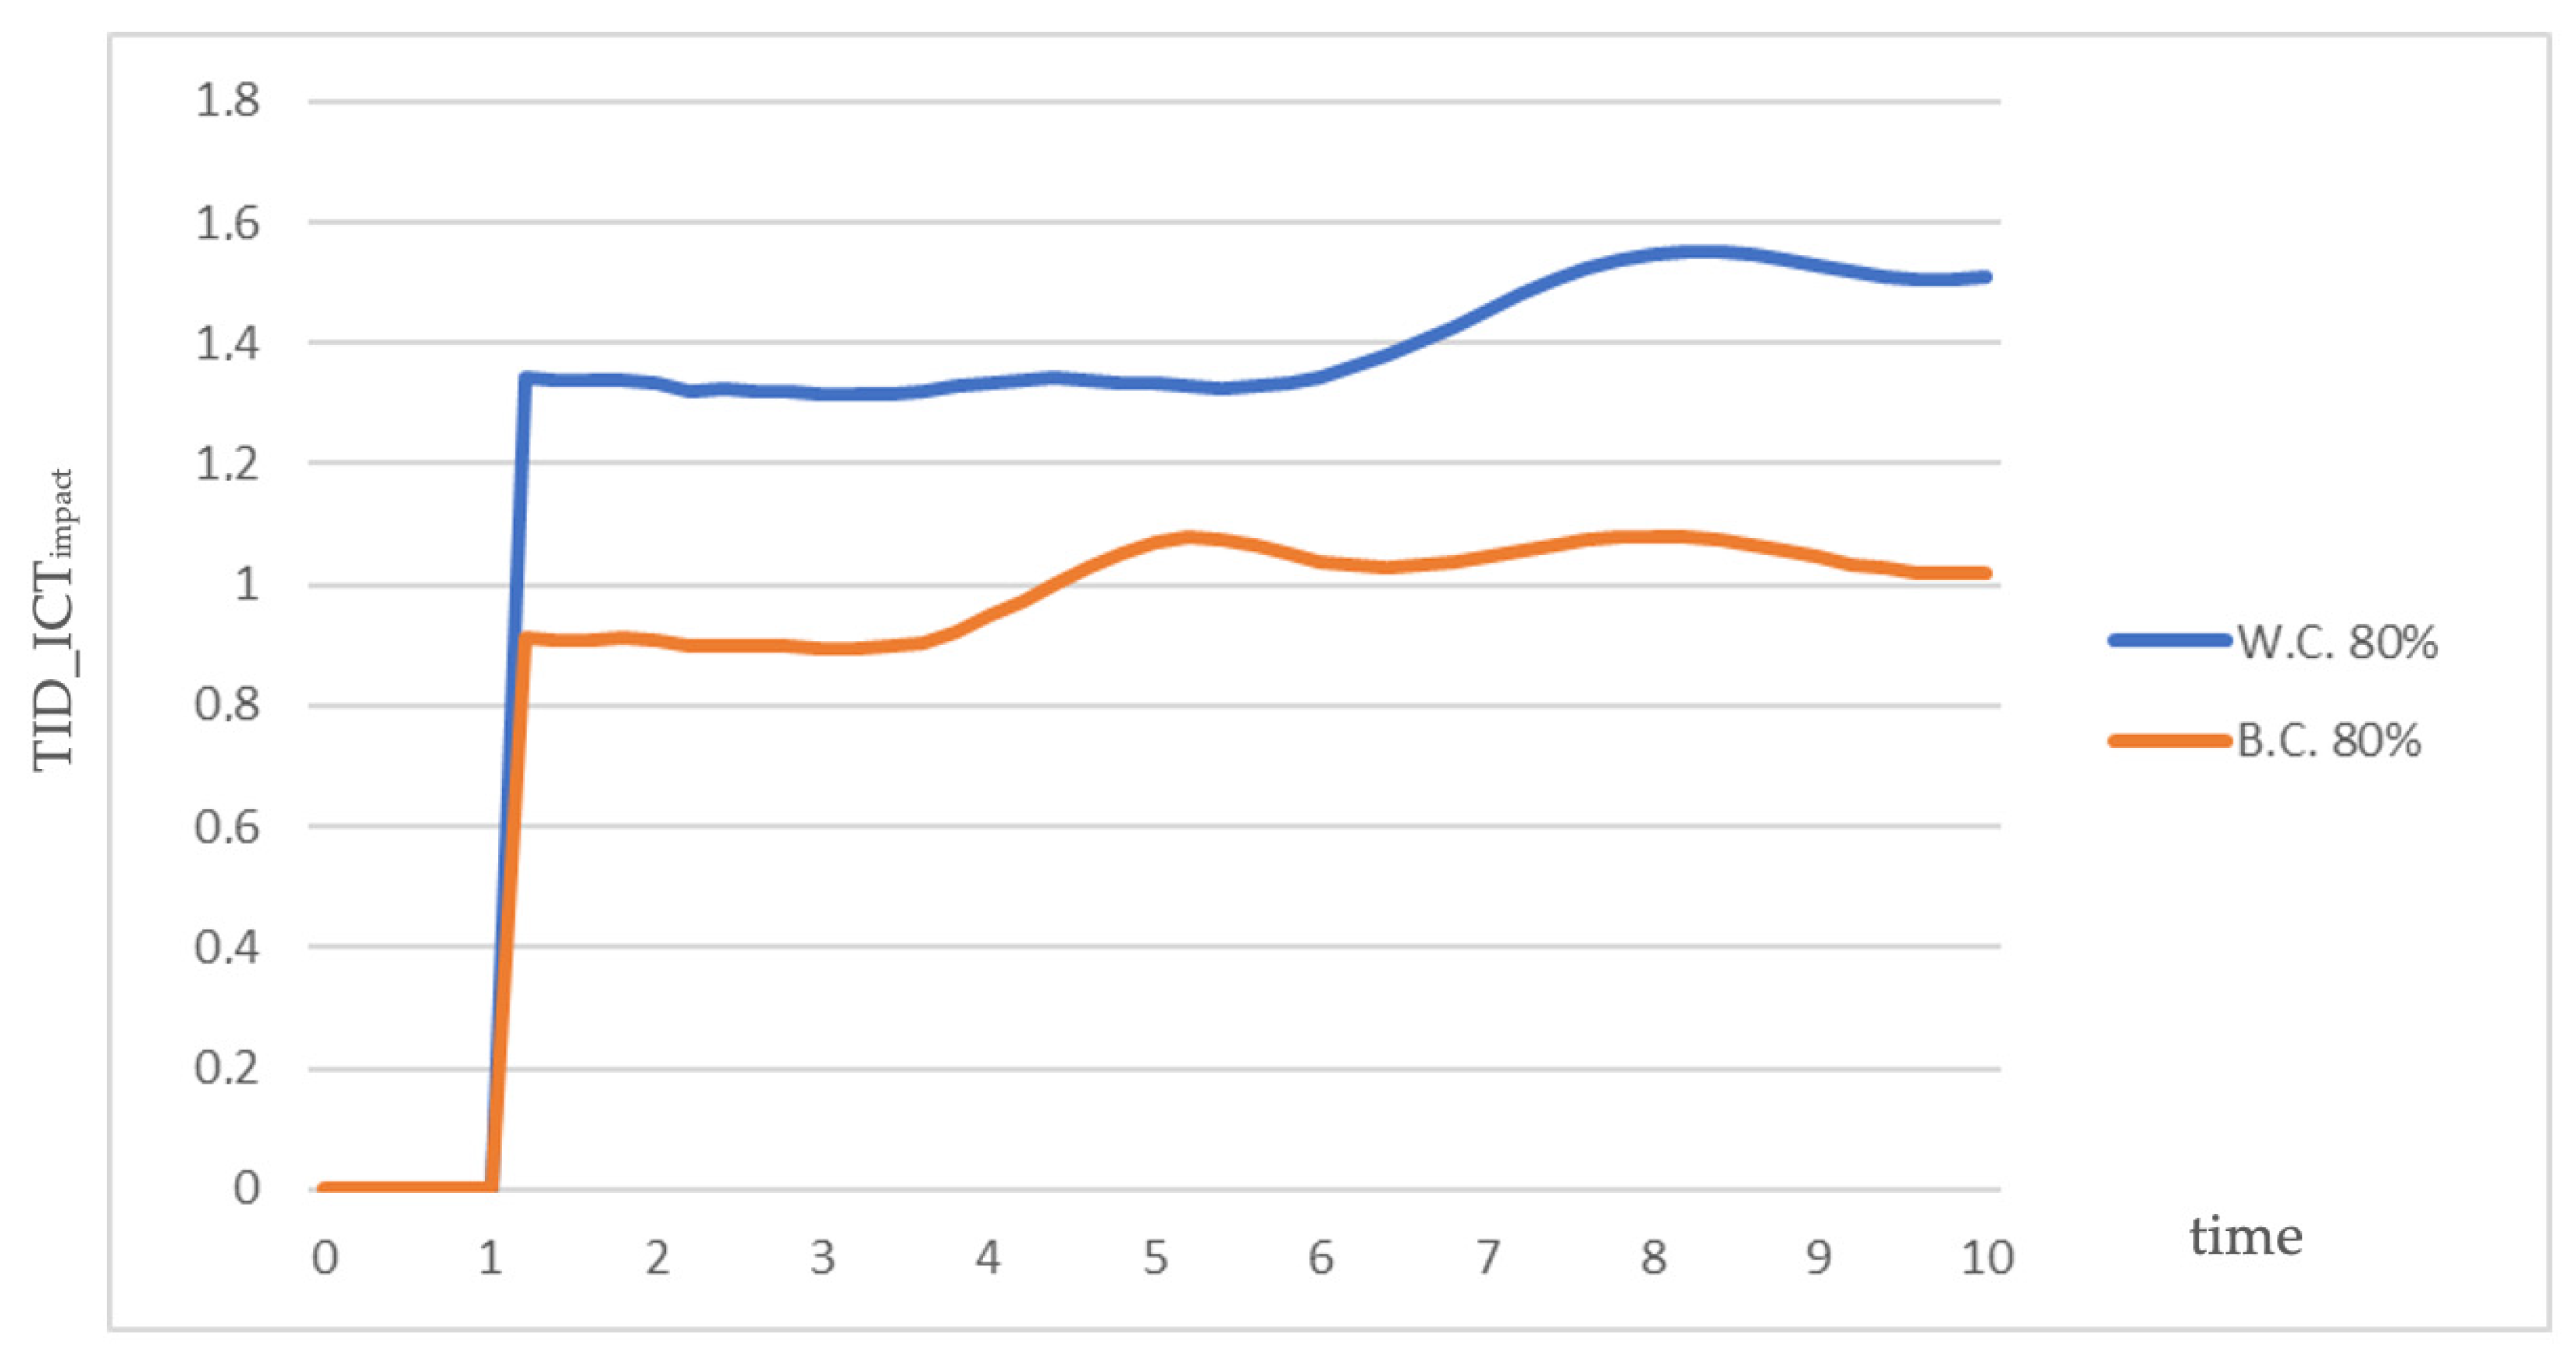
To identify the best and worst combinations, use is made, as in the previous case, of the TID_ICTimpact indicator. In particular, the case for which its value is as low as possible and, if possible, less than unity is considered optimal, as is the variation in the index values. On the other hand, cases in which there is a large fluctuation of the index values, and its values are high, are considered worse, and even worse when they are higher than unity. Table 4, Table 5, Table 6, Table 7 and Table 8 show, respectively, the best and worst combinations for each possible value of the % of home internet connections, considering both the variation in the index values and the average value as well as its maximum value. Also, in Figure 6 and Figure 7, the values of the index for the best and worst combination are shown indicatively in the case where the percentage of home internet connections is equal to 40% and 80%, respectively.
The results demonstrate that, as expected, the worst combinations that result refer to cases where all the other factors are in zero growth, as they receive the worst possible value. What is worth noting is the large variation in the maximum value of the TID_ICTimpact index as the percentage of home internet connections decreases from 60% to 20%, compared to the case where there is a decrease from 100% to 60%. Also, it is perceived that in the case of Western Macedonia, the variation in the index values is smaller than in the case of Central Macedonia. Also, for the impact index (TID_ICTimpact) to obtain a relatively satisfactory value in the case of the worst combinations, the percentage of home internet connections should reach the maximum. Otherwise, the influence of smart technologies on Regional Development is incomplete, even in the case that the percentage of household internet connections reaches 80%.
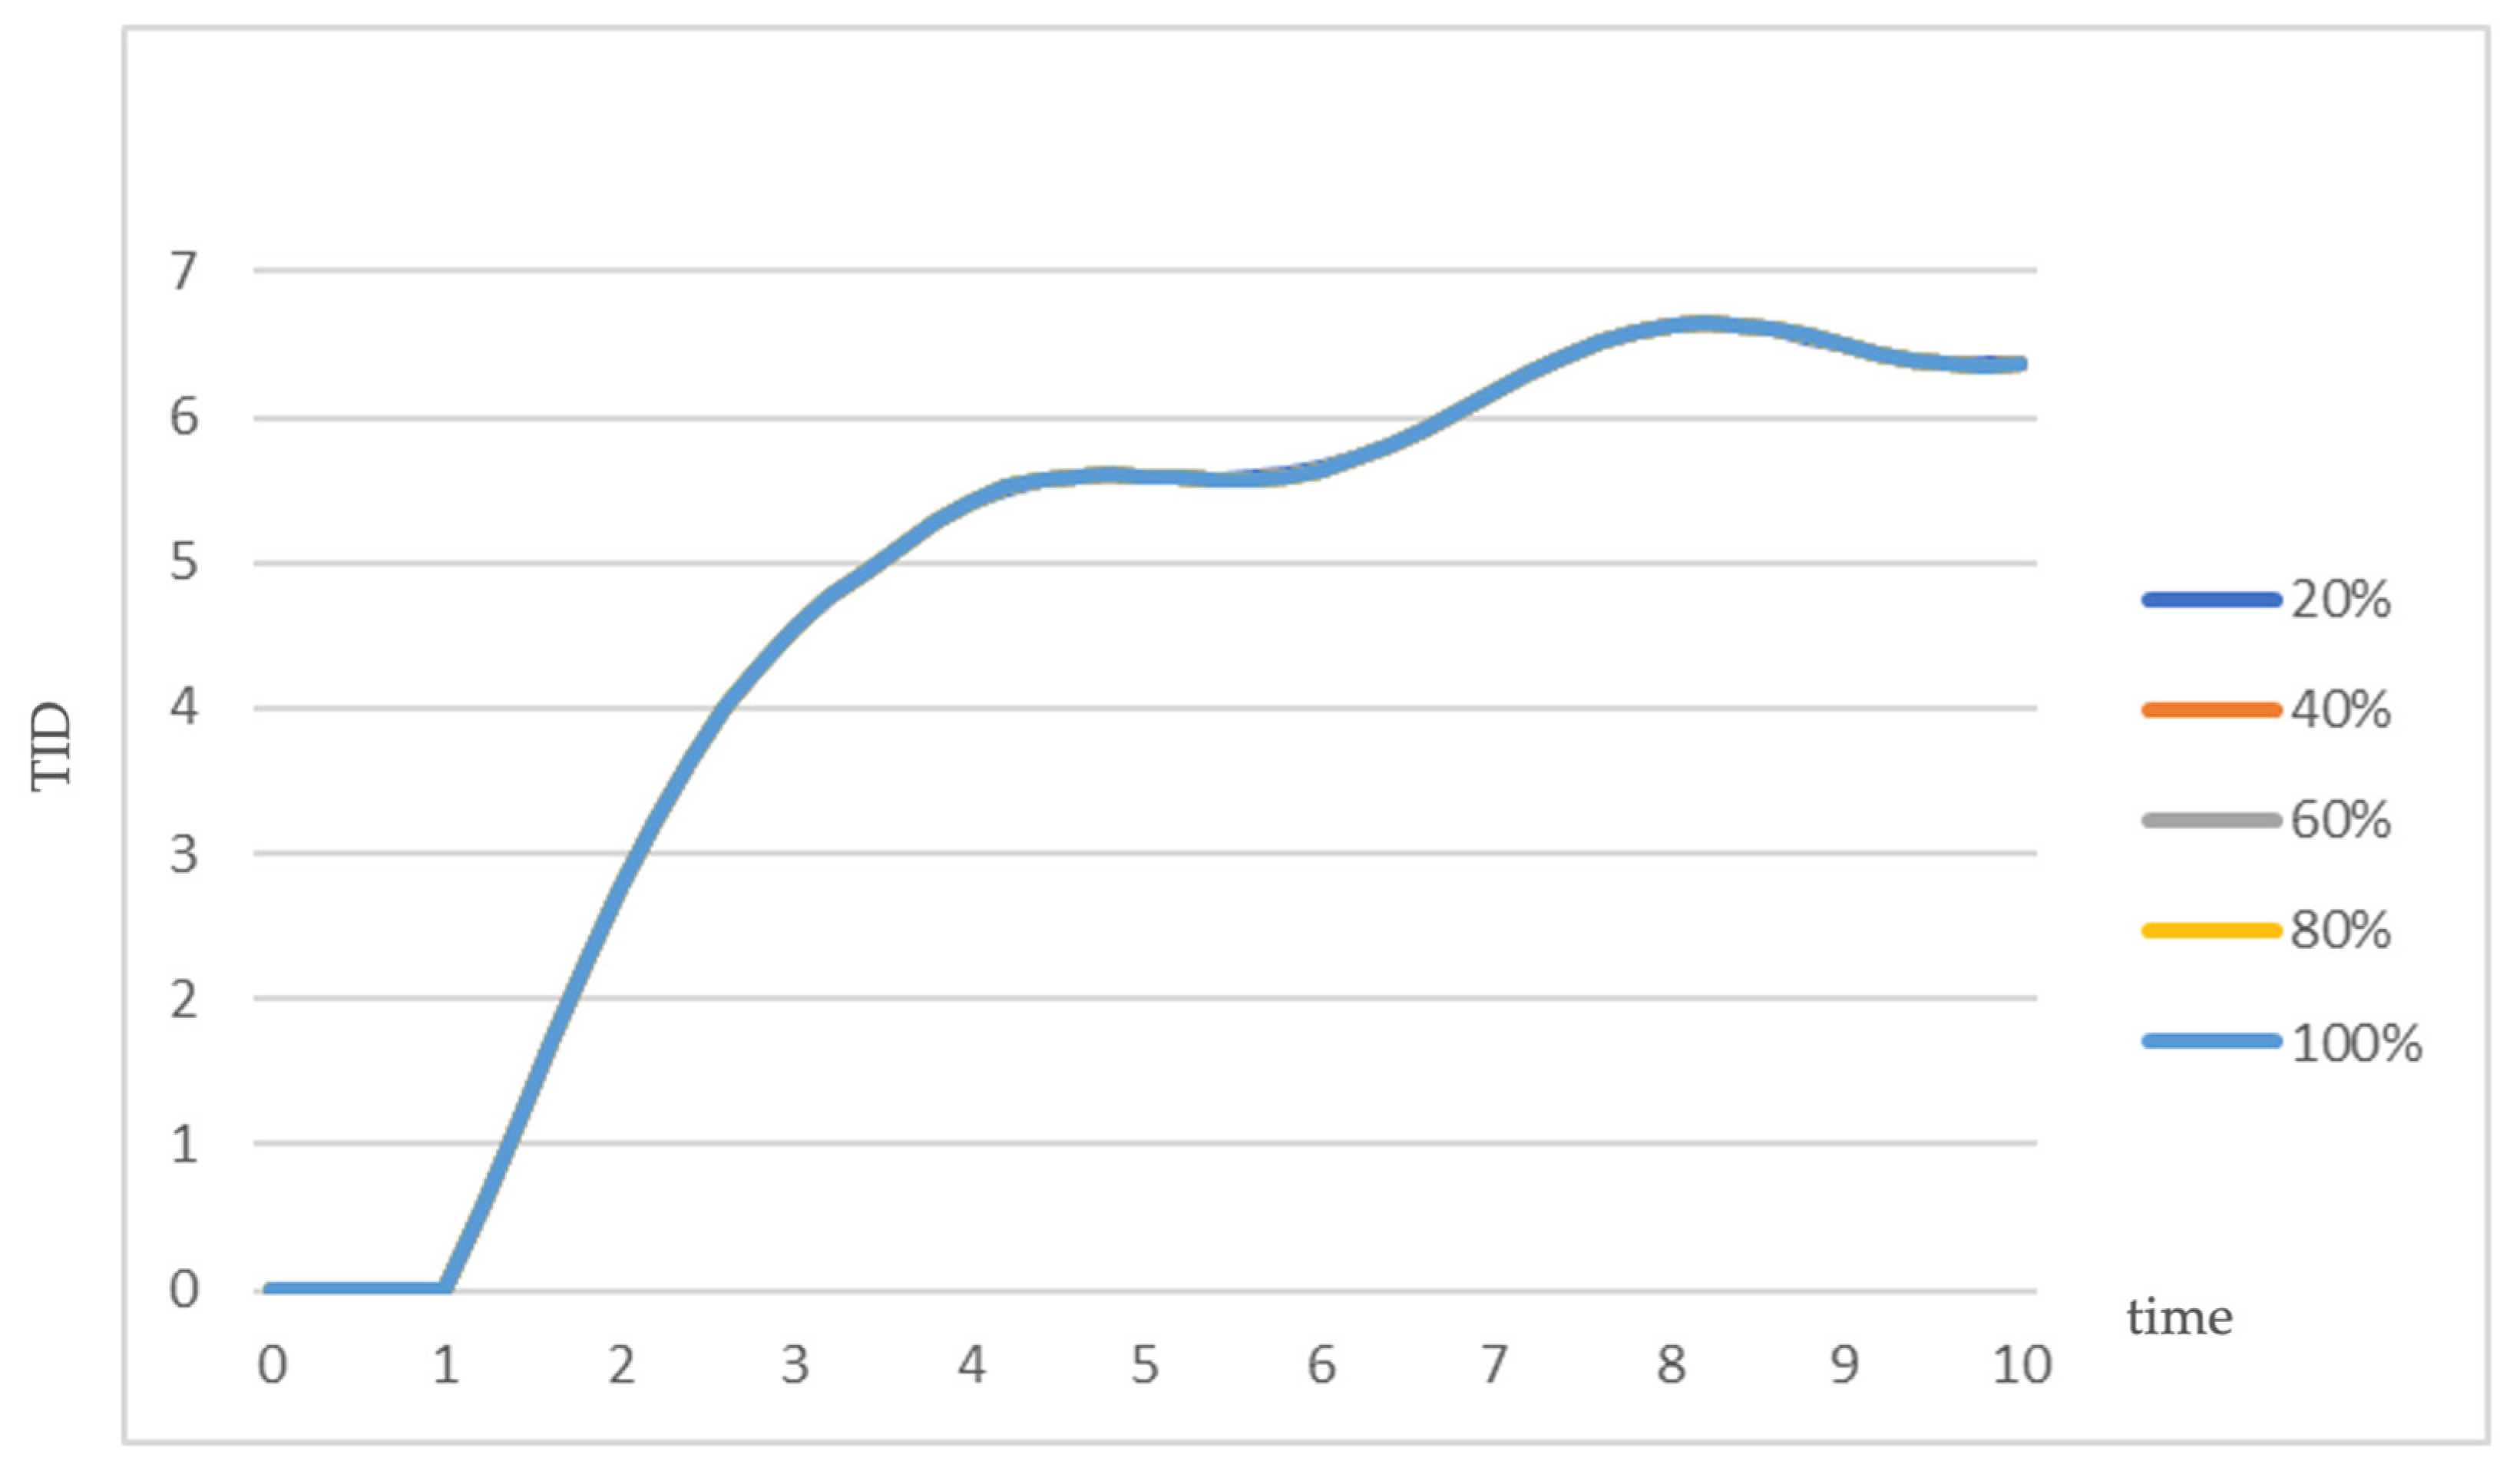
As far as the optimal combinations are concerned, we notice that in all cases, the mode of operation of the system is the same as both the value of the maximum value and the average value, as well as the variation in the values of the influence index, are the same. This fact is also reflected in Figure 8, where the values obtained by the Territorial Innovation and Development (TID) calculation variable for the optimal combinations for each of the possible values of the percentage of home internet connections are collectively noted. We observe that in all cases, the optimal combination has the same impact on the value of Regional Development.
Also, in the case of Western Macedonia, it is noticed that there is more variety in the optimal combinations when the percentage of household internet connections is small, while this variety decreases as this percentage increases. This fact indicates the flexibility that exists in policymaking in order to increase the impact of smart technologies on Regional Development.
It is worth noting that the existence of ICT programs is an important factor as they should range at a medium or high level, as seen in the majority of optimal combinations. Also, as the results state, both the average value and the maximum value of the optimal combinations are slightly greater than unity, which means that smart technologies will have an impact on Regional Development equal to their system change. On the other hand, we see that the variation in the influence index is noticeably lower compared to the case of Central Macedonia.

4.3. Policy Implications

Based on the findings from the simulations, we can make the following recommendations for policymakers in the regions of Western and Central Macedonia:
  • Western Macedonia
Given the region’s historical dependence on lignite and the consequent economic decline, diversification is crucial. The simulation results indicate that ICT infrastructure is vital for regional development. A broadband expansion by accelerating the rollout of high-speed internet across the region, particularly in rural and underserved areas, to ensure comprehensive digital connectivity is considered a key policy for Western Macedonia. By increasing the share of residential and business internet connections, access to digital services and opportunities for education and entrepreneurship can be improved. This could potentially contribute to the development of innovation and the local economy. Moreover, implementing smart city projects in urban areas like Kozani and Ptolemaida to improve public services, transportation, and energy management through the use of IoT and AI technologies will be of high importance to smart city initiatives. Considering the region is undergoing an energy transition, and there will be a large number of the population that will need upskilling, launching extensive training programs to upskill the workforce in ICT and digital skills is a priority for the region. To do so, collaboration with local universities and vocational schools should take place to provide courses tailored to industry needs.
  • Central Macedonia
Based on the simulation results for the case of Central Macedonia, the implementation of the targeted policies below can significantly enhance regional development. More precisely, Central Macedonia can capitalize on the region’s diverse industrial sectors and boost innovation by promoting advanced manufacturing techniques and Industry 4.0 technologies in key sectors like textiles, food processing, and chemicals and by fostering collaboration between universities, research institutes, and industries to drive innovation and technological advancement.
Furthermore, Central Macedonia could leverage ICT to boost regional development. This can be accomplished by implementing widespread digital literacy and ICT training programs targeting both young people and the existing workforce. Taking into consideration that agriculture thrives in Central Macedonia, enhancing precision agriculture could offer multiplier benefits for regional development. Finally, supporting innovative startups and technology-based businesses is of critical importance for Central Macedonia. This could be achieved by offering incentives and aids for the creation and development of new ICT startups that would strengthen the local economy and create new jobs.
By adopting these proposals, both regions can achieve stronger, more sustainable and dynamic growth by exploiting the potential of smart technologies.

5. Conclusions, Limitations and Future Research

This study uses a System Dynamics model of a Regional Innovation System (RIS) to clarify the important role that smart technologies play in promoting regional growth. The results highlight how smart technology can impact regional innovation and competitiveness in a dynamic way. The study offers actual evidence to support the claim that incorporating smart technologies into regional innovation systems can stimulate innovation and economic growth by applying the model to two Greek regions. The developed scenarios show how areas can effectively change their economic landscapes by combining innovation policy with the correct technical infrastructure.
The results show that, in the case of Central Macedonia, the percentage of home internet connections is low, and the development of ICT programs to the maximum extent possible is crucial. On the other hand, if this percentage is high, then the use of PCs and the existence of ICT specialists in the area play a primary role. In the case of Western Macedonia, it is observed that while the percentage of household internet connections is low, there is greater variation in the best combinations; however, as this percentage increases, the variety decreases. In addition, it is noticeable that the majority of best combinations indicate that ICT programs should be at a medium or high level; therefore, their existence is a significant consideration.
Although this study offers insightful information about how smart technologies affect regional development, it must be noted that it has several limitations. First off, the study’s scope is limited to just two Greek regions, which means it might not be representative of other geographic contexts with various socioeconomic features. Furthermore, the reliability of the results may be impacted by the accuracy and accessibility of the regional data, especially in domains with constantly advancing technology. A survey of the literature found a startling dearth of regional data. The authors “regionalized” national-level indicators using a novel analytical approach to make up for this [45]. Using correlations and regressions in a “model fit” approach, they estimated regional-level values for four indicators that are not available there, based on the values of four other indicators that are available there and are intimately related to the former group. These were cloud computing, digitalization, employed ICT professionals, and e-commerce sales.
To generalize the results, future research should concentrate on broadening the study’s geographical scope to encompass a variety of regions with different technological and economic environments. To improve the model’s relevance and prediction ability, real-time data and more dynamic policy variables should be added. A deeper understanding of the strategic planning of regional innovation systems may be gained by examining the long-term effects of smart technologies on district socioeconomic variables and high-effect indicators, including advanced business models [46,47], innovative entrepreneurship types [48], smart education [49], and public welfare within the framework of the Regional Innovation Systems.

Author Contributions

Conceptualization, E.S., P.K. (Paraskevi Kosti) and E.K.; methodology, E.S. and E.K.; formal analysis, E.K.; writing—original draft preparation, E.S. and G.M.; writing—review and editing, E.S., P.K. (Pavlos Kilintzis), E.K. and G.M.; project administration, E.S.; funding acquisition, E.S. All authors have read and agreed to the published version of the manuscript.

Funding

This research was funded by the Hellenic Foundation for Research & Innovation (ΕΛΙΔΕΚ–HFRI) under the 2nd Call for H.F.R.I. Research Projects to Support Post-Doctoral Researchers. Project name: Smart Technologies and Innovation Systems in Regional Development: Approach with System Dynamics (acronym “STEI RED”), project number 00569.

Data Availability Statement

The overall mathematical formulation of the model is available on request from the corresponding author.

Conflicts of Interest

The authors declare no conflict of interest. The funders had no role in the design of the study; in the collection, analyses, or interpretation of data; in the writing of the manuscript; or in the decision to publish the results.

Appendix A

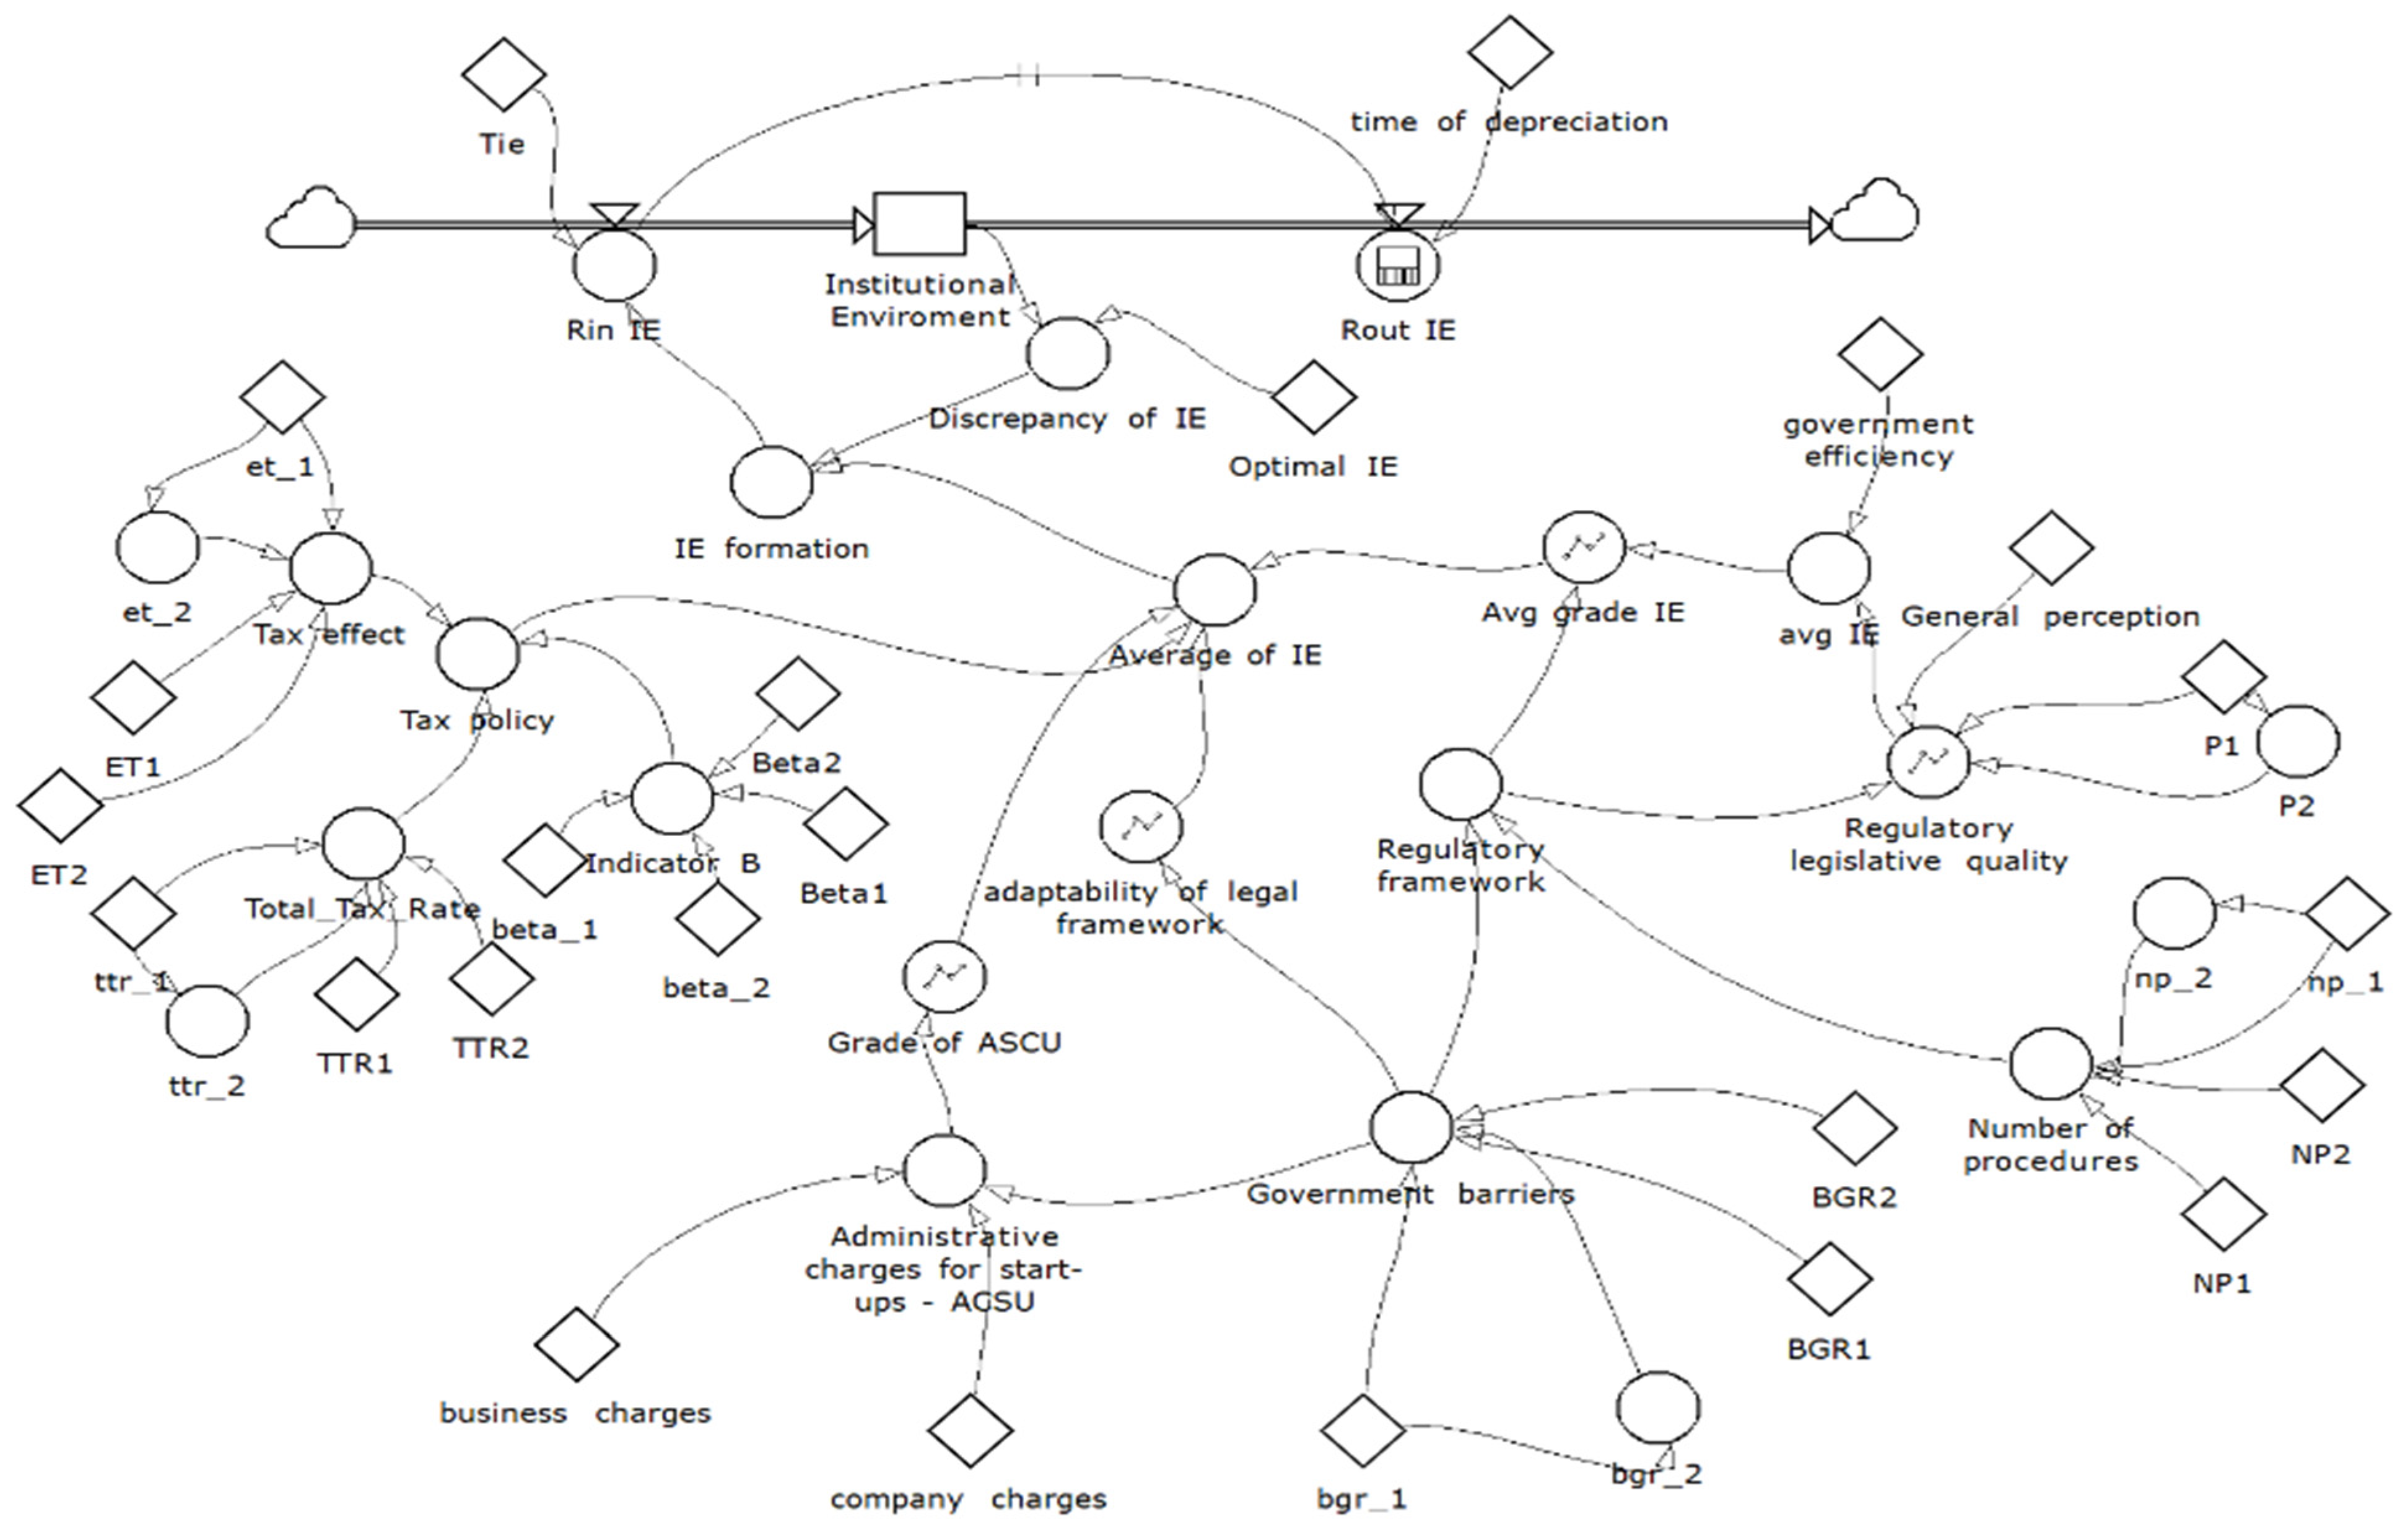
Figure A1. Stock and flow diagram of the institutional framework subsystem.
Systems 12 00200 g0a1
Figure A2. Stock and flow diagram of the knowledge application and exploitation subsystem.
Systems 12 00200 g0a2
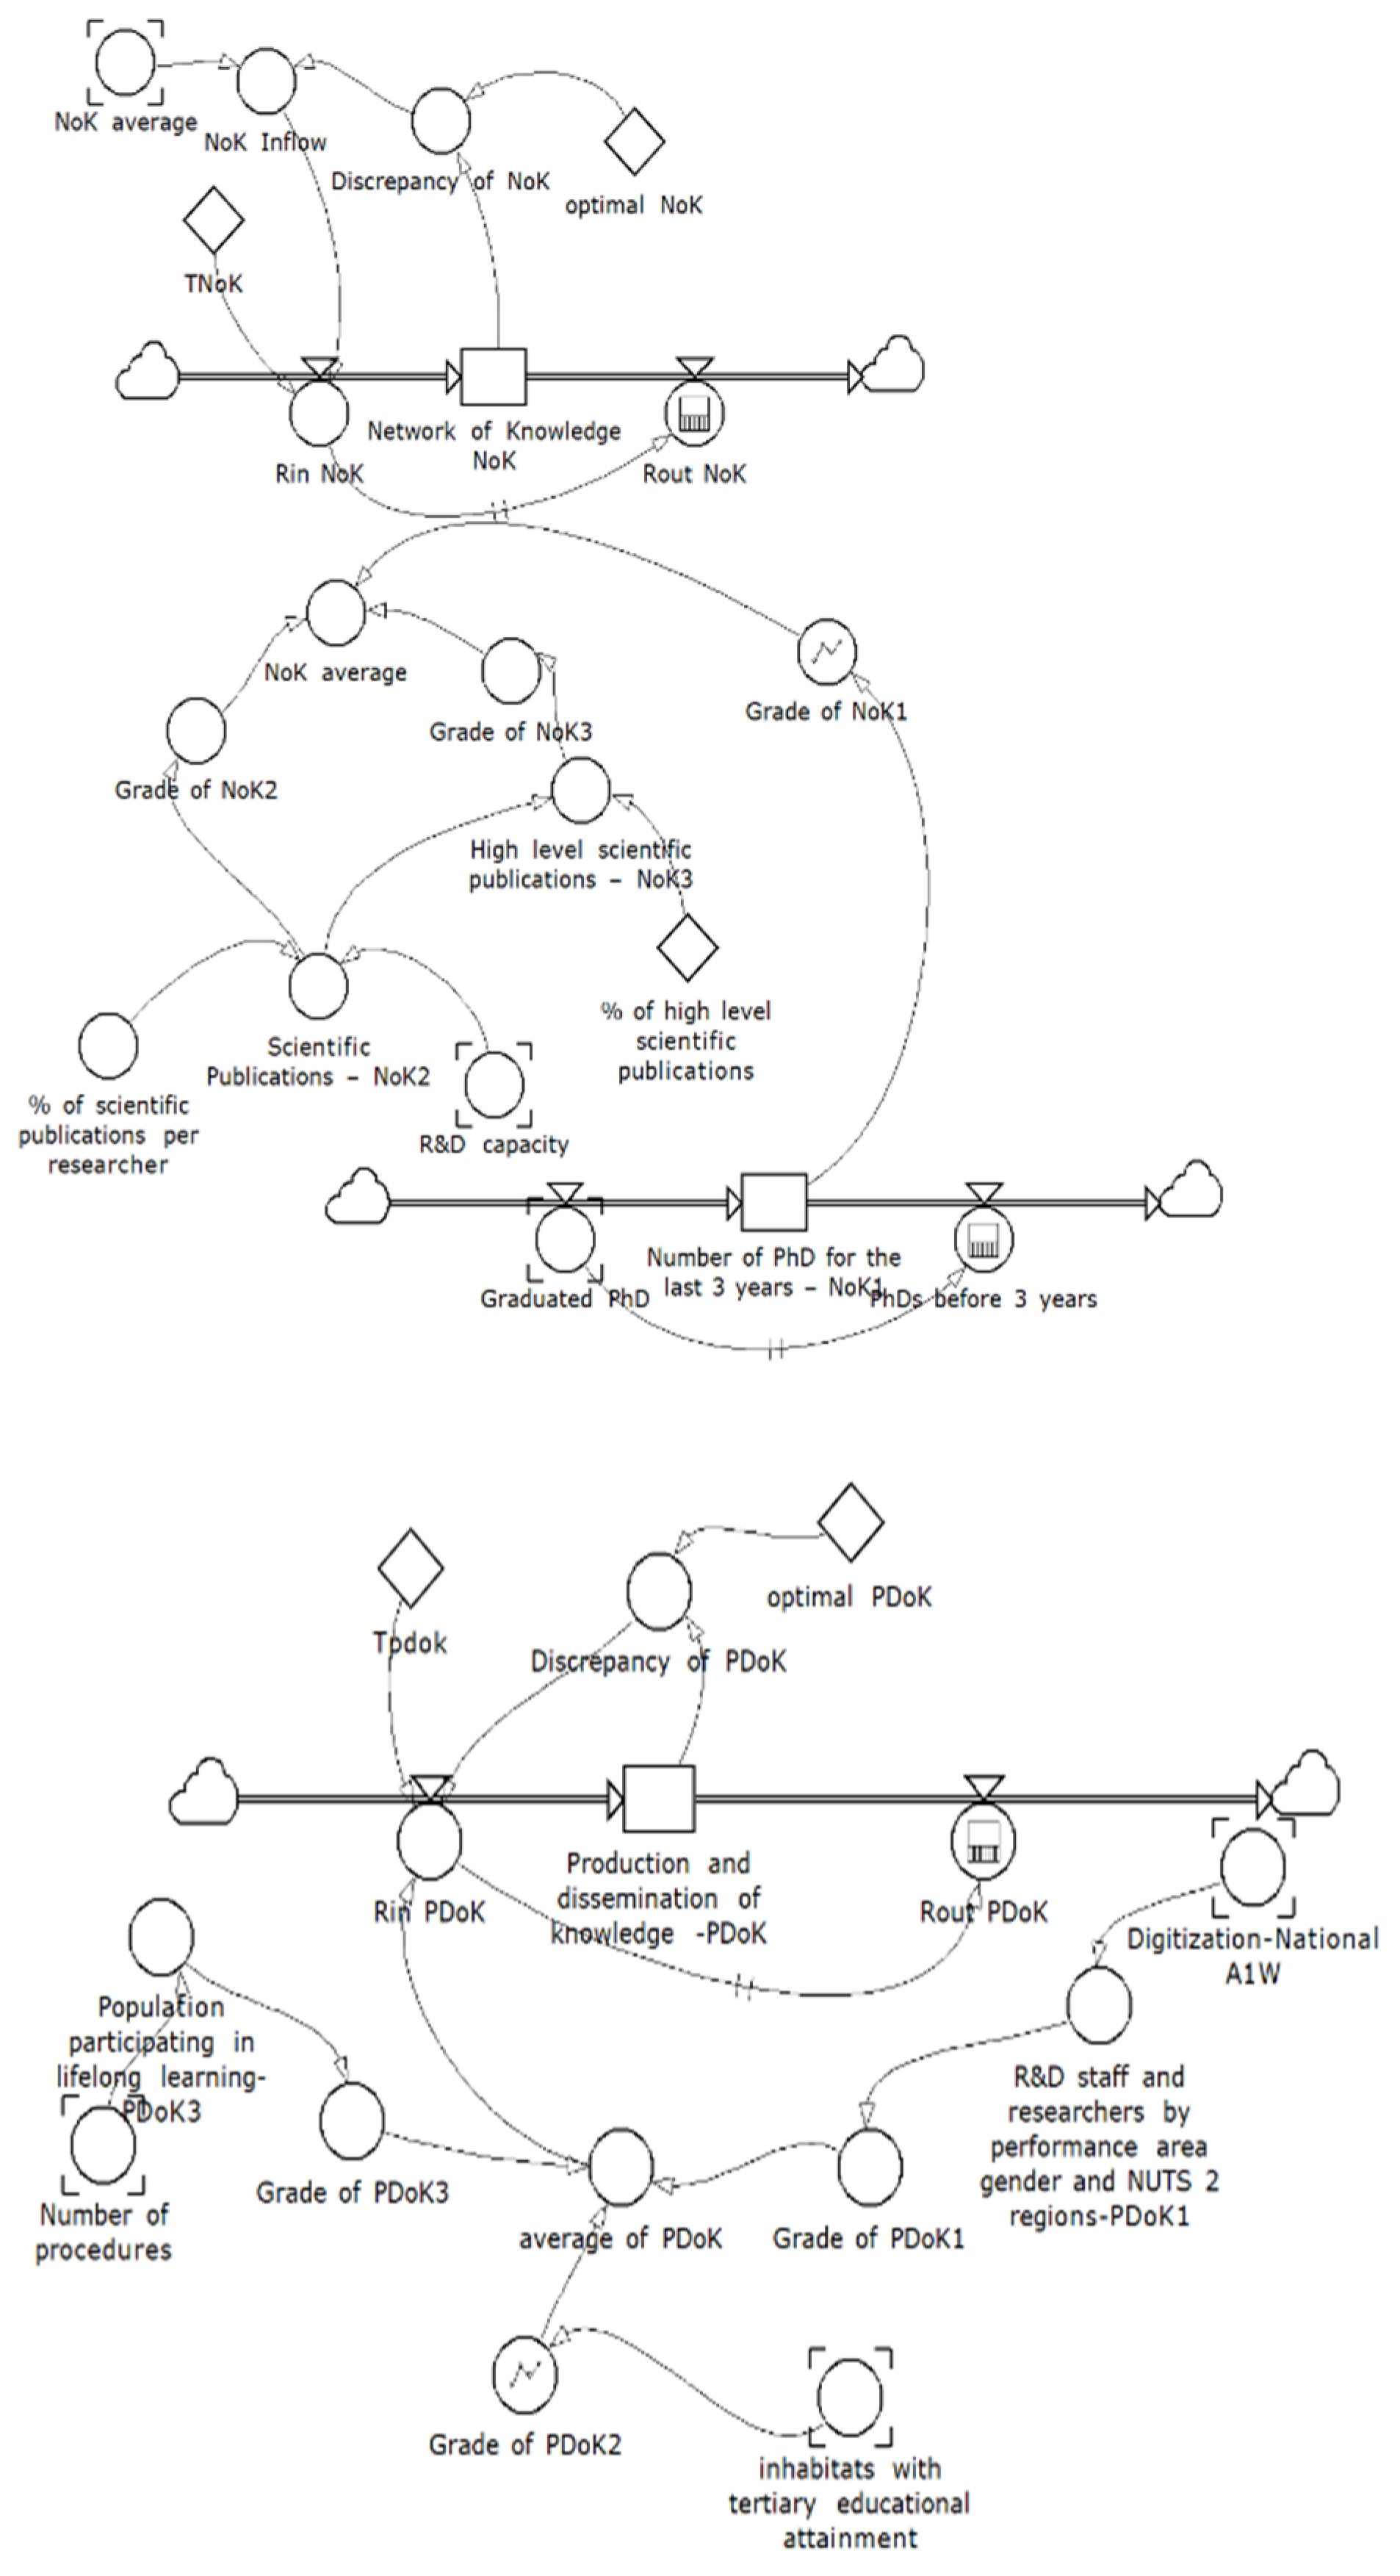
Figure A3. Stock and flow diagrams of the knowledge network and knowledge production and dissemination subsystems.
Systems 12 00200 g0a3

Notes

1
2
3

References

  1. Crossan, M.M.; Apaydin, M. A Multi-Dimensional Framework of Organizational Innovation: A Systematic Review of the Literature. J. Manag. Stud. 2010, 47, 1154–1191. [Google Scholar] [CrossRef]
  2. Tan, Y.; Zhao, C.; Yang, N. Research on The Evaluation Model of Symbiosis Degree in High-Tech Industrial Innovation Ecosystem-An Empirical Study Based on the Panel Data of China from 2012 to 2018. E3S Web Conf. 2023, 409, 01003. [Google Scholar] [CrossRef]
  3. Mogi, T. Richard Florida, The Rise of the Creative Class: And How It’s Transforming Work, Leisure, Community and Everyday Life, Basic Books, New York, 2002. J. Cult. Econ. 2003, 3, 87–89. [Google Scholar]
  4. OECD. Regions and Innovation-Collaborating Across Borders; OECD Reviews of Regional Innovation; OECD Publishing: Paris, France, 2013. [Google Scholar]
  5. Cooke, P.; Uranga, M.G.; Etxebarria, G. Regional Innovation Systems: Institutional and Organisational Dimensions. Res. Policy 1997, 26, 475–491. [Google Scholar] [CrossRef]
  6. Cooke, P.N.; Heidenreich, M.; Braczyk, H.-J. Regional Innovation Systems: The Role of Governance in a Globalized World; Routledge: London, UK, 2004; ISBN 978-0-415-30369-9. [Google Scholar]
  7. Martinidis, G.; Komninos, N.; Dyjakon, A.; Minta, S.; Hejna, M. How Intellectual Capital Predicts Innovation Output in EU Regions: Implications for Sustainable Development. Sustainability 2021, 13, 14036. [Google Scholar] [CrossRef]
  8. Cooke, P. The Role of Research in Regional Innovation Systems: New Models Meeting Knowledge Economy Demands. IJTM 2004, 28, 507. [Google Scholar] [CrossRef]
  9. Research on the Knowledge Transfer Model Based on Regional Innovation System. Available online: https://www.lis.ac.cn/EN/10.13266/j.issn.0252-3116.2017.17.002 (accessed on 16 May 2024).
  10. Pino, R.M.; Ortega, A.M. Regional Innovation Systems: Systematic Literature Review and Recommendations for Future Research. Cogent. Bus. Manag. 2018, 5, 1463606. [Google Scholar] [CrossRef]
  11. Shang, Y.; Zeng, G. The Role and Mechanism of Scientific and Technological Innovation in Promoting the Transformation of Regional Economic Development Models. Geogr. Res. 2017, 36, 2279–2290. [Google Scholar]
  12. Gunawardena, C.N.; Hermans, M.B.; Sanchez, D.; Richmond, C.; Bohley, M.; Tuttle, R. A Theoretical Framework for Building Online Communities of Practice with Social Networking Tools. Educ. Media Int. 2009, 46, 3–16. [Google Scholar] [CrossRef]
  13. OECD. Innovation-Driven Growth in Regions: The Role of Smart Specialisation; OECD Publishing: Paris, France, 2013. [Google Scholar]
  14. Asheim, B.T.; Coenen, L. Contextualising Regional Innovation Systems in a Globalising Learning Economy: On Knowledge Bases and Institutional Frameworks. J. Technol. Transf. 2006, 31, 163–173. [Google Scholar] [CrossRef]
  15. Autio, E. Evaluation of RTD in Regional Systems of Innovation. Eur. Plan. Stud. 1998, 6, 131–140. [Google Scholar] [CrossRef]
  16. Trippl, M. Developing cross—Border regional innovation systems: Key factors and challenges. Tijd. Voor Econ. Soc. Geog. 2010, 101, 150–160. [Google Scholar] [CrossRef]
  17. Zook, M.A. The Knowledge Brokers: Venture Capitalists, Tacit Knowledge and Regional Development. Int. J. Urban Reg. Res. 2004, 28, 621–641. [Google Scholar] [CrossRef]
  18. Tallman, S.; Jenkins, M.; Henry, N.; Pinch, S. Knowledge, Clusters, and Competitive Advantage. AMR 2004, 29, 258–271. [Google Scholar] [CrossRef]
  19. Huggins, R.A.; Izushi, H. Competing for Knowledge: Creating, Connecting and Growing; Routledge: London, UK, 2007. [Google Scholar]
  20. Foray, D.; David, P.A.; Hall, B. Smart Specialisation—The Concept. Knowl. Econ. Policy Brief. 2009, 9, 100. [Google Scholar]
  21. Foray, D. From Smart Specialisation to Smart Specialisation Policy. Eur. J. Innov. Manag. 2014, 17, 492–507. [Google Scholar] [CrossRef]
  22. Boschma, R. Constructing Regional Advantage and Smart Specialisation: Comparison of Two European Policy Concepts. Sci. Reg. Ital. J. Reg. Sci. 2014, 13, 51–68. [Google Scholar] [CrossRef]
  23. McCann, P.; Ortega-Argilés, R. Smart Specialisation in European Regions: Issues of Strategy, Institutions and Implementation. Eur. J. Innov. Manag. 2014, 17, 409–427. [Google Scholar] [CrossRef]
  24. Manioudis, M.; Angelakis, A. Creative Economy and Sustainable Regional Growth: Lessons from the Implementation of Entrepreneurial Discovery Process at the Regional Level. Sustainability 2023, 15, 7681. [Google Scholar] [CrossRef]
  25. The Sage Encyclopedia of the Internet. 3: R-Y, Index; SAGE Reference: Los Angeles, CA, USA; London, UK; New Delhi, India; Singapore; Washington, DC, USA; Melbourne, Australia, 2018; ISBN 978-1-4739-2661-5.
  26. Ranga, M.; Etzkowitz, H. Triple Helix Systems: An Analytical Framework for Innovation Policy and Practice in the Knowledge Society. Entrep. Knowl. Exch. 2015, 117–158. Available online: https://www.taylorfrancis.com/chapters/edit/10.4324/9781315795638-11/experiential-internships-mary-varghese-loran-carleton-parker-omolola-adedokun-monica-shively-wilella-burgess-amy-childress-ann-bessenbacher (accessed on 1 May 2024).
  27. Kleibrink, A.; Magro, E. The Making of Responsive Innovation Policies: Varieties of Evidence and Their Contestation in the Basque Country. Palgrave Commun. 2018, 4, 74. [Google Scholar] [CrossRef]
  28. Oskam, J.; Boswijk, A. Airbnb: The Future of Networked Hospitality Businesses. J. Tour. Futures 2016, 2, 22–42. [Google Scholar] [CrossRef]
  29. Kenney, M.; Zysman, J. The Rise of the Platform Economy. Issues Sci. Technol. 2016, 32, 61. [Google Scholar]
  30. Biber, E.; Light, S.E.; Ruhl, J.B.; Salzman, J. Regulating Business Innovation as Policy Disruption: From the Model T to Airbnb. Vanderbilt Law Rev. 2017, 70, 1561. [Google Scholar]
  31. Kakderi, C.; Psaltoglou, A.; Fellnhofer, K. Digital Platforms and Online Applications for User Engagement and Collaborative Innovation. In Proceedings of the 20th Conference of the Greek Society of Regional Scientists, Athens, Greece, 4–5 June 2018; pp. 112–117. [Google Scholar]
  32. Antonelli, G.; Cappiello, G. Smart Development in Smart Communities; Routledge: London, UK, 2017. [Google Scholar]
  33. Ziouzios, D.; Karlopoulos, E.; Fragkos, P.; Vrontisi, Z. Challenges and Opportunities of Coal Phase-out in Western Macedonia. Climate 2021, 9, 115. [Google Scholar] [CrossRef]
  34. Tranoulidis, A.; Sotiropoulou, R.-E.P.; Bithas, K.; Tagaris, E. Decarbonization and Transition to the Post-Lignite Era: Analysis for a Sustainable Transition in the Region of Western Macedonia. Sustainability 2022, 14, 10173. [Google Scholar] [CrossRef]
  35. Karafolas, S.; Ragias, V. Economic Crisis Effects on Investment Plans: The Case of the LEADER Program in the Region of West Macedonia, Greece. In Proceedings of the of the 13th International Conference, New York, NY, USA, 22–25 October 2021; p. 14. [Google Scholar]
  36. Hollanders, H.; Es-Sadki, N. Regional Innovation Scoreboard (RIS) 2021; Maastricht Economic and Social Research Institute on Innovation and Technology (UNU-MERIT): Maastricht, The Netherlands, 2021. [Google Scholar]
  37. Kakderi, C.; Tasopoulou, A. Regional Economic Resilience and the Role of Traditionalstructures: The Case of West Macedonia, Greece. In Economic Crisis and the Resilience of Regions; Edward Elgar Publishing: Cheltenham, UK, 2018; pp. 108–126. [Google Scholar]
  38. Zervas, E.; Vatikiotis, L.; Gareiou, Z. Proposals for an Environmental and Social Just Transition for the Post-Lignite Era in Western Macedonia, Greece. In IOP Conference Series: Earth and Environmental Science; IOP Publishing: Bristol, UK, 2021; Volume 899, p. 012049. [Google Scholar]
  39. Maniati, A.; Loizou, E.; Psaltopoulos, D.; Mattas, K. The Regional Economy of Central Macedonia: An Application of the Social Accounting Matrix. Agric. Financ. Rev. 2021, 82, 765–774. [Google Scholar] [CrossRef]
  40. Ketikidis, P.; Zigiaris, S.; Zaharis, N. Regional Innovation and Competitiveness: Analysis of the Thessaloniki Metropolitan Region; Academic Conferences and Publishing International Limited: Reading, UK, 2010. [Google Scholar]
  41. Samara, E.; Kilintzis, P.; Katsoras, E.; Martnidis, G.; Kosti, P. A System Dynamics Approach for the Development of a Regional Innovation System. J. Innov. Entrep. 2024, 13, 26. [Google Scholar] [CrossRef]
  42. Sterman, J.D. Modeling Managerial Behavior: Misperceptions of Feedback in a Dynamic Decision Making Experiment. Manag. Sci. 1989, 35, 321–339. [Google Scholar] [CrossRef]
  43. Samara, E.; Andronikidis, A.; Komninos, N.; Bakouros, Y.; Katsoras, E. The Role of Digital Technologies for Regional Development: A System Dynamics Analysis. J. Knowl Econ. 2023, 14, 2215–2237. [Google Scholar] [CrossRef]
  44. Katsoras, E.; Georgiadis, P. A Dynamic Analysis for Mitigating Disaster Effects in Closed Loop Supply Chains. Sustainability 2022, 14, 4948. [Google Scholar] [CrossRef]
  45. Samara, E.; Kilintzis, P.; Komninos, N.; Anastasiou, A.; Martinidis, G. Assessment of Smart Technologies in Regional Innovation Systems: A Novel Methodological Approach to the Regionalisation of National Indicators. Systems 2024, 12, 12. [Google Scholar] [CrossRef]
  46. Kilintzis, P.; Samara, E.; Carayannis, E.G.; Bakouros, Y. Business Model Innovation in Greece: Its Effect on Organizational Sustainability. J. Knowl Econ. 2020, 11, 949–967. [Google Scholar] [CrossRef]
  47. Giourka, P.; Kilintzis, P.; Samara, E.; Avlogiaris, G.; Farmaki, P.; Bakouros, Y. A Business Acceleration Program Supporting Cross-Border Enterprises: A Comparative Study. J. Open Innov. Technol. Mark. Complex. 2021, 7, 152. [Google Scholar] [CrossRef]
  48. Kilintzis, P.; Avlogiaris, G.; Samara, E.; Bakouros, Y. Technology Entrepreneurship: A Model for the European Case. J. Knowl Econ. 2023, 14, 879–904. [Google Scholar] [CrossRef]
  49. Samara, E.; Angelidis, P.; Kotsiari, A.; Kilintzis, P.; Giorgos, A. Robotics in Primary and Secondary Education-the Lego Mindstorms EV3 Implementation. In Proceedings of the 2021 6th South-East Europe Design Automation, Computer Engineering, Computer Networks and Social Media Conference (SEEDA-CECNSM), Preveza, Greece, 24–26 September 2021; pp. 1–8. [Google Scholar]
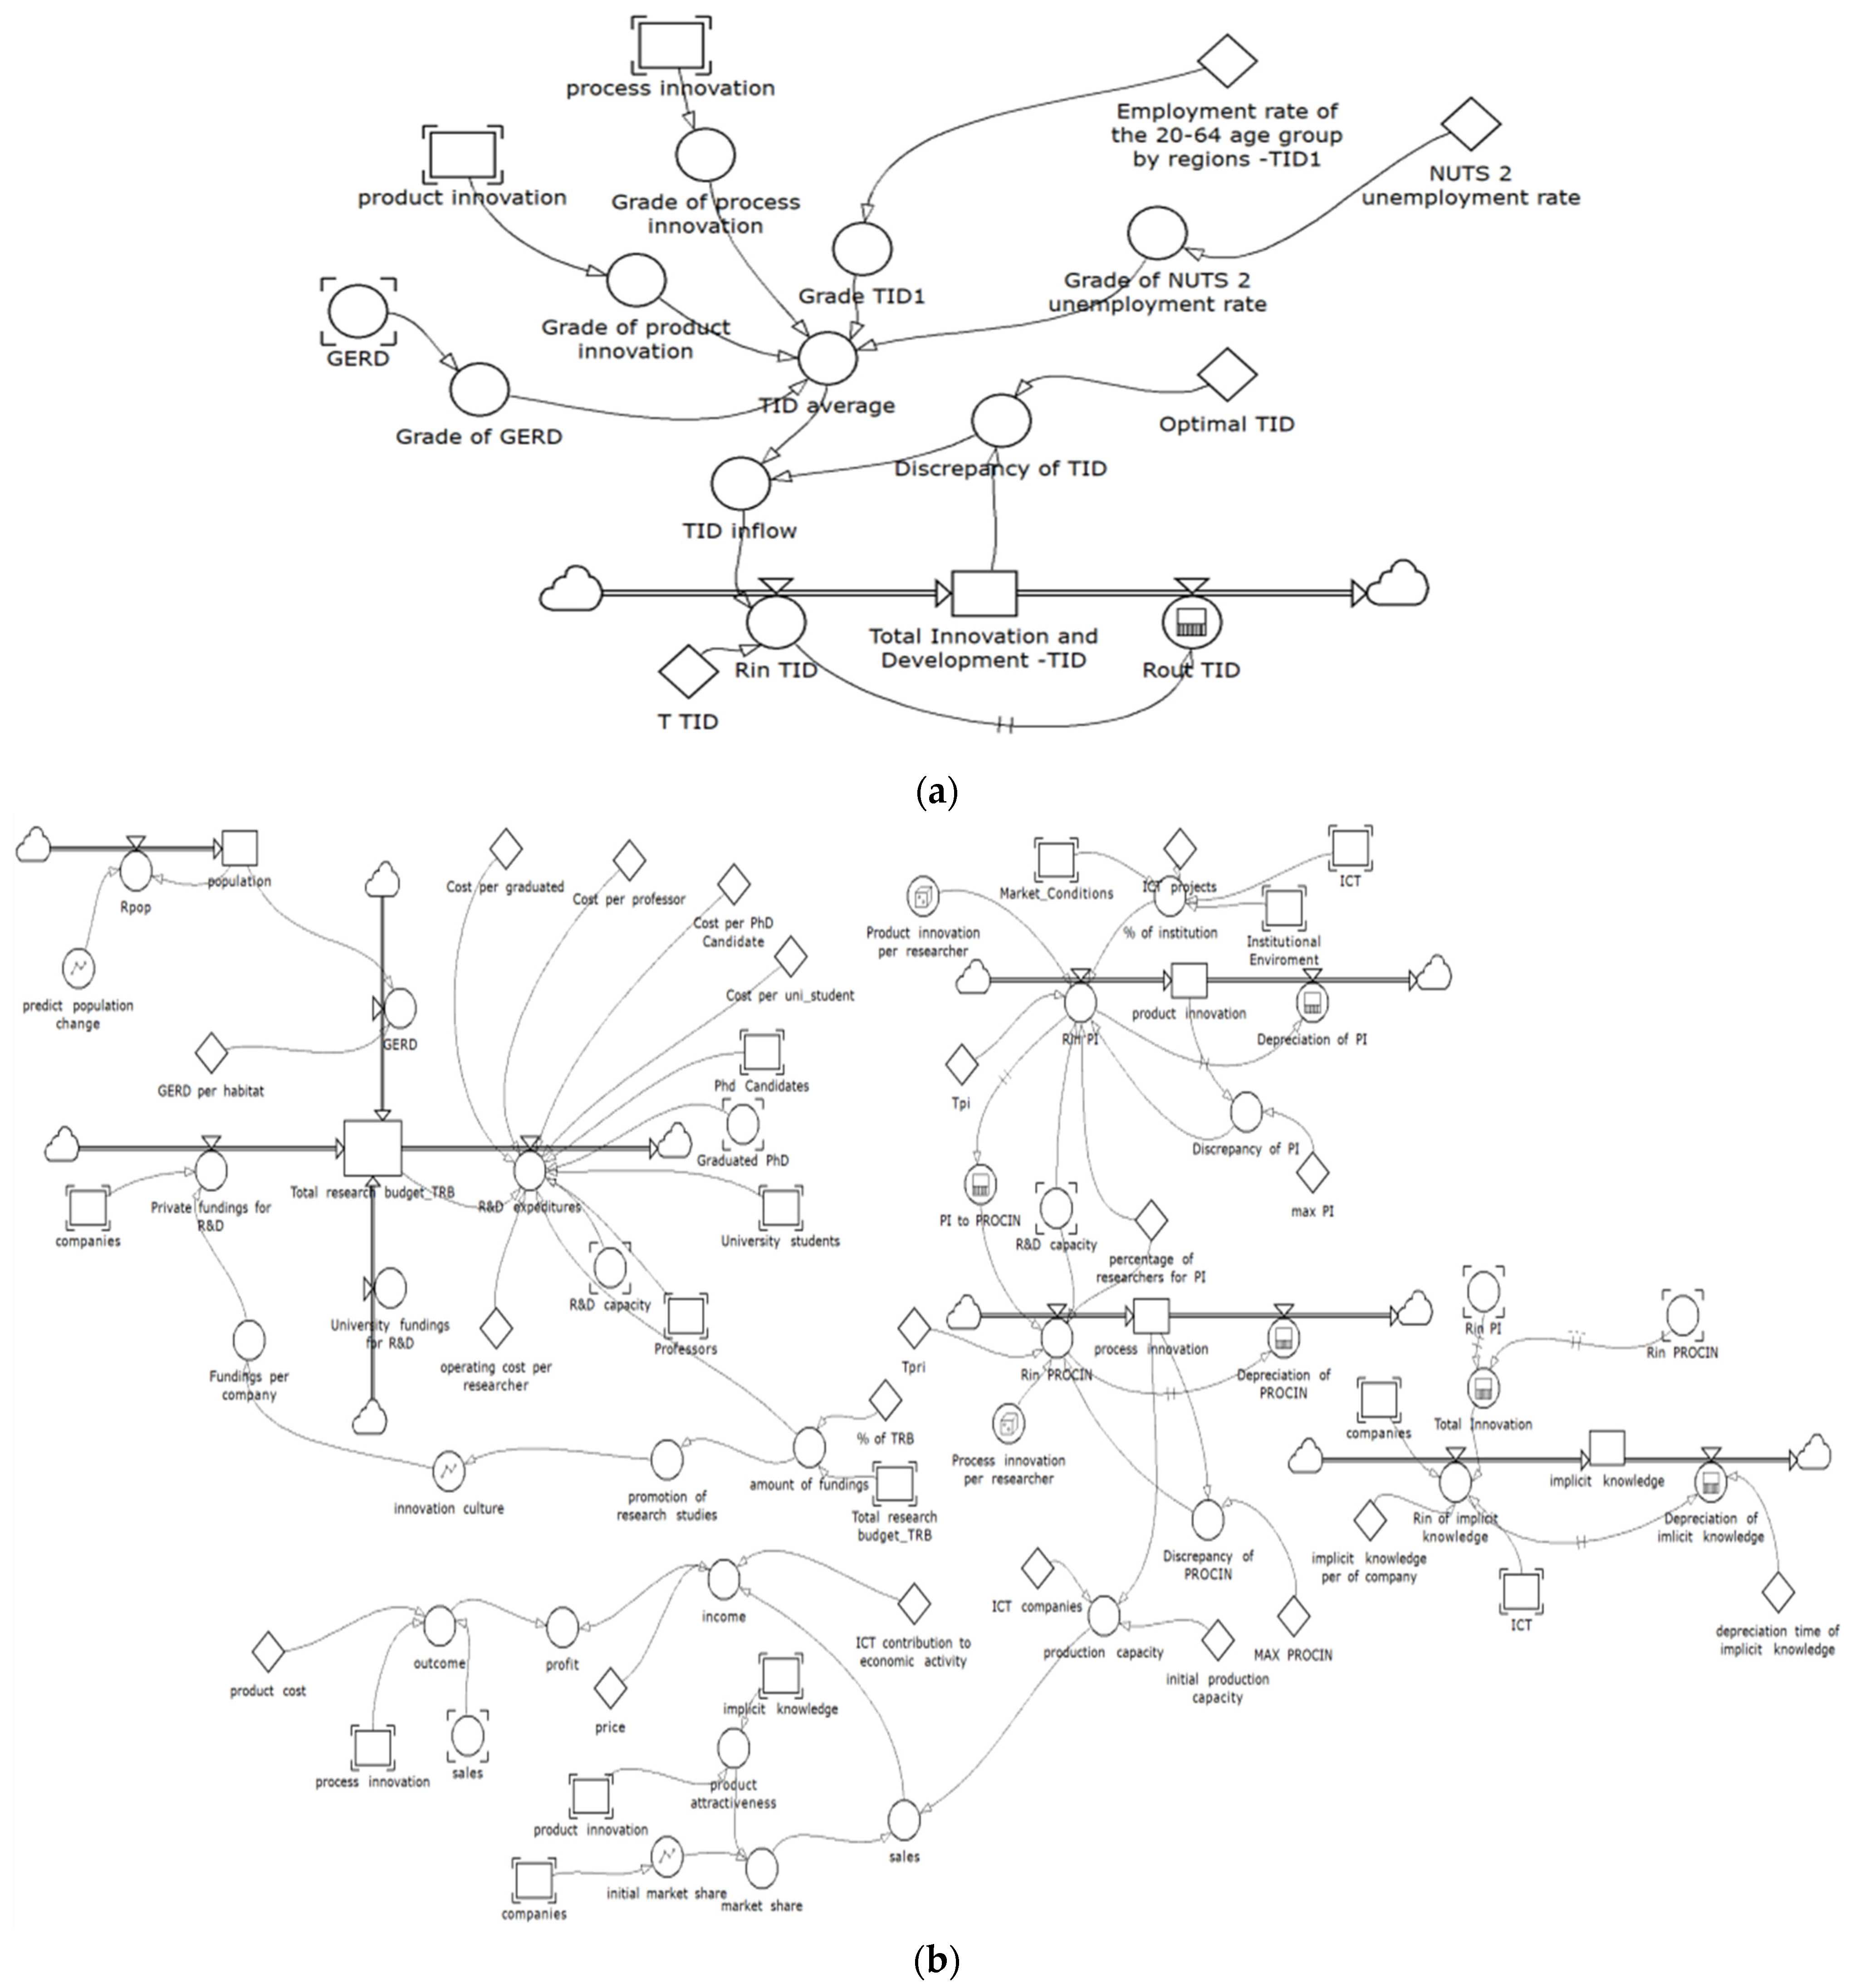
Figure 2. (a) Stock and flow diagram of Innovation and Regional Development subsystem. (b) Stock and flow diagram of Product and Process Innovation. (c) Stock and flow diagram of the ICT subsystem.
Systems 12 00200 g002aSystems 12 00200 g002b
Figure 3. TID_ICTimpact for the percentage of household internet connections = 20% (Central Macedonia).
Systems 12 00200 g003
Figure 4. TID_ICTimpact for the percentage of household internet connections = 60% (Central Macedonia).
Systems 12 00200 g004
Figure 5. TID of best-case combinations (Central Macedonia).
Systems 12 00200 g005
Figure 6. TID_ICTimpact for the percentage of household internet connections = 40% (Western Macedonia).
Systems 12 00200 g006
Figure 7. TID_ICTimpact for the percentage of household internet connections = 80% (Western Macedonia).
Systems 12 00200 g007
Figure 8. TID for best-case scenario combinations (Western Macedonia).
Systems 12 00200 g008
Table 1. Alternative Parameter Values.
Worst-CaseSystems 12 00200 i001Best-Case Scenario
% household internet connections20406080100
ICT specialists in the area 1234567
PC usage1234567
Existence of ICT programs 1234567
Table 2. Best-case scenario combinations (Central Macedonia).
% Household Internet ConnectionsICT Specialists in AreaPC UsageExistence of ICT ProgramsTID_ICTimpact
Average ValueVarianceMax. Value
Best-Case Combination (B.C.)205270.99080.26821.11
437
405620.99080.26821.11
604610.99080.26821.11
803430.99080.26821.11
253
1004320.99080.26821.11
Table 3. Worst-case scenario combinations (Central Macedonia).
% Household Internet ConnectionsICT Specialists in AreaPC UsageExistence of ICT ProgramsTID_ICTimpact
Average ValueVarianceMax. Value
Worst-Case Combination (W.C.)201111.76460.48972.04
401.64090.459111.91
601.43900.40361.67
801.35600.38111.57
1001.28170.35951.49
Table 4. Best-case scenario combinations (Western Macedonia) for the percentage of household internet connections = 20%.
% Household Internet ConnectionsICT Specialists in AreaPC UsageExistence of ICT ProgramsTID_ICTimpact
Average ValueVarianceMax. Value
Best-Case Combination (B.C.)201771.00040.18591.08
276
456
47
573
55
672
36
771
53
35
26
17
Table 5. Best-case scenario combinations (Western Macedonia) for the percentage of household internet connections = 40%.
% Household Internet ConnectionsICT Specialists in AreaPC UsageExistence of ICT ProgramsTID_ICTimpact
Average ValueVarianceMax. Value
Best-Case Combination (B.C.)401761.00040.18591.08
257
374
65
56
455
572
45
36
27
653
35
743
16
Table 6. Best-case scenario combinations (Western Macedonia) for the percentage of household internet connections = 60%.
% Household Internet ConnectionsICT Specialists in AreaPC UsageExistence of ICT ProgramsTID_ICTimpact
Average ValueVarianceMax. Value
Best-Case Combination (B.C.)602641.00040.18591.08
372
63
45
36
27
444
552
34
Table 7. Best-case scenario combinations (Western Macedonia) for the percentage of household internet connections = 80%, 100%.
% Household Internet ConnectionsICT Specialists in AreaPC UsageExistence of ICT ProgramsTID_ICTimpact
Average ValueVarianceMax. Value
Best-Case Combination (B.C.)801461.00040.18591.08
37
254
344
26
17
425
16
533
24
641
14
713
1007121.00040.18591.08
Table 8. Worst-case scenario combinations (Western Macedonia).
% Household Internet ConnectionsICT Specialists in AreaPC UsageExistence of ICT ProgramsTID_ICTimpact
Average ValueVarianceMax. Value
Worst-Case Combination (W.C.)201111.83330.30582.02
401.70270.28531.88
601.49040.25201.65
801.40300.23841.55
1001.28170.35951.49
Disclaimer/Publisher’s Note: The statements, opinions and data contained in all publications are solely those of the individual author(s) and contributor(s) and not of MDPI and/or the editor(s). MDPI and/or the editor(s) disclaim responsibility for any injury to people or property resulting from any ideas, methods, instructions or products referred to in the content.