Article

Spatial Characteristics and Influencing Factors of Intercity Innovative Competition Relations in China

1
School of Architecture and Urban Planning, Nanjing University, Nanjing 210093, China
2
School of Geography and Ocean Science, Nanjing University, Nanjing 210023, China
*
Author to whom correspondence should be addressed.
Systems 2024, 12(3), 87; https://doi.org/10.3390/systems12030087
Submission received: 7 January 2024 / Revised: 29 February 2024 / Accepted: 5 March 2024 / Published: 7 March 2024

Abstract

:
In the knowledge economy era, innovation has become a key emphasis for urban competitions. This paper constructs a theoretical research framework that integrates the basic understandings, influencing factors and ensuing results of intercity innovative competition relations. On the basis of data from the general programs of the National Natural Science Foundation of China from 2005 to 2019, this paper constructs intercity innovative competition relations in China, analyses their spatial distribution and quantitative characteristics, and quantitatively investigates the impact of urban innovation capacity and multidimensional proximity (e.g., geographical proximity, institutional proximity and cognitive proximity) on intercity innovative competition relations through a negative binomial model. The study obtained the following findings: (1) In terms of the overall intercity innovative competition relations, the intensity of China’s intercity innovative competition relations gradually increased from 2005 to 2019, with a spatial clustering towards cities with high administrative ranks (e.g., municipalities directly under the central government, sub-provincial cities and provincial capitals); Beijing is always at the centre of innovative competition relations, but its standing has slightly slipped in recent years. (2) From the perspective of disciplines, cities can become benchmarks in particular fields of innovative competitions by competing according to their disciplinary strengths; intercity innovative competition relations in China vary across various academic disciplines. (3) In terms of influencing factors, urban innovation capacity has significant positive effects on intercity innovative competition relations; geographical proximity, institutional proximity and cognitive proximity all have significant positive effects on innovative competition relations; and interactions occur between multidimensional proximities, including a complementary effect between geographical proximity and institutional proximity, a substitutive effect between cognitive proximity and geographical proximity, and a substitutive effect between cognitive proximity and institutional proximity.

1. Introduction

In the context of economic globalization, competitions among cities for resources and markets are intensifying, leading to an increasing emphasis on intercity competition relations in urban studies [1,2]. Previous studies have always compared the strategic positioning of cities, qualitatively analysed the comprehensive intercity competition relations, and proposed strategies to comply with the competition relations and promote urban development [3,4,5]. In recent years, scholars have proposed a quantitative method for constructing intercity competition relations based on the theory of ecological niche. Based on this method, scholars have empirically explored intercity competition relations in manufacturing [6]. The research findings indicate that distances and political levels of cities impact intercity competition relations. With the advent of the knowledge economy era, China’s economy is increasingly driven by innovation instead of input and investment. Innovation has become an important focus point for urban competitions [3,7]. In this context, the study of intercity innovative competition relations is of great value in guiding urban innovation development.
The theories of innovative competition have a long history. Since the 1970s, scholars belonging to the Neo-Schumpeterian School, such as Kamien and Schwartz, have discussed the two-sided effects of the impact of innovative competition relations on enterprise innovation. Although monopolistic enterprises are capable of technical innovation, they are unable to motivate significant innovation because they are not threatened by competitors, which prevents large technological breakthroughs. However, when innovative competitions are excessively intense, enterprises are generally limited in scale, making them difficult to raise the funds needed for innovation, and also challenging to develop the broad markets required for innovation, thus hindering significant innovation [8,9]. Porter’s externality theory, on the other hand, proposed that innovation benefits from knowledge spillovers generated by competitions [10]. Subsequently, scholars have explored the forms and characteristics of innovative competitions around innovation entities such as enterprises and universities. They proposed that innovative competitions, which manifest as competitions for rare innovation resources, can cause mutual incentives and learning among innovation entities [11,12]. Excessive competitions may cause small-sized innovation entities to lose confidence in winning, resulting in a slacking attitude [13]. Competition failures may also result in talent losses [14]. Based on these theories, this paper proposes that innovative competitions are the competitions for rare innovation resources (e.g., markets, funds, and talents). Moderate innovation competitions can stimulate motivation and knowledge spillovers and continuously drive innovation.
Currently, studies on innovative competition relations have primarily concentrated on micro-scale innovation entities such as individuals [13], universities [11], and enterprises [15]. Scholars have conducted substantial research on the construction, structural characteristics, and performance impact of innovative competition relations among micro-level entities. Two approaches have emerged for the construction of innovative competition relations: the first one is to construct innovative competition relations by weighing the frequency of direct contests in activities related to interest division [13]; the second one is to reflect competitions through similarity, measuring potential innovative competition relations by examining the similarity in funding distribution and patent application topics [11,16,17]. In terms of structural characteristics, previous studies have always started from the development behaviours of micro-level entities such as enterprises, analysed the quantitative characteristics of innovative competition relations among these micro-level entities, and identified key innovation competitors [16,17,18,19]. For example, Luo discovered that Baidu’s strongest innovation competitors in the field of autonomous driving are Huawei and LG [19]. In terms of performance impact, scholars have used quantitative models such as negative binomial regression models and multiple regression models to investigate the impact of the centrality and intensity of innovative competitions on innovation performance [11,13].
In conclusion, current studies have made some progress, but there are still some research gaps: (1) Studies on intercity competition relations have placed little emphasis on innovative competition relations. As the competitive advantages of cities have shifted towards innovation-driven, knowledge and technology become the most important resources. It is crucial to focus on the dimension of innovation, clarify the current status of intercity innovative competition relations, and provide guidance for the healthy and sustainable development of intercity innovative competition relations. (2) Studies on innovative competition relations mostly focus on micro-level entities, with few studies exploring intercity innovative competition relations at the macro level. Moreover, studies on innovative competition relations among micro-level entities have not yet been separated from the perspective of individual development to yield more general findings. Cities serve as incubators of innovation, providing essential spaces and human capital for innovation. The innovation of micro-level entities is nurtured within cities [20,21] and is influenced by macro-level innovation development strategies. Therefore, it is necessary to extend the study of innovative competition relations to the intercity level. Based on this, the paper interprets the basic understandings, influencing factors, and ensuing results of intercity innovative competition relations. On the basis of data from the general programs of the National Natural Science Foundation of China, this paper constructs intercity innovative competition relations in China and conducts an in-depth analysis of the spatial characteristics and influencing factors of intercity innovative competition relations.

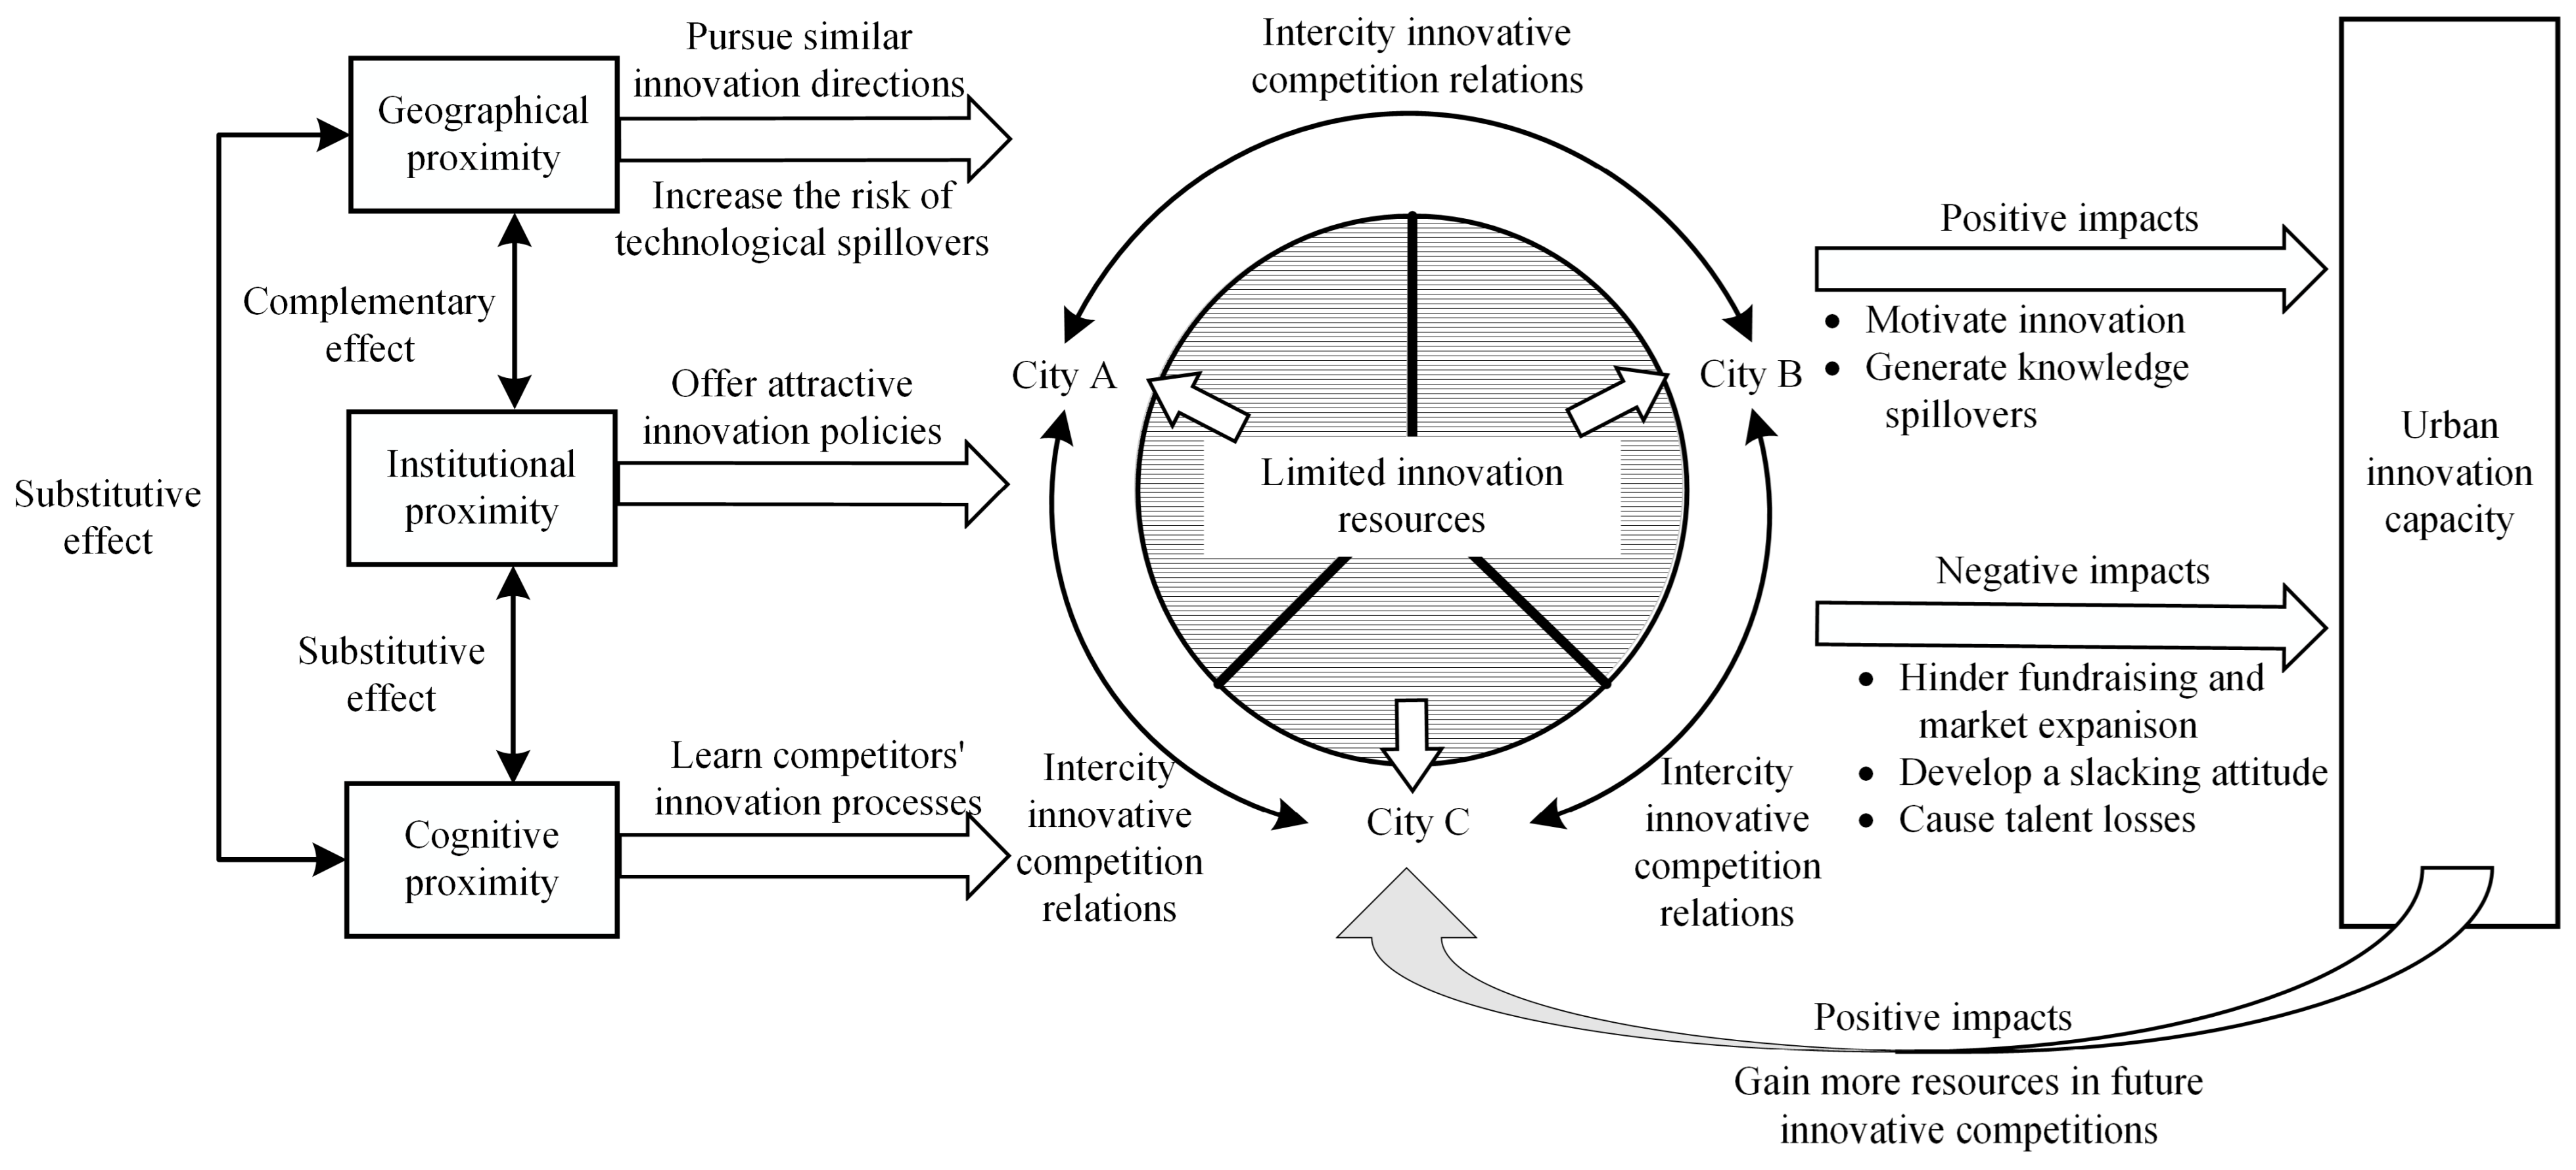
2. Theoretical Framework

This paper constructs a theoretical research framework that integrates the basic understandings, influencing factors and ensuing results of intercity innovative competition relations (Figure 1).
In terms of the basic understandings of intercity innovative competition relations, this paper proposes that intercity innovative competition relations manifest as cities competing for limited innovation resources (e.g., markets, funds, and talents). Due to the finite nature of these innovation resources, cities will compete with each other to gain a larger share of innovation resources. When one city successfully gains innovation resources, it will take up the slot that other cities can obtain, resulting in intense innovative competition relations among cities.
Intercity innovative competition relations are influenced by multidimensional proximity. According to multidimensional proximity theory of evolutionary economic geography, the degree of knowledge interaction between entities and the degree of similarity between entities are closely related [22]. Geographical proximity is the level of spatial proximity between various entities. Cities with close spatial distances always share similar resource endowments and natural environments. In order to exploit comparable resource advantages and solve consistent environmental challenges, cities with close spatial distances may pursue similar innovation directions. In addition, nearby cities have lower costs of interaction and communication, making them easier to obtain information about their competitors, which may also increase the risk of technological spillovers on their own [11], thus magnifying innovative competitions. Institutional proximity is firstly used to describe how much various entities’ policy regimes resemble each other [23]. However, innovation development in China is always actively guided by the governments, with characteristics of administrative hierarchy. Cities with higher administrative ranks (e.g., municipalities directly under the central government, sub-provincial cities and provincial capitals) are in better positions to offer more attractive innovation policies [24] and intensifying innovative competitions. Cognitive proximity refers to whether different entities have similar cognition, interpretations and evaluations when faced with the same situations, reflecting the degree of similarity in knowledge backgrounds [25]. Similar knowledge backgrounds will make cities easier to learn the competitors’ innovation processes and more inclined to compete for scarce research resources [11]. Theoretically, the influence of multidimensional proximity on intercity innovative competition relations may be intertwined. Geographical proximity may maintain or strengthen the benefits of institutional proximity (complementary effect), enabling the formation of intercity innovative competition relations through complementary mechanisms. Cognitive proximity may substitute for geographical proximity and institutional proximity (substitutive effect), reducing the ‘friction costs’ of spatial and institutional distance, thus fostering innovative competition relations among cities with spatial distances and institutional heterogeneity.
Intercity innovative competition relation is a double-edged sword for urban innovation capacity while urban innovation capacity serves as the driving force behind intercity innovative competition relations. On the one hand, the existence of competitors encourages cities to consistently pursue innovation. Cities will attempt to comprehend the innovation patterns of their competitors, engage in imitation and learning, and generate knowledge spillovers in this process [10], all of which will promote urban innovation capacity. On the other hand, excessive competitions will weaken cities’ strengths in financial support and market expansion, making them difficult to achieve significant innovation [8,9]. Excessive competitions may also lead to a loss of confidence and a slacking attitude, thereby hindering innovation [13]. Meanwhile, as the results of competitions can be won or lost, some cities may experience talent losses after failing in innovative competitions, leading to a decrease in their innovation capacities [14]. Urban innovation capacity, as the driving force of intercity innovative competition relations, provides cities with sufficient advantages to launch new rounds of innovative competitions, enabling them to gain more resources in future innovative competitions, which further promotes the formation of intercity innovative competition relations.

3. Materials and Methods

3.1. Data Sources

Funding competition is an important aspect of innovative competition. This paper selects data from the general programs of the National Natural Science Foundation of China (NSFC), which have limited budgets, to construct intercity innovative competition relations in China. The NSFC invests only a certain amount of money in each discipline annually, which is why programs compete with each other to obtain more funding [11]. If these programs belong to different universities and research institutions, then innovative competition relations are formed between these universities and research institutions. Intercity innovative competition relations can be viewed as the macro spatial depiction of cross-city innovative competitions among micro-level entities. If these universities and research institutions are located in different cities, intercity innovative competition relations are also formed between these cities.
As the funding for a general program of NSFC is mostly around 600,000 RMB, with a generally balanced allocation, this study used the number of direct competitions between programs in different cities as the weight to construct intercity innovative competition relations in China. As illustrated in Figure 2, the first step is to identify all NSFC programs, the universities and research institutions to which they belong, and the cities where they are located. The second step is to calculate the number of direct competitions between cities in a discipline. Since programs will compete with other programs in the same discipline for limited funding, if there are m programs located in city i and n programs located in city j within a particular discipline, then city i and city j would have engaged in m × n innovative competition instances in that discipline. Finally, the total number of intercity innovative competition instances across all disciplines is aggregated to construct the intercity innovative competition relations in China.
This paper collects data from the general program of NSFC from 2005 to 2019, including project names, disciplinary categories and affiliated institutions. The data was obtained from the LetPub website (http://www.letpub.com.cn/, accessed on 30 April 2023). As the funding scope of NSFC is limited to the Chinese Mainland, the data does not include Hong Kong, Macao and Taiwan. This paper separated the data into three time windows—2005–2009, 2010–2014 and 2015–2019—because of the randomness and fluctuation of the number of general programs each year in different cities.

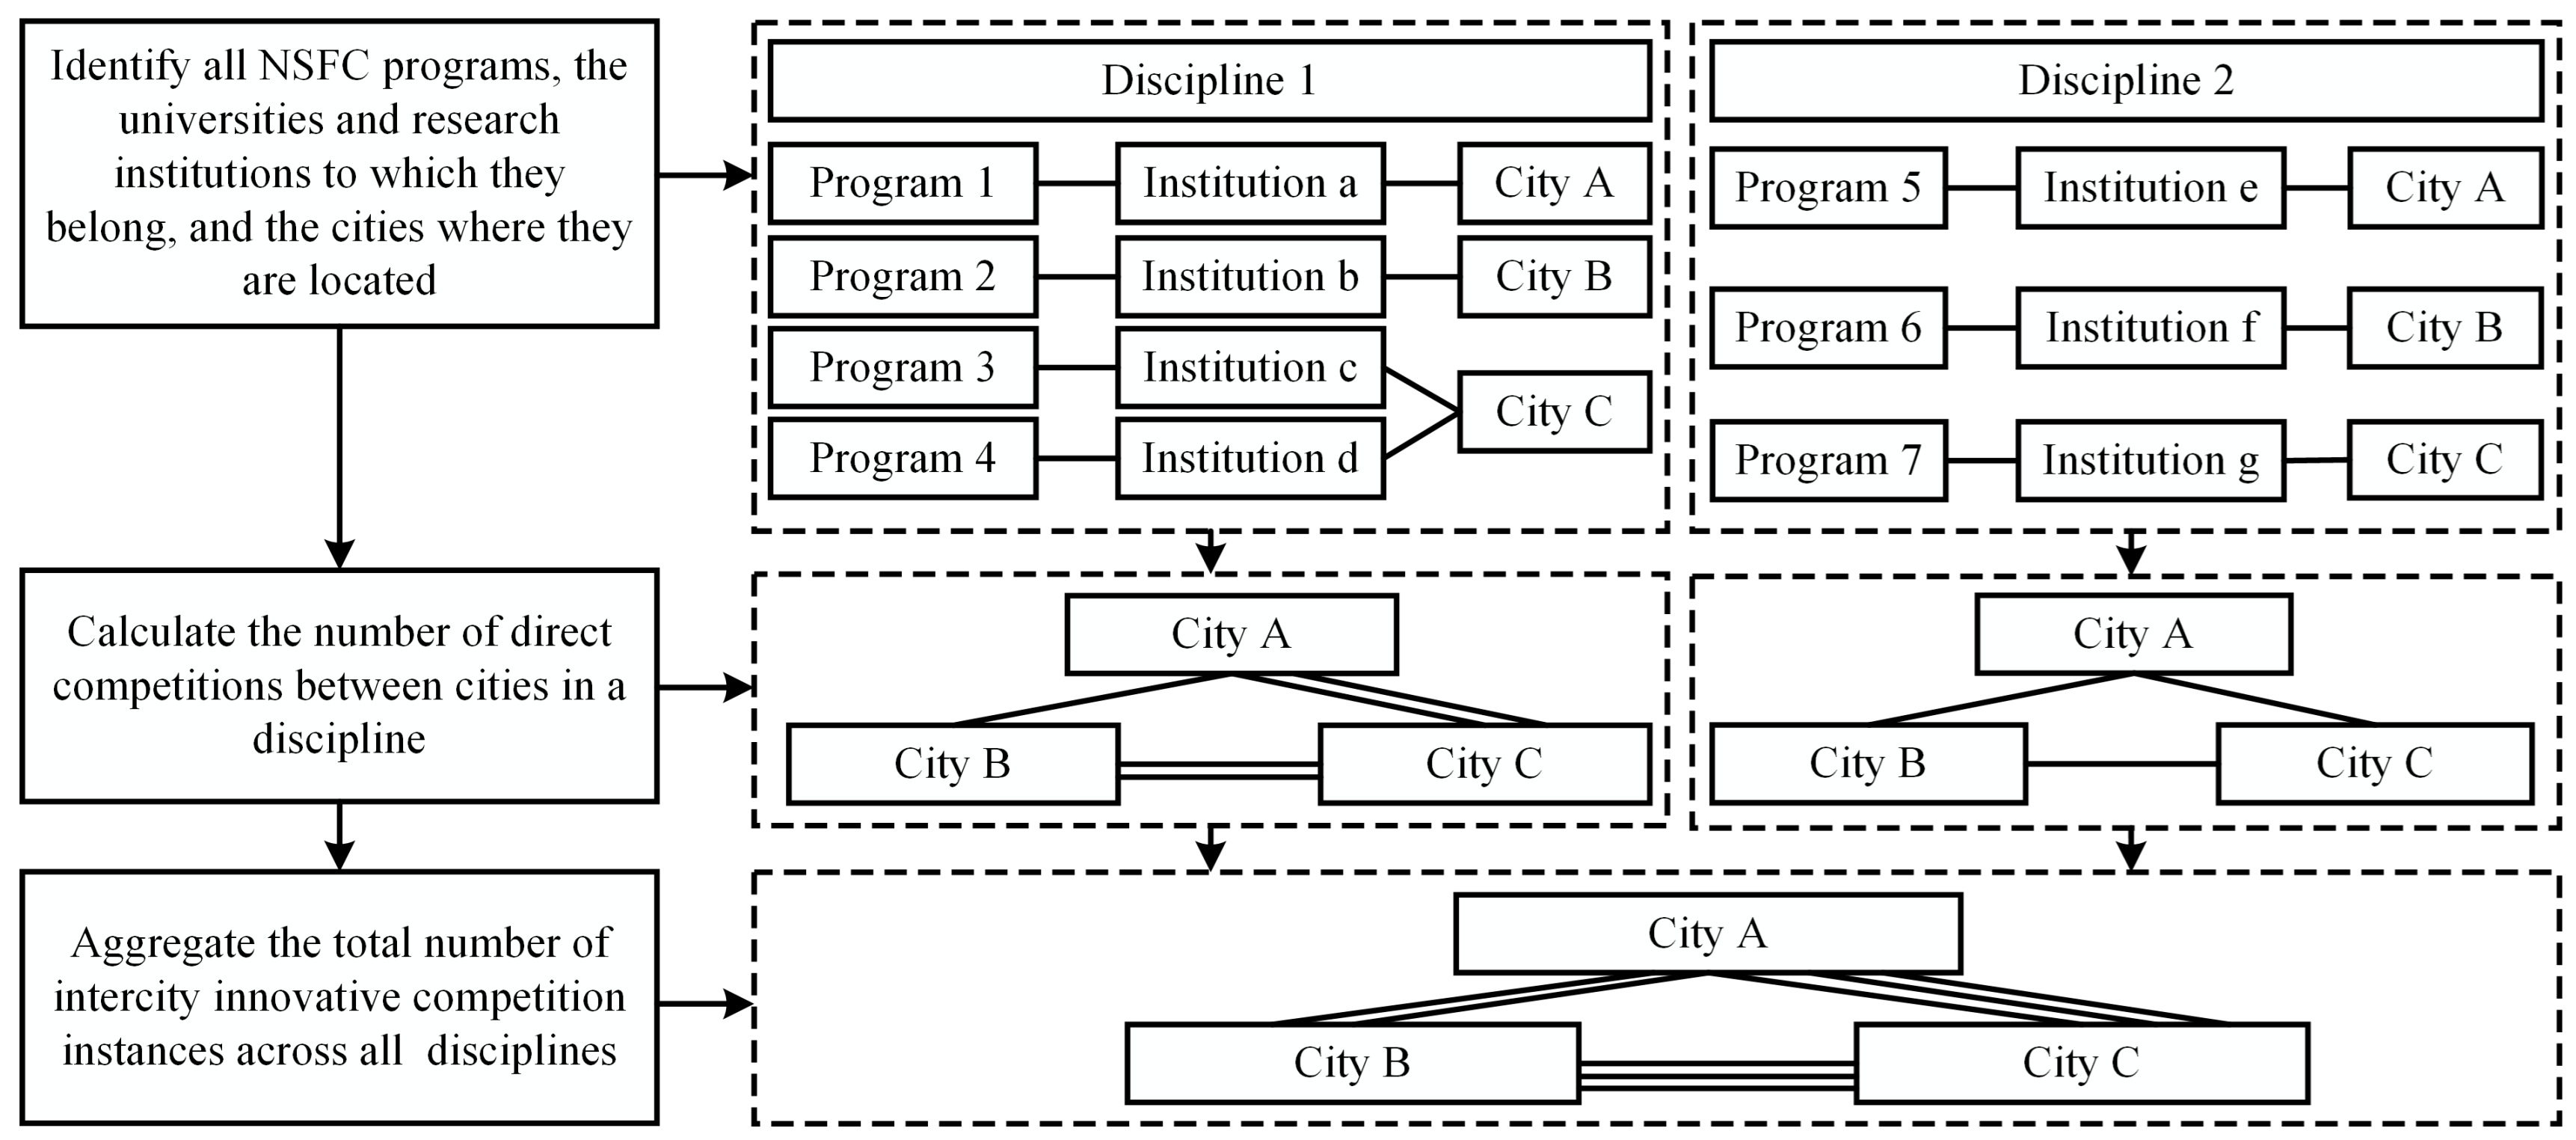
3.2. Research Methods

3.2.1. Social Network Analysis

Social network analysis is a method for studying the characteristics of networks from a relational perspective. In this study, we used social network analysis to investigate the characteristics of intercity innovative competition relations. The indicators of social network analysis are shown in Table 1.

3.2.2. Negative Binomial Regression Model

Since the dependent variable of this paper is the number of intercity innovative competitions, which is a countable variable, and the number of programs funded by NSFC varies greatly by city, the variance of the dependent variable is significantly higher than the expectation, indicating the presence of overdispersion. Thus, the use of a negative binomial regression model is appropriate to identify the influencing factors of intercity innovative competition relations [26]. The equation for this model is represented as follows:
R i j = α + β 1 U I C + β 2 G E O i j + β 3 I N S i j + β 4 C O G i j + β 5 C A P + β 6 R D I + ε i j
where α is the constant term, β 1 , β 2 …… β n are the regression coefficients of the independent variables; and ε i j is the random error term.
The independent variables consist of four components. The first set of independent variables is urban innovation capacity (UIC). This paper measures UIC by multiplying the number of applications for the general programs of NSFC between pairs of cities.
The second set of independent variables is the multidimensional proximity variables. This paper follows three types of proximity: geographical proximity, institutional proximity and cognitive proximity. The measurement methods of these multidimensional proximity variables are shown in Table 2.
The third set of independent variables is the interaction terms of multidimensional proximity, which are the products of pairwise combinations of geographical proximity, institutional proximity and cognitive proximity, reflecting the interaction effects between multidimensional proximity [29,30]. If the coefficient of the interaction term is negative, then a substitutive effect occurs between the two proximity variables; if it is positive, then a complementary effect occurs. All interaction term variables are centred before multiplication to minimise the issue of covariance between the interaction term variables and the independent variables.
The fourth set of independent variables is the control variables. This paper sets two control variables after synthesising previous research [31,32]. The first variable is human capital (CAP). Talents are the main executors of scientific research. The aggregation of talents can promote knowledge innovation and technology transfer. More abundant human capital corresponds to stronger innovative competitions of the city. This paper measures CAP by multiplying the number of scientific research, technical service and geological survey personnel between pairs of cities. The second variable is R&D investment (RDI). R&D investment is the booster of urban innovation and development. The level of R&D investment largely reflects the competitive advantage in urban innovation. This paper measures RDI by multiplying the ratio of scientific expenditures to local fiscal budget expenditures in pairwise cities. The above data are derived from the China City Statistical Yearbook and are represented by the average of five-year data for each city during the periods of 2005–2009, 2010–2014 and 2015–2019.

4. Results

4.1. Characteristics of Intercity Innovative Competition Relations in China

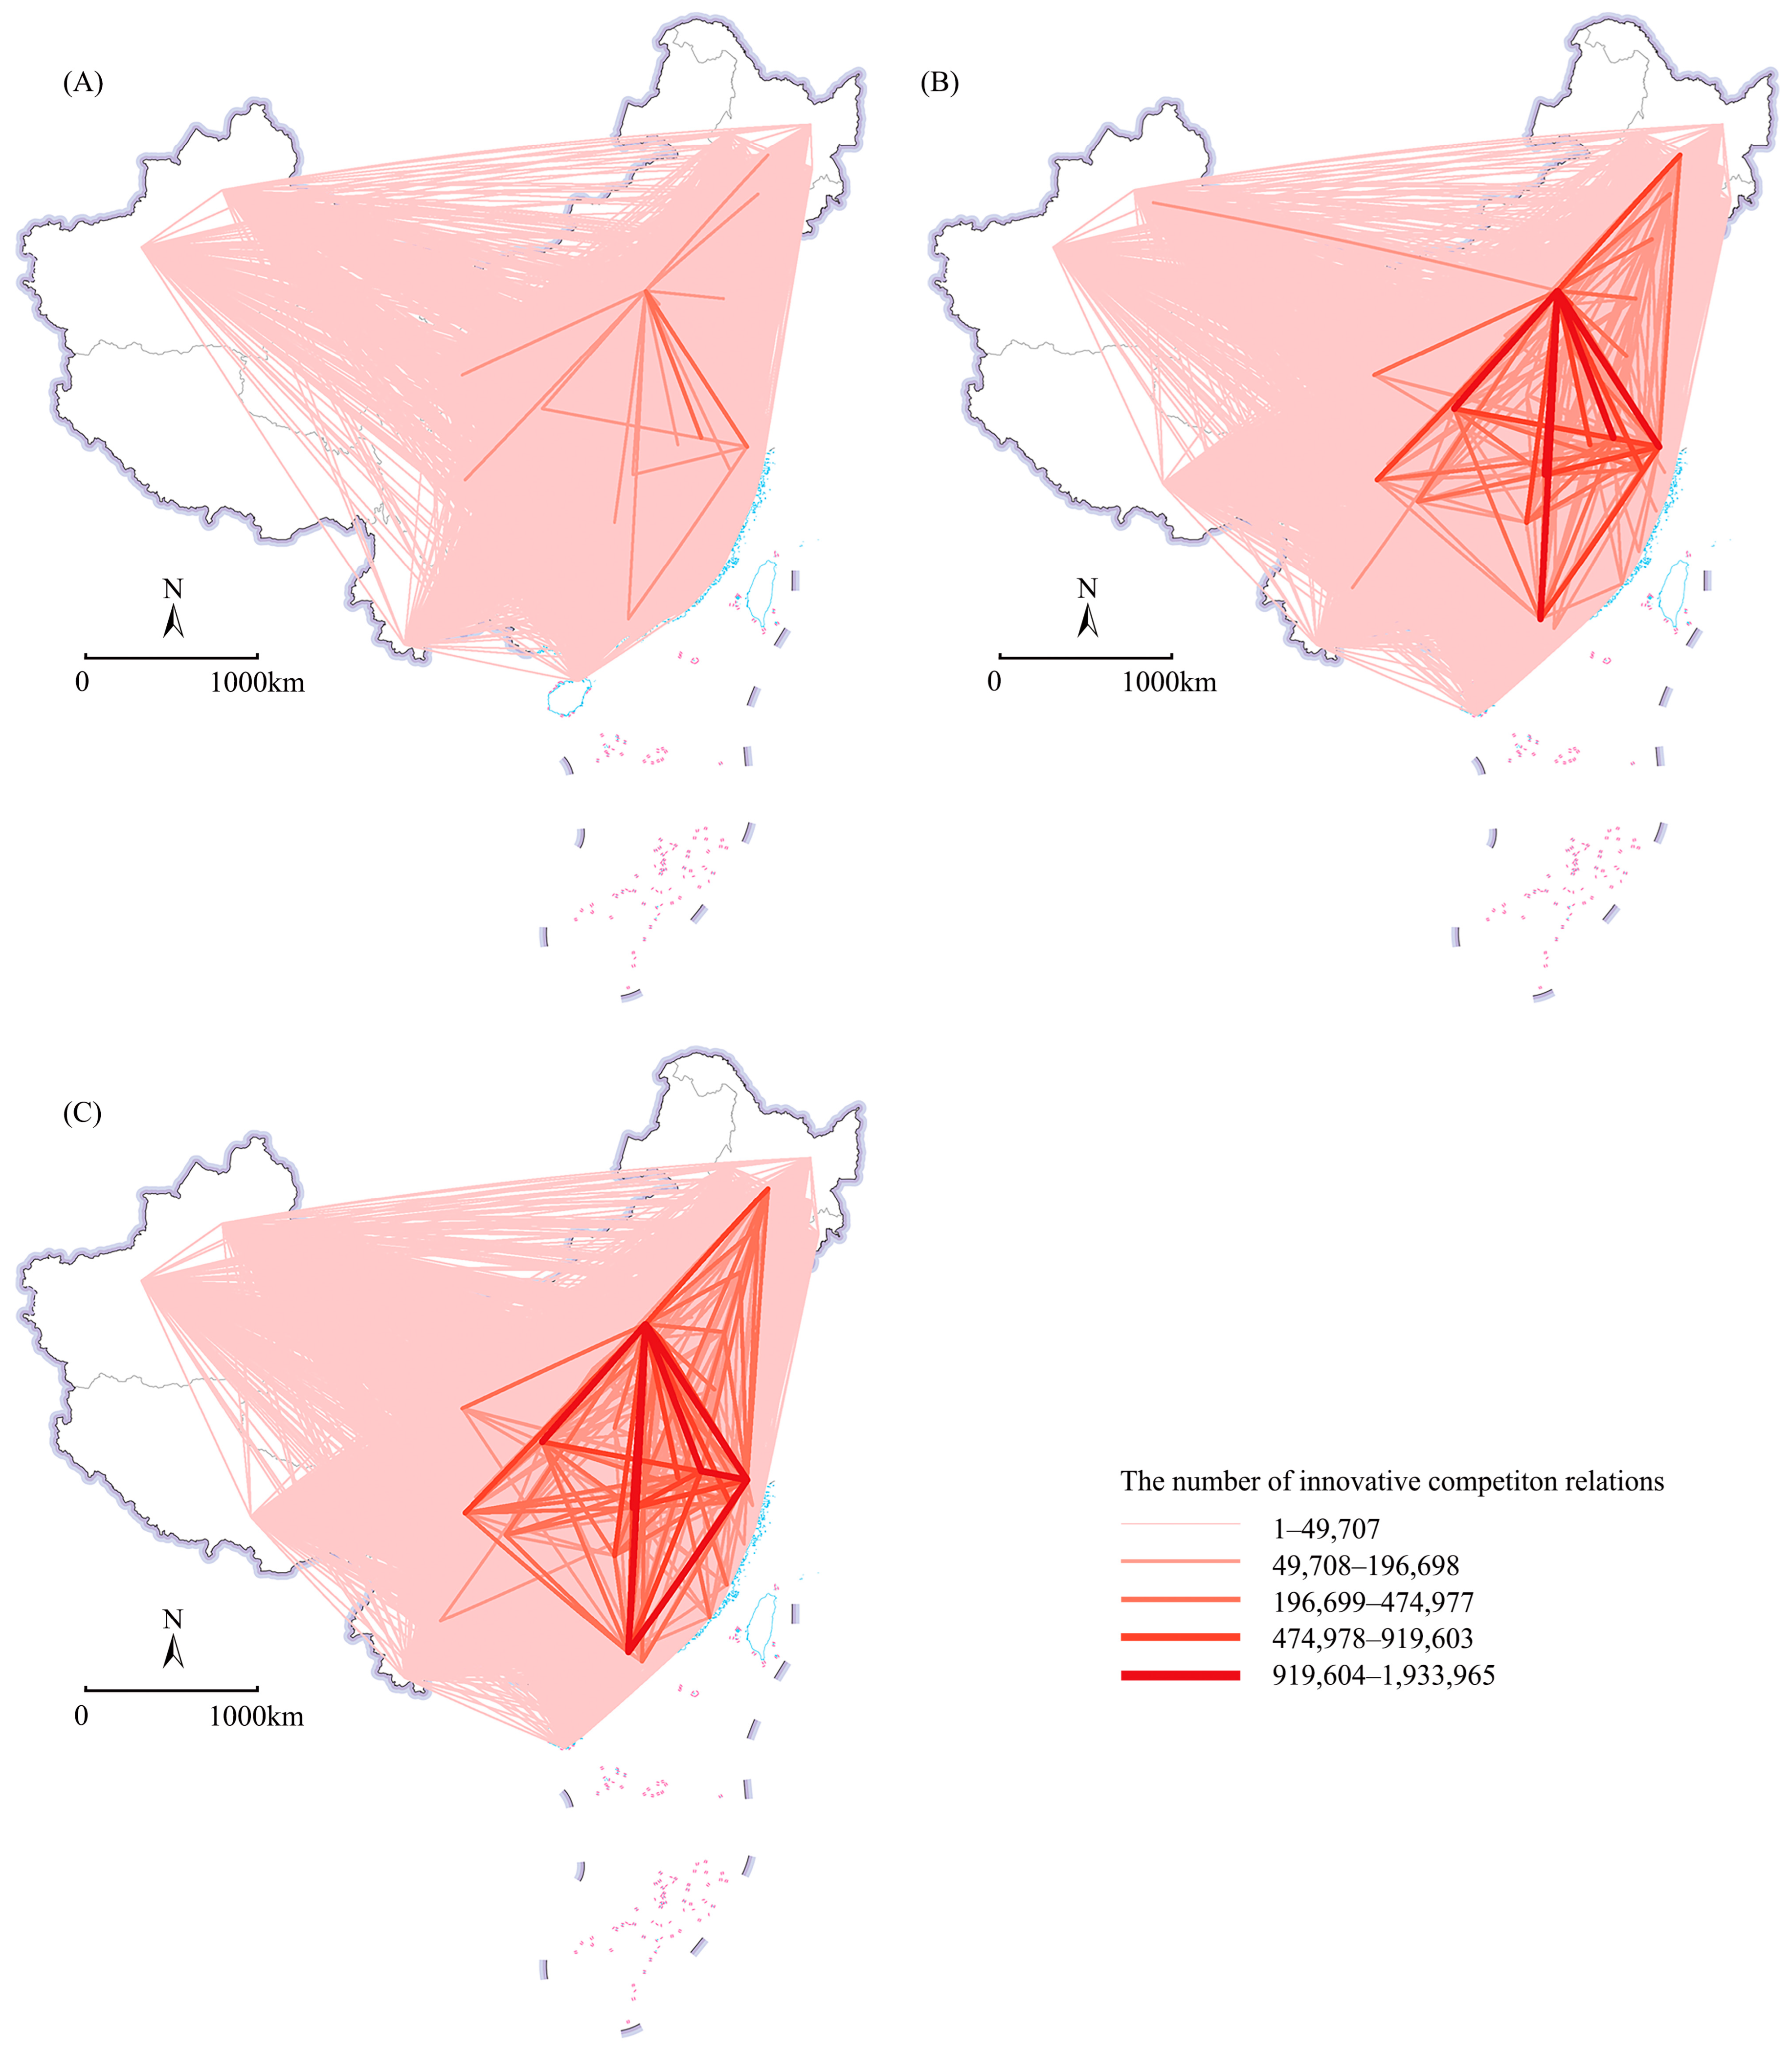
4.1.1. Gradually Rising Intensity of Intercity Innovative Competition Relations in China

The analysis of the quantitative characteristics and social network indicators of China’s intercity innovative competition relations (Table 3) reveals that from 2005 to 2019, the number of intercity innovative competition relations in China increased by 11.5 times, while the number of cities involved in innovative competition relations in China increased from 150 to 197, and the network density increased from 0.15 to 0.28, indicating that the intensity of intercity innovative competition relations in China gradually increased. Since the 18th National Congress, China has vigorously implemented innovation-driven development. The 19th National Congress report also made significant decisions to establish a global leader in science and technology. It suggests focusing on the forefront of global science and technology, advancing fundamental research and making significant strides towards innovative and forward-thinking basic research. As innovation-related strategies and policies continued to be implemented in China, universities and research institutions in various cities focused on the frontiers of science and technology and conducted innovative research. As a result, intercity innovative competitions intensified.

4.1.2. Clustering of Intercity Innovative Competition Relations in China towards Cities with Higher Administrative Ranks

Figure 3 depicts the spatial pattern of innovative competition relations in China from 2005 to 2019. The pattern shows a concentration towards cities with high administrative ranks (e.g., municipalities directly under the central government, sub-provincial cities and provincial capitals).
The percentage of Chinese cities with high administrative ranks in intercity innovative competition relations from 2005 to 2019 was analysed, and the results are shown in Table 3. While the percentage of Chinese cities with high administrative ranks in intercity innovative competitions is on the decline, it still remains high, suggesting that institutional hierarchy may affect intercity innovative competition relations. Universities and research institutions are usually clustered in cities with high administrative ranks, forming close innovative competition relations. In addition, cities with high administrative ranks have stronger support from the governments, thereby motivating the development of innovation through a range of policies and initiatives and encouraging universities and research institutions in these cities to compete in innovation.
With regard to individual city nodes, the top 10 cities in terms of centrality in innovative competitions from 2005 to 2019 were all cities with high administrative ranks (Table 4). Beijing, Shanghai and Nanjing routinely hold the top three spots, attracting a large number of innovative talents because of the abundance of universities and research institutions, resulting in fierce innovative competitions. From 2005 to 2019, the centrality of innovative competitions increased in Guangzhou and Changsha but decreased in Wuhan, Xi’an and Hefei.
For analysis, the top 1, 3 and 10 connected cities are chosen based on the quantity of innovative competitions for each city node. Table 5 lists the cities in the top 1, 3 and 10 innovative competition relations of other cities. The numbers in parentheses indicate how many cities consider the listed city as their top 1, 3 or 10 city nodes for innovative competitions. The cities involved in the top 1, 3, and 10 innovative competition relations are all cities with high administrative ranks, thereby further verifying that innovative competition relations are dominated by cities with high administrative ranks in China.

4.1.3. Beijing at the Centre of Innovative Competition Relations, yet with a Slight Decline in Its Position

Most cities’ top 1 innovative competition relations are centred on Beijing, according to statistical analysis of the top 1 relations. As the centre of science and culture in China, Beijing has unique advantages. It benefits from active government funding, vibrant innovation atmospheres, numerous universities and research institutions, concentrated high-quality talents, high outputs of core research papers and comprehensive coverage of research across diverse domains of knowledge. These elements contribute to its remarkable innovative competitiveness [33]. Therefore, universities and research institutions in Beijing are able to form innovative competition relations with those in other cities. From 2005 to 2019, Beijing’s position in top-level innovative competition relations declined slightly. Beijing’s proportion of top 1 relations was 98%, 96% and 91% in 2005–2009, 2010–2014 and 2015–2019, respectively, showing a slight decline over time. Table 6, which depicts the innovative competition relations between the top 10 city pairs in 2005–2019, reveals the following trends: From 2005 to 2009, the 10 strongest innovative competition relations in China were all related to Beijing. However, in the following decade, other city pairs with high administrative ranks, such as Guangzhou and Shanghai, and Nanjing and Shanghai, emerged at the forefront of innovative competition relations. A rising number of cities are concentrating on establishing themselves as technology and innovation centres, hence intensifying innovative competition relations [34].

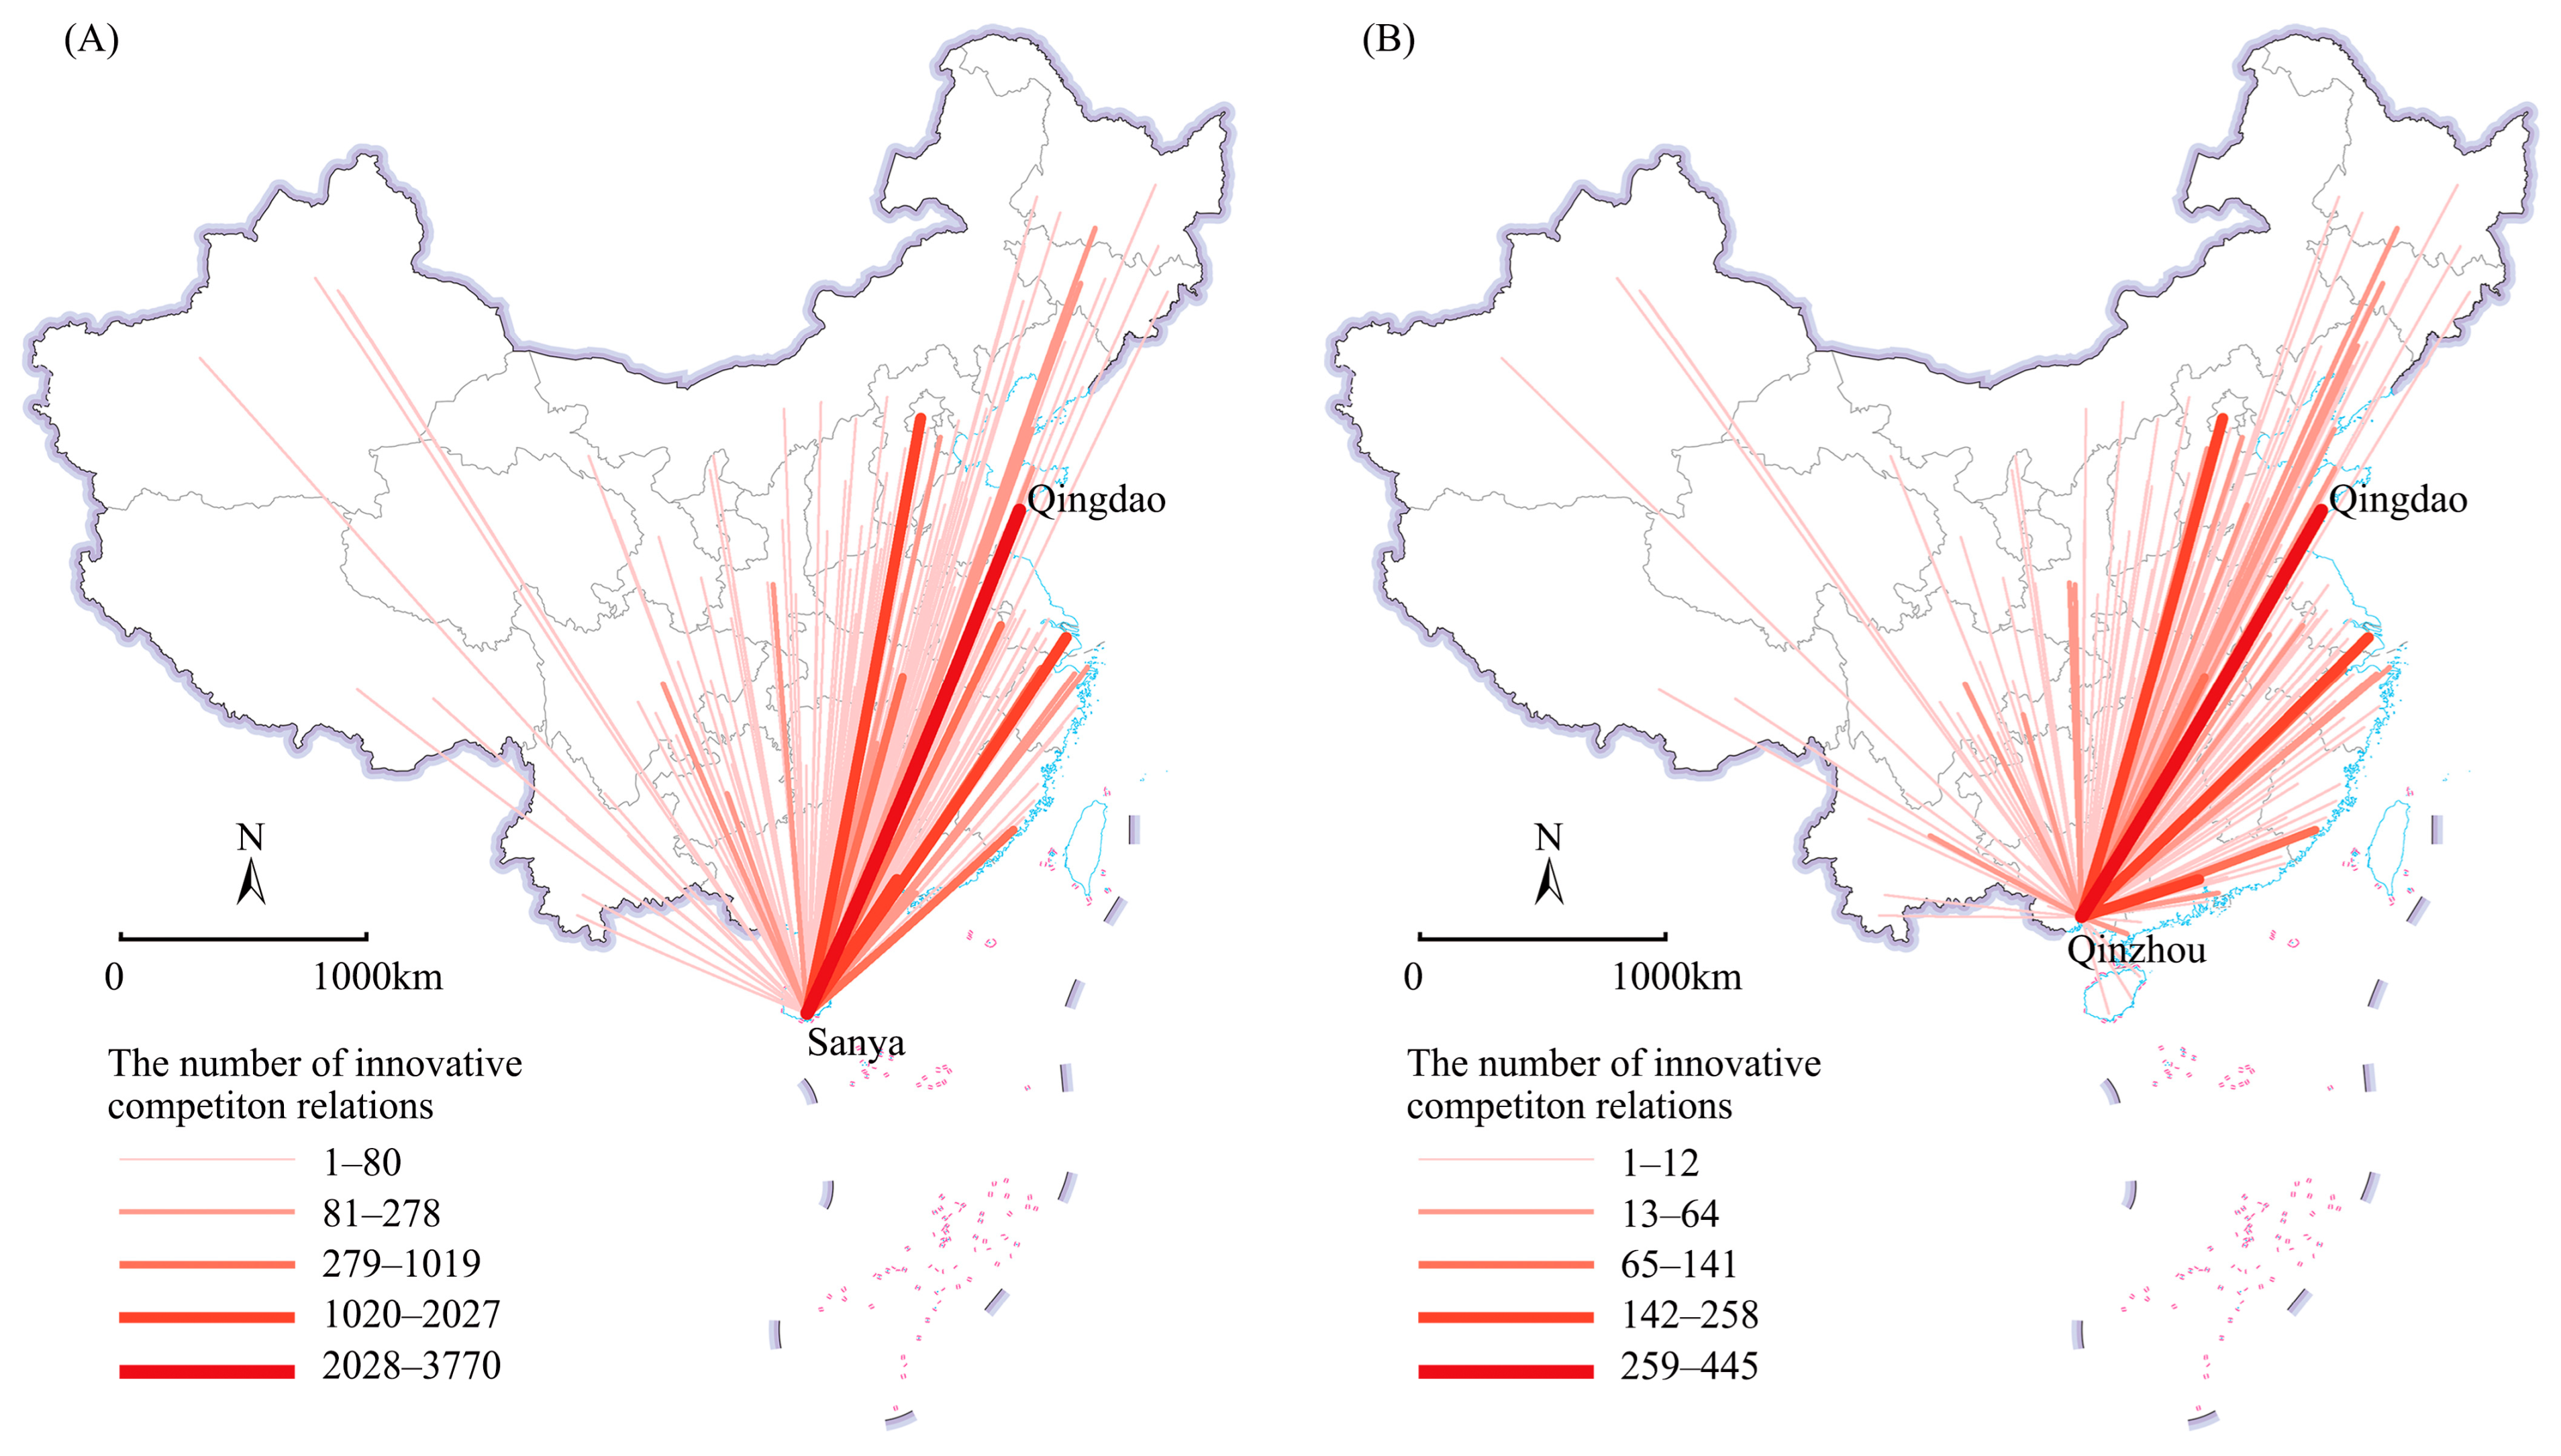
4.1.4. Cities as Benchmarks in Innovative Competitions by Fully Leveraging Disciplinary Strengths in Competitions

Apart from cities that serve as scientific and cultural centres that possess strong innovative competitiveness, some cities have evolved as leaders in innovative competitions by competing on the basis of their disciplinary strengths. Table 5 shows that in 2010–2014 and 2015–2019, two cities’ universities and research institutions competed strongly with those in Qingdao. They are Sanya in Hainan Province and Qinzhou in Guangxi Province (Figure 4). Based on an examination of the particular disciplines in which Qingdao and the two cities’ universities and research institutions engaged in innovative competitions, it is discovered that from 2015 to 2019, the field of marine science saw the highest concentration of innovative competitions between Qingdao’s universities and research institutions and those in Sanya and Qinzhou, at 97.45% and 75.06%, respectively. Qingdao, Sanya and Qinzhou are located on the coast, with abundant marine resources and well-developed marine industry chains. Therefore, universities and research institutions of these cities have more practical opportunities for marine technology innovation, resulting in fierce innovative competitions. This finding indicates that cognitive proximity is also a significant factor in shaping intercity innovative competition relations in China. More importantly, Qingdao has risen to the top of innovative competitions by leveraging its strengths in the field of marine science, demonstrating that cities have the potential to become benchmarks in innovative competitions in specific fields by fully leveraging their disciplinary strengths in competitions. This finding opens up new development opportunities for cities with special disciplinary advantages.

4.1.5. Higher Average Number of Innovative Competitions between Cities That Are Geographically Close to Each Other

The average number of innovative competitions between cities at close spatial distances is higher under the same institutional relationship, according to an analysis of the average number of innovative competitions between cities of different distances from 2005 to 2019 (Table 7). This finding suggests that geographical proximity affects intercity innovative competition relations in China. This may be due to the fact that similar resource endowments exist in geographically close cities, prompting universities and research institutions to engage in innovation in the same direction to explore these resources. For example, Fuxin and Daqing, located in the north-eastern region of China, are rich in mineral resources, leading to intense innovative competitions among their universities and research institutions in metallurgy and mining. Additionally, cities with close spatial distances often have similar natural environments and face consistent environmental challenges such as soil erosion and fragile ecological environments. This prompts their universities and research institutions to solve the challenges through similar innovation paths. For instance, Lanzhou and Xi’an, located around the Loess Plateau, are facing similar challenges like geological fragmentation and soil erosion, resulting in innovative competitions among their universities and research institutions in environmental earth sciences. Furthermore, geographical proximity may also increase the risk of unconscious spillover of tacit knowledge to other cities [35], making it easier for universities and research institutions in adjacent cities to acquire competitors’ key technologies, thus intensifying innovative competitions.

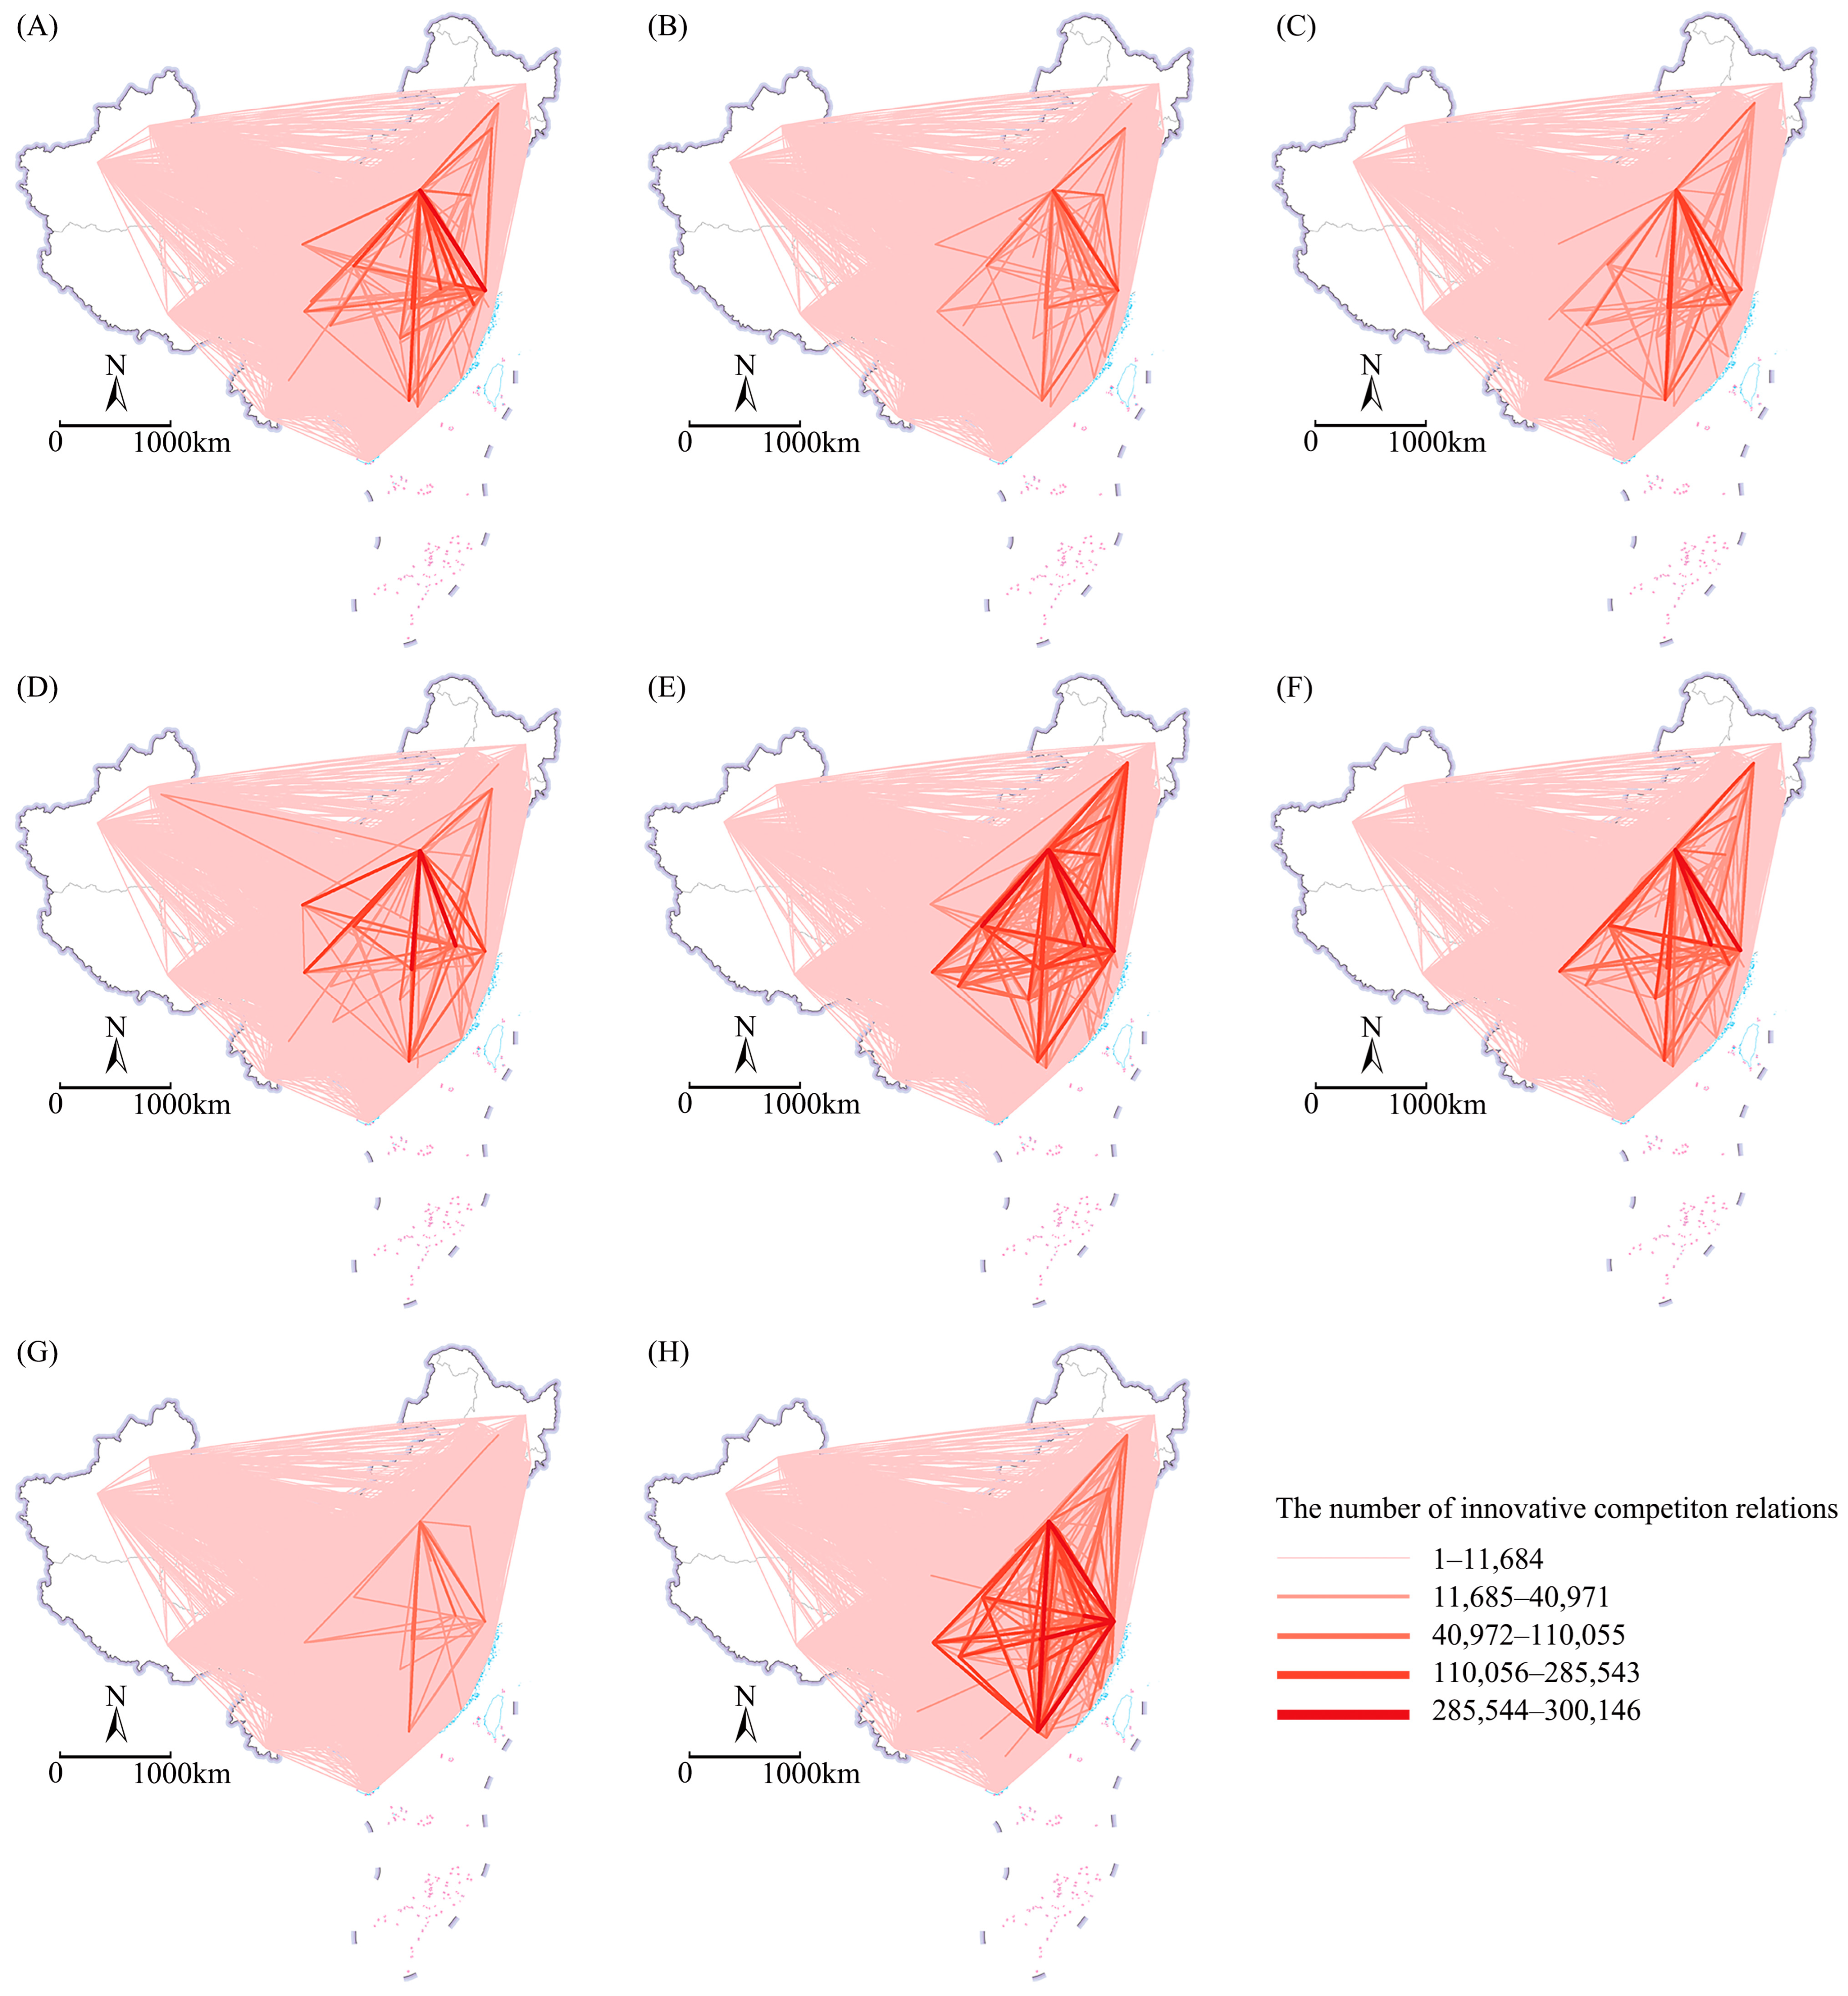
4.1.6. Significant Differences in the Intensity of Intercity Innovative Competitions in China among Various Academic Disciplines

The general programs of NSFC contain eight academic departments: the Department of Mathematical and Physical Sciences, the Department of Chemical Sciences, the Department of Life Sciences, the Department of Earth Sciences, the Department of Engineering and Materials Sciences, the Department of Information Sciences, the Department of Management Sciences and the Department of Medical Sciences. On the basis of an analysis of intercity innovative competition relations in various academic departments in China (Figure 5), innovative competition relations show the characteristics of clustering towards cities with high administrative ranks in each academic department. However, the intensity of innovative competitions among various academic departments has significant differences. The Department of Medical Sciences and the Department of Engineering and Materials Sciences had stronger innovative competition relations from 2015 to 2019, whereas the Department of Management Sciences and the Department of Chemical Sciences had relatively weaker relations. This condition occurred because China’s science and technology innovation concentrates on the global technological frontiers, key national demands and the health of the populace [36]. The global technological frontier and key national demands currently relate to novel materials, whilst medical research is focused on improving human health. Numerous universities and research institutions are actively conducting forward-looking research and nurturing breakthrough discoveries in these two domains, sparking fierce innovative competitions. In addition, fewer innovative competitions in chemistry and management science take place because of the modest technical advancement and saturated markets in these two fields.

4.2. Influencing Factors of Intercity Innovative Competition Relations in China

Firstly, a correlation analysis of the independent variables is conducted. All the correlation coefficients between the independent variables were less than 5, indicating that no obvious problem of multicollinearity occurs among the independent variables. Secondly, negative binomial regression models for the three time windows of 2005–2009, 2010–2014 and 2015–2019 are built. These models are created based on control variables and the independent variables of urban innovation capacity (Models 1, 3 and 5). Then, multidimensional proximity variables and their interaction terms were included as independent variables (Models 2, 4 and 6). All the models pass the chi-square test. The alpha coefficients also pass the chi-square test and z-test. The results of the negative binomial regression models are reported in Table 8.

4.2.1. Impact of Urban Innovation Capacity on the Intercity Innovative Competition Relations

Urban innovation capacity plays a significant role in the formation of intercity innovative competition relations. In Models 1, 3 and 5, the coefficients of urban innovation capacity on intercity innovative competition relations are significantly positive, indicating that the stronger the urban innovation capacity, the higher the probability of intercity innovative competition relations. Cities with leading innovation capacity tend to be more dominant in the competitions for limited innovation resources, motivating them to continuously engage in innovative competitions. From 2005 to 2019, the impact coefficients of urban innovation capacity on intercity innovative competition relations dropped steadily, showing a decrease in the degree of influence of urban innovation capacity on intercity innovative competition relations. In recent years, cities with weaker innovation capacity also have the opportunity to participate in intercity innovative competition relations.

4.2.2. Impact of Multidimensional Proximity on the Intercity Innovative Competition Relations

Intercity innovative competition relations are significantly influenced by geographical proximity, institutional proximity and cognitive proximity. In Models 2, 4 and 6, geographical proximity has a significantly positive impact on innovative competition relations. This finding indicates that universities and research institutions in geographically close cities have stronger innovative competition relations. This finding validates the observation that the intensity of innovative competitions decreases with the increase in distance. Institutional proximity also has a significantly positive effect on innovative competition relations, indicating that effective policy regimes can promote the concentration of innovative activities in cities with high administrative ranks, resulting in more intense intercity innovative competitions. This idea further supports the notion that cities with high administrative ranks dominate the innovative competition relations in China. Cognitive proximity also plays a significant role in promoting innovative competition relations, indicating that cities with comparable disciplinary backgrounds are more likely to form innovative competition relations. This may be because universities and research institutions in two cities with similar knowledge bases will be more interested in each other’s innovation progress, leading to intense innovative competition relations. This finding demonstrates characteristics of intercity innovative competition relations that are distinct from those observed in existing research on intercity competition relations in manufacturing.
In terms of the evolution mechanism of the multidimensional proximity factors, the coefficients of geographical proximity consistently dropped from 2005 to 2019, showing that its influence on the dynamics of innovative competitions diminished. This situation may occur because of the low technological development level in the early years when the transfer of tacit knowledge required intimate contact to be achieved. In recent years, with the rapid development of information technology and transportation infrastructure, communication and interaction between cities have become increasingly convenient. Universities and research institutions in distant cities can also easily acquire and learn from competitors’ core technology and knowledge, reducing the impact of geographical proximity. Meanwhile, the coefficients of institutional proximity and cognitive proximity did not change considerably, maintaining positive and constant impacts on innovative competition relations.

4.2.3. Interactive Influences of Multidimensional Proximity

A complementary effect occurs between geographical proximity and institutional proximity, a substitutive effect occurs between cognitive proximity and geographical proximity, and a substitutive effect occurs between cognitive proximity and institutional proximity. The interaction terms’ coefficients in Models 2, 4 and 6 show how multidimensional proximity factors interact with each other. The coefficients of the interaction terms of geographical proximity and institutional proximity are all significantly positive, suggesting the presence of complementary effects. This idea indicates that, when geographical proximity acts as a moderator, institutional proximity will encourage more innovative competitions. The coefficients of the interaction terms of cognitive proximity and geographical proximity, as well as cognitive proximity and institutional proximity, are both significantly negative, indicating a substitutive effect. The results imply that cities with similar academic backgrounds may engage in innovative competitions even if they are geographically distant or have low administrative ranks.

5. Conclusions and Discussion

This paper constructs a theoretical research framework that integrates the basic understandings, influencing factors and ensuing results of intercity innovative competition relations. On the basis of data from the general programs of NSFC from 2005 to 2019, this paper constructs intercity innovative competition relations in China and conducts an in-depth analysis of the spatial characteristics and influencing factors of intercity innovative competition relations. The study’s conclusions are as follows:
With regard to the characteristics of China’s intercity innovative competition relations, firstly, the intensity of intercity innovative competition relations in China gradually increased from 2005 to 2019, with spatial clustering towards cities with high administrative ranks (e.g., municipalities directly under the central government, sub-provincial cities and provincial capitals). Secondly, Beijing is always at the centre of innovative competition relations, but other cities with higher administrative ranks have steadily risen to prominence and significantly weakened Beijing’s position in recent years. Thirdly, universities and research institutions in cities with similar disciplinary advantages are more likely to form innovative competition relations. Therefore, competitions based on disciplinary strengths provides cities with the potential to become benchmarks in specific fields of innovative competitions. Fourthly, cities with close spatial distances have a higher average number of innovative competitions. Finally, the intensity of intercity innovative competitions in China varies significantly among various academic departments due to the impact of technological frontiers and national demands.
With regard to the influencing factors of intercity innovative competition relations in China, firstly, urban innovation capacity has a significant positive effect on intercity innovative competition relations, but its influence has diminished in recent years. Secondly, geographical proximity, institutional proximity and cognitive proximity all contribute to the formation of innovative competition relations. While geographical proximity’s influence on intercity innovative competition relations gradually diminished, institutional and cognitive proximity continued to have positive and stable effects on these relations. Finally, interactions take place between different proximity factors, with a complementary effect between geographical proximity and institutional proximity, a substitutive effect between cognitive proximity and geographical proximity, and a substitutive effect between cognitive proximity and institutional proximity.
While some of the findings of this study are consistent with previous studies, it also exhibits distinct characteristics that distinguish it from both macro-level intercity competition relations and micro-level innovative competition relations. Compared with research on intercity competition relations in manufacturing, this study reveals that intercity innovative competition relations are more likely to be formed in cities with close spatial distances and high administrative ranks, which is consistent with the research conclusion that intercity competition relations in global manufacturing are concentrated within regions and dominated by the capital cities [6]. However, what is more valuable is that this study finds that cognitive proximity can promote intercity innovative competition relations, and cities can leverage their disciplinary advantages to become benchmarks of innovative competitions in specific fields, opening up new development opportunities for cities with special disciplinary advantages. Compared with research on micro-level innovative competition relations, this study goes beyond specific developmental behaviours of individual entities and instead ascends to the overall level of cities to identify commonalities, laying the groundwork for proposing innovation development strategies at the city level.
It can be observed in this study that moderate intercity innovative competition relations can promote urban innovation capacity, and urban innovation capacity can foster the formation of new rounds of intercity innovative competition relations, ultimately leading to continuous accumulation and self-reinforcement of innovation capacity. In order to continuously improve urban innovation capacity through moderate intercity innovative competition relations, this paper proposes two proposals for development: Firstly, multidimensional proximity has significantly positive effects on intercity innovative competition relations. With the objective existence of geographical proximity and cognitive proximity, it is crucial to leverage the role of institutional proximity. Cities with weaker innovative competitions should be encouraged to propose preferential innovation policies (e.g., talent recruitment policies, innovation activity subsidies, etc.) to continuously incentivise innovation activities. Secondly, cities have the potential to become benchmarks in innovative competitions in specific fields by fully leveraging their disciplinary strengths in innovative competitions. It is necessary to provide special support for the cultivation of advantageous disciplines for cities that excel in specific disciplines. By deeply engaging in innovative competitions based on their disciplinary strengths, cities can become leaders in innovation in specific fields.
The data used in this study has certain limitations. The NSFC data do not disclose programs that did not get funding and the exact branches or affiliations to which the programs belong, which may lead to biased results. Furthermore, since the NSFC mainly funds universities and research institutes, it represents fewer social innovation forces such as enterprises. Future research can consider integrating patent data and data on enterprise innovation into the discussion to generate more comprehensive findings. It is worth noting that while intercity innovative competition relations can stimulate motivation and knowledge spillovers, some studies suggested that excessive competitions may pose significant obstacles for small-sized innovation entities in fundraising and market expansion. Additionally, excessive competitions may also cause small-sized innovation entities to lose confidence in winning, resulting in a slacking attitude that will stifle creativity [13]. Moreover, as the results of competitions can be won or lost, some cities may experience talent losses and a decrease in innovation capacity after failing in innovative competitions. Future research can further explore the innovation performance of intercity innovative competition relations and optimize innovative competition mechanisms. Furthermore, intercity innovative competitions and cooperations coexist, both of which jointly influence urban innovation capacity and may affect and transform each other. Cities can seek opportunities for future innovative cooperations during the innovative competition process, and new innovative competition relations may also emerge during innovative cooperations [37]. Future research can further explore intercity innovative co-opetition relations and propose beneficial mechanisms for intercity innovative co-opetition.

Author Contributions

Conceptualisation, X.Y. and L.S.; methodology, X.Y. and L.S.; software, X.Y.; validation, L.S., X.W. and X.Q.; formal analysis, X.Y.; investigation, X.Y.; resources, L.S.; data curation, X.Y.; writing—original draft preparation, X.Y. and L.S.; writing—review and editing, X.Y., L.S., X.W. and X.Q.; visualisation, X.Y.; supervision, L.S.; project administration, L.S.; funding acquisition, L.S. and X.W. All authors have read and agreed to the published version of the manuscript.

Funding

This research was funded by the Key Project of the National Natural Science Foundation of China (Grant No. 42330510) and the General Project of the National Natural Science Foundation of China (Grant No. 41871160 and Grant No. 42371262).

Data Availability Statement

Data for this study were obtained from the LetPub website “http://www.letpub.com.cn/ (accessed on 30 April 2023)”.

Conflicts of Interest

The authors declare no conflicts of interest.

References

  1. Yu, T.; Gu, C. On urban competition and competitiveness. Urban Plan. Forum 2004, 6, 16–21. [Google Scholar]
  2. Chen, S.; Lin, J.; Yang, L.; Zhang, H. Study on urban competition strategy based on the theory of niche. Hum. Geogr. 2006, 2, 72–76. [Google Scholar]
  3. He, Z.; Luo, X.; Gu, Z. The regional strategy and the new trends of competition and cooperation in the Yangtze River Delta. Econ. Geogr. 2022, 42, 45–51. [Google Scholar]
  4. Liu, J.; Dong, W. The effect of major cities competition and cooperation on construction of Shanghai global cities: A comparative analysis based on urban strategy. Urban Dev. Stud. 2016, 23, 74–81. [Google Scholar]
  5. Lai, K. Differentiated markets: Shanghai, Beijing and Hong Kong in China’s financial centre network. Urban Stud. 2012, 49, 1275–1296. [Google Scholar] [CrossRef]
  6. Zhang, W.; Qian, Y. Unpacking intercity competitive relations in the global corporate spatial organization of manufacturing. Glob. Netw. 2024, e12469. [Google Scholar] [CrossRef]
  7. Lyu, L.; Liao, Q.; Huang, R. Knowledge specialization of cities above the prefecture level in China based on journal articles. Sci. Geogr. Sin. 2018, 38, 1245–1255. [Google Scholar]
  8. Kamien, M.I.; Schwartz, N.L. Timing of innovations under rivalry. Econometrica 1972, 40, 43–60. [Google Scholar] [CrossRef]
  9. Kamien, M.I.; Schwartz, N.L. Market structure and innovation-survey. J. Econ. Lit. 1975, 13, 1–37. [Google Scholar]
  10. Porter, M.E. The competitive advantage of nations. Harvard. Bus. Rev. 1990, 68, 73–93. [Google Scholar]
  11. Zhang, G.; Xiong, L. How does the competitive relationship affect universities’ scientific research performance: Perspective from the competition networks in chemical field. Chin. Soft Sci. 2020, 10, 12–25. [Google Scholar]
  12. Hoffmann, W.; Lavie, D.; Reuer, J.J.; Shipilov, A. The interplay of competition and cooperation. Strateg. Manag. J. 2018, 39, 3033–3052. [Google Scholar] [CrossRef]
  13. Yang, Z.; Li, Y.; Liu, F.; Wei, W. Research on the influence of competitive relations on participators’ innovation performance in crowdsourcing contests: The moderating role of competition intensity. Mod. Manag. 2022, 42, 97–104. [Google Scholar]
  14. Yang, B.; Wang, T.; Li, Z.; Jiang, P. A study on the trend of domestic mobility and evolution of Chinese researchers. Stud. Sci. Sci. 2024, 1–16. [Google Scholar] [CrossRef]
  15. Xu, G.; Wang, L.; Zhou, Y. Comparative analysis of objective entrepreneurial cost and subjective entrepreneurial cost perception in key cities in China. Stud. Sci. Sci. 2021, 39, 463–470. [Google Scholar]
  16. Zhou, Z.; Dou, L. Prediction of potential competition and cooperation between enterprises from the perspective of patent: Taking perovskite solar cells as an example. Sci. Technol. Manag. Res. 2023, 43, 136–145. [Google Scholar]
  17. Li, B.; Ding, K.; Sun, X. Predicting potential technology partners and competitors of enterprises: A case study on fuel cell technology. J. Chin. Soc. Sci. Tech. Inf. 2021, 40, 1043–1051. [Google Scholar]
  18. Wei, Y.; Teng, G.; Guo, S.; Tuo, R. Multidimensional analysis on technological competition based on competing patent network: Taking 3D printing technology as an example. J. Inf. Res. Manag. 2020, 10, 99–108. [Google Scholar]
  19. Luo, J.; Liao, T.; Shi, M.; Cai, L.; Li, W. The identification of potential competitors from the perspective of emerging technologies. Inf. Sci. 2021, 39, 98–104. [Google Scholar]
  20. Dai, L.; Cao, Z.; Ma, H.; Ji, Y. The influencing mechanisms of evolving structures of China’s intercity knowledge collaboration networks. Acta Geogr. Sin. 2023, 78, 334–350. [Google Scholar]
  21. Florida, R.; Adler, P.; Mellander, C. The city as innovation machine. Reg. Stud. 2017, 51, 86–96. [Google Scholar] [CrossRef]
  22. Boschma, R.A. Proximity and innovation: A critical assessment. Reg. Stud. 2005, 39, 61–74. [Google Scholar] [CrossRef]
  23. Knoben, J.; Oerlemans, L.A.G. Proximity and inter-organizational collaboration: A literature review. Int. J. Manag. Rev. 2006, 8, 71–89. [Google Scholar] [CrossRef]
  24. Zhou, R.; Qiu, Y.; Hu, Y. Characteristics, evolution and mechanism of inter-city innovation network in China: From a perspective of multi-dimensional proximity. Econ. Geogr. 2021, 41, 1–10. [Google Scholar]
  25. Nooteboom, B.; Van, H.W.; Duysters, G.; Gilsing, V.; Oord, A.v.d. Optimal cognitive distance and absorptive capacity. Res. Policy 2007, 36, 1016–1034. [Google Scholar] [CrossRef]
  26. Qi, H.; Zhao, M.; Liu, S.; Gao, P.; Liu, Z. Evolution pattern and its driving forces of China’s interprovincial migration of highly-educated talents from 2000 to 2015. Geogr. Res. 2022, 41, 456–479. [Google Scholar]
  27. Zhan, Y.; Gu, R. Characteristics and multi-dimensional proximity mechanism of the online game industry cooperative network in China. Prog. Geogr. 2022, 41, 1145–1155. [Google Scholar] [CrossRef]
  28. Dai, L.; Liu, C.; Wang, S.; Ji, Y.; Ding, Z. Proximity and self-organizing mechanisms underlying scientific collaboration of cities in the Yangtze River Delta. Geogr. Res. 2022, 41, 2499–2515. [Google Scholar]
  29. He, C.; Jin, L.; Liu, Y. How does multi-proximity affect the evolution of export product space in China? Geogr. Res. 2017, 36, 1613–1626. [Google Scholar]
  30. Cao, Z.; Derudder, B.; Peng, Z. Interaction between different forms of proximity in inter-organizational scientific collaboration: The case of medical sciences research network in the Yangtze River Delta region. Pap. Reg. Sci. 2019, 98, 1903–1924. [Google Scholar] [CrossRef]
  31. He, S.; Du, D.; Jiao, M.; Lin, Y. Spatial-temporal characteristics of urban innovation capability and impact factors analysis in China. Sci. Geogr. Sin. 2017, 37, 1014–1022. [Google Scholar]
  32. Wang, J.; Yan, Y.; Hu, S. Spatial pattern and determinants of Chinese urban innovative capabilities base on spatial panel data model. Sci. Geogr. Sin. 2017, 37, 11–18. [Google Scholar]
  33. Jiang, Y.; Yang, N.; Liu, X.; Yuan, Y.; Li, L.; Lu, Y.; Jin, B. Study on the lay out of NSFC in China. Sci. Sci. Manag. S. T. 2003, 3, 5–10. [Google Scholar]
  34. Gui, Q.; Du, D.; Liu, C.; Xu, W.; Hou, C.; Jiao, M.; Zhai, C.; Lu, H. Structural characteristics and influencing factors of the global inter-city knowledge flows network. Geogr. Res. 2021, 40, 1320–1337. [Google Scholar]
  35. Ryu, W.; McCann, B.T.; Reuer, J.J. Geographic co-location of partners and rivals: Implications for the design of R&D alliances. Acad. Manag. J. 2018, 61, 945–965. [Google Scholar]
  36. Hao, H.; Zhao, Y.; Yang, H.; Gao, F.; An, H.; Hao, J.; Zhang, S.; Li, Z.; Zheng, Z.; Yang, L.; et al. Proposal application, peer review and funding of National Natural Science Foundation of China in 2022: An overview. Bull. Nat. Nat. Sci. Found. Chin. 2023, 37, 3–6. [Google Scholar]
  37. Liu, H.; Wang, L.; Li, Y. An exploration of the research frontiers of co-opetition theory. For. Econ. Manag. 2009, 31, 1–8. [Google Scholar]
Figure 1. Theoretical research framework of intercity innovative competition relations.
Systems 12 00087 g001
Figure 2. The diagram of the construction of intercity innovative competition relations.
Systems 12 00087 g002
Figure 3. Layout of intercity innovative competition relations in China from 2005 to 2019. (A) 2005–2009; (B) 2010–2014; (C) 2015–2019.
Systems 12 00087 g003
Figure 4. Layout of intercity innovative competition relations of Sanya and Qinzhou from 2005 to 2019. (A) Sanya; (B) Qinzhou.
Systems 12 00087 g004
Figure 5. Layout of intercity innovative competition relations among various academic departments in China from 2015 to 2019. (A) Mathematical and Physical Sciences; (B) Chemical Sciences; (C) Life Sciences; (D) Earth Sciences; (E) Engineering and Materials Sciences; (F) Information Sciences; (G) Management Sciences; (H) Medical Sciences.
Systems 12 00087 g005
Table 1. The indicators of social network analysis.
Indicators Meaning of IndicatorsCalculation FormulaExplanation of Indicators
Network DensityNetwork density is the ratio of a network’s actual connections to the maximum feasible number of connections. It characterizes the closeness of intercity innovative competition relations. D = 2 L n ( n 1 ) D is the network density; L is the actual number of connections in a network; and n is the number of city nodes. The threshold for network density is [0, 1].
Degree Centrality If a city has a high degree centrality, it occupies a central position in the city network, possessing more power, status, and the ability to aggregate resources. C i = j R i j C i is the degree centrality of city i; and R i j is the number of innovative competition relations between city i and city j.
Table 2. The measurement methods of multidimensional proximity variables.
Multidimensional Proximity Variables Measurement Methods
Geographical   proximity   ( G E O i j ) This paper calculates the Euclidean distance between the centres of two innovative competition cities through the geosphere package in R language and implements standardisation referring to existing research [24]. The calculation formula is as follows:
G E O i j = 1 l n ( d i j / m a x d i j )
where   m a x d i j indicates the maximum distance between cities in China. G E O i j takes a value of 1 or above; a large value corresponds to a high degree of geographical proximity between cities.
Institutional   proximity   ( I N S i j ) Referring to existing studies [27], this paper assesses institutional proximity by examining the administrative-level relationship between cities. If both cities have higher administrative ranks, then the value is 3; if only one of the two cities has a higher administrative rank and the other is an ordinary city, then the value is 1; if both cities are ordinary cities, then the value is 0.
Cognitive   proximity   ( C O G i j ) Referring to existing studies [28], this paper firstly collects the distribution series of general programs of the NSFC in each discipline and then illustrates cognitive proximity by calculating the closeness of the application directions of general programs of the NSFC between cities according to the cosine similarity rule.
Table 3. The quantitative characteristics and social network indicators of China’s intercity innovative competition relations from 2005 to 2019.
Quantitative Characteristics and Social Network Indicators of Innovative Competition Relations2005–20092010–20142015–2019
The number of innovative competitions5,269,94744,374,26260,657,509
The number of cities in innovative competition relations150192197
Network density0.150.280.28
The number of innovative competitions involving cities with high administrative ranks5,231,03943,940,74460,020,918
The percentage of innovative competitions involving cities with high administrative ranks99.26%99.02%98.95%
The number of innovative competitions involving both cities with high administrative ranks4,410,92836,095,25748,981,916
The percentage of innovative competitions involving both cities with high administrative ranks83.70%81.34%80.75%
Table 4. Top 10 cities in terms of centrality in innovative competitions from 2005 to 2019.
2005–20092010–20142015–2019
CityCentrality in Innovative CompetitionsCityCentrality in Innovative CompetitionsCityCentrality in Innovative Competitions
Beijing2,227,518Beijing15,179,363Beijing19,164,325
Shanghai1,035,246Shanghai9,143,353Shanghai12,780,678
Nanjing722,837Nanjing5,818,906Nanjing8,679,340
Wuhan616,176Guangzhou5,220,426Guangzhou8,116,602
Xi’an512,183Wuhan5,160,496Wuhan7,177,656
Guangzhou506,820Xi’an4,554,071Xi’an6,061,432
Hangzhou454,838Hangzhou3,859,669Hangzhou4,990,209
Hefei371,155Changsha3,151,986Changsha3,961,060
Chengdu332,780Chengdu2,750,964Chengdu3,947,738
Tianjin324,528Tianjin2,697,680Tianjin3,835,319
Table 5. Rank of city connectivity in the top 1, 3 and 10 innovative competition relations from 2005 to 2019.
Top 1 Connected CitiesTop 3 Connected CitiesTop 10 Connected Cities
2005–2009Beijing (147)
Shanghai (3)
Beijing (149)
Shanghai (128)
Nanjing (90)
Guangzhou (19)
Xi’an (15)
Wuhan (13)
Hangzhou (13)
Hefei (6)
Lanzhou (5)
Tianjin (3)
Beijing (149)
Shanghai (144)
Wuhan (144)
Nanjing (142)
Guangzhou (141)
Hangzhou (135)
Xi’an (120)
Tianjin (95)
Chengdu (92)
Hefei (84)
2010–2014Beijing (185)
Shanghai (5)
Qingdao (2)
Beijing (189)
Shanghai (158)
Nanjing (111)
Guangzhou (44)
Wuhan (32)
Xi’an (11)
Changsha (7)
Hangzhou (5)
Qingdao (4)
Shenyang (4)
Beijing (191)
Shanghai (190)
Nanjing (187)
Wuhan (186)
Guangzhou (181)
Hangzhou (175)
Xi’an (165)
Changsha (123)
Chengdu (100)
Tianjin (100)
2015–2019Beijing (180)
Shanghai (14)
Qingdao (2)
Harbin (1)
Beijing (195)
Shanghai (160)
Nanjing (106)
Guangzhou (50)
Wuhan (28)
Xi’an (26)
Qingdao (5)
Shenyang (5)
Changsha (3)
Harbin (3)
Beijing (196)
Wuhan (194)
Shanghai (193)
Nanjing (189)
Xi’an (181)
Guangzhou (181)
Hangzhou (174)
Changsha (126)
Tianjin (110)
Chengdu (108)
Table 6. Innovative competition relations between the top 10 city pairs from 2005 to 2019.
2005–20092010–20142015–2019
City 1City 2Number of Innovative CompetitionsCity 1City 2Number of Innovative CompetitionsCity 1City 2Number of Innovative Competitions
BeijingShanghai292,265BeijingShanghai1,933,965BeijingShanghai2,436,375
BeijingNanjing205,185BeijingNanjing1,315,461BeijingNanjing1,772,439
BeijingWuhan171,311BeijingWuhan1,123,563BeijingGuangzhou1,445,014
BeijingXi’an135,766BeijingGuangzhou1,026,202BeijingWuhan1,420,771
BeijingGuangzhou134,479BeijingXi’an934,910GuangzhouShanghai1,234,036
BeijingHangzhou120,085BeijingHangzhou785,369BeijingXi’an1,170,687
BeijingHefei110,029GuangzhouShanghai701,000NanjingShanghai993,512
BeijingChengdu88,539BeijingChangsha637,418BeijingHangzhou919,603
BeijingTianjin80,707NanjingShanghai629,774ShanghaiWuhan824,850
BeijingChangsha79,489BeijingChengdu582,473BeijingChengdu756,181
Table 7. Average number of innovative competitions between cities of different distances from 2005 to 2019.
YearIntercity DistanceAverage Number of Innovative Competitions
Both Cities Are Cities with Higher Administrative RanksOne of the Two Cities Has a Higher Administrative Rank and the Other Is an Ordinary CityBoth Cities Are Ordinary Cities
2005–20090–500 km8.15287.659971.92
500–1000 km7.55260.239466.95
1000–1500 km4.69206.189029.64
1500–2000 km4.26123.655188.02
Above 2000 km0.8850.731733.44
2010–20140–500 km55.532185.2077,585.81
500–1000 km47.071840.8377,208.10
1000–1500 km25.741407.3671,399.71
1500–2000 km24.83839.8342,194.09
Above 2000 km10.64370.6512,604.52
2015–20190–500 km80.382982.91104,912.78
500–1000 km63.412557.76103,375.63
1000–1500 km38.711947.4196,144.78
1500–2000 km32.271140.1260,160.59
Above 2000 km10.83434.0717,122.34
Table 8. Parameter estimation results of the negative binomial regression.
2005–20092010–20142015–2019
Model 1Model 2Model 3Model 4Model 5Model 6
ProximityGEOij 0.199 *** 0.184 *** 0.120 ***
INSij 2.028 *** 2.001 *** 2.102 ***
COGij 11.272 *** 12.108 *** 11.799 ***
Interaction termsGEOij × INSij 0.360 *** 0.357 *** 0.212 ***
GEOij × COGij −1.616 *** −1.462 *** −1.200 ***
INSij × COGij −5.031 *** −5.312 *** −5.791 ***
Urban innovation capacityUIC15.808 ***2.772 ***2.125 ***0.369 ***1.605 ***0.473 ***
Control variablesCAP0.209 ***0.051 ***0.173 ***0.041 ***0.078 ***0.011 ***
RDI0.816 ***0.128 ***5.262 ***1.264 ***49.260 ***26.065 ***
Constant term2.887 ***−0.928 ***4.393 ***0.658 ***4.389 ***0.810 ***
Alpha6.1012.4585.8623.0536.2753.348
Log likelihood−39,368.252−35,068.247−81,141.277−75,221.020−85,785.897−79,908.967
Note: *** represents significance at the 1% level.
Disclaimer/Publisher’s Note: The statements, opinions and data contained in all publications are solely those of the individual author(s) and contributor(s) and not of MDPI and/or the editor(s). MDPI and/or the editor(s) disclaim responsibility for any injury to people or property resulting from any ideas, methods, instructions or products referred to in the content.

