Article

Synergies of Heterogeneous Environmental Regulation on the Quality of Foreign Direct Investment

1
School of Public Administration, Sichuan University, Chengdu 610065, China
2
School of Economics and Management, Fuzhou University, Fuzhou 350108, China
3
Institute for Sustainable Resources, The Bartlett School of Environment, Energy and Resources, University College London, London WC1H 0NN, UK
*
Author to whom correspondence should be addressed.
Systems 2024, 12(12), 586; https://doi.org/10.3390/systems12120586
Submission received: 12 November 2024 / Revised: 13 December 2024 / Accepted: 20 December 2024 / Published: 22 December 2024

Abstract

:
Expanding a high level of openness and attracting high-quality foreign direct investment (FDI) while preventing foreign-invested enterprises from relocating to host countries to reduce costs and circumvent environmental regulation (ER) in their home countries, which can transform host countries into “pollution heaven”, present a significant challenge for emerging markets such as China. Based on a theoretical analysis that integrates various frameworks, this study constructs a panel regression model to empirically investigate the relationship between ER and the quality of FDI. This analysis is conducted from the perspectives of administrative means and market mechanisms, utilizing panel data from 267 prefectural-level cities in China spanning the years 2005 to 2021. This study reveals the following conclusions: (1) The implementation of ER significantly enhances the quality of FDI within cities, a conclusion that remains robust across various tests. (2) ER improves the quality of FDI through two key pathways: enhancing green competitiveness and fostering green technological innovation. (3) In comparison to the isolated effects of administrative and market mechanism policies, the synergistic effect of these two approaches proves to be more pronounced in elevating the quality of FDI. (4) ER exerts a significant impact on the quality of FDI, particularly within sub-samples of cities characterized by higher levels of environmental protection and a focus on non-resource-oriented activities. (5) ER has a negative spatial spillover effect on FDI quality. This study serves as a valuable guide for emerging markets to enhance environmental policy effectiveness and assess the potential for a new open economic system.

1. Introduction

FDI uniquely connects domestic and international markets, playing a crucial role in enabling emerging markets to accelerate the establishment of a new development paradigm and foster high-quality growth. The proactive attraction and utilization of FDI are essential components of advancing high-level openness and constructing a new open economy [1]. Since the initiation of reform and opening up, China has emerged as one of the most successful developing nations in attracting FDI, leveraging its resource advantages in land, labor, and energy, alongside its active engagement in the international division of labor, as well as its expansive market and significant potential [2]. According to the World Investment Report [3], China’s FDI scale surpassed that of other countries for the first time in 2014, positioning it as the world’s largest recipient of FDI inflows, overtaking the United States. In 2023, 53,766 new foreign-invested enterprises were established in the country, reflecting a year-on-year increase of 39.7%. The actual FDI utilized amounted to 11.33 trillion Yuan, which remains historically high. Over the years, foreign-invested enterprises have become significant market players in China. However, the current uncertainties in the international environment and the escalating geopolitical tensions have introduced new challenges to China’s FDI utilization. On one hand, the growing divergence in economic development among countries has resulted in a decline in external demand, rendering it unstable and unreliable [4]. On the other hand, the increasing uncertainty in the global economic landscape and the rising pressure on domestic factor costs in China have intensified international competition for capital attraction. Thus, there is an urgent need to investigate how to establish a more advanced open economic system and create a first-class business environment that is market-oriented, rule-of-law-driven, and internationalized [5]. This approach aims to attract high-quality FDI and ensure that it effectively contributes to the economy’s high-quality development.
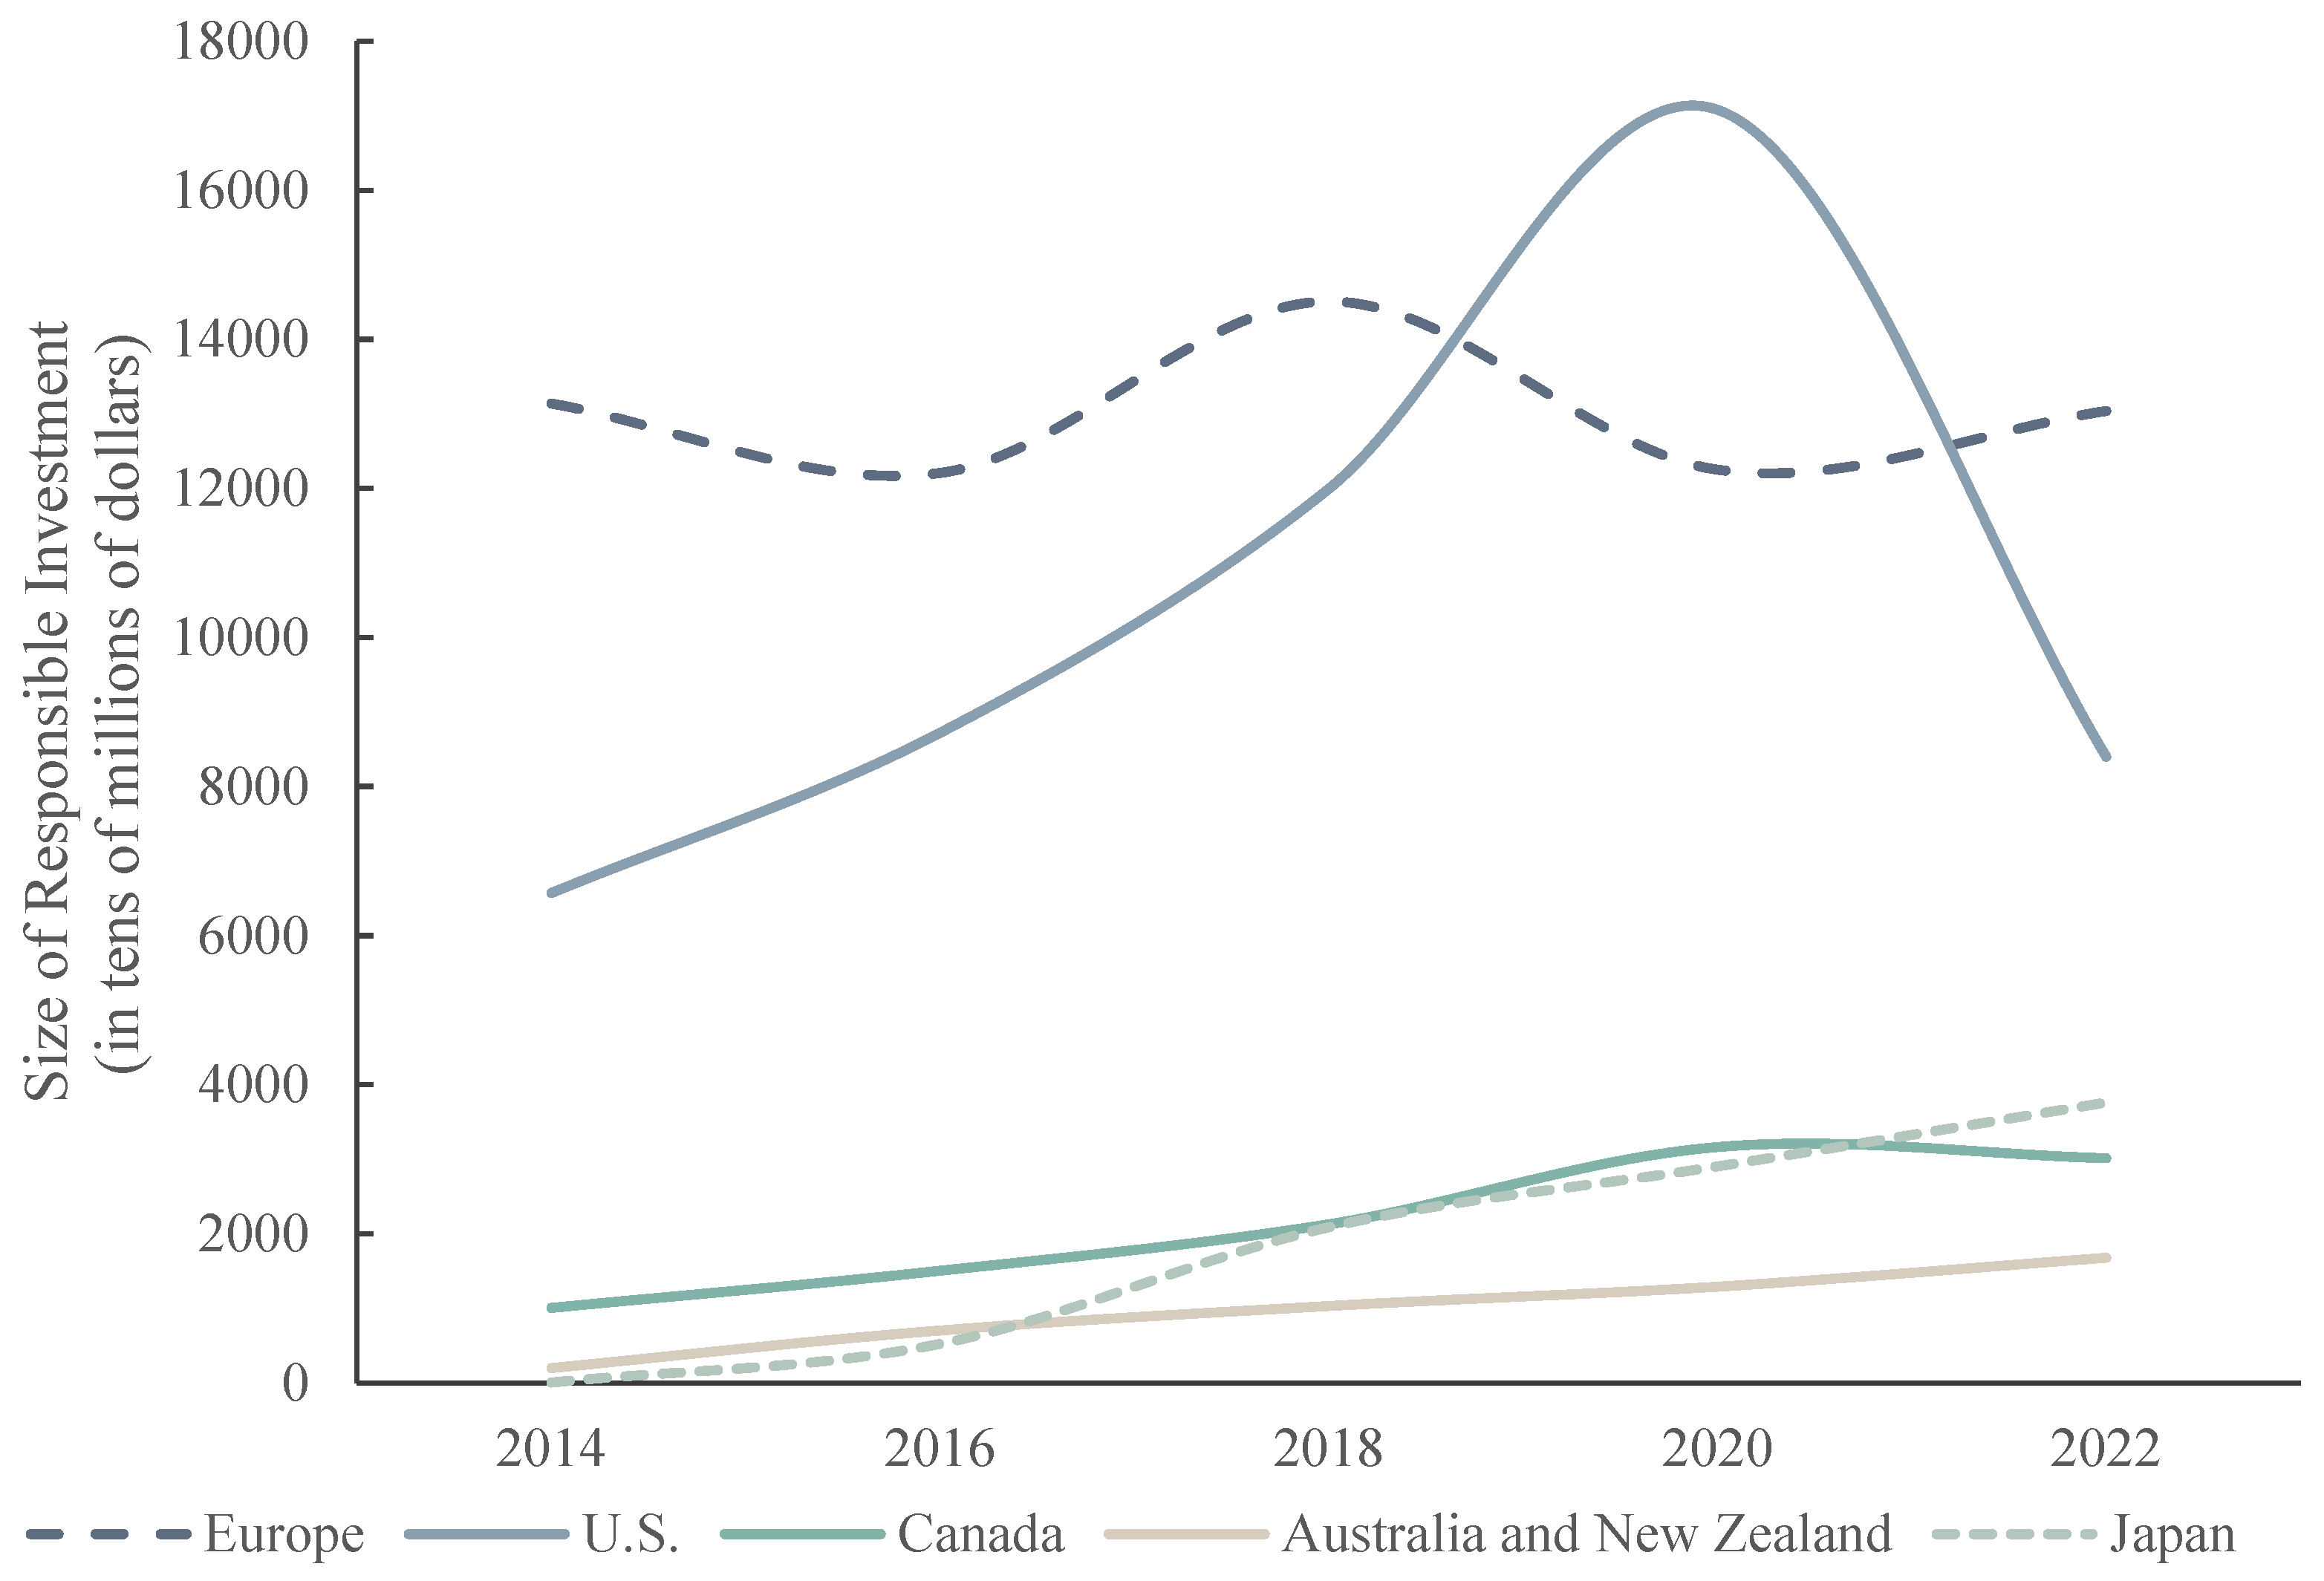
In recent years, the demand for green recovery has driven a significant increase in the scale of global responsible investment (see Figure 1). The social responsibility requirements stemming from sustainable development are reshaping the business philosophies of enterprises across various countries. Consequently, environmental factors are playing an increasingly critical role in the decision-making processes of FDI enterprises in China [6]. On one hand, corporate environmental responsibility has become a crucial component of strategic management in developed Western countries. Increasingly stringent laws and regulations in these regions, particularly in Europe and the United States, mandate that listed companies disclose their sustainable development practices. Many organizations have also integrated Environmental, Social, and Governance (ESG) criteria into their research and investment decision-making processes. Consequently, FDI enterprises with advanced environmental technologies are more likely to expand their investments in regions with higher levels of environmental governance, seeking new opportunities for their emerging green technologies and products [7]. On the other hand, FDI that flows into China predominantly targets the manufacturing, mining, and power sectors, which, while experiencing rapid growth, have also contributed to significant environmental degradation. In response to China’s stringent environmental regulations, polluting FDI enterprises are compelled to invest heavily in pollution-control measures, thereby constraining their sustainable development potential in host countries [8]. This dynamic has led to a declining share of polluting FDI in the market and has catalyzed an upgrade in the quality of FDI.
Cities are a crucial unit in China’s economic and social development, and their green, low-carbon initiatives significantly contribute to achieving the country’s overall low-carbon goals, thereby advancing sustainable development [9]. Currently, the low-carbon city pilot policy (LC), which emphasizes administrative order-based environmental regulation, serves as the central strategy in China’s response to global climate change [10]. When high-quality FDI enterprises with strong management capabilities, technological advantages, and substantial capital establish operations in low-carbon pilot cities, these cities can foster a conducive low-carbon and environmental ecosystem. This environment not only enables enterprises to secure increased financial support for environmental protection but also encourages them to actively engage in green innovation activities. These activities include developing effective countermeasures to minimize negative impacts and seeking viable solutions [11]. Additionally, China has introduced a carbon emissions trading scheme (ETS) that emphasizes market incentives for environmental regulation [12]. This approach integrates the market’s flexible regulatory functions with greenhouse gas emissions control, aiming to manage carbon emissions in a cost-effective manner while creating new pathways to address the increasing conflict between environmental sustainability and development. As a result, this policy significantly enhances the environmental responsibility of high-quality enterprises.
This raises several questions: As a manifestation of China’s green development concept, can the pilot low-carbon city policy, which focuses on executive-directed environmental regulation, and the market-incentivized ETS both positively influence the attraction of high-quality FDI? If so, can the positive effects of both be characterized as “having both the fish and the bear’s paw”, or as “two evils in harmony and two benefits in separation”? Building on a theoretical analysis of the relationship between ER and FDI quality, this study examines the direct impacts, pathways, synergistic effects, and heterogeneity of environmental regulation on the quality of regional FDI through the construction of an empirical model. The findings aim to provide insights for decarbonization practices and support the pursuit of high-quality, sustainable economic development in emerging markets, such as China. Specifically, this study develops a theoretical framework based on policy synergy theory, Porter’s hypothesis, and the pollution shelter hypothesis to examine the relationship between environmental regulation and FDI quality. FDI quality is measured as the core explanatory variable using panel data from China’s prefectural-level municipalities, spanning 2005 to 2021. A difference-in-differences (DID) model is constructed to empirically analyze the impact of environmental regulation on FDI quality while also assessing the synergistic effects of the LC and ETS. Various methods are employed to test the robustness of the empirical results. Subsequently, we construct a mechanism-testing model to investigate the role of green competitiveness and technological innovation capability. We also explored the heterogeneity of this facilitating effect across subgroups concerning environmental protection efforts and urban factor endowments. Furthermore, we examine the spatial perspective on the relationship between ER and FDI quality.
Our findings may contribute as follows:
First, most existing studies tend to evaluate the effects of LC or ETS within separate frameworks, with limited focus on comparing the differences in their impacts. Furthermore, there is a notable lack of research on the synergistic effects of these two distinct types of environmental policies. The theory of policy synergies posits that analogous policy instruments enable different components of the policy system to collaborate, resulting in comprehensive effects [13]. By integrating policy synergy theory, Porter’s hypothesis, and the pollution heaven hypothesis with a theoretical clarification of existing research findings, this study comprehensively analyzes the heterogeneity of these two environmental policy types. This approach not only expands the theoretical framework of sustainable development and green governance but also provides empirical insights for the formulation of future environmental regulations.
Second, FDI quality combines capital stock, technological advancement, and managerial expertise [14]. Within the context of high-quality economic development, existing studies widely acknowledge the positive role of FDI. However, most research has focused on the dynamics of FDI from a quantitative perspective, often overlooking the “quality” of FDI. By exploring the relationship between environmental regulation and FDI quality, our study enriches the theoretical literature on the factors influencing FDI. Furthermore, it offers valuable practical insights on stabilizing and sustaining FDI growth, particularly regarding strategies to promote high-quality FDI inflows that enhance the quality and efficiency of emerging market economies.
Third, regarding research methodology, this study employs LC and ETS as exogenous shocks. It utilizes propensity score matching with DID and placebo tests to mitigate sample selection bias, thereby addressing endogeneity issues and verifying the robustness of the findings. Additionally, the analysis includes a comprehensive examination of heterogeneity based on the strength of urban environmental protection and factor endowments. It investigates the channels through which environmental regulations influence FDI quality, focusing on green competitiveness and green innovation. Finally, we also examine the relationship between ER and FDI quality from a spatial perspective. This research provides empirical evidence to enhance coordination between LC and ETS, fostering policy synergies that promote the continuous improvement of FDI quality in China.

2. Theoretical Analysis and Research Hypothesis

2.1. Policy Background

Since August 2010, China’s National Development and Reform Commission (NDRC) has officially launched a low-carbon pilot program. China’s first low-carbon city development projects were launched with the main objective of achieving low-carbon development in two areas: renewable energy and buildings [15]. The Central Government’s primary objective in initiating the LC project is twofold. First, in alignment with the prevailing trend towards green and low-carbon development, the establishment of several low-carbon pilot cities aims to lead and exemplify energy conservation, emission reduction, and sustainable development, ultimately facilitating a nationwide transition to greener practices [16]. Second, should these low-carbon cities successfully identify development pathways tailored to their unique characteristics and distill effective experiences, they will be positioned to disseminate these findings across the country, thereby contributing valuable insights and support to China’s green and low-carbon development agenda [17].
Against the backdrop of global carbon emissions trading, the Chinese government has begun to promote emissions reductions through market-led, incentive-based environmental regulatory tools, and ETS have subsequently emerged in China (see Table 1). ETS enhance the disclosure of carbon information by enterprises, leading heavily polluting firms to potentially lose their appeal to investors, resulting in a decline in market value [18]. Enterprises demonstrating strong environmental performance are increasingly inclined to improve their information disclosure to the capital market, effectively conveying a “low carbon” signal. This practice fosters a positive corporate image and leverages macroeconomic policy controls to assist firms in recognizing transformation incentive signals that guide low-carbon transitions and the research and development of low-carbon technologies [12]. In 2021, the number of enterprises participating in China’s ETS reached 2802, with these firms distributed across various industrial sectors, including petrochemical, chemical, and thermal power. Carbon trading offers robust policy support for achieving the “dual carbon” goals and represents a crucial step in China’s efforts to combat climate change and promote sustainable development.

2.2. ETS and FDI Quality

The concept of FDI quality remains inconsistently defined across the existing literature. Kumar [19], the first to articulate a definition of FDI quality, asserts that it encompasses the positive spillover effects of FDI on the host country’s technology, management, and earnings. Becker defines FDI quality as the degree to which foreign direct investment generates employment and contributes to the host country’s tax revenues [20]. Other studies characterize FDI quality by its ability to facilitate industrial and technological upgrades in the host country [21], as well as by the distinctiveness of the capital itself [22]. In this paper, we define FDI quality as follows: a region is deemed to possess high FDI quality if the FDI present significantly enhances the profit growth, scale expansion, technological advancement, and regional export capacity of local enterprises.
In recent years, China has enacted a range of environmental regulations, notably including the LC and ETS. While the pollution haven hypothesis posits that countries with less stringent environmental standards increasingly attract cross-border transfers of polluting industries [23], established studies indicate that this conclusion does not consistently apply [24]. Corporate environmental responsibility has increasingly been recognized as a crucial component of strategic management in developed Western countries [25]. FDI enterprises equipped with advanced environmental technologies are more likely to expand their investment in regions with higher levels of environmental governance, seeking new opportunities for the emerging green technologies and products. Conversely, Porter’s hypothesis posits that FDI enterprises [26], in response to rising production costs due to environmental regulatory constraints, will intensify efforts to upgrade their existing environmental technologies. Some may even abandon highly polluting production lines in favor of developing green alternatives. By scaling up individual investments, these firms can enhance output value per unit of pollutant emissions, thereby mitigating or offsetting the cost increases associated with environmental regulations [27]. This cost advantage enables FDI enterprises with advanced environmental technologies to outperform their less sustainable counterparts, thereby constraining the sustainable development potential of polluting FDI enterprises in the host country [28]. Consequently, the market share of products from polluting FDI enterprises diminishes, facilitating the overall upgrading of the quality of China’s FDI.
This leads us to hypothesis H1: ER can improve the quality of FDI.

2.3. Mechanisms of ER Influence on FDI Quality

2.3.1. Green Competitiveness

Green competitiveness denotes a region’s ability to achieve sustainable economic and social development while protecting the ecological environment and transforming resource utilization patterns through innovation. This involves providing more resource-efficient and environmentally friendly technologies, as well as innovative products and services, compared to its competitors [29]. In contrast to sustainable competitiveness, which emphasizes productivity, and environmental competitiveness, which centers on the enterprise dimension, green competitiveness prioritizes “green” aspects such as natural resources, the ecological environment, energy consumption, and quality of life. It places a stronger emphasis on these dimensions compared to the other forms of competitiveness [30,31]. In the short term, ER may result in increased production costs for firms. Faced with such cost pressures, enterprises tend to rely on traditional tangible factors of production, such as physical capital and labor, to boost output and partially offset these cost increases [32]. However, this approach may lead to greater resource consumption and higher pollutant emissions, which not only undermine sustainable development but also impede improvements in overall green competitiveness [33]. From a long-term perspective, strengthened ER can facilitate the internalization of environmental costs, prompting firms to consider the impact of environmental factors during production [34]. This shift can lead to reduced resource consumption and lower pollution emissions, ultimately achieving a socially optimal level of production. Additionally, ER can effectively restore damaged environmental resources and encourage firms to adopt cleaner energy sources [35], foster technological innovation [36], and promote a more efficient allocation of production factors, including environmental resources. This holistic approach enhances green competitiveness across the board.
On the other hand, green competitiveness is closely linked to the attention and investment that local governments and enterprises dedicate to environmental protection [37]. Enhanced green competitiveness fosters a positive environmental reputation for the region, attracting FDI inflows to areas with a strong green image [38]. This not only mitigates risks associated with environmental violations but also helps avoid potential reputational damage and regulatory costs. Consequently, regions exhibiting higher levels of green competitiveness, as key players in China’s “dual-carbon” initiative, encourage FDI enterprises to offer more environmentally friendly and sustainable products to the local community [39]. This, in turn, facilitates the continuous improvement of local FDI quality during the transition to a greener, low-carbon economy.
This leads us to hypothesis H2: ER significantly improves the quality of FDI by increasing green competitiveness.

2.3.2. Green Technology Innovation

Schumpeter’s theory of innovation posits that economic changes arise not only from external factors, like variations in capital and labor, but also from internal innovations within the system [40]. Green technological innovation refers to efforts aimed at improving ecology, reducing pollution, and using energy and raw materials more efficiently. As a novel approach, it effectively addresses the conflict between economic development and environmental sustainability through green production [41]. Green technology innovation encompasses a range of activities wherein enterprises strategically direct their R&D investments toward the development of green technologies to reduce pollution emissions and enhance environmental competitiveness. The driving effect of ER on green technological innovation stems from two primary sources: external pressure from business stakeholders and internal incentives [42]. Regarding external pressure, ER imposes stringent constraints on FDI enterprises by establishing rigorous environmental standards and regulatory requirements. Stakeholder theory posits that firms should balance the interests of all stakeholders rather than solely focusing on shareholder wealth accumulation [43]. Consequently, to avoid financial penalties or reputational damage from non-compliance, enterprises are compelled to expedite green technological innovation, seeking solutions to reduce energy consumption and emissions while enhancing the environmental performance of their production processes. This aligns with Porter’s hypothesis [44]. In terms of internal incentives, ER can motivate managers to overcome organizational inertia and a lack of motivation for change. Green technological innovation emerges as a critical strategy for FDI firms to address local environmental regulations. By implementing green technological innovations, firms can achieve energy savings and emission reductions, yielding significant environmental benefits for society [45]. Additionally, they can develop greener and more differentiated products than their competitors, enabling them to stand out in a competitive market and capture new market share.
Green technological innovation is crucial for integrating environmental and economic goals, enhancing a region’s ability to attract and retain high-quality FDI by improving economic efficiency and establishing green brand value [46]. Firstly, FDI enterprises typically exhibit a strong demand for expansion and a willingness to innovate [47]. When the host country demonstrates a robust level of green technological innovation, local enterprises’ green R&D and new technologies can be transferred to FDI enterprises. This allows FDI enterprises to enhance their production technologies by “following and imitating” local innovations to comply with the host country’s environmental regulations [48]. Secondly, green technological innovation enables enterprises to develop a green brand image [49]. In response to environmental regulatory pressures and the increasing demands of stakeholders, managers of FDI enterprises are actively seeking sustainable innovation solutions and integrating them into their business decisions and strategic planning [50]. This approach fosters a win-win situation for the economy, society, and the environment, ultimately enhancing the quality of FDI.
This leads us to hypothesis H3: ER significantly improves the quality of FDI by enhancing green technology innovation.
Figure 2 illustrates the framework of our study.

3. Methodology

3.1. Methods

As two significant policies for environmental regulation in China, the exogenous impacts of the dual pilots of the LC and ETS on the pilot cities manifest in two dimensions: the ‘individual effect’ and the ‘time effect’. The ‘individual effect’ refers to the differences between pilot and non-pilot cities, while the ‘time effect’ pertains to the duration of the policy impact. When examining the aforementioned effects, most scholars currently employ the traditional DID model to evaluate the impacts of policy implementation [51]. The DID model is grounded in the principles of randomized experiments, enabling the identification of both individual and time-series double differences resulting from exogenous policy interventions. It effectively eliminates factors that change over time and lack identifiability. Compared to conventional methods of policy effect assessment, the DID model adeptly addresses the endogeneity problem, ultimately allowing for the accurate identification of genuine policy effects. Considering that the LC and ETS pilots have different specific times of policy implementation in different regions, this paper uses a multi-period DID model to test the impact of environmental regulation and FDI quality.
We construct the following model:
Q F D I i , t = α + β d i d i , t + γ X i , t + μ i + λ t + ε i , t
In Equation (1), i and t represent the city and year, respectively. QFDIi,t serves as the dependent variable in this study, indicating FDI quality. The variable didi,t is the central explanatory variable, representing ER through the cross-multiplication of year and individual dummies. Specifically, didi,t = 1 indicates that city i has been designated as a dual-pilot (LC and ETS) city in year t; otherwise, didi,t = 0. The coefficient β reflects the DID statistic, which is of primary interest in this analysis, capturing the net effect of establishing dual-pilot cities on FDI quality. If β > 0 and is statistically significant, it suggests that implementing ER significantly enhances FDI quality at the city level. Conversely, if β < 0 and is significant, it indicates a considerable reduction in FDI quality due to these regulations. If β is not statistically significant, it implies that environmental regulation does not have a meaningful impact on FDI quality in the city context. The term Xi,t represents other control variables that may influence FDI quality, while εi,t denotes the random disturbance term.
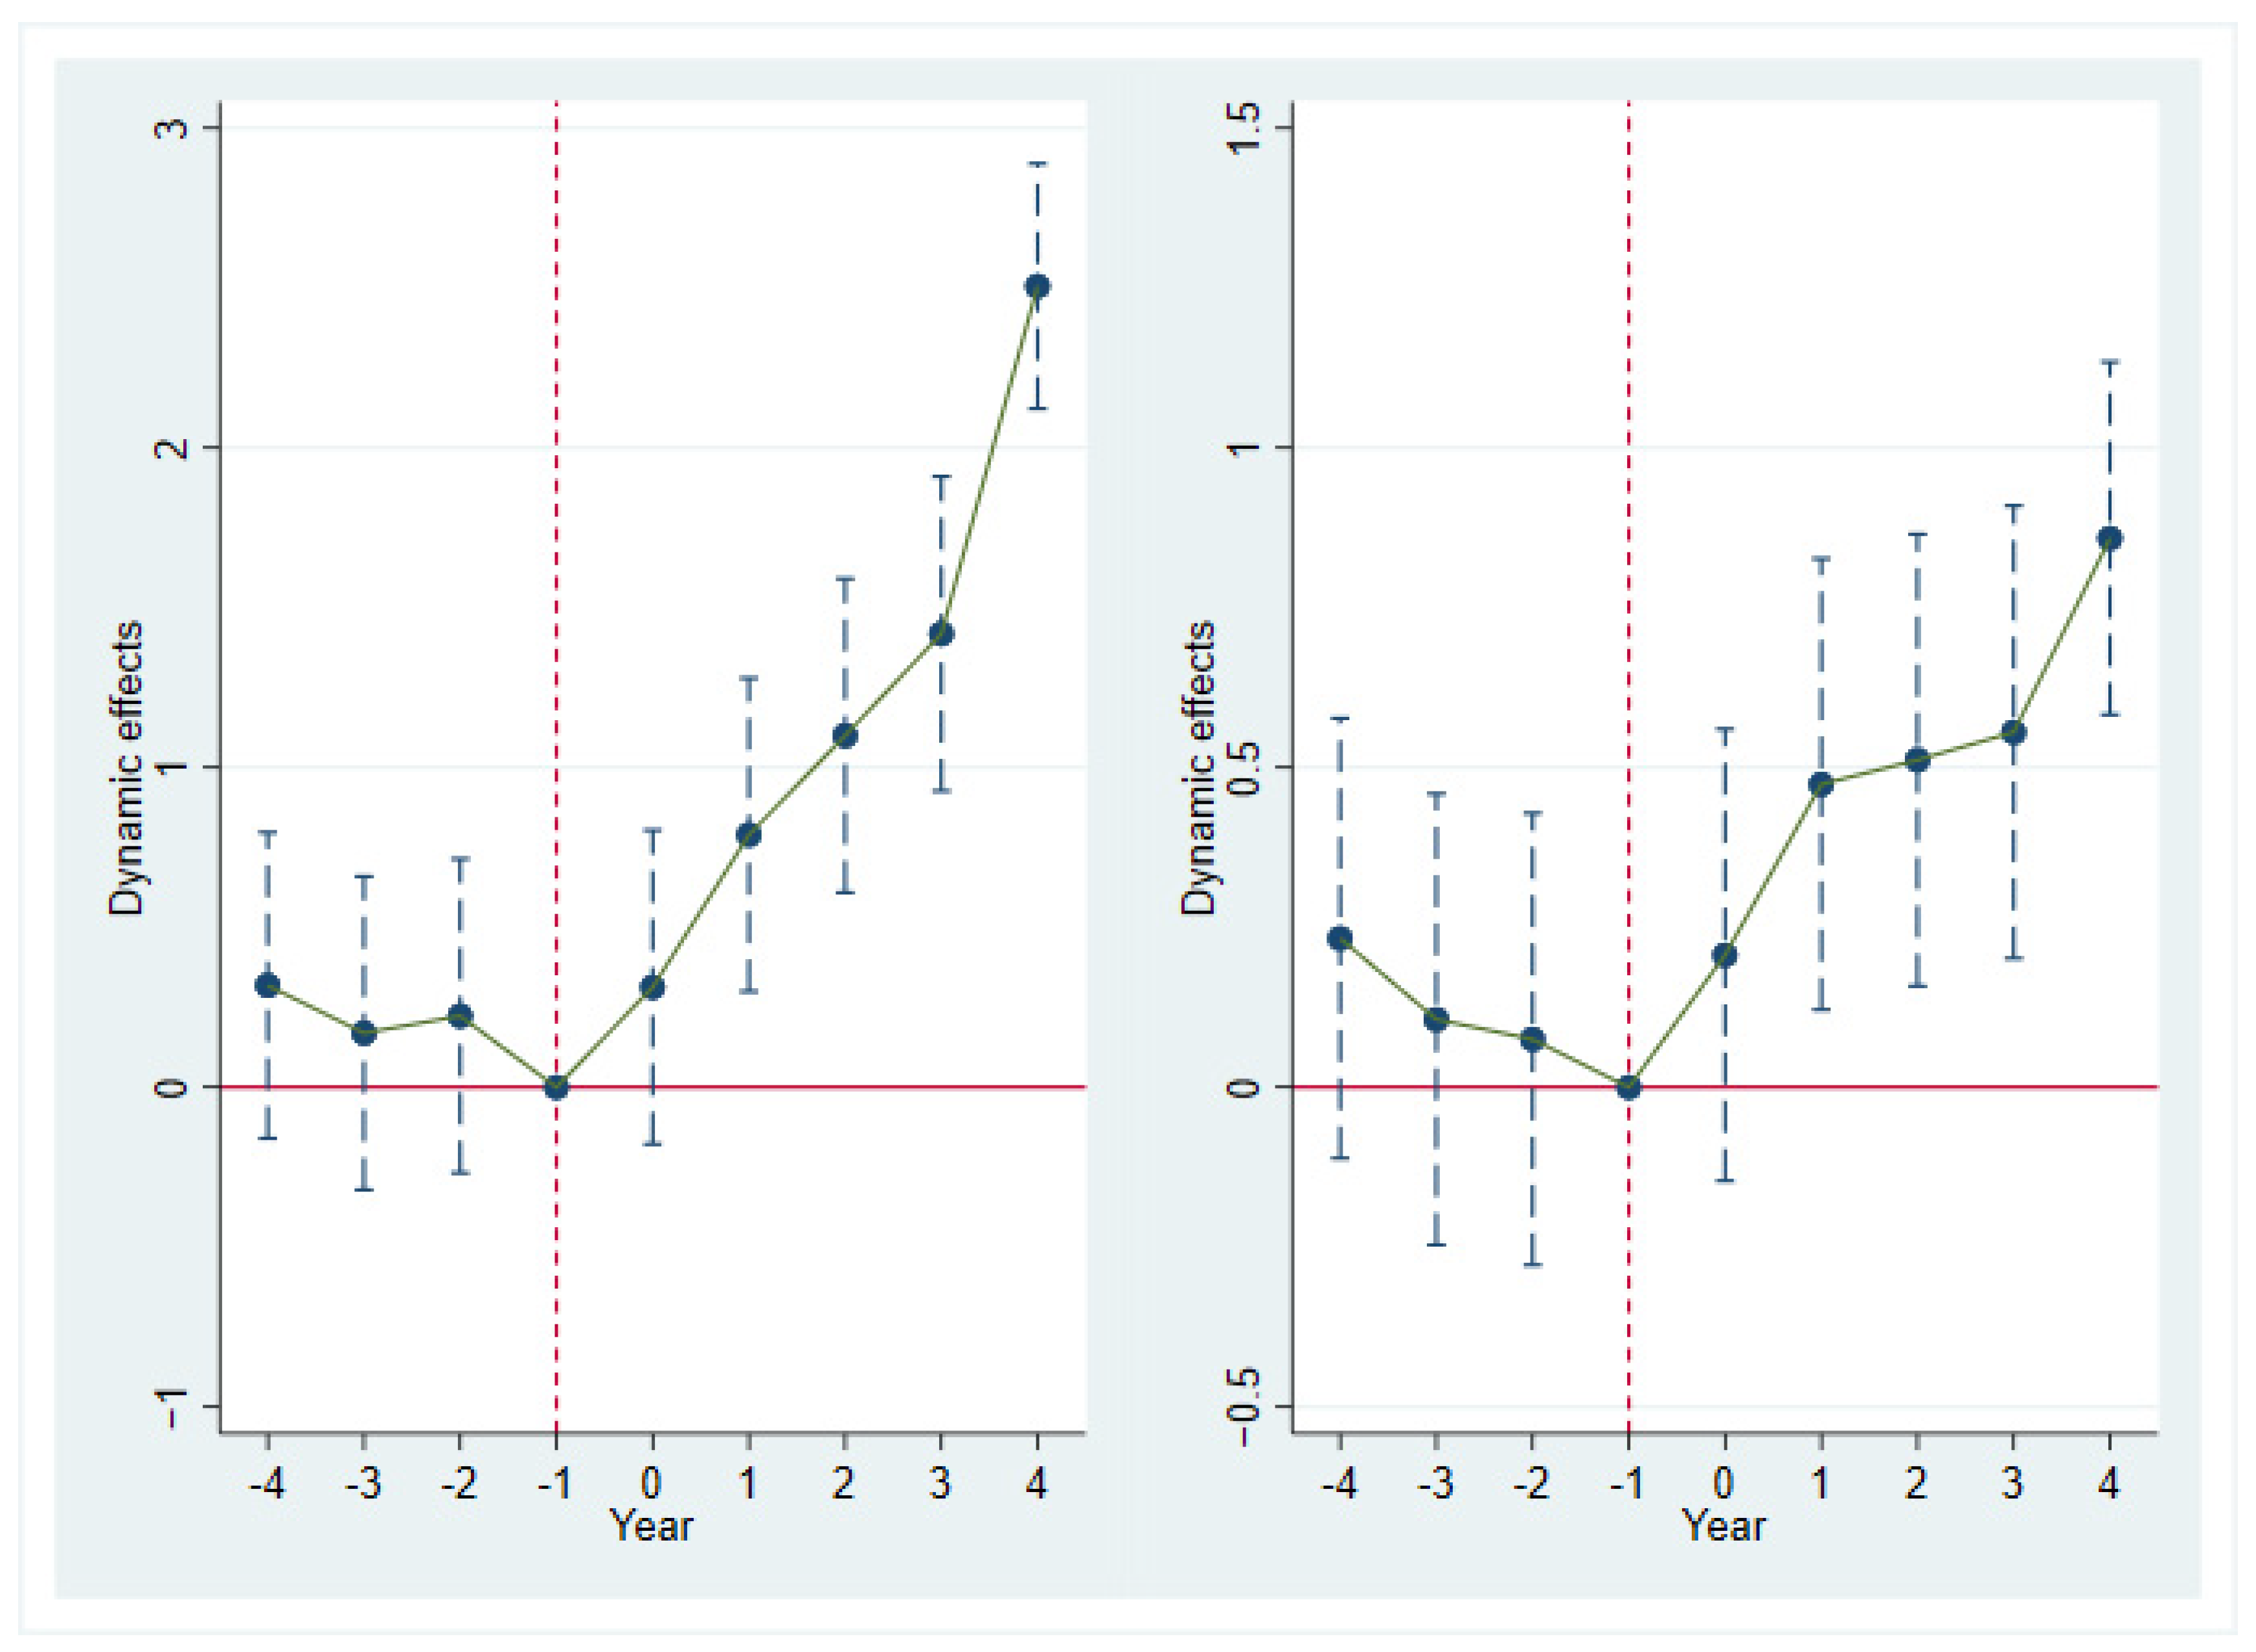
To meet the requirements for employing the DID model, it is essential to pass the common trend test. This entails that the tested variables exhibit consistent time effects or trends in both the experimental and control groups prior to the policy intervention; failure to do so may result in an overestimation or underestimation of the ER implementation effect in Equation (1). We assess the common trend hypothesis using an event analysis approach, selecting four periods before and four periods after the policy implementation to evaluate and analyze the dynamic effects of ER. The specific model construction is as follows:
Q F D I i , t = α + j = 4 4 β j d i d i , t j + γ X i , t + u i + λ t + ε i , t
In Equation (2), didi, tj represents the cross-multiplier of the city dummy variable and the year dummy variable, assigned a value of 1 when the city implements the ER in year tj; otherwise, it takes a value of 0. The coefficients β0, β−4 to β−1, and β1 to β4 correspond to the years surrounding the implementation of ER, specifically the four years prior to implementation and the four years following it. If the coefficients β−4 to β−1 are not statistically significant, this supports the validity of the common trend hypothesis.
To explore the transmission mechanism of “ER—FDI quality”, this study selects mechanistic variables that are theoretically related to FDI quality or congruent with common understanding. The analysis employs a combination of model regression and literature review to test these mechanisms.
In the first step, based on Equation (1), we assess whether the policy variable did has a significant effect on the explanatory variable QFDI. In the second step, we construct Equation (3) to examine the impact of the policy variable did on the mechanism variable M. In the third step, if the tests show significant effects of the policy variable did on both the explanatory variable QFDI and the mechanism variable M, we will conduct an empirical analysis informed by relevant theories and existing research to determine whether the influence pathway is realized. Consequently, this paper establishes the following mechanism testing model:
M i , t = α + β d i d i , t + γ X i , t + μ i + λ t + ε i , t
In Equation (3), Mi,t represents the mediating variable, while the coefficient β denotes the effect of the ER on this mediating variable. The remaining variables are consistent with those in the baseline model.
We construct a spatial econometric model to examine whether there is a spatial spillover effect of ER on FDI quality. We establish Equations (4)–(6):
Q F D I i , t = β 0 + θ W + β 1 d i d i , t + β 2 X i , t + μ i + λ t + ε i , t
Q F D I i , t = β 0 + γ W Q F D I i , t + β 2 W d i d i , t + β 3 X i , t + μ i + λ t + ε i , t
Q F D I i , t = β 0 + γ W Q F D I i , t + β 1 d i d i , t + ρ W d i d i , t + β 2 X i , t + β 3 W X i , t + μ i + λ t + ε i , t
Here, Equation (4) is denoted as the Spatial Error Model (SEM), which is able to identify the effect of spatial variables on the measurement space. Th variable θ denotes the spatial error coefficient, and W denotes the spatial weight matrix. Equation (5) is expressed as a spatial lag model (SAR) that is able to identify the impact of the dependent variable in the region on the dependent variable in its neighboring regions. The variable γ denotes the coefficient of the spatial lag term of QFDI. Equation (6) denotes the Spatial Durbin Model (SDM), which is able to identify both the impact of explanatory variables on the explained variables within the region and reflect the spatial spillover impact of the explanatory variables in the region on the explanatory variables in neighboring regions. The variable ρ denotes the coefficient of the spatial lag term of did.
The foundation for developing a spatial econometric model to assess whether the ER has spatial spillover effect on FDI quality lies in the necessity to determine if FDI quality exhibits spatial relevance. To examine this spatial correlation, we utilize the Moran’s I’ index. The calculation of the Moran’s I’ index is provided in Equations (7)–(9):
M o r a n s   I = a = 1 n b = 1 n W a b ( Q F D I a Q F D I ¯ ) ( Q F D I b Q F D I ) S 2 a = 1 n b = 1 n W a b
S 2 = 1 n ( Q F D I a Q F D I ¯ )
Q F D I ¯ = 1 n Q F D I a
Here, S2 is the variance of QFDI, Q F D I ¯   is the mean value of QFDI, and n is the number of sample cities. If Moran’s I is greater than 0, it means that there is a positive spatial correlation between the provinces, and vice versa for negative correlation.

3.2. Variables

3.2.1. Dependent Variable

There is currently no broad consensus among established studies regarding the measurement of FDI quality. Based on the findings of Shangguan and Guo [52] and Ye et al. [53], we categorize the quality of FDI in the following two ways:
(1) Average size of FDI (QFDI1) is measured by the ratio of the actual utilization of foreign capital to the number of foreign investment projects in the sample cities (see Equation (10)). Generally, a larger average size of FDI indicates a more pronounced driving effect on profit growth, scale expansion, technology upgrading, and the regional export capacity of local enterprises. It also suggests a stronger capacity for environmental protection, particularly in energy conservation and emission reduction, thereby increasing the likelihood of adopting proactive measures for the implementation of various environmental regulations.
Q F D I 1 = A c t u a l   u t i l i z a t i o n   o f   f o r e i g n   c a p i t a l   i n   t h e   c u r r e n t   y e a r N u m b e r   o f   i n v e s t m e n t   p r o j e c t s   b y   f o r e i g n   e n t e r p r i s e s
(2) FDI performance index (QFDI2) encompasses both the overall scale of FDI inflows and the external spillovers of FDI to the host country. These external spillovers comprehensively reflect the economic, social, and technological benefits generated by FDI during localized production in the host nation. This study adopts the FDI performance index published by the United Nations Conference on Trade and Development in the World Investment Report to construct the FDI performance index for each region (see Equation (11)). This index measures the degree of FDI attraction in a region; a higher degree of FDI inflow indicates more pronounced effects on economic growth, technological spillovers, and industry linkages associated with FDI.
Q F D I 2 = F D I i , t / F D I t G D P i , t / G D P t
QFDI2 denotes the amount of foreign investment actually utilized in city i in year t, while FDIi,t represents the total amount of foreign investment used in the entire country during the same year. GDPi,t refers to the Gross Domestic Product (hereinafter referred to as GDP) of city i in year t, whereas GDPi,t indicates the GDP of the entire country in that year.

3.2.2. Independent Variable (didi,t)

In this paper, the dual-pilot environmental policies of LC and ETS are treated as a quasi-natural experiment. Given the temporal sequences and geospatial differences in the implementation of these policies, the asymptotic DID model is employed as the empirical method, with policy dummy variables serving as the core explanatory variables.
First, the variable Treati is defined as the pilot city dummy variable; if a sample city is included in both pilot policy lists simultaneously, it is classified as the treatment group and assigned a value of 1; otherwise, it is assigned a value of 0. Second, the variable Timet is established as the time dummy variable, where a city that becomes a dual-pilot in a given year and in subsequent years is assigned a value of 1; otherwise, it is assigned a value of 0. Finally, the interaction term between the city dummy and the time dummy is designated as the core explanatory variable for this study. Thus, the interaction term of the city dummy variable and the time dummy variable is defined as the policy dummy variable didi,t.

3.2.3. Control Variables

Drawing upon the research findings of Hou et al. [54] and Li and Xiao [55] and taking into account data availability, this paper selects the following control variables: the level of economic development, the degree of openness to external trade, the level of air pollution, the size of the labor force, the level of investment in fixed assets, the level of technological innovation, and the quality of the labor force. The specific measurements of these control variables are presented in the accompanying Table 2.

3.2.4. Mechanism Variables

(1) Green Competitiveness (GTFP). This paper builds on the findings of Xia et al. [56] to define green competitiveness by assessing green total factor productivity based on non-expected output, employing the non-oriented SBM model–GML index. The specific measurements are as follows:
m i n ρ = 1 m i = 1 m x i x i k 1 s 1 + s 2 o = 1 S 1 y ¯ o y o k + u = 1 S 2 z ¯ u z u k
. t . x ¯ i = x ¯ i 0 + s ,   i = 1 ,   2 , m y ¯ o = y ¯ o k s ,   o = 1 ,   2 , s 1 z ¯ u = z ¯ u k + s ,   o = 1 ,   2 , s 2 x ¯ x 0 ,   0 y ¯ o y k , z ¯ u z k , z ¯ u 0 x ¯ j = 1 , j 0 n x j λ j y ¯ o j = 1 , j 0 n y o j λ j z ¯ u j = 1 , j 0 n Z o j λ j 0 λ j
Equation (12) is the objective function and Equation (13) is the qualification, where n is the number of decision-making units (DMUs) and m is the number of input variables. Variables s1 and s2 represent desired and non-desired outputs, respectively. Variables x, y and z are the elements in the input, desired output, and undesired output matrices, respectively, and λ is the weight vector. The selection and measurement of input indicators, desired outputs, and non-desired outputs are shown in Table 3.
(2) Green technological innovation (greeninn). This paper uses the number of green patent applications to measure urban green innovation. In order to eliminate the right-skewed distribution of green patent applications, this paper draws on existing studies, adds 1 to the number of green patent applications, and logarithmizes it.

3.3. Data Source

Considering the scientific rigor, rationality, and data availability, this paper collects panel data from 267 prefecture-level cities in China covering the period from 2005 to 2021 to assess the impact of ER on the quality of FDI. The relevant city-level data are sourced from the China Statistical Yearbook, China Urban Statistical Yearbook, China Environmental Statistical Yearbook, China Energy Statistical Yearbook, and the China Population and Employment Statistical Yearbook from previous years. All variables denominated in U.S. dollars, including FDI, are converted from RMB based on the average annual exchange rate between RMB and U.S. dollars and then calculated accordingly. Following established methodologies, the relevant variables are logarithmized to address issues of heteroscedasticity and scale. Data processing is performed using Stata 16.0 and MaxDEA.

4. Results

4.1. Correlation Test

To mitigate the risk of severe multicollinearity arising from high correlation among variables, this study employed the Pearson test for correlation analysis, with results presented in Figure 3. The analysis reveals that the correlation coefficients for the majority of variables are below 0.7, indicating an absence of significant multicollinearity.

4.2. Common Trend Test

Utilizing Equation (3) and employing event analysis to test the parallel trend hypothesis, we selected four periods before and four periods after the policy implementation to examine the dynamic effects of the policy. The regression results are presented in Figure 4. The estimated coefficients for did for both LC and ETS prior to the pilot policy implementation are greater than 0; however, they are not statistically significant, as the confidence intervals include zero. This indicates no significant difference in the quality of FDI between the experimental and control groups during the two-phase pilot policy implementation. In contrast, the estimated coefficients for did for LC and ETS after implementation are greater than 0, demonstrating a gradual increase, with confidence intervals that do not include zero. This suggests that the study passes the parallel trend test and indicates a continuity of the policy effect following implementation.

4.3. Baseline Regression Results

Utilizing Equation (1), the results of our empirical tests examining the relationship between ER and FDI quality are presented in Table 4. Columns (1) and (2) display the results of regressions that include only the policy dummy variable, while controlling for year and city fixed effects. Columns (3) and (4) present the results of regressions that incorporate additional control variables. The results indicate that the coefficient β for did is significantly positive at the 1% level, irrespective of the inclusion of control variables. This finding supports hypothesis H1, suggesting that the implementation of ER significantly enhances the quality of FDI in prefecture-level cities.
A comparison of the regression results in columns (1) and (2) with those in columns (3) and (4) reveals that, after adding control variables, the coefficient of determination R2 for QFDI1 and QFDI2 increases from 0.594 and 0.697 to 0.627 and 0.747, respectively. Additionally, the β coefficient for did changes from 0.087 and 0.063 to 0.085 and 0.059, reflecting a decrease in absolute value. This suggests that with the inclusion of control variables, the model is able to reduce the potential impact of omitted variables on the empirical results, thus improving the reliability of the regression analysis results. From the results in columns (3) and (4), compared with the non-pilot cities, the average size of FDI in the pilot cities QFDI1 increases by 1.188 units, and the FDI performance index QFDI2 increases by 0.312 units.

4.4. Robustness Tests

4.4.1. Exclusion of Other Policies

In addition to environmental regulations, the newly revised Environmental Protection Law, enacted in 2015, has increased the costs of illegal activities for polluting FDI enterprises due to stricter enforcement and regulatory measures [56] Furthermore, the smart city pilot program aims to attract high-tech enterprises to these areas. This program imposes rigorous requirements during the acceptance phase, compelling pilot city governments to continuously enhance the business environment, which positively impacts FDI quality [43]. To isolate the influence of other policies during the sample period and identify the “net effect” of ER on FDI quality, dummy variables representing the two policies were incorporated into the benchmark model for regression analysis. The results, presented in the Table 5, indicate that the estimated coefficients remain significantly positive at a minimum of the 5% level, with values of 1.046 and 0.219, respectively. This confirms the robustness of the empirical findings of the study.

4.4.2. Troubleshooting Outliers

Several variables exhibit standard deviations exceeding their means, indicating substantial variability within the study sample. We employ the Winsorization shrinkage method to reanalyze the samples at the 1% and 5% extremes of correlation after applying shrinkage. The results are presented in columns (3) to (6) of Table 5. The estimated coefficients for the did are significantly positive at the 1% level, and the shrinkage test of the empirical results does not alter the outcomes of the benchmark regression.

4.4.3. Placebo Test

The promotional effect of ER on the quality of FDI may still be influenced by chance-driven factors. To address this, this paper adopts the approach of Ye et al. [43], which involves randomly generating treatment groups to indirectly assess the impact of potential omitted characteristic variables on the estimation results.
According to Equation (14), the expression for the estimated coefficient βr for QFDI1i,t and QFDI2i,t is derived as follows:
β r = β + δ c o v   ( d i d i , t , ε i , t | τ ) v a r ( d i d i , t , τ )
Here, τ denotes all the control variables in this study.
If a variable can be identified to replace the did, and this variable is theoretically shown to have no effect on the corresponding QFDI1i,t and QFDI2i,t (i.e., β = 0), then estimating βr = 0 would demonstrate that δ = 0. This implies that unobservables do not influence the regression results.
In this paper, the ER shock to the city is regressed after randomization, and this random regression process is repeated 1000 times using Stata 16.0 software. The resulting 1000 regression coefficients βr and their corresponding p-values are obtained, and the kernel density distribution of these coefficient estimates is plotted. Figure 5 presents the results of the placebo tests for QFDI1 and QFDI2, respectively. As illustrated in the figures, βr is centered around 0 and is approximately normally distributed, which allows for the inference that δ = 0. This indicates that the unobserved urban characteristics in the study do not significantly affect the regression results, thereby passing the individual placebo test.

4.5. Mechanism Analysis

Based on Equation (3) and the literature analysis method, the study further explores the mechanism of ER on the quality of FDI and verifies whether hypotheses H2–H3 are valid.
The first aspect verified is the mechanism of the green competitiveness transmission effect. The regression results from Table 6 indicate that the coefficient of did is 0.009, which is statistically significant at the 5% level. This finding suggests that ER significantly enhances the region’s green competitiveness. Coupled with prior theoretical analysis and existing literature demonstrating the positive impact of green competitiveness on FDI quality [57], our results confirm hypothesis H2, indicating that the ER-GTFP-FDI quality mechanism is valid.
Secondly, we test the mechanism of the green technology innovation level. The regression results from Table 6 reveal that the coefficient of did is 0.373, which passes the significance test at the 1% level. This indicates that ER significantly enhances the level of green technology innovation in the region. When combined with prior theoretical analysis and existing literature supporting the positive impact of green technology innovation on the quality of FDI [58], our results confirm hypothesis H3, demonstrating that the ER-greeninn-FDI quality mechanism is valid.

4.6. Heterogeneity Analysis

4.6.1. Environmental Protection

In the context of ER, the formulation of scientifically sound policies by the government and their strict implementation are crucial for ensuring policy success. As the primary target of ER, the investment decisions of FDI enterprises are significantly influenced by the strength of regional environmental protection [59]. Given the variations in ER across different regions, the impact of environmental protection on FDI quality may differ substantially.
To address this, this paper incorporates the strength of environmental protection into a heterogeneity test. We measure the strength of regional environmental protection using the proportion of regional pollution control investment relative to regional GDP. Regions where the environmental protection strength exceeds the median are assigned a value of 1, while those below the median are assigned a value of 0. We then re-estimate the regression.
The results, presented in Table 7, indicate that in regions with stronger environmental protection efforts, the coefficient of did is 0.549 and is significant at the 1% level. Conversely, in regions with weaker environmental protection efforts, the coefficient of did is 0.190 but is not statistically significant. This suggests that ER has a more pronounced effect on the quality of FDI in regions with robust environmental protection, while the positive effect is not significant in regions with weaker protections.

4.6.2. Factor Endowment

Regional factor endowments significantly influence the quality of FDI. Variations among cities in terms of resource types, factor endowments, and factor utilization affect their infrastructure, market efficiency, and business environment, thereby impacting the quality of FDI in those regions [60]. Accordingly, this paper utilizes the National Sustainable Development Plan for Resource Cities (2013–2020) to categorize the sample cities into resource and non-resource cities. We then conduct regression analysis to examine the effect of regional factor endowments on FDI quality.
The regression results are presented in Table 8. Analyzing the estimated coefficient values of did across the four subsamples reveals that all coefficient values are significantly positive at the 1% level in the non-resource city sample, while none are significant in the resource city sample. This indicates that the positive impact of ER on FDI quality is pronounced in the non-resource city sample, whereas it does not exhibit a positive effect in the resource city sample.

4.7. Synergy Analysis

LC enhances the level of green technological innovation within the city, reduces environmental compliance costs for enterprises at the micro level, and encourages proactive emission reductions. At the macro level, it optimizes the regional industrial structure and improves the quality of FDI. ETS can significantly enhance FDI quality and serve as a catalyst for the city’s green and high-quality development. Consequently, there may be a synergistic effect between LC and ETS on FDI quality; specifically, the combined impact of both pilots on FDI quality is likely to be greater than that of either pilot alone. To investigate this, we conduct the following tests:
First, we examine the impact of LC and ETS on FDI quality separately. This involves excluding the sample of ETS-cities while retaining the samples of LC-cities and those that are neither LC-cities nor ETS-cities for regression analysis. In this context, the estimated coefficient of dtdid reflects the net effect of the LC on FDI quality. Conversely, the estimated coefficient of tpfdid indicates the net effect of ETS on FDI quality when the sample of LC-cities is excluded, while retaining the sample of ETS-cities and those that are neither LC-cities nor ETS-cities, followed by regression analysis. The results are presented in the Table 9. The estimated coefficient of dtdid in column (2) is 0.114, which is significantly positive at the 5% level. In contrast, the estimated coefficient of dtdid in column (4) is −0.442, indicating a significant negative impact at the 10% level. These findings suggest that the LC positively affects the FDI performance index at the 5% significance level, while the ETS exerts a significant negative influence on the FDI performance index.
Second, we further test and demonstrate whether the dual pilots of LC and ETS are more effective than the single pilots. This is accomplished by excluding samples that are neither LC-cities nor carbon ETS-cities and conducting regression analysis again. In this context, the estimated coefficient of did captures the net effect of dual-pilot cities on FDI quality, with results presented in columns (5) and (6) of Table 9. The estimated coefficients for did are all significantly positive at the 1% level. This indicates that the dual-pilot approach contributes more significantly to FDI quality in dual-pilot cities compared to single-pilot cities, suggesting that the dual-pilot strategy is more effective in influencing FDI quality than either the LC or ETS alone.

4.8. Spatial Effects

The previous analysis confirms the impact of ER on the quality of FDI. Building on this, the study constructs a geographic distance matrix and introduces an SDM to assess the effects of ER both within the region and in geographically connected areas.
Firstly, we calculate the spatial effects for the period 2005–2021 using Equations (7)–(9), with the results presented in Table 10. Notably, the Moran’s I index of FDI quality based on the geographic distance weight matrix is greater than zero for the period 2005–2021. Moreover, the p-value of the test results consistently falls below 0.1, which provides preliminary evidence that the necessary conditions for selecting and applying the spatial econometric model are satisfied.
Secondly, the study presents the results of the Likelihood Ratio test statistic for assessing spatial autocorrelation in FDI quality, utilizing the geographic distance spatial weight matrix (see Table 11). The LR test statistic significantly rejects the null hypothesis of no spatial autocorrelation at the 1% level, further confirming the presence of spatial autocorrelation in FDI quality. In conjunction with the Hausman test results, these findings warrant the selection of the Spatial Durbin Model to estimate the spillover effects of ER.
Finally, Table 12 presents the results of estimating the spatial spillovers associated with the impact of ER on the quality of FDI. Specifically, column (1) displays the estimation results derived from constructing the geographic distance matrix within the framework of the SDM. The coefficient for the variable did is 0.3728, which is significantly positive at the 1% level, while the coefficient for ρ is 0.8634, also significantly positive at the 1% level. These results indicate that ER has a significant positive effect on FDI quality within the region.
We further employ partial differentiation to the variables in the SDM to decompose the spatial spillover effect of ER on FDI quality into total, direct, and indirect effects. The regression results are presented in columns (2) to (4) of Table 12. The coefficient for the direct effect is 0.3686, significantly positive at the 1% level; the coefficient for the indirect effect is 1.490, significantly negative at the 5% level; and the coefficient for the total effect is 1.121, significantly negative at the 1% level. These findings indicate that ER exerts a significant negative spillover effect on FDI quality, with the effect showing an increasing trend. Our results reaffirm the potential validity of the pollution heaven hypothesis in the context of China.

5. Discussions and Conclusions

In the context of China’s efforts to promote green and low-carbon economic and social development, this paper examines whether China’s ER affects the quality of FDI. Utilizing panel data from 267 prefecture-level cities in China from 2005 to 2021, this study employs a quasi-natural experiment framework comparing two ER approaches: LC and ETS. The analysis explores the direct impact, the pathways of influence, the synergistic effects, and the heterogeneity of ER on the quality of FDI. The findings and discussions presented in this paper are as follows:
The results of our benchmark regression analysis indicate that ER effectively enhances the quality of FDI. This finding aligns with the results obtained from the policy network analysis model employed by [61]. The mechanism through which ER influences FDI quality can be conceptualized as the interaction and collaboration among various stakeholders, including government agencies (such as central and local governments), ETS, FDI enterprises, consumers, and other market participants, within a specific environmental policy framework [62]. The implementation of top-down ER by China’s central government indicates a shift in the country’s economic development from “brisk” growth to high-quality growth. The imperative for local governments to prioritize environmental considerations over economic gains has evolved. By raising environmental standards, the influx of high-pollution and high-energy-consumption FDI will be curtailed through the mechanisms of “pushing” and “correcting.” Consequently, local governments will be better positioned to attract high-quality FDI that incorporates advanced technologies. Simultaneously, FDI enterprises seeking to profit from investments in emerging markets like China will enhance their competitiveness through low-end industry transfers and high-tech reverse feedback, thereby aligning with the host country’s ER. This aligns with the findings of [63].
In the future, while China and other developing countries and emerging markets have made significant strides in environmental protection, gaps remain in comparison to developed nations regarding environmental protection laws and regulations, policy frameworks, and the cultivation of environmental awareness. These gaps are unlikely to be fully addressed in the short term, underscoring the importance of strengthening exchanges and cooperation with the international community. By engaging with advanced concepts and practices in international environmental protection and learning from the successful experiences of developed countries in formulating environmental laws, implementing policies, and fostering technological innovation, developing countries can enhance both the effectiveness of their environmental protection efforts and the quality of their economic development.
The results of our mechanism analysis indicate that ER can enhance the quality of FDI through two primary pathways: improving green competitiveness and fostering green technological innovation. Research by [64] highlights that green competitiveness serves as a crucial engine for the high-quality development of regions and cities. When a region’s green development exhibits positive growth trends, it can create increased investment and collaboration opportunities for multinational corporations. A favorable investment climate and promising development prospects constitute the core competitive advantages of a region in attracting FDI. This not only facilitates the short-term influx of high-quality FDI but also supports a stable virtuous cycle of attracting such investments over the long term through the clustering and scaling effects of high-quality industrial agglomeration [65]. These dynamics align with the characteristics of the environmental Kuznets curve. On the other hand, within the context of escalating ER in China, the tightening of these regulations positively influences green technological innovation, primarily through external pressures from stakeholders and internal incentives for enterprises [66]. Green technological innovation is pivotal for integrating environmental and economic objectives, enhancing a region’s capacity to attract and retain high-quality FDI by improving economic efficiency and establishing green brand value. This observation further suggests that the weak version of Porter’s hypothesis demonstrates significant applicability in China.
The results of our heterogeneity test indicate that ER significantly upgrades the quality of FDI in the sub-sample of regions characterized by higher environmental protection and non-resource-based economies. Simultaneously, the impact of ER on FDI quality exhibits a negative spatial spillover effect. According to signaling theory, stringent enforcement and supervision of ER in these areas convey a clear policy signal to investors, demonstrating the region’s strong commitment to sustainable development and a low-carbon economy [67]. This effectively attracts high-quality FDI that prioritizes long-term stability, sustainable development, and good governance. On the other hand, resource-based cities, with their excessive reliance on energy resources such as coal and oil during their economic development, have experienced more pronounced environmental pollution issues in their early production phases. Consequently, when ER is enacted, these cities encounter the dual pressures of significant emission reduction demands and limited technical capabilities, leading to less effective implementation outcomes. In contrast, non-resource-based cities demonstrate a lower dependency on resources, a stronger foundation for economic development, and a more rational organization of new energy industries. This positions non-resource cities to enhance the quality of FDI more effectively in response to ER.
In the future, developing countries and emerging markets should adhere to the principle of customizing their development models to local conditions and urban policies. They should leverage the comparative advantages of each region and align local industrial development strategies with the availability of production factors to formulate a series of attractive policy combinations tailored to high-quality FDI enterprises. This approach aims to reduce the overall operational costs for foreign-invested firms and enhance their competitiveness and development potential within their respective countries.
The results of our synergy effect test indicate that, compared to single-pilot environmental policies, the designation of a dual-pilot city has a stronger positive impact on the quality of FDI. This suggests that dual-pilot environmental policies are more effective in influencing FDI quality than single-pilot policies alone. This enhanced effect may stem from the follow-cost theory, which posits that LC can improve the level of green technological innovation in cities. Indeed, this aligns with the policy synergies outlined in policy synergy theory. This, in turn, reduces the environmental follow-costs for enterprises at the micro level, encouraging them to proactively reduce emissions. Additionally, LC initiatives can optimize the regional industrial structure at the macro level, further enhancing FDI quality. For ETS, transitioning to an LC-city can significantly elevate FDI quality and drive the city’s green and high-quality development. Therefore, a synergistic effect may exist between the low-carbon pilot city and the carbon emissions trading policy regarding their impact on regional FDI quality. This finding aligns with the Motivation, Incentives, and Information analytical framework [68]. In the context of China’s current environmental governance, local governments retain considerable autonomy, with primary pressure focused on achieving end results rather than managing the entire process. Consequently, the motivations driving local government autonomy significantly influence outcomes. In the context of the overarching environmental emission reduction targets and in response to central government policy pressures, market incentives, and the transmission of green information, the dual pilot approach of LC and ETS exerts a more substantial impact on FDI quality than the single pilot approach.

6. Limitations and Perspectives

Although our study elucidates the relationship between ER and FDI quality at a theoretical level and validates this analysis through various panel regression models, it has certain limitations. Specifically, our research is focused on China, which, while offering insights relevant to other developing countries and emerging markets, restricts the global applicability of our conclusions. Consequently, we aspire to investigate the relationship between ER and FDI across various country types, particularly within both developed and developing nations, from a global perspective in future research. This endeavor aims to contribute to the sustainable development of the global economy and environment.

Author Contributions

Z.Z.: Conceptualization, Data curation, Methodology, Visualization, Roles, Writing—original draft, Writing—review & editing, Funding acquisition, Software. Y.C.: Validation, Supervision. C.Y.: Supervision, Validation, Investigation, Project administration, Resources. C.Y.: Validation. C.Y.: Supervision, Writing—review & editing. L.L.: Writing—review & editing. All authors have read and agreed to the published version of the manuscript.

Funding

This research was funded by Sichuan Academy of Social Sciences, “Construction of Twin-city Economic Circle in Chengdu-Chongqing Area” Special Project (24YBCY23), Funded by Sichuan Academy of Social Sciences; General Project of Key Research Base of Philosophy and Social Science in Sichuan Province (2024QZGYYB010), Funded by the Research Center for Economic, Social and Cultural Development on the Tibetan Plateau; Central Universities Fundamental Scientific Research Operating Expenses Research Special Program (PA-11), Funded by Sichuan University.

Data Availability Statement

Dataset available on request from the authors.

Conflicts of Interest

The authors declare no conflicts of interest.

References

  1. Hayat, A. Foreign Direct Investments, Institutional Quality, and Economic Growth. J. Int. Trade Econ. Dev. 2019, 28, 561–579. [Google Scholar] [CrossRef]
  2. Zhang, S.; Han, Z.; Guo, M. FDI, New Development Philosophy and China’s High-Quality Economic Development. Environ. Dev. Sustain. 2023, 26, 25227–25255. [Google Scholar] [CrossRef]
  3. World Investment Report 2024: Investment Facilitation and Digital Government | Publications | UNCTAD Investment Policy Hub. Available online: https://investmentpolicy.unctad.org/publications/1295/world-investment-report-2024-investment-facilitation-and-digital-government (accessed on 6 December 2024).
  4. Hamid, I.; Jena, P.K.; Mukhopdhyay, D. Should China Prefer More Foreign Direct Investment Inflows to Environmental Change? J. Public Aff. 2022, 22, e2466. [Google Scholar] [CrossRef]
  5. Su, C.-W.; Umar, M.; Chang, H.-L. Nonlinear Dependence Between Economic Policy Uncertainty and Fdi Inflows in China. Econ. Comput. Econ. Cybern. Stud. 2022, 56, 153–168. [Google Scholar] [CrossRef]
  6. Li, X.; Xiao, L. The Impact of Urban Green Business Environment on FDI Quality and Its Driving Mechanism: Evidence from China. World Dev. 2024, 175, 106494. [Google Scholar] [CrossRef]
  7. Demena, B.A.; Afesorgbor, S.K. The Effect of FDI on Environmental Emissions: Evidence from a Meta-Analysis. Energy Policy 2020, 138, 111192. [Google Scholar] [CrossRef]
  8. Ding, G.; Xiong, Y.; Wang, Y. Moderating Effect of Digital Governance and Eco-Policy Stringency in Realizing Natural Resources-Growth Nexus: Role of Financial Development and FDI in G20 Countries. Resour. Policy 2024, 92, 104976. [Google Scholar] [CrossRef]
  9. Liao, B.; Li, L. Spatial Division of Labor, Specialization of Green Technology Innovation Process and Urban Coordinated Green Development: Evidence from China. Sustain. Cities Soc. 2022, 80, 103778. [Google Scholar] [CrossRef]
  10. Wu, W.; Liu, Y.; Wu, C.-H.; Tsai, S.-B. An Empirical Study on Government Direct Environmental Regulation and Heterogeneous Innovation Investment. J. Clean. Prod. 2020, 254, 120079. [Google Scholar] [CrossRef]
  11. Huang, J.; Ma, L. Substantive Green Innovation or Symbolic Green Innovation: The Impact of Fintech on Corporate Green Innovation. Financ. Res. Lett. 2024, 63, 105265. [Google Scholar] [CrossRef]
  12. Deng, M.-Z.; Zhang, W.-X. Recognition and Analysis of Potential Risks in China’s Carbon Emission Trading Markets. Adv. Clim. Change Res. 2019, 10, 30–46. [Google Scholar] [CrossRef]
  13. Zhu, Y.; Wang, K. Policy Synergy Analysis on Coordinating Reduction of Pollution and Carbon Emissions in China: Insights from Text Mining and Network Analysis. J. Environ. Manag. 2024, 372, 123389. [Google Scholar] [CrossRef] [PubMed]
  14. deMello, L.R. Foreign Direct Investment in Developing Countries and Growth: A Selective Survey. J. Dev. Stud. 1997, 34, 1–34. [Google Scholar] [CrossRef]
  15. Guo, S.; Song, Q.; Qi, Y. Innovation or Implementation? Local Response to Low-Carbon Policy Experimentation in China. Rev. Policy Res. 2021, 38, 555–569. [Google Scholar] [CrossRef]
  16. Huang, J.; Cao, J.; Hasan, T.; Zhao, J. Low-Carbon City Initiatives and Firm Risk: A Quasi-Natural Experiment in China. J. Financ. Stab. 2021, 57, 100949. [Google Scholar] [CrossRef]
  17. Wang, X.; Wang, C. Is There a Green Path to Economic Growth: A Study on China’s Low-Carbon City Initiative. Appl. Econ. Lett. 2023, 1–6. [Google Scholar] [CrossRef]
  18. Lv, M.; Bai, M. Evaluation of China’s Carbon Emission Trading Policy from Corporate Innovation. Financ. Res. Lett. 2021, 39, 101565. [Google Scholar] [CrossRef]
  19. Kumar, N. Use and Effectiveness of Performance Requirements: What Can Be Learnt from the Experiences of Developed and Developing Countries? In Development Dimension of FDI: Policy and Rule-Making Perspectives; United Nations: New York, NY, USA, 2003; pp. 59–78. [Google Scholar]
  20. Becker, J.; Fuest, C.; Riedel, N. Corporate Tax Effects on the Quality and Quantity of FDI. Eur. Econ. Rev. 2012, 56, 1495–1511. [Google Scholar] [CrossRef]
  21. Sargent, J.; Matthews, L. China versus Mexico in the Global EPZ Industry: Maquiladoras, FDI Quality, and Plant Mortality. World Dev. 2009, 37, 1069–1082. [Google Scholar] [CrossRef]
  22. Pan, X.; Guo, S.; Han, C.; Wang, M.; Song, J.; Liao, X. Influence of FDI Quality on Energy Efficiency in China Based on Seemingly Unrelated Regression Method. Energy 2020, 192, 116463. [Google Scholar] [CrossRef]
  23. Cheng, Z.; Li, L.; Liu, J. The Impact of Foreign Direct Investment on Urban PM2.5 Pollution in China. J. Environ. Manag. 2020, 265, 110532. [Google Scholar] [CrossRef] [PubMed]
  24. Khan, M.; Ozturk, I. Examining the Direct and Indirect Effects of Financial Development on CO2 Emissions for 88 Developing Countries. J. Environ. Manag. 2021, 293, 112812. [Google Scholar] [CrossRef] [PubMed]
  25. Furrer, O.; Egri, C.P.; Ralston, D.A.; Danis, W.; Reynaud, E.; Naoumova, I.; Molteni, M.; Starkus, A.; Leon Darder, F.; Dabic, M.; et al. Attitudes toward Corporate Responsibilities in Western Europe and in Central and East Europe. Manag. Int. Rev. 2010, 50, 379–398. [Google Scholar] [CrossRef]
  26. Dou, S.; Lee, M. The Effect of Environmental Regulation and Regional FDI on Firms’ Productivity in China: Using a DDD Method. Pol. J. Environ. Stud. 2024, 33, 4561–4571. [Google Scholar] [CrossRef]
  27. Famanta, M.; Randhawa, A.A.; Yajing, J. The Impact of Green FDI on Environmental Quality in Less Developed Countries: A Case Study of Load Capacity Factor Based on PCSE and FGLS Techniques. Heliyon 2024, 10, e28217. [Google Scholar] [CrossRef]
  28. Sun, H.; Liu, Z.; Chen, Y. Foreign Direct Investment and Manufacturing Pollution Emissions: A Perspective from Heterogeneous Environmental Regulation. Sustain. Dev. 2020, 28, 1376–1387. [Google Scholar] [CrossRef]
  29. Cheng, X.; Long, R.; Chen, H.; Li, W. Green Competitiveness Evaluation of Provinces in China Based on Correlation Analysis and Fuzzy Rough Set. Ecol. Indic. 2018, 85, 841–852. [Google Scholar] [CrossRef]
  30. Despotovic, D.; Cvetanovic, S.; Nedic, V.; Despotovic, M. Economic, Social and Environmental Dimension of Sustainable Competitiveness of European Countries. J. Environ. Plan. Manag. 2016, 59, 1656–1678. [Google Scholar] [CrossRef]
  31. Seroka-Stolka, O.; Fijorek, K. Linking Stakeholder Pressure and Corporate Environmental Competitiveness: The Moderating Effect of ISO 14001 Adoption. Corp. Soc. Responsib. Environ. Manag. 2022, 29, 1663–1675. [Google Scholar] [CrossRef]
  32. Jiang, F.; Guo, L.; Chen, C. Pollution Haven Effect in North-South Trade: A Theoretical Analysis under the Mixed Duopoly Cournot Model. Appl. Econ. Lett. 2022, 29, 1205–1210. [Google Scholar] [CrossRef]
  33. Fang, J.; Liu, C.; Gao, C. The Impact of Environmental Regulation on Firm Exports: Evidence from Environmental Information Disclosure Policy in China. Environ. Sci. Pollut. Res. 2019, 26, 37101–37113. [Google Scholar] [CrossRef] [PubMed]
  34. Liu, H.; Owens, K.A.; Yang, K.; Zhang, C. Pollution Abatement Costs and Technical Changes under Different Environmental Regulations. China Econ. Rev. 2020, 62, 101497. [Google Scholar] [CrossRef]
  35. Dam, L.; Scholtens, B. The Curse of the Haven: The Impact of Multinational Enterprise on Environmental Regulation. Ecol. Econ. 2012, 78, 148–156. [Google Scholar] [CrossRef]
  36. Luo, S.; Mabrouk, F. Nexus between Natural Resources, Globalization and Ecological Sustainability in Resource-Rich Countries: Dynamic Role of Green Technology and Environmental Regulation. Resour. Policy 2022, 79, 103027. [Google Scholar] [CrossRef]
  37. Afum, E.; Li, Y.; Han, P.; Sun, Z. Interplay between Lean Management and Circular Production System: Implications for Zero-Waste Performance, Green Value Competitiveness, and Social Reputation. J. Manuf. Technol. Manag. 2022, 33, 1213–1231. [Google Scholar] [CrossRef]
  38. Liu, X.; Zhang, W.; Liu, X.; Li, H. The Impact Assessment of FDI on Industrial Green Competitiveness in China: Based on the Perspective of FDI Heterogeneity. Environ. Impact Assess. Rev. 2022, 93, 106720. [Google Scholar] [CrossRef]
  39. Li, P.; Bi, P. Study on the Regional Differences and Promotion Models of Green Technology Innovation Performance in China: Based on Entropy Weight Method and Fuzzy Set-Qualitative Comparative Analysis. IEEE Access 2020, 8, 226931–226941. [Google Scholar] [CrossRef]
  40. Gualerzi, D. Elaborating on the Demand-Side of Economic Development: Schumpeter and Neo-Schumpeterian Theory. Int. J. Polit. Econ. 2024, 53, 187–201. [Google Scholar] [CrossRef]
  41. Li, H.; Liu, J.; Wang, H. Impact of Green Technology Innovation on the Quality of Regional Economic Development. Int. Rev. Econ. Financ. 2024, 93, 463–476. [Google Scholar] [CrossRef]
  42. Zhang, F.; Zhu, L. Enhancing Corporate Sustainable Development: Stakeholder Pressures, Organizational Learning, and Green Innovation. Bus. Strateg. Environ. 2019, 28, 1012–1026. [Google Scholar] [CrossRef]
  43. Zhang, J.; Liang, G.; Feng, T.; Yuan, C.; Jiang, W. Green Innovation to Respond to Environmental Regulation: How External Knowledge Adoption and Green Absorptive Capacity Matter? Bus. Strateg. Environ. 2020, 29, 39–53. [Google Scholar] [CrossRef]
  44. Peng, B.; Tu, Y.; Wei, G. Can Environmental Regulations Promote Corporate Environmental Responsibility? Evidence from the Moderated Mediating Effect Model and an Empirical Study in China. Sustainability 2018, 10, 641. [Google Scholar] [CrossRef]
  45. Zhu, Z.; Huang, Y.; Hu, C.; Yan, Y. The Green Effects of Competition: Administrative Monopoly Regulation and Green Innovation. Financ. Res. Lett. 2024, 64, 105488. [Google Scholar] [CrossRef]
  46. Zhang, X.; Xiao, Y.; Wang, L. Can the Sci-Tech Innovation Increase the China’s Green Brands Value?-Evidence from Threshold Effect and Spatial Dubin Model. Entropy 2023, 25, 290. [Google Scholar] [CrossRef]
  47. Chen, Q.; Tang, S.; Xu, Y.; Lin, J. How Much State Ownership Is More Conducive to Corporate Innovation in Firms? Evidence from China. Asian J. Technol. Innov. 2024, 32, 37–64. [Google Scholar] [CrossRef]
  48. Fourne, S.P.L.; Zschoche, M. Reducing Uncertainty in Follow-up Foreign Direct Investment: Imitation by Family Firms. Glob. Strateg. J. 2020, 10, 839–860. [Google Scholar] [CrossRef]
  49. Li, J.; Sun, X.; Li, G. Relationships Among Green Brand, Brand Equity and Firm Performance: Empirical Evidence from China. Transform. Bus. Econ. 2018, 17, 221–236. [Google Scholar]
  50. Jin, H.; Li, H.; Zhao, T.; Pang, Y. Role of the Sharing Economy in the Achievement of Energy Efficiency and Sustainable Economic Development: Evidence from China. J. Innov. Knowl. 2023, 8, 100296. [Google Scholar] [CrossRef]
  51. Zhao, Z.; Ye, C. The Impact of China’s Low-Carbon Initiative on the Location Expansion of International SPA Enterprises. Discret. Dyn. Nat. Soc. 2021, 2021, 8933067. [Google Scholar] [CrossRef]
  52. Shangguan, Y.; Guo, W. Is FDI a High-Quality Investment? Evidence from the Changes in the Chinese FDI after HSR Opening. Appl. Econ. 2022, 54, 6863–6874. [Google Scholar] [CrossRef]
  53. Ye, C.; Zhao, Z.; Cai, J. The Impact of Smart City Construction on the Quality of Foreign Direct Investment in China. Complexity 2021, 2021, 5619950. [Google Scholar] [CrossRef]
  54. Hou, L.; Li, Q.; Wang, Y.; Yang, X. Wages, Labor Quality, and FDI Inflows: A New Non-Linear Approach. Econ. Model. 2021, 102, 105557. [Google Scholar] [CrossRef]
  55. Xia, R.; Wei, D.; Jiang, H.; Ding, Y.; Luo, X.; Yin, J. Research on the Coordinated Development and Convergence Characteristics of China’s Urban Competitiveness and Green Total Factor Productivity. Ecol. Indic. 2024, 161, 111954. [Google Scholar] [CrossRef]
  56. Xu, Y.; Du, Z.; Kong, L.; Xu, K. Research on the Impact of Public Environmental Participation on Foreign Direct Investment: Evidence from China. Environ. Res. Commun. 2024, 6, 025019. [Google Scholar] [CrossRef]
  57. Rokhmawati, A. The Nexus among Green Investment, Foreign Ownership, Export, Greenhouse Gas Emissions, and Competitiveness. Energy Strateg. Rev. 2021, 37, 100679. [Google Scholar] [CrossRef]
  58. Yin, X.S.; Hussain, J. The Implication of Technological Innovation and Tourism Development on FDI-Growth-Environment Nexus in Association of Southeast Asian Countries: A Simultaneity Modeling Analysis. Energy Sources Part B 2021, 16, 878–902. [Google Scholar] [CrossRef]
  59. Yuan, B.; Yin, Q. Does Green Foreign Investment Contribute to Air Pollution Abatement? Evidence from China. J. Int. Dev. 2024, 36, 912–938. [Google Scholar] [CrossRef]
  60. Siddiqui, A.; Iqbal, A. In Search of Spatial Interdependence of US Outbound FDI in the MENA Region. World Econ. 2018, 41, 1415–1436. [Google Scholar] [CrossRef]
  61. Kalantari, E.; Montazer, G.; Ghazinoory, S. Modeling the Characteristics of Collaborative Science and Technology Policy Network. Technol. Anal. Strateg. Manag. 2022, 34, 504–517. [Google Scholar] [CrossRef]
  62. Tanaka, M.; Chen, Y.; Siddiqui, A.S. Regulatory Jurisdiction and Policy Coordination: A Bi-Level Modeling Approach for Performance-Based Environmental Policy. J. Oper. Res. Soc. 2022, 73, 509–524. [Google Scholar] [CrossRef]
  63. Cai, X.; Lu, Y.; Wu, M.; Yu, L. Does Environmental Regulation Drive Away Inbound Foreign Direct Investment? Evidence from a Quasi-Natural Experiment in China. J. Dev. Econ. 2016, 123, 73–85. [Google Scholar] [CrossRef]
  64. Zhao, Z.; Zheng, Y.; Ye, C.; Chen, S.; Wu, T. The Impact of Carbon Emissions Trading System on Regional Green Innovation: A Perspective of Foreign Investment Agglomeration. Pol. J. Environ. Stud. 2024, 33, 4973–4985. [Google Scholar] [CrossRef] [PubMed]
  65. Fabrizi, A.; Gentile, M.; Guarini, G.; Meliciani, V. The Impact of Environmental Regulation on Innovation and International Competitiveness. J. Evol. Econ. 2024, 34, 169–204. [Google Scholar] [CrossRef]
  66. Yang, Y.; Xiao, Z.; Gong, Y.; al Humdan, E. The Tone of Buyer Firms’ Annual Reports and Suppliers’ Green Innovation: The Spillover Effects in the Supply Chain. Bus. Strateg. Environ. 2024, 33, 5721–5735. [Google Scholar] [CrossRef]
  67. Nie, S. Does Intellectual Property Rights Protection Matter for Low-Carbon Transition? The Role of Institutional Incentives. Econ. Model. 2024, 140, 106842. [Google Scholar] [CrossRef]
  68. Evans, M.F.; Gilpatric, S.M.; Liu, L. Regulation with Direct Benefits of Information Disclosure and Imperfect Monitoring. J. Environ. Econ. Manag. 2009, 57, 284–292. [Google Scholar] [CrossRef]
Figure 1. Trends in the size of responsible investment in five global markets. Data Source: Global Sustainable Investment Alliance (GSIA).
Systems 12 00586 g001
Figure 2. Research Framework.
Systems 12 00586 g002
Figure 3. Correlation test.
Systems 12 00586 g003
Figure 4. Common trend test.
Systems 12 00586 g004
Figure 5. Placebo tests.
Systems 12 00586 g005
Table 1. ETS Area.
Table 1. ETS Area.
Pilot AreaLaunch TimeEnterprise Inclusion CriteriaNumber of Enterprises
ShenzhenJune
2013
Industrial enterprises with carbon dioxide emissions of 3000 tons or more in any one year from 2009 to 2013635
BeijingNovember
2013
Enterprises and institutions with carbon dioxide emissions of 10,000 tons (including direct and indirect emissions) or more in any one year from 2009 to 2012543
ShanghaiNovember 2013Industrial enterprises with carbon dioxide emissions of 20,000 tons or more in any one year from 2009 to 2011197
GuangdongDecember 2013Enterprises with carbon dioxide emissions of 20,000 tons or energy consumption of 10,000 tons of standard coal or more in any one year from 2011 to 2012202
TianjinDecember 2013Industrial enterprises with carbon dioxide emissions of 20,000 tons or more in any one year from 2009 to 2012114
HubeiFebruary 2014Industrial enterprises with comprehensive energy consumption of 60,000 tons of standard coal or above in any one year from 2009 to 2014167
ChongqingJune
2014
Industrial enterprises with carbon dioxide emissions of 20,000 tons or more in any one year from 2008 to 2012242
Fujian ProvinceSeptember 2016Industrial enterprises with total comprehensive energy consumption of 10,000 tons of standard coal or more in any one year from 2013 to 2016255
Source: Organized by the authors.
Table 2. Control variables.
Variable TypeVariable NameVariable SymbolDefinition
Control VariablesLevel of economic developmentpergdpRegional GDP per capita
Level of opening to the outside worldopenRegional utilized foreign capital/regional GDP
Air pollution levelSO_2Regional industrial sulfur dioxide emissions
Labor force sizelaborNumber of employees at the end of the year
Level of fixed asset investmentinvestRegional fixed asset investment/Regional GDP
Level of technological innovationinnovationRegional patent authorization
Labor force quality leveledupayRegional education expenditures
Table 3. Input and output.
Primary IndicatorSecondary Indicator
Input indicatorsNumber of employees at the end of the year
Capital stock
Electricity consumption
Desired outputsActual GDP
Non-desired outputsSulphur dioxide emissions
Table 4. Baseline regression results.
(1)(2)(3)(4)
Variable Q F D I 1 Q F D I 2 Q F D I 1 Q F D I 2
d i d 1.238 ***0.369 ***1.188 ***0.312 ***
(0.087)(0.063)(0.085)(0.059)
S O 2 −0.094 ***−0.112 ***
(0.024)(0.017)
p e r g d p 0.450 ***−0.026
(0.092)(0.064)
o p e n 4.945 ***5.242 ***
(0.306)(0.213)
l a b o r 0.332 ***0.270 ***
(0.097)(0.067)
i n n o v a t i o n 0.051 **0.006
(0.024)(0.017)
i n v e s t 0.350 ***0.456 ***
(0.068)(0.047)
e d u p a y 0.250 **0.666 ***
(0.107)(0.074)
Cons8.628 ***1.345 ***−0.331−7.303 ***
(0.016)(0.012)(1.333)(0.927)
N 4539453945394539
Adj- R 2 0.5940.6970.6270.747
Year FEYesYesYesYes
City FEYesYesYesYes
Note: ** and *** denote 5% and 1% significance levels, respectively; standard errors in parentheses.
Table 5. Robustness tests results.
(1)(2)(3)(4)(5)(6)
Variables Q F D I 1 Q F D I 2 Q F D I 1 Q F D I 1 Q F D I 2 Q F D I 2
1%5%1%5%
d i d 1.046 ***0.219 **1.178 ***1.133 ***0.281 ***0.237 ***
(0.118)(0.102)(0.083)(0.072)(0.057)(0.051)
l a w 0.736 **−0.598 **
(0.313)(0.270)
s m a r t 0.0480.169 ***
city(0.070)(0.061)
ControlYesYesYesYesYesYes
Cons1.762−5.614 ***−0.1600.699−7.103 ***−5.816 ***
(1.366)(1.177)(1.301)(1.141)(0.894)(0.810)
N 453945394539453945394539
Adj- R 2 0.3730.1850.6100.6160.7490.757
Year FeYesYesYesYesYesYes
City FeYesYesYesYesYesYes
Note: ** and *** denote 5% and 1% significance levels, respectively; standard errors in parentheses.
Table 6. Mechanism test results.
(1)(2)
Variables G T F P g r e e n i n n
d i d 0.009 **0.373 ***
(0.004)(0.047)
C o n s 0.962 ***−8.907 ***
(0.021)(0.268)
ControlYesYes
City FeYesYes
Year FeYesYes
N 45394539
Adj- R 2 0.0080.836
Note: ** and *** denote 5% and 1% significance levels, respectively; standard errors in parentheses.
Table 7. Environmental protection heterogeneity tests results.
(1)(2)(3)(4)
Q F D I 1 Q F D I 2 Q F D I 1 Q F D I 2
HighLowHighLow
d i d 0.549 ***0.527 ***0.1900.284
(0.071)(0.072)(0.166)(0.192)
ControlYesYesYesYes
Cons−10.070 ***−11.266 ***−6.278 ***−7.011 ***
(1.396)(1.442)(1.570)(1.669)
N 2243224322962296
Adj- R 2 0.7940.7980.7590.774
Year FeYesYesYesYes
City FeYesYesYesYes
Note: *** denotes 1% significance level; standard errors in parentheses.
Table 8. Factor endowment heterogeneity tests results.
(1)(2)(3)(4)
Resource ResourceNon-resourceNon-resource
Q F D I 1 Q F D I 2 Q F D I 1 Q F D I 2
d i d 0.0590.1150.345 ***0.317 ***
(0.146)(0.151)(0.038)(0.038)
C o n s −6.116 ***−6.693 ***−5.500 ***−5.166 ***
(1.405)(1.459)(0.780)(0.791)
C o n t r o l YesYesYesYes
N 1793179327462746
Adj- R 2 0.7420.7580.9260.935
Year FeYesYesYesYes
City FeYesYesYesYes
Note: *** denotes 1% significance level; standard errors in parentheses.
Table 9. Synergy tests results.
(1)(2)(3)(4)(5)(6)
Variables Q F D I 1 Q F D I 2 Q F D I 1 Q F D I 2 Q F D I 1 Q F D I 2
d t d i d 0.0420.114 **
(0.071)(0.051)
t p f d i d −0.562−0.442 *
(0.450)(0.256)
d i d 0.774 ***1.128 ***
(0.154)(0.151)
Cons−0.050−8.416 ***−14.808 **−7.819 **−3.558−3.849
(1.385)(0.988)(6.190)(3.515)(3.286)(3.608)
N 4196419637543754946946
Adj- R 2 0.6320.7250.7050.8660.7470.789
Year FeYesYesYesYesYear FeYes
City FeYesYesYesYesCity FeYes
Note: *, ** and *** denote 10%, 5% and 1% significance levels, respectively; standard errors in parentheses.
Table 10. Moran I’s results.
YearIZp
20050.0274.0490.000
20060.0344.9760.000
20070.0263.8780.000
20080.0446.3280.000
20090.0517.1440.000
20100.0436.1260.000
20110.0446.2160.000
20120.0729.8360.000
20130.10413.8990.000
20140.08211.1980.000
20150.0638.740.000
20160.07810.5740.000
20170.08110.9520.000
20180.07910.6810.000
20190.06810.3510.000
20200.08411.3330.000
20210.0729.7840.000
Note: all p-values are less than 0.001.
Table 11. Spatial autocorrelation re-test regression results.
TestStatisticsp-Value
LM-lag639.040
R-LM-lag268.6310
LM-err625.4080
R-LM-err254.9980
LR-lag32.520.0191
LR-err4504.710
Hausman54.240
Table 12. Spatial Durbin effect regression results.
MainDirect EffectIndirect EffectTotal Effect
did0.3728 ***0.3686 ***−1.490 **−1.121 ***
(5.09)(5.05)(2.35)(2.77)
Control variablesYesYesYesYes
City FEYesYesYesYes
Year FEYesYesYesYes
Rho0.8634 ***
(29.41)
N4539453945394539
Note: ** and *** denote 5% and 1% significance levels, respectively; standard errors in parentheses.
Disclaimer/Publisher’s Note: The statements, opinions and data contained in all publications are solely those of the individual author(s) and contributor(s) and not of MDPI and/or the editor(s). MDPI and/or the editor(s) disclaim responsibility for any injury to people or property resulting from any ideas, methods, instructions or products referred to in the content.

