1. Introduction
With the continued growth of global economic activity, greenhouse gas emissions have risen to unprecedented levels, posing significant environmental challenges. To address the escalating climate crisis, countries worldwide have engaged in ongoing global efforts. Building upon the foundation laid by the Paris Agreement, the IPCC’s Sixth Assessment Report, released in 2023, has emphasized the urgent need for more ambitious action and stresses the importance of achieving net-zero emissions by mid-century. Countries and regions have successfully formulated carbon emission reduction targets and measures within this framework, as shown in
Figure 1 [
1,
2,
3,
4]. The electric power grid significantly contributes to total carbon emissions, and its transformation is crucial to achieving zero-carbon goals [
5,
6]. According to a report by the International Energy Agency (IEA), carbon emissions from the power sector account for nearly a quarter of global energy-related carbon emissions, and this proportion is likely to increase in the future [
7]. In the United States, individual states have taken leading roles in implementing clean energy policies [
4]. New York State, in particular, is aggressively revamping its grid to meet its ambitious clean energy goals. The state aims to generate 70% of its electricity from renewable sources by 2030 and achieve 100% carbon-free electricity by 2040 [
8]. Thus, New York State offers an excellent case study for examining the challenges and opportunities in transitioning to clean energy due to its diverse energy landscape, dense urban areas, and commitment to innovative policy solutions.
Studying carbon emissions from power systems, market structures, and policies is crucial in controlling and reducing carbon emissions. Despite significant progress in this field, existing research often focuses on individual aspects of emission reduction, such as technological solutions or market mechanisms, without fully considering the systemic interactions between these elements [
9,
10]. Furthermore, there is a notable gap in research regarding integrating real-time market data with emission monitoring systems, making it difficult to establish direct correlations between market behavior and environmental impacts [
11]. Within this context, Masoumzadeh et al. point out that the design of the electricity market, through incentives such as subsidies and tax incentives, can effectively promote renewable energy development [
12]. At the same time, by implementing a carbon emissions cap and trading system, the market can effectively limit high-carbon-emission electricity production activities [
13]. These policies drive the deployment of low-carbon technologies and help phase out carbon-intensive power sources. For example, Fridstrøm points out that a reasonable carbon pricing mechanism can significantly enhance the market competitiveness of renewable energy and promote optimizing the energy structure [
14]. In addition, Wang et al. [
15] analyze the impact of the European Carbon Trading System (ETS) on the power industry. They find that the carbon trading mechanism effectively reduced overall carbon emissions and accelerated the innovation and application of clean technologies. Demand-side management is also an important strategy that regulates carbon emissions by directly affecting electricity consumption. Research by Melgar-Dominguez et al. shows how demand response programs can help the grid balance supply and demand and reduce reliance on carbon-intensive backup power, thereby improving energy efficiency and reducing overall carbon emissions [
16]. Cross-regional power trading also has significant benefits in reducing carbon emissions.
Acworth et al. emphasize that through cross-regional cooperation and power trading, renewable resources in each region can be used more efficiently, such as using the abundant wind energy resources in one area and the solar energy resources in another area, reducing reliance on local high-carbon power generation [
17]. It is particularly noteworthy that the regional marginal pricing (LMP) mechanism has become a popular and effective power market pricing strategy globally. As stated by Chen et al., LMP provides accurate price signals by reflecting each grid node’s real-time supply and demand conditions and transmission constraints, thereby optimizing the allocation and use of power resources [
18]. Researchers further show that the LMP mechanism effectively promotes renewable energy utilization and reduces carbon emissions by incentivizing companies to adjust power generation strategies according to market demand and price changes. For example, when the LMP value is high, electricity demand increases, or renewable energy is in short supply. This will encourage companies to invest more low-carbon or zero-carbon power generation resources to meet market demand [
19]. Therefore, through in-depth research and optimization of the application of LMP, not only can the operating efficiency of the power market be improved, but also the low-carbon transformation of the power system can be promoted, making an essential contribution to achieving the global carbon neutrality goal.
With the rapid development of data technology, machine learning has become a powerful tool for processing power system big data and discovering deep relationships and patterns. In power system research, machine learning is widely used in many fields, such as load forecasting, market analysis, and carbon emission estimation. For example, Ungureanu et al. showed that power demand and market prices can be accurately predicted through machine learning models, optimizing power generation and grid operation strategies and reducing unnecessary carbon emissions [
20]. Especially in carbon emission analysis, machine learning methods can effectively process and analyze large-scale environmental and operational data and identify critical factors affecting carbon emissions. In the study by Nguyen et al., machine learning technology was applied to investigate the emission data of multiple power stations and successfully identified the operating parameters and environmental factors that most significantly affect carbon emissions [
21]. In addition, by integrating market data and meteorological information, machine learning models can predict the carbon emissions of the power system under different weather conditions to support power grid management and dispatch [
22]. Machine learning also shows great potential in improving the efficiency of renewable energy utilization. Research shows that machine learning models can optimize the dispatch of wind and solar power, maximize the utilization of renewable energy, and reduce dependence on fossil fuels by accurately predicting energy production and market demand [
23]. Applying this technology not only improves the efficiency of energy production but also helps reduce the carbon footprint of the entire power system. In addition, machine learning is also used to optimize the electricity market’s design, such as optimizing LMP pricing strategies. By analyzing historical transaction data with machine learning models, researchers can better understand the relationship between price fluctuations and carbon emissions and then design more effective market mechanisms to promote the deployment of low-carbon power generation [
24].
Systems engineering, as an approach, holistically considers various factors and interactions in complex systems and provides us with a reasonable framework to analyze and study power system problems involving multiple variables and high complexity. The unique advantage of this approach is its ability to simultaneously and systematically address various levels of power system design, operation, policy development, and environmental impacts. In studying carbon emission issues, the application of system engineering is critical for framing the situation while considering the scope of the problem. It helps us identify and analyze key factors affecting grid carbon emissions from a broader perspective. It also integrates environmental science, economics, and power engineering knowledge to form a more comprehensive solution. For example, researchers can use system engineering approaches to assess different electricity generation technologies’ environmental impacts and economic benefits, considering technology maturity, policy support, and market demand [
25]. Although system engineering is widely used in many fields, such as manufacturing and aerospace, this approach still needs to be defined when studying carbon emissions from power systems. Traditionally, many studies focus on specific technology or policy interventions, but fewer take a whole-system perspective to consider various interactions and impacts comprehensively. For instance, existing research may focus on optimizing single renewable energy technologies or applying carbon capture and storage technologies while ignoring the interactions between these technologies and existing power system structures [
26]. We can solve these problems more effectively by introducing a system engineering approach. This approach allows researchers to conduct more comprehensive models, simulations, and, when appropriate, optimizations, considering the entire process from electricity production to consumption and related policy and market factors [
27]. Research by Chu et al. demonstrates how solar and wind energy can be integrated through a system engineering approach to maximize these resources’ utilization efficiency while reducing the system’s overall carbon emissions [
28]. Therefore, applying system engineering to study carbon emissions from power systems provides an innovative perspective that can help us better understand and optimize complex energy systems. By comprehensively considering the interaction of various technology, policy, and market factors, system engineering can provide strong support for developing effective carbon emission reduction strategies and realizing a sustainable energy future [
29].
The combination of system engineering with machine learning in this study aims to contribute to the existing analytical approaches in the power sector. While previous research has made significant progress using these methodologies separately, we propose that their integration could offer additional insights. Traditional studies have typically employed these methodologies independently; system engineering approaches provide valuable insights into comprehensive system interactions but may face challenges in capturing dynamic, real-time market–emission relationships, while machine learning approaches, though powerful in pattern recognition, sometimes overlook important system-level constraints [
30,
31]. Our methodology attempts to bridge these approaches, suggesting several potential improvements. First, it proposes a framework that considers market mechanisms and environmental impacts together, complementing traditional approaches that often examine these aspects separately. Second, it enables analysis across multiple temporal and spatial scales, from real-time price fluctuations to long-term emission trends. Third, by incorporating system-level constraints into the machine learning framework, our approach seeks to generate insights that align with practical operational requirements. This integration will enhance our understanding of the relationships between market price signals and emission patterns, offering new perspectives for analyzing policy interventions and their effects on both market operations and environmental outcomes.
Building upon this methodological foundation, we develop a novel analytical model to explore the complex relationship between regional marginal prices (LMP) and carbon emissions in electricity markets. LMP is the core economic indicator of the power market and directly affects the operational decisions of power generation companies and the energy allocation strategy of the entire market. By accurately analyzing the dynamic relationship between LMP and carbon emissions, this study deepens the understanding of the interaction between electricity market operations and environmental impacts. It provides objective data support for formulating carbon emission reduction strategies based on market mechanisms. More importantly, the research results can guide power market policymakers, helping them optimize market design and achieve sustainable power industry development. By integrating system engineering and machine learning technologies, the model built in this study can handle complex and changing data and predict and evaluate the impact of different policies and market changes on carbon emissions. Applying this innovative method allows us to understand and optimize carbon emission issues in the electricity market and contribute to more accurately promoting the low-carbon transformation of the electricity industry. Through this research, policymakers and market operators can more effectively use LMP as a regulatory tool to guide market participants to adopt more environmentally friendly power generation methods and optimize energy allocation, thereby reducing the carbon footprint of the entire power system. This research improves our understanding of the electricity market structure and environmental policy’s interactive effects. It opens new perspectives and methodologies in electricity market design and environmental sustainability research.
3. System Engineering Analysis
In the system engineering analysis stage, a system engineering approach is applied to analyze and solve complex issues involving LMP and carbon emissions in the electricity market. This stage mainly includes several key steps: Problem Definition and System Boundary Identification, System Architecture and Functional Decomposition, Model Development and Integration, and Scenario Analysis and Trade-off Evaluation.
3.1. Problem Definition and System Boundary Identification
A correlation analysis was conducted to explore the interrelationships between key variables in the electricity market dataset to define the problem scope and identify system boundaries. The Locational Marginal Price (LMP) in electricity markets consists of three components: the Locational Based Marginal Price (LBMP), which represents the energy component or base component of electricity prices; the marginal cost of losses, which accounts for transmission losses; and the marginal cost of congestion, which reflects transmission constraints. Through the generated correlation matrix and heat map, we examined the relationships between these three LMP components (LBMP, marginal cost of losses, and marginal cost of congestion) and carbon emissions. By analyzing how each component of LMP correlates with carbon emissions, we can better understand which aspects of electricity pricing have the strongest relationship with emission patterns. These findings provide data support for defining the main research questions and understanding how different pricing components might influence carbon emission outcomes [
35].
As shown in
Figure 2, the correlation analysis reveals several significant relationships that define the system boundaries. A moderate positive correlation (0.24) exists between LBMP and carbon emissions (Total CO
2 Mass), suggesting that increased LBMP may be associated with higher carbon emissions. More notably, a strong positive correlation (0.54) is observed between the marginal cost of losses and carbon emissions, indicating that system inefficiencies significantly impact environmental outcomes. The marginal cost of congestion shows a robust negative correlation with LBMP (−0.74), implying that in the electricity market, increased congestion costs may lead to decreased LBMPs.
These correlations are particularly useful as they highlight the complex interplay between economic factors (LBMP), system inefficiencies (losses), grid management (congestion), and environmental impact (carbon emissions). These findings guided the focus on developing a system engineering approach that integrates pricing mechanisms, grid efficiency, and emission reduction strategies. By defining these relationships, the system’s boundaries are established, encompassing not just the physical power grid but also the electricity markets’ economic and environmental aspects. This comprehensive view enables addressing the multifaceted challenges of reducing carbon emissions while maintaining economic efficiency in power systems.
3.2. System Architecture and Functional Decomposition
To analyze the direct and indirect relationships between these variables further, a transdisciplinary engineering tool called Interpretive Structural Modeling (ISM), proposed by Warfield in 1973 [
36], will be used through the Platform for Integrated Transdisciplinary Design Toolkit [
37,
38]. ISM is a method for identifying and summarizing relationships between a defined problem and specific variables. It enables us to structure complex relationships in a system, establish hierarchies, and visualize direct and indirect dependencies between elements [
39].
The ISM process began with constructing a Structural Self-Interaction Matrix (SSIM) to understand the hierarchy of influence and causal relationships between each variable. This facilitates a more explicit and systematic understanding of the dimensions of the problem [
40]. As shown in
Figure 3, the symbol “O” indicates no direct relationship between the two variables. The symbol “X” indicates a two-way relationship between variable i and variable j, which means they influence each other. The symbol “A” indicates a one-way relationship from j to i.
There is no direct relationship (“O”) between hour and other variables, as the hour parameter only serves as a temporal reference to locate data points and does not directly influence carbon emissions or costs. Total CO2 Mass and LBMP: is marked with an “A”, indicating that LBMP may affect total carbon emissions, but total carbon emissions do not affect LBMP. LBMP and Marginal Cost of Losses are marked with an “X”, meaning there is a two-way relationship between the two. LBMP may change due to changes in loss costs, and loss costs may also be affected by LBMP. LBMP and Marginal Cost of Congestion are marked with an “X”, indicating that there is also a two-way relationship between the two. Increases or decreases in congestion costs may affect LBMP and vice versa. Marginal Cost of Losses and Total CO2 Mass are marked with an “A”, indicating that loss costs may affect carbon emissions, but carbon emissions will not affect loss costs.
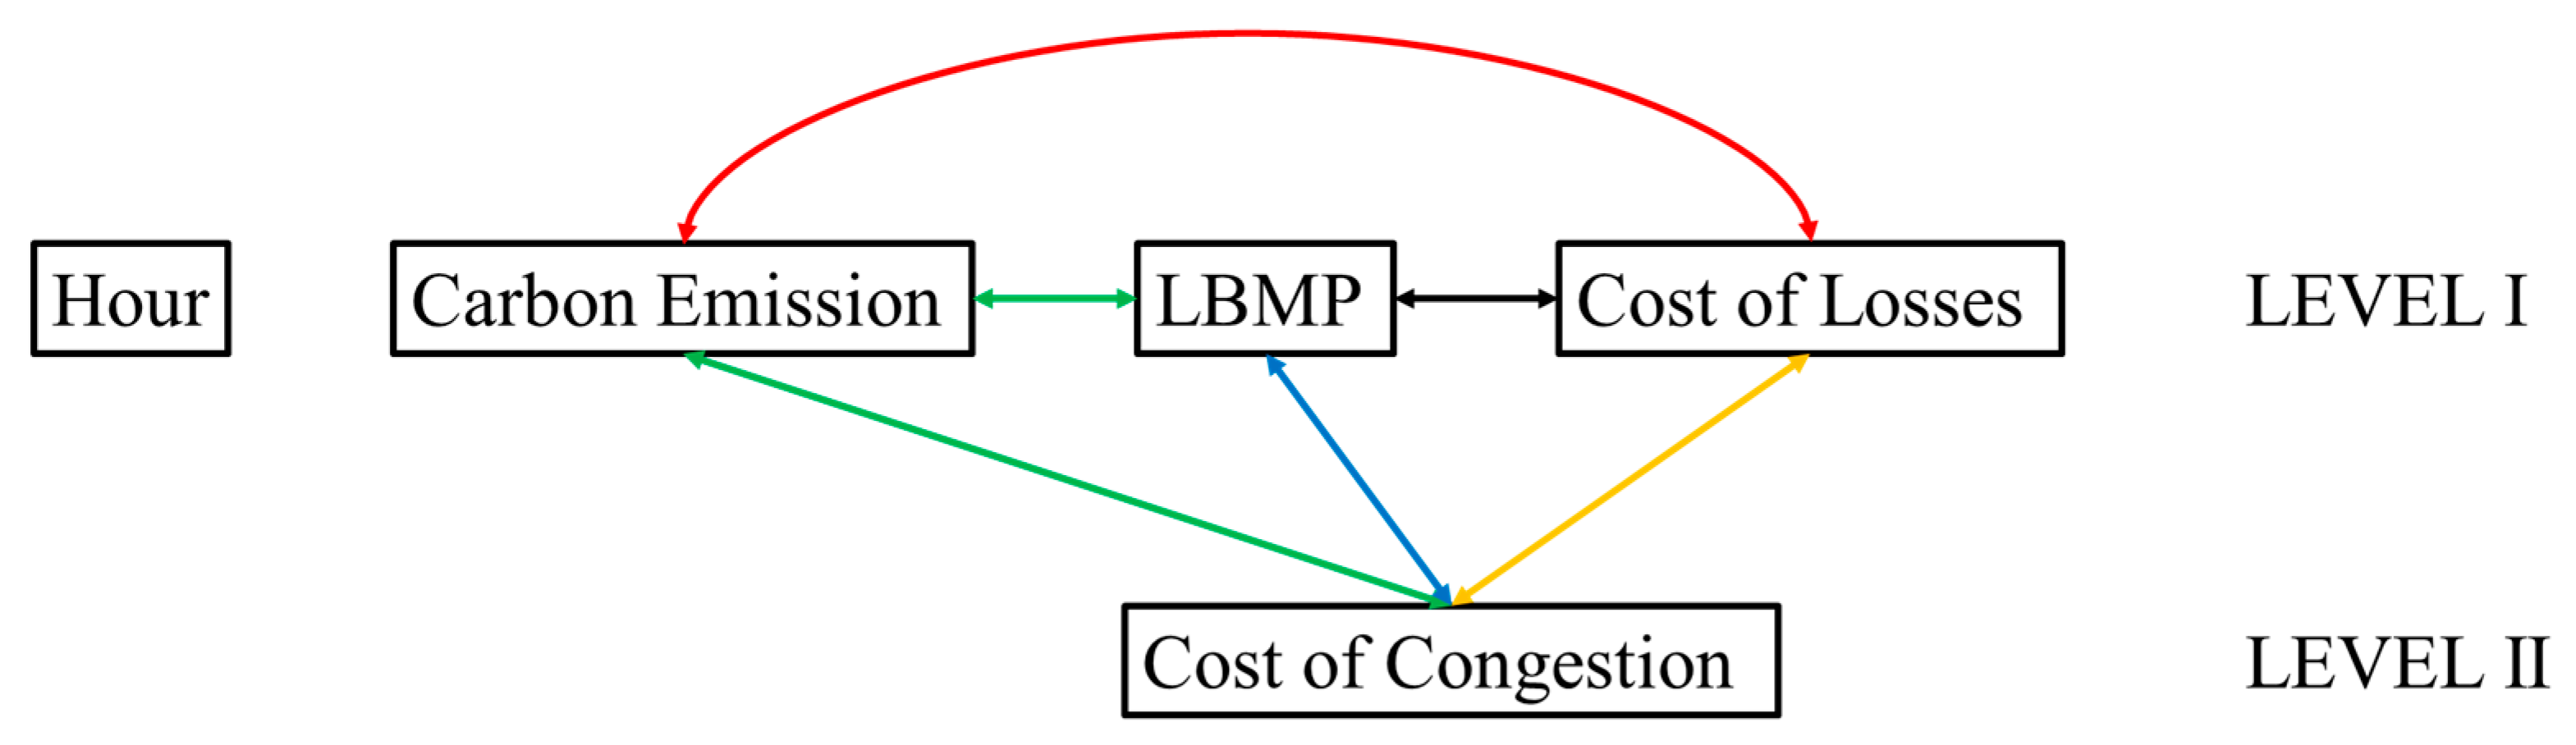
The SSIM was then transformed into a digraph, visually representing the flow and relations to the key attributes of learning programs [
41]. As shown in
Figure 4, the Hour variable lacks structural relationships with other variables and appears as an isolated node, consistent with previous correlation analysis. Carbon emissions are linearly connected to LBMP, which is also influenced by the cost of losses and congestion. LBMP has a direct linear relation with the cost of losses, and the cost of losses reciprocally influences LBMP. Furthermore, the cost of congestion has bidirectional relationships with both LBMP and the cost of losses.
The last activity of the Integrated Transdisciplinary Design Toolkit ISM implementation is the Matrix Impact Cross-Reference Multiplication Applied to a Classification (MICMAC) analysis, which will identify the driving power and dependencies of the identified key attributes [
42,
43]. The MICMAC analysis arranges system performance factors with respect to driving power and dependence into four clusters, as illustrated in
Figure 5. Cluster I includes one factor (Hour (1)) that is autonomous. Autonomous factors have low driving power and low dependence, which means they have minimal influence on and are minimally influenced by other factors in the system, making them relatively disconnected from the system’s overall behavior. Cluster II includes no factor that is dependent. Dependent factors have low driving power and high dependence, which means they are strongly influenced by other factors but have little ability to influence the system themselves, making them outcome variables of the system. Cluster III includes four factors (Carbon Emission (2), LBMP (3), Cost of Losses (4), and Cost of Congestion (5)) that are linked. Linkage factors have high driving power and high dependence, which means they are both influential and vulnerable to changes in other factors, making them critical variables that require careful monitoring, as any change in these factors can affect the entire system and create feedback loops. Cluster IV includes no factor that is independent. Independent factors have high driving power and low dependence, which means they strongly influence other factors while being relatively unaffected by them, making them key strategic variables that can be used to influence the system’s behavior.
The results of the ISM and MICMAC analyses identify the most influential variables in the system, namely LBMP, Cost of Losses, and Cost of Congestion. These analyses also reveal the complex interdependencies between these variables, which must be considered in any solution approach. Furthermore, they highlight the central role of LBMP in influencing carbon emissions, suggesting that pricing mechanisms could be a key lever for emission reduction. Additionally, the analyses demonstrate the linked nature of the key variables, indicating that a holistic approach addressing multiple factors simultaneously may be most effective.
These insights from the ISM process directly inform the next step: inputting data into a machine-learning model. The identified key variables and their relationships provide a framework for feature selection and model design, ensuring that the most relevant and influential factors are considered. Moreover, understanding variable interdependencies can guide the interpretation of machine learning results and the development of targeted strategies for reducing carbon emissions while maintaining economic efficiency in the electricity market.
3.3. Model Development and Integration
Based on the comprehensive system analysis provided by the ISM and MICMAC techniques, the identified high interdependencies among key factors such as LBMP, Cost of Losses, and Cost of Congestion, along with their significant influence on carbon emissions, necessitate a modeling approach capable of capturing non-linear relationships and intricate feedback loops. Neural networks emerge as an ideal solution tool for addressing the complex interplay of variables in the electricity market and carbon emission system. Neural networks excel in this regard, offering the ability to learn and represent complex, multidimensional interactions without requiring explicit programming of these relationships [
44]. Furthermore, the linked nature of the key variables, as revealed by the MICMAC analysis, suggests that a holistic approach is needed. Neural networks can effectively integrate multiple inputs and consider their combined effects, aligning well with this requirement [
45]. The adaptability of neural networks also allows for incorporating new data and insights as they become available, making them well-suited for the dynamic nature of electricity markets and environmental policies [
46]. By leveraging neural networks, it becomes possible to develop a predictive model that accounts for the identified system complexities and provides a flexible framework for exploring various scenarios and strategies to reduce carbon emissions while maintaining economic efficiency in the power system.
The dataset used in this study consists of 70,080 samples with 11 features. It is split into a training set (56,064 samples, 80%) and a testing set (14,016 samples, 20%) using stratified sampling to ensure a representative distribution. Before model training, we applied Standard Scaler normalization to all features, transforming the data to have zero mean and unit variance [
47]. This preprocessing step is crucial for ensuring optimal neural network performance and convergence.
The neural network architecture was carefully designed to balance model complexity with computational efficiency. The model consists of four layers: an input layer matching the 11 feature dimensions, three hidden layers with 128, 64, and 32 neurons, respectively, and a single-neuron output layer for carbon emission prediction. The decreasing neuron architecture (128-64-32) was chosen to progressively distill complex patterns into more concentrated representations. Each hidden layer employs the ReLU (Rectified Linear Unit) activation function, selected for its effectiveness in handling non-linear relationships while avoiding the vanishing gradient problem common in deep networks [
48].
The neural network constructed contains multiple layers, each with its specific role. First is the input layer, whose dimensions correspond to the number of features in the training data. Next, the network consists of three hidden layers with 128, 64, and 32 neurons, respectively, using ReLU (rectified linear unit) as the activation function. These hidden layers are designed to increase the expressive power of the model, allowing the network to capture complex patterns and non-linear relationships in the data. The output layer contains a neuron that predicts carbon emissions. The model is compiled using the Adam optimizer, an efficient stochastic gradient descent method suitable for processing large-scale datasets. The loss function is the mean square error (MSE), which measures the difference between predicted and actual values. The entire training process is executed silently within the specified 100 cycles, and 20% of the data is used as a validation set to monitor the performance during the training process. The model is compiled using the Adam optimizer, an adaptive learning rate optimization algorithm that combines the advantages of two other extensions of stochastic gradient descent: AdaGrad and RMSProp [
49]. We chose root mean square error (RMSE) as the loss function, given its suitability for regression tasks and its sensitivity to outliers [
50]. The training process incorporates a validation split of 20% of the training data to monitor generalization performance and prevent overfitting. The model is trained for 100 epochs with the entire process automated to optimize computational efficiency.
As shown in
Figure 6, the evaluation results of the model show that the root mean square error (RMSE) is 191.42. These indicators reflect the accuracy and error of the model in predicting carbon emissions. As can be seen from the figure, the data predicted by the model (red dashed line) and the actual data (blue solid line) have consistent trends at most data points, although there are some deviations. This shows that the neural network is effective at capturing the main trends in the data, although there is room for improvement in capturing specific peaks and fluctuations. This visualization helps us intuitively understand the model’s performance and points out the direction for future optimization, such as adjusting the network structure or further refining feature engineering to improve the model’s prediction accuracy for electricity market dynamics.
4. Results and Discussion
In this study, we systematically evaluate the impact of different market policy changes on carbon emissions across six key zones in the New York power market: Central Region (CENTRL), Hudson Valley (HUD VL), Long Island (LONGIL), New York City (N.Y.C.), North Region (NORTH), and Western Region (WEST). Our baseline parameters are derived from the 2019 NYISO Market Operations Report, ensuring our analysis is grounded in actual market conditions.
We designed four distinct market scenarios and carefully calibrated parameters to reflect realistic market conditions. The Baseline Scenario represents 2019 market conditions with LBMP at USD 33.18/MWh based on the NYISO’s historical average market clearing price, Marginal Cost of Losses at USD 0.15/MWh reflecting observed transmission efficiency, and Marginal Cost of Congestion at −USD 20.0/MWh representing typical congestion patterns [
51]. The Increased LBMP Scenario tests price sensitivity by raising LBMP to USD 40.0/MWh (approximately 20% increase) while maintaining other parameters constant, simulating potential market price escalation. The Reduced Marginal Cost of Losses Scenario examines efficiency improvements by reducing loss costs to USD 0.10/MWh (a 33% improvement) while keeping LBMP and congestion costs at baseline levels. The Reduced Marginal Cost of Congestion Scenario assesses congestion management by reducing congestion costs to −USD 10.0/MWh (a 50% improvement) while maintaining baseline levels for other parameters.
As shown in
Figure 7, the model’s predictions reveal distinct patterns across different regions. In the Central Region (CENTRL), baseline emissions are 350.68 short tons, with emissions decreasing to 343.08 tons under increased LBMP, suggesting that higher prices in this region may encourage more efficient generation dispatch. When reducing the marginal cost of losses, emissions increase slightly to 358.06 tons. In comparison, reduced congestion costs lead to 380.57 tons, indicating that congestion management in this region may need careful consideration for emission control. The Hudson Valley region (HUD VL) shows a different pattern, with baseline emissions at 305.77 tons. Increased LBMP leads to higher emissions of 321.36 tons, while reduced marginal cost of losses and congestion show moderate reductions to 308.09 and 320.83 tons, respectively. This suggests that the Hudson Valley region is particularly sensitive to price changes. Long Island (LONGIL) and New York City (N.Y.C.) exhibit the highest emission levels among all regions, reflecting their significant energy demand. LONGIL’s baseline emissions of 425.48 tons increase to 484.73 tons with higher LBMP, while N.Y.C. shows baseline emissions of 955.03 tons, slightly increasing to 989.45 tons under increased LBMP. This suggests that these high-demand regions require additional policy measures beyond price mechanisms to reduce emissions effectively. The Northern (NORTH) and Western (WEST) regions show notably lower emission levels, with the NORTH’s baseline at 60.52 tons and the WEST’s at 23.23 tons. These regions demonstrate varying responses to market changes, with WEST showing particular sensitivity to congestion cost reductions, resulting in a significant increase to 53.57 tons under this scenario.
These results highlight the complex relationship between market parameters and emissions across different regions. In densely populated areas like N.Y.C. and Long Island, emissions are generally higher and more resistant to market parameter changes, suggesting more targeted intervention strategies are needed. Conversely, regions like NORTH and WEST show greater sensitivity to market adjustments, indicating that market-based approaches might be more effective in these areas for emission reduction.
The analysis demonstrates that the effectiveness of market mechanisms in reducing carbon emissions varies significantly by region, suggesting that a one-size-fits-all approach may not be optimal for achieving emission reduction goals. Instead, policies should be tailored to regional characteristics, considering factors such as local generation mix, transmission constraints, and demand patterns. These findings provide valuable insights for policymakers and market operators in designing targeted strategies for emission reduction while maintaining system reliability and economic efficiency.
These comprehensive analytical results demonstrate the complex relationship between market mechanisms and carbon emissions across different regions. However, translating these insights into practical policy implementation requires careful consideration of both technical and operational challenges. Our analysis reveals that regions with high energy demand, such as New York City (baseline emissions of 955.03 tons) and Long Island (baseline emissions of 425.48 tons), may require a combination of market-based and direct regulatory approaches, as price signals alone show limited effectiveness in these areas. For instance, the 20% LBMP increase led to relatively modest emission changes in these regions, suggesting that market mechanisms should be complemented with targeted efficiency programs and infrastructure improvements. Conversely, regions like the Western zone, which showed significant sensitivity to market parameters (varying from 23.23 to 53.57 tons across scenarios), might benefit more directly from market-based interventions. However, careful monitoring would be needed to prevent unintended consequences.
The implementation of these findings faces several practical challenges that policymakers must address. The varying regional responses to market parameters, as evidenced by the contrasting behaviors of the CENTRL (showing emission increases from 350.68 to 389.57 tons under reduced congestion) and HUD VL regions, necessitate carefully coordinated policy approaches to prevent emission leakage and maintain system reliability. Successfully implementing these insights requires an adaptive management approach where policy adjustments are based on continuous monitoring of market responses, supported by a robust technical infrastructure for real-time data collection and analysis. This approach would enable policymakers to fine-tune interventions based on observed outcomes while maintaining market stability and stakeholder confidence.
5. Conclusions
This study uses a system engineering approach, including a transdisciplinary method combined with advanced machine learning technology, to analyze the relationship between regional marginal prices (LMP) and carbon emissions in the electricity market. Applying system engineering ensures that the research can comprehensively consider and integrate market design, policy adjustments, economic factors, and environmental impacts, providing an overall analysis framework. This comprehensive approach enables this study to identify various influencing factors and systematically assess their combined impact on carbon emissions.
Through simulations of different market scenarios, this study reveals the specific impact of market policies, such as changes in LBMP, adjustments to loss costs, and congestion costs on carbon emissions. A system engineering approach enables these complex relationships to emerge clearly. It highlights the importance of considering the system’s integrity and the interactions between its parts when formulating environmental policies and optimizing electricity market structures. This interdisciplinary comprehensive analysis demonstrates the central role of system engineering in solving environmental and energy problems, providing solid theoretical and methodological support for formulating effective carbon emission reduction strategies.
While this study demonstrates the effectiveness of combining system engineering with machine learning for analyzing carbon emissions in electricity markets, several limitations and opportunities for future research should be noted. The current model could be enhanced by incorporating additional environmental and operational variables, such as real-time weather data, renewable energy generation patterns, and seasonal demand variations. The development of real-time data analytics capabilities could enhance the model’s predictive accuracy and enable more dynamic policy responses. Furthermore, extending our methodology to incorporate emerging technologies and market mechanisms, such as energy storage systems and demand response programs, could provide more comprehensive insights into emission reduction strategies. Future research should also explore the integration of inter-regional power flows and their impact on emission patterns, contributing to a more robust and comprehensive framework for sustainable power market management.
In addition, the study recommends optimizing the power market design based on system engineering principles, emphasizing carbon emissions reduction through comprehensive regulation of market mechanisms and operational strategies. Future research should explore applying system engineering methods in power system management, especially in data-driven decision support systems, to promote sustainable development and environmental protection in the power industry.
In summary, the applied system engineering approach provides a valuable perspective and tool that enables policymakers and market operators to fully understand and manage the complex interactions between electricity markets and environmental policy. This approach allows strategies to be more accurately assessed and implemented to optimize energy efficiency, reduce carbon emissions, and drive the power industry toward the goal of low-carbon transformation.


