
What Is the Effect of China’s Renewable Energy Market-Based Coupling Policy?—A System Dynamics Analysis Based on the Coupling of Electricity Market, Green Certificate Market and Carbon Market


Abstract
1. Introduction
1.1. Background
1.2. Literature Review
- Based on the present situation of China’s electricity marketization reform, this paper constructs an SD model under the coupling effects of the electric power market, green certificate market and carbon market. This model reveals the internal mechanism of coupling the carbon market, green certificate market and electricity market and analyzes the price trends of the independent markets and the coupled market. At the same time, the model distinguishes the total quota and non-water renewable energy quota and accurately simulates the development trajectory of RES, hydropower and fossil energy under different mechanisms.
- Based on the Chinese Renewable Energy Policy (NDRC, 2019), this paper aims to analyze the impact of the transformation of RPS responsibility into e-commerce on China’s electricity market, TGC market and ET market, focusing on the impact of the carbon reduction policy and RPS ratio on the change in sales price and China’s power supply structure.
- As a unique mode of electricity trading, power generation rights trading is also a unique measure of energy conservation and emission reduction in China. This paper analyzes its relationship with the renewable energy quota system and carbon emission rights trading policy and makes clear the cooperation mechanism between different policies. Through SD model simulation, the influence of a power generation rights trading policy on the development momentum of different market players in the short- and long-term markets is clarified.
2. Theoretical Framework Analysis
2.1. Model Principle
2.2. System Dynamics Characteristics of Coupled Markets and Policies
2.3. Three-Markets Interaction Mechanism
3. Model Design
3.1. System Boundary and Assumptions
3.2. TGC Market Module
3.3. ET Market Module
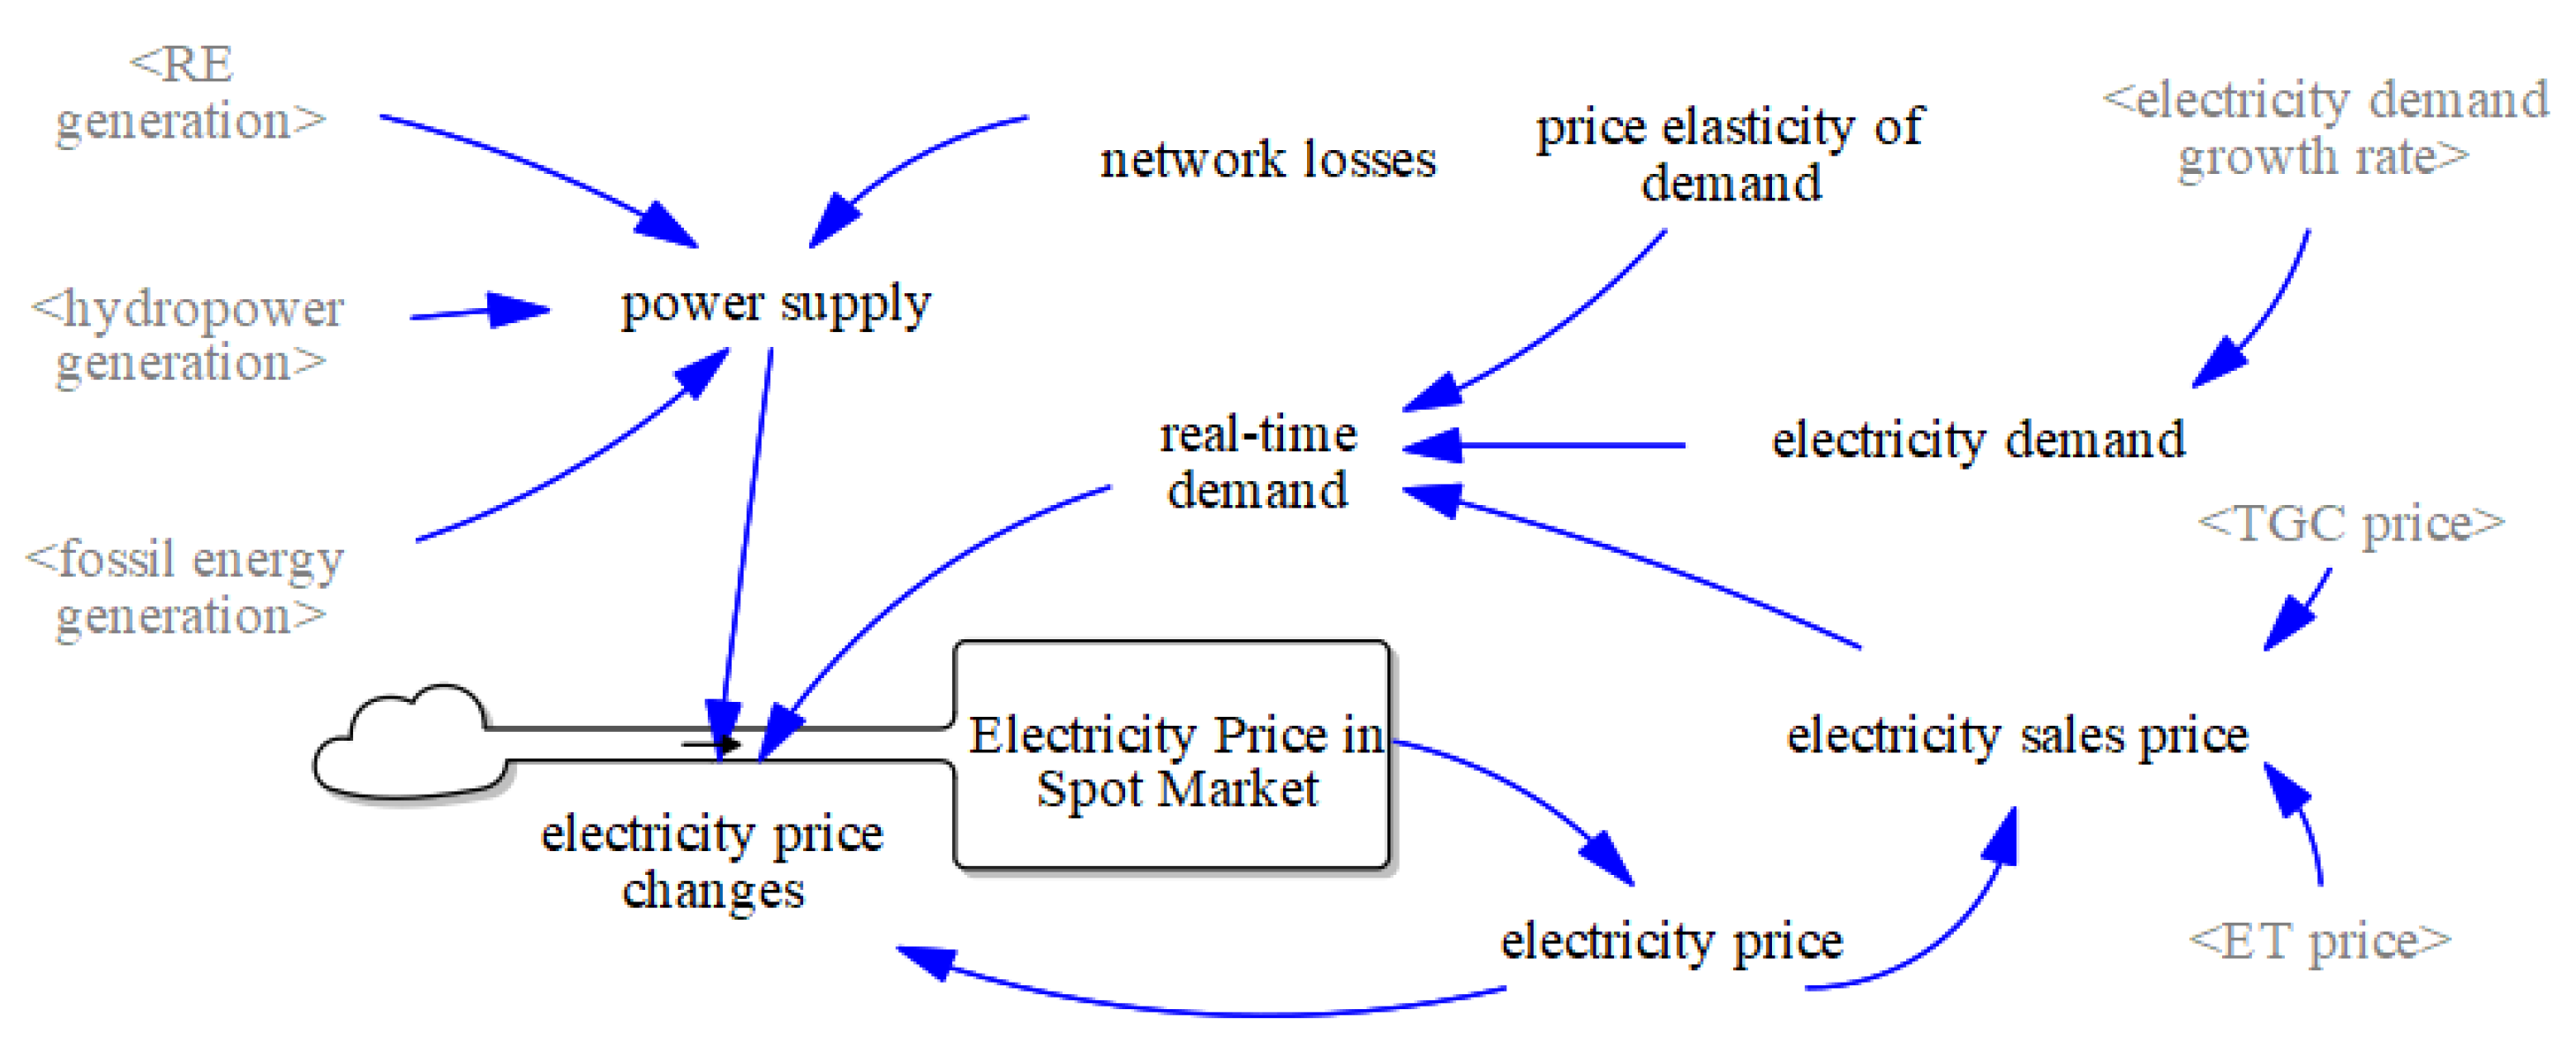
3.4. Electricity Market Module
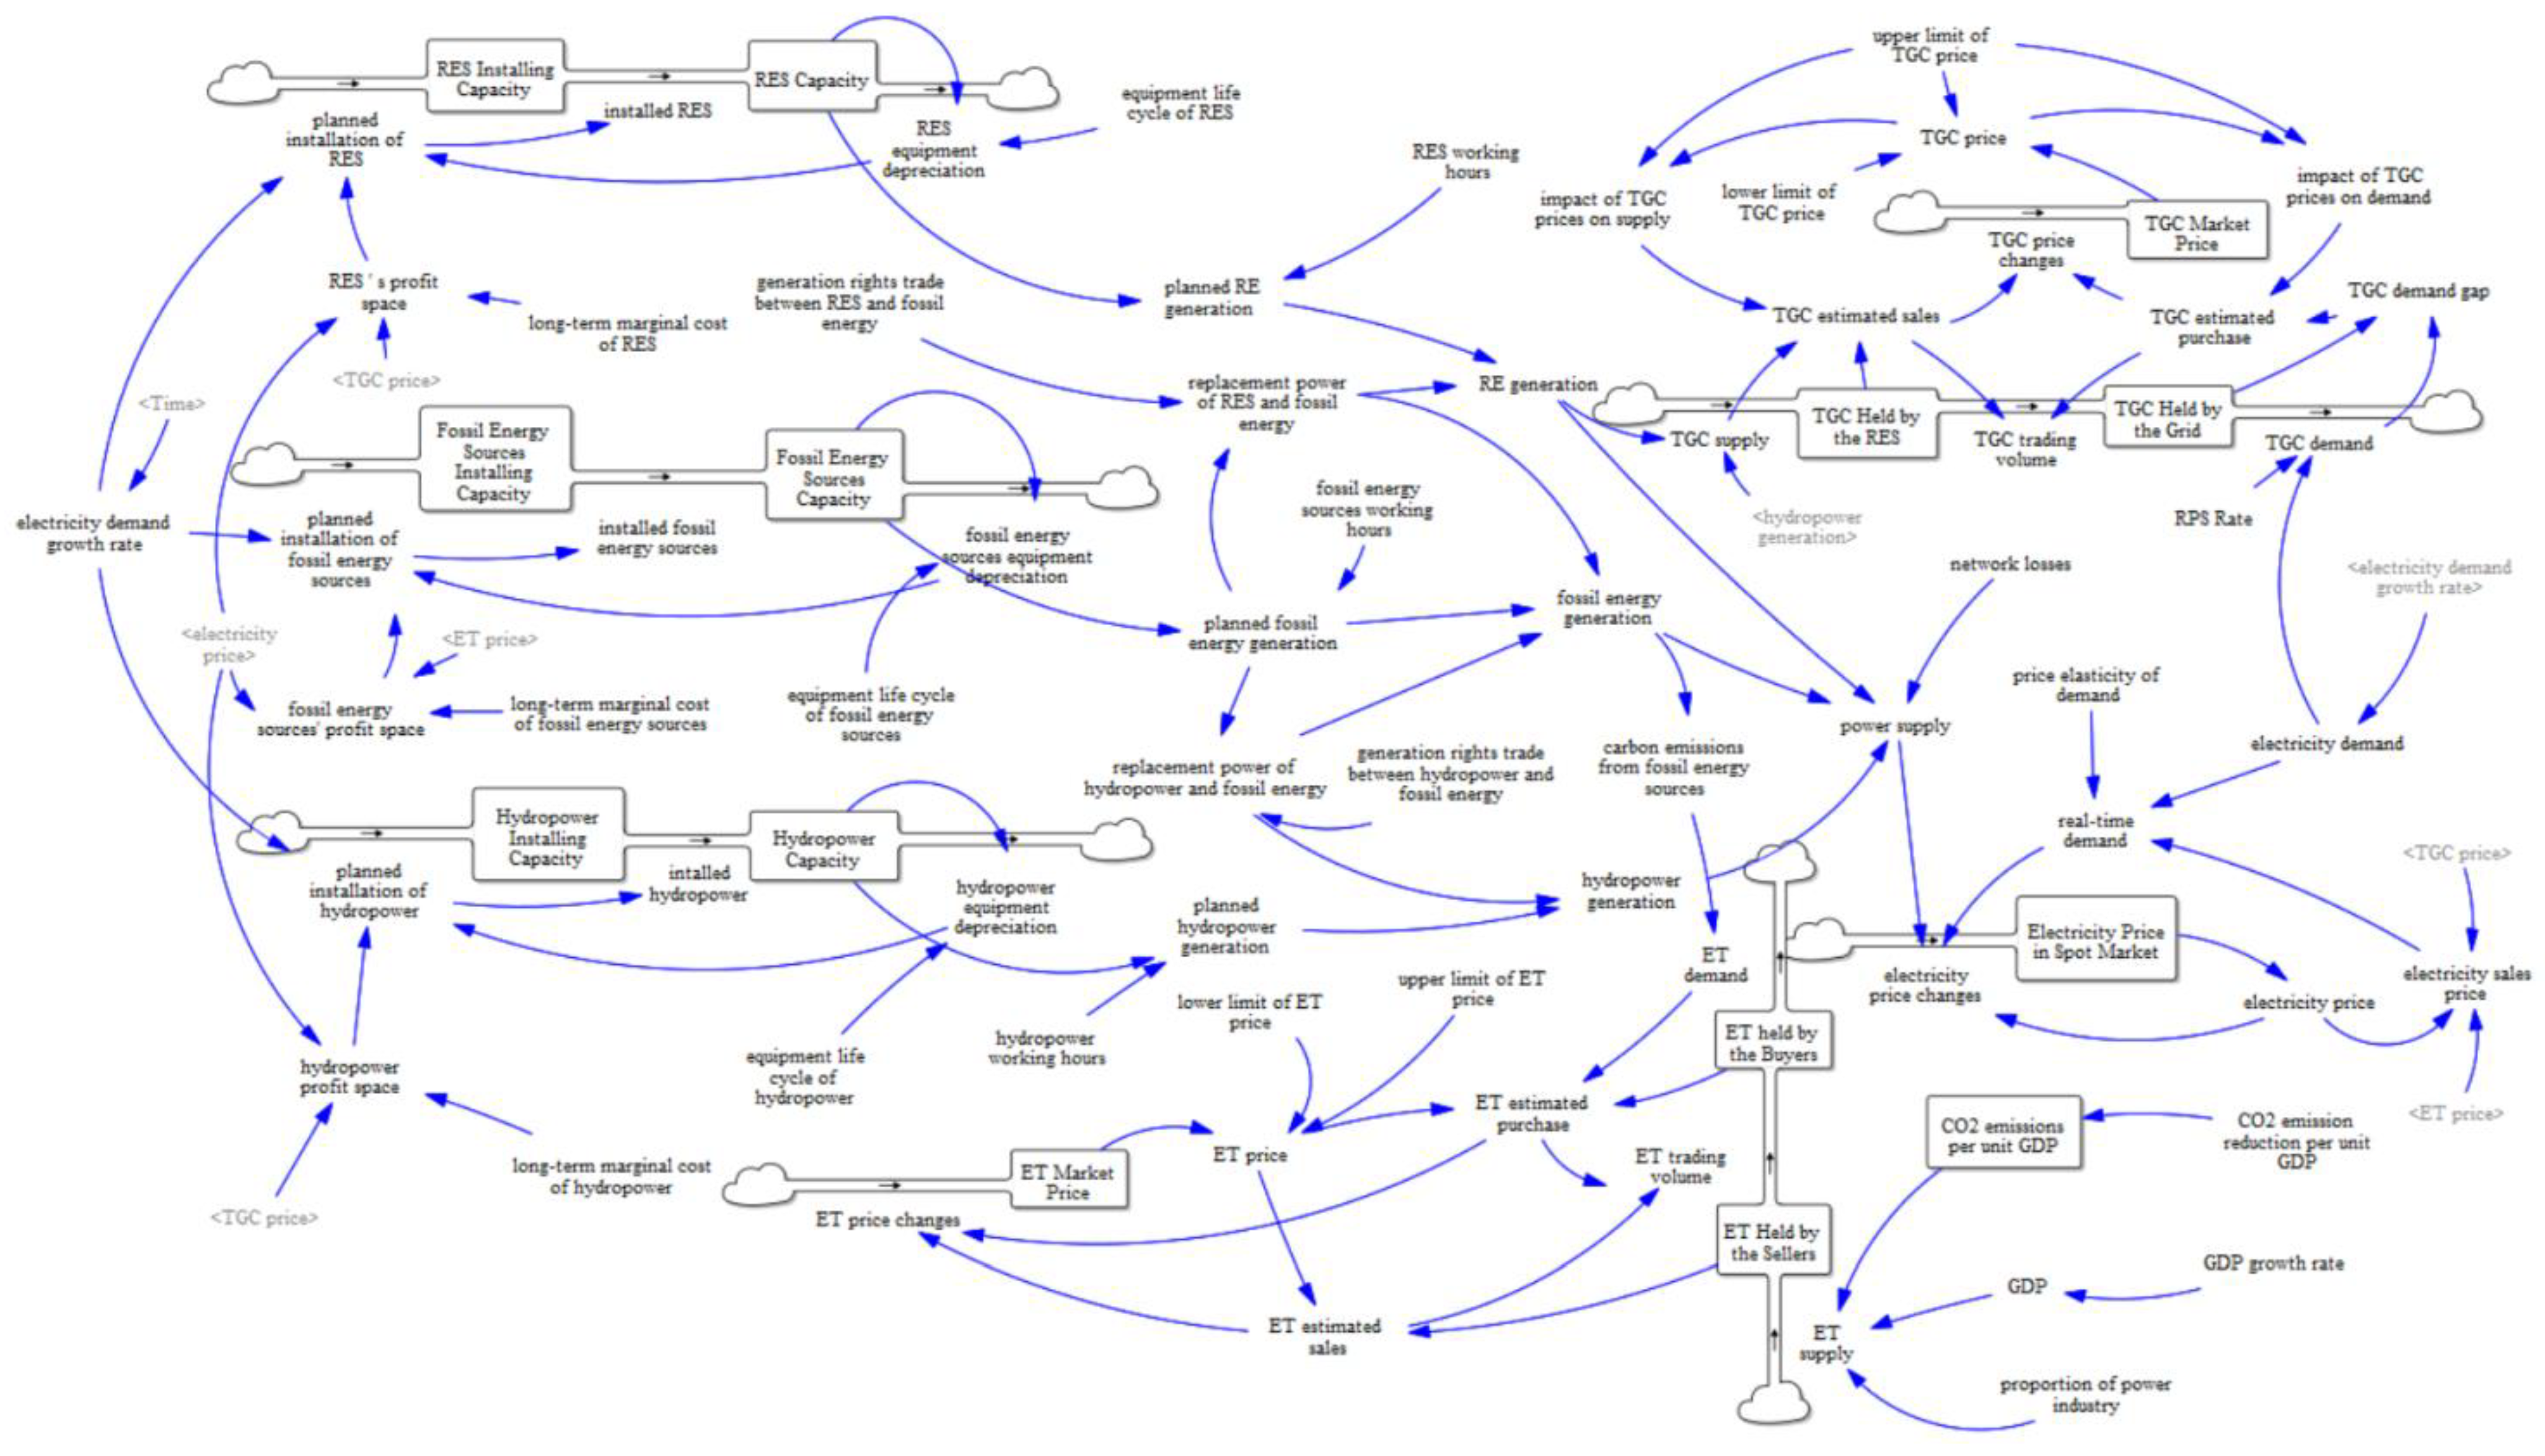
3.5. Three-Markets Interaction Module
3.6. Data and Scenario Design
4. Results and Discussion
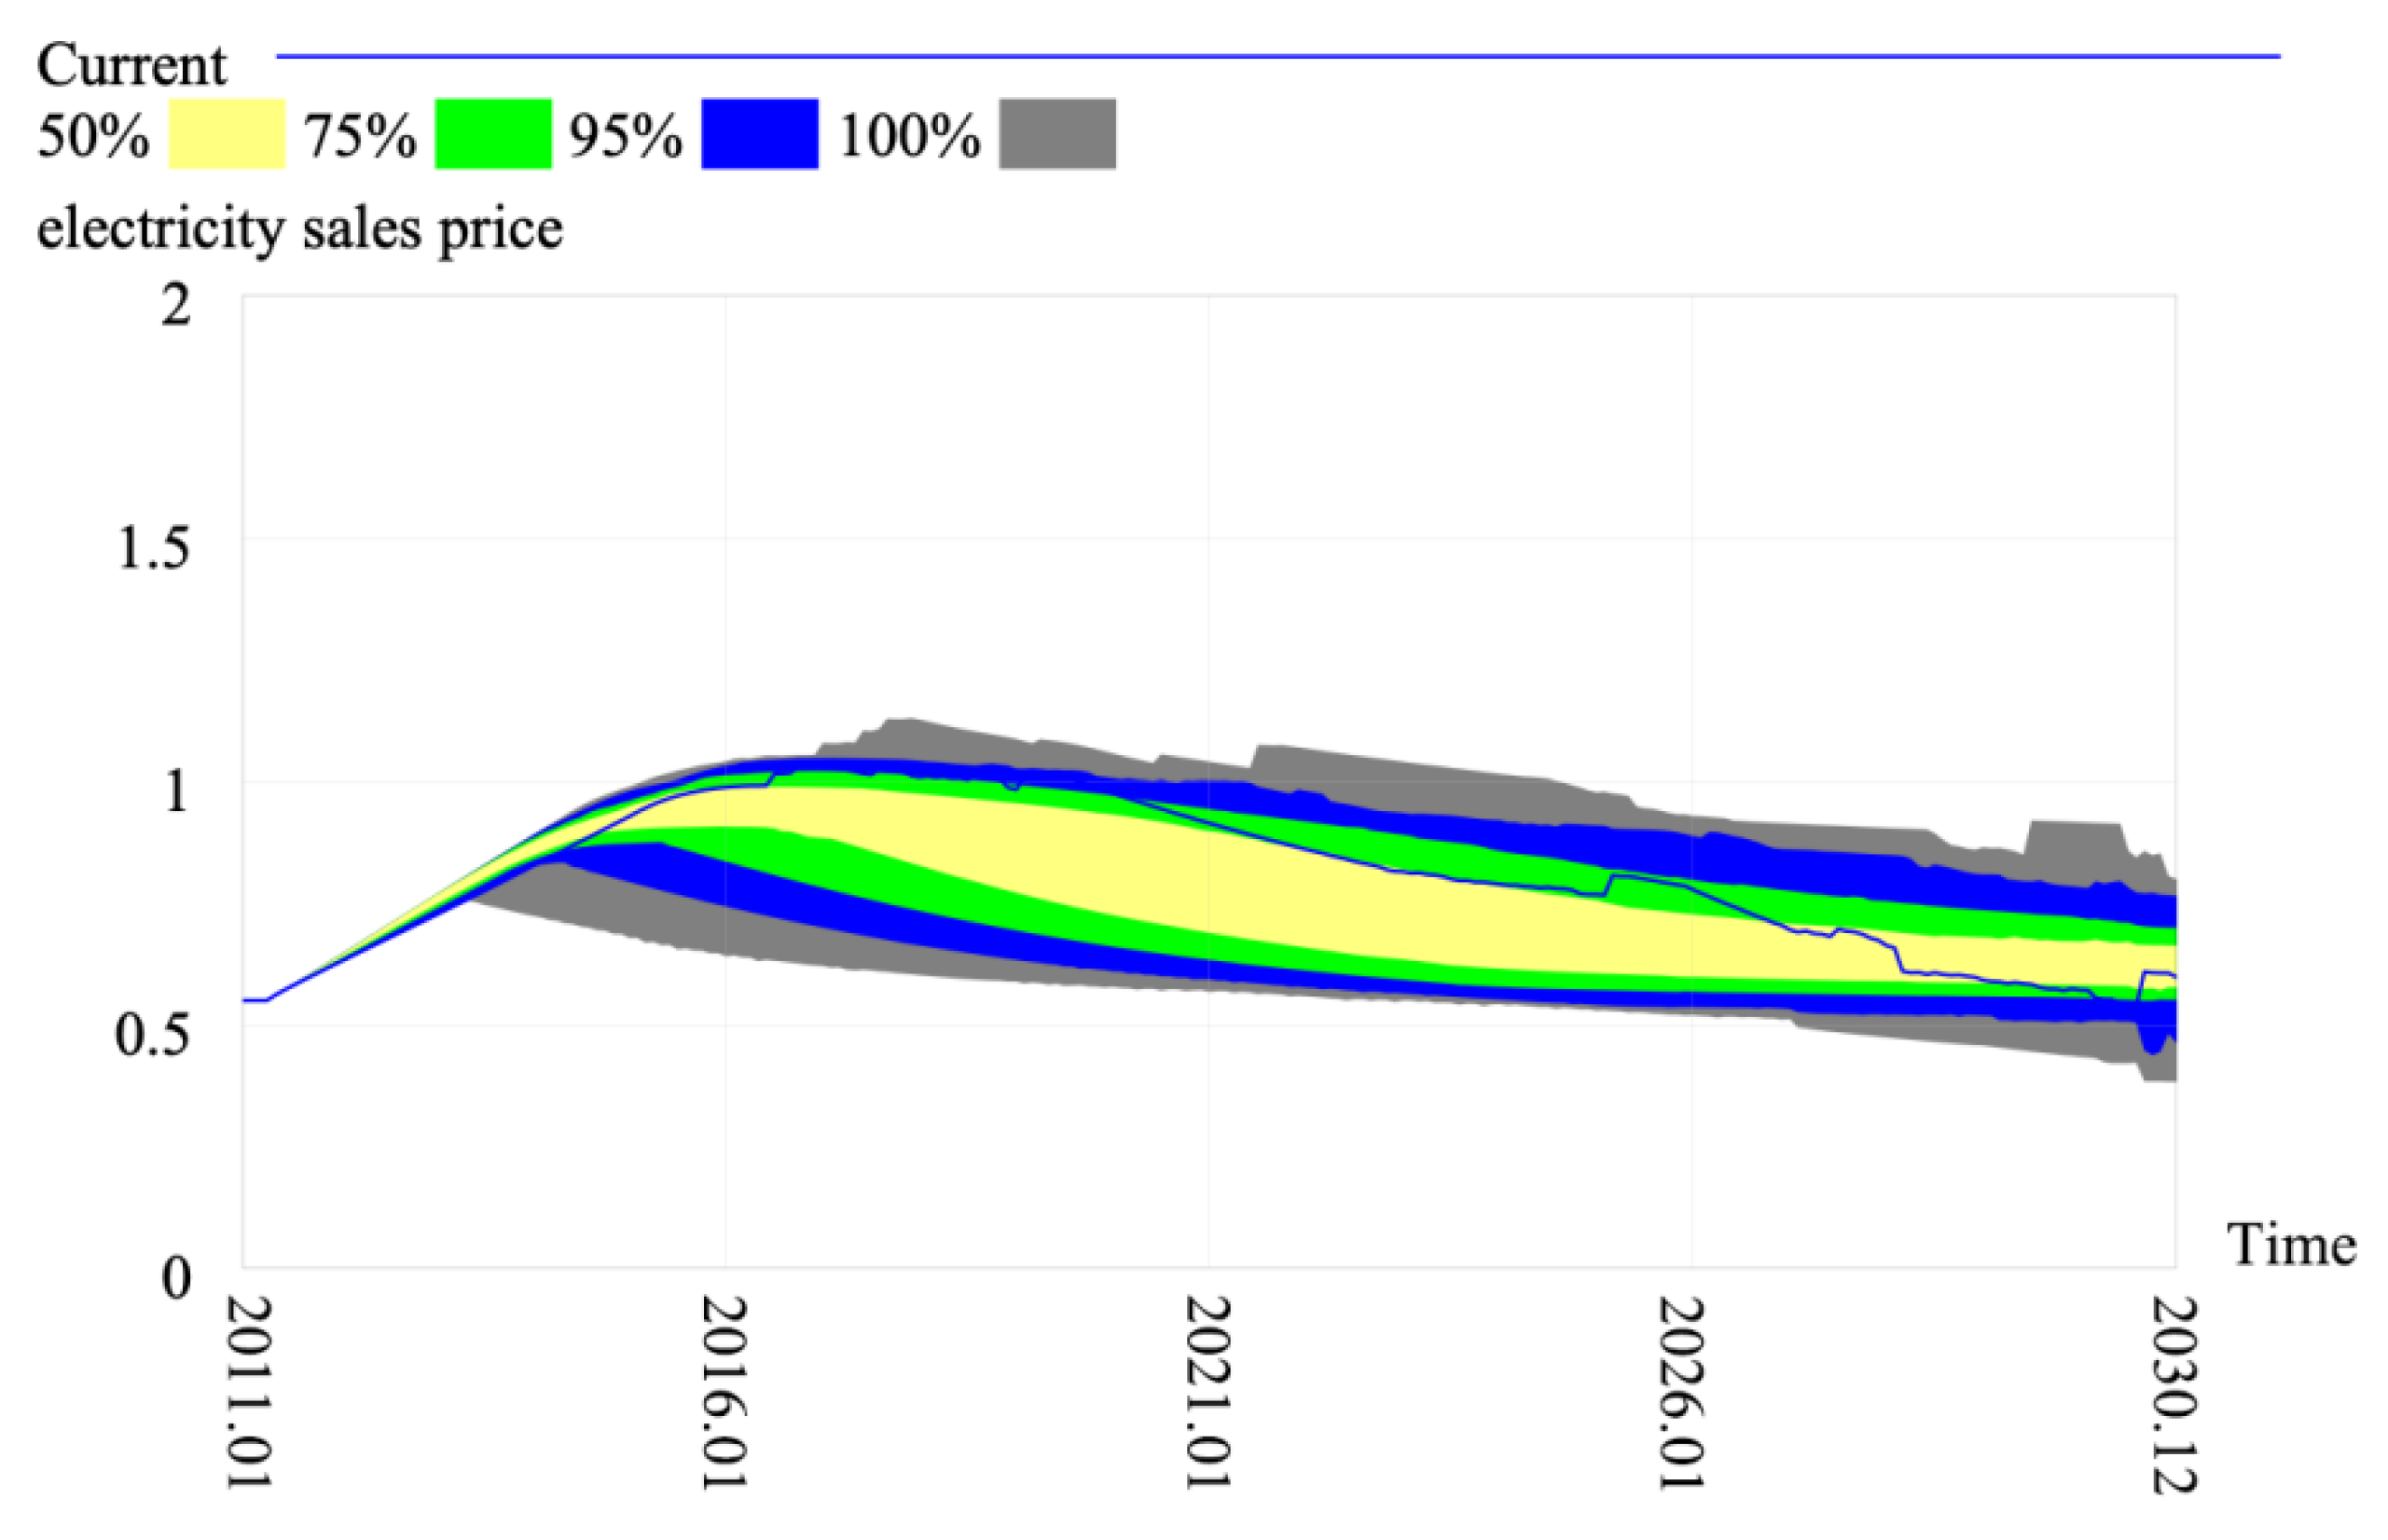
4.1. Sensitivity Analysis
4.2. Authenticity Test
4.3. Analysis of Price Trends in Independent and Coupled Markets
4.3.1. Green Certificate Price Change
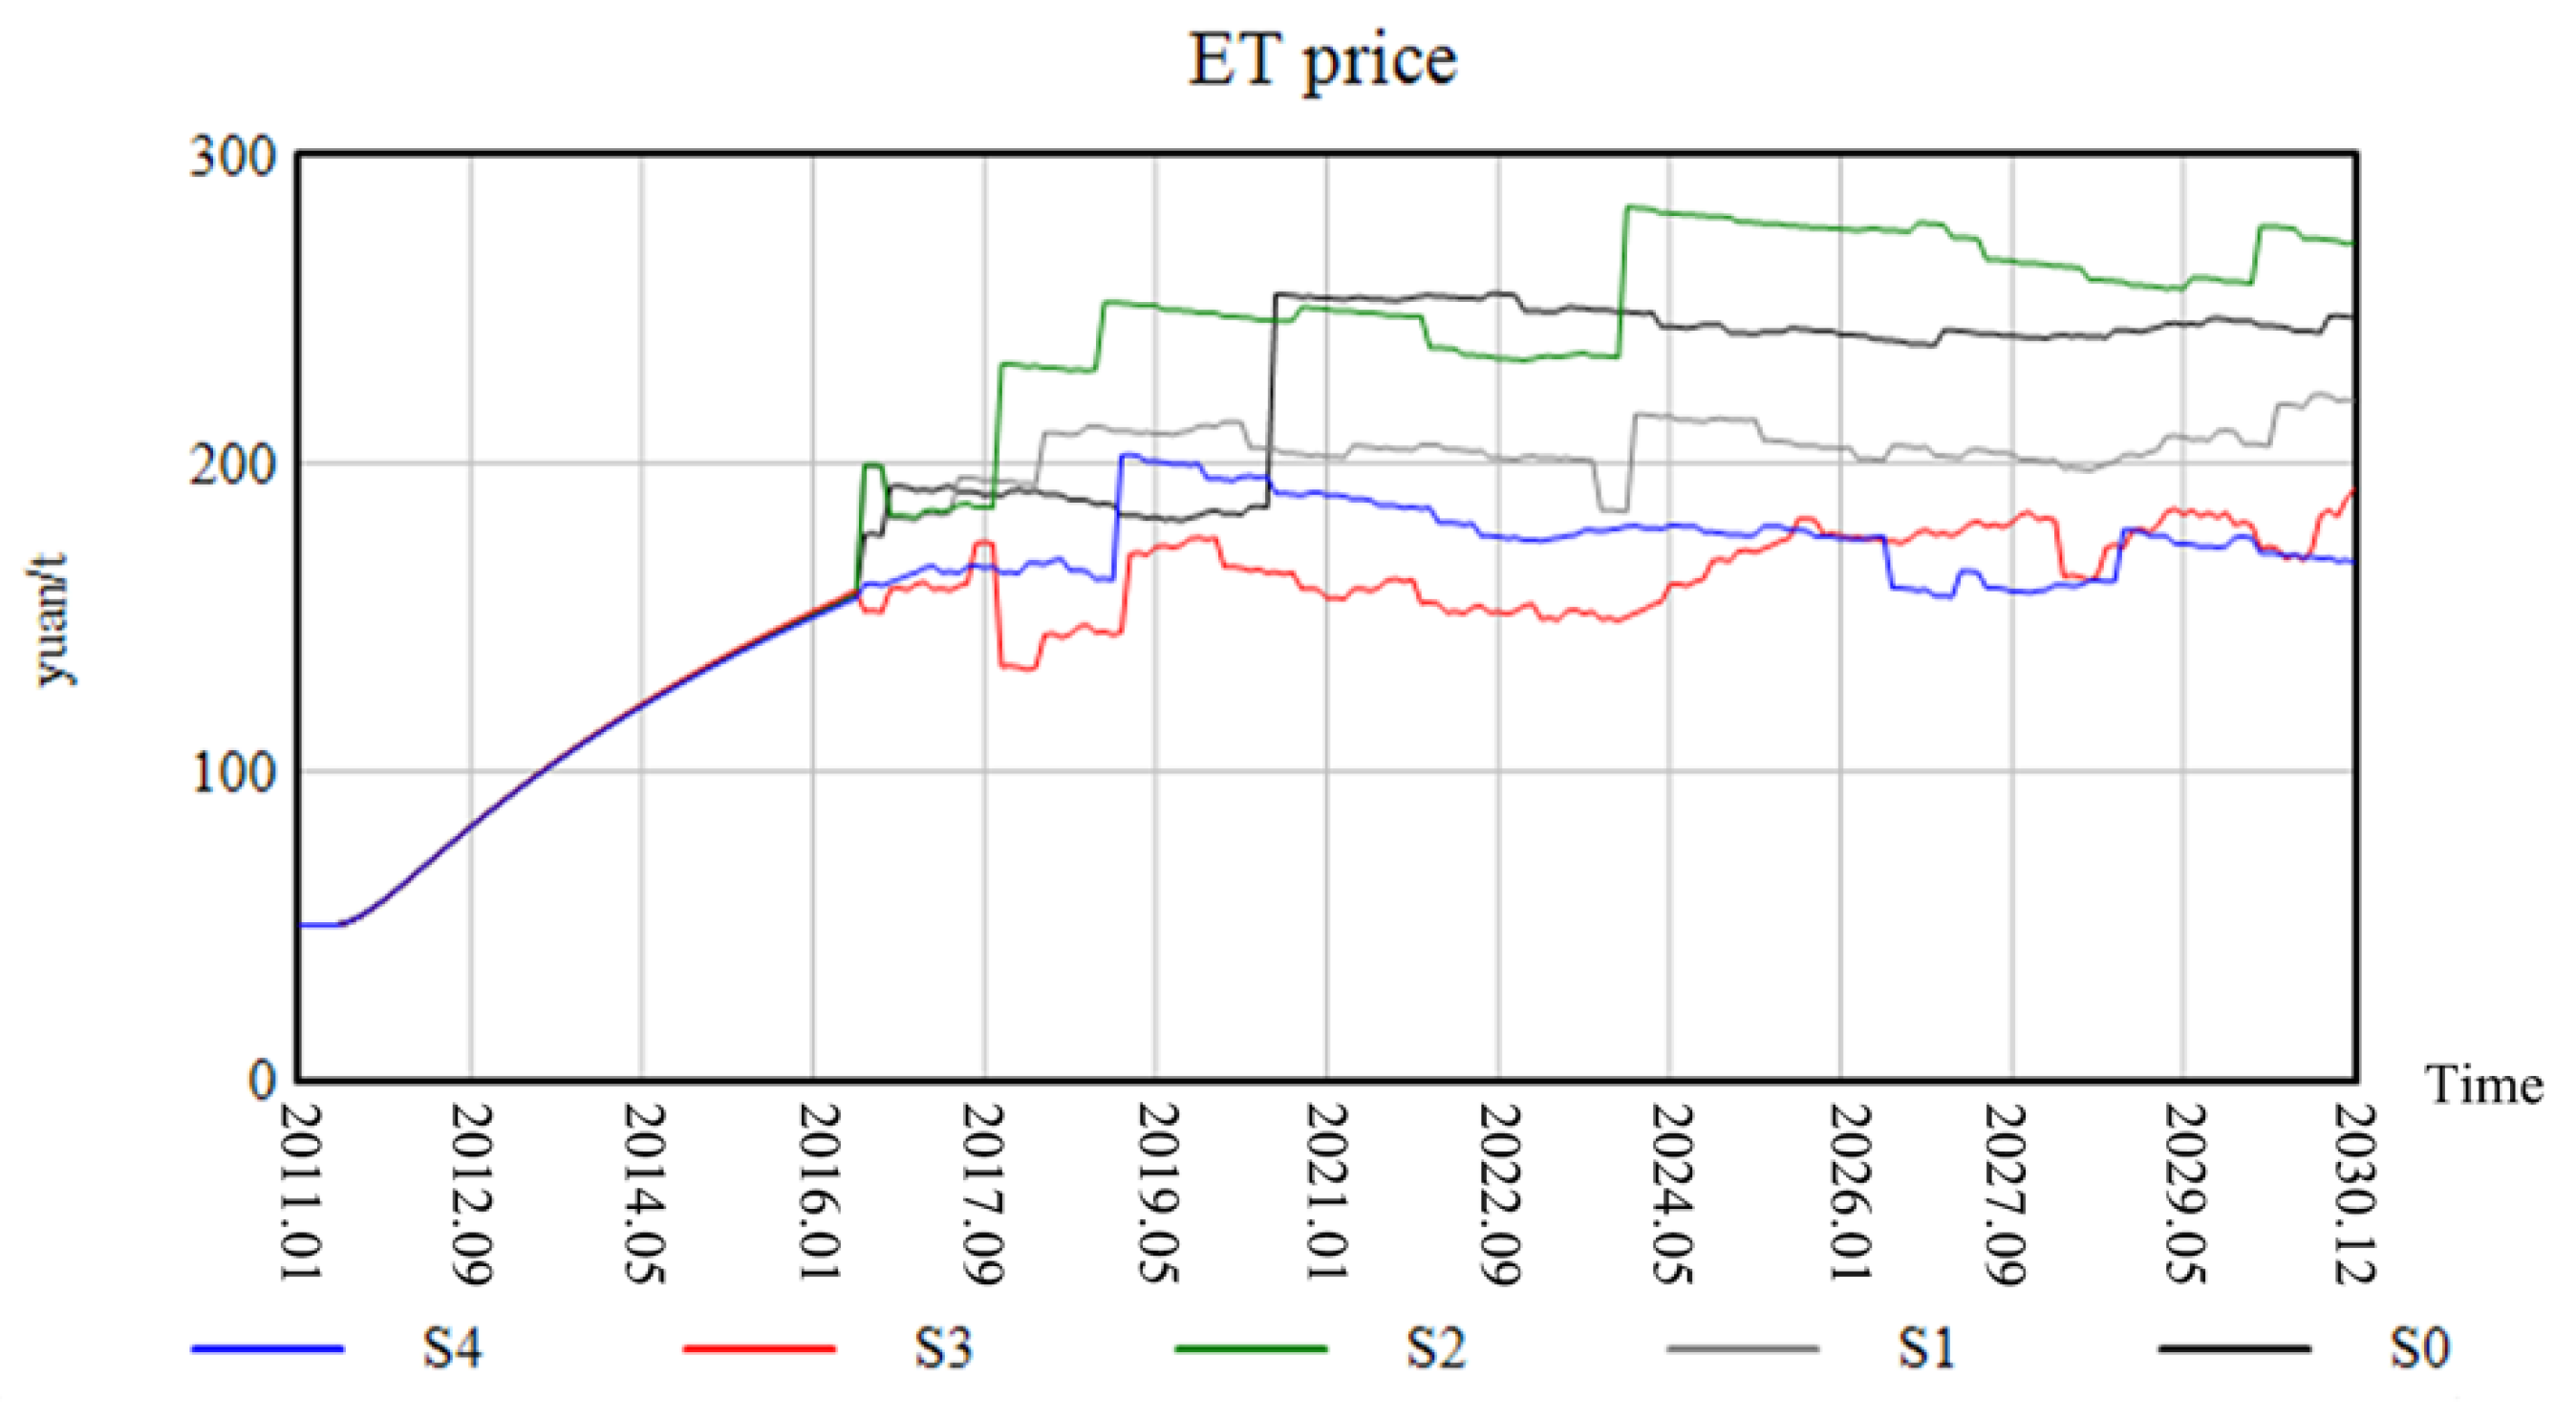
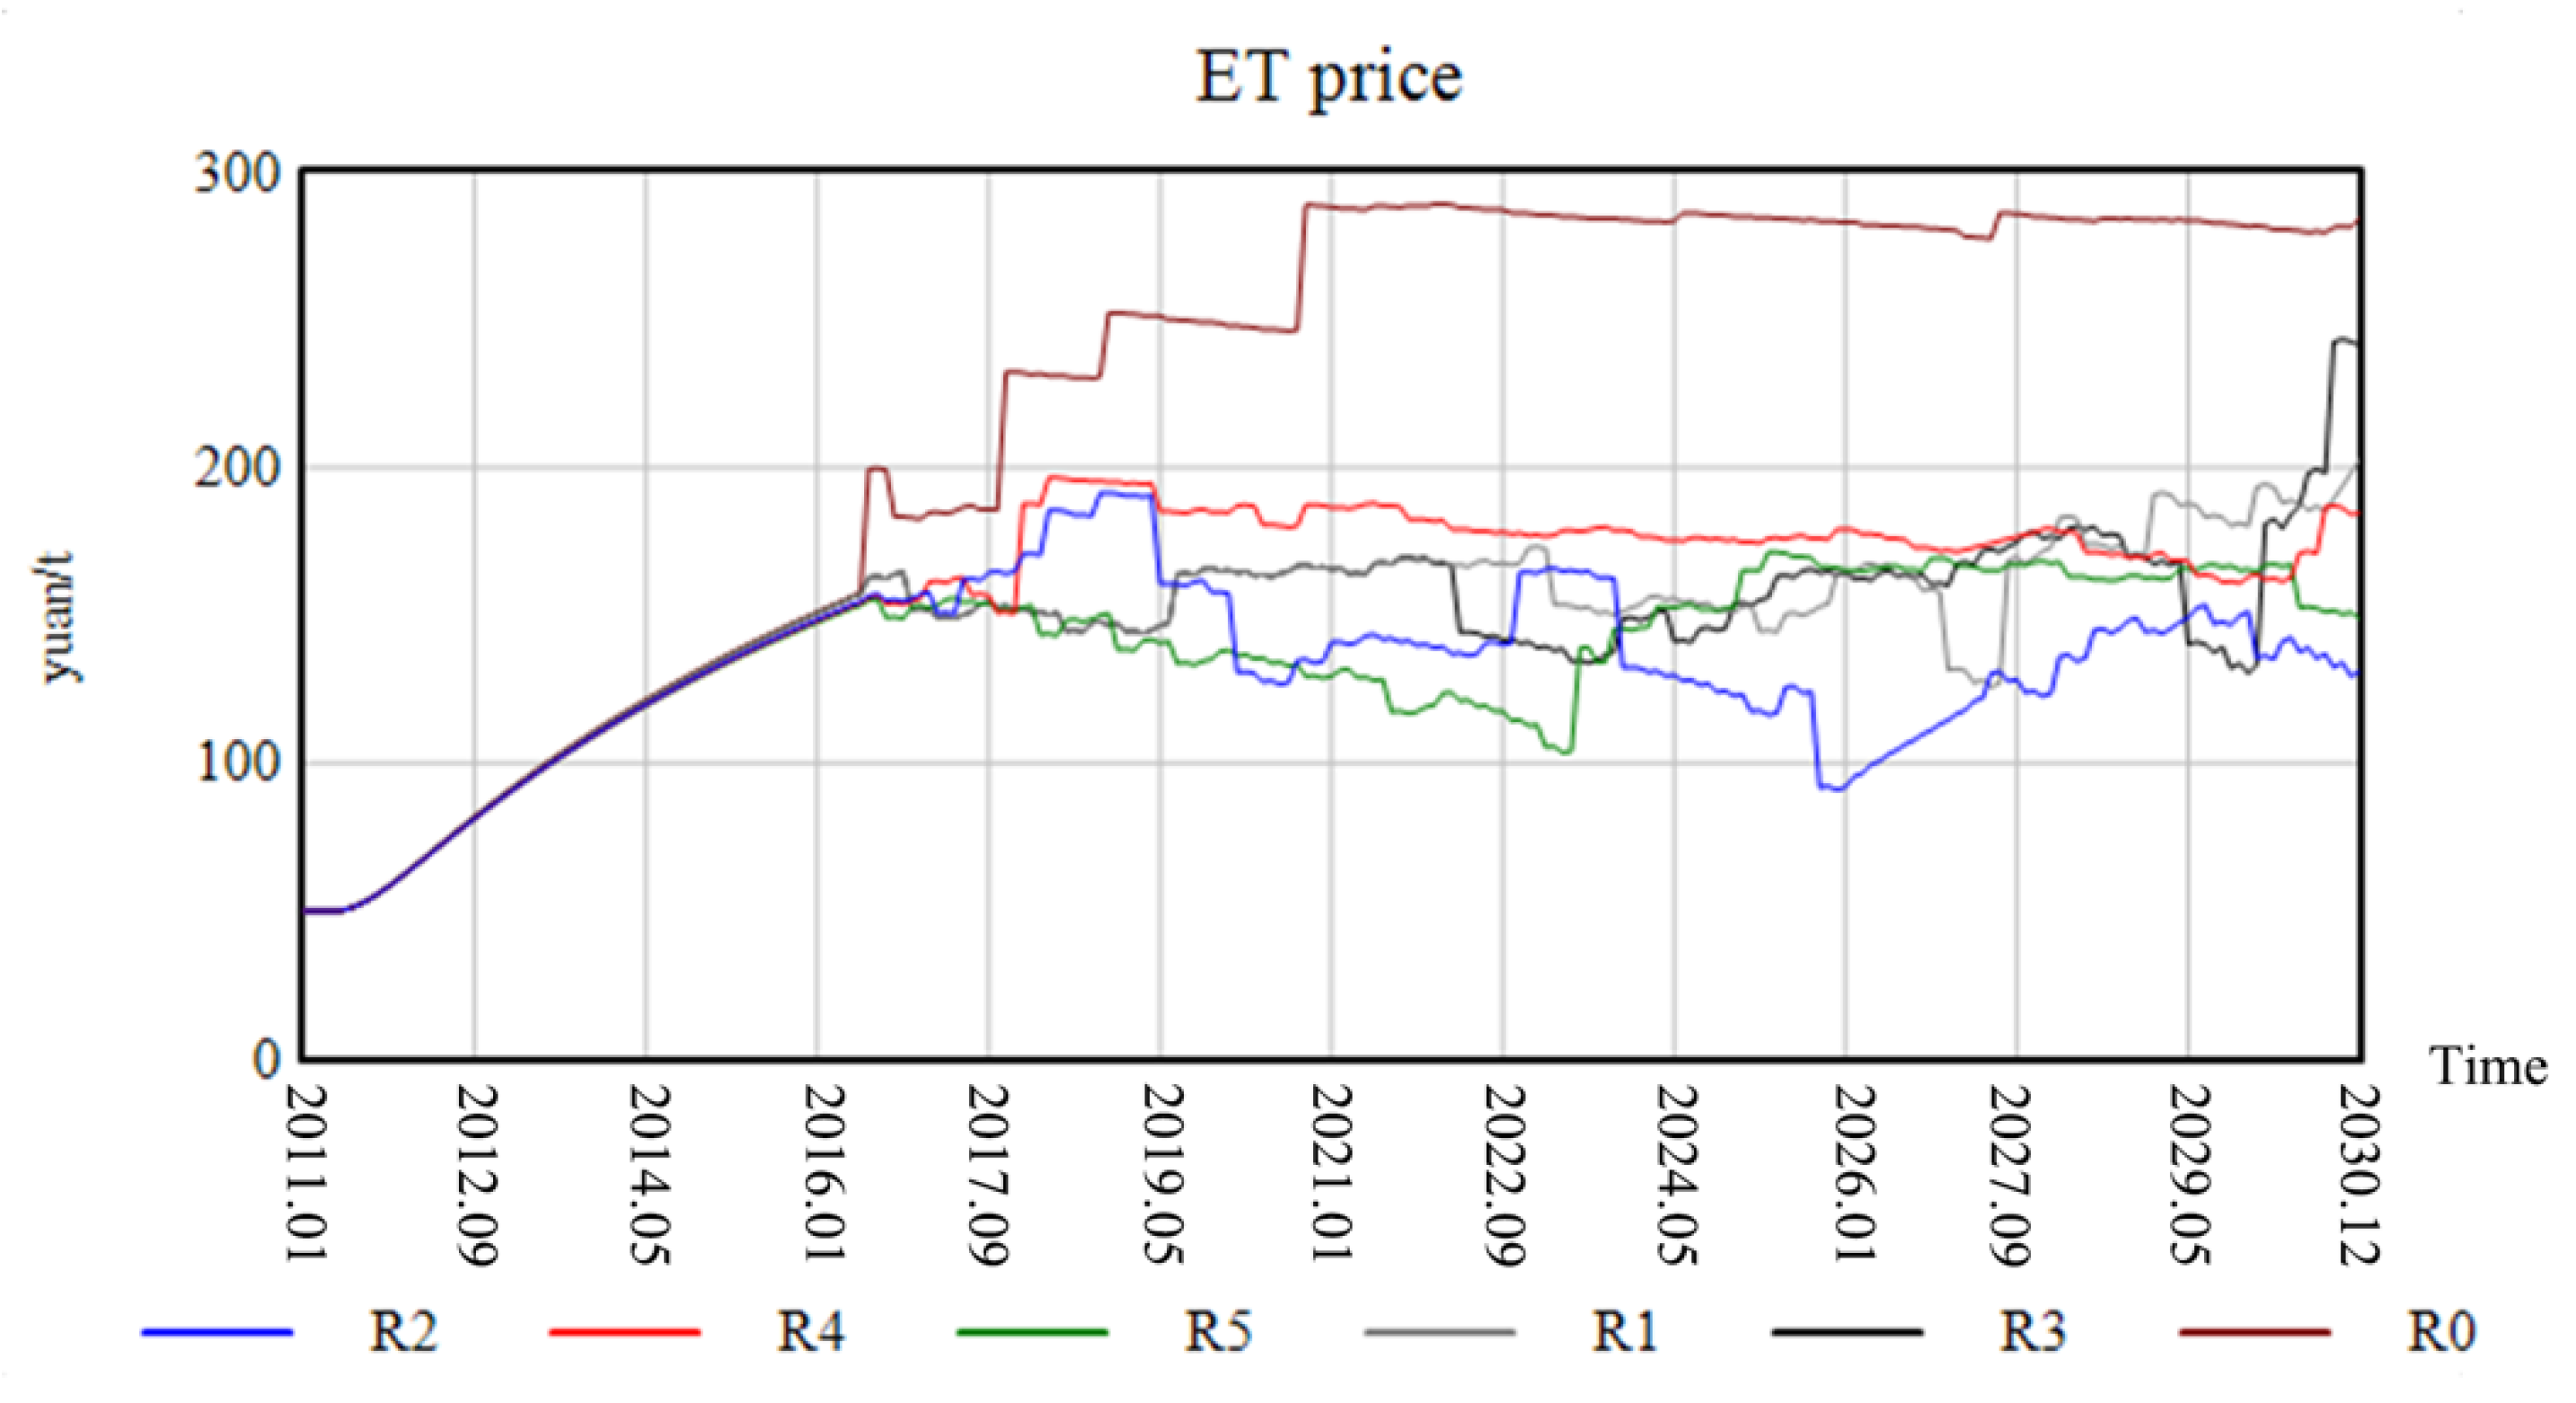
4.3.2. Carbon Emission Certificate Price Change
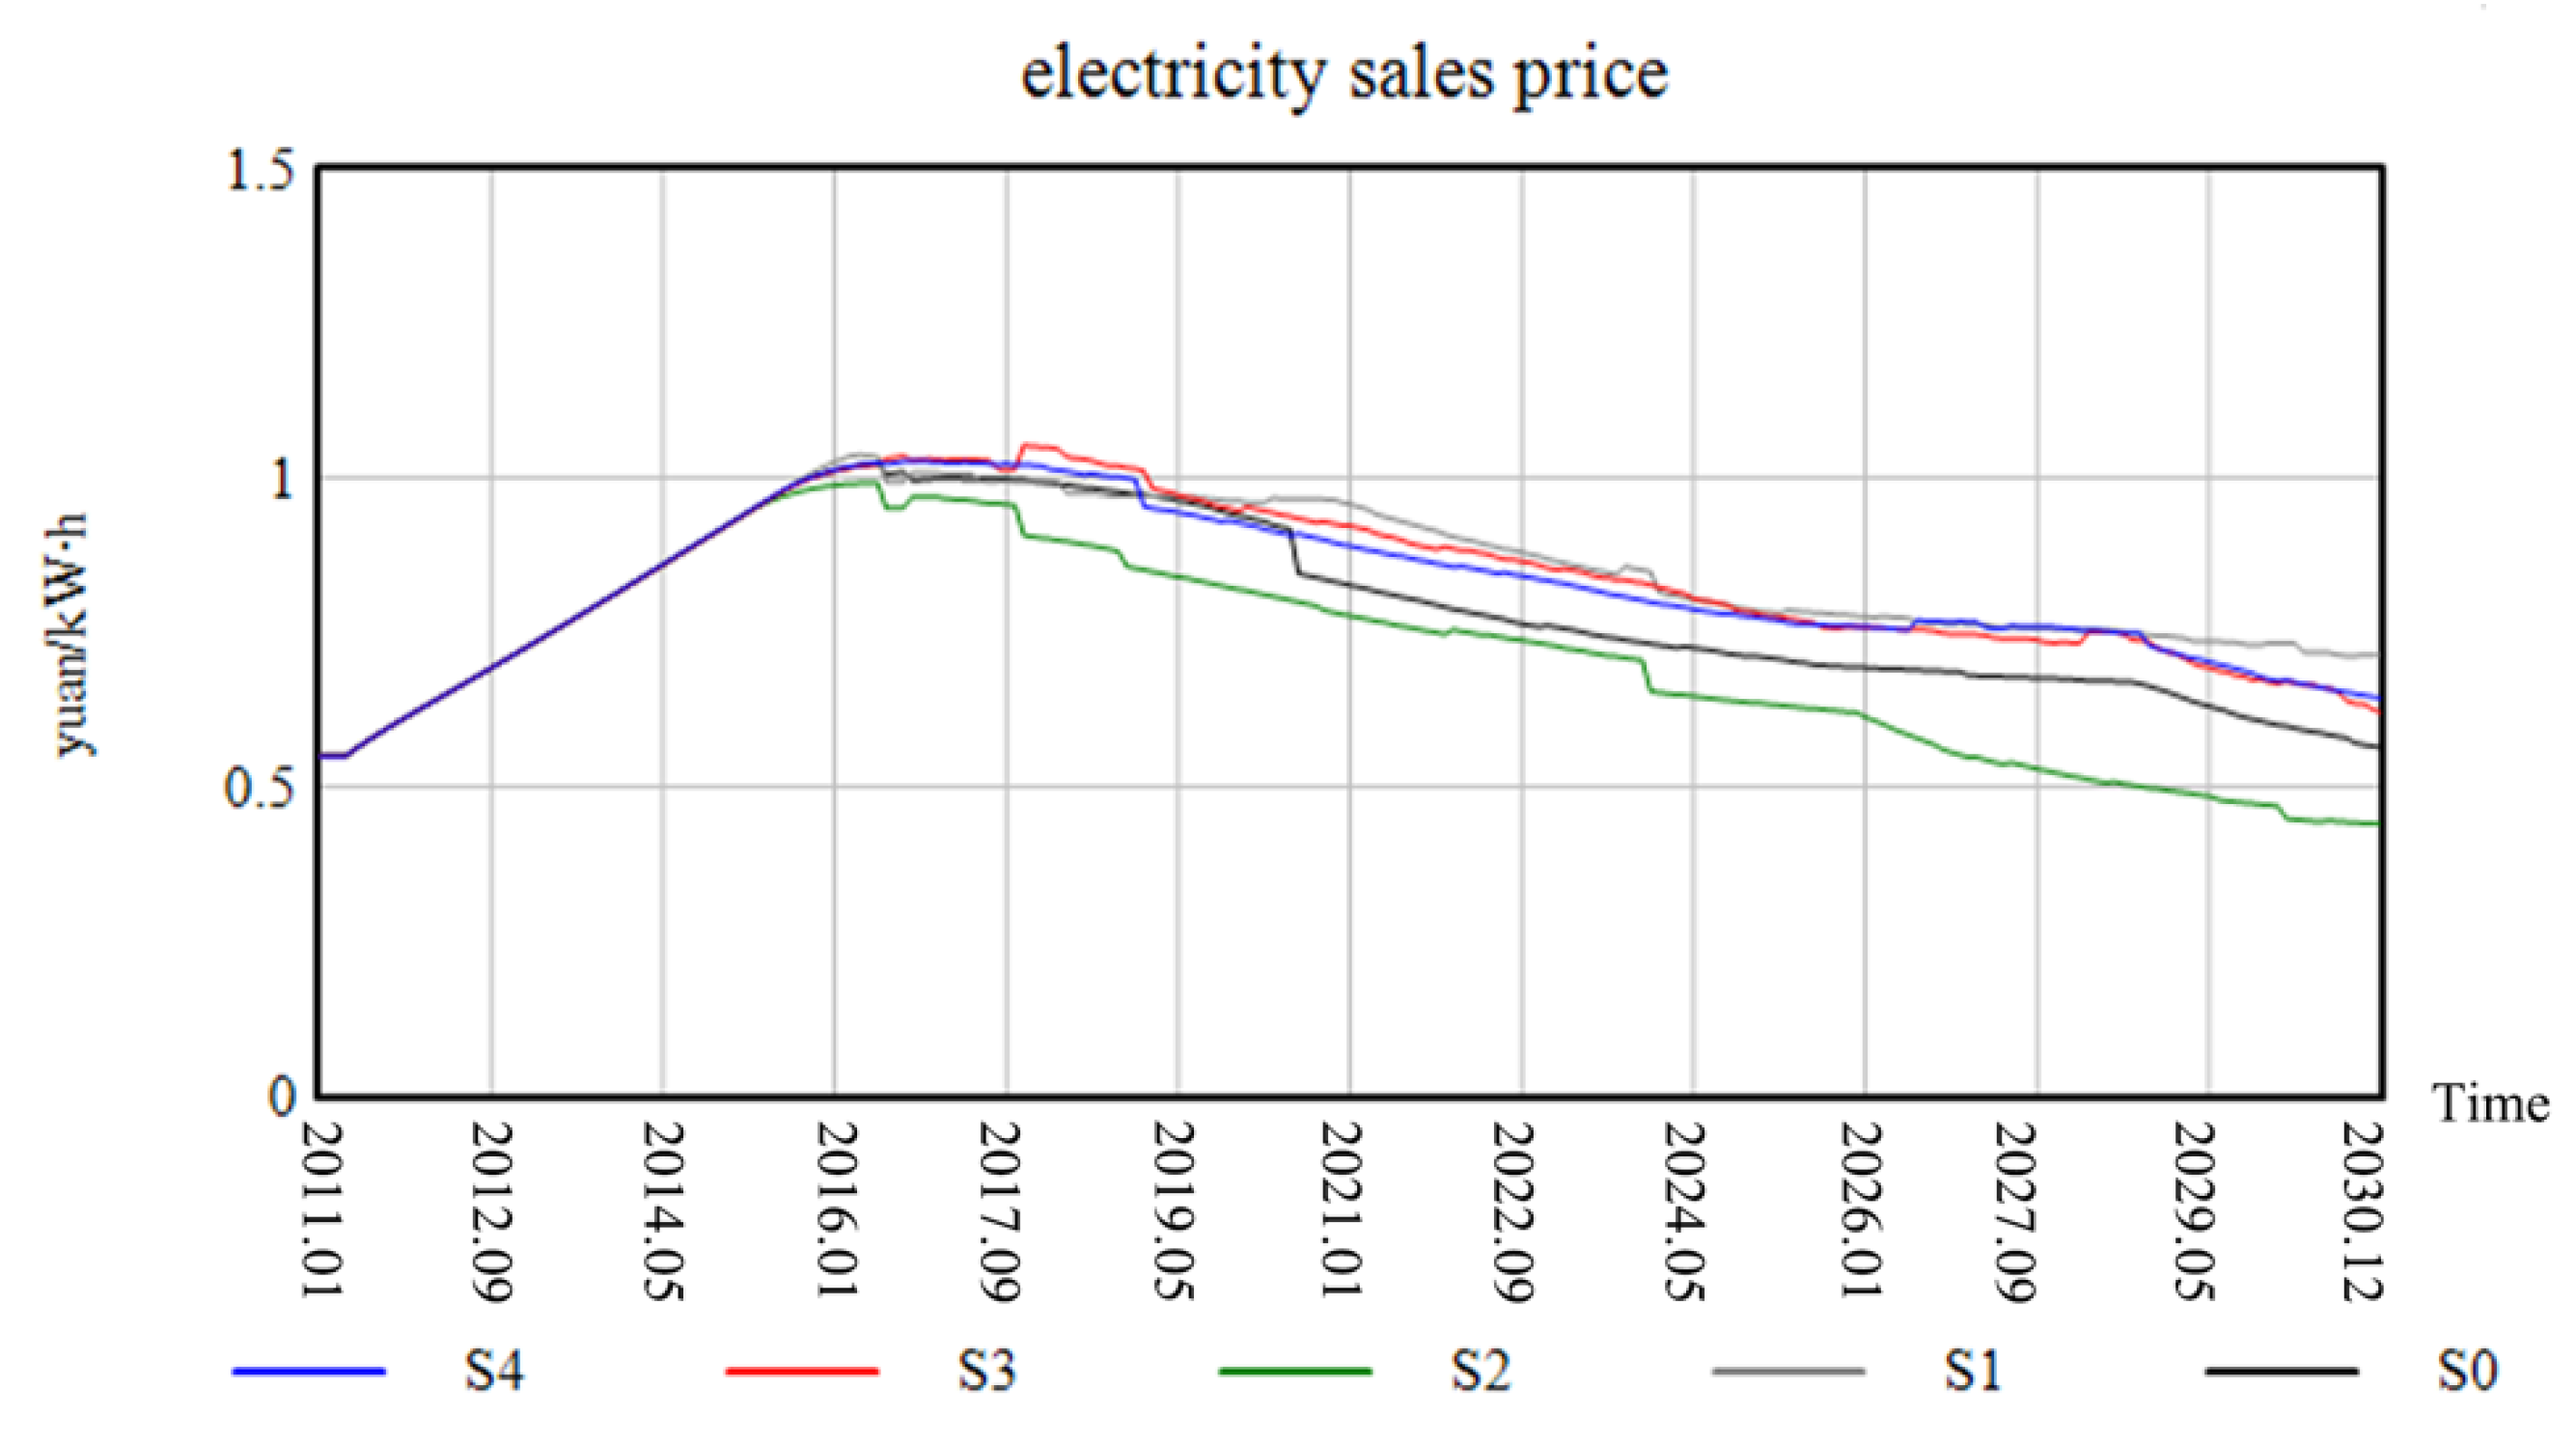
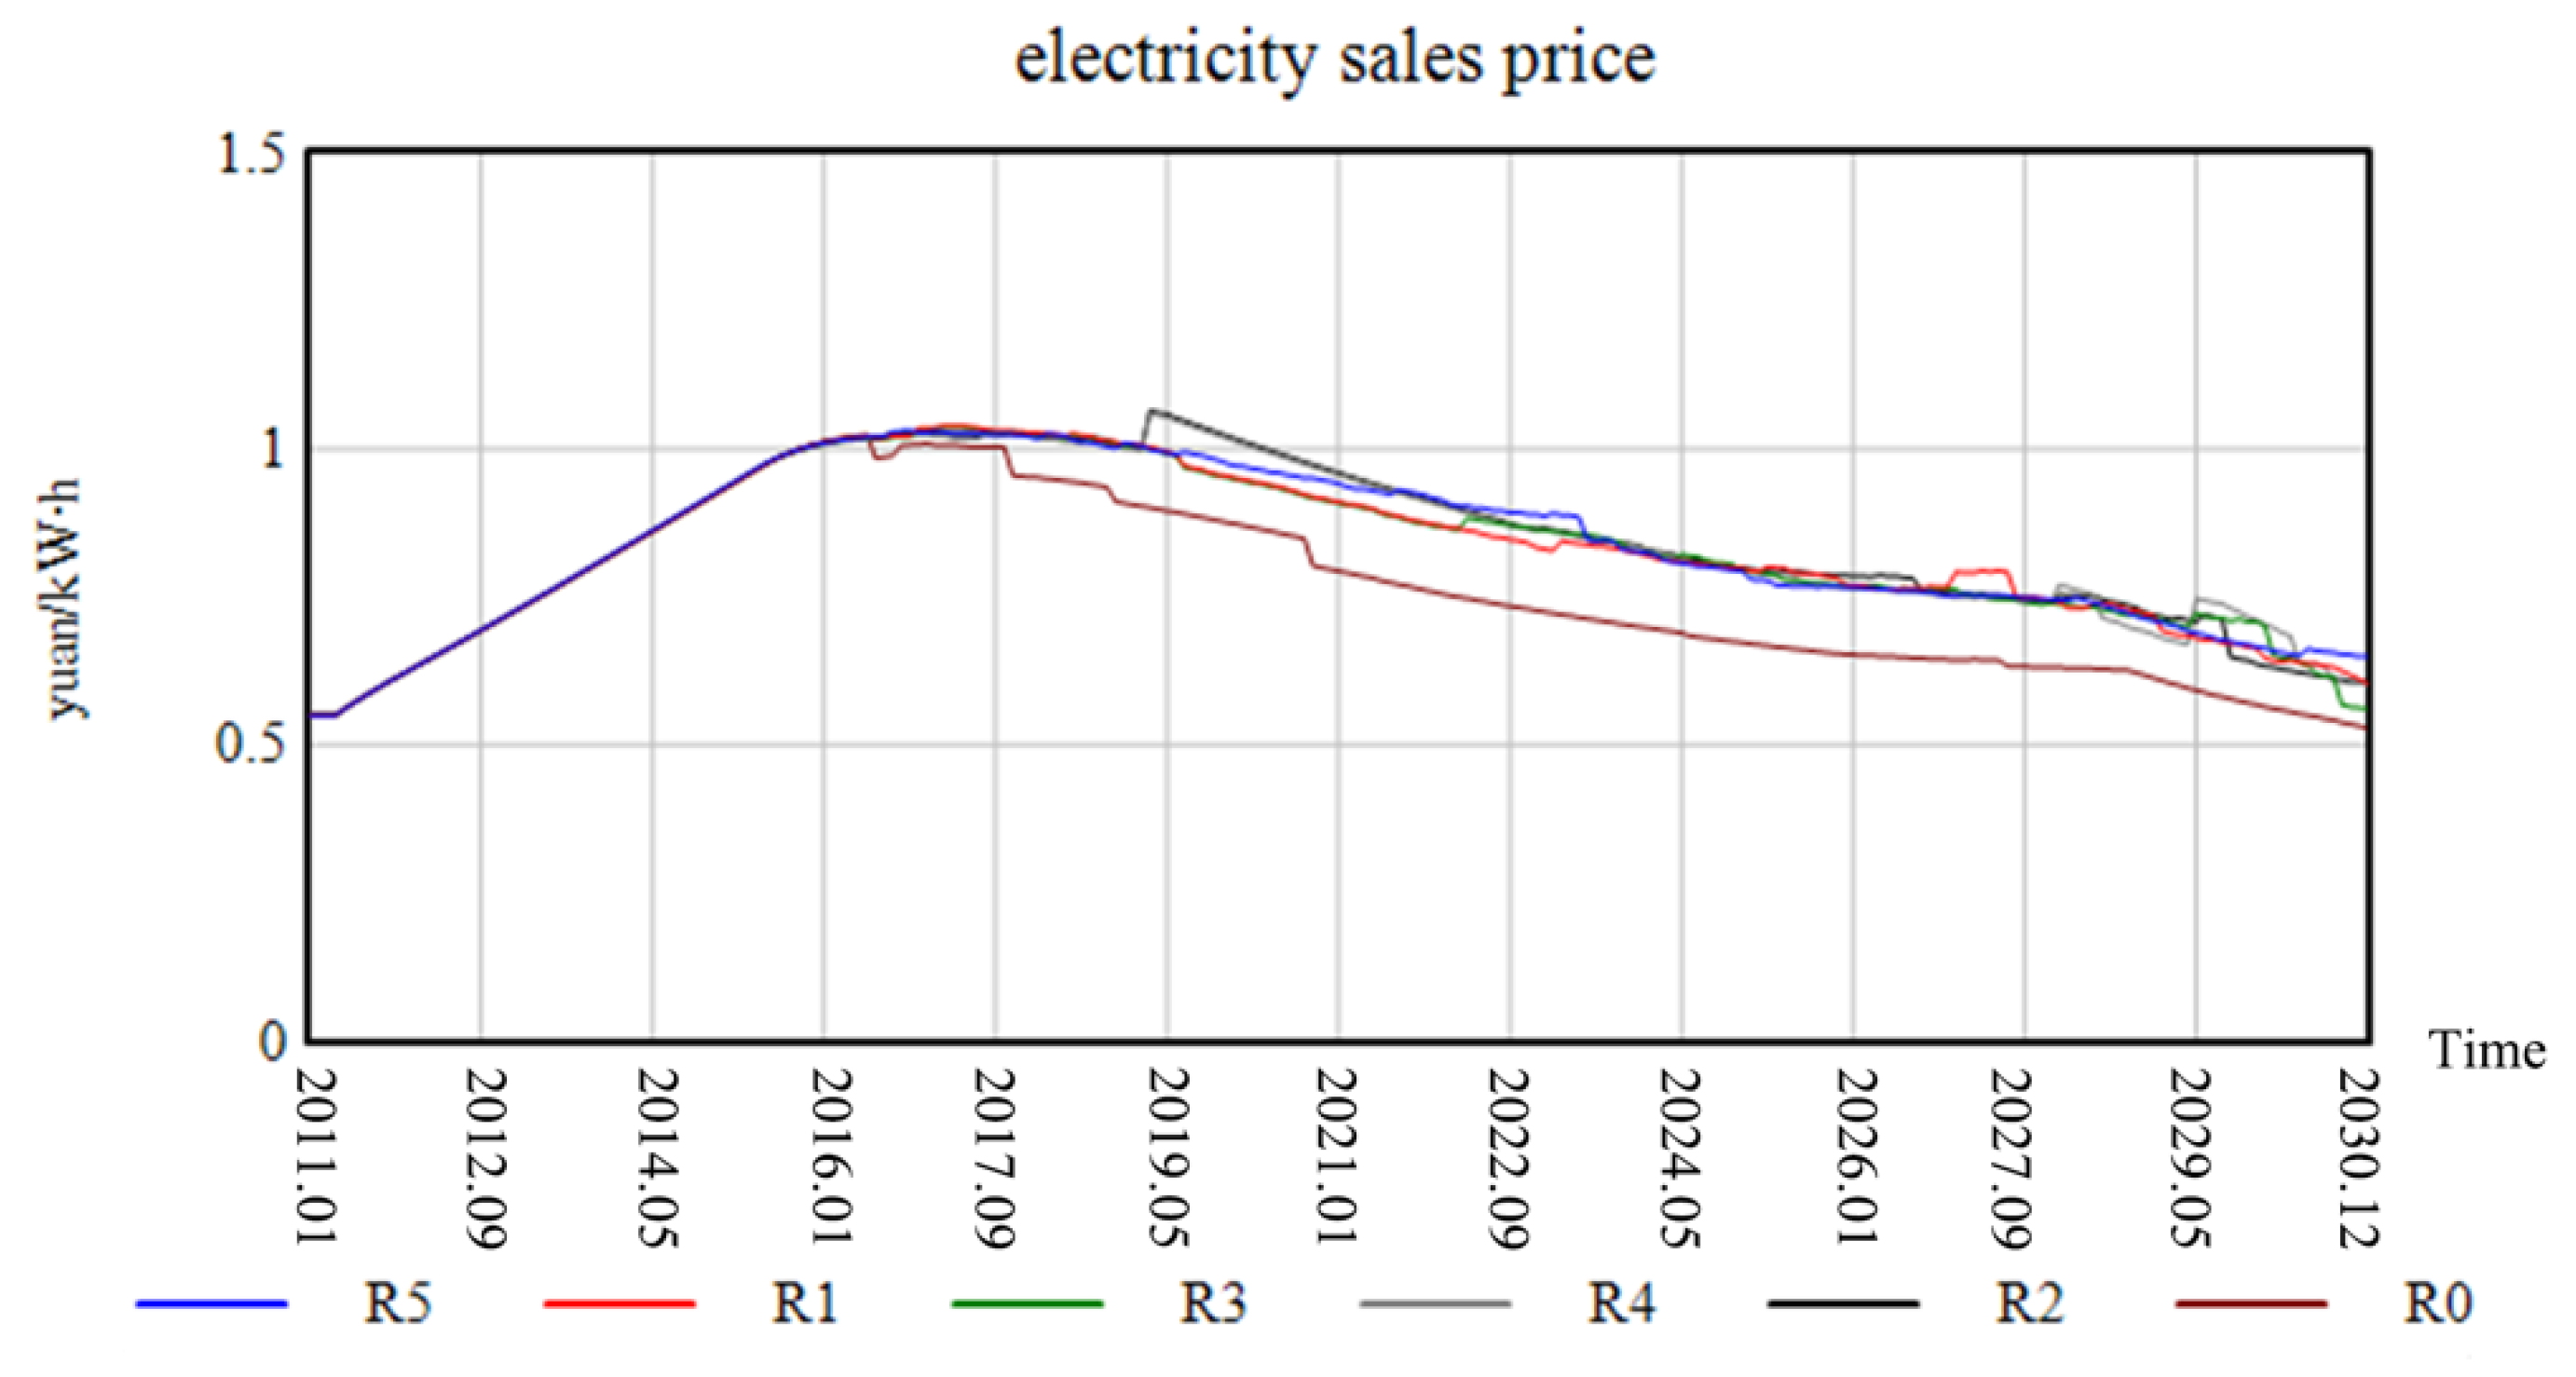
4.3.3. Sales Price Change
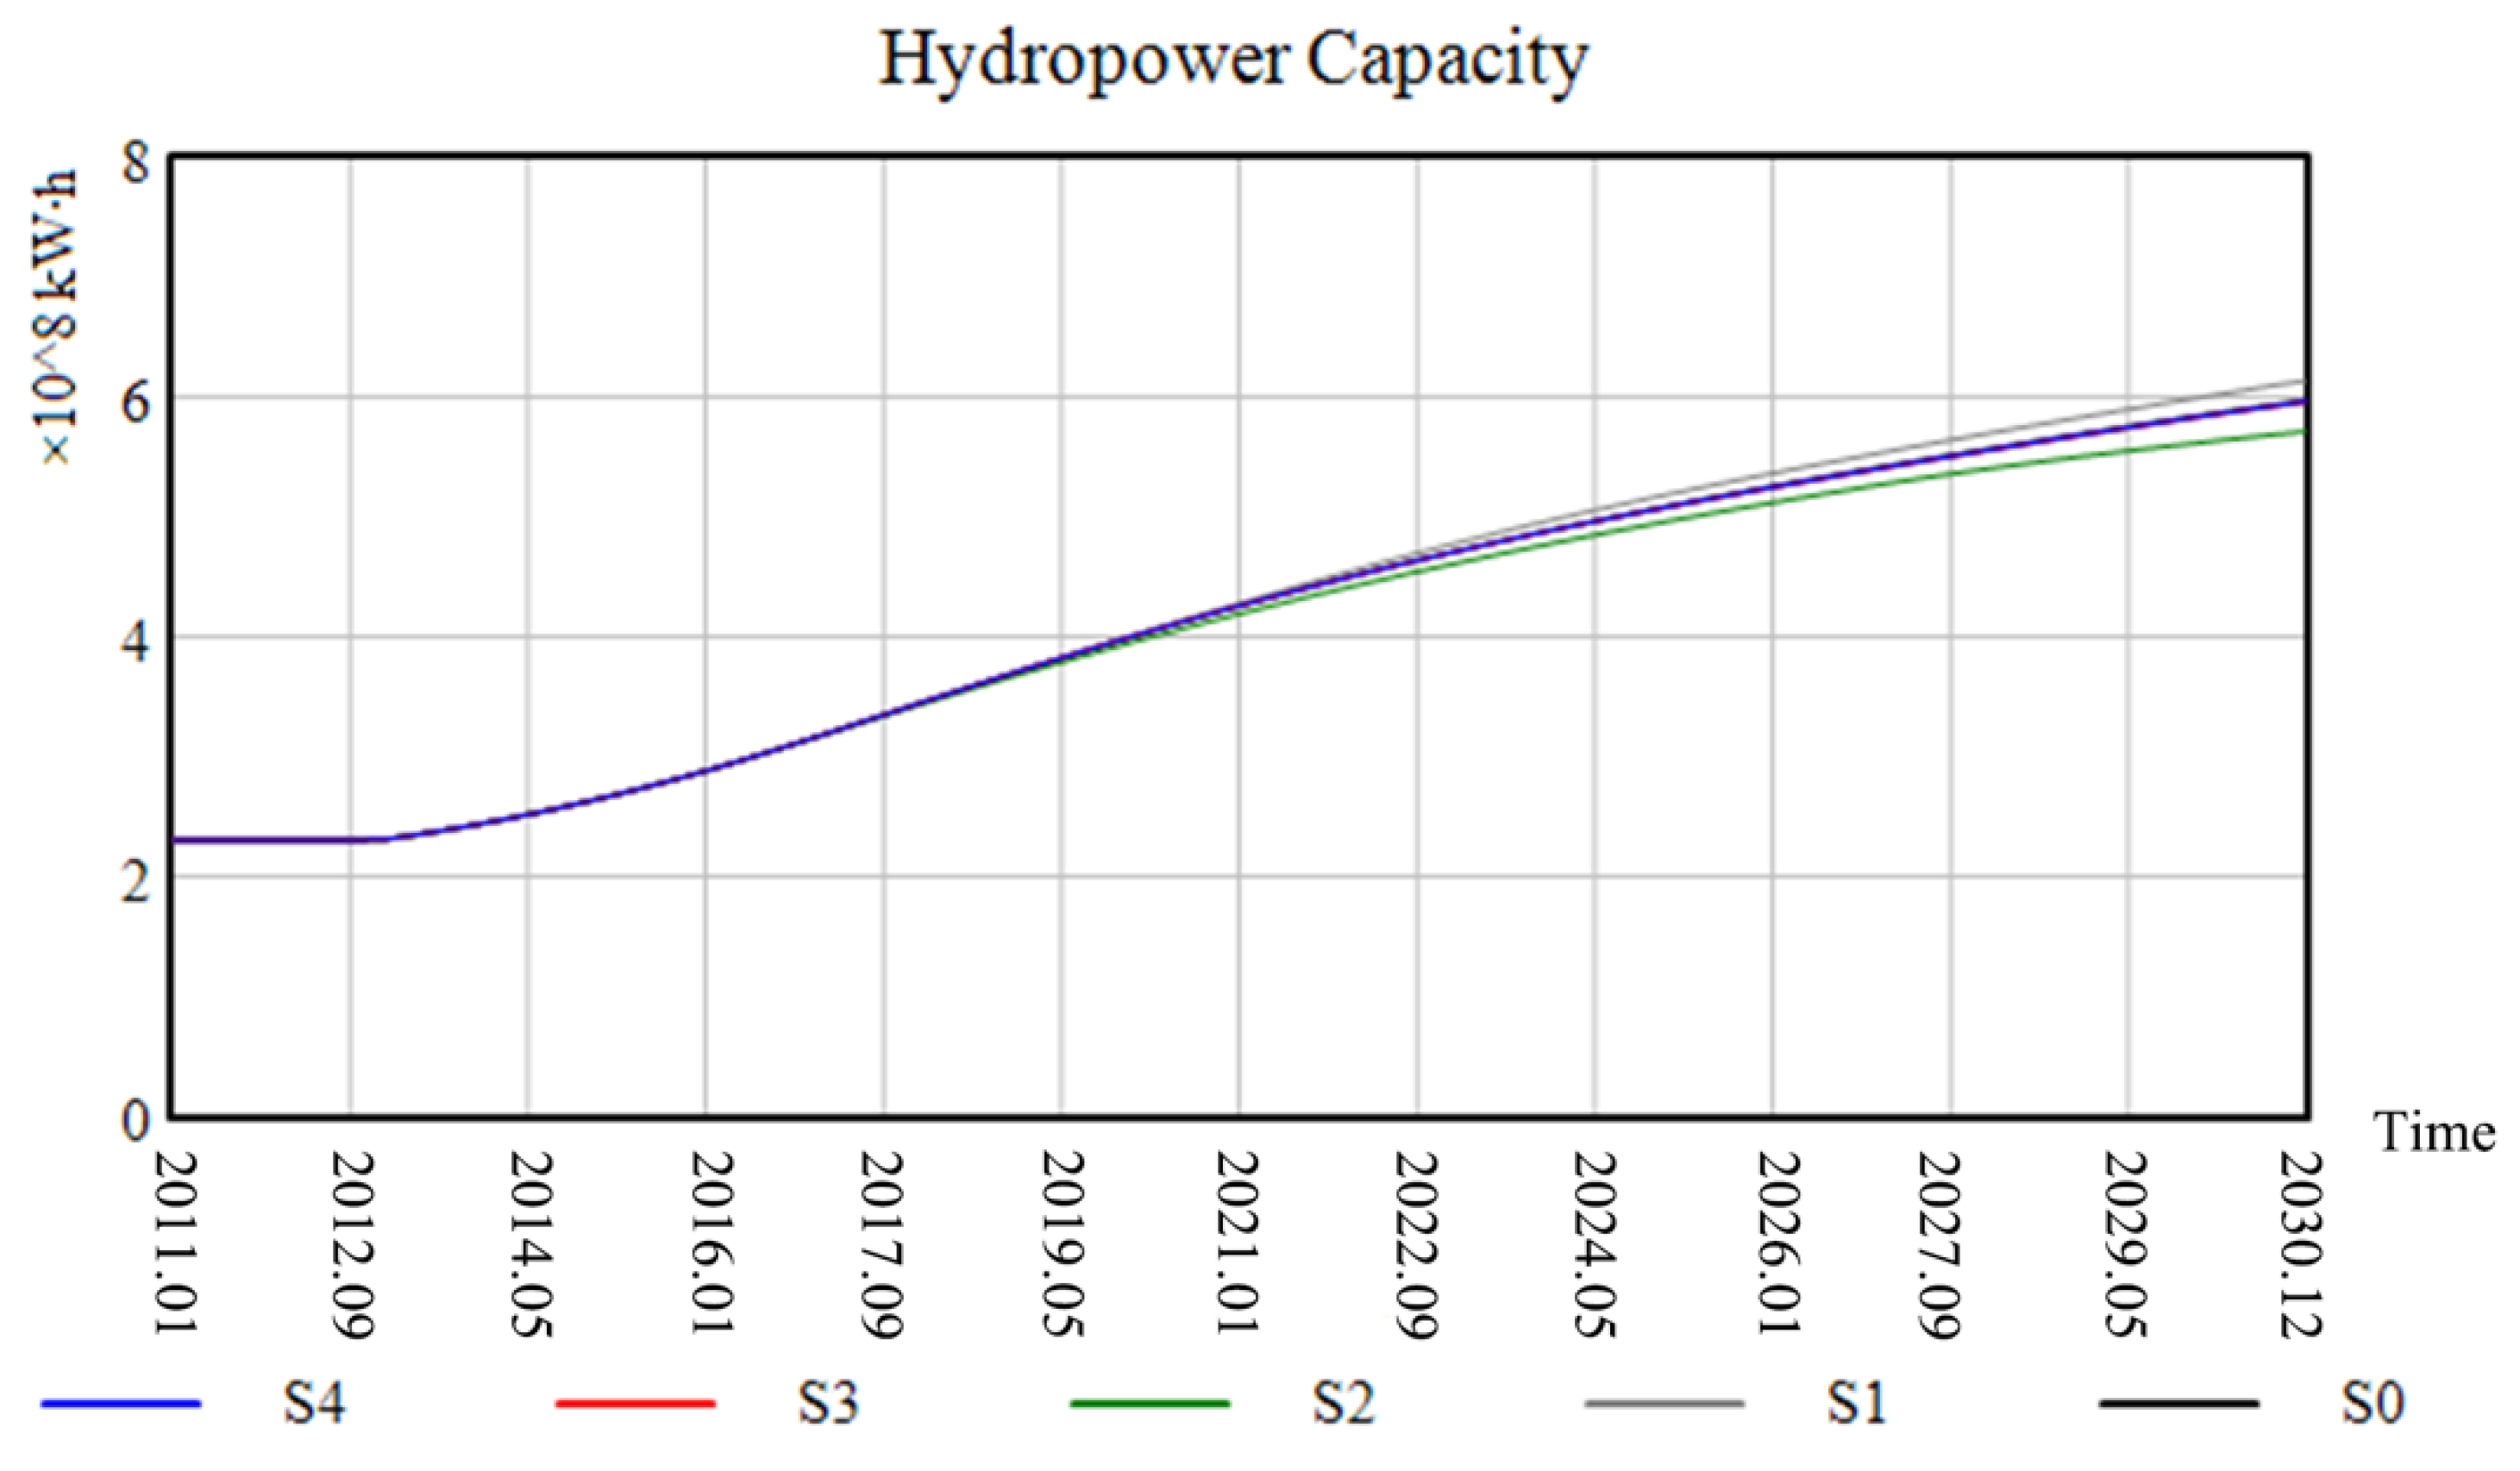
4.4. Power Structure Evolution Analysis
4.5. Generation Rights Trade Policy Analysis
5. Conclusions and Policy Implications
5.1. Conclusions
5.2. Policy Suggestion
5.3. Limitations and Future Work
Author Contributions
Funding
Data Availability Statement
Conflicts of Interest
Appendix A. Green Certificate Trading Market Module

| Variables | Unit | Symbolic Explanation |
|---|---|---|
| - | Number of TGCs handed in | |
| - | The proportion of renewable energy quota published by the state | |
| - | The demand gap of TGC | |
| - | The effect of TGC prices on demand | |
| - | The estimated purchase amount of TGC | |
| - | The impact of TGC price on supply | |
| - | The estimated sales of TGC | |
| CNY | TGC price changes | |
| CNY | TGC market price | |
| CNY | TGC price | |
| - | The supply of TGC | |
| CNY | Non-hydro renewable energy producers’ profit margins | |
| CNY | Hydropower producers’ profit margins | |
| CNY | Fossil energy producers’ profit margins | |
| MW | Installed capacity of non-hydro renewable energy producers | |
| MW | Installed capacity of hydropower producers | |
| MW | Installed capacity of fossil energy producers | |
| MW | Planned capacity of non-hydro renewable energy producers | |
| MW | Planned capacity of hydropower producers | |
| MW | Planned capacity of fossil energy producers | |
| MW | Completed capacity of non-hydro renewable energy producers | |
| MW | Completed capacity of hydropower producers | |
| MW | Completed capacity of fossil energy producers | |
| MW | Actual generation of non-hydro renewable energy producers | |
| MW | Actual generation of hydropower producers | |
| MW | Actual generation of fossil energy producers | |
| h | Equipment utilization hours of non-hydro renewable energy producers | |
| h | Equipment utilization hours of hydropower producers | |
| h | Equipment utilization hours of fossil energy producers | |
| - | Investment multiplier of non-hydro renewable energy producers | |
| - | Investment multiplier of hydropower producers | |
| - | Investment multiplier of fossil energy producers | |
| MW | Replacement power between non-hydro renewable energy producers and fossil energy producers | |
| MW | Replacement power between hydropower producers and fossil energy producers | |
| - | Quantity of carbon certificate supply | |
| - | Carbon emission certificate held by the sellers | |
| t | Carbon emissions from fossil energy generation | |
| - | Demand for carbon certificates from power producers | |
| - | Estimated sales of carbon certificates | |
| - | Estimated purchases of carbon certificates | |
| CNY | Price changes of carbon certificates | |
| CNY | Carbon certificate market price | |
| CNY | Carbon certificate price | |
| MW | Aggregate power supply | |
| MW | Power demand | |
| MW | Real-time power demand | |
| CNY/MWh | Electricity price change | |
| CNY/MWh | Market price of electricity | |
| CNY/MWh | Electricity price | |
| % | Reduction rate of carbon emissions per unit of GDP |
Appendix A.1. TGC Market Submodule
Appendix A.2. Renewable Energy Generation and Generation Rights Trade Submodule
Appendix B. Carbon Emissions Trading Module
Appendix B.1. ET Market Submodule
Appendix B.2. Fossil Energy Generation Submodule
Appendix C. Electricity Market Module
Appendix D. Three-Markets Interaction Module
Appendix E. Causal Relationships Within the Feedback Loops
References
- Han, Y.; Zou, Z.; Zhang, H. Exploration and Research on Low-Carbon Urban Transportation in Tianjin under the ‘Dual Carbon’ Goals. In Resilient Transportation: Quality and Service—Proceedings of the 2023 Annual Conference on Urban Transportation Planning; Tianjin Urban Planning and Design Research Institute Co., Ltd., Ed.; China Building Industry Press: Beijing, China, 2023; pp. 363–369. [Google Scholar]
- Gu, H.; Ou, K. Research on Carbon Emission Right Valuation Method for Power Generation Industry under the Background of “Dual Carbon” Background. Mod. Ind. Econ. Informationization 2024, 14, 172–175. [Google Scholar]
- Zhang, M.; Huang, X. Research on the Evolution of Renewable Energy Incentive Policies. Contemp. Econ. 2024, 41, 44–51. [Google Scholar]
- Wang, Y.; Fan, X. Carbon Reduction Througth the Synergy Between Carbon Intensity Quota Trading Market and Tenewable Energy Support Policy in Electric Power Industry. Arid Zone Resour. Environ. 2024, 38, 31–41. [Google Scholar]
- Jin-da, W.; Fan-si, K.; Yu-fei, J.; Bi-shan, Z. Research and Application of Synchronized Layout and Optimization Model for Renewable Energy Stations in District Heating Systems. Acta Energiae Solaris Sin. 2024, 45, 266–275. [Google Scholar]
- Wang, S.; Zhang, X. Soft Law Governance of Renewable Energy Absorption Guarantee Mechanism under the Background of “Dual Carbon”. J. Nanjing Tech. Univ. (Soc. Sci. Ed.) 2023, 22, 21–35+109. [Google Scholar]
- Cui, M.; Feng, T.; Liu, L. Integration and Development of Blockchain and Renewable Energy under Double Carbon Target. Smart Power 2024, 52, 17–24. [Google Scholar]
- NDRC. Notice on the Establishment of a Sound Renewable Energy Power Consumption Guarantee Mechanism. 2019. Available online: https://www.ndrc.gov.cn/xwdt/xwfb/201905/t20190515_954419.html?code=&state=123 (accessed on 23 May 2022).
- Guo, W.; Zhao, X.; Feng, X. Comparative Analysis of Feed-in Tariff and Renewable Portfolio Standards: The Power Market in China. China Sci. Technol. Forum 2016, 9, 90–97. [Google Scholar]
- Liu, D.; Liu, M.; Xu, E.; Pang, B.; Guo, X.; Xiao, B.; Niu, D. Comprehensive effectiveness assessment of renewable energy generation policy: A partial equilibrium analysis in China. Energy Policy 2018, 115, 330–341. [Google Scholar] [CrossRef]
- Wang, G.; Zhang, Q.; Li, Y.; McLellan, B.C. Efficient and equitable allocation of renewable portfolio standards targets among China’s provinces. Energy Policy 2019, 125, 170–180. [Google Scholar] [CrossRef]
- Xin-Gang, Z.; Pei-Ling, L.; Ying, Z. Which policy can promote renewable energy to achieve grid parity? Feed-in tariff vs. renewable portfolio standards. Renew. Energy 2020, 162, 322–333. [Google Scholar] [CrossRef]
- NDRC. Guidance on Vigorously Implementing Renewable Energy Substitution Actions. 2024. Available online: https://www.ndrc.gov.cn/xxgk/zcfb/tz/202410/t20241030_1394119.html (accessed on 23 May 2022).
- Zhao, W.; Lin, M.; Gao, J. Combined transaction model of generation right and carbon emission right under the power market mechanism with renewable energy considered. Power Syst. Clean Energy 2016, 32, 5862–5870. [Google Scholar]
- Zhou, Y.; Zhao, X.; Wang, Z. Demand side incentive under renewable portfolio standards: A system dynamics analysis. Energy Policy 2020, 144, 111652. [Google Scholar] [CrossRef]
- Ji, X. Review on Climate and Energy Policy Interaction Abroad. China Popul. Resour. Environ. 2014, 24, 42–50. [Google Scholar]
- Wang, P.; Song, X.; Yang, H.; Zhai, X.; Han, J.; Ju, L. Multi-market Coupling Trading Simulation of Electricity Green Certificate -and Excess Consumption Under New Renewable Portfolio Standard. J. Syst. Simul. 2022, 34, 2458–2469. [Google Scholar]
- Zhao, S.; Wang, B.; Li, Y.; Sun, M.; Zeng, W. System Dynamics Based Analysis on Incentive Mechanism of Distributed Renewable Energy Resources. Autom. Electr. Power Syst. 2017, 41, 97–104. [Google Scholar]
- Del Río, P. Why does the combination of the European Union Emissions Trading Scheme and a renewable energy target makes economic sense? Renew. Sustain. Energy Rev. 2017, 74, 824–834. [Google Scholar] [CrossRef]
- Del Río, P.; Cerdá, E. The missing link: The influence of instruments and design features on the interactions between climate and renewable electricity policies. Energy Res. Soc. Sci. 2017, 33, 49–58. [Google Scholar] [CrossRef]
- Schusser, S.; Jaraitė, J. Explaining the interplay of three markets: Green certificates, carbon emissions and electricity. Energy Econ. 2018, 71, 29. [Google Scholar] [CrossRef]
- Åberg, M.; Lingfors, D.; Olauson, J.; Widén, J. Can electricity market prices control power-to-heat production for peak shaving of renewable power generation? The case of Sweden. Energy 2019, 176, 1–14. [Google Scholar] [CrossRef]
- Yi, B.-W.; Xu, J.-H.; Fan, Y. Coordination of policy goals between renewable portfolio standards and carbon caps: A quantitative assessment in China. Appl. Energy 2019, 237, 25–35. [Google Scholar] [CrossRef]
- Bao, X.; Zhao, W.; Song, Y.; Wang, X. Policy Effects Concerning the Coexistence of Renewable Portfolio Standards and Emissions Trading. Oper. Res. Manag. Sci. 2022, 31, 129–135. [Google Scholar]
- Shi, D.; Zhang, C.; Zhou, B.; Yang, L. The Implementation Effect and Influencing Factors of Carbon Emissions Trading: A Review. Chin. J. Urban Environ. Stud. 2017, 04, 93–110. [Google Scholar]
- Zhu, C.; Fan, R.; Lin, J. The impact of renewable portfolio standard on retail electricity market: A system dynamics model of tripartite evolutionary game. Energy Policy 2020, 136, 111072. [Google Scholar] [CrossRef]
- Zhang, Y.; Zhang, J.; Yang, Z.; Li, J. Analysis of the distribution and evolution of energy supply and demand centers of gravity in China. Energy Policy 2012, 49, 695–706. [Google Scholar] [CrossRef]
- Zhou, Y.; Zhao, X.; Jia, X.; Wang, Z. Can the Renewable Portfolio Standards Improve Social Welfare in China’s Electricity Market. Energy Policy 2021, 152, 112242. [Google Scholar]
- Thombs, R.P.; Jorgenson, A.K. The political economy of renewable portfolio standards in the United States. Energy Res. Soc. Sci. 2020, 62, 101379. [Google Scholar] [CrossRef]
- Bao, X.; Zhao, W.; Wang, X.; Tan, Z. Impact of policy mix concerning renewable portfolio standards and emissions trading on electricity market. Renew. Energy 2019, 135, 761–774. [Google Scholar] [CrossRef]
- Li, C.; Kang, C.; Xia, Q. Generation rights trade and its mechanism. Autom. Electr. Power Syst. 2003, 27, 13–18. [Google Scholar]
- Wang, X.; Xiao, Y.; Wang, X. Study and Analysis on Supply-demand Interaction of Power Systems Under New Circumstances. Proc. CSEE 2014, 34, 5018–5028. [Google Scholar]
- Wang, H.; Chen, B.; Zhao, W.; Liao, K.; Bao, X. Optimal Decision-making of Trans-provincial Power Transaction Subjects Under Renewable Portfolio Standard. Power Syst. Technol. 2019, 43, 1987–1995. [Google Scholar]
- Zhao, W.; Zhang, J.; Li, R.; Zha, R. A transaction case analysis of the development of generation rights trading and existing shortages in China. Energy Policy 2021, 149, 112045. [Google Scholar] [CrossRef]
- Wang, Z.H.; Bao, H.; Zhang, F.; Ding, J.J. Optimization model of power generation right trading considering carbon trading income and network loss cost. Electr. Power Autom. Equip. 2023, 43, 23–29. [Google Scholar]
- Shen, Q.; Chen, Q.; Tang, B.-S.; Yeung, S.; Hu, Y.; Cheung, G. A system dynamics model for the sustainable land use planning and development. Habitat Int. 2009, 33, 15–25. [Google Scholar] [CrossRef]
- Sterman, J. Business Dynamics; McGraw-Hill, Inc.: New York, NY, USA, 2000. [Google Scholar]
- Forrester, J.W. System Dynamics and the Lessons of 35 Years. In A Systems-Based Approach to Policymaking; De Greene, K.B., Ed.; Springer: Boston, MA, USA, 1993; pp. 199–240. [Google Scholar]
- Zhang, L.; Chen, C.; Wang, Q.; Zhou, D. The impact of feed-in tariff reduction and renewable portfolio standard on the development of distributed photovoltaic generation in China. Energy 2021, 232, 120933. [Google Scholar] [CrossRef]
- Zhou, Y.; Zhao, X. The impact of Renewable Portfolio Standards on carbon emission trading under the background of China’s electricity marketization reform. Energy 2021, 226, 120322. [Google Scholar]
- Laurikka, H.; Koljonen, T. Emissions trading and investment decisions in the power sector—A case study in Finland. Energy Policy 2006, 34, 1063–1074. [Google Scholar] [CrossRef]
- Li. J.; Zhang, Y.; Wang, X.; Cai, S. Policy Implications for Carbon Trading Market Establishment in China in the 12th Five-Year Period. Adv. Clim. Chang. Res. 2012, 3, 163–173. [Google Scholar] [CrossRef]
- Yu, X.; Wu, Z.; Wang, Q.; Sang, X.; Zhou, D. Exploring the investment strategy of power enterprises under the nationwide carbon emissions trading mechanism: A scenario-based system dynamics approach. Energy Policy 2020, 140, 111409. [Google Scholar] [CrossRef]
- Meadows, D.H. Thinking in Systems: A Primer; Sustainability Institute: Lynedoch, South Africa, 2008. [Google Scholar]
- Sterman, J. Business Dynamics: Systems Thinking and Modeling for a Complex World; Massachusetts Institute of Technology, Engineering Systems Division: Cambridge, MA, USA, 2002. [Google Scholar]
- Wei, W.; Gao, H.; Zhu, J.; Xu, T.; Hao, H.; Li, Z. Evaluation on Sustainable Development Capability of Smart Distribution Network Based on System Dynamics. Proc. CSU-EPSA 2018, 30, 1–7+21. [Google Scholar]
- Yu, S.; Zhou, L.; Li, C. System dynamic model design for green certificate trading based on renewable portfolio standard. East China Electr. Power 2013, 41, 0281–0285. [Google Scholar]
- Dai, Y.; Zhao, P. A hybrid load forecasting model based on support vector machine with intelligent methods for feature selection and parameter optimization. Appl. Energy 2020, 279, 115332. [Google Scholar] [CrossRef]
- Yu, S.; Bi, P.; Yang, W.; Wang, Y.; Huang, Y. Dynamic Development System Dynamics of Renewable Energy Considering Renewable Energy Quota System. Proc. CSEE 2018, 38, 2599–2608+2828. [Google Scholar]
- Suo, C.; Li, Y.P.; Jin, S.W.; Liu, J.; Li, Y.F.; Feng, R.F. Identifying optimal clean-production pattern for energy systems under uncertainty through introducing carbon emission trading and green certificate schemes. J. Clean. Prod. 2017, 161, 299–316. [Google Scholar] [CrossRef]
- Zhang, J.; Zhou, X. Impact Analysis of Market-Driented Carbon Emission Reduction Policies in Power Generation Industry Based on System Dynamics. Electr. Power 2020, 06, 114–123. [Google Scholar]
- Wang, H.; Chen, Z.; Wu, X.; Nie, X. Can a carbon trading system promote the transformation of a low-carbon economy under the framework of the porter hypothesis?—Empirical analysis based on the PSM-DID method. Energy Policy 2019, 129, 930–938. [Google Scholar] [CrossRef]
- Jiang, J.; Xie, D.; Ye, B.; Shen, B.; Chen, Z. Research on China’s cap-and-trade carbon emission trading scheme: Overview and outlook. Appl. Energy 2016, 178, 902–917. [Google Scholar] [CrossRef]
- Zhang, L.; Li, Y.; Jia, Z. Impact of carbon allowance allocation on power industry in China’s carbon trading market: Computable general equilibrium based analysis. Appl. Energy 2018, 229, 814–827. [Google Scholar] [CrossRef]
- IEA. CO2 Emissions from Fuel Combustion, Paris, 2012. Available online: https://www.oecd-ilibrary.org/energy/co2-emissions-from-fuel-combustion-2012_co2_fuel-2012-en (accessed on 24 April 2022).
- Hasani-Marzooni, M.; Hosseini, S.H. Dynamic Interactions of TGC and Electricity Markets to Promote Wind Capacity Investment. IEEE Syst. J. 2012, 6, 46–57. [Google Scholar] [CrossRef]
- Barlas, Y. Formal aspects of model validity and validation in system dynamics. Syst. Dyn. Rev. 1996, 12, 183–210. [Google Scholar] [CrossRef]
- Musango, J.K.; Brent, A.C.; Amigun, B.; Pretorius, L.; Müller, H. Technology sustainability assessment of biodiesel development in South Africa: A system dynamics approach. Energy 2011, 36, 6922–6940. [Google Scholar] [CrossRef]
- Liu, J.; Niu, D.; Song, X. The energy supply and demand pattern of China: A review of evolution and sustainable development. Renew. Sustain. Energy Rev. 2013, 25, 220–228. [Google Scholar] [CrossRef]
- Raadal, H.L.; Dotzauer, E.; Hanssen, O.J.; Kildal, H.P. The interaction between Electricity Disclosure and Tradable Green Certificates. Energy Policy 2012, 42, 419–428. [Google Scholar] [CrossRef]


| Parameters | Unit | Value a |
|---|---|---|
| Initial TGC price | CNY/kW∙h | 0.22 |
| Initial ET price | CNY/t | 50 |
| Initial price of electricity | CNY/kW∙h | 0.38 |
| Initial demand of power | GW∙h | 4.6 × 10⁶ |
| Initial rate of electricity demand growth | % | 7 |
| Power elasticity of demand for price | - | −0.1 |
| Rate of RPS demand growth | % | 13 |
| Initial number of TGCs held by RES | - | 390 × 108 |
| Initial amount of ET held by sellers | t | 2.231 × 10⁸ |
| Long-run marginal cost of RES | CNY/kW∙h | 0.5 |
| Long-run marginal cost of fossil energy sources | CNY/kW∙h | 0.3 |
| Long-run marginal cost of hydropower sources | CNY/kW∙h | 0.4 |
| Initial capacity of RES | GW∙h | 48.64 |
| Initial capacity of fossil energy sources | GW∙h | 768.34 |
| Initial capacity of hydropower sources | GW∙h | 232.98 |
| GDP growth rate | % | 7 |
| Network losses | % | 10 |
| Carbon emission value per unit GDP | t/million CNY | 2.2 |
| Scenario | T0 | T1 | T2 | E0 | E1 | E2 |
|---|---|---|---|---|---|---|
| RPS proportion | 30% | 35% | 25% | - | - | - |
| Reduction rate of carbon emissions per unit GDP | - | - | - | 0.75% | 0.80% | 0.70% |
| Scenario | S0 | S1 | S2 | S3 | S4 |
|---|---|---|---|---|---|
| RPS proportion | 30% | 35% | 25% | 30% | 30% |
| Reduction rate of carbon emissions per unit GDP | 0.75% | 0.75% | 0.75% | 0.80% | 0.70% |
| Scenario | R0 | R1 | R2 | R3 | R4 | R5 |
|---|---|---|---|---|---|---|
| Hydropower and fossil energy | 0% | 1% | 2% | 0% | 0% | 1% |
| RES and fossil energy | 0% | 0% | 0% | 1% | 2% | 1% |
| Parameter | Value | Range |
|---|---|---|
| Generation rights trade between hydropower and fossil power | 0.001 | [0, 0.5] |
| Generation rights trade between RES and fossil power | 0.001 | [0, 0.5] |
| CO2 emission reduction per unit GDP | −0.75 | [−0.75, −0.95] |
| Year | RES Capacity | Hydropower Capacity | Fossil Energy Capacity | ||||||
|---|---|---|---|---|---|---|---|---|---|
| Simulation Value/ GW∙h | True Value a/ GW∙h | Error/ % | Simulation Value/ GW∙h | True Value a/ GW∙h | Error/ % | Simulation Value/GW∙h | True Value a/ GW∙h | Error/ % | |
| 2015 | 116.55 | 107.43 | 8.5 | 311.01 | 319.54 | −2.7 | 1002.71 | 1005.54 | −0.3 |
| 2016 | 213.1 | 223.78 | −4.8 | 340.02 | 332.07 | 2.4 | 1011.1 | 1060.94 | −4.7 |
| 2017 | 308.3 | 294.42 | 4.7 | 368.81 | 343.59 | 7.3 | 1020.73 | 1104.95 | −7.6 |
| 2018 | 390.95 | 358.85 | 8.9 | 373.41 | 352.59 | 5.9 | 1048.29 | 1144.08 | −8.4 |
| 2019 | 438.55 | 412.43 | 6.3 | 387.35 | 358.04 | 8.2 | 1095.1 | 1189.57 | −7.9 |
| Scenario | Independent Market | Combination Market | ||||||
|---|---|---|---|---|---|---|---|---|
| E0 | E1 | E2 | S0 | S1 | S2 | S3 | S4 | |
| ET price (CNY/t) | 213 | 215 | 176 | 249 | 203 | 266 | 181 | 179 |
| Scenario | S0 | S1 | S2 | S3 | S4 |
|---|---|---|---|---|---|
| Electricity sales prices (CNY/kW∙h) | 0.520 | 0.865 | 0.440 | 0.598 | 0.615 |
| Time Interval | Scenario | S0 | S1 | S2 | S3 | S4 |
|---|---|---|---|---|---|---|
| Short-term market (60 to 80 months) | Non-hydroelectric RES structure (%) | 32.21 | 32.21 | 32.21 | 32.22 | 31.78 |
| Hydropower structure (%) | 16.76 | 16.76 | 16.76 | 16.76 | 16.60 | |
| Fossil energy source structure (%) | 51.03 | 51.03 | 51.04 | 51.02 | 51.62 | |
| Mid-term market (120 to 140 months) | Non-hydroelectric RES structure (%) | 49.96 | 50.23 | 49.26 | 49.51 | 47.47 |
| Hydropower structure (%) | 15.11 | 15.03 | 15.15 | 14.98 | 14.90 | |
| Fossil energy source structure (%) | 34.93 | 34.74 | 35.5 | 35.50 | 37.64 | |
| Long-term market (220 to 240 months) | Non-hydroelectric RES structure (%) | 59.41 | 61.74 | 58.83 | 60.26 | 55.82 |
| Hydropower structure (%) | 14.03 | 13.73 | 14.24 | 14.22 | 13.74 | |
| Fossil energy source structure (%) | 25.56 | 20.53 | 26.93 | 25.52 | 30.44 |
| Scenario | R0 | R1 | R2 | R3 | R4 | R5 |
|---|---|---|---|---|---|---|
| TGC price (CNY/kW∙h) | 0.481 | 0.476 | 0.471 | 0.473 | 0.464 | 0.467 |
| ET price (CNY/t) | 284.35 | 186.96 | 139.07 | 182.70 | 171.70 | 152.66 |
| Electricity sales prices (CNY/kW∙h) | 0.527 | 0.604 | 0.670 | 0.561 | 0.609 | 0.648 |
Disclaimer/Publisher’s Note: The statements, opinions and data contained in all publications are solely those of the individual author(s) and contributor(s) and not of MDPI and/or the editor(s). MDPI and/or the editor(s) disclaim responsibility for any injury to people or property resulting from any ideas, methods, instructions or products referred to in the content. |
© 2024 by the authors. Licensee MDPI, Basel, Switzerland. This article is an open access article distributed under the terms and conditions of the Creative Commons Attribution (CC BY) license (https://creativecommons.org/licenses/by/4.0/).
Share and Cite
Zhao, W.; Lin, Y.; Pan, H. What Is the Effect of China’s Renewable Energy Market-Based Coupling Policy?—A System Dynamics Analysis Based on the Coupling of Electricity Market, Green Certificate Market and Carbon Market. Systems 2024, 12, 545. https://doi.org/10.3390/systems12120545
Zhao W, Lin Y, Pan H. What Is the Effect of China’s Renewable Energy Market-Based Coupling Policy?—A System Dynamics Analysis Based on the Coupling of Electricity Market, Green Certificate Market and Carbon Market. Systems. 2024; 12(12):545. https://doi.org/10.3390/systems12120545
Chicago/Turabian StyleZhao, Wenhui, Yanghui Lin, and Hua Pan. 2024. "What Is the Effect of China’s Renewable Energy Market-Based Coupling Policy?—A System Dynamics Analysis Based on the Coupling of Electricity Market, Green Certificate Market and Carbon Market" Systems 12, no. 12: 545. https://doi.org/10.3390/systems12120545
APA StyleZhao, W., Lin, Y., & Pan, H. (2024). What Is the Effect of China’s Renewable Energy Market-Based Coupling Policy?—A System Dynamics Analysis Based on the Coupling of Electricity Market, Green Certificate Market and Carbon Market. Systems, 12(12), 545. https://doi.org/10.3390/systems12120545