Article

Urban Ecological Economic Resilience in China: Spatio-Temporal Evolution, Influencing Factors, and Trend Prediction

1
College of Application Economics, Guizhou University of Finance and Economics, Guiyang 550025, China
2
Regional Economic High-Quality Development Research Provincial Innovation Team, Guizhou University of Finance and Economics, Guiyang 550025, China
3
Guizhou Collaborative Innovation Center of Green Finance and Ecological Environment Protection, Guiyang 550025, China
4
Management School, Lancaster University, Lancaster LA1 4YW, UK
5
Artificial Intelligence and Digital Finance Lab, Guizhou University of Finance and Economics, Guiyang 550025, China
*
Author to whom correspondence should be addressed.
These authors contributed equally to this work.
Systems 2024, 12(12), 525; https://doi.org/10.3390/systems12120525
Submission received: 7 October 2024 / Revised: 21 November 2024 / Accepted: 24 November 2024 / Published: 26 November 2024

Abstract

:
This article adopted exploratory spatio-temporal data analysis (ESTDA), geographic detector, and spatial Markov chain model to analyze the spatio-temporal evolution characteristics, main influencing factors, and future trend predictions of urban ecological economic resilience (EER). The results show that EER has been significantly enhanced, and high-level cities have a “rhombus” spatial distribution pattern. EER has a noticeable spatial agglomeration effect and the range of high–high agglomeration areas has gradually expanded. The LISA time path reflects that the spatial structure of EER is relatively stable, and urban units and neighboring cities show a more apparent synergistic growth trend. Social development, economic support, ecological restoration, and innovation and transformation strongly influence the development of EER, and the interaction between factors is more significant. In the future, EER will still tend to maintain the existing stable and unchanged state, and cross-grade leapfrogging development will not be achieved.

1. Introduction

China’s economy is shifting from a phase of rapid growth to a stage of high-quality development (HQD). However, the pursuit of economic growth alone or the one-sided emphasis on ecological environmental protection can no longer meet the needs of the current HQD. With the increasingly severe global environmental problems and the urgent need for sustainable development, the international community has begun to deeply understand the close connection between ecological environmental protection and socio-economic development. Consequently, countries gradually integrate ecological environmental protection into social and economic development and are committed to building a green and efficient ecological economy (EE) system. The United States has issued a series of bills, including the Bipartisan Infrastructure Law [1] and the Inflation Reduction Act, actively promoting a fair low-carbon transition across states. The European Union’s Green Deal requires that 37% of the funds from the Recovery and Resilience Facility be allocated to areas related to green transition. The United Kingdom has unveiled a comprehensive plan, Powering Up Britain, integrating energy security and net-zero growth plans to develop the EE [2]. Meanwhile, the report of the 20th National Congress of the Communist Party of China (CPC) emphasized that promoting green and low-carbon economic and social development is a crucial aspect of achieving HQD. The white book titled China’s Green Development in the New Era explicitly advocates for unwavering commitment to green and low-carbon development and accelerating the green transformation of development patterns. According to the Statistical Communiqué of the People’s Republic of China on the 2023 National Economic and Social Development, the proportion of high technology manufacturing industry in the value-added of all industrial enterprises above the designated size rose significantly between 2012 and 2023, from 9.4% to 15.7%, which reflects China’s positive progress in green transformation and HQD [3]. Additionally, the Blue Book on China’s Low Carbon Economy Development Report (2022–2023) also highlights that since 2012, China has supported an average annual economic growth of 6.6% with an average annual energy consumption growth rate of 3%, achieving a cumulative decrease in energy consumption per unit of GDP by 26.4% and a cumulative increase in major resource output rates by 58% [4]. China’s coordinated development of EE is gradually penetrating and integrating into the field of sustainable development, with theoretical and practical explorations continually expanding in depth and breadth.
Although EE is a pivotal force in promoting HQD, it also faces issues such as an unreasonable layout of territorial space development and protection, the coexistence of pressure on the secure supply of natural resources and the extensive utilization, and the apparent shortcomings of the environmental infrastructure in the process of its rapid development [5]. These problems stem from the inertia of emphasizing development over protection and the market inertia of prioritizing economics over the environment. This has led to an inadequate understanding of the strategic importance and fragile nature of the ecological environment, significantly hindering the pace of ecological civilization construction [6]. A series of important policies, such as the Regulations on Ecological Compensation Mechanism and the Blue Book on Ecological Governance, have proposed improving the quality and stability of EE systems. As the core element of the quality and stability of the EE system, EER is especially important in maximizing risk resistance and rapidly restoring the operation of the EE system when facing multiple pressures and uncertainties. Moreover, the role of EER in facilitating deep integration of EE among regions, strengthening resilient connections, and promoting high-quality development of EE has become increasingly prominent. Therefore, systematically assessing the spatio-temporal evolution patterns and influencing factors of EER in Chinese cities, as well as predicting its future development trends, serves as an important premise and foundation for formulating differentiated development policies that cater to the needs of EER in different types of regions, and for scientifically and reasonably advancing the HQD of China’s EE.
There is still vast room for exploration in current research on EER, particularly in its spatio-temporal evolution, influencing factors, and future trends. Research gaps persist in understanding the dynamic characteristics of its developmental evolution, especially regarding the spatial agglomeration patterns and development types of EER across different regions, as well as in-depth exploration of its spatial evolution patterns. Although preliminary explorations have been conducted in influencing factor analysis, further in-depth analysis and clarification are needed for the key factors that significantly drive the development of EER and their complex interaction mechanisms. Finally, there are still notable gaps and a lack of systematic forward-looking research in predicting future EER development trends. Therefore, this article will employ methods such as ESTDA, geographical detectors, and spatial Markov chains to explore the spatio-temporal evolution patterns of EER, clarify its external driving mechanisms, and further predict its future development trends. This research has academic value in filling theoretical gaps and provides practical guidance for formulating scientific and reasonable strategies for enhancing EER and promoting regional sustainable development.
This article consists of six sections. Section 1 is the introduction. Section 2 presents a literature review of the research. Section 3 deals with the construction of the indicator system and the design of research methods. Section 4 reports and analyzes the empirical results. Section 5 is the discussion. Section 6 summarizes the main conclusions, proposes policy recommendations, objectively analyzes the study’s limitations, and looks forward to future development directions. Figure 1 illustrates the research framework.

2. Literature Review

EE is a new economic theory proposed in the early 1960s to overcome contemporary society’s dilemmas. The core of the theory is to use the principles of ecological economics and systems engineering methods to transform production and consumption patterns within the ecosystem’s carrying capacity, explore the potential of all available resources, and finally realize a sustainable development economy [7]. Although China’s EE practices lag behind those of developed countries, its theoretical research on the EE has kept pace [8]. Current research on EE mainly focuses on three aspects: the definition of its connotation, the construction of evaluation indicators and measurement methods, and its influencing factors. In terms of research content, EE primarily focuses on the coupling and coordination of EE systems [9,10], analyzing the coordinated development relationships among ecological, economic, and social systems. Many studies have taken Chinese cities as the analysis object, measuring and analyzing the evolution of coupling coordination degrees within urban systems. Some studies have also targeted specific contiguous regions and urban agglomerations, such as the Beijing–Tianjin–Hebei region [11], the Yellow River basin [12], and the Yangtze River Economic Belt [13]. However, given the significant differences in natural environmental characteristics and economic development levels among different geographical regions, some scholars have adopted a more granular micro-perspective, taking individual prefecture-level cities as examples to quantitatively evaluate the EE development status of administrative regions such as Jilin province, which is a major grain-producing area [14]. Regarding the evaluation indicators construction and measurement methods at the EE development level, scholars have established it from four dimensions: ecological investment, ecological output, ecological environment, and ecological development benefits [15]. Other scholars have emphasized the direct and indirect effects of economic activities, using input variables, desired outputs, and undesired outputs as important indicators to measure regional EE [16]. Notably, with the rise of the marine economy, Jinli et al. [17] have incorporated marine resource consumption and regeneration into the ecological–economic evaluation indicator system to promote the long-term green and healthy development of marine industries such as mariculture. Existing studies have mainly used the entropy method, TOPSIS model, Super Slacks-Based Measure (SBM) model, and equidistant division method [15,18,19]. However, these methods fail to fully consider the qualitative differences among different materials, energies, and services, as well as the complexity of interactions between socio-economic systems and the natural environment. Therefore, Pan et al. [20] used the emergy analysis method based on energy and ecological thermodynamics principles to provide a deeper analysis of material flows and energy transfers, assessing the sustainability of EE systems. Some scholars have used the discrete particle swarm optimization model to analyze the EE benefits of forests [21]. Further, Jin et al. [22] used various models, including a fractional-order dynamic system for the co-evolution of wetland composite systems, to analyze the internal structural characteristics of wetland ecological–economic–social composite systems. Regarding research on the influencing factors of EE, Yuan et al. [23] identified key driving factors that affect the coordinated and dynamic development of industry and EE in the Yangtze River Economic Zone, revealing that the industrial ecosphere is a core factor influencing the development of EE. Furthermore, Li et al. [24] explored the impact of terrain, climate, landscape, and transportation on the coupling of ecological economics. The research results showed that terrain factors have the most significant impact on the development of EE coupling.
Resilience originated in physics and refers to the ability of an object to absorb energy during plastic deformation and rupture. Holling first introduced resilience into ecology in 1973 to characterize the stable structure and functioning within the ecosystem [25]. Subsequently, the study of resilience gradually shifted from natural ecology to social ecology, with resilience perspectives evolving from engineering resilience to ecological resilience and then to adaptive resilience [26,27,28]. The concept of resilience has been increasingly applied to many fields, especially in urban ecology and spatial economics, where it has become a research focus. Ecological resilience refers to the ability of urban ecosystems to prevent and respond to risk disturbances and to rebound and recover to their pre-disturbance state after being affected. Scholars have predominantly employed the core variable method to construct ecological resilience indicators from perspectives such as ecosystem services [29], sustainable development of the natural environment [30], and community disaster resilience [31]. However, a single-indicator approach falls short in fully capturing the complexity and diversity of ecosystems. On this basis, some scholars have shifted their research focus to the urban level, proposing an urban ecological resilience evaluation system based on target layers such as scale, density, and morphology [32]. This evaluation system places greater emphasis on the physical structure and spatial layout of urban ecosystems, assessing their ecological resilience by quantifying various urban characteristics. To evaluate urban ecological resilience more comprehensively, Tao et al. and Shi et al. [33,34], starting from the essential characteristics of resilience, constructed a multi-dimensional urban ecological resilience evaluation system encompassing resistance, adaptability, recoverability, sensitivity, and adaptive capacity. Additionally, research on the dynamic evolution of regional ecological resilience continues to deepen, with methodologies expanding to include adaptive cycle models, system simulations, and scenario modeling [35]. Furthermore, scholars have conducted in-depth analyses of the factors influencing urban ecological resilience from the perspectives of the natural environment [36] and social activities [37]. Economic resilience is the ability of the economy to withstand external uncertainty shocks and achieve economic recovery and sustainable development. In current methods for measuring economic resilience, some scholars tend to directly use indicators such as GDP growth rate, employment structure, or unemployment rate [38,39], while others measure economic resilience by examining the gap between actual and expected changes in regional output or unemployment rate [40]. However, these two methods result in relatively high economic resilience values without shocks and relatively low values with shocks. Given the limitations of the aforementioned methods, scholars have explored more comprehensive and systematic evaluation index systems to measure economic resilience. For example, Martin [41] constructed a comprehensive economic resilience measurement framework that includes four dimensions: vulnerability, resistance, stability, and recovery. Additionally, studies have combined economic resilience with theories in regional economics to examine the evolutionary characteristics and driving factors of regional and urban economic resilience [42,43], and there are also studies focusing on the critical role of economic resilience in promoting coordinated regional development [44]. Compared with studying a single ecosystem or economic system, the complexity of socio-economic–natural complex ecosystems is more prominent. When this comprehensive system encounters external shocks, it can also maintain the overall system stability and continue to function through its internal resistance and self-repair mechanisms, known as ecological economic resilience. The resilience perspective provides an important instrument for analyzing the sustainable development status of EE, but few scholars have systematically explored the intrinsic resilience of EE. Therefore, how to comprehensively and effectively measure EER in China has become an important issue. The academic community has not reached a consensus on the definition of the concept of EER, and there are also differences in its measurement indicators. Most scholars conduct evaluations of EER from the perspectives of economy and society, infrastructure, and ecological environment [11]. Existing research primarily uses the core variable and comprehensive indicator system methods to measure EER [45,46]. Regarding strategies for enhancing EER, Gao et al. [47] found a decline in the process and outcome performance of marine EE system governance and proposed suggestions for promoting resilience management and resilience performance evaluation. Kitchen and Marsden [48] derived a sustainable rural development model by stimulating the EE through a case study in Wales. Meanwhile, Li et al. [49] also conducted assessments and tracking of the sustainability of circular economy eco-cities, exploring ways to enhance urban sustainable development capabilities through practice.
In summary, current research on EER primarily focuses on its conceptual definition and theoretical framework, measurement methods, and enhancement strategies. However, considerable space remains for exploring the spatial-temporal evolution patterns and influencing factors of EER. Existing comprehensive indicator systems mostly emphasize static assessments of urban EER, leaving gaps in considering its dynamic phases, such as adaptation and recovery. They fail to view the evolution of urban EER as a continuous and dynamic process. Additionally, due to significant differences in resource conditions and geographical features among different regions, exploring the spatial interconnections and interaction mechanisms of EER becomes particularly important. Compared to traditional panel data analysis or spatial cross-sectional analysis, ESTDA effectively integrates time and space [50], emphasizing the dynamic evolution of the spatio-temporal geographical characteristics of EER. In influencing factor analysis, econometric regression and spatial econometric models are widely applied. However, based on linear or non-linear assumptions and susceptible to multicollinearity issues, they struggle to fully reveal the spatial heterogeneity among factors. In contrast, the geographical detector incorporates geospatial analysis, effectively avoiding the impact of multicollinearity while examining the combined effects of dual factors on the dependent variable. It is worth noting that there are still relatively few predictive studies on the evolution trends of EER, and many predictive models focus solely on the impacts of time-varying driving factors. The spatial Markov chain, however, can deeply analyze the internal evolution patterns of panel data in the context of time and space and make scientific and reasonable predictions about their long-term evolution trends. It is an effective tool for revealing the patterns and processes of changes in the composition of convergence clubs [51]. Based on this, this article uses the entropy method to construct a multi-indicator evaluation system at the municipal level to measure China’s EER from 2006 to 2021. It employs ESTDA to explore the spatio-temporal evolution of EER, uses the geographical detector to analyze the direction and intensity of the effects of major influencing factors on EER, and applies the spatial Markov chain to predict the future development trends of EER. The aim is to provide a scientific basis for enhancing EER and promoting high-quality development in China.

3. Data and Methodology
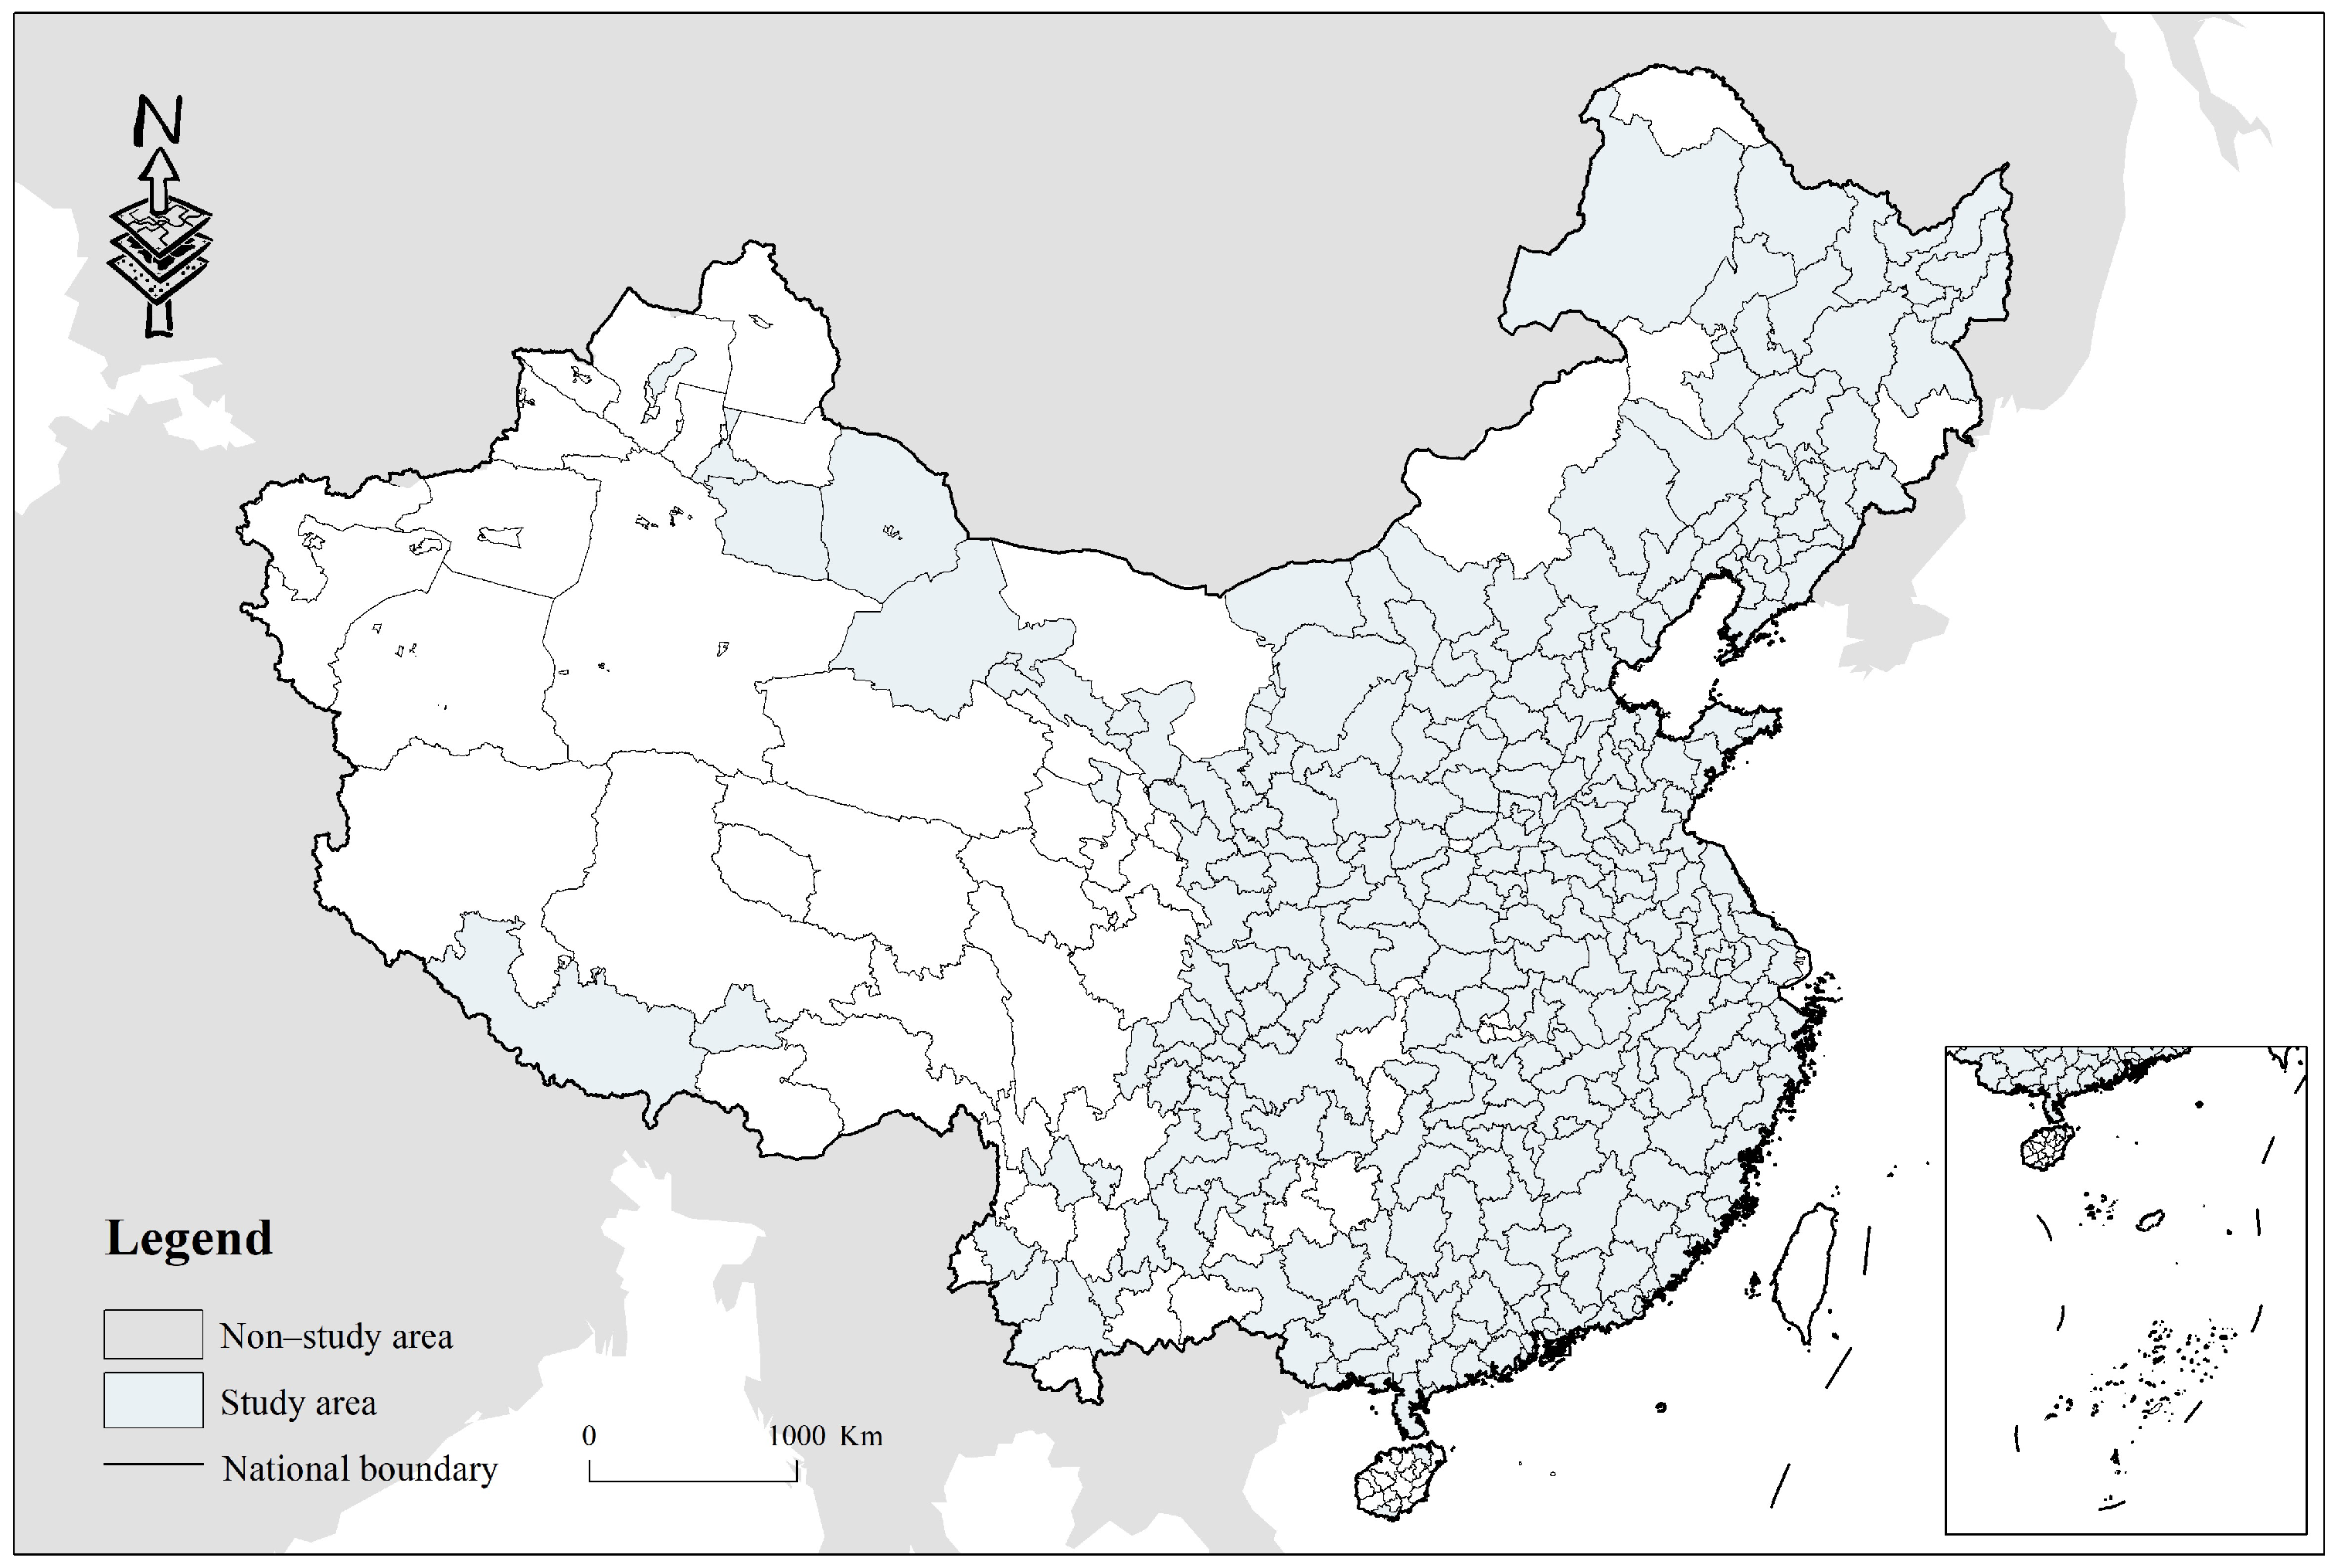
3.1. Study Area

Based on the availability and accuracy of EER indicators at the municipal level, this article excludes cities with missing data and identifies 290 cities in China, including 4 municipalities directly under the central government (Beijing and other areas), 18 sub-provincial cities (Shenyang and other areas), and 268 prefecture cities (Shijiazhuang and other areas). The study time points of 2006, 2011, 2016, and 2021 were chosen because they are fixed time intervals that allow for better analysis of long-term trends and cyclical changes (Figure 2).

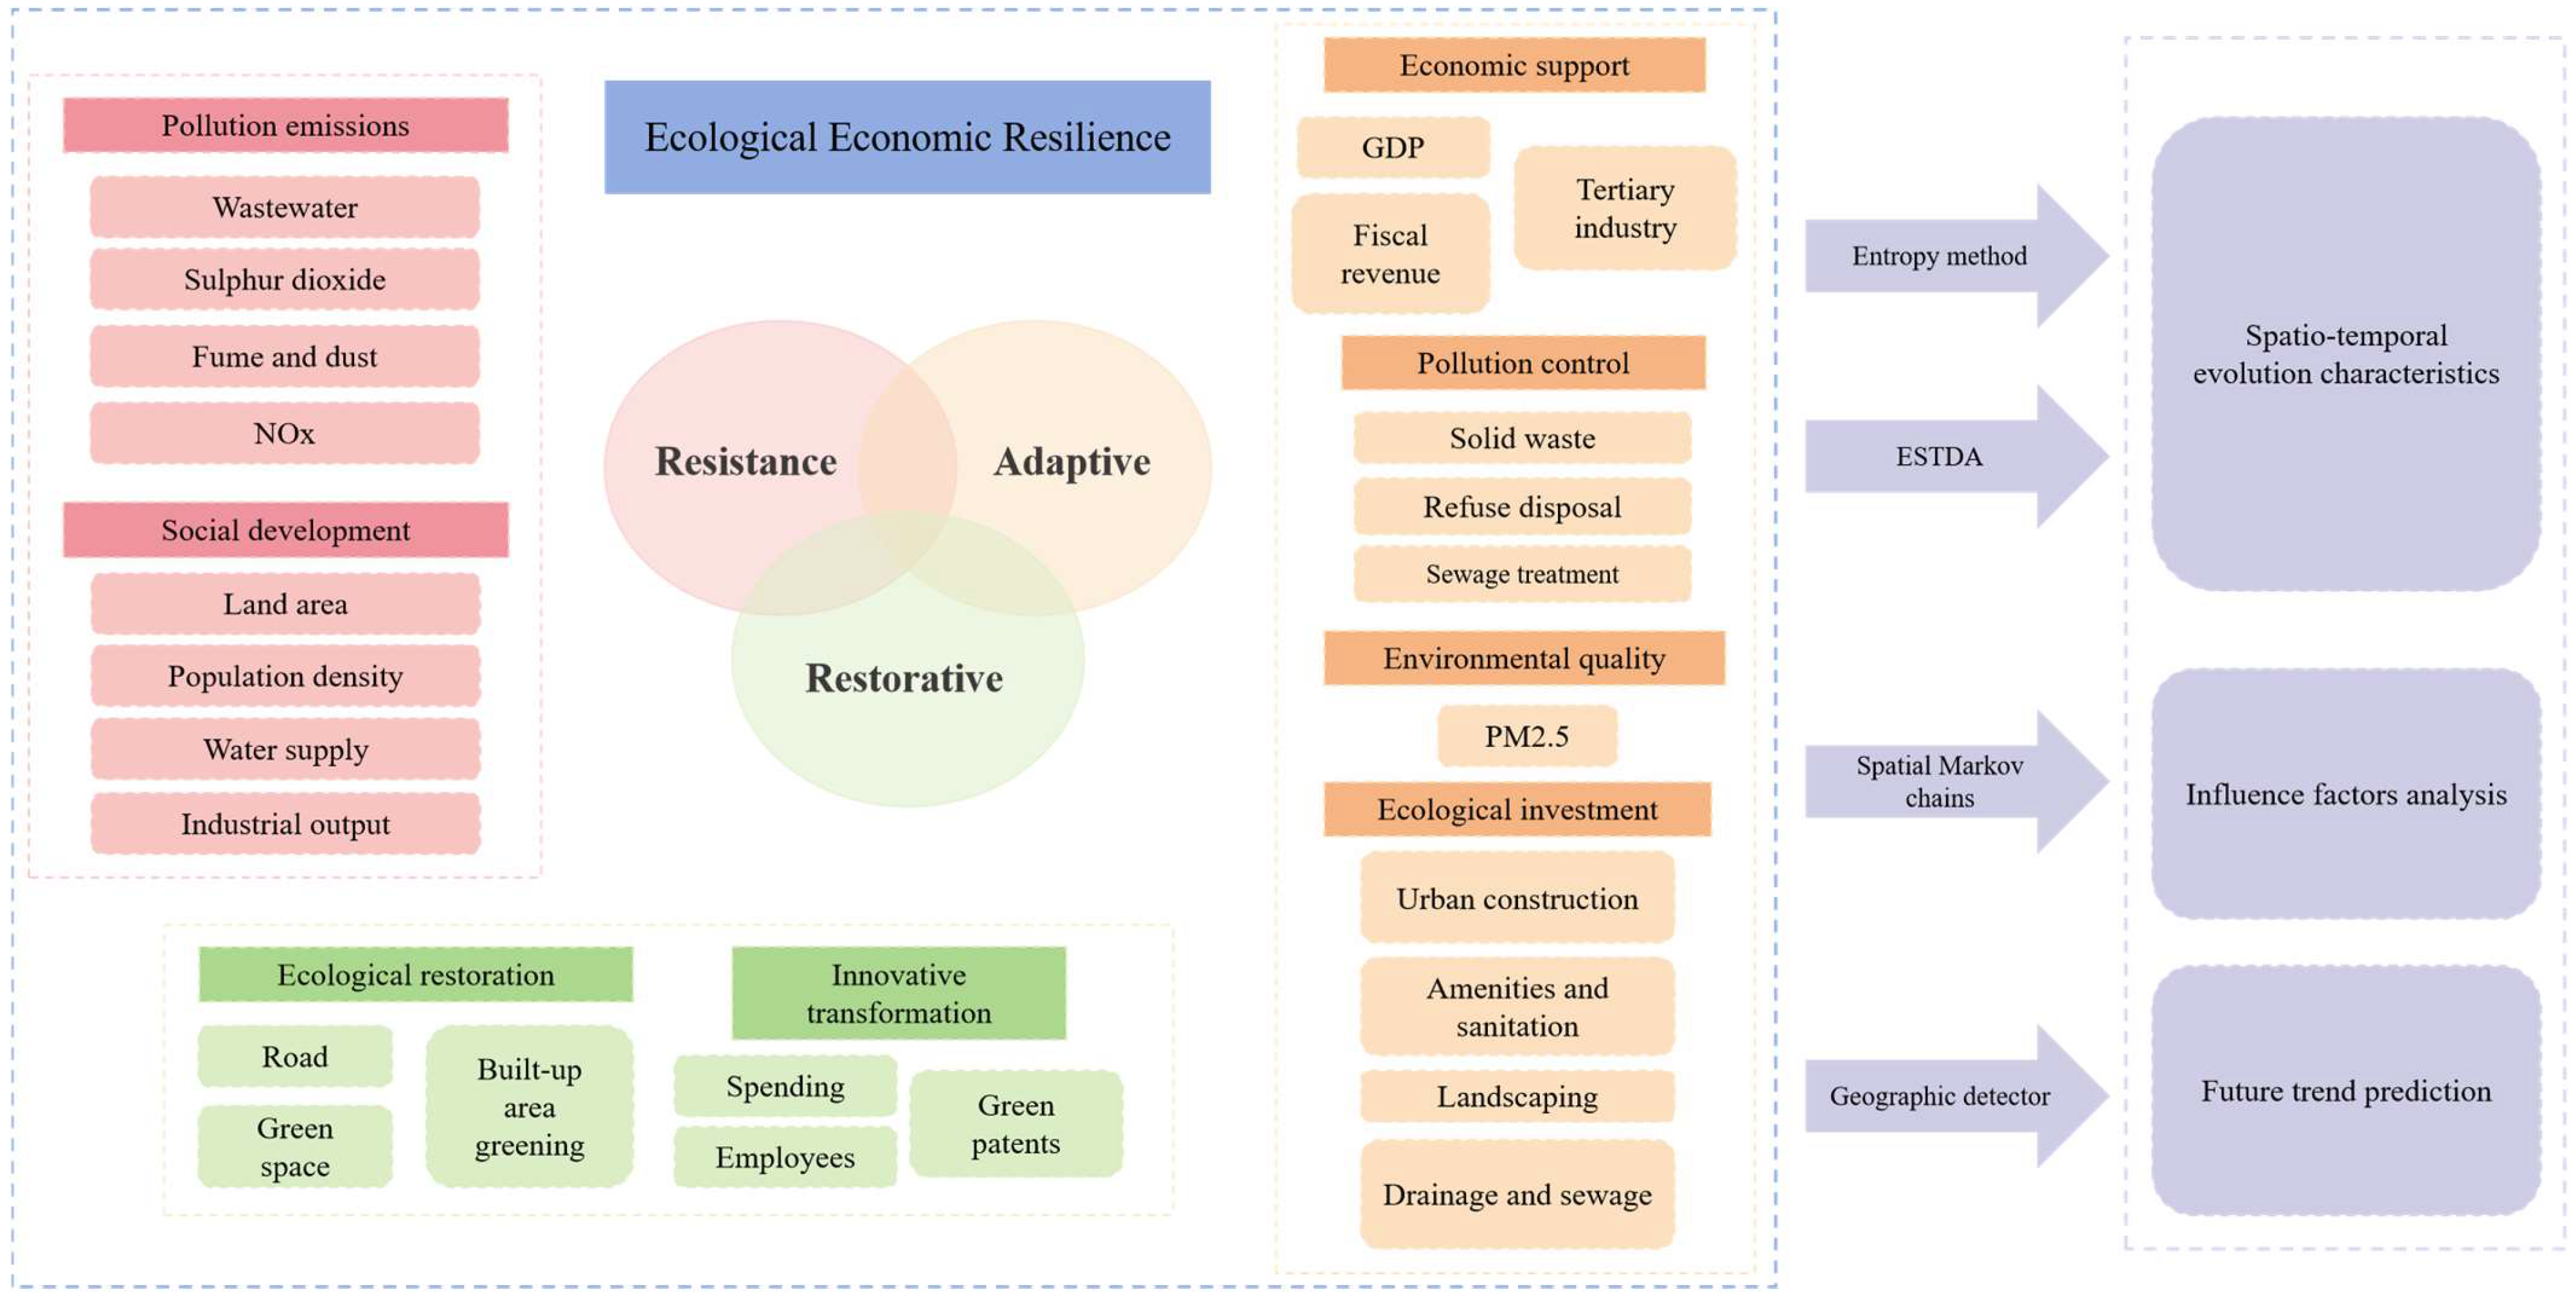
3.2. Indicator System Construction

EER emphasizes that the EE system is dynamic in response to endogenous and exogenous disturbances, adapting to shocks and disturbances by adjusting its structure and state, quickly returning to a stable state and continuing to perform its functions. Based on different stages of disturbance, this article proposes three capabilities of EER: resistance capacity, adaptive capacity, and restorative capacity. The resistance capacity relies on the pre-existing conditions of the system, which manifests as the ability of the urban EE system to withstand disturbances and maintain a stable structure. It mainly includes pollution emissions and social development [52]. The adaptive capacity focuses on the ability of the EE system to self-adjust and adapt in the face of change. The adaptive capacity mainly includes four aspects: economic support, air quality, pollution control, and ecological investment [53]. The restorative capacity performance is a more rapid response to interference, enabling it to return to a balanced state or generate a new balance, which mainly includes ecological restoration and innovation and transformation [54]. Based on this, this article constructs an urban EER index system, measures it using 25 evaluation indicators, and refers to Huang et al.’s [55] entropy method to calculate EER (Table 1).

3.3. Data Sources

This article took 290 cities and 16 years in China as research objects; the relevant data were obtained from the China Urban Statistical Yearbook, China Urban Construction Statistical Yearbook, and the National Economic and Social Development Statistical Bulletin of the relevant cities in the past years. The data on PM2.5 were obtained from the Atmospheric Composition Analysis Group. The data were analyzed and preprocessed, considering their authenticity, completeness, and availability. Missing values were assigned using linear interpolation and trend extrapolation, and outliers were removed and supplemented after targeted analysis in the context of the actual situation.

3.4. Research Methodology

3.4.1. Entropy Method

In order to reflect the original information of the indicators scientifically and accurately, the entropy method is used to assign weights to the corresponding indicators to measure the information volume of each indicator and better evaluate urban EER.
x i j = x i j m i n ( x i j ) ma x x i j m i n ( x i j )
x i j = m a x ( x i j ) x i j ma x x i j m i n ( x i j )
p i j = x i j i = 1 n x i j ( 0 p i j 1 )
e j = k i = 1 n p i j . l n p i j ( k > 0 , k = 1 l n n , e j 0 )
w j = 1 e j j = 1 m ( 1 e j )
s i = j = 1 m w j x i j
First, the initial data are standardized to eliminate the effect of different indicator scales. Xij (i = 1, 2, …, n; j = 1, 2, …, m) represents the value of the j indicator in region i, max(xij) and min(xij) are the maximum and minimum values of the j indicator in region i. xij is the value after standardization. The positive indicators in the indicator system are calculated by Equation (1), and the negative indicators are calculated by Equation (2). Next, the entropy value, ej, is calculated. The weight of the j indicator in the i region is calculated according to Equation (3), and then the entropy value of the j indicator, ej, is calculated according to Equation (4). Finally, the weight of the indicators, Wj, is calculated by Equation (5), and EER is calculated by the linear weighting method.

3.4.2. Exploratory Spatio-Temporal Data Analysis (ESTDA)

ESTDA effectively integrates the temporal and spatial dimensions based on the traditional exploratory spatial analysis (ESDA), realizing the analysis of temporal and spatial interactions and linkages. This article uses ESTDA to characterize the spatio-temporal structure of urban EER further.
Global spatial autocorrelation and local spatial autocorrelation studies are applied to analyze the degree of spatial agglomeration of EER. The global spatial autocorrelation is calculated in Equation (7). The local Moran analysis identifies the aggregation centers by LISA statistic, and the calculation is shown in Equation (8).
M o r a n I = i = 1 n j = 1 n w i j ( D i D ¯ ) ( D j D ¯ ) x 2 i = 1 n j = 1 n w i j
I = ( D i D ¯ ) i = 1 n j = 1 n w i j ( D j D ¯ ) x 2
D ¯ = 1 n j = 1 n D j
x 2 = 1 n j = 1 n ( D i D ¯ ) 2
where w i j is the spatial weight matrix, and D i and D j is EER of neighboring cities.
LISA time paths are used to characterize further the spatio-temporal dynamic evolution of each spatial unit within the local Moran’s I scatter plot of urban EER, whose geometric features include path length, curvature, and transition direction.
l i = N t = 1 T 1 d ( L i , t , L i , t + 1 ) i = 1 N t = 1 T 1 d ( L i , t , L i , t + 1 )
φ i = t = 1 T 1 d ( L i , t , L i , t + 1 ) d ( L i , t , L i , t + 1 )
θ i = a r c t a n j s i n θ j j c o s θ j
Here, l i is the relative length, φ i is the curvature, and θ i is the transition direction. N denotes the number of research units, T denotes the time interval of the research period, L i , t is the position of research unit i in Moran’s I scatter plot for year t, and d ( L i , t , L i , t + 1 ) is the moving distance of research unit i from year t to year t+1.

3.4.3. Spatial Markov Chains

This article uses Markov chains to reflect the transfer state characteristics and probabilities of urban EER. Construct an n × n order probability transfer matrix (Equation (16)), and the element Pij in the matrix denotes the probability that state i at time t is transferred to state j at time t+1 (Equation (15)). Assume that the random variable Mt = j(t∈T), which indicates that the state of the system at time t is j. At the same time, the system state has a finite number of values. The Markov chain (Equation (14)) shows that the probability that the random variable M is in state j at time t+1 depends only on its state at time t. nij is the number of provinces in which state i at time t is transferred to state j at time t+1 during the study period. ni is the total number of cities of type i.
p = M t + 1 = j | M o = i , M 1 = i 1 , , M t = i t = M t + 1 | M t = i = P i j
P i j = n i j n i
p = P 11 P 1 k P k 1 P k k
Spatial Markov chain is based on the traditional Markov chain to introduce the “spatial lag” condition, the spatial weighted average of the attribute values of the observed city neighborhood as the spatial lag value, to analyze the state transfer trend of the sample under the action of spatial factors. The formula is as follows:
L a g a = b = 1 n Y b W a b
where Y b is the coupling coordination degree of the city. The spatial weight matrix W a b is determined by the adjacency principle; if city a and city b are neighboring, W a b = 1, otherwise W a b  = 0.

3.4.4. Geographic Detector

Geographic detectors are statistical methods for detecting spatial variability and revealing the driving forces behind it. They can detect both numerical and qualitative data and the role of two-factor interaction on the dependent variable. At the same time, there is no linear assumption on the variables, and statistical accuracy is better than other models, so they are widely used in the correlation analysis of influencing factors. Geographic detector models mainly include factor detectors, risk detectors, ecological detectors, and interaction detectors.
Factor detection is used to detect the explanatory power of influencing factors on EER and to identify its influence. It is mainly measured by the q-value, which is taken in the range of [0, 1], and the larger the q-value is, the stronger the explanatory power of the factor on the spatial differentiation of EER; the formula is as follows:
q = 1 h = 1 L N h σ h 2 N σ 2 = 1 S S W S S T
In Equation (16), q is the dissimilarity factor, and the larger q is, the more spatially distinct the data dissimilarity is. L is the categorization of the explanatory factor or the explanatory factor. h = 1, 2, …, is a specific type. Nh and N denote the number of h-category and the number of whole-area cells, respectively. σh and σ are the variance of the h-category and the variance of whole-area cells, respectively.
Interaction detection is used to evaluate whether factors acting together increase or decrease the explanatory power of EER or play an independent role. The type of influence is mainly identified by comparing the magnitude of the q-value, with the more extensive the value, the stronger the explanatory power, as shown in Table 2.

4. Analysis and Results

4.1. Spatio-Temporal Evolution Characteristics

It divides EER by natural breaks method into lower-level zone [0.004234, 0.026543], low-level zone (0.026544, 0.054586], medium-level zone (0.054587, 0.142813], high-level zone (0.142814, 0.252279], and higher-level zone (0.252279, 0.713370]. As can be seen from Figure 3, the number of cities at the lower level shows a decreasing trend from 2006 to 2021, while the number of cities at the low level, medium level, high level, and higher level shows an increasing trend. Overall, EER is dominated by lower and low levels, with fewer high and higher levels. From 2006 to 2021, EER increased by leaps and bounds, with the average value increasing from 0.0283 to 0.0577, an overall growth of 103.8%. This remarkable increase trend reflects the strong resistance, coping, response, and self-repairing ability of EE in China in dealing with external influences and fluctuations, indicating its strong development momentum and profound growth potential. However, it is worth noting that the extreme difference in EER has risen from 0.4620 to 0.7017, which implies that the regional differences are widening. The phenomenon of unbalanced development among regions is becoming more and more apparent.
This article used ArcGIS10.7 to spatially visualize EER in 2006, 2011, 2016, and 2021, as shown in Figure 4.
In 2006, the cities with higher-level EER were Shanghai and Guangzhou, while the higher-level regions were mainly distributed in the eastern coastal cities of Beijing, Nanjing, Shenzhen, and Dongguan. The medium-level regions are concentrated mainly in 20 cities, including Tianjin, Harbin, Mudanjiang, Jilin, Shenyang, Dalian, Jinan, Suzhou, Hangzhou, Ma’anshan, Ningbo, and Foshan in the eastern region, and Chengdu, Chongqing, Kunming, Liuzhou, Wuhan, Ezhou, Changsha, and Xiangtan in the southwestern region. Low-level cities were primarily located in provinces such as Heilongjiang, Inner Mongolia, Fujian, Zhejiang, Gansu, Guizhou, and Guangxi. High-level cities were concentrated in the eastern coastal areas and southwestern areas. This is because the eastern cities, relying on their location advantages, have taken the lead in promoting energy conservation, emission reduction, and industrial restructuring and have implemented the New Deal for Environmental Protection and the Green GDP assessment. With its natural ecological advantages, the southwestern region demonstrated immense potential for EE development. This spatial distribution pattern reflects the exploration and experimentation in China’s early stage of EE development.
In 2011, the number of cities with higher levels of EER increased. Beijing rose from the high to the higher level, showing an “isosceles triangle” spatial pattern distribution with Shanghai and Guangzhou. These areas have a better economic foundation, sound industrial base, apparent policy advantages, and innovation agglomeration effect, making them the leading regions in terms of EER. Chongqing rose from the medium to the high level due to the accelerated development of EE in the municipality, which became one of the first pilot regions for low-carbon cities in 2010. Additionally, there was a notable increase in medium-level cities and a growing number of lower-level cities, reflecting that the resilience of the better-developed cities in each province has been further enhanced as they actively engage in EE development. The declining trend in the number of lower-level cities indicates that the overall level of EER is gradually improving and that lower-level cities are gradually improving their EE situation.
In 2016, EER steadily improved, with a continuous increase in the number of high-level and higher-level regions. Shenzhen, as an advanced demonstration zone of socialism with Chinese characteristics, achieved remarkable results in building its EE, leaping from the high to the higher level. Hangzhou, Suzhou, and Chengdu have made the leap from medium to high levels by increasing eco-environmental investment and promoting the development of green industries. Meanwhile, the number of medium-level and low-level regions rose from 20 and 43 in 2006 to 32 and 72 in 2016, mainly in the east–central region. The number of lower-level regions declined from 221 to 174. This was because the thirteenth Five-Year Plan integrated green development into all areas and aspects of economic and social development. Regions fully utilized their resource endowments and policy advantages to promote EE development, significantly enhancing EER.
In 2021, EER demonstrated a marked enhancement, with Tianjin, Suzhou, Nanjing, Hangzhou, Wuhan, Dongguan, Chengdu, and Chongqing having risen to higher-level regions. The connection between these cities and the four cities of Beijing, Shanghai, Guangzhou, and Shenzhen shows a typical spatial distribution pattern of the “rhombus”. Among them, Wuhan stands as the sole higher-level city in the central region, realizing the transcendence from “following” to “leading”. Ten cities, including Xi’an, Hefei, Wuxi, Zhengzhou, Ningbo, Qingdao, Changsha, Jinan, Shenyang, and Foshan, were upgraded from the medium to the high level. Most higher-level regions, except Beijing, Tianjin, and Guangdong, are located in the Yangtze River Economic Belt, where the green development index has steadily risen. Notably, the eastern region has demonstrated strong advantages in terms of green growth and carrying capacity, benefiting from its clear regional ecological and economic development strategies, removing obstacles in dual circulation, and the formation of a powerful synergy for the coordinated development of ecology and economy. The Western region has made remarkable progress in ecological and environmental protection and rational resource utilization, and its green security force is particularly outstanding, laying a solid foundation for the region’s sustainable development. Meanwhile, EER in the central region has experienced a rapid increase. The region serves as a link between the East and West and connects the South and North, so it has obvious geographical advantages in the development of EE. Overall, EER is still dominated by low- and lower-level areas, mainly distributed in the northeastern, northwestern, and southwestern regions, mostly economically underdeveloped. The industrial structure of the northeastern region is dominated by heavy and chemical industries, with a disproportionately large share of energy-heavy industries, and structural change and kinetic energy transformation are relatively tricky, inhibiting EE development of the region.

4.2. Exploratory Spatio-Temporal Data Analysis

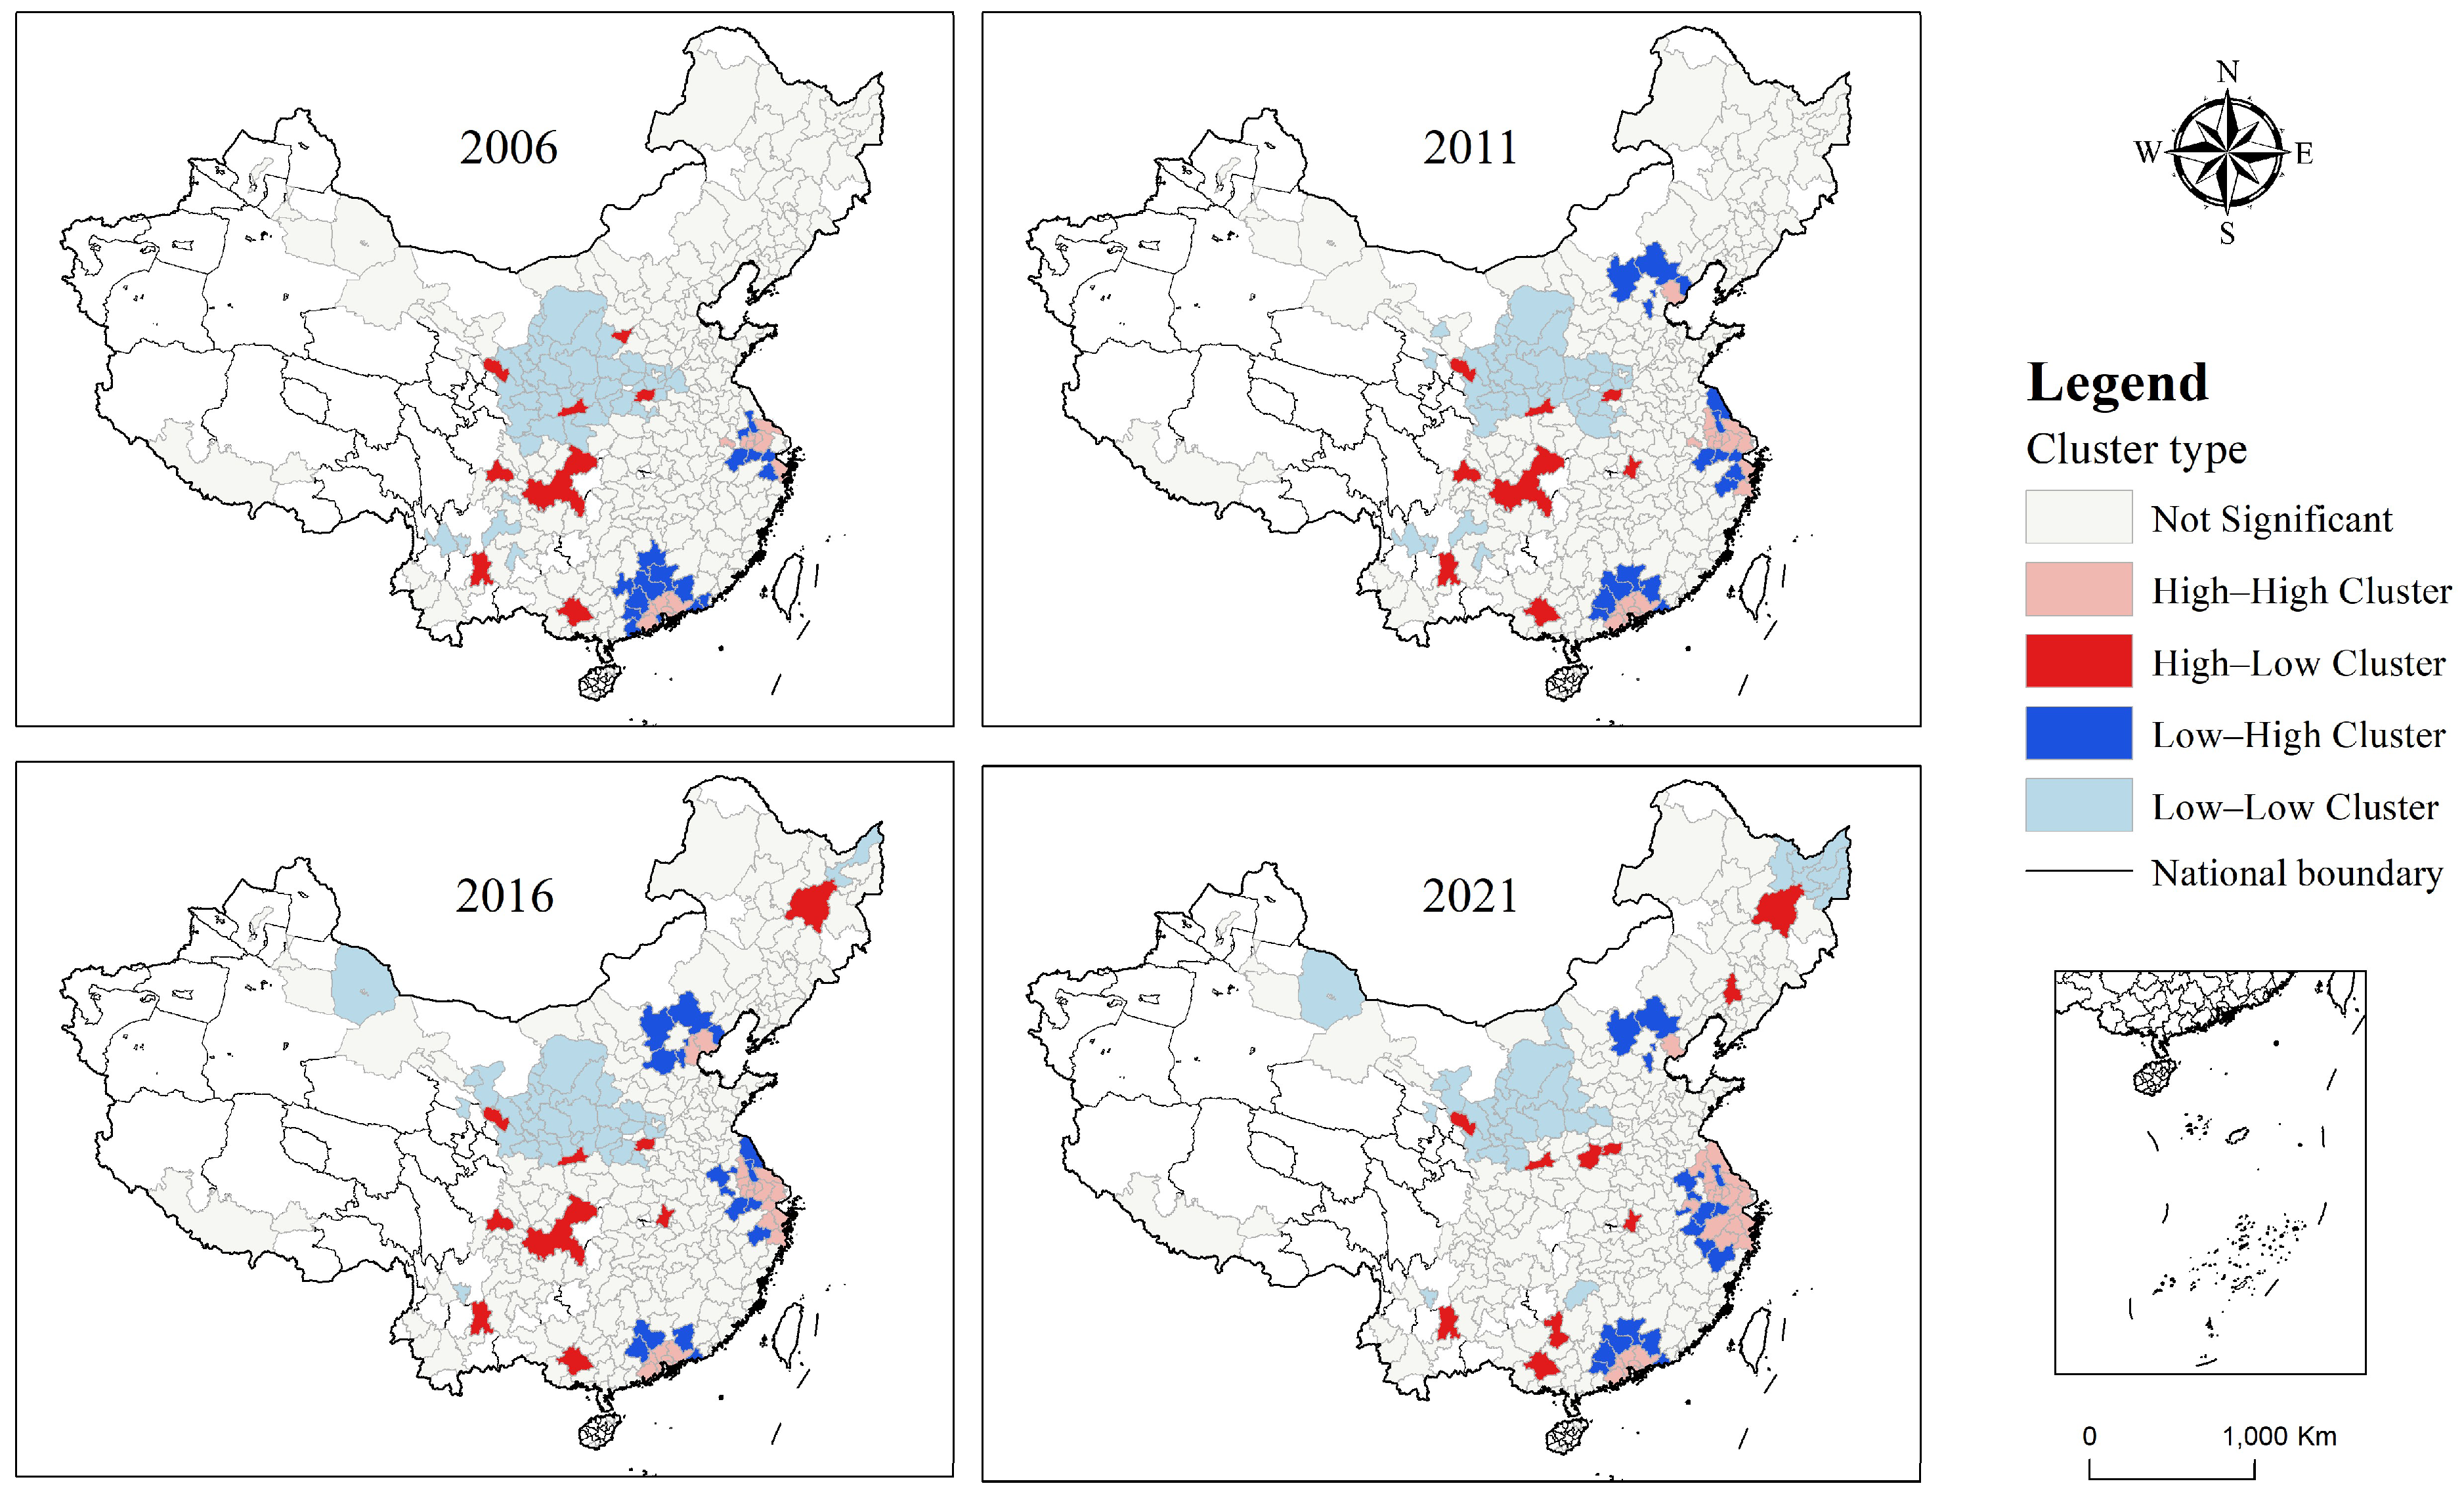
4.2.1. Spatial Correlation Analysis

Global autocorrelation analysis using ArcGIS 10.7 was conducted to obtain the global Moran’s I of urban EER (Table 3). The global Moran’s I values of EER were positive during the study period, and they all passed the significance test, indicating that there is a significant spatial positive correlation of urban EER, which exhibits a spatial clustering effect.
The LISA agglomeration map of EER (Figure 5) further reveals its spatial agglomeration and evolutionary characteristics.
From Figure 5, it can be seen that there is an apparent spatial agglomeration relationship of EER, which is mainly manifested in the high-value agglomerations in the east and the low-value agglomerations in the west. From 2006 to 2021, the eastern coast cities were stably located in the high–high agglomerations, with slight changes in spatial patterns. The number of high–high agglomerations rose, and the range of agglomerations gradually expanded. The Beijing–Tianjin–Hebei region, the Yangtze River Delta region, and the Pearl River Delta region evolved from non-significant and low–high agglomeration to high–high agglomeration, indicating that the high-value EER cities in the eastern coastal region have a radiation-driven effect on the surrounding areas, with more significant radiation and leading role in the north–south direction. Low–low agglomeration areas were mainly concentrated in western regions such as Gansu, Ningxia, and Shaanxi, but the number of cities in the agglomeration areas gradually decreased, and the scope of these areas shifted upwards. This is because the exceptional geographic environment and human factors are not conducive to EER development in the region, resulting in the persistence of the Matthew effect. Among them, the range of low–low agglomeration areas in Heilongjiang Province has significantly expanded, which may be caused by economic deceleration and population outflow from this region. Nevertheless, it is worth noting that Chengdu, Chongqing, Kunming, Nanning, Xi’an, Lanzhou, Zhengzhou, Taiyuan, Harbin, and Wuhan belong to the high–low agglomeration area, which is because these cities are mainly located in provincial capitals and economically faster-developing core areas. Their EER development shows a continuous and rapid growth trend, with development speeds significantly higher than those of surrounding areas, giving them strong development potential and competitive advantages.

4.2.2. LISA Time Path Characterization

To identify the contribution of each city unit to the global correlation, this article explores the spatio-temporal dynamic characteristics of urban EER by calculating the relative length, curvature, and transition direction of the LISA time paths. The relative length and curvature of EER are divided into four levels using ArcGIS. The Geoda is used to analyze the coordinate changes of the local Moran’s I scatter plot. The transition direction is divided into four categories: the 0~90° direction indicates the high-speed growth of EER of neighboring cities, the 180~270° direction is the low-speed growth, and the 90~180° and 270~360° directions indicate EER of neighboring cities in the reverse migration. The results are shown in Figure 6.
The relative length of the LISA time path reflects the dynamism of the local spatial structure of EER, with a mean value of 1.000. There are 70 city units with relative length values greater than the mean, accounting for 24.1% of the total sample size, which indicates that the spatial structure of EER within the study area is relatively stable. There are 16 city units with high and higher relative lengths, accounting for 5.5% of the total. These cities exhibit dynamic local spatial structures in EER. In particular, the relative lengths of Jixi, Jincheng, Zhangjiajie, and Shenyang are more extensive, which indicates that the EER development of these cities has shown a trend of slowing down first and then speeding up, resulting in relatively significant dynamic changes in EER. There are 274 city units with low or lower relative lengths, accounting for 94.5% of the total sample size. Among them, Jining, Ji’an, Yunfu, and Fuyang have smaller relative lengths, and the spatial pattern of EER in these cities is relatively stable.
The LISA time path curvature measures the volatility of the local spatial structure of EER in the direction of dependence, with a mean value of 40.000. During the study period, the curvature of all cities was greater than 1, and the moving paths showed nonlinear changes, indicating that urban EER has migration and transformation characteristics and that there is volatility in the direction of dependency within the local spatial structure. Among them, the cities with more significant curvature are Zhangjiakou, Yulin, and Zhangye, indicating that these cities are subject to the spatial role of the neighboring region. They have a more significant spatial dependence fluctuation and more robust dynamic change processes with the neighboring region. There are 273 city units with low and lower curvature, accounting for 94.1% of the total sample size, indicating that the EER of each city exhibits weaker volatility in the direction of local spatial dependence and spatial growth process. Meanwhile, it can be seen that the EER of each city is influenced by the spillover effect of the neighboring cities to a lesser extent. Overall, the distribution of low curvature in the LISA time path is widespread and accounts for a large proportion, indicating that the spatial pattern of eco-economic resilience is relatively stable and less affected by the spillover or siphon effects of neighboring cities.
The LISA time path transition direction is used to show the spatial integration characteristics of the local spatial pattern of EER. There were 144 cities with a transition direction in the LISA time path, indicating synergistic growth, accounting for 49.7% of the total. This indicates that urban EER spatial pattern evolution has a robust spatial integration, with city units and neighboring cities showing a pronounced trend of overall high or low growth in EER. Among them, there are 64 cities with synergistic high-speed growth, accounting for 44.4% of the synergistic growth of urban units. However, it is worth noting that the synergistic high-speed growth cities have not yet formed a large-scale agglomeration, and some cities have not formed a sound synergistic growth situation with neighboring cities, and synergistic high-speed growth is mainly distributed in the northeast and west of these cities with a lower level of regional economic development. There are 80 cities with synergistic low-speed growth, accounting for 55.6% of the cities with synergistic growth, represented by Beijing, Tianjin, and Shanghai. Although these areas have a relatively high level of EER, the driving effect on the neighboring cities is not apparent, and the regional imbalance of the problem is prominent.

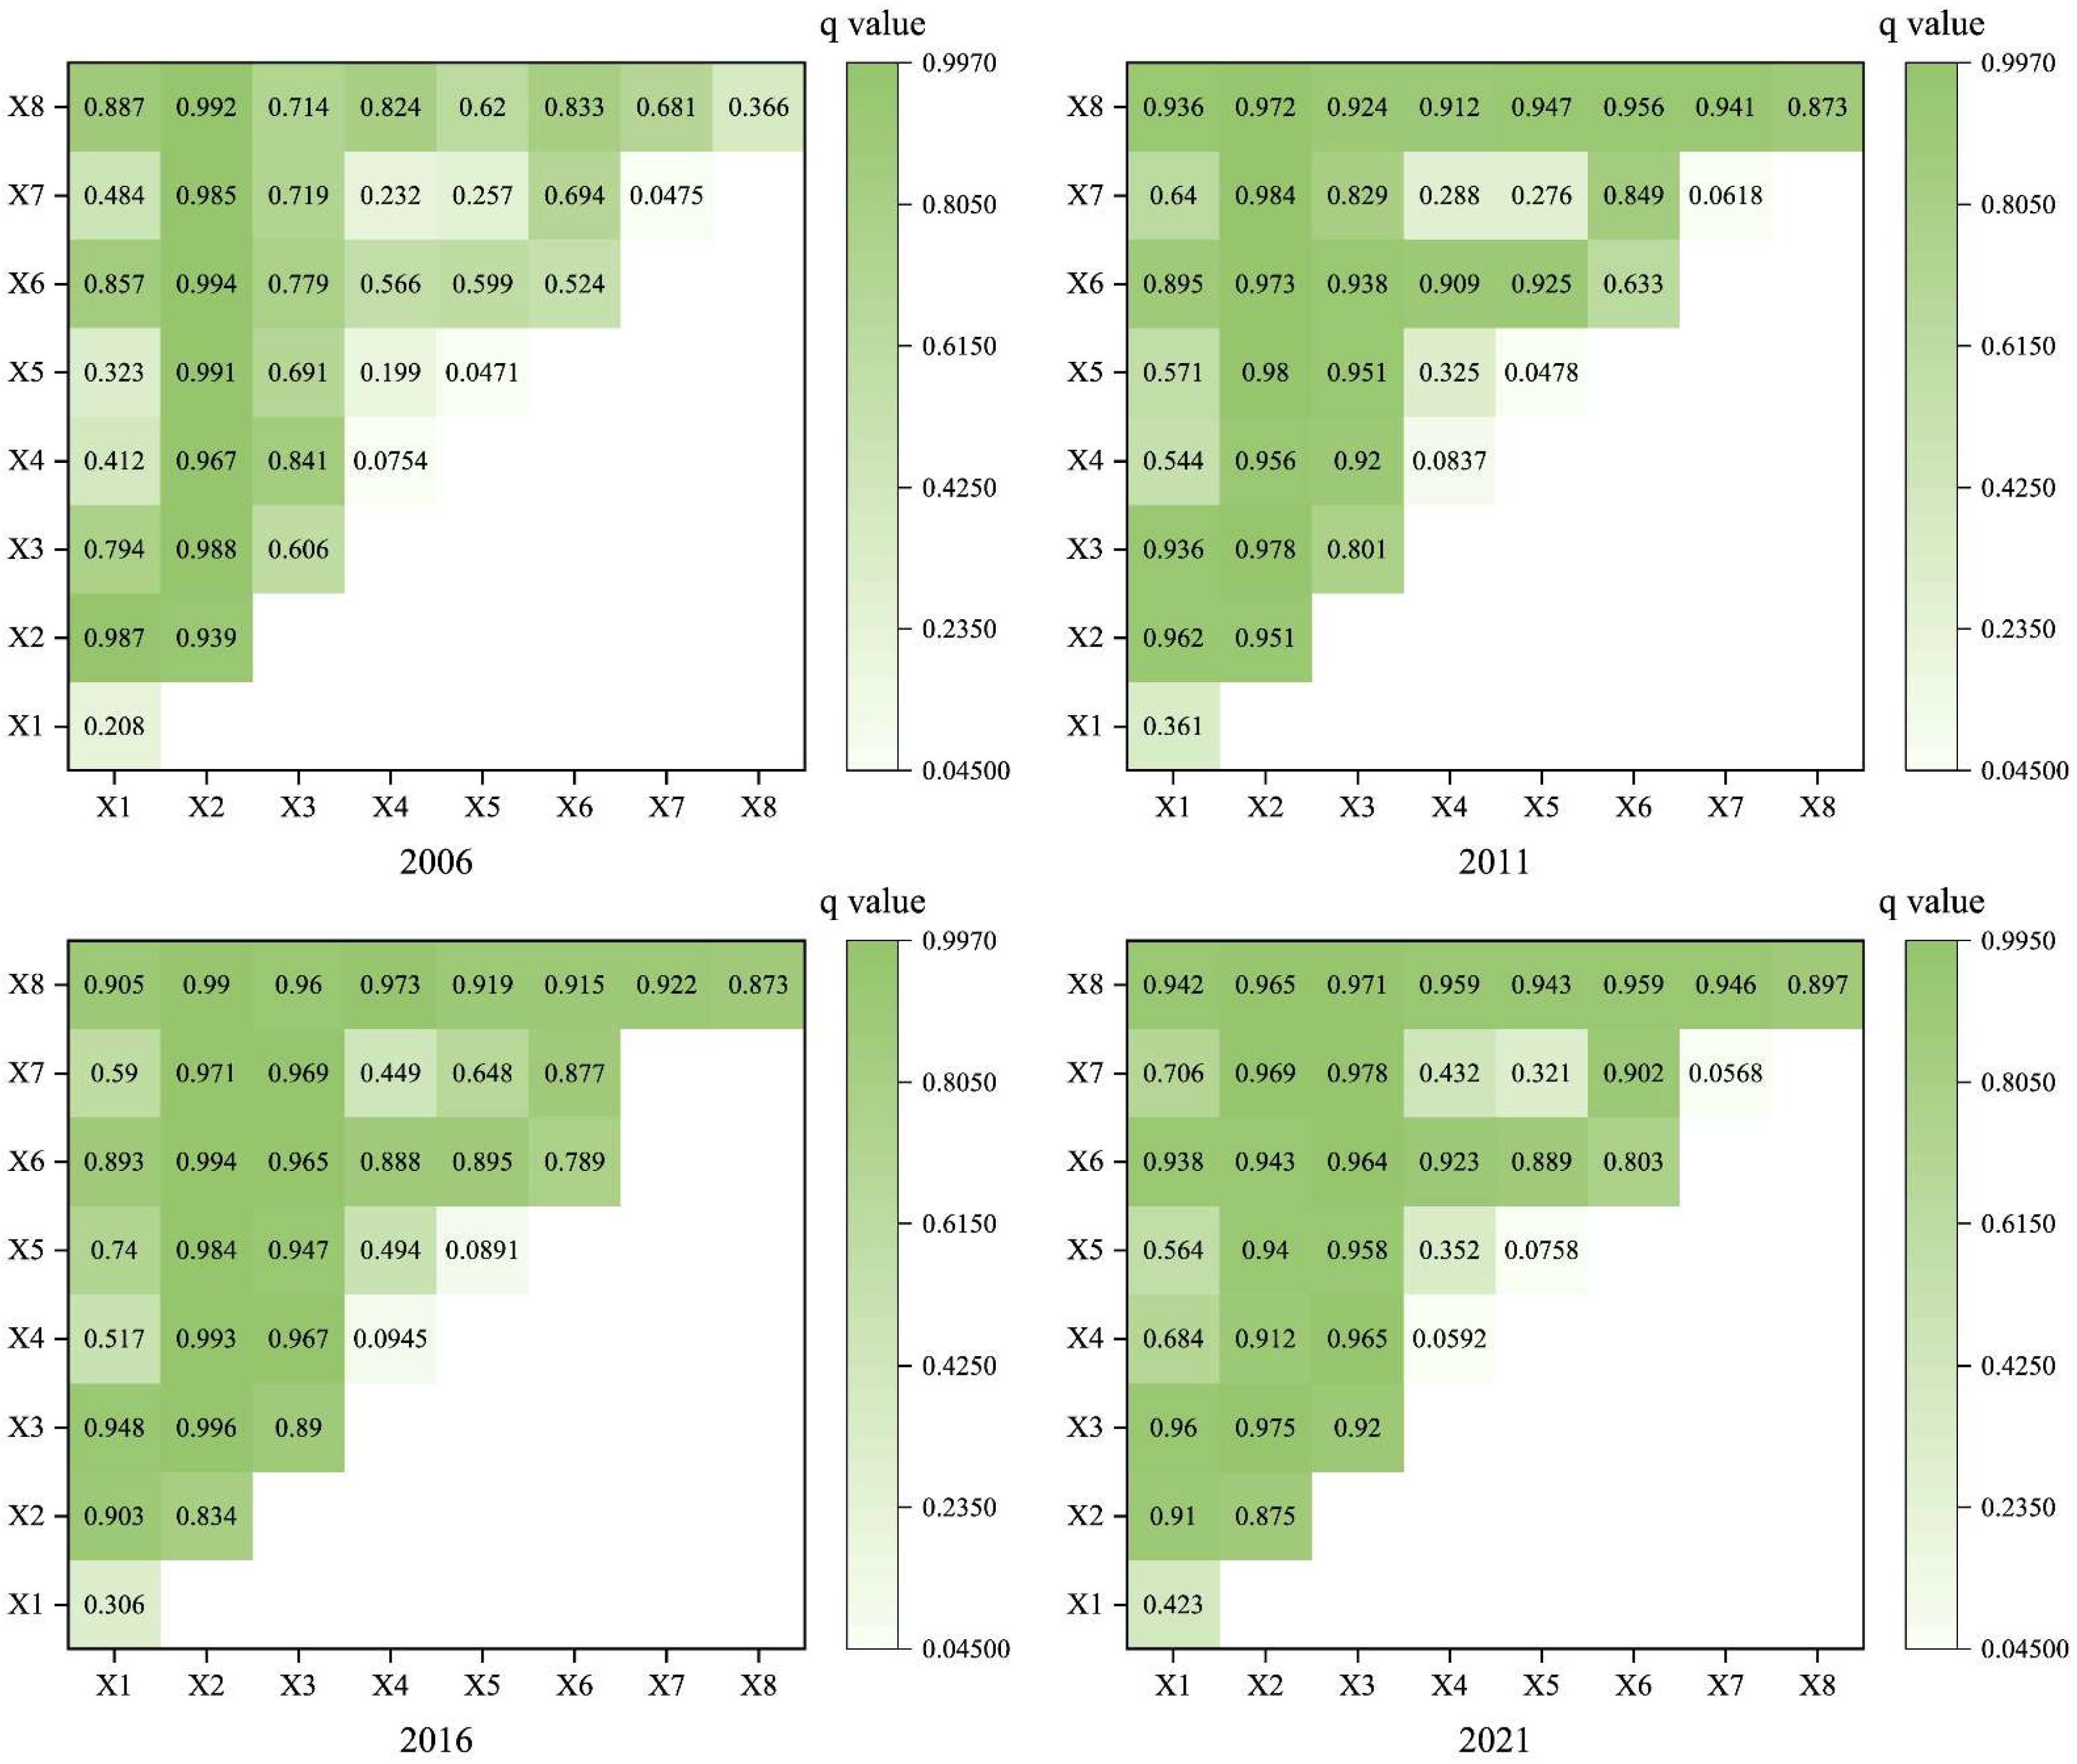
4.3. Influence Factor Analysis

The drivers of urban EER are examined using the factor detection and interaction detection methods of the geographic detector. The related influencing factors are selected as pollution emission (x1), social development (x2), economic support (x3), environmental quality (x4), pollution control (x5), ecological investment (x6), ecological restoration (x7), and innovation transformation (x8).
As shown in Figure 7, the results of factor detection on EER show that all eight indicators pass the significance test (p < 0.001), which indicates that each influencing factor has a certain degree of explanatory power on EER. The explanatory power is in the range of 3.22–95.1%. Specifically, social development, economic support, ecological investment, and innovation transformation are the dominant influence factors affecting EER development, and the average value of the explanatory power of the influence factors are 0.899, 0.804, 0.687, and 0.752, respectively. The degree of influence of social development and economic support on EER shows a steady increase trend, and the degree of influence of ecological investment and innovation transformation shows a significant increase trend. From 2006 to 2011, the influence of social development on EER reached its peak, indicating that some factors, such as the expansion of the industrial scale, the acceleration of the urbanization process, and the intensification of population activities, have seriously damaged the balance of the ecosystem and significantly weakened EER. Nevertheless, these prerequisites laid a solid foundation for the rapid development of EE in the subsequent years. From 2016 to 2021, economic support had the most significant impact on EER because the improvement of the economic development level led to the enhancement of people’s awareness of ecological and environmental protection, and the transformation and upgrading of industries improved the adaptive capacity of the economic system to changes in the ecological environment. Furthermore, the popularization and practice of the concepts of green development and recycling economy provide strong support for the enhancement of EER. At the same time, the degree of influence of innovation transformation rose from 0.366 in 2006 to 0.897 in 2021, which fully indicates that green science and technology innovation strongly promotes the green transformation of industries, promotes economic and social development in the direction of green and low-carbon, and effectively improves EER to external shocks.
Further, geographic detectors are utilized to detect the interactions of EER driving factors. The results (Figure 8) indicate that, on the whole, the interaction types of the drivers are two-factor enhancement and nonlinear enhancement. The factor explanatory power of the interaction of each indicator is greater than the q-value of any factor, which suggests that a single factor does not cause EER but is rather the result of the combined action of multiple factors. Although the magnitude of enhancement varies among the factors in the interactive driving process, the overall situation shows a synergistic enhancement. The interaction of social development, economic support, ecological investment, and innovation transformation with other factors is particularly prominent, becoming the core driving EER. Specifically, the interaction between social development and other factors is particularly significant, among which is the interaction with ecological investment, which continues to show significant influence over the years. This is because ecological investment can guide the flow of social capital to the green industry, promote the optimization and upgrading of EE structure, and enhance EER. The interaction between social development and economic support also has a more pronounced driving effect on EER, reflecting the strong adaptability of economic support to EER in the late stage of social development. Meanwhile, the interactive influence of economic support and ecological investment gradually increased, becoming the most dominant interactive driver by 2021. This shows that EE development is moving towards a more balanced and sustainable direction. Although the interaction effects of pollution emission, environmental quality, pollution control, and ecological restoration with other factors are slightly less influential, their long-term positive effects on EER should not be ignored.

4.4. Future Trend Prediction

In order to further reveal the transfer trend and transfer characteristics of urban EER, this article analyzes them with traditional Markov and spatial Markov chains. Firstly, EER is classified into the low level (Ⅰ), medium-low level (Ⅱ), medium-high level (Ⅲ), and high level (Ⅳ), and then its traditional Markov probability transfer matrix and spatial Markov probability transfer matrix are computed, in which the rows denote the state in the year t, and the columns denote the states in the year t + 1. Values on the diagonal represent the probability that the state type did not shift in year t + 1. In contrast, values on the off-diagonal represent the probability that a shift occurred between the different types in year t + 1.
The traditional Markov chain results are shown in Table 4. First, during the study period, the transition probabilities on the diagonal of the matrix are greater than those on the non-diagonal. The average value of the transfer probability on the diagonal is 0.804, which indicates that urban EER is more stable, with a high probability of maintaining its original state and a lower probability of undergoing hierarchical jumps. Secondly, the “club convergence” phenomenon of “High-value areas agglomeration together, driving the development of low-value areas” is evident. The probabilities of EER transitioning from a low level to a medium-low level, from a medium-low level to a medium-high level, and from a medium-high level to a high level are 16.8%, 16.6%, and 8.1%, respectively. The probabilities of reversing transitions between the medium-low and medium-high levels are 6.5% and 5.4%, respectively. The highest probability of maintaining the original state of EER is 97.0%, with high-level provinces being in the most stable state. There is still a positive trend of upward transitions, and it is essential to continuously enhance the EER of medium-low and medium-high-level cities to facilitate their gradual transition into the high-level category. Finally, the values on the non-diagonal line are not all zero, mainly clustered on both sides of the line, and neighboring types dominate the state transfer. This suggests that enhancing urban EER is a continuous and gradual process, and it is challenging to realize rank-leaping development.
Based on the neighbor matrix, the influence of spatial factors on urban EER is explored with the spatial Markov chain method; the spatial Markov transfer probability matrix is shown in Table 5. First, the EER of neighboring cities affects the transfer probability of their development-level state. Compared with the traditional Markov probability transfer matrix, the spatial Markov probability transfer matrix changes more significantly under the influence of EER of neighboring cities. Second, the transfer probability on the diagonal of the matrix is more significant than that on the non-diagonal, which indicates that under the condition of considering the EER of spatially neighboring cities and adding inter-temporal transfers, urban EER still tends to keep the existing state stable and unchanged. Then, “club convergence” is still evident. The lower the EER type of neighboring cities, the higher the probability of downward transfer and the smaller the probability of upward transfer of the province. The higher the EER type of neighboring cities, the higher the probability of upward transfer and the smaller the probability of downward transfer of the province. Urban EER has apparent spatial spillover effects. Finally, the probability value of not being directly adjacent to the diagonal position in the spatial transfer probability matrix is zero, suggesting that urban EER cannot realize the development of cross-ranking leaps regardless of the influence of any spatial neighboring effects.

5. Discussion

5.1. Analysis of Commonalities and Differences in the Evolutionary Trends of EER

This article integrates the three characteristics of resistance, adaptation, and restoration into a unified analytical framework. By analyzing and discussing the spatio-temporal evolution, influencing factors, and trend predictions of EER, it expands the theoretical horizons and case applications of current research on EER. The research results indicate that the development level of EER in various regions is continuously and steadily rising, and cities generally exhibit a positive trend toward improvement. This positive change aligns with the practical achievements of China’s ecological civilization construction [6]. Specifically, cities such as Beijing, Shanghai, Guangzhou, Chengdu, and Wuhan serve as cores, driving the vigorous development of other regions, including the Beijing–Tianjin–Hebei area, the Yangtze River Delta, the Pearl River Delta, the Chengdu–Chongqing Economic Circle, and the Wuhan Economic Circle. However, resource-based cities in northeast China, constrained by their current economic and industrial structures, are still at a relatively low level of EER development, which is consistent with the research conclusions of Li et al. [56]. It is noteworthy that, despite a consensus on the overall evolutionary trend among various studies, specific change characteristics exhibit differences, mainly attributed to the choice of research perspectives, the setting of evaluation indicators, and the differences in measurement standards. Chen et al. [57] found that the gap between cities is gradually narrowing, which is different from the conclusion of our article that regional disparities are widening. The research results of our article align with Wang et al.’s [32] findings on the Pearl River Delta, showing that the level of coordinated development between urban development and ecological resilience has shifted from basic coordination to a state of severe imbalance.

5.2. Theoretical Contributions

This article relies on the practical development of urban EER in China, incorporating frontier theories such as spatial effects and evolutionary economic geography into a unified research framework to construct a theoretical analysis framework for studying EER. By combining the analytical framework with empirical applications, it better reflects the complexity and dynamism of EER, highlighting its theoretical significance. Furthermore, unlike the existing comprehensive indicator systems that mostly focus on the static state assessment of urban EER, this article improves current research on EER by constructing an evaluation system encompassing the three characteristics of resistance, adaptation, and restoration. It also dynamically reflects the changing trends and evolutionary features of the EER system at different stages of development.
The evolution of EER constitutes a complex and dynamic system, so analyzing its driving factors is crucial for exploring ways to enhance resilience. Most current studies are limited to a framework of linear assumptions, primarily focusing on the net effect of the single impact of driving factors while neglecting the complex interactions that may exist among these factors. In contrast, the geographical detector model, by integrating spatial information, can not only reveal the direct impact of a single driving factor on the dependent variable but also deeply analyze the interactions among these driving factors. Most scholars currently focus on the impact of external factors on specific dependent variables. However, it is worth noting that a deeper measurement of internal factors can more thoroughly reveal the internal operating mechanisms of the EER system, accurately identify key nodes and vulnerable links within the system, promptly and accurately locate problems, and provide firmer support for the rational allocation of resources and the enhancement of EER.
Revealing the future spatial dynamic evolution of EER expands the application boundary of the spatial Markov model, and, unlike prediction models that treat time series as a single driving factor, the spatial Markov chain prediction model considers both historical evolution and spatial relationships, describing the possibility of the system transitioning from one state to another through state transition probabilities. Under different spatial lag conditions, effectively analyzing the development level of urban EER of regional units in different spatial contexts is an effective tool for revealing the patterns and processes of changes in the composition of convergence clubs.

5.3. Practical Implications

This article explores the positioning and interconnections of EER across different regions, clarifies the strengths and weaknesses of each city in the process of EER development, and uncovers their potential for growth. It also sorts out important factors and related indicators influencing regional EER to better grasp its development direction, providing new insights for clarifying the development of EER in different regions. Furthermore, it offers empirical evidence and decision-making references for achieving coordinated development of regional EER and continuously narrowing regional disparities.
By defining and measuring the connotation of EER, a more comprehensive understanding of China’s actual performance in this regard along its development trajectory can be obtained. China’s EE system demonstrates significant resilience in facing multiple challenges, such as resource constraints and economic fluctuations, but it also reveals issues and shortcomings that need addressing. Therefore, gaining an in-depth understanding of the current status of EER development across various regions in China is strategically crucial for formulating targeted development strategies, optimizing resource allocation, and comprehensively enhancing the overall level of EER.
The measurement framework constructed in this article, from the perspectives of resistance, adaptability, and recovery capacity, has broad applicability globally. It can be applied not only to the assessment of EER within China but also to EER systems worldwide. Given the diversity and complexity of EE systems, the indicator system under this framework can be selected and adjusted according to the characteristics of the assessment objects. Moreover, the differences and complementarities in EER among different countries and regions can facilitate international cooperation and exchange spaces, enabling shared experiences and resources to address global challenges.

6. Conclusions and Policy Implications

6.1. Conclusions

This article took 290 cities in China as research objects and adopted ESTDA, geographic detector, and spatial Markov chain model to analyze the spatio-temporal evolution characteristics, the main influencing factors, and the future trend predictions of urban EER from 2006 to 2021. The conclusions of the study are as follows:
(1)
Urban EER exhibited a significant overall enhancement trend during the study period. Cities with higher levels of EER are mainly concentrated in Beijing, Shanghai, Guangzhou, Chengdu, and others, forming a typical “rhombus” pattern in spatial distribution. In contrast, cities with lower levels are mostly clustered in the northeast and western regions, where economic development is relatively sluggish. Despite some progress being made by various regions in enhancing EER, low and lower levels of resilience still dominate the overall picture. Notably, inter-regional disparities are gradually widening, and the issue of uneven development in EER is increasingly prominent.
(2)
There is a clear spatial agglomeration relationship in EER, mainly manifested as high-value agglomeration areas in the east and low-value agglomeration areas in the west. The number of high–high agglomeration areas shows an upward trend, and the scope of these areas is gradually expanding, while the scope of low–low agglomeration areas is shrinking. High–low agglomeration areas are mainly concentrated in provincial capitals and core regions with faster economic development. During EER development, the Matthew Effect is significant, meaning that the strong continue to grow stronger while the weak continue to weaken, and this differentiation trend persists.
(3)
Cities with relatively short lengths are widely distributed, and the spatial structure of EER is relatively stable overall. The distribution of areas with relatively low curvature is extensive and accounts for a large proportion, and they are relatively less affected by the spillover or siphon effects from neighboring cities. Cities with coordinated development of EER in China account for a high proportion, and the spatial pattern evolution demonstrates strong spatial integration. The overall trend of high or low growth in EER among urban units and adjacent cities is relatively evident.
(4)
From the perspective of influencing factor analysis, social development, economic support, ecological restoration, and innovation transformation are the dominant factors affecting the development of EER. In terms of the interactive driving effects among these factors, the combined action of any two driving factors will enhance their intensity of influence on EER. The interactions of social development, economic support, ecological restoration, and innovation transformation with other factors are particularly prominent, becoming the core force driving EER.
(5)
Compared to the traditional Markov probability transition matrix, the spatial Markov probability transition matrix undergoes significant changes due to the influence of neighboring cities’ EER. Under the condition of incorporating intertemporal transitions, the EER of each city still tends to maintain its current state of stability. The phenomenon of “club convergence” remains evident. China’s urban EER exhibits a clear spatial spillover effect, and no city can achieve cross-level leapfrogging development.

6.2. Policy Implications

Based on the preceding conclusions and practical issues, this study makes the following policy recommendations:
(1)
To narrow the development gap in regional EER, differentiated policies should be implemented for different regions. In the eastern regions, particularly the Beijing–Tianjin–Hebei, Yangtze River Delta, and Pearl River Delta economic circles centered on Beijing, Shanghai, and Guangzhou, they should continue to play their demonstrative and leading roles, radiating and driving EER development in the central and western regions as well as the northeastern region through their advanced experiences and technological advantages. Meanwhile, due to the natural EE advantages of the central and western regions, these areas should focus on developing green industries and strengthening the sustainable development of EE. In contrast, the northeastern region is characterized by its resource-based economy, with a severely rigid urban structure and difficulties in industrial structural development and, transformation and upgrading. Therefore, continuous policy preferences and support should be provided to help the northeastern region accelerate the transformation and upgrading of traditional industries and the cultivation and development of emerging industries.
(2)
It is important to emphasize the driving role of core explanatory factors, as social development and economic support play crucial roles in enhancing EER. Cities should stabilize the pace of urban construction, accelerate the transformation of industries towards green and low-carbon directions, and ensure the harmonious coexistence of urban development and ecological protection. Increased financial investment and preferential tax policies for EE projects should be implemented to encourage social capital participation in EE construction, forming a diversified investment pattern and effectively promoting the enhancement of EER. At the same time, it is recommended that efforts be intensified in the utilization of industrial solid waste, non-hazardous disposal of household waste, and sewage treatment, formulating detailed implementation plans and action plans with clear responsible entities and timelines. Additionally, the green area and green coverage in built-up areas should be continuously expanded, and a long-term management mechanism for improving EER should be established and improved.
(3)
High-level cities should be leveraged to demonstrate and drive development. Cities with high EER in China have a positive spillover effect, and the “leading” role of high-level cities can help promote state transitions in other cities. High-level cities should be actively encouraged to share advanced experiences and economic and technological advantages, for example, by establishing an information-sharing platform for EER, to drive EER development in low-level cities, maximizing the positive spatial spillover effect of high-level cities with strong EER and promoting regional coordination and common development nationwide. At the same time, policies that restrict EER development should be promptly adjusted to ensure that policy adjustment schemes are coordinated with the overall development strategies of the country, regions, and cities.

6.3. Limitations and Future Research

System resilience is a multi-factor, multi-dimensional, and comprehensive proposition. Although scholars have begun to pay attention to EER, a set of authoritative and comprehensive measurement index systems has yet to be formed; thus, how to assess EER more comprehensively and multi-dimensionally is still the focus of future research. Secondly, although the period of existing studies has been extended, the current time cycle still needs to be improved to fully reveal the development stage and characteristics of EER. Future studies should further extend the research cycle, include the adaptive cycle theory, and analyze the development stage of EER in depth to provide a scientific basis for proposing an effective adaptive management mechanism. Finally, with the increasing improvement of green industries and means of production and living, the association and interaction between various EE zones have become closer and more frequent. The exchange and transfer of resources brought about by the flow of people, logistics, information, and capital have led to an intricate network of interactions within EE zones, between economic zones, and the external environment. Whether and how such internal correlation and mobility affect EER is an issue that deserves further exploration.

Author Contributions

Methodology, writing—original draft preparation, data curation, project administration, K.W.; writing—review and editing, B.Z.; resources, formal analysis, S.J.; conceptualization, writing—review and editing, R.D. All authors have read and agreed to the published version of the manuscript.

Funding

This work was supported by the National Natural Science Foundation of China (No. 72001053) and the Innovation Exploration and Academic Seeding Project of Guizhou University of Finance and Economics (No. 2024XSXMB18).

Data Availability Statement

The data presented in this study are available on request from the corresponding author.

Acknowledgments

We thank the editors and the anonymous reviewers for their valuable comments and suggestions.

Conflicts of Interest

The authors declare no conflicts of interest.

References

  1. Norman, M.R. Infrastructure Investment and Jobs Act (IIJA). ITE J. 2022, 92, 24. [Google Scholar]
  2. Kenter, J.O.; Reed, M.S.; Irvine, K.N.; O’Brien, L.; Brady, E.; Bryce, R.; Christie, M.; Church, A.; Cooper, N.; Davies, A. UK National Ecosystem Assessment Follow-On. Work Package Report 6: Shared, Plural and Cultural Values of Ecosystems. UK National Ecosystem Assessment; The University of York: Yorkshire, England, 2014. [Google Scholar]
  3. The quality of the ecological environment has continued to improve, and the comprehensive promotion of Beautiful China construction has been carried out. Econ. Financ. Circ. 2024, 28, 12–15. (In Chinese)
  4. Statistical communique of the people’s republic of China on the 2023 national economic and social development. China Stat. 2024, 3, 4–21. (In Chinese)
  5. Chen, S. Environmental pollution emissions, regional productivity growth and ecological economic development in China. China Econ. Rev. 2015, 35, 171–182. [Google Scholar] [CrossRef]
  6. Meng, F.; Guo, J.; Guo, Z.; Lee, J.C.; Liu, G.; Wang, N. Urban ecological transition: The practice of ecological civilization construction in China. Sci. Total Environ. 2021, 755, 142633. [Google Scholar] [CrossRef]
  7. Li, Y.; Wang, J.; Ma, L.; Lian, P.; Ma, L.; Wen, X.; Yue, H. Eco-economic Basis of Progress Leading to Victory and Its Relationship with Soil and Water Conservation. J. Soil Water Conserv. 2023, 30, 470–476. [Google Scholar]
  8. Wang, H.; Wu, W.; Xiong, L.; Wang, F. Is there an environment and economy trade-off for the National Key Ecological Function Area policy in China? Environ. Impact Assess. Rev. 2024, 104, 107347. [Google Scholar] [CrossRef]
  9. Lu, H.; Zhou, L.; Chen, Y.; An, Y.; Hou, C. Degree of coupling and coordination of eco-economic system and the influencing factors: A case study in Yanchi County, Ningxia Hui Autonomous Region, China. J. Arid Land 2017, 9, 446–457. [Google Scholar] [CrossRef]
  10. Bi, A.-P.; Zhu, H.-J. Research of coupling of eco-economic systems of soil erosion regions based on the PSR model—A case study of Zhuxi River Basin. Chin. J. Eco-Agric. 2013, 21, 1023–1030. [Google Scholar] [CrossRef]
  11. Yuan, K.; Hu, B.; Li, X.; Niu, T.; Zhang, L. Exploration of Coupling Effects in the Digital Economy and Eco-Economic System Resilience in Urban Areas: Case Study of the Beijing-Tianjin-Hebei Urban Agglomeration. Sustainability 2023, 15, 7258. [Google Scholar] [CrossRef]
  12. Zhang, Z.; Chang, T.; Qiao, X.; Yang, Y.; Guo, J.; Zhang, H. Eco-Economic Coordination Analysis of the Yellow River Basin in China: Insights from Major Function-Oriented Zoning. Sustainability 2021, 13, 2715. [Google Scholar] [CrossRef]
  13. Li, S.; Jia, B.; Zhong, Y.; Ren, T. Temporal and spatial differences of eco-economic efficiency in the Yangtze River Economic Belt and its driving factors. Stat. Decis. 2023, 39, 74–78. (In Chinese) [Google Scholar]
  14. Zhang, Z.; Zhang, Y.; Shao, X. Coupling coordination analysis and spatiotemporal heterogeneity of the agricultural eco-economic system in the main grain-producing areas of Jilin Province. Environ. Sci. Pollut. Res. 2023, 30, 41782–41793. [Google Scholar] [CrossRef] [PubMed]
  15. Yuan, C. Statistical Measurement of China’s Ecological Economy Development Level. Stat. Decis. 2024, 40, 106–111. (In Chinese) [Google Scholar]
  16. Hou, J.; An, Y.; Song, H.; Chen, J. The Impact of Haze Pollution on Regional Eco-Economic Treatment Efficiency in China: An Environmental Regulation Perspective. Environ. Sci. Pollut. Res. 2019, 16, 4059. [Google Scholar] [CrossRef]
  17. Jinli, D.; Manhong, S.; Xuan, Y. Study on the eco-economic efficiency of China’s mariculture based on undesirable output. Front. Mar. Sci. 2023, 10, 1254537. [Google Scholar] [CrossRef]
  18. Zhang, J.; Wang, Y.; Li, J. Maximize Eco-Economic Benefits with Minimum Land Resources Input: Evaluation and Evolution of Land Use Eco-Efficiency of Agglomerations in Middle Reaches of Yangtze River, China. Environ. Sci. Pollut. Res. 2023, 20, 1985. [Google Scholar] [CrossRef]
  19. Li, X.; Lei, L.; Li, J. Integrating ecosystem service value into the evaluation of sustainable land use in fast-growing cities: A case study of Qingdao, China. Ecol. Indic. 2023, 153, 110434. [Google Scholar] [CrossRef]
  20. Pan, Y.; Zhang, B.; Wu, Y.; Tian, Y. Sustainability assessment of urban ecological-economic systems based on emergy analysis: A case study in Simao, China. Ecol. Indic. 2021, 121, 107157. [Google Scholar] [CrossRef]
  21. Ye, C.; Chen, L.; Ni, S.; Zhou, J. Evaluation model of forest eco economic benefits based on discrete particle swarm optimization. Environ. Technol. Innov. 2021, 22, 101426. [Google Scholar] [CrossRef]
  22. Jin, Z.; Cao, H.; Xia, S.; Liu, Q.; Jia, M.; Wang, R. Research on the Synergy Measurement for Wetland Ecological-Economic-Social Composite System Based on Fractional Order Dynamic System. Discrete Dyn. Nat. Soc. 2022, 2022, 1934271. [Google Scholar] [CrossRef]
  23. Yuan, L.; Li, R.; He, W.; Wu, X.; Kong, Y.; Degefu, D.M.; Ramsey, T.S. Coordination of the industrial-ecological economy in the Yangtze River Economic Belt, China. Front. Environ. Sci. 2022, 10, 882221. [Google Scholar] [CrossRef]
  24. Li, L.; Fan, Z.; Feng, W.; Yuxin, C.; Keyu, Q. Coupling coordination degree spatial analysis and driving factor between socio-economic and eco-environment in northern China. Ecol. Indic. 2022, 135, 108555. [Google Scholar] [CrossRef]
  25. Holling, C.S. Resilience and stability of ecological systems. Annu. Rev. Ecol. Evol. Syst. 1973, 4, 460–482. [Google Scholar] [CrossRef]
  26. Berkes, F.; Folke, C.; Colding, J. Linking social and ecological systems: Management practices and social mechanisms for building resilience. J. R. Anthropol. Inst. 2001, 7, 387–389. [Google Scholar]
  27. Carpenter, S.; Walker, B.; Anderies, J.M.; Abel, N. From Metaphor to Measurement: Resilience of What to What? Ecosystems 2001, 4, 765–781. [Google Scholar] [CrossRef]
  28. Folke, C. Resilience: The emergence of a perspective for social–ecological systems analyses. Global Environ. Chang. 2006, 16, 253–267. [Google Scholar] [CrossRef]
  29. McPhearson, T.; Andersson, E.; Elmqvist, T.; Frantzeskaki, N. Resilience of and through urban ecosystem services. Ecosyst. Serv. 2015, 12, 152–156. [Google Scholar] [CrossRef]
  30. Botequilha-Leitão, A.; Díaz-Varela, E.R. Performance Based Planning of complex urban social-ecological systems: The quest for sustainability through the promotion of resilience. Sustain. Cities Soc. 2020, 56, 102089. [Google Scholar] [CrossRef]
  31. Ireni-Saban, L. Challenging disaster administration: Toward community-based disaster resilience. Adm. Soc. 2013, 45, 651–673. [Google Scholar] [CrossRef]
  32. Wang, S.; Cui, Z.; Lin, J.; Xie, J.; Su, K. The coupling relationship between urbanization and ecological resilience in the Pearl River Delta. J. Geogr. Sci. 2022, 32, 44–64. [Google Scholar] [CrossRef]
  33. Tao, J.; Dong, P.; Lu, Y. Spatial-temporal Analysis and Influencing Factors of Ecological Resilience in Yangtze River Delta. Resour. Environ. Yangtze Basin 2022, 31, 1975–1987. (In Chinese) [Google Scholar]
  34. Shi, C.; Zhu, X.; Wu, H.; Li, Z. Assessment of urban ecological resilience and its influencing factors: A case study of the Beijing-Tianjin-Hebei urban agglomeration of China. Land 2022, 11, 921. [Google Scholar] [CrossRef]
  35. Zhang, Y.; Yang, Y.; Chen, Z.; Zhang, S. Multi-criteria assessment of the resilience of ecological function areas in China with a focus on ecological restoration. Ecol. Indic. 2020, 119, 106862. [Google Scholar] [CrossRef]
  36. He, J.; Shi, X.; Fu, Y. Identifying vegetation restoration effectiveness and driving factors on different micro-topographic types of hilly Loess Plateau: From the perspective of ecological resilience. J. Environ. Manag. 2021, 289, 112562. [Google Scholar] [CrossRef]
  37. Adger, W.N. Social and ecological resilience: Are they related? Prog. Hum. Geogr. 2000, 24, 347–364. [Google Scholar] [CrossRef]
  38. Brakman, S.; Garretsen, H.; Van Marrewijk, C. Regional resilience across Europe: On urbanisation and the initial impact of the Great Recession. Camb. J. Reg. Econ. Soc. 2015, 8, 225–240. [Google Scholar] [CrossRef]
  39. Davies, S. Regional resilience in the 2008–2010 downturn: Comparative evidence from European countries. Camb. J. Reg. Econ. Soc. 2011, 4, 369–382. [Google Scholar] [CrossRef]
  40. Martin, R.; Sunley, P.; Gardiner, B.; Tyler, P. How regions react to recessions: Resilience and the role of economic structure. Reg. Stud. 2016, 50, 561–585. [Google Scholar] [CrossRef]
  41. Martin, R. Regional economic resilience, hysteresis and recessionary shocks. J. Econ. Geogr. 2012, 12, 1–32. [Google Scholar] [CrossRef]
  42. Boschma, R. Towards an evolutionary perspective on regional resilience. Reg. Stud. 2015, 49, 733–751. [Google Scholar] [CrossRef]
  43. Cheng, K.; Wang, X.; Liu, S.; Zhuang, Y. Spatial differences and dynamic evolution of economic resilience: From the perspective of China’s eight comprehensive economic zones. Econ. Chang. Restruct. 2024, 57, 73. [Google Scholar] [CrossRef]
  44. Brada, J.C.; Gajewski, P.; Kutan, A.M. Economic resiliency and recovery, lessons from the financial crisis for the COVID-19 pandemic: A regional perspective from Central and Eastern Europe. Int. Rev. Financ. Anal. 2021, 74, 101658. [Google Scholar] [CrossRef] [PubMed]
  45. Simone, C.; Iandolo, F.; Fulco, I.; Loia, F. Rome was not built in a day. Resilience and the eternal city: Insights for urban management. Cities 2021, 110, 103070. [Google Scholar] [CrossRef]
  46. González, D.P.; Monsalve, M.; Moris, R.; Herrera, C. Risk and Resilience Monitor: Development of multiscale and multilevel indicators for disaster risk management for the communes and urban areas of Chile. Appl. Geogr. 2018, 94, 262–271. [Google Scholar] [CrossRef]
  47. Gao, L.; Bao, W.; Shi, L. Governance mechanism and performance of marine eco-economic system: Evidence from China. Ecol. Indic. 2022, 136, 108668. [Google Scholar] [CrossRef]
  48. Kitchen, L.; Marsden, T. Creating sustainable rural development through stimulating the eco-economy: Beyond the eco-economic paradox? Sociol. Rural. 2009, 49, 273–294. [Google Scholar] [CrossRef]
  49. Li, J.; Sun, W.; Song, H.; Li, R.; Hao, J. Toward the construction of a circular economy eco-city: An emergy-based sustainability evaluation of Rizhao city in China. Sustain. Cities Soc. 2021, 71, 102956. [Google Scholar] [CrossRef]
  50. Guerci, J.R. Space-Time Adaptive Processing for Radar; Artech House: Washington, DC, USA, 2014. [Google Scholar]
  51. Møller, J. Markov chain Monte Carlo and spatial point processes. In Stochastic Geometry; Routledge: Abingdon, UK, 2019; pp. 141–172. [Google Scholar]
  52. Feng, R.; Wang, F.; Wang, K.; Wang, H.; Li, L. Urban ecological land and natural-anthropogenic environment interactively drive surface urban heat island: An urban agglomeration-level study in China. Environ. Int. 2021, 157, 106857. [Google Scholar] [CrossRef]
  53. Wang, J.; Zhou, X. Measurement and synergistic evolution analysis of economic resilience and green economic efficiency: Evidence from five major urban agglomeration, China. Appl. Geogr. 2024, 168, 103302. [Google Scholar] [CrossRef]
  54. Hu, H.; Yan, K.; Shi, Y.; Lv, T.; Zhang, X.; Wang, X. Decrypting resilience: The spatiotemporal evolution and driving factors of ecological resilience in the Yangtze River Delta Urban Agglomeration. Environ. Impact Assess. Rev. 2024, 106, 107540. [Google Scholar] [CrossRef]
  55. Huang, J.; Zhong, P.; Zhang, J.; Zhang, L. Spatial-temporal differentiation and driving factors of ecological resilience in the Yellow River Basin, China. Ecol. Indic. 2023, 154, 110763. [Google Scholar] [CrossRef]
  56. Li, W.; Yi, P.; Zhang, D.; Zhou, Y. Assessment of coordinated development between social economy and ecological environment: Case study of resource-based cities in Northeastern China. Sustain. Cities Soc. 2020, 59, 102208. [Google Scholar] [CrossRef]
  57. Chen, Y.; Tian, W.; Zhou, Q.; Shi, T. Spatiotemporal and driving forces of Ecological Carrying Capacity for high-quality development of 286 cities in China. J. Clean. Prod. 2021, 293, 126186. [Google Scholar] [CrossRef]
Figure 1. Research framework.
Systems 12 00525 g001
Figure 2. EER study area.
Systems 12 00525 g002
Figure 3. Number of cities with different levels of EER from 2006–2021.
Systems 12 00525 g003
Figure 4. Spatial distribution of EER from 2006–2021.
Systems 12 00525 g004
Figure 5. Results of LISA agglomeration analysis of EER.
Systems 12 00525 g005
Figure 6. Spatial distribution characteristics of LISA time paths of EER from 2006 to 2021.
Systems 12 00525 g006
Figure 7. Q-value of each impact factor from 2006 to 2021.
Systems 12 00525 g007
Figure 8. Impact factor interaction q-values from 2006 to 2021.
Systems 12 00525 g008
Table 1. EER evaluation indicator system.
DimensionSubdimensionSpecific Indicators
ResistancePollution emissions (x1)Industrial wastewater discharge
Industrial sulfur dioxide emissions
Industrial fume and dust emissions
Industrial NOx emissions
Social development (x2)Percentage of land area in built-up areas
Total urban water supply
Population density
Gross industrial output value above scale
AdaptiveEconomic support (x3)GDP per capita
Advanced industrial structure (value added of tertiary industry as a share of GDP)
Revenue from the general budget of the local treasury
Environmental quality (x4)PM2.5
Pollution control (x5)Comprehensive utilization rate of general industrial solid waste
Non-hazardous treatment rate of domestic waste
Sewage treatment rate
Ecological investment (x6)Urban construction and maintenance expenditure
Investment in landscaping
Investment in amenities and sanitation
Drainage and sewage investments
RestorativeEcological restoration (x7)Road area per capita
Green space per capita in parks
Greening coverage in built-up areas
Innovative transformation (x8)Share of education, science, and technology expenditure in general public budget expenditure
Number of employees in the information transmission, computer services, and software industries as a share of total employment
Number of green patents granted
Table 2. Basis and type of factor interactions.
Basis of DivisionTypology
q ( X 1 X 2 ) < m i n ( q ( X 1 ) , q ( X 2 ) ) Nonlinear weakening
m i n ( q ( X 1 ) , q ( X 2 ) ) < q ( X 1 X 2 ) < m a x ( q ( X 1 ) , q ( X 2 ) ) Single-factor nonlinear attenuation
q ( X 1 X 2 ) > m a x ( q ( X 1 ) , q ( X 2 ) ) Two-factor enhancement
q ( X 1 X 2 ) = q ( X 1 ) + q ( X 2 ) Stand alone
q ( X 1 X 2 ) > q ( X 1 ) + q ( X 2 ) Nonlinear enhancement
Table 3. Global Moran’s I index of EER from 2006 to 2021.
YearMoran’s IZ-Valuep-Value
20060.1027.3060.000
20070.1067.5860.000
20080.1017.1860.000
20090.0976.8750.000
20100.1017.0970.000
20110.0976.7710.000
20120.0996.8540.000
20130.0886.1700.000
20140.0815.7100.000
20150.0896.1950.000
20160.0785.4960.000
20170.0825.7510.000
20180.0886.1080.000
20190.0956.5100.000
20200.1087.3250.000
20210.1047.0840.000
Source: Own calculations based on statistical data.
Table 4. Traditional Markov transfer probability matrix.
t/t + 1N
0.8320.1680.0000.0001144
0.0650.7670.1660.0021105
0.0000.0540.8650.0811050
0.0000.0010.0290.9701051
Source: Own calculations based on statistical data.
Table 5. Spatial Markov transfer probability matrix.
t/t + 1N
0.8320.1680.0000.0001144
0.0650.7670.1660.0021105
0.0000.0540.8650.0811050
0.0000.0010.0290.9701051
0.8520.1480.0000.000330
0.0890.7850.1260.000246
0.0000.0670.8720.060149
0.0000.0000.0320.968124
0.7910.2090.0000.000358
0.0720.7690.1570.002446
0.0000.0610.8670.072376
0.0000.0000.0410.959293
0.7790.2210.0000.000204
0.0360.7460.2150.003331
0.0000.0400.8630.098502
0.0000.0040.0260.970532
Source: Own calculations based on statistical data.
Disclaimer/Publisher’s Note: The statements, opinions and data contained in all publications are solely those of the individual author(s) and contributor(s) and not of MDPI and/or the editor(s). MDPI and/or the editor(s) disclaim responsibility for any injury to people or property resulting from any ideas, methods, instructions or products referred to in the content.

