Article

Mitigating Financial Distress by Engaging in Digital Transformation: The Moderating Role of Life Cycles

Business School, Shandong University, Weihai 264209, China
*
Author to whom correspondence should be addressed.
Systems 2024, 12(12), 513; https://doi.org/10.3390/systems12120513
Submission received: 22 September 2024 / Revised: 7 November 2024 / Accepted: 18 November 2024 / Published: 21 November 2024
(This article belongs to the Special Issue Strategic Management in Digital Transformation Era)

Abstract

:
Financial distress is detrimental to both companies and the development of economic society. The emergence of digital transformation provides a potentially prominent pathway for companies to address financial distress. Drawing on the dynamic capability view, this study explored the effects of digital transformation on firms’ financial distress and how this relationship may be contingent on the life cycle. Our hypotheses were empirically examined using a large panel dataset of Chinese-listed manufacturing firms and applied a hierarchical linear model with multiple high-dimensional fixed effects. The results indicate that digital transformation significantly alleviates financial distress. Moreover, the life cycle has a moderating effect on this relationship. Specifically, the mitigating effect of digital transformation on financial distress is stronger during the growth stage but weaker during the declining stage. Finally, the findings provide important theoretical contributions to the literature on digital transformation and corporate finance and offer managers valuable practical implications to mitigate financial distress.

1. Introduction

Corporate financial distress can be defined as a situation of low cash flow and loss incurred without being insolvent [1]. It is a trigger of macro systemic risk and is often examined in terms of financial performance, insolvency risk, and debt default. Persistent financial distress is not only detrimental to the construction of healthy capital markets but also to the development of firms themselves. Some researchers have identified factors leading to financial distress, such as poor financial management, inadequate capital, and high-intensity rivalries [2,3,4]. However, efforts to alleviate financial distress in these sources are rarely successful, as mitigating financial distress is a complex task that requires high degrees of information processing, innovation, and resource allocation capacity. Therefore, addressing financial challenges requires a focus on the importance of corporate dynamic capability, for which we highlight the role of digital transformation.
With numerous emerging technologies, most sectors of society are moving into a digital transformation phase. Digital transformation represents an innovative process through which an organization uses digital technologies to transform its business and operations to adapt to a complex environment [5,6]. Thus, digitalization may offer a new and disruptive market opportunity for companies. Specifically, Zhu and Yu (2024) contend that digital transformation enhances the bargaining power of firms within the supply chain regarding profit allocation, particularly for those struggling with ineffective resource management and facing intense competition [7]. The increase in bargaining power may reduce the probability of financial distress. In addition, digital transformation equips organizations with the requisite tools to restructure their operational frameworks, which allows them to effectively identify and adapt to emerging customer needs, thereby enhancing operational efficiency and ultimately optimizing financial resource utilization and avoiding the risk of financial distress [8]. Overall, digital transformation is crucial not only for organizations grappling with financial challenges stemming from ineffective resource management and fierce competition but also for the advantages it offers in restructuring operational processes and enhancing the optimization of financial resources.
However, prior research on digital transformation has generally been limited to specific areas, such as operation digitization, management digitization, and accounting digitization, with little literature on the role of digitization in corporate finance from a dynamic capability view, which is a pivotal perspective in achieving successful corporate digital transformation [9,10,11,12,13]. An investigation of the financial effects of digital transformation on firms from the perspective of corporate dynamic capability will address an important gap involving providing solutions to financial distress. Thus, an investigation of the financial effects of digital transformation on firms from the perspective of corporate dynamic capability will address an important gap involving providing solutions to financial distress.
Notwithstanding the importance of implementing digital transformation, the financial character of the organization itself cannot be ignored, especially the role of the life cycle in this context. The life cycle concept suggests that organizations, similar to organisms, are characterized by a life cycle from birth to death, with each stage potentially revealing marked variations in aspects of maturity, profitability, and growth [14,15,16]. The contingency theory suggests that an effective strategy must be connected to both the organization’s internal dynamics and external environmental changes. This implies that the success of digital transformation and its capacity to alleviate financial distress depends on a company’s specific stage in its life cycle [17]. Specifically, when a firm has sufficient capital savings and strong profitability, the effect of digital transformation on financial distress is insignificant [18]. Alternatively, when a firm’s strategic objective is its survival, it will adopt more cautious financial decisions, thus reducing the effect of digital transformation on financial distress [19]. Thus, failure to consider the life cycle will lead to an inability to accurately ascertain the extent to which digital transformation affects business performance. Yet, few studies have considered the role of the life cycle in corporate digital transformation. Thus, an additional aim of this research is to investigate how the corporate life cycle affects the moderating role of digital transformation in relation to corporate financial distress.
Overall, this study considers the phenomenon of financial distress experienced by numerous enterprises in the context of intensifying business competition. Accordingly, this study contributes to the field of digital transformation by identifying strategies that can be employed to mitigate financial distress, with a specific focus on the influence of the organizational life cycle in this context. Firstly, this study proposes the significance of adopting a dynamic capability view to examine the impact of digital transformation on financial distress. Previous research has typically concentrated on singular and static aspects of digital transformation (e.g., Fang et al., 2023; Liu et al., 2024) [20,21]. However, through a dynamic capability view, digital transformation affects various departments, levels, and connections within an organization. It reshapes the organization’s ability to adapt, innovate, and allocate resources effectively. Therefore, it is crucial to investigate the economic implications of digital transformation through the dynamic capability view, particularly how it can help mitigate financial distress. Secondly, this study contributes to articulating the corporate finance and digital transformation literature. While previous studies have tended to focus on predicting financial distress through a model comparison perspective (e.g., Huang and Yen, 2019; Mselmi et al., 2017) [22,23], this study extends the corporate finance and digital transformation genre by taking a dynamic capability view and proposing digital transformation as a viable solution for firms experiencing financial distress. Finally, we have decomposed digital transformation. We deepened the aggregate effect of digital transformation examined in the previous literature (e.g., Zhuo and Chen, 2023; Peng and Tao, 2022) by dividing digital transformation into three dimensions: strategy, technology, and application [24,25]. Furthermore, the technology dimension is deconstructed into three key dimensions: artificial intelligence, blockchain, cloud computing, and big data. This structured approach will meticulously illuminate the structural effect of digital transformation on financial distress.
In summary, this study fills this gap by extending the research on the consequences of digital transformation, while few studies have considered the contribution of digital transformation to financial distress, thus contributing to the field of digital transformation (e.g., Fang et al., 2023; Fang et al., 2024; Liu et al., 2024; Liu et al., 2024; Wang et al., 2023; Xu et al., 2022) [20,21,26,27,28,29]. Consequently, the aim of this study is to answer the following research questions (RQs):
RQ1. Can digital transformation help firms address financial distress?
RQ2. What is the role of the life cycle in the link between digital transformation and financial distress, and how does it do so?
To answer these RQs, an analysis was conducted using a panel dataset of 16,589 listed Chinese manufacturing companies from 2011 to 2020. Hierarchical linear modeling with multiple high-dimensional fixed effects was utilized. The primary results indicate that firms’ digital transformation implementation significantly mitigated financial distress. Secondly, the life cycle moderated the mitigation. Firms in the growth stage exert a greater effect on digital transformation and financial distress, whereas those in the declining stage have less impact on them. Thirdly, these two moderating mechanisms mainly affected the strategy dimension of digital transformation as well as AI and blockchain.
The remaining sections in this paper are structured as follows. Section 2 reviews the theoretical motivation for the hypotheses. Section 3 describes the data sample, variables, and methodology. Section 4 reports the results of the empirical analysis. Section 5 discusses the theoretical and practical implications and limitations of the study. Finally, Section 6 contains concluding remarks.

2. Literature Review and Theoretical Framework

2.1. Financial Distress

Financial distress is defined as a state of low cash flow in which a company incurs continuous losses [1]. It can be described as a type of business performance that is related to issues of financial risk, insolvency risk, and debt default [30,31,32]. Specifically, financial risk refers to a company’s inability to pay debt due to declining profitability, resulting in higher bond yields than credit rates. Insolvency risk involves screening firms unable to meet obligations due to liquidity issues and inefficient resource use. From a debt default perspective, breach of contract or missed loan repayments signal financial distress. Consequently, corporate financial distress can be described as a negative and persistent financial situation with characteristics such as increased cost of capital, inability to pay debts, and low liquidity.
To identify effective ways to alleviate financial distress, it is also demanding to identify the drivers of financial distress, which have been extensively analyzed in studies at both the macro and micro levels. At the macro level, the focus is on external factors, such as monetary policy shock [33], real economic cycle [34], and business environment [35]. Monetary policy adjustments include higher interest rates and lower money supply, with the former directly leading to higher financing costs for firms and the latter leading to lower liquidity for firms [36]. During economic recessions, when market demand shrinks, firms will face the double pressure of declining revenues and rising costs of credit supply [37]. Additionally, a poor business environment will exacerbate industrial monopolies and impede fair credit supply, which affects firms’ innovation [38]. These factors will trigger corporate financial distress. At the micro level, prior research has focused on the internal factors of firms, including corporate risk management, financial leverage, and capital structure [1,36,37]. If a firm’s risky assets are not properly invested, it will lead to a low total asset portfolio value and thus cause financial distress [1]. Leverage raises asset risk, default probability, and debt repayment issues, leading to financial distress [38]. Additionally, the higher the proportion of debt in a company’s financing, the greater the likelihood of financial distress [39].

2.2. Digital Transformation

Digital transformation refers to a planned process of change through digital technologies [40]. With changing markets, companies are increasingly integrating new digital technologies across various aspects of their operations to adapt to rapidly changing market demands and consumer preferences [27,41]. In this context, some scholars characterize a firm’s digital transformation as a reform within an organization through the integration of digital technologies [28,42].
The widespread adoption of digitalization has caused an increasing focus on the consequences of digital transformation, such as increasing business productivity [43], optimizing organizational management [44], and improving business economic efficiency [45]. Although the operational and strategic benefits of digital transformation are increasingly recognized, the specific mechanisms through which they influence financial performance remain under-explored, and a framework for developing dynamic capabilities remains lacking [46]. This is the focus of the present study, which will contribute to the literature that links digital transformation to firm performance by examining the process by which digital transformation affects financial distress based on a dynamic capability view.

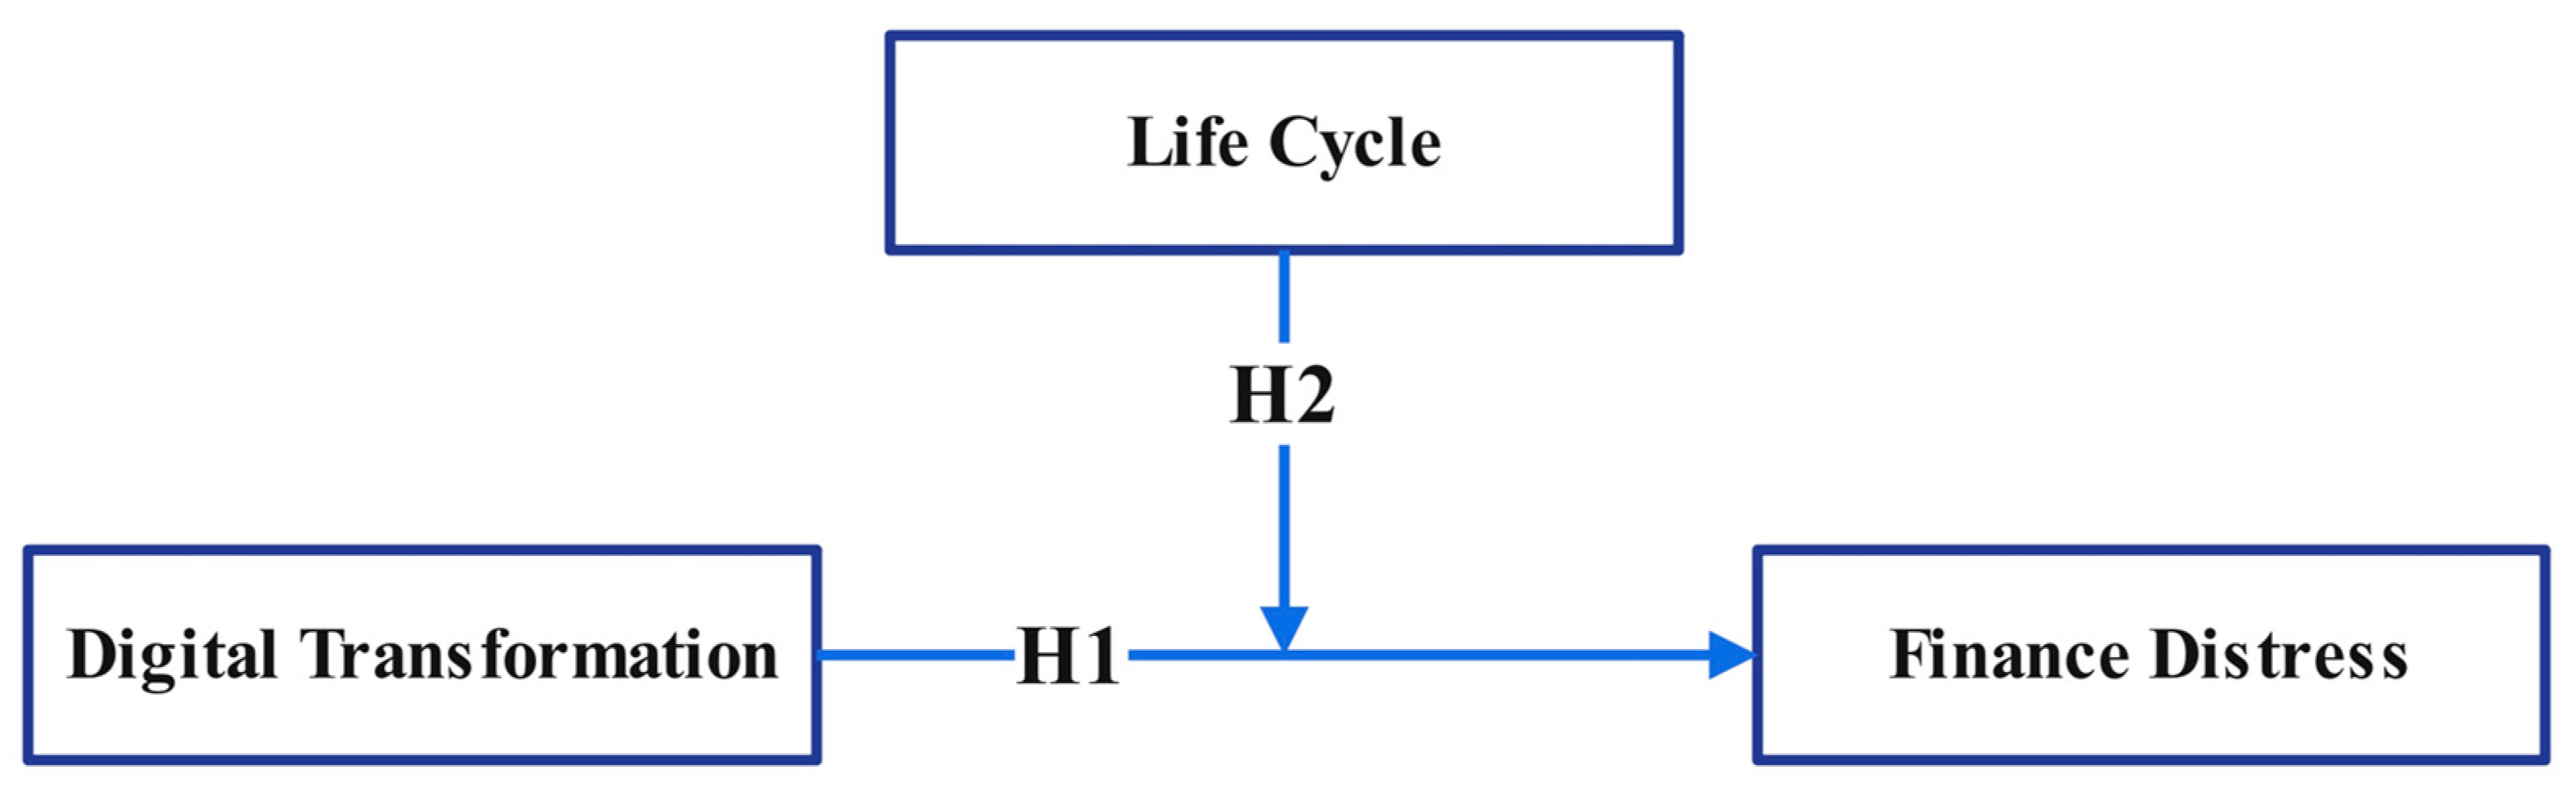
2.3. Theoretical Framework and Hypotheses Development

2.3.1. A Perspective on Digital Transformation and Financial Distress

The extant literature describes the dynamic capability view as the ability of an organization to generate, renew, and restructure internal and external resources to respond to a swiftly changing environment [22,47,48]. Drawing on Teece’s (2007) dynamic capability view framework, this study distinguishes the dynamic capability view into three pathways to examine the effect of digital transformation in financial distress, including adaptive capability, innovative capability, and resource allocation capability [49].
Firstly, through ex ante control, digital transformation can increase the adaptive capacity of the dynamic capability view to adapt to external uncertainty shocks, thereby reducing financial distress. This is particularly pertinent as the failure to obtain and respond to emerging market information is a significant contributor to financial distress [50]. In this way, digital transformation can be effective. Firms implementing digital transformation have more advanced technology to accurately collect and process important information [51]. Therefore, digital transformation enhances their adaptability in response to macroeconomic shocks, thereby reducing financial distress. On the one hand, adaptive capacity especially enables addressing evolving customer requirements by rapidly modifying or upgrading existing products and adjusting the market position of products. Thus, mitigating financial constraints arising from macro trends that might trigger financial distress [52,53]. On the other hand, adaptive capacity removes the negative aspects of shocks [54]. This creates benefits for the firm by shaping opportunities and threats and provides another protection against financial distress. To this end, digital transformation improves the adaptive capability of firms, thereby avoiding financial distress.
Secondly, through in-ante control, digital transformation enables firms to rapidly recover from financial distress by enhancing the innovative capability of the dynamic capability view. Digital transformation, as a way to enhance innovative capability, can be considered a useful approach to mitigate financial distress [55]. Digital transformation restructures the strategic position through the introduction of digital technologies, which reduces learning periods, fosters the development of new businesses, and consequently increases the ability to innovate. This, in turn, leads to innovative operating models and significant business value [56]. It also enables firms that are in financial distress to review market needs, target their business activities, and reshape their business model to resolve financial crises. Moreover, innovative capability related to improving professionalism also increases productivity and promotes effective resource allocation between sectors, which helps mitigate financial distress [57]. Therefore, we conclude that digital transformation improves the innovative capability of firms and enables their rapid recovery from financial distress.
Thirdly, through post ante control, digital transformation effectively averts the risk of a firm relapsing into financial distress by improving the resource allocation capability of the dynamic capability view, as it optimizes the efficiency of resource utilization within the firm and stabilizes its financial status. Digital transformation has advanced digital technology to corporations characterized by lower ownership costs, unique competitive advantages, and efficient information flow capabilities. This enables firms to identify resource gaps and overlaps, implement precise resource allocation, and thus align resources with a long-term development direction for their business, reducing financial distress [58,59]. Therefore, we conclude that digital transformation prevents firms from relapsing into financial distress by enhancing firm’s resource allocation capability. Based on the preceding arguments, the following hypothesis is proposed:
H1. 
Digital transformation is negatively related to financial distress.

2.3.2. The Moderating Role of Life Cycle

Various factors may influence the effectiveness of digital transformation in alleviating financial distress. Drawing on the contingency theory, this paper focuses on a firm’s life cycle, which is most often highlighted in the literature on organizational performance. The life cycle of a firm represents its current strategic objective and reveals the dynamics of its products, resources, and capabilities [60,61]. Changes during this cycle will have significant implications for the firm’s market position and profitability, making its life cycle essential for evaluating these aspects [62]. Following this logic, we posit that the effect of digital transformation on financial distress will vary during each life cycle stage.
Firms within the growth stage are usually described as having high heterogeneity and feature non-standardized products and unstable market share. Their primary strategic objective focuses on expanding their scale and capturing more market share [63]. However, these firms often face challenges related to internal entrusted agencies arising from immature management [64]. The introduction of digital transformation, which leverages digital technologies to centralize financial data, should reduce internal management costs [65,66]. It also enhances internal controls and risk management to ensure the effective allocation of resources and finance allocation, as well as substantially mitigating financial risks, thereby reducing the corporation’s financial distress. Following previous growth, the maturity stage is characterized by intense competition and robust market share that relate to abundant capital reserves and high profitability [67,68,69]. These firms typically have little need for digital transformation and are also less vulnerable to financial distress [70]. Accordingly, the effect of digital transformation on financial distress during the maturity stage is inferred as uncertain. During the declining stage, a firm experiences declining sales and profitability, leading it to undertake digital transformation for survival [71]. Digital transformation combats potential underperformance by exploring new business opportunities. However, considering that they are in a critical period, these firms tend to use greater caution when making financial decisions. Therefore, we conclude that digital transformation affects financial distress less during the declining stage than during the growth stage. In light of these discussions, the subsequent hypothesis is proposed:
H2. 
The life cycle moderates the relationship between digital transformation and financial distress such that the mitigating effects of digital transformation on financial distress are stronger for firms during the growth stage and weaker for firms during the declining stage.
In conclusion, the conceptual framework of this study is shown in Figure 1.

3. Methodology

3.1. Sample and Data Collection

This study focuses on how digital transformation can help alleviate the financial distress faced by Chinese listed manufacturing firms by employing panel data. Panel data have both cross-sectional and temporal dimensions. The utilization of panel data offers a distinct advantage in this analysis, as it skillfully addresses omitted variable bias due to unobserved individual heterogeneity. This aspect is particularly important given the potential influence of numerous unobservable factors on both digital transformation and financial distress.
In the data collection phase, this study initially gathered information on Chinese listed companies from the Choice database, which is a widely used source in economic and management studies, and calculated financial indicators [27]. Then, annual reports from the Shanghai Stock Exchange (SSE) and the Shenzhen Stock Exchange (SZSE) were examined to gain detailed insights into digital transformation. In the subsequent data processing phase, this research meticulously carried out the data cleaning step. Companies in the financial sector were excluded to maintain the integrity of the dataset. Next, this research merged multiple datasets based on ticker codes and years, ensuring that any observations missing key metrics were excluded to maintain the accuracy and completeness of the data. Ultimately, this study successfully constructed a panel dataset consisting of 2645 manufacturing firms in the Chinese A-share market from 2011–2020, comprising 16,589 firm-year observations. It is worth noting that 2021–2023 is an exceptional period due to the outbreak of COVID-19, which prevents the data from this period from accurately reflecting the circumstances of individual companies. We therefore chose to analyze the data up to 2020. This dataset is utilized for further formal analyses.

3.2. Variables

3.2.1. Financial Distress

According to Berger et al. (2017) and Karolyi (2018), this study analyzed Altman’s Z-score as a proxy for financial distress [72,73]. There are three important advantages to adopting this metric. Firstly, the calculation of the Z-score relies on financial statement data, and its calculation method is relatively straightforward, making this indicator prevalent in empirical applications [74,75,76]. Secondly, the application of the Altman Z-score extends beyond predicting bankruptcy, it is also useful for addressing with other types of financial distress [77]. Finally, a multitude of studies have validated that the Z-score demonstrates a remarkable capacity for accurately evaluating the financial health of companies [78,79,80].
The following step involves the calculation of the Z-score. Firstly, the necessary financial data was extracted from the companies’ financial statements, such as total assets, current assets, current liabilities, retained earnings, and profit before tax. Secondly, the Z-score is calculated by incorporating the financial metrics into the Z-score formula. According to the guidelines of Altman (2017), the calculation method is represented in Equation (2) [77]. Finally, the resulting Z-score was analyzed. In line with prior research, we consider a firm to be financially sound if its Z-score is greater than 2.67 and financially distressed if the Z-score is less than 1.81 [81,82].
Z - score = 1.2 × Working   Capital Total   Assets + 1.4 × Retained   Earnings Total   Assets +   3.3   × Earnings   before   intertest   and   Taxes   ( EBIT ) Total   Assets + 0.6   ×   Market   Value   of   Equity Book   Value   of   Liabilities + 0.999   ×   Net   Sales Total   Assets

3.2.2. Digital Transformation

In this research, data mining and text analysis were used to assess digital transformation through the following steps. Firstly, categorizing digital transformation, we divided digital transformation into three dimensions: strategy, technology, and application, then further subdivided the technology dimension of digital transformation into four segments, including AI, blockchain, cloud computing, and big data, to indicate the technology of digital transformation [26]. In concrete terms, digital transformation can be characterized in detail in the following three dimensions. In the strategy dimension of digital transformation, the strategy index is a measure of firms’ strengths in adopting the digital transformation strategy. In the technology dimension of digital transformation, the technology index conveys the respective extent of technology adoption from the four indexes of AI, blockchain, cloud computing, and big data. In the application dimension of digital transformation, the application index refers to the extent to which firms adopt applications.
Secondly, a digital transformation indicator was constructed. Based on the above, a dictionary comprised of 54 keywords about digital transformation was compiled, and six factors were synthesized to measure companies’ digital transformation indicators [28,83]. Table 1 summarizes the detailed initial lexicons for the digital transformation indexes.
Finally, digital transformation information was extracted. Based on annual reports of listed companies, which is a reliable source of information about a company’s current status, operational and strategic characteristics, and future outlook, the Term Frequency-Inverse Document Frequency (TF-IDF) approach was utilized to analyze the frequency of words [20,82,84,85,86]. According to Johnson et al. (2022), this text analysis approach uses term frequency (TF) to evaluate the importance of words and inverse document frequency (IDF) to control the number of documents in the whole set [87]. Thus, its accumulation is used to examine digital transformation. The specific calculation is as follows:
TF - ID F it = TF ( a ) it × IDF ( a ) = m ( a ) it M it × log N n ( a ) + 1
where TF ( a ) it is the term frequency (TF) of the keyword a in the keyword group that appears in the firm’s annual report in year t . IDF ( a ) is the inverse document frequency (IDF) of the annual report that includes the keyword a . m ( a ) it refers to the frequency of the keyword a in the firm i’s annual report in year t . M it refers to the whole number of terms of firm i in year t . N represents the whole number of all yearly reports. n ( a ) represents the quantities of annual reports containing the keyword a . The digital transformation values were multiplied by 10,000 to increase legibility.

3.2.3. Life Cycle

Building on prior investigations, cash flow was a valid proxy for a firm’s life cycle assessment and it was categorized into three stages: the growth stage, the maturity stage, and the declining stage [14,88]. According to Dickinson (2011), the cash flow serves as a crucial indicator of risk and profitability at each life cycle stage and derives from the aggregation of three types of net cash flow, including operating, investing, and financing [63]. This approach minimizes the interference of industry differences and ensures a more objective sample division. Specifically here, the growth stage is defined as a stage where investment cash flows are negative, and financing cash flows are positive. During the maturity stage, firms typically show positive operating cash flows, negative investing cash flows, and negative financing cash flows. We define the rest of the case as the declining stage.

3.2.4. Control Variable

Several variables were selected to control for externalities [1,22,89,90]. Specifically, size is represented by the natural logarithm of the firm’s total assets. Age is the number of years since a firm was established. Leve is the proportion of total liabilities to total assets. Profitability is the ratio of net profit to total assets. Current is the ratio of current assets to current liabilities. Notably, cash is calculated by adding monetary funds to trading financial assets and then dividing this sum by current liabilities. Quick is calculated from the difference between current assets and net inventory divided by current liabilities. Finally, concentration refers to the percentage of ownership held by the largest shareholder. Table 2 provides the variable definitions and Table 3 provides a comprehensive overview of the sample.

3.3. Analysis

Firstly, following the preceding analysis, the specific statistical model is constructed by substituting the variables accordingly.
F i n a n c e _ d i s t r e s s i , t = β 0 + β 1 D i g i t a l _ t r a n s f o r m a t i o n i , t + β 2 l i f e _ c y c l e i , t + β n C o n t r o l i , t + F i x e d _ y e a r + F i x e d _ i n d u s t r y + ε i , t
where F i n a n c e _ d i s t r e s s i , t , D i g i t a l _ t r a n s f o r m a t i o n i , t , and l i f e _ c y c l e i , t are firm i ’s financial distress, digital transformation, and life cycle in year t , respectively. The control variables ( C o n t r o l i , t ) are Size, Age, Leverage, Profitability, Current, Cash, Quick, and Concentration. Additionally, β 0 , β 1 , β 2 , and β n represent the vectors of the variables’ estimated parameter values; β 0 is a constant item, and ε i , t denotes an error term. F i x e d _ y e a r and F i x e d _ i n d u s t r y represent the fixed effects of year and industry, respectively.
Secondly, hierarchical modeling was conducted using the logit command in STATA to examine the relationships among digital transformation, financial distress, and life cycle. The selection of logistic regression analysis offers three significant advantages. Firstly, logistic regression analysis is exceptionally adept at modeling binary dependent variables. Utilizing the logistic regression connection function allows for the direct estimation of the probability that an observation falls into a particular category. Moreover, the inherent flexibility of logistic regression is a notable asset, as it can seamlessly integrate both continuous and categorical independent variables, thereby effectively representing the variety of predictors found within the dataset.
Furthermore, logistic regression is capable of accommodating non-linear relationships between dependent and independent variables, which enhances the explanatory power of the model. In conducting this logistic regression analysis, we recognized that there is an ordered relationship between the variables at each level, which involves the gradual inclusion of variables for an increase in explanatory power. At the first level, we included control variables such as size, age, leverage, profitability, current, cash, quick, and concentration to examine their fundamental effects on the dependent variable. Then, in the second layer, we included indicators of digital transformation. In the third layer, we introduced life cycle indicators, which include growth, maturity, and decline stages. Finally, the fourth layer incorporated the interaction term of digital transformation and life cycle stages. This structured approach allows us to effectively consider the influence of lower-level variables while analyzing the higher-level variables, which leads to an increase in the binary dependent variable model’s illustrative power.
The following step was to control for both industry and year fixed effects, which allowed estimation using linear regressions with high-dimensional fixed effects [91]. Furthermore, by adjusting the clustered standard errors at the industry and year level, we obtain more robust coefficients to test our hypotheses. Finally, the correlation results support the idea that multicollinearity is not a significant concern in this study. The correlation matrix is shown in Table 4.

4. Results

Main Results

The main results of the hierarchical regression analyses are presented in Table 5. In the first step, the control variables (Size, Age, Leverage, Profitability, Current, Cash, Quick, and Concentration) were entered to estimate their effects on financial distress (Model 1). In step 2, the dependent variable and the control variables were regressed, which explains their effects on financial distress (Model 2). The third step tested the effects of three life cycle stages in Model 3, Model 5, and Model 7, respectively. Finally, the interaction term was introduced to determine the moderating role of three life cycle stages in Model 4, Model 6, and Model 8. Notably, all specifications include industry (Ind FE) and year (Year FE) fixed effects.
Column (1) reports the effects of eight control variables. The results indicate that Size, Leverage, and Cash have a significantly positive effect on financial distress, while Profitability, Current, and Concentration negatively affect financial distress. Column (2) indicates digital transformation (β = −0.0378, p < 0.01) to be statistically significant, supporting that digital transformation leads to a decline in financial distress as stated in Hypothesis 1.
The interaction effects illustrated in the remaining columns strongly support that the relationship between digital transformation and financial distress is moderated by the firm life cycle. In Columns (3) and (7), the coefficients for the growth stage and the declining stage are positive and significant, which indicates that an increase in the life cycle of these two stages leads to higher financial distress. In contrast, in Column (5), the maturity stage has a significant negative association with financial distress. Columns (4), (6), and (8) present the outcomes of the moderated hierarchical regression analysis for all hypothesized interactive effects across the three life cycle stages, including the growth stage, the maturity stage, and the declining stage. Column (4) indicates that the interaction of digital transformation and the growth stage is negative and significant (β = −0.0529, p < 0.05). This result illustrates that the negative relationship between digital transformation and the financial distress effect is negatively moderated by the life cycle of the growth stage, which implies that the mitigating effect of digital transformation on financial distress is stronger for firms during the growth stage. Column (8) shows that the interaction of financial distress and the declining stage is positive and significant (β = 0.0815, p < 0.01). Thus, the mitigating effect of digital transformation on financial distress is weaker for firms during the declining stage. These findings all support Hypothesis 2.
Table 6 and Table 7 report the results of the sub-dimensions, and Table 8, Table 9, Table 10 and Table 11 report the results of the four technology dimension categories. Model 1 is the baseline model and includes all eight control variables. Model 2 adds interested variables progressively. Models 4, 6, and 8, introduce the interaction effects of digital transformation with the variables of interest.
Table 6 presents the influence of the strategy dimension of digital transformation on financial distress and the moderating role of the life cycle. As shown in Column (2), the strategy dimension has a statistically significant, negative effect (β = −0.2567, p < 0.01) on financial distress. The results in Column (4) reveal that the interaction between the strategy dimension and the growth stage is negative and significant (β = −0.0521, p < 0.01). This suggests that the mitigating effect will be stronger between the strategy dimension and financial distress during the firms’ growth stage. Column (8) shows the interaction of the strategy dimension and the declining stage is positive and significant (β = 0.0463, p < 0.1). This indicates a weaker mitigating effect of the strategy dimension on financial distress during firms’ declining stage.
Table 7 considers the effect of the application dimension of digital transformation on financial distress. However, as shown in Column (2), the coefficient is negative but statistically insignificant. Thus, the influence between the application dimension and financial distress received no support.
Table 8, Table 9, Table 10 and Table 11 display the analysis results for AI, blockchain, cloud computing, and big data, respectively.
As reported in Column (2) of Table 8 and Table 11, a negative and significant coefficient is observed on AI (β = −0.2430, p < 0.01) and big data (β = −0.0595, p < 0.1), indicating that firms with higher ability to utilize AI and big data obtain better mitigation of financial distress. Specifically, AI is negatively significant in the growth stage of the life cycle (β = −0.0350, p < 0.1) while positively significant in the decline stage (β = 0.0688, p < 0.05). These provide support that a stronger mitigating effect of the AI in the growth stage and a weaker mitigation of it in the decline stage. During the growth stage, AI can assist organizations in recognizing potential financial risks through advanced risk management and prediction, enabling them to implement suitable strategies to prevent or alleviate these risks. Conversely, in the decline stage, companies may encounter challenges such as capital shortages and talent attrition, which hinder their ability to invest in and utilize AI technologies effectively. Similarly, big data also exhibits a negative significance in the growth stage (β = −0.0588, p < 0.01) and a positive significance in the decline stage (β = 0.0551, p < 0.05), providing the notion that big data has a stronger mitigating effect during the growth phase and a weaker effect during the decline phase. In the growth stage, big data provides information and analytical resources that enable companies to make quick decisions to capitalize on market opportunities. Conversely, during the decline stage, while big data can provide some informational support, companies may face increased competition, which can make it difficult to fundamentally change the market position and competitive landscape of these companies.
Column (2) in Table 9 reports that the effect of blockchain on financial distress is positive, while Column (2) in Table 10 reports that the effect of cloud computing on financial distress is negative. Yet, neither is statistically significant, and no support can be provided for the effect of blockchain or cloud computing on financial distress.

5. Discussion

Financial distress can be costly because it impedes access to credit, increases costs associated with stakeholder relationships, and misses opportunities to gain market share [89,92,93,94]. This study theorizes and investigates how firms mitigate financial distress with the implementation of digital transformation and how firms’ life cycles moderate digital transformation’s contribution. By empirically analyzing the panel dataset from Chinese manufacturing firms between 2011 and 2020, we found firstly that digital transformation application significantly inhibits financial distress. Secondly, the life cycle moderated the negative relationship between firms’ digital transformation and financial distress. Specifically, growth-stage firms experience a stronger effect between digital transformation and financial distress, while declining-stage firms experience a weaker effect between them. Furthermore, the moderating mechanisms of growth stage and declining stage firms mainly affect digital transformation’s strategy dimension and categories of AI and big data. Notably, these results expand research on the outcomes of digital transformation. Previous research has proposed the benefit of digital transformation to firms in multiple ways, such as digitalization of operations, management, and accounting [10,95]. This study further employs a dynamic capability view to examine the impact of digital transformation on organizational capabilities. It further distinctly outlines the path of digital transformation in mitigating financial distress. Meanwhile, building on prior research focusing on the broad effects of digital transformation, this paper enhances the comprehension of digital transformation implementation strategies by analyzing the structural effects of digital transformation to explore its specific impact on financial distress [24,28,45]. Thus, this research provides meaningful contributions to provide important theoretical and practical contributions.

5.1. Theoretical Implications

We note that several studies from various countries have provided insights into the interplay between digital transformation, corporate finance, and their combined effects (Chouaibi et al., 2022; ElBannan, 2021; Gökalp and Martinez, 2021) [96,97,98]. For example, utilizing a sample from Arab spring countries, ElBannan (2021) investigates the factors contributing to financial distress and the influence of the corporate life cycle [97]. Chouaibi et al. (2022) demonstrated that the financial performance in Tunisia improves in the context of digital transformation [96]. This research explores the complex relationship between digital transformation, corporate finance, and the life cycle. This study further decomposes the sub-dimensions of digital transformation to assess its impact across various facets. This study also recognizes that firms exhibit distinct characteristics at different stages of their life cycle, thus disaggregating the life cycle of firms to facilitate a more precise analysis of the relationships between these variables. Therefore, the primary theoretical contributions of this research are three-fold.
Firstly, this study contributes to the interface between corporate finance and digital transformation literature by finding that digital transformation alleviates financial distress. Although financial distress, which is a crucial theme of corporate survival and development, has been extensively studied in the corporate finance literature, prior literature has emphasized the significance of financial distress prediction, which only offers temporary relief and suffers from prediction biases, hence incurring high costs [89,94,99]. Based on the dynamic capability view, we offer another solution from a corporate strategy perspective. This study supports that firms experiencing financial distress require strategic transformation to enhance their capacity for adaption, innovation, and resource allocation [100,101]. With this in mind, this study broadens these streams of research by investigating the effects of digital transformation on financial distress. This not only broadens the scope of the application of digital transformation but also provides feasible solutions to address financial distress.
The second theoretical contribution is exploring the significance of different sub-dimensions’ digital transformation indexes on financial distress by finding that among the six digital transformation index sub-dimensions, strategy dimension, AI, and big data are the three most crucial features affecting financial distress, which differ from findings of other studies. Previous studies have highlighted the effect of digital transformation on various business aspects, including business operations, organization structure, and management practices, but have overlooked the significance of its sub-dimensions [102,103,104]. This study’s detailed analysis reveals specific weakening factors of financial distress and elucidates its various sub-levels. These findings are consistent with reality as the adoption of strategy dimension, AI, and big data is more widespread than that of application dimension, blockchain, and cloud computing. Thus, the application of digital transformation requires all those involved to make relevant organizational changes, which presents implementation challenges [105]. Although the application of blockchain and cloud computing offer various benefits, companies must prioritize developing necessary organizational and management strategies and policies for successful implementation, which will waste valuable resources [106,107].
Thirdly, this study complements the recent literature on life cycles by explaining the moderating role of life cycles in digital transformation on financial distress. While scholars have highlighted that the corporate life cycle has a valuable effect on management and business strategy, such as strategic financing decisions, corporate acquisitions, and corporate venturing [90,108,109], there is insufficient research on the role of the life cycle in digital transformation and financial distress. This study examines how digital transformation and its sub-dimensions influence financial distress during different stages of a firm’s life cycle. The results reveal diverse outcomes, indicating that growth-stage firms have a greater need for digital transformation, which plays a vital role in alleviating financial distress. In contrast, for declining-stage firms, digital transformation offers a limited effect on mitigating financial distress. These findings provide valuable insights into the optimal timing for implementing digital transformation and the effective methods to address financial distress.

5.2. Practical Implications

These results also draw significant practical implications for managers. Firstly, they demonstrate a negative relationship between digital transformation and financial distress. From a dynamic capability view perspective, we suggest firms implement digital transformation to receive effective market information, which is essential for reducing unnecessary capital losses [102,110]. Although there are various ways to create short-term profits, such as cost control, inventory management, and short-term investment, it is more important for firms to actively seize opportunities and shape their core competitiveness. In particular, firms must position their business activities and promote resource liquidity by leveraging digital technologies. Therefore, firm managers must adapt to the digital age and adopt a digital transformation strategy to reduce financial distress.
Secondly, this analysis demonstrates the moderating role of the life cycle in the relationship between digital transformation and financial distress. Especially during the growth stage of the life cycle, adopting digital transformation can have a greater mitigating effect on financial distress. In fact, during the growth stage, firms require digital transformation to provide financial support for rapid development and also to build competitiveness for intense market changes [111,112]. Therefore, this study suggests that company management strategically use digital capabilities based on their life cycle stage to mitigate financial distress.
Thirdly, this study reveals that digital transformation strategy, AI, and big data are the three primary elements of digital transformation that alleviate financial distress. Companies should actively utilize digital technologies to construct a strategic blueprint that aligns with market trends and their own strengths to achieve changes, such as business process optimization, product innovation, and organizational structure changes [113]. Moreover, AI and big data may predict short-term financial distress and effectively control corporate risks [114,115,116,117]. Therefore, companies must clarify their digital transformation strategy and increase their application of AI and big data to alleviate financial distress and achieve sustainable growth.

5.3. Limitations and Future Research Prospects

This study is not without limitations. Firstly, it focuses on the direct effect of digital transformation on financial distress and expects further research on the indirect effect of digital transformation on financial distress. Secondly, it only adopted a single moderating condition, life cycle, to capture digital transformation’s ability to reduce financial distress. We encourage future research to investigate other moderating variables and their mechanisms. This will increase the understanding of the importance of business reforms. Finally, this study was conducted based on a sample of Chinese firms, which restricts its generalizability to other emerging markets and developed economies. In this respect, we encourage more research to validate our findings and analyze the potential heterogeneity across emerging market economies and between emerging market economies and developed economies. These are all important questions warranting future research.

6. Conclusions

Based on the dynamic capability view and contingency theory, this study extended the research stream by examining the role of digital transformation in mitigating financial distress and investigating the moderating effect of the life cycle on this relationship. These findings indicate that digital transformation is negatively associated with financial distress, indicating that digital transformation mitigates financial distress. Additionally, this study supports this perspective and reveals the moderating role of the life cycle in digital transformation and financial distress. Specifically, the mitigating effect of digital transformation on financial distress is stronger during the growth stage and weaker during the declining stage.
Based on the above conclusions, policy implications are made: Firstly, corporations should prioritize the active implementation of digital transformation. This process is crucial for enterprises, especially those facing financial challenges. They should invest strategically to facilitate the execution of digital transformation initiatives. Seizing the opportunities presented by digital transformation serves as a vital strategy to enhance financial performance and compete in market competition.
Secondly, corporations should focus on their life cycle characteristics to develop tailored policies. Based on their life cycle stage, including the growth stage, maturity stage, and declining stage, companies should select the digital transformation strategy that aligns with their specific requirement. For instance, firms in the growth stage should receive increased resources and support to effectively utilize digital transformation to mitigate financial challenges. Conversely, companies in the decline stage should adopt a cautious investment approach to guarantee the effectiveness and sustainability of their digital transformation efforts.
Finally, AI and big data significantly influence enterprises during both the growth and decline stages. Enterprises in the growth stage should proactively adopt AI and big data technologies to elevate their intelligence and data analysis capabilities. By leveraging these technologies, they can streamline production processes, which enhances product quality and lowers operational costs, ultimately leading to a boost in their competitive edge. Meanwhile, enterprises in the decline stage should employ AI and big data for comprehensive analysis to accurately target customer segments, which uncover potential market opportunities and pathways for growth, leading to business transformation and advancement.

Author Contributions

Conceptualization, J.Z., Y.Y. and Z.S.; methodology, J.Z. and Y.Y.; software, Z.Z. and Z.S.; validation, J.Z. and Z.S.; formal analysis, J.Z., Z.W. and J.S.; investigation, J.Z., Z.Z. and Z.S.; resources, J.Z. and Z.Z.; data curation, Y.Y., Z.W. and J.S.; writing—original draft preparation, J.Z., Y.Y. and Z.W.; writing—review and editing, J.Z., Y.Y., J.S. and Z.S.; visualization, Y.Y. and Z.Z.; supervision, J.Z.; project administration, Z.S. All authors have read and agreed to the published version of the manuscript.

Funding

This research received no external funding.

Data Availability Statement

The data that support the findings of this study are available from the corresponding author upon reasonable request.

Conflicts of Interest

The authors declare no conflicts of interest.

References

  1. Purnanandam, A. Financial distress and corporate risk management: Theory and evidence. J. Financ. Econ. 2008, 87, 706–739. [Google Scholar] [CrossRef]
  2. Aiyar, S.; Calomiris, C.W.; Wieladek, T. Bank capital regulation: Theory, empirics, and policy. IMF Econ. Rev. 2015, 63, 955–983. [Google Scholar] [CrossRef]
  3. Delis, M.; Galariotis, E.; Monne, J. Economic condition and financial cognition. J. Bank. Financ. 2021, 123, 106035. [Google Scholar] [CrossRef]
  4. Madrid-Guijarro, A.; García-Pérez-de-Lema, D.; Van Auken, H. An analysis of non-financial factors associated with financial distress. Entrep. Reg. Dev. 2011, 23, 159–186. [Google Scholar] [CrossRef]
  5. Hanelt, A.; Bohnsack, R.; Marz, D.; Antunes Marante, C. A systematic review of the literature on digital transformation: Insights and implications for strategy and organizational change. J. Manag. Stud. 2021, 58, 1159–1197. [Google Scholar] [CrossRef]
  6. Hess, T.; Matt, C.; Benlian, A.; Wiesböck, F. Options for formulating a digital transformation strategy. MIS Q. Exec. 2016, 15, 123. [Google Scholar]
  7. Zhu, Y.; Yu, D. Digital transformation and firms’ bargaining power: Evidence from China. J. Bus. Res. 2024, 183, 114851. [Google Scholar] [CrossRef]
  8. Van Nguyen, T.; Pham, H.T.; Ha, H.M.; Tran, T.T.T. An integrated model of supply chain quality management, Industry 3.5 and innovation to improve manufacturers’ performance—A case study of Vietnam. Int. J. Logist. Res. Appl. 2024, 27, 261–283. [Google Scholar] [CrossRef]
  9. Vogel, R.; Güttel, W.H. The dynamic capability view in strategic management: A bibliometric review. Int. J. Manag. Rev. 2013, 15, 426–446. [Google Scholar] [CrossRef]
  10. Knudsen, D.R. Elusive boundaries, power relations, and knowledge production: A systematic review of the literature on digitalization in accounting. Int. J. Account. Inf. Syst. 2020, 36, 100441. [Google Scholar] [CrossRef]
  11. Kraus, S.; Durst, S.; Ferreira, J.J.; Veiga, P.; Kailer, N.; Weinmann, A. Digital transformation in business and management research: An overview of the current status quo. Int. J. Inf. Manag. 2022, 63, 102466. [Google Scholar] [CrossRef]
  12. Matarazzo, M.; Penco, L.; Profumo, G.; Quaglia, R. Digital transformation and customer value creation in Made in Italy SMEs: A dynamic capabilities perspective. J. Bus. Res. 2021, 123, 642–656. [Google Scholar] [CrossRef]
  13. Warner, K.S.; Wäger, M. Building dynamic capabilities for digital transformation: An ongoing process of strategic renewal. Long Range Plan. 2019, 52, 326–349. [Google Scholar] [CrossRef]
  14. Atif, M.; Liu, B.; Nadarajah, S. The effect of corporate environmental, social and governance disclosure on cash holdings: Life-cycle perspective. Bus. Strategy Environ. 2022, 31, 2193–2212. [Google Scholar] [CrossRef]
  15. Durana, P.; Michalkova, L.; Privara, A.; Marousek, J.; Tumpach, M. Does the life cycle affect earnings management and bankruptcy? Oeconomia Copernic. 2021, 12, 425–461. [Google Scholar] [CrossRef]
  16. Phelps, R.; Adams, R.; Bessant, J. Life cycles of growing organizations: A review with implications for knowledge and learning. Int. J. Manag. Rev. 2007, 9, 1–30. [Google Scholar] [CrossRef]
  17. Trkman, P. The critical success factors of business process management. Int. J. Inf. Manag. 2010, 30, 125–134. [Google Scholar] [CrossRef]
  18. Liu, Y.; Wei, H. Digital transformation and enterprise financial asset allocation. Appl. Econ. 2024, 1–18. [Google Scholar] [CrossRef]
  19. Zhao, X.; Huang, Q.; Zhang, H.; Zhao, L. Can digital transformation in manufacturing enterprises mitigate financial distress? Technol. Anal. Strateg. Manag. 2023, 1–17. [Google Scholar] [CrossRef]
  20. Liu, F.; Fang, M.; Xiao, S.; Shi, Y. Mitigating bullwhip effect in supply chains by engaging in digital transformation: The moderating role of customer concentration. Ann. Oper. Res. 2024, 1–22. [Google Scholar] [CrossRef]
  21. Fang, M.; Liu, F.; Xiao, S.; Park, K. Hedging the bet on digital transformation in strategic supply chain management: A theoretical integration and an empirical test. Int. J. Phys. Distrib. Logist. Manag. 2023, 53, 512–531. [Google Scholar] [CrossRef]
  22. Huang, Y.P.; Yen, M.F. A new perspective of performance comparison among machine learning algorithms for financial distress prediction. Appl. Soft Comput. 2019, 83, 105663. [Google Scholar] [CrossRef]
  23. Mselmi, N.; Lahiani, A.; Hamza, T. Financial distress prediction: The case of French small and medium-sized firms. Int. Rev. Financ. Anal. 2017, 50, 67–80. [Google Scholar] [CrossRef]
  24. Peng, Y.; Tao, C. Can digital transformation promote enterprise performance?—From the perspective of public policy and innovation. J. Innov. Knowl. 2022, 7, 100198. [Google Scholar] [CrossRef]
  25. Zhuo, C.; Chen, J. Can digital transformation overcome the enterprise innovation dilemma: Effect, mechanism and effective boundary. Technol. Forecast. Soc. Change 2023, 190, 122378. [Google Scholar] [CrossRef]
  26. Liu, W.; Liu, C.; Luo, J.; Liu, F. How does digital transformation promote total factor productivity? Strategy, technology, and application. Manag. Decis. Econ. 2024, 45, 2739–2750. [Google Scholar] [CrossRef]
  27. Fang, M.; Yu, Y.; Park, K.; Liu, F.; Xiao, S.S.; Shi, Y. Supply chain relationship dependencies and circular economy performance: The contingency role of digitalization capability. J. Purch. Supply Manag. 2024, 30, 100902. [Google Scholar] [CrossRef]
  28. Wang, M.; Yu, Y.; Liu, F. Does digital transformation curb the formation of zombie firms? A machine learning approach. Technol. Anal. Strateg. Manag. 2023, 1–17. [Google Scholar] [CrossRef]
  29. Xu, J.; Haris, M.; Liu, F. Intellectual capital efficiency and firms’ financial performance based on business life cycle. J. Intellect. Cap. 2022, 24, 653–682. [Google Scholar] [CrossRef]
  30. Gordon, M.J. Towards a theory of financial distress. J. Financ. 1971, 26, 347–356. [Google Scholar] [CrossRef]
  31. Johnston, R.; Markov, S.; Ramnath, S. Sell-side debt analysts. J. Account. Econ. 2009, 47, 91–107. [Google Scholar] [CrossRef]
  32. White, M.J. The corporate bankruptcy decision. J. Econ. Perspect. 1989, 3, 129–151.e10. [Google Scholar] [CrossRef]
  33. Bhamra, H.S.; Fisher, A.J.; Kuehn, L.A. Monetary policy and corporate default. J. Monet. Econ. 2011, 58, 480–494. [Google Scholar] [CrossRef]
  34. Benmelech, E.; Frydman, C.; Papanikolaou, D. Financial frictions and employment during the great depression. J. Financ. Econ. 2019, 133, 541–563. [Google Scholar] [CrossRef]
  35. Demirguc-Kunt, A.; Love, I.; Maksimovic, V. Business environment and the incorporation decision. J. Bank. Financ. 2006, 30, 2967–2993. [Google Scholar] [CrossRef]
  36. Alves, P.; Couto, E.B.; Francisco, P.M. Board of directors’ composition and capital structure. Res. Int. Bus. Financ. 2015, 35, 1–32. [Google Scholar] [CrossRef]
  37. Garlappi, L.; Yan, H. Financial distress and the cross-section of equity returns. J. Financ. 2011, 66, 789–822. [Google Scholar] [CrossRef]
  38. Cathcart, L.; Dufour, A.; Rossi, L.; Varotto, S. The differential impact of leverage on the default risk of small and large firms. J. Corp. Financ. 2020, 60, 101541. [Google Scholar] [CrossRef]
  39. Kim, S.Y.; Upneja, A. Predicting restaurant financial distress using decision tree and AdaBoosted decision tree models. Econ. Model. 2014, 36, 354–362. [Google Scholar] [CrossRef]
  40. Brodeur, J.; Pellerin, R.; Deschamps, I. Collaborative approach to digital transformation (CADT) model for manufacturing SMEs. J. Manuf. Technol. Manag. 2022, 33, 61–83. [Google Scholar] [CrossRef]
  41. Richard, P.J.; Devinney, T.M. Modular strategies: B2B technology and architectural knowledge. Calif. Manag. Rev. 2005, 47, 86–113. [Google Scholar] [CrossRef]
  42. AlNuaimi, B.K.; Singh, S.K.; Ren, S.; Budhwar, P.; Vorobyev, D. Mastering digital transformation: The nexus between leadership, agility, and digital strategy. J. Bus. Res. 2022, 145, 636–648. [Google Scholar] [CrossRef]
  43. Tan, T.F.; Netessine, S. At your service on the table: Impact of tabletop technology on restaurant performance. Manag. Sci. 2020, 66, 4496–4515. [Google Scholar] [CrossRef]
  44. Aben, T.A.; van der Valk, W.; Roehrich, J.K.; Selviaridis, K. Managing information asymmetry in public–private relationships undergoing a digital transformation: The role of contractual and relational governance. Int. J. Oper. Prod. Manag. 2021, 41, 1145–1191. [Google Scholar] [CrossRef]
  45. Li, L. Digital transformation and sustainable performance: The moderating role of market turbulence. Ind. Mark. Manag. 2022, 104, 28–37. [Google Scholar] [CrossRef]
  46. Ghosh, S.; Hughes, M.; Hodgkinson, I.; Hughes, P. Digital transformation of industrial businesses: A dynamic capability approach. Technovation 2022, 113, 102414. [Google Scholar] [CrossRef]
  47. Lütjen, H.; Schultz, C.; Tietze, F.; Urmetzer, F. Managing ecosystems for service innovation: A dynamic capability view. J. Bus. Res. 2019, 104, 506–519. [Google Scholar] [CrossRef]
  48. Teece, D.J.; Pisano, G.; Shuen, A. Dynamic capabilities and strategic management. Strateg. Manag. J. 1997, 18, 509–533. [Google Scholar] [CrossRef]
  49. Teece, D.J. Explicating dynamic capabilities: The nature and microfoundations of (sustainable) enterprise performance. Strateg. Manag. J. 2007, 28, 1319–1350. [Google Scholar] [CrossRef]
  50. Kroh, J.; Luetjen, H.; Globocnik, D.; Schultz, C. Use and efficacy of information technology in innovation processes: The specific role of servitization. J. Prod. Innov. Manag. 2018, 35, 720–741. [Google Scholar] [CrossRef]
  51. Sestino, A.; Prete, M.I.; Piper, L.; Guido, G. Internet of Things and Big Data as enablers for business digitalization strategies. Technovation 2020, 98, 102173. [Google Scholar] [CrossRef]
  52. Livdan, D.; Sapriza, H.; Zhang, L. Financially constrained stock returns. J. Financ. 2009, 64, 1827–1862. [Google Scholar] [CrossRef]
  53. Lu, Y.; Zhou, L.; Bruton, G.; Li, W. Capabilities as a mediator linking resources and the international performance of entrepreneurial firms in an emerging economy. J. Int. Bus. Stud. 2010, 41, 419–436. [Google Scholar] [CrossRef]
  54. Atzmon, M.B.; Vanderstraeten, J.; Albers, S. Small-firm growth-enabling capabilities: A framework for young technology-based firms. Technovation 2022, 117, 102542. [Google Scholar] [CrossRef]
  55. Yang, G.; Nie, Y.; Li, H.; Wang, H. Digital transformation and low-carbon technology innovation in manufacturing firms: The mediating role of dynamic capabilities. Int. J. Prod. Econ. 2023, 263, 108969. [Google Scholar] [CrossRef]
  56. Barua, A.; Konana, P.; Whinston, A.B.; Yin, F. An empirical investigation of net-enabled business value. MIS Q. 2004, 28, 585–620. [Google Scholar] [CrossRef]
  57. Cassiman, B.; Golovko, E. Innovation and internationalization through exports. J. Int. Bus. Stud. 2011, 42, 56–75. [Google Scholar] [CrossRef]
  58. Gopalakrishna-Remani, V.; Byun, K.A.; Doty, D.H. The impact of employees’ perceptions about top management engagement on sustainability development efforts and firm performance. Bus. Strategy Environ. 2022, 31, 2964–2977. [Google Scholar] [CrossRef]
  59. Jones, C.I.; Tonetti, C. Nonrivalry and the Economics of Data. Am. Econ. Rev. 2020, 110, 2819–2858. [Google Scholar] [CrossRef]
  60. Lynall, M.D.; Golden, B.R.; Hillman, A.J. Board composition from adolescence to maturity: A multitheoretic view. Acad. Manag. Rev. 2003, 28, 416–431. [Google Scholar] [CrossRef]
  61. Thietart, R.A.; Vivas, R. An empirical investigation of success strategies for businesses along the product life cycle. Manag. Sci. 1984, 30, 1405–1423. [Google Scholar] [CrossRef]
  62. Kliestik, T.; Novak Sedlackova, A.; Bugaj, M.; Novak, A. Stability of profits and earnings management in the transport sector of Visegrad countries. Oeconomia Copernic. 2022, 13, 475–509. [Google Scholar] [CrossRef]
  63. Dickinson, V. Cash flow patterns as a proxy for firm life cycle. Account. Rev. 2011, 86, 1969–1994. [Google Scholar] [CrossRef]
  64. Park, S.M. The Effects of Personnel Reform Systems on Georgia State Employees’ Attitudes: An empirical analysis from a principal–agent theoretical perspective. Public Manag. Rev. 2010, 12, 403–437. [Google Scholar] [CrossRef]
  65. Ceipek, R.; Hautz, J.; De Massis, A.; Matzler, K.; Ardito, L. Digital transformation through exploratory and exploitative internet of things innovations: The impact of family management and technological diversification. J. Prod. Innov. Manag. 2021, 38, 142–165. [Google Scholar] [CrossRef]
  66. Menz, M.; Kunisch, S.; Birkinshaw, J.; Collis, D.J.; Foss, N.J.; Hoskisson, R.E.; Prescott, J.E. Corporate Strategy and the Theory of the Firm in the Digital Age. J. Manag. Stud. 2021, 58, 1695–1720. [Google Scholar] [CrossRef]
  67. Carnes, C.M.; Chirico, F.; Hitt, M.A.; Huh, D.W.; Pisano, V. Resource orchestration for innovation: Structuring and bundling resources in growth-and maturity-stage firms. Long Range Plan. 2017, 50, 472–486. [Google Scholar] [CrossRef]
  68. Doha, A.; Das, A.; Pagell, M. The influence of product life cycle on the efficacy of purchasing practices. Int. J. Oper. Prod. Manag. 2013, 33, 470–498. [Google Scholar] [CrossRef]
  69. Karniouchina, E.V.; Carson, S.J.; Short, J.C.; Ketchen, D.J., Jr. Extending the firm vs. industry debate: Does industry life cycle stage matter? Strateg. Manag. J. 2013, 34, 1010–1018. [Google Scholar] [CrossRef]
  70. Zhai, H.; Yang, M.; Chan, K.C. Does digital transformation enhance a firm’s performance? Evidence from China. Technol. Soc. 2022, 68, 101841. [Google Scholar] [CrossRef]
  71. La Rocca, M.; La Rocca, T.; Cariola, A. Capital structure decisions during a firm’s life cycle. Small Bus. Econ. 2011, 37, 107–130. [Google Scholar] [CrossRef]
  72. Berger, A.N.; EI Ghoul, S.; Guedhami, O.; Roman, R.A. Internationalization and bank risk. Manag. Sci. 2017, 63, 2283–2301. [Google Scholar] [CrossRef]
  73. Karolyi, S.A. Personal lending relationships. J. Financ. 2018, 73, 5–49. [Google Scholar] [CrossRef]
  74. Campa, D. Earnings management strategies during financial difficulties: A comparison between listed and unlisted French companies. Res. Int. Bus. Financ. 2019, 50, 457–471. [Google Scholar] [CrossRef]
  75. Ding, S.; Cui, T.; Bellotti, A.G.; Abedin, M.Z.; Lucey, B. The role of feature importance in predicting corporate financial distress in pre and post COVID periods: Evidence from China. Int. Rev. Financ. Anal. 2023, 90, 102851. [Google Scholar] [CrossRef]
  76. Lukason, O.; Laitinen, E.K. Firm failure processes and components of failure risk: An analysis of European bankrupt firms. J. Bus. Res. 2019, 98, 380–390. [Google Scholar] [CrossRef]
  77. Altman, E.I.; Iwanicz-Drozdowska, M.; Laitinen, E.K.; Suvas, A. Financial distress prediction in an international context: A review and empirical analysis of Altman’s Z-score model. J. Int. Financ. Manag. Account. 2017, 28, 131–171. [Google Scholar] [CrossRef]
  78. Almamy, J.; Aston, J.; Ngwa, L.N. An evaluation of Altman’s Z-score using cash flow ratio to predict corporate failure amid the recent financial crisis: Evidence from the UK. J. Corp. Financ. 2016, 36, 278–285. [Google Scholar] [CrossRef]
  79. García, C.J.; Herrero, B. Female directors, capital structure, and financial distress. J. Bus. Res. 2021, 136, 592–601. [Google Scholar] [CrossRef]
  80. Tinoco, M.H.; Wilson, N. Financial distress and bankruptcy prediction among listed companies using accounting, market and macroeconomic variables. Int. Rev. Financ. Anal. 2013, 30, 394–419. [Google Scholar] [CrossRef]
  81. Ellinger, A.E.; Natarajarathinam, M.; Adams, F.G.; Gray, J.B.; Hofman, D.; O’Marah, K. Supply chain management competency and firm financial success. J. Bus. Logist. 2011, 32, 214–226. [Google Scholar] [CrossRef]
  82. Grice, J.S.; Ingram, R.W. Tests of the generalizability of Altman’s bankruptcy prediction model. J. Bus. Res. 2001, 54, 53–61. [Google Scholar] [CrossRef]
  83. Zhong, X.; Ren, G. Independent and joint effects of CSR and CSI on the effectiveness of digital transformation for transition economy firms. J. Bus. Res. 2023, 156, 113478. [Google Scholar] [CrossRef]
  84. Aizawa, A. An information-theoretic perspective of tf–idf measures. Inf. Process. Manag. 2003, 39, 45–65. [Google Scholar] [CrossRef]
  85. Akter, S.; Michael, K.; Uddin, M.R.; McCarthy, G.; Rahman, M. Transforming business using digital innovations: The application of AI, blockchain, cloud and data analytics. Ann. Oper. Res. 2022, 308, 7–39. [Google Scholar] [CrossRef]
  86. Fang, M.; Liu, F.; Park, K. Is inventory performance helping to improve SME credit ratings? The moderating role of supply chain concentration. Appl. Econ. Lett. 2022, 31, 880–884. [Google Scholar] [CrossRef]
  87. Johnson, M.; Albizri, A.; Harfouche, A.; Fosso-Wamba, S. Integrating human knowledge into artificial intelligence for complex and ill-structured problems: Informed artificial intelligence. Int. J. Inf. Manag. 2022, 64, 102479. [Google Scholar] [CrossRef]
  88. Lu, Q.; Chesbrough, H. Measuring open innovation practices through topic modelling: Revisiting their impact on firm financial performance. Technovation 2022, 114, 102434. [Google Scholar] [CrossRef]
  89. Oliveira, M.; Kadapakkam, P.R.; Beyhaghi, M. Effects of customer financial distress on supplier capital structure. J. Corp. Financ. 2017, 42, 131–149. [Google Scholar] [CrossRef]
  90. Hoy, F. The complicating factor of life cycles in corporate venturing. Entrep. Theory Pract. 2006, 30, 831–836. [Google Scholar] [CrossRef]
  91. Correia, S. REGHDFE: Stata Module to Perform Linear or Instrumental-Variable Regression Absorbing Any Number of High-Dimensional Fixed Effects. Boston College Department of Economics. 2023. Available online: https://ideas.repec.org/c/boc/bocode/s457874.html (accessed on 20 April 2024).
  92. Blanc, S.M.; Setzer, T. Analytical debiasing of corporate cash flow forecasts. Eur. J. Oper. Res. 2015, 243, 1004–1015. [Google Scholar] [CrossRef]
  93. Fresard, L. Financial strength and product market behavior: The real effects of corporate cash holdings. J. Financ. 2010, 65, 1097–1122. [Google Scholar] [CrossRef]
  94. Geng, R.; Bose, I.; Chen, X. Prediction of financial distress: An empirical study of listed Chinese companies using data mining. Eur. J. Oper. Res. 2015, 1, 236–247. [Google Scholar] [CrossRef]
  95. Broccardo, L.; Tenucci, A.; Agarwal, R.; Alshibani, S.M. Steering digitalization and management control maturity in small and medium enterprises (SMEs). Technol. Forecast. Soc. Change 2024, 204, 123446. [Google Scholar] [CrossRef]
  96. Chouaibi, S.; Festa, G.; Quaglia, R.; Rossi, M. The risky impact of digital transformation on organizational performance–evidence from Tunisia. Technol. Forecast. Soc. Change 2022, 178, 121571. [Google Scholar] [CrossRef]
  97. ElBannan, M.A. On the prediction of financial distress in emerging markets: What matters more? Empirical evidence from Arab spring countries. Emerg. Mark. Rev. 2021, 47, 100806. [Google Scholar] [CrossRef]
  98. Gökalp, E.; Martinez, V. Digital transformation capability maturity model enabling the assessment of industrial manufacturers. Comput. Ind. 2021, 132, 103522. [Google Scholar] [CrossRef]
  99. Pindado, J.; Rodrigues, L.; De la Torre, C. Estimating financial distress likelihood. J. Bus. Res. 2008, 61, 995–1003. [Google Scholar] [CrossRef]
  100. Dang, V.A.; Gao, N.; Yu, T. Climate policy risk and corporate financial decisions: Evidence from the NOx budget trading program. Manag. Sci. 2023, 69, 7517–7539. [Google Scholar] [CrossRef]
  101. Gupta, N.; Sardana, D.; Lee, R. Dynamic capabilities that matter for business failure versus survival. Ind. Mark. Manag. 2024, 116, 40–50. [Google Scholar] [CrossRef]
  102. Bresciani, S.; Huarng, K.H.; Malhotra, A.; Ferraris, A. Digital transformation as a springboard for product, process and business model innovation. J. Bus. Res. 2021, 128, 204–210. [Google Scholar] [CrossRef]
  103. Fernandez-Vidal, J.; Perotti, F.A.; Gonzalez, R.; Gasco, J. Managing digital transformation: The view from the top. J. Bus. Res. 2022, 152, 29–41. [Google Scholar] [CrossRef]
  104. Kretschmer, T.; Khashabi, P. Digital transformation and organization design: An integrated approach. Calif. Manag. Rev. 2020, 62, 86–104. [Google Scholar] [CrossRef]
  105. Dal Mas, F.; Massaro, M.; Ndou, V.; Raguseo, E. Blockchain technologies for sustainability in the agrifood sector: A literature review of academic research and business perspectives. Technol. Forecast. Soc. Change 2023, 187, 122155. [Google Scholar] [CrossRef]
  106. .Queiroz, M.M.; Wamba, S.F. Blockchain adoption challenges in supply chain: An empirical investigation of the main drivers in India and the USA. Int. J. Inf. Manag. 2019, 46, 70–82. [Google Scholar] [CrossRef]
  107. Ribeiro-Navarrete, B.; Calderon-Monge, E.; Simón-Moya, V. Digitalisation and digital transformation in the social economy: The cases of Anecoop and Consum. Br. Food J. 2023, 125, 3489–3505. [Google Scholar] [CrossRef]
  108. Alqahtani, J.; Duong, L.; Taylor, G.; Eulaiwi, B. Outside directors, firm life cycle, corporate financial decisions and firm performance. Emerg. Mark. Rev. 2022, 50, 100820. [Google Scholar] [CrossRef]
  109. Arikan, A.M.; Stulz, R.M. Corporate acquisitions, diversification, and the firm’s life cycle. J. Financ. 2016, 71, 139–194. [Google Scholar] [CrossRef]
  110. Nauhaus, S.; Luger, J.; Raisch, S. Strategic decision making in the digital age: Expert sentiment and corporate capital allocation. J. Manag. Stud. 2021, 58, 1933–1961. [Google Scholar] [CrossRef]
  111. Vittori, D.; Natalicchio, A.; Panniello, U.; Petruzzelli, A.M.; Cupertino, F. Business Model Innovation between the embryonic and growth stages of industry lifecycle. Technovation 2022, 117, 102592. [Google Scholar] [CrossRef]
  112. Liu, F.; Dutta, D.K.; Park, K. From external knowledge to competitive advantage: Absorptive capacity, firm performance, and the mediating role of labour productivity. Technol. Anal. Strateg. Manag. 2021, 33, 18–30. [Google Scholar] [CrossRef]
  113. Chanias, S.; Myers, M.D.; Hess, T. Digital transformation strategy making in pre-digital organizations: The case of a financial services provider. J. Strateg. Inf. Syst. 2019, 28, 17–33. [Google Scholar] [CrossRef]
  114. Chen, M.Y. Predicting corporate financial distress based on integration of decision tree classification and logistic regression. Expert Syst. Appl. 2011, 38, 11261–11272. [Google Scholar] [CrossRef]
  115. Chen, Y.J.; Chen, Y.M. Forecasting corporate credit ratings using big data from social media. Expert Syst. Appl. 2022, 207, 118042. [Google Scholar] [CrossRef]
  116. Huang, Y.; Wang, Z.; Jiang, C. Diagnosis with incomplete multi-view data: A variational deep financial distress prediction method. Technol. Forecast. Soc. Change 2024, 201, 123269. [Google Scholar] [CrossRef]
  117. Zhang, Z.; Wu, C.; Qu, S.; Chen, X. An explainable artificial intelligence approach for financial distress prediction. Inf. Process. Manag. 2022, 59, 102988. [Google Scholar] [CrossRef]
Figure 1. Conceptual framework.
Systems 12 00513 g001
Table 1. Initial lexicons for the digital transformation indexes.
DimensionCategoryKeywords
StrategyDigital Transformation StrategyBusiness digitalization; Digital age; Digital capability; Digital change; Digital management; Digital technology; Digitalization strategy; DT; Industrial digitalization; Information digitalization
TechnologyArtificial IntelligenceArtificial intelligence; Business intelligence; Deep learning; Face recognition; Image understanding; Intelligent data analysis; Machine learning; Natural language processing; Robotic process automation; Semantic search; Smart robot; Speech recognition
BlockchainAlliance chain; Blockchain; Differential Privacy; Digital currency; Distributed computing; Interconnected chain; Test chain
Cloud ComputingBrain-like computing; Cloud computing; Cognitive computing; Cyber-physical systems; Fusion architecture; Graph computing; Green computing; In-memory computing; Multi-party secure computing; Stream computing
Big DataBata mining; Big data; Data center; Data visualization; Hadoop; Multi-source heterogeneous data; Text mining
ApplicationDigital Transformation ApplicationDigital marketing; Digital platform; Industrial internet; Industry 4.0; Intelligent manufacturing; Internet of things; Smart factory
Table 2. Definitions of variables.
CategoryVariableDefinition
Dependent VariableFinancial distressEquals one if the Z-score of a company is less than 1.81, and zero if the Z-score of a company is more than 2.67
Independent VariableDigital transformationUse keywords about digital transformation in the annual reports published by the companies and analyses the degree of word specificity and its word frequency based on the TF-IDF method
Moderator VariableGrowth stageEquals one if a firm’s investment cash flows are negative and financing cash flows are positive and zero otherwise
Maturity stageEquals one if a firm’s operating cash flows are positive, investing cash flows are negative, negative financing cash flows, and zero otherwise
Declining stageEquals one (1) if a firm is not in the growth or maturity stage
Control VariableSizeThe natural logarithm of the firm’s total assets.
AgeThe number of years since a firm was established.
LeverageTotal liabilities/total assets
ProfitabilityNet profit/total assets
CurrentCurrent assets/current liabilities
Cash(Monetary funds + trading financial assets)/current liabilities
Quick(Current assets-net inventory)/current liabilities
ConcentrationThe percentage of ownership held by the largest shareholder
Table 3. Statistical description.
VariablesMeanS.D.MinMax
Financial Distress0.1813 0.3853 0 1
Digital Transformation1.5584 3.3156 0 18.6
Growth stage0.4702 0.4991 0 1
Maturity stage0.3508 0.4772 0 1
Declining stage0.1791 0.3834 0 1
Size7.5827 1.1236 5.1591 10.6879
Age17.5052 5.5832 7 35
Leverage0.3716 0.2035 0.0491 0.9444
Profitability0.0670 0.0741 −0.2254 0.2779
Current3.0272 3.0878 0.3894 18.4989
Cash1.2972 2.0430 0.0427 12.5255
Quick2.4534 2.8218 0.2175 17.0209
Concentration0.3407 0.1422 0.0908 0.7341
Table 4. Correlations.
VariablesFinancial DistressDigital TransformationGrowth StageMaturity StageDeclining StageSizeAge
Financial Distress1
Digital Transformation−0.0210 *1
Growth stage0.0253 *0.0271 *1
Maturity stage−0.0581 *−0.0458 *−0.6924 *1
Declining stage0.0393 *0.0217 *−0.4399 *−0.3433 *1
Size0.3124 *0.0183 *0.00520.0899 *−0.1186 *1
Age0.1257 *0.0459 *−0.1450 *0.0657 *0.1070 *0.1248 *1
Leverage0.6792 *0.00300.0989 *−0.0999 *−0.00440.4302 *0.1461 *
Profitability−0.3967 *−0.045 *0.0296 *0.1017 *−0.1652 *0.0393 *−0.1039 *
Current−0.3094 *−0.0259 *−0.0566 *0.0352 *0.0299 *−0.3954 *−0.1457 *
Cash−0.2348 *−0.0265 *−0.0275 *0.0179 *0.0135−0.3286 *−0.1412 *
Quick−0.2899 *−0.0164 *−0.0477 *0.0304 *0.0244 *−0.3912 *−0.1479 *
Concentration−0.0363 *−0.0567 *−0.0186 *0.0641 *−0.0556 *0.1423 *−0.1339 *
VariablesLeverageProfitabilityCurrentCashQuickConcentration
Financial Distress
Digital Transformation
Growth stage
Maturity stage
Declining stage
Size
Age
Leverage1
Profitability−0.3458 *1
Current−0.6537 *0.2071 *1
Cash−0.5434 *0.1836 *0.8989 *1
Quick−0.6308 *0.2071 *0.9883 *0.9148 *1
Concentration−0.0285 *0.1631 *0.0281 *0.0343 *0.0232 *1
Notes: * p < 0.1.
Table 5. Results of hierarchical linear modeling analysis of digital transformation relationship with financial distress.
VariablesFinancial Distress
(1)(2)(3)(4)(5)(6)(7)(8)
Digital Transformation −0.0378 ***−0.0384 ***−0.0080−0.0393 ***−0.0382 ***−0.0379 ***−0.0543 ***
(0.013)(0.013)(0.019)(0.013)(0.014)(0.013)(0.015)
Growth stage 0.1471 *0.2320 ***
(0.080)(0.088)
Digital Transformation
× Growth stage
−0.0529 **
(0.023)
Maturity stage −0.3524 ***−0.3445 ***
(0.087)(0.096)
Digital Transformation
× Maturity stage
−0.0054
(0.027)
Declining stage 0.2701 **0.1297
(0.106)(0.117)
Digital Transformation
× Declining stage
0.0815 ***
(0.029)
Control VariableYesYesYesYesYesYesYesYes
Constant−12.4464 ***−12.5989 ***−12.6953 ***−12.7336 ***−12.6094 ***−12.6139 ***−12.6993 ***−12.6880 ***
(0.552)(0.556)(0.559)(0.559)(0.557)(0.558)(0.558)(0.558)
Year FEYesYesYesYesYesYesYesYes
Industry FEYesYesYesYesYesYesYesYes
Observations16,58916,58916,58916,58916,58916,58916,58916,589
R20.7100.7110.7110.7110.7120.7120.7110.712
Notes: Standard errors in parentheses; *** p < 0.01, ** p < 0.05, * p < 0.1.
Table 6. Results of hierarchical linear modeling analysis of strategy dimension’s relationship with financial distress.
VariablesFinancial Distress
(1)(2)(3)(4)(5)(6)(7)(8)
Digital Transformation Strategy −0.2567 ***−0.2580 ***−0.1973 **−0.2600 ***−0.2438 ***−0.2570 ***−0.2760 ***
(0.090)(0.090)(0.093)(0.090)(0.092)(0.091)(0.092)
Growth stage 0.1439 *0.2319 ***
(0.080)(0.085)
Digital Transformation Strategy
× Growth stage
−0.0521 ***
(0.017)
Maturity stage −0.3488 ***−0.3178 ***
(0.087)(0.095)
Digital Transformation Strategy
× Maturity stage
−0.0209
(0.025)
Declining stage 0.2709 **0.1892
(0.106)(0.116)
Digital Transformation Strategy
× Declining stage
0.0463 *
(0.026)
Control VariableYesYesYesYesYesYesYesYes
Constant−12.4464 ***−12.5670 ***−12.6595 ***−12.7906 ***−12.5727 ***−12.6010 ***−12.6675 ***−12.6309 ***
(0.552)(0.555)(0.558)(0.560)(0.556)(0.557)(0.557)(0.557)
Year FEYesYesYesYesYesYesYesYes
Industry FEYesYesYesYesYesYesYesYes
Observations16,58916,58916,58916,58916,58916,58916,58916,589
R20.7100.7110.7110.7110.7120.7120.7110.711
Notes: Standard errors in parentheses; *** p < 0.01, ** p < 0.05, * p < 0.1.
Table 7. Results of hierarchical linear modeling analysis of application dimension relationship with financial distress.
VariablesFinancial Distress
(1)(2)(3)(4)(5)(6)(7)(8)
Digital Transformation
Application
−0.0305−0.03180.0196−0.0329−0.0266−0.0300−0.0425 **
(0.020)(0.020)(0.025)(0.020)(0.021)(0.020)(0.022)
Growth stage 0.1452 *0.2562 ***
(0.080)(0.086)
Digital Transformation
Application × Growth stage
−0.0691 ***
(0.020)
Maturity stage −0.3494 ***−0.3118 ***
(0.087)(0.095)
Digital Transformation
Application × Maturity stage
−0.0251
(0.026)
Declining stage 0.2689 **0.1744
(0.106)(0.117)
Digital Transformation
Application × Declining stage
0.0534 **
(0.027)
Control VariableYesYesYesYesYesYesYesYes
Constant−12.4464 ***−12.5191 ***−12.6137 ***−12.7043 ***−12.5259 ***−12.5531 ***−12.6172 ***−12.5912 ***
(0.552)(0.555)(0.558)(0.559)(0.556)(0.557)(0.557)(0.557)
Year FEYesYesYesYesYesYesYesYes
Industry FEYesYesYesYesYesYesYesYes
Observations16,58916,58916,58916,58916,58916,58916,58916,589
R20.7100.7100.7100.7110.7110.7110.7110.711
Notes: Standard errors in parentheses; *** p < 0.01, ** p < 0.05, * p < 0.1.
Table 8. Results of hierarchical linear modeling analysis of AI’s relationship with financial distress.
VariablesFinancial Distress
(1)(2)(3)(4)(5)(6)(7)(8)
AI −0.2430 ***−0.2433 ***−0.1945 ***−0.2447 ***−0.2393 ***−0.2436 ***−0.2727 ***
(0.056)(0.056)(0.061)(0.056)(0.057)(0.056)(0.058)
Growth stage 0.1419 *0.2004 **
(0.080)(0.085)
AI × Growth stage −0.0350 *
(0.018)
Maturity stage −0.3484 ***−0.3315 ***
(0.087)(0.095)
AI × Maturity stage −0.0117
(0.026)
Declining stage 0.2736 **0.1581
(0.106)(0.116)
AI × Declining stage 0.0688 **
(0.027)
Control VariableYesYesYesYesYesYesYesYes
Constant−12.4464 ***−12.6486 ***−12.7390 ***−12.8034 ***−12.6550 ***−12.6707 ***−12.7523 ***−12.7204 ***
(0.552)(0.555)(0.558)(0.560)(0.557)(0.558)(0.558)(0.558)
Year FEYesYesYesYesYesYesYesYes
Industry FEYesYesYesYesYesYesYesYes
Observations16,58916,58916,58916,58916,58916,58916,58916,589
R20.7100.7110.7120.7120.7120.7120.7120.712
Notes: Standard errors in parentheses; *** p < 0.01, ** p < 0.05, * p < 0.1.
Table 9. Results of hierarchical linear modeling analysis of Blockchain’s relationship with financial distress.
VariablesFinancial Distress
(1)(2)(3)(4)(5)(6)(7)(8)
Blockchain 0.15590.16420.29250.16800.21350.14860.1072
(0.228)(0.228)(0.231)(0.227)(0.228)(0.227)(0.228)
Growth stage 0.1419 *0.2503 ***
(0.080)(0.085)
Blockchain × Growth stage −0.0628 ***
(0.017)
Maturity stage −0.3463 ***−0.2907 ***
(0.087)(0.094)
Blockchain × Maturity stage −0.0380
(0.025)
Declining stage 0.2700 **0.2071 *
(0.106)(0.116)
Blockchain × Declining stage 0.0359
(0.026)
Control VariableYesYesYesYesYesYesYesYes
Constant−12.4464 ***−12.4527 ***−12.5420 ***−12.7444 ***−12.4540 ***−12.5193 ***−12.5532 ***−12.5161 ***
(0.552)(0.552)(0.555)(0.559)(0.554)(0.556)(0.555)(0.555)
Year FEYesYesYesYesYesYesYesYes
Industry FEYesYesYesYesYesYesYesYes
Observations16,58916,58916,58916,58916,58916,58916,58916,589
R20.7100.7100.7100.7110.7110.7110.7110.711
Notes: Standard errors in parentheses; *** p < 0.01, ** p < 0.05, * p < 0.1.
Table 10. Results of hierarchical linear modeling analysis of cloud computing’s relationship with financial distress.
VariablesFinancial Distress
(1)(2)(3)(4)(5)(6)(7)(8)
Cloud Computing −0.1120−0.11390.0170−0.1177−0.0997−0.1128−0.1390 *
(0.079)(0.079)(0.088)(0.079)(0.081)(0.079)(0.081)
Growth stage 0.1424 *0.2454 ***
(0.080)(0.085)
Cloud Computing
× Growth stage
−0.0615 ***
(0.018)
Maturity stage −0.3476 ***−0.3051 ***
(0.087)(0.095)
Cloud Computing
× Maturity stage
−0.0289
(0.026)
Declining stage 0.2713 **0.1908 *
(0.106)(0.116)
Cloud Computing
× Declining stage
0.0462 *
(0.026)
Control VariableYesYesYesYesYesYesYesYes
Constant−12.4464 ***−12.4781 ***−12.5685 ***−12.7231 ***−12.4829 ***−12.5265 ***−12.5802 ***−12.5444 ***
(0.552)(0.553)(0.556)(0.559)(0.554)(0.556)(0.556)(0.556)
Year FEYesYesYesYesYesYesYesYes
Industry FEYesYesYesYesYesYesYesYes
Observations16,58916,58916,58916,58916,58916,58916,58916,589
R20.7100.7100.7100.7110.7110.7110.7110.711
Notes: Standard errors in parentheses; *** p < 0.01, ** p < 0.05, * p < 0.1.
Table 11. Results of hierarchical linear modeling analysis of big data’s relationship with financial distress.
VariablesFinancial Distress
(1)(2)(3)(4)(5)(6)(7)(8)
Big data −0.0595 *−0.0599 *−0.0049−0.0610 *−0.0529−0.0600 *−0.0777 **
(0.033)(0.033)(0.036)(0.033)(0.034)(0.033)(0.034)
Growth stage 0.1417 *0.2410 ***
(0.080)(0.086)
Big data × Growth stage −0.0588 ***
(0.019)
Maturity stage −0.3471 ***−0.3113 ***
(0.087)(0.095)
Big data
× Maturity stage
−0.0246
(0.026)
Declining stage 0.2719 **0.1775
(0.106)(0.116)
Big data
× Declining stage
0.0551 **
(0.027)
Control VariableYesYesYesYesYesYesYesYes
Constant−12.4464 ***−12.4791 ***−12.5683 ***−12.7220 ***−12.4830 ***−12.5199 ***−12.5821 ***−12.5429 ***
(0.552)(0.553)(0.556)(0.559)(0.554)(0.556)(0.556)(0.556)
Year FEYesYesYesYesYesYesYesYes
Industry FEYesYesYesYesYesYesYesYes
Observations16,58916,58916,58916,58916,58916,58916,58916,589
R20.7100.7100.7110.7110.7110.7110.7110.711
Notes: Standard errors in parentheses; *** p < 0.01, ** p < 0.05, * p < 0.1.
Disclaimer/Publisher’s Note: The statements, opinions and data contained in all publications are solely those of the individual author(s) and contributor(s) and not of MDPI and/or the editor(s). MDPI and/or the editor(s) disclaim responsibility for any injury to people or property resulting from any ideas, methods, instructions or products referred to in the content.

