1. Introduction
Along with the growth of the population and the continually increasing consumption of various resources, global environmental problems are becoming more and more prominent. In 2023, energy-related carbon dioxide emissions were 37.4 billion tons worldwide, of which transportation accounted for about a quarter of the total [
1]. Meanwhile, rapid global urbanization results in higher traffic volumes and accidents that negatively affect daily life, especially in metropolitan areas [
2,
3]. Together with the global need to reduce greenhouse gas emissions and improve the travel environment, new solutions for daily transport are increasingly needed. Transport policymakers and planners are continuously seeking efficient and environmentally friendly ways that enable people to travel more sustainably, for instance, using smart mobility solutions [
4,
5].
With the progressive development of Information and Communications Technologies and the sharing economy, new types of transportation modes have been developing rapidly in recent years, such as car-sharing, ride-sharing, and bike-sharing [
6]. These mobility services increase the mode selection set and accessibility to different destinations. However, the wide range of choices also brings additional complexity for users to some extent. In this context, a new model of transportation, MaaS (mobility as a service), is emerging, which is a significant necessity for innovative and sustainable mobility solutions. Unlike traditional transportation methods, this mode integrates all travel services. Users input travel starting points, destinations, personal preferences, and other information, and the platform provides reservation, ticketing, and real-time information services [
7]. Based on a growing population, especially in metropolitan areas, increasing mobility requirements, traffic congestion, and pollutant emissions above the defined targets, there is a significant necessity for innovative and sustainable mobility solutions [
8].
The concept of MaaS was first proposed by Sampo Hietanen, President of the Finnish Intelligent Transportation Association, at the European Union Intelligent Transport Systems Congress in 2014. He defined MaaS as a transportation service model that provides users with personalized customized travel services through a single platform. After his proposal, a series of researchers performed extensive work to define the concept of MaaS and give it different definitions [
9,
10,
11,
12,
13,
14]. Although the researchers explain MaaS from different perspectives, all the interpretations share the following four basic ideas: integration, servitization, user perspective, and digitalization [
15,
16]. Integration indicates that Maas unites all kinds of travel modes, trip planning, reservations, ticketing, and payment into an integrated system. Servitization indicates that users buy mobility services from the MaaS platform instead of transport modes themselves. User perspective indicates that MaaS provides personalized and on-demand mobile solutions for travelers based on their special needs, preferences, and habits. Digitalization indicates that MaaS relies on a digital platform that integrates “door-to-door” travel planning, reservation, ticketing, payment, and real-time travel information.
Nowadays, many cities around the world are becoming attracted to the enormous potential of MaaS to promote sustainable mobility and more livable environments, and they have experimented with MaaS demonstration applications, such as UbiGo in Gothenburg; Whim in Helsinki; Moovel in Stuttgart and Hamburg; BeMobility in Berlin; WienMobil and Smile in Vienna; EMMA in Montreal; MobilityShop in Hannover; HelloGo in Utrecht; and SHIFT in Las Vegas [
17,
18]. In China, some cities have put forward proposals to develop MaaS systems and have started their implementation. For example, the Beijing Municipal Commission of Transport and Amap began constructing the MaaS platform together in 2019. However, there is limited understanding of the intentions and preferences of potential MaaS users in developing countries.
There are studies which have shown that the implementation of MaaS has a positive impact on the economy, ecology, security, society, etc. MaaS has the potential to reshape urban economies by reducing transportation costs, optimizing the use of resources, and fostering economic growth through increased mobility. By integrating electric vehicles, shared transportation, and multimodal travel, MaaS contributes to reduced carbon emissions and more sustainable urban transport systems [
19]. MaaS encourages the efficient use of various modes of transportation, reducing the number of vehicles on the roads, thereby improving safety. MaaS has the potential to drive social inclusion by improving mobility for vulnerable populations (e.g., elderly and low-income groups) who may otherwise face barriers to transportation [
20]. Researchers believe that MaaS provides individuals with attractive alternatives, increases their satisfaction, and encourages travelers to make more sustainable and responsible decisions. However, despite the positive aspects of MaaS, some scholars worry that its penetration may result in unsustainable travel behaviors [
21]. Others argue that even if the potential of MaaS is confirmed, public participation is still necessary before it can create a more sustainable transportation system [
22]. Historically, many innovative services or products have failed to achieve widespread diffusion due to their inadequacy in addressing real user needs and preferences or because of their incompatibility with user values and past experiences when introduced into the market. Therefore, public acceptance is a fundamental precondition for the success of MaaS.
This study aims to conduct an analysis of the user acceptance mechanisms of MaaS and understand the constraints and enabling factors of user acceptance. Specifically, it can be divided into the following aspects: Firstly, a behavioral model based on technology acceptance theory was established to describe the mechanism of individuals’ intention to use MaaS. Secondly, a structured questionnaire consisting of eight sections and thirty-three questions was designed and conducted online. Thirdly, reliability and validity tests were implemented on the questionnaire data to ensure their suitability for model calibration. Finally, a Structural Equation Model was applied to calculate the behavioral model.
2. Literature Review
A series of researchers have conducted extensive research in MaaS. The main research fields include the following aspects: definition of MaaS, construction of MaaS integrated system, electric MaaS system, business model, data sharing and security, function design, MaaS impact assessment, MaaS benefit evaluation, and acceptance of MaaS [
23,
24]. However, many studies have shown that the success of MaaS significantly depends on individuals’ behavior [
25]. Meanwhile, the MaaS development white paper published by the MaaS Alliance indicates that individuals’ acceptance and willingness are the key points of MaaS, based on the ultimate goal of MaaS, which is to satisfy the requirements and fulfill the expectations of users [
26]. The previous literature broadly agrees that the success of MaaS and its ability to promote the adoption of more sustainable behaviors significantly relies on individuals’ engagement. Therefore, it is critical to evaluate individuals’ viewpoints to define and implement this innovative travel model. To the best of our knowledge, a small number of researchers have investigated why and how individuals adopt and use these innovative solutions. Their studies show that individuals’ characteristics and preferences affect the willingness and acceptance of MaaS [
27].
From the perspective of researching data, there were survey-based, experiment-oriented, and interview-based data used in various research studies. Survey-based research concentrates on exploring individuals’ preferences for using MaaS to identify the key factors influencing the use of MaaS. Alonso et al. explored individuals’ willingness to use MaaS from the aspects of travel modes, mobility integration, mobile applications, and willingness to pay in the Netherlands [
28]. It shows that individuals who are highly educated, are young, are living in denser urban areas, have no children, and depend more on online information for travel are more likely to use MaaS. Caiati et al. explored the latent demand for MaaS by implementing an SP survey [
29]. It shows that the key factors in MaaS subscription include subscription fees and social influence. They also found that public transportation integration was a crucial component in participant interest in MaaS systems. Experiment-oriented research focuses on investigating individuals’ behavior when selecting specific MaaS packages, with the aim of recognizing crucial factors in using MaaS. Ho et al. investigated the willingness of individuals to pay for MaaS by establishing a mixed logit model in Sydney, showing that the price of MaaS and car ownership are key factors to the acceptance of MaaS [
30]. Interview-based research concentrates on obtaining individuals’ perceptions and preferences when adopting MaaS. Matyas identified potential ways that MaaS could promote behavioral change and identify the obstacles to using alternative transport modes. The results indicate that MaaS positively influences behavior regarding the use of multiple transport modes and decreases reliance on private vehicles.
According to different theories and modeling methods, most researchers investigate individuals’ intentions and willingness to use MaaS from two perspectives. The first perspective uses multiple forms of discrete selection methods, such as probabilistic models, logit models, multivariate discrete models, and so on, to construct a choice-willing model under specific travel scenarios by utilizing traditional travel choice theory and utility maximization theory [
31]. Sascha et al. conducted an ordered hybrid choice model to explore the role of latent psychological factors [
32]. The findings reveal that individuals perceived public transportation experiences improve their likelihood of using MaaS for commuting more frequently. Feneri et al. applied an Error Components Logit to examine the critical factors of mode choice as a result of the introduction of MaaS [
33]. One of the observations is that travelers whose frequent travel modes are walking or biking are more likely to use MaaS compared with travelers whose frequent travel modes are private cars. With further research, the connotation of the discrete model was extended by unobservable latent variables in order to increase the interpretability of decision-making behavior by adding psychological factors, such as attitudes, perceptions, beliefs, etc., to the observable variables.
The second applies technology-adoption models and relevant theoretical models to explore key factors that influence individuals’ acceptance of and willingness to use MaaS regarding MaaS as a new digital technology. MaaS essentially constitutes the integration of various forms of transport services into a single mobility service. Therefore, MaaS can be regarded as a new digital technology. The Unified Theory of Acceptance and Use Technology (UTAUT) model and Technology Acceptance Model (TAM) are generally applied to explain individuals’ willingness to use MaaS. Jianhong Ye et al. established an analysis framework of MaaS acceptance and intention based on the Unified Theory of Acceptance and Use Technology (UTAUT) model [
34]. This study shows that the strongest demand for users to use MaaS is convenience, greater than the impact of time and cost. Schikofsky et al. investigated the key motivation for MaaS by establishing a structural causal equation model that captures the motivational mechanisms behind the intention to adopt MaaS in Germany [
35]. The study shows that autonomy, competence, and relatedness affect individuals’ intention to use MaaS. TAM initially focused on attitudinal factors as a central predictor of technology adoption, and its validity, reliability, and robustness have been supported by a large number of research studies. TAM is the most influential and widely used conceptual model for identifying factors that influence individuals’ acceptance of specific technologies. According to the definition of TAM, an individual’s intention to adopt a certain type of behavior, i.e., MaaS, is a strong predictor of whether he or she will engage in such behavior. Stella Huang applied an adjusted version of the TAM model to evaluate the relationship between privacy concerns and the acceptance of MaaS [
36]. The study’s results indicate trust is the key to MaaS adoption.
In summary, the current research progress enriches our understanding of how MaaS changes people’s travel behavior and preferences. These studies identify a variety of variables, including demographic characteristics of individuals, behavioral attributes, transaction cost factors, network externality issues, and social dimensions that all affect MaaS use. However, the relevant research on the willingness of users to accept MaaS was insufficient. This study establishes a behavioral model based on TAM which is calculated with survey-based data to identify the mechanism of individuals’ intention to use MaaS. The results will provide suggestions for the functional design and future promotion of MaaS.
3. Methodology
The methodology followed in this study was to construct a behavioral model for analyzing individuals’ willingness to use MaaS for travel. In this section, the overall research approaches, including the design of the survey and the analysis methods of data, are discussed. Firstly, a research behavioral model was conceptualized based on the theoretical construction of TAM, and a series of hypotheses were proposed. Secondly, based on the model and its hypotheses, a questionnaire was designed to provide data for the behavioral model. Thirdly, reliability and validity tests were conducted to examine the consistency, accuracy, and usefulness of questionnaire data. Lastly, the Structural Equation Model (SEM) was utilized for the quantitative analysis of the behavioral model and hypotheses.
3.1. Research Behavioral Model and Hypotheses
Based on previous studies, the adoption theory in the field of information technology is more comprehensive than using multiple forms of discrete selection methods to construct a choice model under specific travel scenarios. The implementation of MaaS relies on an integrated mobile application or an online service. Therefore, MaaS can be considered a new technology, and its acceptance can be explored through adoption theory. TAM is an information systems theory that models how users come to accept and use a technology. The model suggests that when users are exposed to a new technology, several factors significantly influence their decisions regarding how and when they will adopt it, which are perceived usefulness, perceived ease of use, and behavioral intention to use. TAM is a widely used adoption theory to explore acceptance behavior mechanisms, and it is often adjusted and enhanced to identify the factors that affect individuals’ acceptance of a technology in many research fields. Moreover, extensive research has demonstrated the validity, reliability, and robustness of TAM [
37]. In summary, TAM was employed within the framework of MaaS.
Although the applicability of the TAM has been well established, it also has some limitations. For instance, perceived ease of use is less relevant to technologies in the exploration stage, and the influencing factors included in the model are not comprehensive. Therefore, this study modified the TAM to make it more suitable for exploring individuals’ willingness to use MaaS. In the modified model, the variables of individual characteristics, mobility characteristics, travel preference, and travel philosophy have been added, and perceived ease of use has been removed. The detailed description is as follows.
According to the assumptions of the TAM, individuals’ willingness to use MaaS is determined by behavioral intention, which is shaped by perceived usefulness and attitude. Attitude is jointly determined by perceived usefulness and perceived ease of use. Perceived usefulness can be defined as the expected benefit derived from a new technology-based solution and its utilization. MaaS is expected to bring many benefits to users, such as saving money, saving time, convenient travel, integrated travel methods, providing real-time travel information, etc. Perceived ease of use describes the expected burden of using a new product or solution [
38]. However, perceived ease of use is not considered in this study since MaaS technologies are in an exploratory stage and, thus, are not fully conceptualized.
In addition, the literature review in
Section 2 shows that perceived risk, individual characteristics, mobility characteristics, travel philosophy, and travel preferences also have a significant impact on willingness to use MaaS. Perceived risk originated from the psychology area and was extended to consumer behavior research by Bauer, who suggested that perceived risk is the uncertainty about the outcome in the process of making a purchasing decision. Individual characteristics have been demonstrated to have a significant impact on individuals’ beliefs, attitudes, intentions, and behaviors. As indicated in previous findings, the intention to adopt MaaS is massively dependent on an individual’s current mobility characteristics to a large extent [
39].
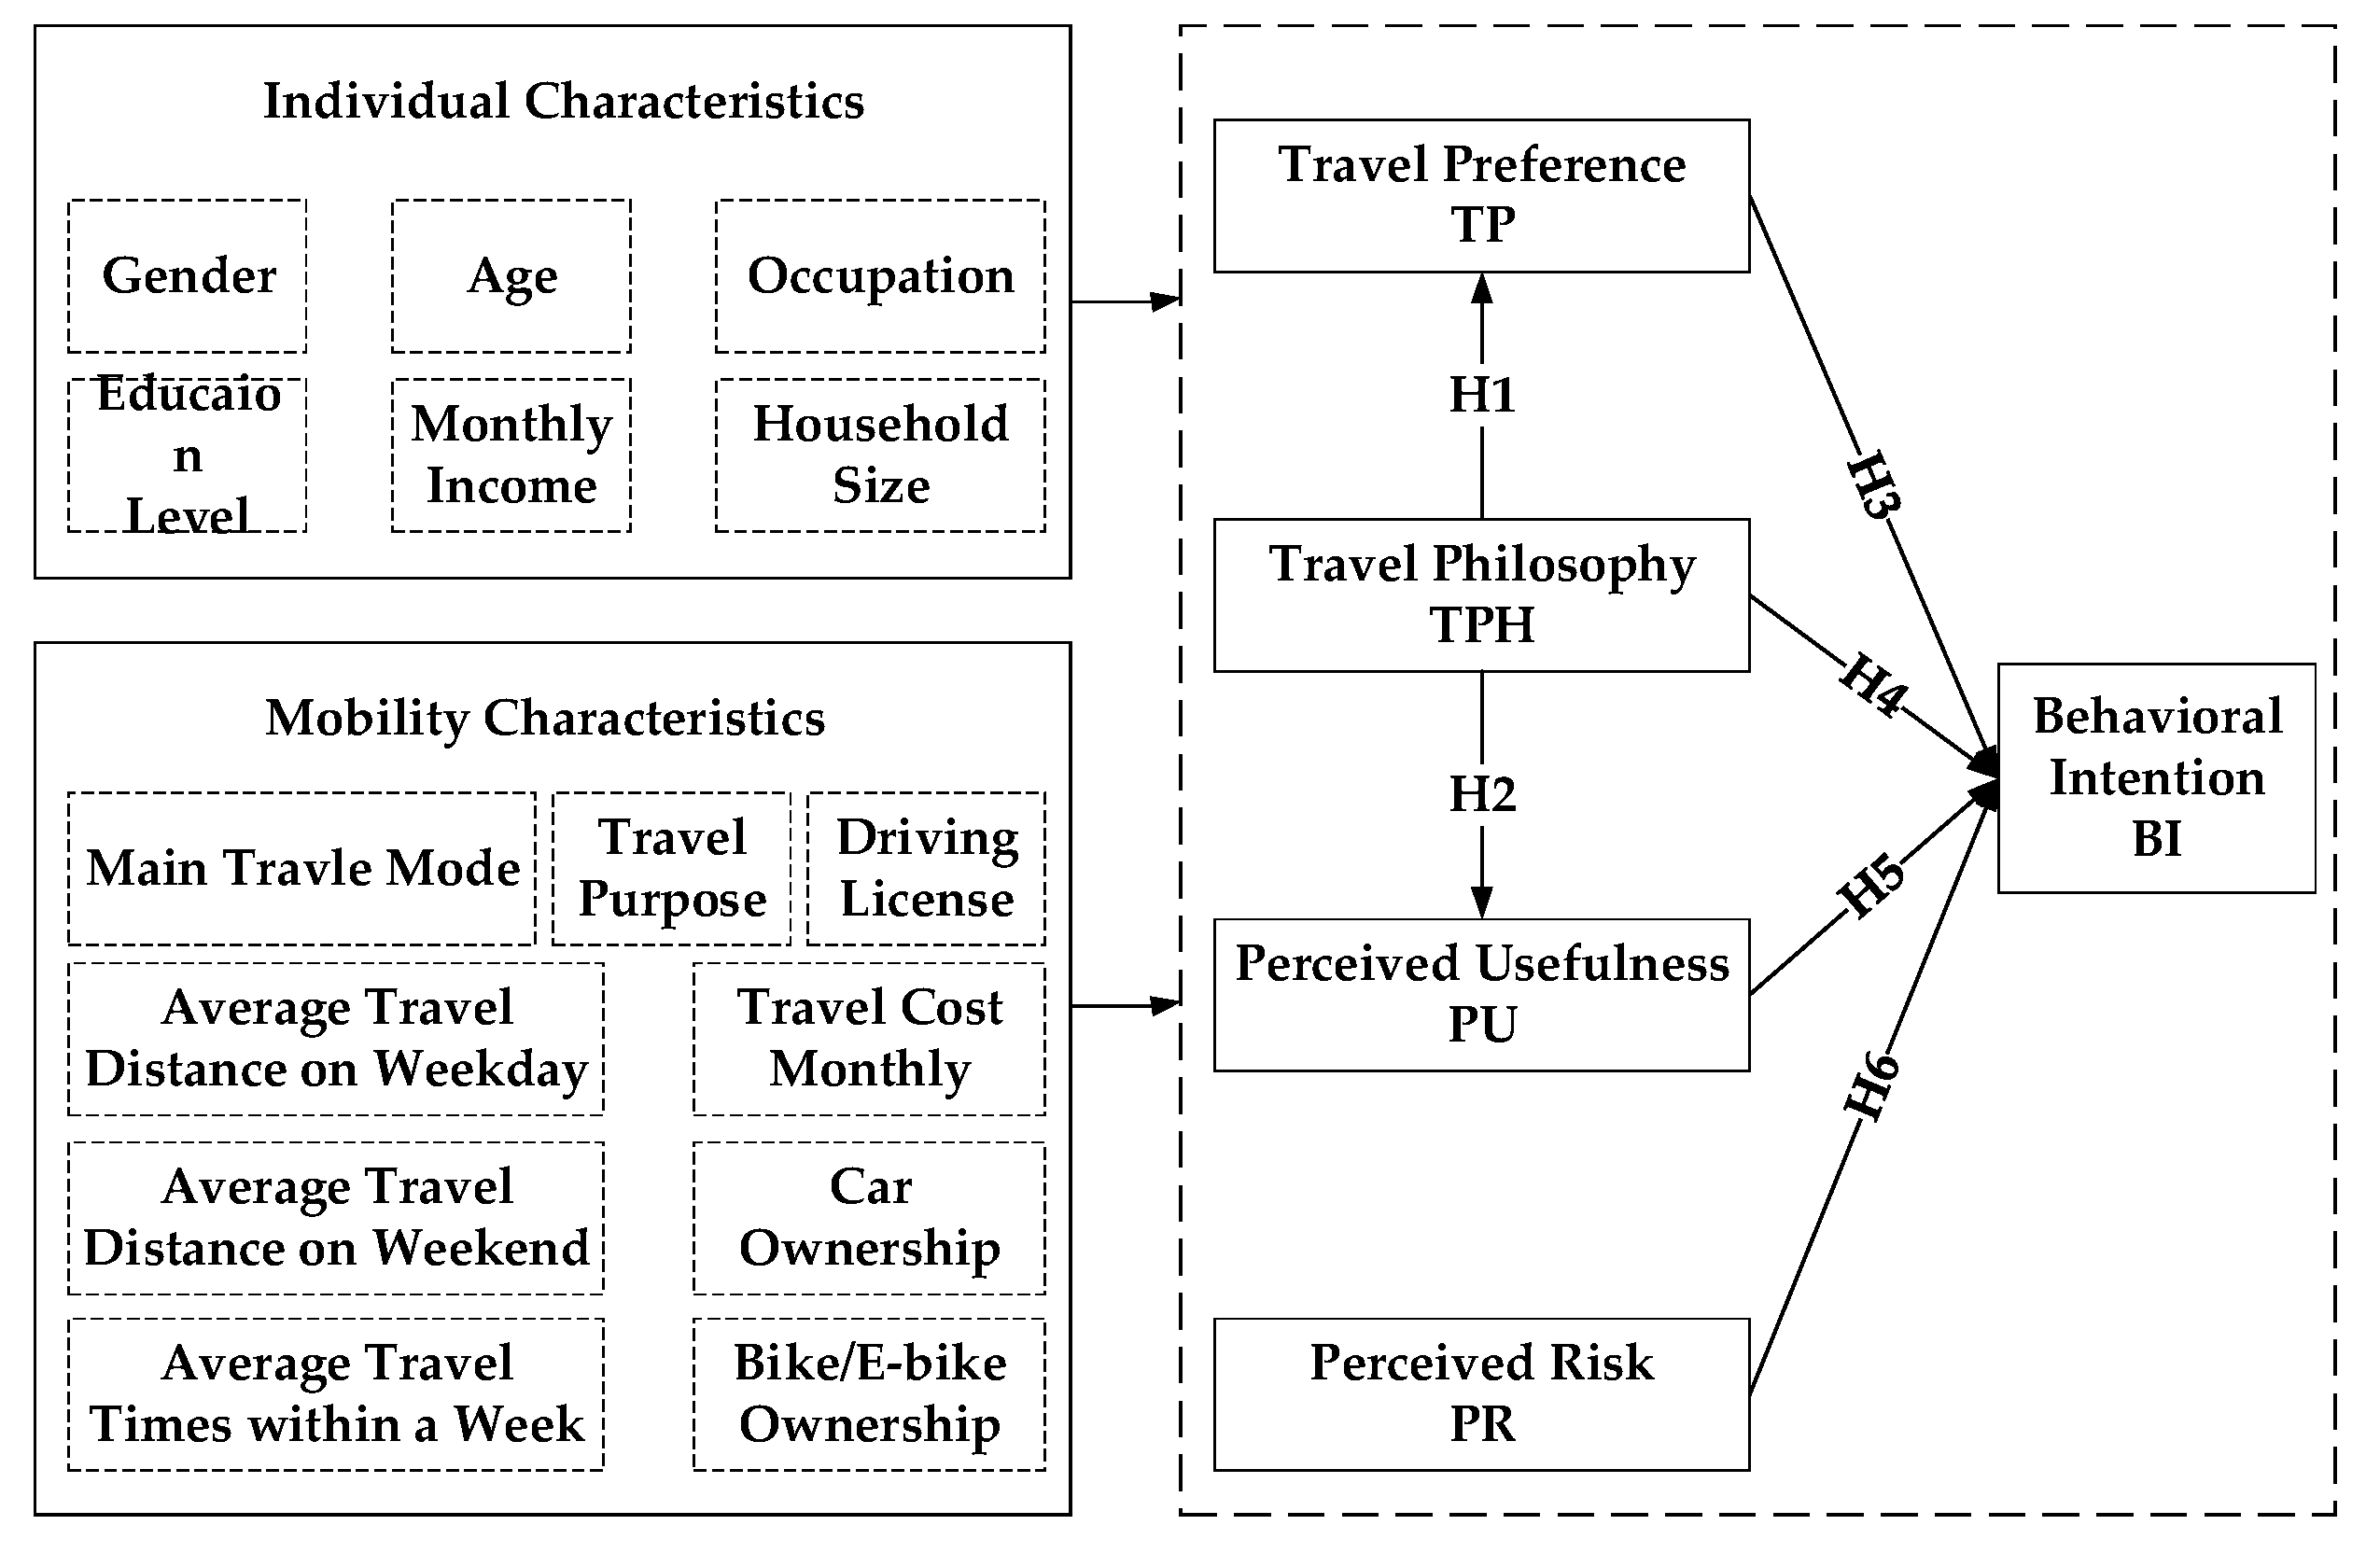
In this study, travel philosophy refers to individuals’ attitudes toward safety, convenience, comfort, sustainability, and economic efficiency in travel. Travel preference refers to individuals’ preferences for travel mode, travel time, and so on, in the process of travel. These factors are also considered in this study. Driven by the theoretical constructs of the TAM and all factors, a research behavioral model is conceptualized to explore motivational mechanisms underlying individuals’ willingness to adopt MaaS. Considering the assumptions of this theoretical model, we postulate the following hypotheses:
H1. Travel philosophy affects travel preference. This hypothesis proposes that travelers’ core beliefs about mobility impact their selection and approach toward different modes and forms of travel. For example, people who value comfort more tend to choose private cars for travel, while those who prioritize sustainability are more likely to choose public transport.
H2. Travel philosophy affects perceived usefulness. It suggests that there are underlying principles guiding an individual’s perception of the usefulness of MaaS. For example, people who think convenience is more important are more likely to accept Maas since MaaS can integrate route planning and consolidate payment.
H3. Travel preference affects behavioral intention. This hypothesis posits that individuals’ preferences for specific travel options strongly influence their intention to engage with those options in real scenarios. It is consistent with existing research indicating that favorable preferences increase the likelihood of future travel behavior that corresponds to those preferences.
H4. Travel philosophy affects behavioral intention. This hypothesis posits that travel philosophy serves as a factor influencing whether an individual will engage in a specific travel behavior.
H5. Perceived usefulness affects behavioral intention. This hypothesis suggests that the degree to which individuals perceive a travel service as useful correlates with their intent to use it. Higher perceived usefulness increases the likelihood of acceptance and engagement.
H6. Perceived risk affects behavioral intention. This hypothesis posits an inverse relationship between perceived risk and the willingness to use MaaS. It suggests that if people believe that using MaaS will bring risks, such as privacy leaks, it will reduce the likelihood of using MaaS.
In summary, TAM was adapted to the context of MaaS. The developed research model, including the postulated direct and indirect effects on behavioral adoption intention, is shown in
Figure 1.
3.2. Survey Design
Based on the behavioral model and a review of previous similar studies, a tailor-made questionnaire survey was designed to identify potential future users of sustainable MaaS and the most relevant factors affecting individuals’ willingness to use MaaS.
Part 1: Introduction. This section was meant to provide responders with a realistic and reasonable degree of knowledge of MaaS before administering the questionnaire. First, the concept of MaaS in this paper is provided as follows:
“MaaS integrates different transportation services (e.g., bus, metro, cab, etc.) into an accessible digital travel service based on an efficient public transportation system. According to the travel demands of individuals, the MaaS service provides integrated travel solutions, such as hybrid travel path planning, information services, travel booking, and convenient payment, as shown in
Figure 2”. Then, participants need to answer the question “Do you gain a general understanding of MaaS?” with “Yes” or “No”.
Part 2: Individual characteristics. People with different individual characteristics have differences in physiology, psychology, cognition, and emotion, and will exhibit different attitudes and behavior when accepting MaaS. In this section, participants were asked about their gender, age, educational level, occupation, monthly income, and household size. Previous researchers indicate that these factors influence technology-acceptance behavior, which needs to be verified.
Part 3: Mobility characteristics. Current mobility behavior has an important impact on future travel-mode choices. In this section, participants were asked about their travel-related characteristics, i.e., average travel times per week, average travel distance per day on weekdays, travel purpose, car ownership, driver’s license, travel cost monthly, and travel frequency on different public transport modes (i.e., bus, subway, shared bike, and taxi/online car-hailing) [
40].
Part 4: Travel philosophy. Different travel philosophies lead to different perspectives on using MaaS. In this section, participants were asked about their travel philosophies on travel. There are five questions designed to explain the travel philosophy of participants, as shown in
Table 1. The five questions were presented to respondents as 5-point Likert-scale statements (strongly disagree/disagree/neutral/agree/strongly agree).
Part 5: Travel preference. Travel preference can indicate which aspects of MaaS individuals prioritize, potentially affecting their inclination to utilize MaaS. In this section, participants were asked about their preferences regarding travel time, travel modes, and other aspects, as shown in
Table 2. The six questions were presented to respondents as 5-point Likert-scale statements (strongly disagree/disagree/neutral/agree/strongly agree).
Part 6: Perceived usefulness. Perceived usefulness, one of the key antecedents of TAM, is directly correlated with behavioral intentions to use new technology. In this section, participants were asked about their attitudes toward the perceived usefulness of MaaS, as shown in
Table 3. Three questions were presented to respondents as 5-point Likert-scale statements (strongly disagree/disagree/neutral/agree/strongly agree).
Part 7: Perceived risk. Perceived risk has a significant negative impact on individuals’ willingness to use MaaS [
41]. Users have certain psychological concerns regarding potential negative experiences while using MaaS services that diminish their inclination to utilize MaaS. In this section, participants were asked about their concerns regarding privacy disclosure when using MaaS, as shown in
Table 4. Three questions were presented to respondents as 5-point Likert-scale statements (strongly disagree/disagree/neutral/agree/strongly agree).
Part 8: Behavioral intention. Behavioral intention refers to an individual’s intention to perform a specific behavior. Previous studies have shown that behavioral intention plays a significant role in the acceptance and usage of new technologies. Considering that the MaaS platform is currently in an exploratory phase, behavioral intention can represent individuals’ willingness to use MaaS in this study. In this section, participants were asked about their behavioral intention, as shown in
Table 5. Three questions were presented to respondents as 5-point Likert-scale statements (strongly disagree/disagree/neutral/agree/strongly agree).
3.3. Reliability and Validity Tests
In this study, Likert-scale questions were designed in the fourth-to-eighth parts of the questionnaire to explore individuals’ willingness to use MaaS from a subjective perspective. Unlike objective questionnaires, such as individual characteristics, mobility characteristics, and so on, the scale questionnaire requires reliability and validity tests to ensure the reliability and internal consistency of the data.
A reliability test is used to evaluate the accuracy, stability, and consistency of measurement tools, which indicate the proximity of repeated measurements. Reliability test methods generally include test–retest reliability, parallel reliability, split-half reliability, and Cronbach’s alpha coefficient [
42]. Cronbach’s alpha coefficient is the most frequently used method by many researchers. Compared with other methods, Cronbach’s alpha coefficient is highly sensitive, intuitive, easy to understand, and suitable for attitude and opinion-based questionnaires. Therefore, Cronbach’s alpha coefficient is applied in this study. The formula is as follows:
where
is Cronbach’s alpha coefficient;
is the total number of items in the scale questionnaire;
is the intra-test variance of the score of question,
; and
is the variance of the total score of all items.
The validity test is used to examine whether the questionnaire results can reflect the real characteristics of individuals and whether the designed items are reasonable, mainly for the validity analysis of the Likert-scale questions. The general method of a validity test is to use factor analysis to measure the structural validity of the scale or the entire questionnaire. The main function of factor analysis is to extract some common factors from all the variables (items) of the scale. Each common factor is highly correlated with a certain group of specific variables. These common factors represent the basic structure of the scale. Through factor analysis, we can examine whether the questionnaire can measure a certain structure assumed by the researcher when designing the questionnaire. There are two methods for factor analysis: Exploratory Factor Analysis (EFA) and Confirmatory Factor Analysis (CFA). EFA is suitable for non-classical scales. Therefore, Confirmatory Factor Analysis (CFA) is applied to investigate the latent structure of the unobservable variables and to explore their theoretical structure in this study [
43].
3.4. Structural Equation Model
After conducting reliability and validity tests on the questionnaire data, a quantitative analysis of the relationships between variables was applied using the Structural Equation Model (SEM). The SEM originated from path analysis which was invented by Sewall Wright in the 1920s [
44]. However, the concept of the SEM was not formally proposed until the 1907s and then began to be used in many fields, such as psychology, sociology, economics, and so on, as an important tool for multivariate statistical analysis [
45]. SEM is an empirical analysis model that can deal with measurement and analysis problems simultaneously. It is a widely accepted comprehensive statistical approach for exploring the interrelations between variables, including observed and latent variables, based on the covariance matrix of variables. Moreover, the relationship between latent variables estimated by SEM is not affected by measurement error.
SEM consists of two distinct components: the measurement equation and the structural equation, enabling researchers to evaluate the correlations between the variables of interest. Specifically, the measurement equation focuses on measuring the relationship between the potential variable of travel mode satisfaction and several observed variables. The calculation formula is as follows:
where
is the factor load matrix of observation variable
on its potential variable,
;
is the measurement error term of
;
is the factor load matrix of observation variable
on its potential variable,
; and
is the measurement error term of
.
Based on constructing the path structure of the influence relationship between variables, the SEM model estimates the causal relationship between endogenous and exogenous latent variables. The calculation formula of the structural equation is as follows:
where
is the structural coefficient matrix between variables
,
is the structural coefficient matrix between variables
and
, and
is the residual term of the structural equation.
4. Results and Discussion
4.1. Data Collection and Descriptive Statistics
4.1.1. Data Collection
As the capital and the political center of China, Beijing plays a very important role in the development of China. The first MaaS service platform in China was launched by the Beijing Municipal Commission of Transport and Amap in Beijing in November 2019. The MaaS service platform integrates many kinds of travel-mode information, including bus, subway, suburban railway, walking, cycling, online car-hailing, aviation, railway, long-distance bus, and self-driving information. However, this MaaS service platform only integrates travel information without a payment function, which is not a widely accepted concept of MaaS. Considering the importance of Beijing and the current development status of MaaS in Beijing, this study chose Beijing to explore the willingness to use MaaS.
For the purpose of this study, online-based data collection was effective because MaaS is more likely to be used by groups with frequent access to the Internet. Therefore, an online survey which has the advantages of wide coverage and low cost was conducted to investigate individuals’ willingness to use MaaS. An anonymous questionnaire was conducted through WJX, which is an online platform providing questionnaire-design and -filling functions, in Beijing, from 14 February 2022 to 14 March 2022. A total of 2742 responses were collected from the online survey. In total, 1260 valid responses were selected for the analysis after data processing, in which respondents with very low response times and inconsistent responses were removed.
Sample size formula, as shown in Formulas (4)–(6), was applied to determine whether 1260 valid questionnaires are appropriate for generalizing the results to the population.
where
n is the sample size;
E is the margin of error;
N is the population size;
r is the fraction of responses; and
is the critical value for the confidence level,
c. In this study, let the acceptable margin of error be 5%; the confidence level be 95%; the population size be 21,843,000, which is the number of permanent residents in Beijing in 2022; and the response distribution be 50%. Then, the minimum recommended size for the survey is 385. Therefore, the sample size of this study is appropriate.
4.1.2. Descriptive Statistics
According to the survey results, after the implementation of MaaS, 44.29% of people strongly agree to using it, 33.33% of people agree to using it, 14.92% of people are neutral, 5.40% of people disagree to using it, and 2.06% of people strongly disagree to using it. Overall, most of the individuals, which are 77.62%, are willing to use MaaS after it is implemented. More specifically,
Table 6 and
Table 7 show a summary of the basic descriptive analysis of the sample, which includes the frequency distribution of socioeconomic and mobility characteristics and intention to use MaaS for each indicator. The frequency distribution of socioeconomic characteristics of the sample indicates significant heterogeneity, suggesting that the sample contains different types of individuals to some extent in Beijing, China.
Compared to the seventh national census of Beijing, the present study sample comprised more females (56.2% versus 48.9%) and, consequently, fewer males (43.8% versus 51.1%), as shown in
Table 6 [
46]. Both men and women have a strong tendency to use MaaS, with nearly half of them (43.49% and 44.91%) expressing a strong desire to use MaaS after it is implemented. Regarding age, individuals aged from 25 to 34 accounted for the largest proportion of the total sample, which is 37.1%, and they constitute the highest proportion (83.43%) of those tending to use MaaS. There are only 3.4% of samples aged above 54 years old. Most of the individuals’ ages were concentrated in the 18-to-54-year-old range, with a proportion of 90.6%. Among the population with a strong desire to use MaaS, the highest proportion is 51.59% for those under 18 years old, and the lowest proportion is 14.43% for those over 60 years old. We found a significant proportion of individuals with a bachelor’s degree, which is 71.3%, while the percentage of non-university is 28.7%. Regarding education level, an interesting finding is that the individuals with the highest degree, a doctoral degree, make up the lowest proportion (32.68%) of respondents who strongly agree with the idea of using MaaS and the highest proportion (9.34%) of those who strongly disagree with the idea of using MaaS.
According to the Chinese situation, the occupations in the survey questionnaire are divided into five categories: student, private-enterprise employee, state-owned-enterprise employee, civil servant, and others. Private-enterprise employees have the highest proportion (84.68%) who said strongly agree or agree in regard to using MaaS and the lowest proportion (0.62%) who said strongly disagree in regard to using MaaS. Among all the occupations, state-owned-enterprises employees have the lowest proportion who said they strongly agree with using MaaS, which is 39.98%. In terms of monthly income, the proportion of respondents whose monthly income is below CNY 8000 accounts for 53.92% while approximately half of the respondents have a monthly income of more than CNY 8000. In total, 52.69% of the individuals whose monthly income is between CNY 10,001 and CNY 15,000 strongly agree with the idea of using Maas, and 86.56% of them are willing to use MaaS, thus indicating that they are most likely to use MaaS. It is interesting that individuals with the highest and lowest monthly incomes have the lowest rates of willingness to use MaaS, i.e., 73.98% and 71.12%, respectively. Concerning the household size of the interviewees, the majority of the sample is represented by families with four or more people, with a percentage of 59.4%.
Table 6 shows that single people are more likely to use MaaS, with 52.91% of them choosing strongly agree in regard to using MaaS. In light of familiarity with MaaS, 42.4% of the sample had heard of the concept of MaaS, while the remaining 57.6% indicated not having heard of the concept of MaaS. Compared to the individuals who have never heard of MaaS, the individuals who have heard of MaaS have a stronger desire to use MaaS (45.11% versus 43.68%).
Table 7 shows that nearly three-quarters of respondents chose bus/subway as their main travel mode, and each of the four kinds of travel modes—taxi/online car-hailing, private car, shared bicycle, and walk—accounted for more than one-third of the sample. A total of 50%, which is the highest percentage of “strongly agree”, of the individuals whose main travel mode is only taxi/online car-hailing strongly agree with the idea of using MaaS; and 38.96%, which is the lowest percentage of “strongly agree”, of the individuals whose main travel mode is private car and other travel mode (except public transport) strongly agree with the idea of using MaaS. It is notable that, compared to individuals who only use public transport, individuals who only use private cars are more likely to strongly agree with the idea of using MaaS (46.30% versus 40.00%).
Among the respondents, many people have a driver’s license (70.40%). The individuals who have a driver’s license are more likely to use MaaS (79.49% versus 73.19%). Regarding car ownership, individuals who do not own private cars are more likely to accept MaaS, with 46.17% of them strongly agreeing with the use of MaaS, while individuals who own one private car have the highest rate of strongly disagreeing with the use of MaaS, i.e., 2.81%. In the field of bike/e-bike ownership, 66.5% of the sample has a bike/e-bike. The percentage of individuals with and without a bike/e-bike who strongly agree with using MaaS is 44.39% and 44.08%, respectively, and the percentage of them who agree with using MaaS is 33.53% and 32.94%, respectively. It suggests that bike/e-bike ownership has little impact on individuals’ willingness to use MaaS. The frequency distribution of the average travel times within a week is relatively balanced, with each category representing about 25%.
Table 7 shows that, as the average travel time increases, individuals’ willingness to use MaaS gradually increases, which is 72.13%, 76.39%, 80.62%, and 81.36%.
By comparing the average travel distance on weekdays and weekends, it was found that the number of individuals whose average travel distance is less than 5 km is slightly higher on weekends (33.1% versus 30.7%), while the number of individuals whose average travel distance is between 5 km and 20 km is smaller on weekends (43.9% versus 48.8%). On weekday, individuals whose travel distance is between 40 km and 60 km have the strongest willingness (60.78%) to use MaaS. On weekends, individuals whose travel distance is between 10 km and 20 km have the strongest willingness (48.37%) to use MaaS. Concerning travel purposes, 77.2% of the sample travels for commuting, including work, school, etc., while the remaining respondents travel for lifestyle purposes, such as leisure, entertainment, etc. Compared to individuals who travel for lifestyle purposes, individuals who travel for commuting have more willingness to use MaaS.
The descriptive statistics also reveal that the respondents who spend CNY 150–400 on travel per month have the highest proportion (32.5%) of the sample, while the respondents who spend more than CNY 1500 on travel per month have the lowest proportion (5.6%) of the sample. Meanwhile, most of the respondents spend between CNY 50 and CNY 400 (70.7%) on travel per month.
Table 7 also shows that as the monthly travel cost increases, individuals’ willingness to use MaaS gradually increases. Individuals whose travel cost monthly is more than CNY 1500 have the strongest willingness (52.11%) to use MaaS. The individuals whose travel cost monthly is less than CNY 50 have the highest strongly disagree rate in regard to using MaaS, i.e., 3.03%.
4.2. Reliability and Validity Tests of Scale Data
The reliability and validity tests were performed using IBM Statistical Package for the Social Sciences 27 on a Lenovo laptop with an Intel(R) Core (TM) i7-10750H 2.60 GHz CPU and 32.0 GB of RAM. In this study, the Cronbach’s alpha coefficients of the total scale and four subscales corresponding to four latent variables of travel philosophy, travel preference, perceived usefulness, and perceived risk were calculated to analyze the consistency of the data, as shown in
Table 8. If the questionnaire results are reliable, the Cronbach’s alpha coefficient of the total scale should preferably be above 0.8, or at least above 0.7 [
47]. The Cronbach’s alpha coefficient of the subscale is preferably above 0.7, or at least above 0.6. If the Cronbach’s alpha coefficient is below 0.6, a new questionnaire should be considered.
Table 8 shows that the Cronbach’s alpha coefficients of the subscales are all larger than 0.8, thus indicating that the questionnaire data have high internal-consistency reliability.
Prior to conducting a validity test, it is essential to utilize Kaiser–Meyer–Olkin (KMO) and Bartlett’s Test of Sphericity to assess the suitability of the data for conducting exploratory factor analysis. A KMO value greater than 0.6 and a Bartlett’s Test of Sphericity
p-value less than 0.05 are necessary [
48].
Table 9 shows that the KMO value is 0.892, the Approx. Chi-Square of Bartlett’s Test of Sphericity is 6202.882, and the
p-value is 0.000, indicating that the scale data are appropriate for performing the Confirmatory Factor Analysis.
CFA establishes the connection between indicators and factors prior to analysis. As such, it serves the purpose of hypothesis testing and can also function as a method to assess the construct validity of scales. CFA was performed using Amos 26 on a Lenovo laptop with an Intel(R) Core (TM) i7-10750H 2.60 GHz CPU and 32.0 GB of RAM in this study. The result of CFA reported great indexes of fitness:
, GFI = 0.952, AGFI = 0.911, CFI = 0.976, NFI = 0.943, IFI = 0.964, and RMSEA = 0.035.
Table 8 shows that the factor loadings of all variables are larger than 0.6, which indicates that the questionnaire data have good convergent validity.
4.3. Structural Model Analysis
The bootstrap method was conducted with a resample size of 5000 to evaluate the effects of latent variables on behavioral intention. The results were calculated in the Amos software, as shown in
Table 10. The influence path refers to the directional relationship and causal link between two variables in the model, representing how one variable affects or influences another. These paths are typically depicted as arrows in the path diagram and correspond to the hypothesized causal relationships in the model. The standardization coefficient represents the influence between variables, while the value of the coefficient represents the degree of influence. The larger the absolute value of the coefficient, the greater the degree of influence. The positive and negative coefficients indicate positive and negative effects, respectively. C.R. (Critical Ratio) is an important statistical indicator primarily used to assess the significance of path coefficients; it equals the ratio of the path coefficient to its standard error. The
p-value is the concomitant probability of the statistical test of C.R. The
p-value represents the significance level. Generally, when the absolute value of C.R. is greater than 1.96 and the
p-value is less than 0.05, the null hypothesis is rejected at a significance level of 0.05. The SEM model assumes that all path coefficients are equal to zero. Therefore, if the hypothesis is rejected, it indicates that there is a significant influence between latent variables at a significance level of 0.05.
The following is the analysis of results from
Table 10:
H1~H6 are true, indicating that the research behavioral model is reasonable and that the parameter estimation and hypothesis testing provided by SEM are effective. We can make rational inferences based on these results.
Travel philosophy plays an important role in individuals’ choices of travel mode, travel time, and travel-planning tools. From the perspective of latent variables, travel philosophy (coefficient = 0.276) has a significantly positive impact on behavioral intention. Meanwhile, travel philosophy also has a significantly positive impact on travel preference (coefficient = 0.415) and perceived usefulness (coefficient = 0.283). The latent variable of travel philosophy measures individuals’ value judgments on safety, convenience, economy, comfort, and environmental friendliness in travel that determine the travel preferences of individuals during the actual travel process and reflect individuals’ perception of the usefulness of MaaS. From the perspective of observed variables, convenience is the most important element for individuals through the travel process, followed by economy, comfort, and safety, while environmental protection is the least influential factor.
Travel preference indicates individuals’ inclinations toward factors such as travel time and costs. From the perspective of latent variables, travel preference (coefficient = 0.308) has a significantly positive impact on behavioral intention. From the perspective of observed variables, individuals who prefer the travel mode with short waiting and travel times are more likely to use MaaS. It indicates that travel efficiency is a considerably important factor in the travel process. Individuals who are willing to adopt more convenient modes of transportation different from their original ones have a positive impact on the use of MaaS, meaning that those who are more receptive to new things will increase their tendency to use MaaS. Individuals who prefer using smartphones to plan their trips are more likely to use MaaS because MaaS is an intelligent application platform, and its operations are all completed on a single platform or an app. MaaS enables users to complete the entire travel process on one platform, making it reasonable for those who do not want their itinerary to be interrupted to prefer using MaaS.
Perceived usefulness is a key antecedent of the research behavioral model and consistently impacts individuals’ behavioral intentions toward MaaS. From the perspective of latent variables, perceived usefulness (coefficient = 0.364) has the most significantly positive impact on behavioral intention, as compared to travel philosophy and travel preference. This result is consistent with prior research; for example, Burak Can Altay et al. found that perceived usefulness was the most crucial factor influencing individuals’ attitudes toward using MaaS, with a direct effect of 0.3. From the perspective of observed variables, individuals who think MaaS can improve their travel efficiency are more likely to use MaaS compared to individuals who think that MaaS can improve their current travel situation. Individuals who care more about a high-performance/price ratio and, thus, can be considered price-sensitive have the least positive impact on perceived usefulness.
Perceived risk is the anticipation of a negative outcome in the process of using MaaS. From the perspective of latent variables, perceived risk (coefficient = −0.141) has a significantly negative impact on behavioral intention. Individuals’ willingness to use MaaS has been reduced since they harbor psychological concerns regarding the potential adverse circumstances that may arise while utilizing MaaS services. From the perspective of observed variables, users are most worried that MaaS may use their private information for other purposes without their authorization. For example, some platforms or apps illegally collect private information and sell it to other organizations, even scam groups, causing significant losses. This kind of thing happens every day, posing certain obstacles to the use of MaaS.
Behavior intention represents willingness to use MaaS since MaaS has not been implemented in Beijing. From the perspective of observed variables, individuals have expectations for using MaaS and are willing to try new travel modes if they are more convenient.
5. Conclusions
As a novel mobility solution that aims to provide users with a comprehensive range of mobility services, MaaS has great potential to promote travel efficiency and improve the sustainability of the transportation system. However, MaaS is currently in a developmental stage in most countries, and academic research on MaaS is still in its early phases worldwide. Identifying the latent acceptance factors and mechanisms behind willingness to use MaaS is very important for the successful implementation of MaaS.
In this study, a technology adoption model-based method was applied to analyze the mechanisms that influence individuals’ willingness to use MaaS. Firstly, a modified TAM-based behavioral model including seven latent variables, which are individual characteristics, mobility characteristics, travel preference, travel philosophy, perceived usefulness, perceived risk, and behavioral intention, was established, and six hypotheses were postulated. Secondly, based on the behavioral model, a customized online questionnaire was designed and conducted in Beijing, China. A total of 2742 questionnaires were collected from the survey, of which 1260 were valid. Descriptive statistics were used to analyze the frequency distribution and intention to use MaaS based on the socioeconomic and mobility characteristics. We found that 77.62% of the respondents are willing to use MaaS after it is implemented, and 44.29% of them strongly agree to use it. There are also some interesting findings: Individuals with the highest and lowest monthly incomes have the relatively lowest rates of willing to use MaaS, which are 73.98% and 71.12%, respectively. And compared to individuals who only use public transport, individuals who only use private cars are more likely to strongly agree to use MaaS. Thirdly, the reliability of the scale data was assessed using Cronbach’s alpha coefficient, while the validity was evaluated using Confirmatory Factor Analysis. The Cronbach’s alpha coefficients of the subscales are all larger than 0.8, the KMO value is 0.892, and the factor loadings of all variables are larger than 0.6, thus indicating that the questionnaire data have high internal consistency, reliability, and good convergent validity. Finally, a quantitative analysis of the relationships between variables was applied using the Structural Equation Model. We found that travel philosophy, travel preference, and perceived usefulness positively influence individuals’ behavioral intention to use MaaS, while perceived risk negatively influences individuals’ behavioral intention to use MaaS, with a coefficient of −0.141. Moreover, perceived usefulness has the most significant impact, with a coefficient of 0.364.
The contributions of the present study are threefold. Firstly, this study introduces an innovative model that expands the traditional TAM by incorporating a range of new factors that are specific to the context of MaaS, such as travel philosophy, travel preferences, and perceived risk. This adaptation provides a deeper understanding of the complex mechanisms driving MaaS adoption, offering insights that are crucial for the successful implementation and future development of MaaS systems. Secondly, this study provides a detailed analysis of individuals’ willingness to use MaaS from the perspective of socioeconomic and mobility characteristics. A total of 16 variables and 72 factors affecting the willingness to use MaaS were analyzed. Thirdly, our research results can provide a reference for enterprises to design MssS service content and for governments to formulate sustainable transportation development strategies.
There are also some limitations in this study. Firstly, for research purposes, we simulated a MaaS-usage architecture, which may differ from the actual MaaS program to be used in the future. While this approach may help identify basic motivational mechanisms, it is essential to note that future research on choice behavior should be based on actual applications. In the future, if possible, we will conduct access surveys on actual users of MaaS. Secondly, this study is a stated preference analysis, lacking depth in understanding the increments of specific MaaS parameters and the most attractive options for different potential users. In the future, we will conduct a detailed quantitative analysis of the acceptance and preference levels of MAAS among individuals of different ages, incomes, travel habits, and so on.
Author Contributions
Conceptualization, S.Y. and B.L.; data curation, S.Y. and Y.L.; formal analysis, S.Y.; funding acquisition, H.W.; investigation, S.Y.; methodology, S.Y.; project administration, S.Y.; software, S.Y. and S.H.; supervision, B.L.; validation, S.Y.; writing—original draft, S.Y.; writing—review and editing, S.Y.; proofreading, S.Y., H.W., Y.L. and S.H. All authors have read and agreed to the published version of the manuscript.
Funding
This research was funded by the Pilot Project of the Transportation Power of Research Institute of Highway Ministry of Transport (Grant No. QG2022-2-8-4), the Basic Scientific Research Business Expenses Special Funds from National Treasury of Research Institute of Highway Ministry of Transport (Grant No. 2024-9069), the Basic Scientific Research Business Expenses Special Funds from National Treasury of Research Institute of Highway Ministry of Transport (Grant No. 2024-9071), and the State Key Lab of Intelligent Transportation System Project (Grant No. 2024-Z013).
Data Availability Statement
The data presented in this study are available on request from the corresponding author due to privacy.
Conflicts of Interest
The authors declare no conflicts of interest.
References
- International Energy Agency. CO2 Emissions in 2023. Available online: https://www.iea.org/reports/co2-emissions-in-2023 (accessed on 10 September 2024).
- Yu, S.; Jia, Y.H.; Sun, D.Y. Identifying Factors that Influence the Patterns of Road Crashes Using Association Rules: A case Study from Wisconsin, United States. Sustainability 2019, 11, 1925. [Google Scholar] [CrossRef]
- Yang, Y.; Yin, L.; Yuan, M.Z. Modeling of Freeway Real-Time Traffic Crash Risk Based on Dynamic Traffic Flow Considering Temporal Effect Difference. J. Transp. Eng. Part A 2023, 149, 04023063. [Google Scholar] [CrossRef]
- Cao, Z.C.; Wang, Y.Q.; Yang, Z.H.; Chen, C.G.; Zhang, S.L. Timetable rescheduling using skip-stop strategy for Sustainable Urban Rail Transit. Sustainability 2023, 15, 14511. [Google Scholar] [CrossRef]
- Yu, S.; Li, B.; Liu, D. Exploring the Public Health of Travel Behaviors in High-Speed Railway Environment during the COVID-19 Pandemic from the Perspective of Trip Chain: A Case Study of Beijing–Tianjin–Hebei Urban Agglomeration, China. Int. J. Environ. Res. Public Health 2023, 20, 1416. [Google Scholar] [CrossRef] [PubMed]
- Matyas, M. Opportunities and barriers to multimodal cities: Lessons learned from in-depth interviews about attitudes towards mobility as a service. Eur. Transp. Res. Rev. 2020, 12, 7. [Google Scholar] [CrossRef]
- Wright, S.; Nelson, J.D.; Cottrill, C.D. MaaS for the suburban market: Incorporating carpooling in the mix. Transp. Res. Part A Policy Pract. 2020, 131, 206–218. [Google Scholar] [CrossRef]
- Nikolaidou, A.; Papadopoulos, E.; Politis, I.; Basbas, S. An Indicator-Based Methodological Framework for Assessing an eMaaS Scheme. World Electr. Veh. J. 2023, 14, 186. [Google Scholar] [CrossRef]
- Holmberg, P.E.; Collado, M.; Sarasini, S.; Williander, M. Mobility as a Service: Describing the Framework. Available online: https://www.diva-portal.org/smash/get/diva2:1043942/FULLTEXT01.pdf (accessed on 11 June 2024).
- Nikiforiadis, A.; Tsavdari, D.; Mizaras, V.; Ayfantopoulou, G. Identifying Barriers and Expectations in MaaS: Users’ and Stakeholders’ Perspective. Future Transp. 2023, 3, 1240–1252. [Google Scholar] [CrossRef]
- Hamari, J.; Sjöklint, M.; Ukkonen, A. The sharing economy: Why people participate in collaborative consumption. Assoc. Inf. Sci. Technol. 2016, 67, 2047–2059. [Google Scholar] [CrossRef]
- Grybaite, V.; Stankeviciene, J. Motives for participation in the sharing economy Evidence from Lithuania. Econ. Manag. 2016, 8, 7–17. [Google Scholar] [CrossRef]
- Smith, G.; Sochor, J.; Karlsson, I.C.M. Mobility as a Service: Development scenarios and implications for public transport. Res. Transp. Econ. 2018, 69, 592–599. [Google Scholar] [CrossRef]
- Storme, T.; de Vos, J.; de Paepe, L.; Witlox, F. Limitations to the car-substitution effect of MaaS. Findings from a Belgian pilot study. Transp. Res. Part A Policy Pract. 2020, 131, 196–205. [Google Scholar] [CrossRef]
- Jittrapirom, P.; Caiati, V.; Feneri, A.M.; Ebrahimigharehbaghi, S.; Alonso-González, M.J.; Narayan, J. Mobility as a service: A critical review of definitions, assessments of schemes, and key challenges. Urban Plan. 2017, 2, 13–25. [Google Scholar] [CrossRef]
- Hensher, D.; Ho, C.; Reck, D. Mobility as a Service and private car use: Evidence from the Sydney MaaS trial. Transp. Res. Part A Policy Pract. 2021, 45, 17–33. [Google Scholar] [CrossRef]
- Rindone, C. Sustainable Mobility as a Service: Supply Analysis and Test Cases. Information 2022, 13, 351. [Google Scholar] [CrossRef]
- Kamargianni, M.; Matyas, M. The business ecosystem of mobility-as-a-service. In Proceedings of the TRB 96th Annual Meeting, Washington, DC, USA, 8–12 January 2017; pp. 1–14. [Google Scholar]
- Feng, Y.F.; Cao, Z.C.; Zhang, S.L. Shuttle bus timetable adjustment in response to behind-schedule commuter railway disturbance. Sustainability 2022, 14, 16708. [Google Scholar] [CrossRef]
- Nima, A.; Seda, S.; Kate, P.; Djamila, O. Socially Sustainable Mobility as a Service (MaaS): A practical MCDM framework to evaluate accessibility and inclusivity with application. Cities 2024, 154, 105360. [Google Scholar] [CrossRef]
- Alyavina, E.; Nikitas, A.; Tchouamou Njoya, E. Mobility as a service and sustainable travel behaviour: A thematic analysis study. Transp. Res. Part F Traffic Psychol. Behav. 2020, 73, 362–381. [Google Scholar] [CrossRef]
- Hunecke, M.; Haustein, S.; Grischkat, S.; Bohler, S. Psychological, sociodemographic, and infrastructural factors as determinants of ecological impact caused by mobility behavior. J. Environ. Psychol. 2007, 27, 277–292. [Google Scholar] [CrossRef]
- Datson, J. Mobility as a Service: Exploring the Opportunity for Mobility as a Service in the UK. Available online: https://trid.trb.org/view/1420547 (accessed on 12 July 2024).
- Rindone, C.; Vitetta, A. Measuring Potential People’s Acceptance of Mobility as a Service: Evidence from Pilot Surveys. Information 2024, 15, 333. [Google Scholar] [CrossRef]
- Chinh, Q.H. Can MaaS change users’ travel behaviour to deliver commercial and societal outcomes? Transp. Res. Part A Policy Pract. 2022, 165, 76–97. [Google Scholar] [CrossRef]
- MaaS Alliance. White Paper. Guidelines & Recommendations to Create the Foundations for a Thriving MaaS Ecosystem; MaaS Alliance: Bruxelles, Belgium, 2017; pp. 7–8. [Google Scholar]
- Fioreze, T.; de Gruijter, M.; Geurs, K. On the likelihood of using Mobility-as-a-Service: A case study on innovative mobility services among residents in the Netherlands. Case Stud. Transp. Policy 2019, 7, 790–801. [Google Scholar] [CrossRef]
- Alonso-González, M.J.; Hoogendoorn-Lanser, S.; van Oort, N.; Cats, O.; Hoogendoorn, S. Drivers and barriers in adopting Mobility as a Service (MaaS)—A latent class cluster analysis of attitudes. Transp. Res. Part A Policy Pract. 2020, 132, 378–401. [Google Scholar] [CrossRef]
- Caiati, V.; Rasouli, S.; Timmermans, H. Bundling, pricing schemes and extra features preferences for mobility as a service: Sequential portfolio choice experiment. Transp. Res. Part A Policy Pract. 2020, 131, 123–148. [Google Scholar] [CrossRef]
- Ho, C.; Hensher, D.; Mulley, C.; Wong, Y. Potential uptake and willingness-to-pay for Mobility as a Service (MaaS): A stated choice study. Transp. Res. Part A Policy Pract. 2018, 117, 302–318. [Google Scholar] [CrossRef]
- Wang, W.C.; Yang, Y.; Yang, X.B.; Gayah, V.; Wang, Y.P.; Tang, J.J.; Yuan, Z.Z. A Negative Binomial Lindley Approach Considering Spatiotemporal Effects for Modeling Traffic Crash Frequency with Excess Zeros. Accid. Anal. Prev. 2024, 207, 107741. [Google Scholar] [CrossRef]
- Behren, S.V.; Chlond, B.; Vortisch, P. Exploring the role of individuals’ attitudes in the use of on-demand mobility services for commuting—A case study in eight Chinese cities. Int. J. Transp. Sci. Technol. 2022, 11, 229–242. [Google Scholar] [CrossRef]
- Feneri, A.; Rasouli, S.; Timmermans, H.J.P. Modelling the effect of Mobility-as-a- Service on mode choice decisions. Transp. Lett. 2020, 14, 324–331. [Google Scholar] [CrossRef]
- Ye, J.; Zheng, J.; Yi, F. A study on users’ willingness to accept mobility as a service based on UTAUT model. Technol. Forecast. Soc. Chang. 2020, 157, 120066. [Google Scholar] [CrossRef]
- Schikofsky, J.; Dannewald, T.; Kowald, M. Exploring motivational mechanisms behind the intention to adopt mobility as a service (MaaS): Insights from Germany. Transp. Res. Part A Policy Pract. 2020, 131, 296–312. [Google Scholar] [CrossRef]
- Huang, S. Listening to users’ personal privacy concerns. The implication of trust and privacy concerns on the user’s adoption of a MaaS-pilot. Case Stud. Transp. Policy 2022, 10, 2153–2164. [Google Scholar] [CrossRef]
- Taylor, S.; Todd, P. Assessing IT usage: The role of prior experience. MIS Q. 1995, 19, 561–570. [Google Scholar] [CrossRef]
- Venkatesh, V.; Thong, J.Y.L.; Xu, X. Consumer acceptance and use of information technology: Extending the unified theory of acceptance and use of technology. MIS Q. 2012, 36, 157–178. [Google Scholar] [CrossRef]
- Loubser, J.; Marnewick, A.L.; Joseph, N. Framework for the potential userbase of mobility as a service. Res. Transp. Bus. Manag. 2020, 39, 100583. [Google Scholar] [CrossRef]
- Cao, Z.C.; Wang, Y.Y.; Zhang, S.L. Operation estimation on multiple public transport timetables integrated with vehicle scheduling in practice. Transp. Lett. 2024, 1–19. [Google Scholar] [CrossRef]
- Cottrill, C.D. MaaS surveillance: Privacy considerations in Mobility as a Service. Transp. Res. Part A Policy Pract. 2020, 131, 50–57. [Google Scholar] [CrossRef]
- Ke, L.D.; Chen, Z.; Yung, W.K. A reliability test of standard-based quantitative PCR: Exogenous vs endogenous standards. Mol. Cell. Probes 2000, 14, 127–135. [Google Scholar] [CrossRef]
- Schreiber, J.B. Issues and recommendations for exploratory factor analysis and principal component analysis. Res. Soc. Adm. Pharm. 2021, 17, 1004–1011. [Google Scholar] [CrossRef]
- Öreskog, J.; Thillo, V. A Longitudinal Factor Model For Studying Change In Ability Structure. Multivar. Behav. Res. 1977, 12, 221–241. [Google Scholar] [CrossRef] [PubMed]
- Savalei, V. Understanding Robust Corrections in Structural Equation Modeling. Struct. Equ. Model. 2014, 21, 149–160. [Google Scholar] [CrossRef]
- The People’s Government of Beijing Municipality. Main Data of the Seventh National Population Census of Beijing. Available online: https://www.beijing.gov.cn/gongkai/shuju/sjjd/202105/t20210519_2392877.html (accessed on 5 September 2024).
- Renske, V.; Jan, A.A.; Yashar, A.; Gonçalo, H.; Bert, W. Mobility-as-a-Service (MaaS): A latent class cluster analysis to identify Dutch vehicle owners’ use intention. Transp. Res. Part A Policy Pract. 2023, 169, 103608. [Google Scholar] [CrossRef]
- Kaiser, H.F.; Rice, J. Little Jiffy, mark IV. Educ. Psychol. Meas. 1974, 34, 111–117. [Google Scholar] [CrossRef]
| Disclaimer/Publisher’s Note: The statements, opinions and data contained in all publications are solely those of the individual author(s) and contributor(s) and not of MDPI and/or the editor(s). MDPI and/or the editor(s) disclaim responsibility for any injury to people or property resulting from any ideas, methods, instructions or products referred to in the content. |
© 2024 by the authors. Licensee MDPI, Basel, Switzerland. This article is an open access article distributed under the terms and conditions of the Creative Commons Attribution (CC BY) license (https://creativecommons.org/licenses/by/4.0/).


