Abstract
Airborne dust easily accumulates on the top of solar panel surfaces and reduces the output power in arid regions. A commonly used mitigation solution for dust deposition issues is cleaning PV panels periodically. However, cleaning frequency affects the economic viability of solar PV systems, resulting in a trade-off between cleaning costs and energy loss costs. To address this issue, this study relates several metrics and develops a generic framework based on simulation and optimization to determine the optimal cleaning interval. Based on the computational tests, the optimal cleaning interval in Abu Dhabi is determined to be 34 days, which is longer than the currently recommended cleaning interval of 28 days. This study also identifies that energy recovery is responsive to decreases in unit cleaning costs in the presence of high electricity tariffs, whereas total cost savings show sensitivity when electricity tariffs are low. Finally, this study discusses energy policy implications by presenting an innovative concept involving the introduction of a cleaning subsidy which could reshape energy system cost dynamics, making PV systems economically competitive beyond the conventional levelized cost of electricity.
1. Introduction
In recent decades, solar energy has been the subject of significant public attention and intense research in various fields, and solar energy systems are now being widely deployed in global energy markets. The International Renewable Energy Agency reported that solar photovoltaic (PV) capacity was approximately 1050 GW in 2022, or 4.5% of total global electricity generation, surpassing wind energy capacity [1].
Solar PV generation highly depends on the amount of irradiance generated from the sun, which is why the majority of solar power farms are located in arid regions with high levels of irradiance. However, a large portion of the irradiance is reflected and scattered, and the absorbed portion is not entirely converted into electrical energy. The energy conversion efficiencies of current commercial PV modules are 25% or less [2].
Furthermore, in arid regions, airborne dust and sand accumulate on top of the solar panel surface, significantly reducing the output power. This issue is known as soiling, which is generally defined as the accumulation of dust, dirt, leaves, and bird droppings on PV modules [3]. Many factors contribute to PV soiling issues, particularly regional environmental conditions.
Local weather has a major impact on soiling through particle deposition and removal. Figure 1 illustrates various influential parameters, including airborne dust, wind speed, humidity, temperature, and rainfall. Airborne dust is the most dominant factor, followed by wind, which can help accumulate dust on the panels at low wind speeds as well as remove it at higher speeds. These parameters affect the amount of dust deposited on the surface that can shade, block, or limit the sun’s irradiance, thus reducing the amount of power generated from the PV panel.
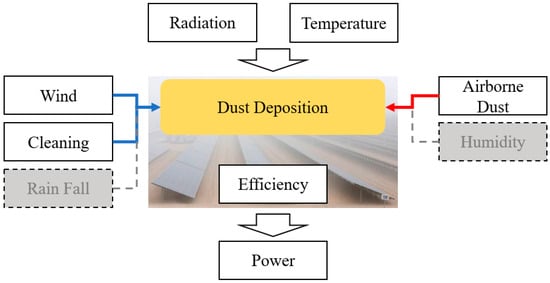
Figure 1.
Various factors affecting solar panel efficiency.
This research aims to accomplish three main objectives: (1) develop a sophisticated, simulation-based optimization framework to determine the optimal cleaning interval in arid regions; (2) investigate a real-world case study in Abu Dhabi; and (3) discuss policy implications concerning PV system cleaning costs.
Many studies have addressed soiling issues and investigated the impact of dust deposition on solar panel modules. According to a study by [4], when solar PV modules were left unclean for more than six months, their output power decreased by 50%. [5] showed that after two weeks of the dry season in Saudi Arabia, the PV output power decreased by 10.8%. [6] examined the effect of soiling on a single rooftop for a month and showed a 22% loss in PV performance.
Ref. [7] analyzed the composition and distribution of dust on the surface of PV panels in the East Bank of the Nile region and introduced a PV soiling index. Their results showed a uniform distribution and a decrease in power capacity of more than half. Furthermore, studies showed that geographical location plays an important role in soiling because of the different modules’ tilt angles and weather conditions in different locations [8,9].
The effect of longer time on PV soiling was addressed by [10], who performed their experiment in the Sultanate of Oman. They analyzed how dust accumulation varies throughout the year and is most strongly influenced by particulate matter. Similarly, [11] performed a study in Sharjah in the UAE on the nature of particles and their effect on power reduction, which was 8.5% after 41 days.
Quantifying efficiency degradation over a specific length of time is crucial for this study; as such, we summarize PV performance reduction reported in the literature over different time durations and in different locations, as presented in Table 1. Since their experimental durations are different, the PV performance reductions are not directly comparable.

Table 1.
PV performance reduction over time in different locations.
A current major research trend involves investigating and modeling the performance loss of PV modules as a function of dust accumulation. Ref. [24] developed three equations to calculate power, current, and efficiency as a function of the accumulated amount of dust on a PV module. Ref. [25] combined indoor and outdoor experiments and found that deposition decreases the short circuit current by 30–40%. Ref. [26] summarized the impact of dust on solar panel efficiency, demonstrating that efficiency degradation is linear with dust density.
Ref. [27] developed two models to evaluate and forecast the influences of dust deposition on the transmittance of PV modules. Ref. [28] integrated field measurements and modeling and assessed the impact of particulate matter resulting from fossil fuel combustion on solar power generation. Likewise, ref. [29] identified a correlation between dust accumulation and PV current, voltage, power, and efficiency. They also validated the model proposed by [24] and developed improved polynomials. Ref. [30] quantified the amount of dust that deposited daily on a PV module surface. Their stepwise regression analysis found that deposition was affected by wind speed more than particulate matter and humidity. Specifically, when the wind speed exceeds 3 m/s, deposits are reduced on panel surfaces.
Ref. [13] performed a study in Sharjah in the UAE in which they revealed a linear relationship between normalized power and dust density, with a drop of 1.7%/g/m2. They also reported that the tilt angle had a substantial impact on deposition. Recently, a machine learning-based method to estimate dust accumulation was introduced by [31]. They developed a regression tree model based on their experimental data for irradiance, temperature, and PV module power.
Several recent reviews comprehensively summarized key factors affecting dust deposition, including wind velocity, wind direction, the surface structure of the module, the characteristics of the dust particles, surface temperature, PV manufacturing materials, coating materials and types of glass covers, humidity, tilt angle, and orientation [32,33].
As a mitigation strategy for dust deposition, cleaning PV panels has been widely adopted using different technologies. However, due to the cost of cleaning, investigations involving economic analyses of cleaning frequency have been performed. Ref. [34] performed a cost comparison study for PV cleaning systems in remote sites in the UAE by examining the cost components of three cleaning methods. Ref. [35] indicated that the total cost of production losses caused by dust was lower than the total cost of cleaning.
Ref. [36] derived a general expression for optimal cleaning intervals, applying it to PV modules in central Saudi Arabia over a year and showing that optimal cleaning costs are smaller than typical operation and maintenance costs. Ref. [37] also experimentally investigated PV module cleaning scheduling in Kuwait. They observed significant efficiency degradation in April, May, and October when the experimental panels required weekly cleaning to maintain efficiency losses below 15%; for the other months, they found a 30-day cleaning interval to be appropriate.
Ref. [38] developed a simple formula for optimal PV cleaning periods, based on the assumption that accumulation increases linearly with time. Ref. [16] proposed an improved framework to estimate the economic impact of soiling on the PV system, considering humidity, tilt angle, and precipitation, and to determine the optimal cleaning frequency. The framework was used in seven cities globally, including Doha in Qatar, where the efficiency losses reached 80% over 140 days. However, the authors used a simple Monte Carlo simulation-based method with trivial triangular distributions for uncertain factors.
Ref. [39] evaluated the soiling cost of PV power plants in China to be 16,100–22,200 USD/MW, which they argued could be reduced by 36.5–50.3% if their proposed optimal cleaning interval were to be applied. Based on a model developed after experimental investigation, they suggested cleaning frequencies of 10 days and 23 days when using dry and wet cleaning methods, respectively. Similarly, in Al Ain in the UAE, Shah et al. (2020) [12] measured the decrease in irradiance intensity and power output for four selected cleaning frequencies. Their study revealed that the output power dropped by 13% for a three-month cleaning interval, and only by 4% for a 15-day cleaning interval. In addition, the Abu Dhabi government in the UAE recommends a 4-week (28 days) cleaning interval in its region based on empirical evidence [40].
Although several studies have addressed the soiling issue on solar PV systems, most of the research has been performed in laboratories or using small-scale outdoor experiments that do not capture the entire year. Also, detailed modeling of weather data for a period longer than one year has not previously been performed. Recently, a few studies have proposed data-driven methods to determine an economically optimal cleaning frequency: simulation-based optimization [16], deterministic optimization-based scheduling [41], Markov decision process [42], and prediction-based cleaning scheduling [43]. However, there is still a lack of research addressing uncertainties, and further studies in this area are needed.
Hence, to effectively address the soiling issue, we must address challenging issues that were not adequately addressed in previous studies. As such, we propose the following questions: How can we determine the ideal cleaning frequency for a given PV system, especially in arid regions, to minimize cleaning expenses while maximizing energy generation? Is the Abu Dhabi government’s current recommended cleaning interval for PV systems of 28 days the optimal frequency? Should a government implement new energy policies to address soiling problems?
From a system standpoint, this study contributes to the development of a management framework to optimize the cleaning schedule for solar PV systems and offers a systematic solution to enhance system efficiency. This study can provide valuable tools and insights for policymakers and system managers, assisting them in effectively managing solar PV energy systems in Abu Dhabi. These findings may also have broader relevance to other arid regions.
2. Methods
This study began with gathering the required data from reliable and reputable sources. After basic preprocessing of the collected data (e.g., data cleansing), we proposed several metrics to estimate the total costs. Then, using the developed metrics, a simulation-based optimization model was developed to minimize the total costs by determining the optimal cleaning interval. Then, we conducted a case study by examining possible scenarios. Finally, we analyzed the results and their implications for supporting policies.
2.1. Data Collection
We collected several streams of data from different sources. In particular, four weather parameters—temperature, wind speed, particulate matter, and irradiance, as presented in Table 2—were gathered from 2018 to 2020 in the target area, Abu Dhabi. The daily average was used to represent the daily data for temperature and wind speed. Irradiance is the value measured throughout the day by the National Center of Meteorology [44]. Regarding particulate matter, the Sand and Dust Storm Warning Advisory and Assessment System provides particulate matter data recorded at 12:00 PM GMT [45].

Table 2.
Weather data and sources.
In the collected data, there were a few missing data points. In such a case, we substituted the missing data points with the monthly average value. In addition, the data for 29 February 2020, were not included because February only had 28 days in 2018 and 2019.
Particulate matter data were provided in Network Common Data Form format, a file format that supports the creation, access, sharing, and storing of multi-dimensional scientific data. Data in this format were converted to a CSV format to be used in this study, using National Oceanic and Atmospheric Administration’s Weather and Climate Toolkit 4.6.1 software [47].
To evaluate electricity tariffs, we used the information provided by Abu Dhabi Distribution Company (Abu Dhabi, United Arab Emirates) [48], a government agency in Abu Dhabi. The company supplies electricity at 0.073 USD/kWh for expatriate residents and 0.018 USD/kWh for UAE citizens (Abu Dhabi Distribution Company). These are the two basic rates applied to the majority of residents in Abu Dhabi, although there are higher or lower rates for special cases.
2.2. Metric Modeling
To estimate the operating cost of cleaning PV panels, several metrics were defined, including daily dust deposition, soil accumulation over a certain period, PV panel efficiency, and energy loss. The detailed modeling procedure is provided in the following subsections.
2.2.1. Daily Dust Deposition
First, the daily dust deposition was computed using the accumulation formula proposed by [30]. The formula of daily soil deposition, Dep, is shown in Equation (1):
where WS is wind speed in m/s, PM is particulate matter in g/m2, and ΔWS is the hourly change in the wind speed. The formula employs both the wind speed and the particulate matter predictors to estimate the daily deposition. In this formula, wind speed has the strongest influence on the overall accumulation rate.
It should be noted that the last term, −14.9ΔWS, was ignored here because there were no available hourly wind speed data to calculate ΔWS, and its estimated value was considered to be insignificant compared to the other terms. Thus, Dep is modified to DDep as presented in Equation (2).
Here, is a constant to convert the unit of from µg/(m2min) to g/(m2day) so that the resulting value can be used in the efficiency equation directly.
2.2.2. Dust Accumulation
Dust accumulation can be calculated by summing the daily deposition in Equation (2) over a certain period. Ref. [30] observed an apparent negative correlation between dust accumulation and wind speed. At higher wind speeds, the dust accumulation rate decreases. When the wind speed exceeds 3 m/s, the panel consistently becomes cleaner on average. Equation (2) can result in a negative value, indicating that high wind speeds would result in reduced dust accumulation.
However, based on our experience, dust might not be removed completely by high-speed winds due to the high levels of humidity, particularly during the nighttime, in the UAE. In the desert climate of the Middle East, the humidity during the daytime, when solar power generation is possible, is minimal due to the extreme dryness, meaning that the impact of humidity on solar energy generation during this period is negligible. Although humidity rises at night, it dries almost completely after sunrise every morning, so the influence of accumulated dust due to humidity is expected to be very limited. In this study, based on empirical observations and existing data in [14], we propose a calibration factor α to indirectly account for the effects of humidity on dust adhesion. The calibration factor α is a ratio that indicates the amount of dust that is naturally removed by the wind.
where stands for the modified daily deposition. If is negative at high wind speeds, its effect will be considered not by 100% but by α. To estimate the calibration factor in Equation (3), we developed an Excel-based manual logic to calculate PV panel efficiency using all the equations described in this study. Then, an Excel optimization solver determined the best value of the calibration factor to be 0.1 by examining the search space from 0 to 1 and targeting the PV reduction in Table 1 from [14].
Dust accumulation, Acc(t), can be expressed as the sum of the accumulation up to the previous day, Acc(t − 1), and today’s deposition, DDep’, as presented in Equation (4).
Unless the PV modules are intentionally cleaned by a laborer or a machine, we assume that the dust will not be completely removed and some dust residues would always remain. The minimum residue level is assumed to be 0.01 g/m2 and is used to calculate the modified accumulation as presented in Equation (5).
2.2.3. PV Panel Information and Efficiency
For this study, we assume that a polycrystalline silicon panel is used in the PV system because this type of panel is commonly available in the target region [49]. Table 3 lists the specifications of the assumed solar PV module used in the calculations. The size, lifespan, rated power, and efficiency are the primary parameters utilized in this research.

Table 3.
Assumed solar PV module specifications.
Since PV panel efficiency decreases as dust accumulates on it, this study computes the efficiency using Equation (6), developed by [29], which is valid for dust accumulation levels below 3 g/m2. It is assumed that regular maintenance and technological advancements would minimize the degradation of the panel’s efficiency over time.
For clarity, it should be reiterated that the units for the accumulated amount of dust in Equation (6) are g/m2. As listed in Table 3, the maximum efficiency of the panel is assumed to be 19.2%.
2.2.4. Energy Loss
Finally, the energy loss due to the decrease in the efficiency was calculated, utilizing Equation (7), proposed by [47], which calculates the expected amount of electrical energy generated from the PV panel, considering specific irradiance, temperature, and system efficiency.
where is the energy loss of day t in kWh, P is power in kW, H is irradiance in kWh/m2, and k is the temperature coefficient which is assumed to be 0.0043 [50].
2.3. Simulation-Based Optimization
Due to the high level of uncertainty in weather data, a discrete-event simulation method was utilized to mimic the target system by generating random variates of the four weather factors—airborne particulate matter, wind speed, temperature, and radiation—based on the probability distribution fitted to the collected data (see Section 2.4). Then, the optimization model was embedded into the simulation model to minimize the total cost by determining the best cleaning interval under the considered cost and tariff structure.
2.3.1. Simulation Model
Figure 2 illustrates the overall logic implemented in the simulation model. The model first generates weather factors randomly according to the input distributions. It then calculates the daily dust deposition using Equation (2). If the deposition value is negative, it is multiplied by the calibration factor as shown in Equation (3). Then, the dust deposition value is added to the amount of dust to keep the dust accumulation value as defined in Equation (4). Next, the model checks if the current day is a cleaning day by comparing the value of a counter with the input cleaning interval.
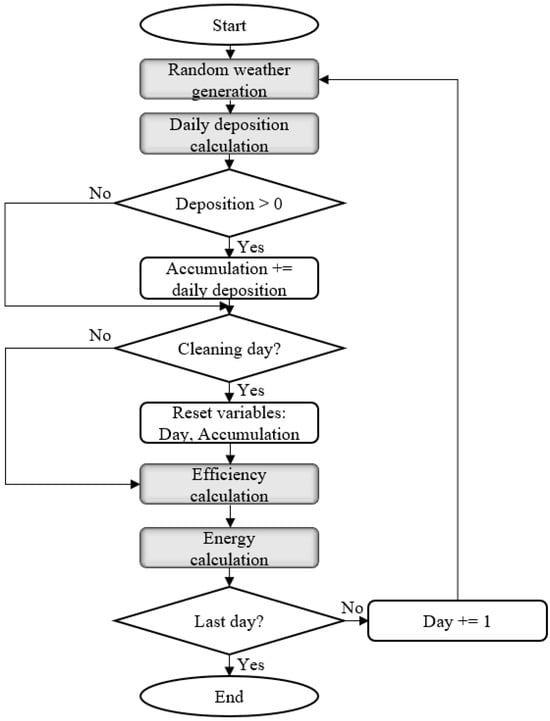
Figure 2.
Logic flow chart of the simulation model.
When a cleaning event occurs (i.e., the day is equal to the cleaning interval), the number of cleanings is incremented by one, the amount of the accumulated dust is reset, and the day is set to zero.
If the current day is not a cleaning day, the model proceeds to check the accumulation value. If it is below the minimum residue , the accumulation is assigned the value of (see Equation (5)). The model continues to calculate efficiency using Equation (6) and energy loss using Equation (7). When the day counter reaches the last day of the lifespan, the logic ends; otherwise, the day counter increases by one day and goes back to the starting point.
2.3.2. Optimization Model
This subsection describes the optimization model embedded in the simulation model, formulated using the following equations.
subject to
where cleaning interval z is a decision variable. Objective (8) is to minimize the expected value of the total cost, which is the sum of the cleaning cost(z) and energy loss cost(z). The two cost terms are defined by the following equations.
It should be noted that energy loss in day t, , is a function of z implicitly by Equations (5) and (6). Constraint (9) limits the range of the considered cleaning interval. The presented optimization model was implemented using OptQuest, which is an add-in optimization module in Simio v14 simulation software.
2.4. Weather Data and Distribution Fitting
Three years of daily data for temperature, wind speed, radiation, and particulate matter are plotted in Figure 3. Figure 3a displays the daily temperature variation over three years. Significant fluctuations can be observed in January, February, and March, as opposed to minor variances in August, October, November, and December, indicating more stable temperatures.
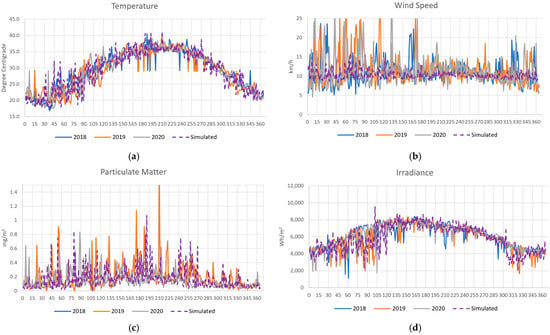
Figure 3.
Daily weather data for three years: (a) temperature, (b) wind speed, (c) particulate matter, and (d) irradiance.
Examining Figure 3b, wind speed fluctuates significantly, except from July to September. For particulate matter, since 2019 data were not provided by WMO for Abu Dhabi (24.5 N, 54.375 E), 2018 data are substituted for 2019 data. Figure 3c illustrates random seasonal dust fluctuations. Several high peaks in the chart might be caused by unpredictable dust storms.
Figure 3d plots irradiance data, which are provided by the National Center of Meteorology, UAE [44]. The average annual irradiance was 2213.4 kWh/m2 over the three years. Some fluctuations can be observed in February, April, May, and August. However, there is a general trend of increasing irradiance in summer and decreasing irradiance in winter.
To generate data randomly in simulation tools, the distribution pattern of the collected data must be known. A statistical tool, Stat::fit v3 software (Geer Mountain), was used to determine the distribution for each parameter, month by month, to capture the pattern for each month. Table 4 provides a summary of these distributions using the Simio software format [51]. For a detailed explanation of statistical analysis methods, we refer readers to [52].

Table 4.
Monthly distributions of the collected three-year weather data (in Stat::fit format).
As Table 4 shows, there is no significant difference between subsequent months. However, there is a significant difference between months that are far apart, implying that fitting the distribution to a relatively short period (monthly) results in more realistic distributions.
3. Results
This section provides the experimental design used in the computational tests. The results of the simulation experiments are then analyzed.
3.1. Design of Experiment
The objective of this study is to determine the optimal cleaning interval that minimizes the total operating cost including the cleaning and energy loss costs. Thus, it is of interest to investigate the impact of the electricity rate and cleaning cost on the optimal cleaning cycle. Ref. [12] assumed the cleaning cost in UAE to be 0.03 USD/m2/cleaning cycle, similar to the cost in Saudi Arabia. In this case, considering a 1.96 m × 0.992 m panel, the cost is 0.0583 USD/cleaning cycle. We generated 10 test cases with two electricity rates, for expats in the UAE (0.073 USD/kWh) and UAE nationals (0.018 USD/kWh), as well as five different cleaning costs (i.e., the basic cleaning cost of 0.0583 USD/panel/cycle and two higher and two lower values). The test cases are summarized in Table 5.

Table 5.
Experimental design.
3.2. Simulation Results
This subsection presents the validation results of the developed model and the associated computational results.
3.2.1. Validation
To test the goodness of the fit of the distributions observed for the weather data, we generated weather data randomly using the distributions and fitted and illustrated them, which are presented as dotted lines in Figure 3 in Section 2.4. The graphs generated from the simulations show similar patterns to the actual data.
For the simulation model, each detailed logic was validated thoroughly with different test cases. To validate the model, we conducted an experiment using Excel (v2409 in MS Office 365) manual calculations and the simulation model with the same cleaning intervals, cleaning cost, and electricity tariff. The Excel calculations were performed using the weather data for 2018, 2019, and 2020, but the simulation model used the randomly generated weather data. As can be seen in Figure 4, the resulting total cost curve from the simulation model shows a similar pattern to the curves generated based on the Excel calculations, validating the computational logic in the simulation model.
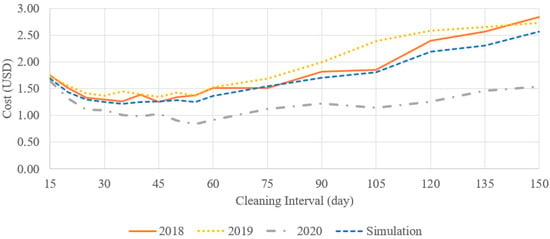
Figure 4.
Validation of the simulation model.
3.2.2. Simulation Results
For each case in Table 5, the OptQuest optimization module was used to determine the optimal cleaning interval. OptQuest employs the Kim and Nelson algorithm to identify optimal solutions for stochastic outputs [53]. In this optimization process, a 95% confidence level was set, with an indifference zone of 0.1 to define negligible performance differences. The final reported solution represents a statistically significant optimal value with 95% confidence, where cost differences up to 0.1 were considered negligible. During the OptQuest run, the number of replications for different cleaning intervals was dynamically adjusted from 10 to 100 to maintain the required confidence level within the 0.1 indifference zone.
Table 6 shows the optimal results for the 10 cases. Column 1 lists the names of the 10 cases, and column 2 gives the optimal cleaning interval. Column 3 provides the cleaning cost, and columns 4 and 5 give the total energy loss and the related energy loss cost, respectively. Column 6 provides the total cost, and column 7 shows the minimum efficiency of the PV panel observed during the 20-year simulation run, which is defined as 100% performance reduction. Finally, column 8 provides the energy loss percentage due to dust accumulation.

Table 6.
Computational test results.
For the current electricity tariff in Case S3exp and Case S3uae, the optimal cleaning intervals are determined to be 34 days and 72 days, respectively. Specifically, the optimal cleaning interval of 34 days for Case S3exp has practical implications because the currently recommended cleaning interval in Abu Dhabi is 4 weeks (28 days) for the expat tariff. Since this recommended interval is shorter by nearly one week than the optimal interval found in this study, it may result in operating costs that are higher than necessary. Please refer to Table S1 in the Supplementary Materials for examples of the total cost distributions obtained from the OptQuest optimization tool for cases S3exp and S3uae.
Figure 5 illustrates the detailed cost curves of Case S3exp based on the cleaning interval. As the cleaning interval increases, the cleaning cost decreases while the energy loss cost increases. For a cleaning interval of 34 days, the total cleaning cost—the sum of cleaning and energy loss costs—reaches its minimum value, thus indicating the optimal cleaning interval. Furthermore, as the cleaning interval increases, the minimum efficiency decreases as well.
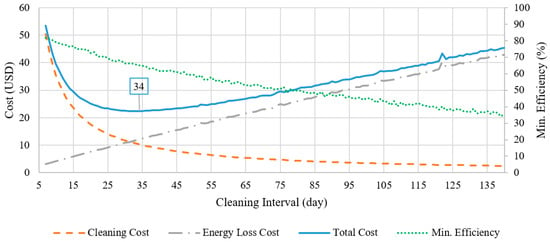
Figure 5.
Simulation output of Case S3exp.
From Table 6, as the unit cleaning cost increases, i.e., from Cases S1 to S5, both the optimal cleaning interval and the total cost increase. From Cases S1 to S5, the cleaning cost increases because the increasing rate of the unit cleaning cost has a higher impact on the cleaning cost than the decreasing rate of the number of cleanings. Figure 6a illustrates the total cost curves of Cases S1–5exp. As the unit cleaning cost increases, the total cost curve falls rapidly from a higher value, and the minimum cost increases and shifts to longer cleaning intervals.
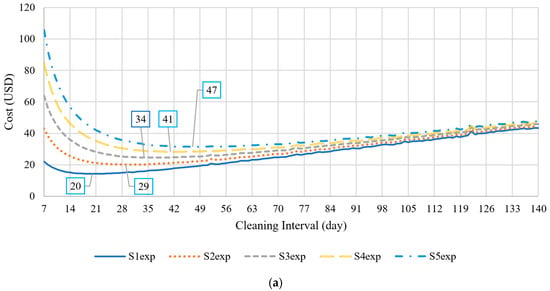
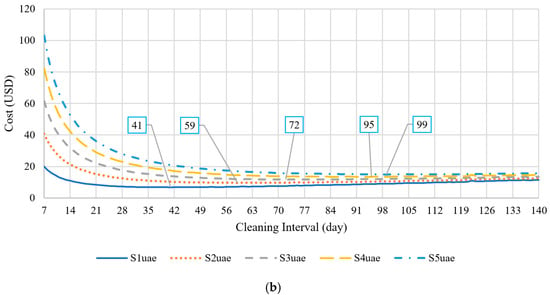
Figure 6.
Optimal cleaning intervals for several cleaning costs: (a) expat tariff (Cases S1–5exp) and (b) UAE national tariff (Cases S1–5exp).
For Cases S1–5uae (the tariff for UAE nationals) in Figure 6b, the results show a similar pattern to those in Cases S1–5exp: a higher unit cleaning cost results in a longer cleaning interval. However, the optimal cleaning intervals for UAE national tariff cases are much longer than those for expats’ tariff cases, ranging from 41 to 99 days. Thus, it still might be financially viable for UAE nationals to delay cleaning and buy energy from the grid to compensate for the lost energy if needed.
Figure 6b shows the impact of changing the unit cleaning cost when the electricity rate is low (i.e., UAE nationals’ tariff). Although the shifting pattern is similar to the graph in Figure 6a, Figure 6b shows a more flattened total cost curve, implying that determining an optimal cleaning interval may be less critical when the electricity tariff is low.
A sensitivity analysis regarding cleaning costs and electricity tariffs is illustrated in Figure 7. As can be seen from the chart, more frequent cleaning is required when the unit cleaning cost is lower and the electricity tariff is higher, and vice versa.
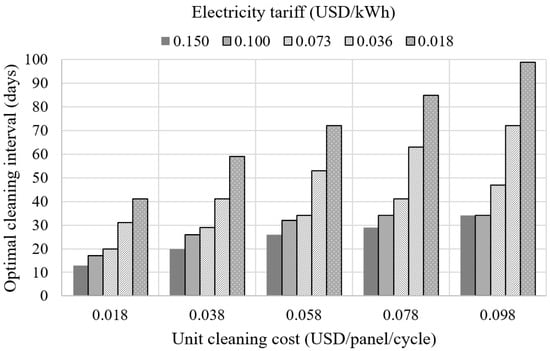
Figure 7.
Sensitivity analysis for cleaning cost and electricity tariff.
4. Discussion
As can be observed from the computational results listed in Table 6 (see Section 3.2.2), as the unit cleaning cost decreases from Case S5exp(uae) to S1exp(uae), both the cleaning cost and energy loss decrease. Thus, by decreasing the unit cleaning cost, we can expect to reduce the energy loss, i.e., recover energy production, and vice versa. This subsection further analyzes the impact of the unit cleaning cost change on energy recovery and total cost savings and discusses the policy implications relating to energy subsidies.
To investigate the impact of a change in the unit cleaning cost from the current value (0.0583 USD/panel/cycle) on the energy system, we define two metrics as follows. The first metric is ‘energy recovery’, which is defined as energy production at the considered unit cleaning cost, ranging from 0.0183 to 0.0983 USD/panel/cycle, minus energy production at the current unit cleaning cost. Thus, energy recovery measures the amount of energy produced above (+) or below (−) the current level when optimally cleaned by our proposed method. The second metric is the ‘total cost savings’, which measures the cost savings from the current level and is defined as the total cost with the considered unit cleaning cost minus the total cost with the current unit cleaning cost.
Regarding these two metrics, Section 4.1 provides a linear regression analysis, and Section 4.2 discusses policy implications relating to a subsidy.
4.1. Linear Regression Analysis
A linear regression analysis was conducted based on the results of the expat’s electricity tariff cases from Table 6, as presented in Figure 8a. The dependent variable is energy recovery in kWh, and the independent variable is the unit cleaning cost (see the solid line and triangle marks). Their relationship shows a strong linear relationship of y = −1440.6x + 83.483 with an R2 of 0.9913. The slope of −1440.6 implies that when the unit cleaning cost decreases by USD 0.01, the energy recovery could reach 14.40 kWh in a single PV panel over a 20-year period. Similarly, when the dependent variable is the total cost savings and the independent variable x is the unit cleaning cost, a strong linear relationship is also observed, expressed as y = −212.4x + 13.235 with an R2 of 0.9846 (see the dotted line and circle marks). Thus, reducing the unit cleaning cost by USD 0.01 would result in a total cost savings of USD 2.12 for one PV panel over a 20-year period.
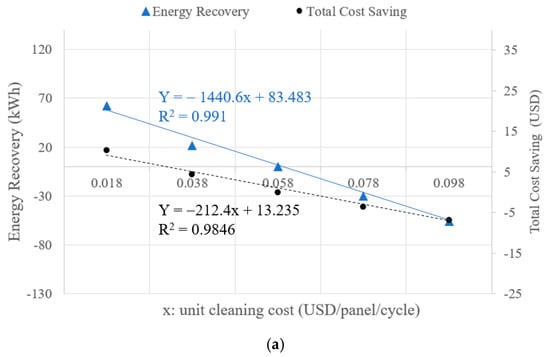
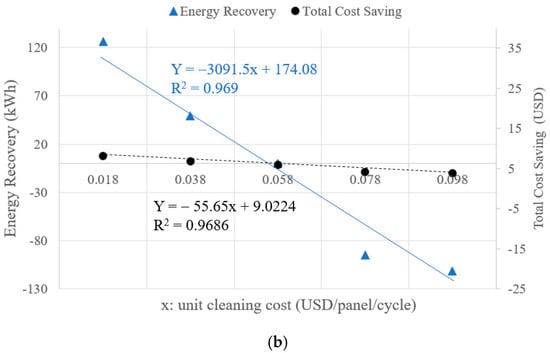
Figure 8.
Energy recovery and total cost savings per panel over a lifespan from the base case (S3) based on the unit cleaning cost: (a) expat tariff (Cases S1–5exp) and (b) UAE national tariff (Cases S1–5exp).
For UAE nationals’ electricity tariffs, Figure 8b illustrates another linear regression analysis for energy recovery and total cost savings based on the unit cleaning cost. Similar to the expats’ tariff, a strong linear relationship exists between energy recovery and the unit cleaning cost, calculated as y = −3091.6x + 174.08 with an R2 of 0.9692 (see the solid line and triangle marks). The total cost saving also has a strong linear relationship with the unit cleaning cost, expressed as y = −55.65x + 9.0224 with an R2 of 0. 9686 (see the dotted line and circle marks).
Energy recovery is more sensitive to unit cleaning costs under UAE nationals’ electricity tariff compared to that of expats, as reflected by the steeper slope: −3091.5 for UAE nationals versus −1440.6 for expats. This indicates that energy recovery under the expats’ electricity tariff is 2.15 times less sensitive to unit cleaning costs than under the UAE nationals’ tariff. In contrast, the total cost savings under the expats’ tariff are less sensitive to unit cleaning costs, with a slope of −55.65, compared to the higher sensitivity of −212.4 observed for UAE nationals. This analysis suggests that while energy recovery is more efficient for UAE nationals with lower unit cleaning costs, the overall financial benefit, in terms of total cost savings, remains more resilient for expats. Policy implications based on these results are discussed in the following section.
4.2. Policy Implications for a Subsidy
Table 7 briefly summarizes the results of the linear regression analysis presented in the previous section. The symbol ▽ represents the unit cleaning cost reduction defined as −0.01 USD/panel/cycle. The energy recovery rate is the amount of energy produced, and the total cost-saving rate is the total cost saving when 0.01 USD/panel/cycle of the unit cleaning cost is reduced.

Table 7.
Impact of unit cleaning cost reduction on energy recovery and total cost savings.
When the unit cleaning cost of 0.01 USD/panel/cycle is reduced by any method, we can expect to generate 14.4 (30.9) kWh of additional energy and save a total cost of USD 2.12 (0.56) for one panel over a 20-year period with the expat (UAE nationals) tariff. This analysis clearly shows that there is an opportunity to produce more energy by decreasing the unit cleaning cost. However, reducing the unit cleaning cost may not be a trivial task without developing new cleaning technologies. To address this issue, we propose to reduce the unit cleaning cost through a subsidy as follows. If a subsidy is provided when PV panels are cleaned, it could be considered a reduction in the unit cleaning cost. Then, the cleaning interval would be shortened according to the proposed decision support system in this study, resulting in increased energy production (i.e., decreased energy losses). Thus, this reduction in cleaning costs expands the solar PV system’s capacity without the need to physically install additional PV panels; instead, financial resources—subsidies—are required.
Therefore, it is worthwhile to evaluate the economic benefit of the cleaning cost subsidy compared to the conventional solar energy production cost, i.e., the levelized cost of electricity (LCOE). For example, the difference in the unit cleaning cost from Case S3 (current unit cleaning cost) to Case S2 (lower unit cleaning cost) is 0.02 (=0.0583 − 0.0383) USD/panel/cycle, or 2▽. Thus, the total cost savings is USD 4.24 (=2.12 USD/▽ × 2▽) according to the rate in Table 5. If a cleaning subsidy of USD 4.24 is provided for one panel for a 20-year period, it is expected to generate 28.88 (=14.44 kWh/▽ × 2▽) kWh of additional energy, which equates to a production cost of 0.18 USD/kWh.
However, since the recently reported LCOEs in the UAE are approximately 0.02–0.05 USD/kWh (Alhammami and An, 2021 [49]), the calculated production cost of 0.18 USD/kWh may not be an attractive option. This comparison indicates that the cleaning cost subsidy may not be suitable for replacing conventional physical investments in the UAE at a high electricity tariff.
However, for the UAE nationals’ tariff, providing a cleaning subsidy of USD 1.12 (=0.56 USD/▽ × 2▽) per panel could be considered, as the unit cleaning cost is reduced by 2▽ from 0.0583 (Case S8) to 0.0383 (Case S7) USD/panel/cycle. Thus, one panel in the system will generate 61.82 (=30.91 kWh/▽ × 2▽) kWh of additional energy over a 20-year period. This equates to a production cost of 0.02 USD/kWh, which is very competitive compared to the range of the current LCOEs. While this study did not account for the time value of money due to computational complexity in the simulation model, its inclusion may not alter the results significantly.
For example, if a subsidy of USD 2.24 per panel over the lifespan is provided, this is equivalent to reducing the unit cleaning cost of 4▽ at the UAE nationals’ tariff because USD 2.24 = 0.56 USD/▽ × 4▽. Thus, the subsidy will generate 123.64 (=30.91 kWh/▽ × 4▽) kWh/20 years or 6.18 kWh/year of additional energy.
From these results, we can conclude that providing a cleaning subsidy for the UAE nationals’ tariff may lead PV system managers to economically optimize cleaning intervals to enable more energy production using the existing energy infrastructure. This finding is significant because this is the first work to identify the opportunity of implementing a cleaning subsidy to generate energy more economically than by a typical capacity increase. In addition, by enhancing operation management alone, the system capacity can be increased, thereby mitigating potential CO2 emissions associated with the physical construction of new energy systems.
5. Conclusions
This paper addresses the soiling issue related to PV solar systems. A generic framework is developed based on simulation and optimization to find the optimal cleaning interval in arid regions, considering detailed weather data and several key metrics. In particular, the computational results found that the optimal cleaning interval for Abu Dhabi is 34 days, which is considerably longer than the current recommended cleaning interval of 28 days.
By employing linear regression, further analysis revealed that energy recovery is particularly sensitive with high electricity tariffs, while total cost savings are sensitive to reductions in the unit cleaning cost with low electricity tariffs. Finally, this study introduced a novel concept: a cleaning subsidy would alter the cost structure of the energy system and increase its capacity economically, surpassing ordinary LCOEs.
The developed advanced framework for determining a cleaning interval is easily applicable to other arid regions (e.g., the Middle East, Northern Africa, and Asia). To expand the scope of this study, future research could involve varying cleaning frequencies by season, evaluating the impact of rainfall on cleaning intervals in different regions, and considering various cleaning technologies. Furthermore, the study of the detailed relation between humidity and dust accumulation in the Middle Eastern climate, as well as the consideration of the degradation of panels’ efficiency over time, are suggested as important avenues for future research.
Supplementary Materials
The following supporting information can be downloaded at: https://www.mdpi.com/article/10.3390/systems12100418/s1.
Author Contributions
A.G.S.M.: methodology, software, validation, formal analysis, investigation, data curation, writing—original draft preparation, and visualization. H.A.: conceptualization, methodology, validation, formal analysis, investigation, resources, writing—review and editing, supervision, project administration, and funding acquisition. All authors have read and agreed to the published version of the manuscript.
Funding
This research was supported by Basic Science Research Program through the National Research Foundation of Korea (NRF) funded by the Ministry of Education (No. RS-2023-00248913).
Data Availability Statement
The data used in this study are available upon request to the corresponding author.
Acknowledgments
The authors would like to acknowledge the professional suggestions of anonymous reviewers.
Conflicts of Interest
The authors declare no conflicts of interest.
References
- Renewable Capacity Statistics 2023 [WWW Document]. IRENA. 2023. Available online: https://www.irena.org/Publications/2023/Mar/Renewable-capacity-statistics-2023 (accessed on 29 August 2023).
- Most Efficient Solar Panels 2023 [WWW Document]. Clean Energy Reviews. 2023. Available online: https://www.cleanenergyreviews.info/blog/most-efficient-solar-panels (accessed on 30 August 2023).
- Ilse, K.; Micheli, L.; Figgis, B.W.; Lange, K.; Daßler, D.; Hanifi, H.; Wolfertstetter, F.; Naumann, V.; Hagendorf, C.; Gottschalg, R.; et al. Techno-Economic Assessment of Soiling Losses and Mitigation Strategies for Solar Power Generation. Joule 2019, 3, 2303–2321. [Google Scholar] [CrossRef]
- Adinoyi, M.J.; Said, S.A.M. Effect of dust accumulation on the power outputs of solar photovoltaic modules. Renew Energy 2013, 60, 633–636. [Google Scholar] [CrossRef]
- Ramli, M.A.M.; Prasetyono, E.; Wicaksana, R.W.; Windarko, N.A.; Sedraoui, K.; Al-Turki, Y.A. On the investigation of photovoltaic output power reduction due to dust accumulation and weather conditions. Renew Energy 2016, 99, 836–844. [Google Scholar] [CrossRef]
- Thangaraj, S.; Velury, M. Soiling Losses for Different Solar PV technologies in a Rooftop of a Metropolitan City. Int. J. Sci. Res. Dev. 2016, 4, 156–159. [Google Scholar]
- Menoufi, K.; Mohamed, H.F.M.; Farghali, A.A.; Khedr, M.H. Dust accumulation on photovoltaic panels: A case study at the East Bank of the Nile (Beni-Suef, Egypt). Energy Procedia 2017, 128, 24–31. [Google Scholar] [CrossRef]
- Tamizhmani, G.; King, B.; Venkatesan, A.; Deline, C.; Pavgi, A.; Tatapudi, S.; Kuitche, J.; Chokor, A.; El Asmar, M. Regional soiling stations for PV: Soling loss analysis. In Proceedings of the 2016 IEEE 43rd Photovoltaic Specialists Conference (PVSC), Portland, OR, USA, 5–10 June 2016; pp. 1741–1746. [Google Scholar] [CrossRef]
- Lu, H.; Zhao, W. Effects of particle sizes and tilt angles on dust deposition characteristics of a ground-mounted solar photovoltaic system. Appl. Energy 2018, 220, 514–526. [Google Scholar] [CrossRef]
- Kazem, H.A.; Chaichan, M.T. The effect of dust accumulation and cleaning methods on PV panels’ outcomes based on an experimental study of six locations in Northern Oman. Sol. Energy 2019, 187, 30–38. [Google Scholar] [CrossRef]
- Abdelsalam, M.A.M.; Ahmad, F.F.; Hamid, A.K.; Ghenai, C.; Rejeb, O.; Alchadirchy, M.; Obaid, W.; El Haj Assad, M. Experimental study of the impact of dust on azimuth tracking solar PV in Sharjah. Int. J. Electr. Comput. Eng. (IJECE) 2021, 11, 3671–3681. [Google Scholar] [CrossRef]
- Shah, A.H.; Hassan, A.; Laghari, M.S.; Alraeesi, A. The Influence of Cleaning Frequency of Photovoltaic Modules on Power Losses in the Desert Climate. Sustainability 2020, 12, 9750. [Google Scholar] [CrossRef]
- Hachicha, A.A.; Al-Sawafta, I.; Said, Z. Impact of dust on the performance of solar photovoltaic (PV) systems under United Arab Emirates weather conditions. Renew Energy 2019, 141, 287–297. [Google Scholar] [CrossRef]
- Mokri, A.; Aal Ali, M.; Emziane, M. Solar energy in the United Arab Emirates: A review. Renew. Sustain. Energy Rev. 2013, 28, 340–375. [Google Scholar] [CrossRef]
- Zeedan, A.; Barakeh, A.; Al-Fakhroo, K.; Touati, F.; Gonzales, A.S.P. Quantification of PV Power and Economic Losses Due to Soiling in Qatar. Sustainability 2021, 13, 3364. [Google Scholar] [CrossRef]
- You, S.; Lim, Y.J.; Dai, Y.; Wang, C.H. On the temporal modelling of solar photovoltaic soiling: Energy and economic impacts in seven cities. Appl. Energy 2018, 228, 1136–1146. [Google Scholar] [CrossRef]
- Martinez-Plaza, D.; Abdallah, A.; Figgis, B.W.; Mirza, T. Performance improvement techniques for photovoltaic systems in Qatar: Results of first year of outdoor exposure. Energy Procedia 2016, 77, 386–396. [Google Scholar] [CrossRef]
- Touati, F.; Al-Hitmi, M.; Bouchech, H. Towards understanding the effects of climatic and environmental factors on solar PV performance in arid desert regions (Qatar) for various PV technologies. In Proceedings of the 2012 1st International Conference on Renewable Energies and Vehicular Technology, Nabeul, Tunisia, 26–28 March 2012; pp. 78–83. [Google Scholar] [CrossRef]
- Walwil, H.M.; Mukhaimer, A.; Al-Sulaiman, F.A.; Said, S.A.M. Comparative studies of encapsulation and glass surface modification impacts on PV performance in a desert climate. Sol. Energy 2017, 142, 288–298. [Google Scholar] [CrossRef]
- Said, S.A.M.; Al-Aqeeli, N.; Walwil, H.M. The potential of using textured and anti-reflective coated glasses in minimizing dust fouling. Sol. Energy 2015, 113, 295–302. [Google Scholar] [CrossRef]
- Said, S.A.M.; Walwil, H.M. Fundamental studies on dust fouling effects on PV module performance. Sol. Energy 2014, 107, 328–337. [Google Scholar] [CrossRef]
- Hadwan, M.; Alkholidi, A. Assessment of factors influencing the sustainable performance of photovoltaic water pumping systems. Renew. Sustain. Energy Rev. 2018, 92, 307–318. [Google Scholar] [CrossRef]
- Boyle, L.; Flinchpaugh, H.; Hannigan, M.P. Natural soiling of photovoltaic cover plates and the impact on transmission. Renew Energy 2015, 77, 166–173. [Google Scholar] [CrossRef]
- Benatiallah, A.; Ali, A.M.; Abidi, F.; Benatiallah, D.; Harrouz, A.; Mansouri, I. Experimental Study of Dust Effect in Mult-Crystal PV Solar Module. Int. J. Eng. Innov. Technol. 2012, 10, 16–20. [Google Scholar] [CrossRef]
- Rao, A.; Pillai, R.; Mani, M.; Ramamurthy, P. Influence of Dust Deposition on Photovoltaic Panel Performance. Energy Procedia 2014, 54, 690–700. [Google Scholar] [CrossRef]
- Zaihidee, F.M.; Mekhilef, S.; Seyedmahmoudian, M.; Horan, B. Dust as an unalterable deteriorative factor affecting PV panel’s efficiency: Why and how. Renew. Sustain. Energy Rev. 2016, 65, 1267–1278. [Google Scholar] [CrossRef]
- Wang, J.; Gong, H.; Zou, Z. Modeling of Dust Deposition Affecting Transmittance of PV Modules. J. Clean Energy Technol. 2017, 5, 217–221. [Google Scholar] [CrossRef]
- Bergin, M.H.; Ghoroi, C.; Dixit, D.; Schauer, J.J.; Shindell, D.T. Large Reductions in Solar Energy Production Due to Dust and Particulate Air Pollution. Environ. Sci. Technol. Lett. 2017, 4, 339–344. [Google Scholar] [CrossRef]
- Darwish, Z.A.; Kazem, H.A.; Sopian, K.; Alghoul, M.A.; Alawadhi, H. Experimental investigation of dust pollutants and the impact of environmental parameters on PV performance: An experimental study. Environ. Dev. Sustain. 2018, 20, 155–174. [Google Scholar] [CrossRef]
- Figgis, B.; Guo, B.; Javed, W.; Ahzi, S.; Rémond, Y. Dominant environmental parameters for dust deposition and resuspension in desert climates. Aerosol Sci. Technol. 2018, 52, 788–798. [Google Scholar] [CrossRef]
- Shaaban, M.F.; Alarif, A.; Mokhtar, M.; Tariq, U.; Osman, A.H.; Al-Ali, A.R. A New Data-Based Dust Estimation Unit for PV Panels. Energies 2020, 13, 3601. [Google Scholar] [CrossRef]
- Said, S.A.M.; Hassan, G.; Walwil, H.M.; Al-Aqeeli, N. The effect of environmental factors and dust accumulation on photovoltaic modules and dust-accumulation mitigation strategies. Renew. Sustain. Energy Rev. 2018, 82, 743–760. [Google Scholar] [CrossRef]
- Gholami, A.; Ameri, M.; Zandi, M.; Ghoachani, R.G. Dust accumulation on photovoltaic modules: A review on the effective parameters. Sigma J. Eng. Nat. Sci. 2021, 39, 45–57. [Google Scholar]
- Lamont, L.A.; El Chaar, L. Automatic Versus Manual Solar Panel Cleaning for Remote Locations. J. Technol. Innov. Renew. Energy 2013, 2, 98–105. [Google Scholar] [CrossRef]
- Tanesab, J.; Parlevliet, D.; Whale, J.; Urmee, T. Dust Effect and its Economic Analysis on PV Modules Deployed in a Temperate Climate Zone. Energy Procedia 2016, 100, 65–68. [Google Scholar] [CrossRef]
- Jones, R.K.; Baras, A.; Al Saeeri, A.; Al Qahtani, A.; Al Amoudi, A.O.; Al Shaya, Y.; Alodan, M.; Al-Hsaien, S.A. Optimized Cleaning Cost and Schedule Based on Observed Soiling Conditions for Photovoltaic Plants in Central Saudi Arabia. IEEE J. Photovolt. 2016, 6, 730–738. [Google Scholar] [CrossRef]
- Bunyan, H.; Ali, W.; Alnaser, M.; Bunyan, H.; Ali, W.; Alnaser, M. Enhancing the Performance of Photovoltaic Panel by Proper Washing Periods in Kuwait. Smart Grid Renew. Energy 2016, 7, 190–196. [Google Scholar] [CrossRef]
- Abu-Naser, M. Solar Panels Cleaning Frequency for Maximum Financial Profit. Open J. Energy Effic. 2017, 6, 80–86. [Google Scholar] [CrossRef]
- Zhao, B.; Zhang, S.; Cao, S.; Zhao, Q. Cleaning cycle optimization and cost evaluation of module dust for photovoltaic power plants in China. Clean Technol. Environ. Policy 2019, 21, 1645–1654. [Google Scholar] [CrossRef]
- Installation of Solar PV Systems [WWW Document]. Regulation and Supervision Bureau. 2017. Available online: https://doe.gov.ae/-/media/project/doe/department-of-energy/media-center-publications/english-files/solar_pv_installation_guidance_document.pdf (accessed on 31 August 2023).
- Diouf, M.C.; Faye, M.; Thiam, A.; Sambou, V. A framework of optimum cleaning schedule and its financial impact in a large-scale PV solar plant: A case study in Senegal. EPJ Photovolt. 2022, 13, 21. [Google Scholar] [CrossRef]
- González-Castillo, M.; Navarrete, P.; Tapia, T.; Lorca, Á.; Olivares, D.; Negrete-Pincetic, M. Cleaning scheduling in photovoltaic solar farms with deterministic and stochastic optimization. Sustain. Energy Grids Netw. 2023, 36, 101147. [Google Scholar] [CrossRef]
- Zhang, C.; Ma, Y.; Mi, Z.; Yang, F.; Zhang, L. A rolling-horizon cleaning recommendation system for dust removal of industrial PV panels. Appl. Energy 2024, 353, 122168. [Google Scholar] [CrossRef]
- National Centre of Meteorology [WWW Document]. National Center of Meteorology. 2023. Available online: https://www.ncm.ae/maps-radars/radar-merge-sat?lang=en (accessed on 31 August 2024).
- Northern Africa-Middle East-Europe Regional Center, Sand and Dust Storm Warning Advisory and Assessment System [WWW Document]. World Meteorological Organization. 2023. Available online: https://sds-was.aemet.es/ (accessed on 31 August 2024).
- The Weather’s Record Keeper [WWW Document]. Meteostat. 2023. Available online: https://meteostat.net/ (accessed on 31 August 2024).
- National Centers for Environmental Information [WWW Document]. National Oceanic and Atmospheric Administration. 2023. Available online: https://toolkit.climate.gov/tool/noaas-weather-and-climate-toolkit (accessed on 7 October 2024).
- Rates and Tariffs 2020 [WWW Document]. Abu Dhabi Distribution Company. 2023. Available online: https://www.addc.ae/en-US/residential/Pages/RatesAndTariffs2020.aspx (accessed on 31 August 2023).
- Alhammami, H.; An, H. Techno-economic analysis and policy implications for promoting residential rooftop solar photovoltaics in Abu Dhabi, UAE. Renew. Energy 2021, 167, 359–368. [Google Scholar] [CrossRef]
- Dubey, S.; Sarvaiya, J.N.; Seshadri, B. Temperature Dependent Photovoltaic (PV) Efficiency and Its Effect on PV Production in the World A Review. Energy Procedia 2013, 33, 311–321. [Google Scholar] [CrossRef]
- Simio Software [WWW Document]. Simio. 2023. Available online: https://www.simio.com/ (accessed on 31 August 2023).
- Vining, G.; Kowalski, S. Statistical Methods for Engineers, 3rd ed.; Cengage Learning: Boston, MA, USA, 2010; ISBN 1111810206. [Google Scholar]
- Kim, S.; Nelson, B.L. A Fully Sequential Procedure for Indifference-Zone Selection in Simulation. ACM Trans. Model. Comput. Simul. 2001, 11, 251–273. [Google Scholar] [CrossRef]
Disclaimer/Publisher’s Note: The statements, opinions and data contained in all publications are solely those of the individual author(s) and contributor(s) and not of MDPI and/or the editor(s). MDPI and/or the editor(s) disclaim responsibility for any injury to people or property resulting from any ideas, methods, instructions or products referred to in the content. |
© 2024 by the authors. Licensee MDPI, Basel, Switzerland. This article is an open access article distributed under the terms and conditions of the Creative Commons Attribution (CC BY) license (https://creativecommons.org/licenses/by/4.0/).