Article

The Power of Big Data: The Impact of Urban Digital Transformation on Green Total Factor Productivity

1
School of Economics and Business Administration, Chongqing University, Chongqing 400044, China
2
School of Public Policy and Administration, Chongqing University, Chongqing 400044, China
*
Author to whom correspondence should be addressed.
Systems 2024, 12(1), 4; https://doi.org/10.3390/systems12010004
Submission received: 21 November 2023 / Revised: 11 December 2023 / Accepted: 18 December 2023 / Published: 21 December 2023

Abstract

:
Focusing on the construction of the National Big Data Comprehensive Pilot Zone (NBDCPZ), we adopted the difference-in-differences model to examine the impact of big data on green total factor productivity (GTFP), using data from 276 cities in China for the period of 2012 to 2019. We also conducted mediating effects and moderating effects tests to explore whether a factor exists through which, or relying on it, big data influences the GTFP. The result of the baseline regression showed that the construction of the NBDCPZ significantly increased GTFP. After a series of robustness tests, this conclusion remains valid. In addition, we examined the mediating effects of industrial structure and green innovation and found that the construction of the NBDCPZ increased the level of GTFP, mainly by promoting industrial structure upgrading and green innovation activities. We identified the moderating effects of different types of environmental regulation on the relationship between urban digital transformation and GTFP and found that market incentive environmental regulation (MIER) has a significant positive moderating effect on big data increasing GTFP. Conversely, the moderating effects of command and control environmental regulation (CCER) and social participation environmental regulation (SPER) were found to be insignificant. These findings suggest that urban digital transformation, through its contribution to increasing GTFP, is an important pathway to high-quality development.

1. Introduction

With the rapid development of information technology, countries around the world are on the verge of a profound digital revolution. The digital revolution is dramatically transforming the world at an unprecedented pace, fueling a surge in global demand and shaping future trends. Propelled by continuous technological innovation and advancement, the digital revolution is ushering human society into a new era that is marked more prominently by digitization, intelligence, and interconnectedness. Enterprises and individuals worldwide experience its transformative effects, ranging from modes of production to lifestyle changes. Moving forward, the digital revolution will continue to evolve further, stimulating the growth in global demand and sculpting unparalleled opportunities for the future. In this digital revolution, big data, as a driver of social and economic transformation [1], is championing the push towards urban digital transformation. In response, major nations and cities globally are sequentially unveiling strategic plans and supportive measures concerning big data. Despite being the world’s largest developing country, China has achieved many innovations in the field of big data. Over recent years, China boasts an extensive and significant data infrastructure that encompasses high-speed broadband networks, cloud computing centers, and data centers. Coupled with its vast population and abundant datasets, these comprehensive resources underpin the analysis and application of big data. Currently, numerous cities have proposed digital transformations in China. For instance, Shanghai endeavored to “comprehensively promote the urban digital transformation” in 2021, while Beijing aims to become a “benchmark city for the global digital economy” by 2030. China stands among the frontrunners in big data development. Taking China as the research object to study a China-typical big data phenomenon has a certain relevance and significance for the development of big data strategies with other countries. Meanwhile, the overlapping impacts of climate change, pollution, and other factors have posed certain challenges to urban sustainable development. Governments, international organizations, and technology companies often harbor high expectations for the application of information technology, foreseeing these as potential solutions to significant environmental challenges such as climate change and biodiversity loss [2]. In the existing context, studies on the impact of urban digital transformation on the environment have quickly become a scholarly focus [3,4,5]. Increasing GTFP is an important way to achieve sustainable development in China [6]. Big data, playing a key role in facilitating urban digital transformation, can improve the allocation efficiency of production factors and promote the integration of technological innovation. Big data has gradually become the core driving force of green total factor productivity (GTFP) and one of the most important paths to achieve the urban sustainable development.
To implement its big data strategy, China initiated the National Big Data Comprehensive Pilot Zone (NBDCPZ), an important policy tool to facilitate the urban digital transformation. The formation of the NBDCPZ is an innovative exploration of China’s big data strategy through regional reform pilot programs. Unlike previous efforts focusing primarily on the economic and social impacts of big data, this research seeks to discern the environmental implications arising from big data utilization. This study takes the NBDCPZ pilot as a quasi-natural experiment and employs a staggered difference-in-differences (DID) model to investigate the net effect of big data on GTFP. The main purpose of this study is to investigate the impact of urban digital transformation on GTFP from the perspective of big data. It aims to assess the policy effects of the construction of the NBDCPZ in terms of increasing GTFP and to comprehend the underlying patterns and mechanisms. The results derived from this study will serve as a case in the context of environmental impacts related to big data, providing insights for policy makers in decision making processes. Figure 1 shows the research framework of this study: Section 1 is the introduction. Section 2 reviews the relevant literature and proposes the research hypotheses. Section 3 outlines the model design and variable selection. Section 4 presents the empirical analysis, robustness tests, and heterogeneity analysis. Section 5 delves into an analysis of mediating effects. Section 6 illustrates an examination of the moderating effects. Section 7 is conclusions, policy recommendations, and limitations. This study has three main marginal contributions. First, the construction of the NBDCPZ provides an opportunity to scrutinize the relationship between big data and GTFP.
This study tries to address a crucial research gap in assessing the impact of digital transformation on GTFP from the perspective of big data. Our work enriches the relevant literature by providing contemporary illustrations of how big data, as a newly recognized factor of production, promotes green innovation and sustainability. At the same time, this study enhances the understanding of the different impacts that are generated by different environmental regulation schemes, thus solidifying the causality between big data applications and urban GTFP. From both a macro-level industrial structure and micro-level green innovation activities perspectives, this study examines the channels via which big data influences GTFP, thus providing an analytical paradigm for such research. Through this research, we fill an existing gap in the research on “green” impacts of digital transformation, particularly in terms of how different environmental regulations play their different roles. To recapitulate, our research aims not only to elucidate the broad influence of digital transformation on GTFP through the prism of big data, but also to fill the gap in understanding “the role of environmental regulation frameworks in the green implications of digital transformation”. This two-pronged exploration subtly but significantly contributes to a more comprehensive and nuanced discernment of the complex interplay between big data, digital transformation, environmental regulation frameworks, and their collective influence on urban GTFP.
This section presented an introduction to the background of big data and digital transformation. The subsequent section will delve into a literature review that is centered around our research theme.

2. Literature Review

2.1. The Literature on the Digital Revolution and Big Data

The “digital revolution”, initiated in the late 1960s, has significantly revolutionized the economy and society. For the past few years, promoting urban digital transformation has emerged as an essential determinant to foster economic growth [7]. Urban digital transformation relies on the use of digital technologies [8]. One of the most important technologies for urban digital transformation is big data. Several studies have been conducted on the concept, characteristics, and functions of big data. Scholars and practitioners often used the notion of “V” to define big data, which has evolved from the classic three “V”s (volume, variety, and velocity) definition to five “V”s (two additional, veracity and value) definition [9,10,11,12]. Big data, hailed as the “center of the future knowledge economy”, is widely acknowledged for its capacity to stimulate economic growth and technological innovation [13]. By integrating a new generation of information technologies, big data facilitates numerous novel forms of economic activities and burgeoning industries. On the one hand, big data is a new form of production factor, dedicated to the creation of new services and products [14]. The integration of big data leads to an increasingly marginal productivity, thus achieving a consistent positive growth rate predicted by endogenous growth theory [15,16]. Compared to traditional production factors, the expenditure required for big data is notably lower [17] This can primarily be attributed to the “non-rivalrous” nature [18], which is not constrained by time or space [19] and does not require depreciation or value reduction [20]. Furthermore, it is easily shared and disseminated in an open-source manner [21] and can relieve information asymmetry [22,23]. On the other hand, big data fosters cross-innovation and enhances productivity [24,25], promoting the transition from an industrial economy primarily manufacturing physical products to a digital economy that chiefly produces information goods and services [26]. Big data is gradually evolving into a new general-purpose technological revolution, permeating every industry and business area [27]. The ability to leverage big data is a key indicator of urban competitiveness and an important determining factor in showcasing urban power, termed as big data power (BD power) [28]. In addition, big data plays an irreplaceable role in supporting the environmental governance [29], which has become the core engine for sustainable development in the digital economy era [30,31]. Overall, big data is driving the current digital revolution, permeating various fields and bringing new opportunities for sustainable development in the future.

2.2. The Literature on the Environment and Big Data

Recent academic research has gradually focused on the relationships between digital transformation and the environment. Centered around information technology, digital transformation has the potential to alleviate environmental pollution issues, thus fostering a synergistic advancement in both economic development and environmental conservation [32]. With the rapid extension of the IOT (Internet of Things) in the natural environment, environmental big data is rapidly generating at an unprecedented scale [33,34], which has the potential to transform the ways of governing the environment [35]. This means that environmental big data may change the interaction patterns between the environment and humans in different ways, generating new environmental solutions. Meanwhile, environmental informatics has been widely applied in the management of environmental processes [36]. Numerous studies and academic projects have explored the emerging role of big data in the environmental sector recently. For example, big data technologies can ensure waste management and environmental management in regular urban affairs [37]. In addition, remote sensing technology can continuously obtain spectral information of large-scale ground data [38,39], thereby quickly detecting environmental dynamics. Big data can integrate seemingly unrelated and fragmented information for environmental governance. This is also known as the key to its important application in the field of environmental management. On the one hand, big data promotes collaboration among various business departments and improves the organizational efficiency of environmental governance [40]. On the other hand, big data has improved the level of environmental management of businesses. By analyzing and applying large-scale environmental protection data, the accuracy and effectiveness of ecological environmental governance can be improved [41]. In summary, the application of big data technologies in the environmental field is constantly growing, and its complex impact on the environment is becoming the focus of academic attention.

2.3. The Literature on the Digital Transformation and GTFP

To accomplish harmony between the economy and the environment, GTFP is without a doubt the fundamental approach to achieving this goal [42]. GTFP is a comprehensive indicator which takes into account economic growth, energy consumption, and environmental pollution simultaneously [43]. Technological innovations, such as big data technologies, can significantly reduce the negative impact of human activities on environmental systems and then increase the GTFP [44,45]. In order to change the drivers of economic growth, the role of technological innovation in the growth of GTFP should be enhanced [46]. Only by accelerating breakthroughs in green technological innovation can we support the true realization of green development [47]. With continuous breakthroughs in big data technology, big data has become an important means to promoting green innovation and sustainable development. Previous studies centered on the relationships between digital transformation and GTFP have found that the digital economy has positive temporal and spatial effects on GTFP from the perspective of the digital economy [48]. Big data, with a high green value, is a core input element of the digital economy. Big data increases GTFP mainly by improving technological efficiency, narrowing the technological gap [48,49], reducing the reliance on fossil fuels [50], and accelerating the upgrading of industrial structures [51,52,53]. In reviewing the relevant literature, we find that while significant research has explored the link between the digital economy and GTFP, there remains a gap in understanding the impact of big data on GTFP. In the context of urban digital transformation, the impact of big data on GTFP deserves attention.

2.4. Research Commentary

After reviewing several relevant studies related to the keyword of this study, we observed three key findings: First, scholars have developed a comprehensive understanding of big data, especially in the context of the digital transformation. They have theorized around the concepts, characteristics, and functions of big data, thereby forming a theoretical framework for big data. This has been further explored from economic, social, and environmental perspectives through theoretical or empirical tests. Second, scholars have conducted numerous studies on the environmental impact of big data, especially its effectiveness in reducing pollution and carbon emissions when applied to environmental policy. Third, research on the impact of big data on GTFP is primarily presented from the perspective of the digital economy, exploring how the digital economy influences green innovation or GTFP. Overall, the existing literature is evolving from a basic to a detailed analysis of big data, gradually focusing on an in-depth mechanistic dissection within a specific area. However, there is still a relative lack of focus on the impact of big data on GTFP, which is the concern of this study. Furthermore, the existing literature rarely explores the causal relationship between the two, demonstrating a gap that this research aims to fill. Therefore, this analysis is essential to deepening our understanding of the relationship between big data and GTFP.
This section presented a comprehensive literature review. The subsequent section will delve into the research hypotheses, modeling, and variable selection.

3. Research Hypotheses, Modeling, and Variable Selection

3.1. Research Hypotheses

(1) Big data and GTFP
Big data exerts a significant influence on the GTFP. On the one hand, the data capital possesses a pervasive impact, capable of driving improvements in quality and efficiency across various industries and domains [24,25,27]. On the other hand, the implementation of big data can diminish energy consumption slightly and enhance environmental regulation efficiency [35,40,41]. Hence, the urban digital transformation based on big data technology tends to elevate the overall level of GTFP. The enhancement of urban GTFP by big data potentially occurs within two channels: firstly, promoting industrial structure upgrades on a macro level [51,52,53], and secondly, fostering green innovative activities at the micro scale [48,49]. Both the upgrade of industrial structure and green innovative activities have a significant impact on increasing the GTFP. Thus, we propose the following hypotheses H1, H1a, and H1b:
H1. 
Big data increases GTFP.
H1a. 
Big data increases GTFP by elevating the level of industrial structures.
H1b. 
Big data increases GTFP by fostering green innovative activities.
(2) Environmental regulation, big data, and GTFP
If hypothesis H1 “Big Data increases GTFP” is confirmed, the next point of interest is exploring whether this influence varies according to certain moderating variables. GTFP is pronounced to have externality issues that are associated with environmental concerns. When discussing the impact of big data on GTFP, the influence of environmental regulation is undeniably crucial. Implementing a certain degree of environmental regulation sets a prerequisite for understanding how big data can affect GTFP. Environmental regulation is an important perspective in studying environmental issues [54]. Therefore, we adopt the moderating variable of environmental regulation to test whether the impact of big data on GTFP shows heterogeneity due to different levels of urban environmental regulation. Generally, the higher the level of environmental regulation, the more pronounced the impact of big data on enhancing GTFP is. Furthermore, we select command and control environmental regulation (CCER) [55], social participation environmental regulation (SPER) [56], and market incentive environmental regulation (MIER) [57] to examine whether the way that big data increases GTFP varies depending on the different types of environmental regulation. Thus, we propose hypotheses H2a, H2b, and H2c:
H2a. 
Big data increasing GTFP is positively moderated by CCER. The higher the level of CCER, the more evident the impact of big data on increasing GTFP is.
H2b. 
Big data increasing GTFP is positively moderated by SPER. The higher the level of SPER, the more evident the impact of big data on increasing GTFP is.
H2c. 
Big data increasing GTFP is positively moderated by MIER. The higher the level of MIER, the more evident the impact of big data on increasing GTFP is.
Figure 2 shows the research hypotheses of this study.

3.2. Econometric Model

Chinese policy experimentation has evolved as an institutional arrangement, where local regions implement pilot projects before a new policy plan is proposed. The experiences from these pilot experiments are then extended to the whole country. China has conducted several policy experiments since reforming and opening up, such as special economic zone pilots, state-level new zone pilots, and free trade zone pilots, gaining valuable development and reform insights through early implementation and innovation. This study takes the construction of the NBDCPZ as a quasi-natural experiment. Regarded as an “experimental field” for big data practices in China, the NBDCPZ enables us to observe the impact and implications of big data strategies and applications under relatively controlled conditions. These “treatment” cities can be compared against other cities (control group) that have not received this same level of focus on big data development. By comparing the changes in GTFP before and after the establishment of the NBDCPZ, we can isolate its causal effect, similar to the methodology employed in a natural experiment. As shown in Figure 3, the policy experiment was implemented in two batches, with the Guizhou Big Data Comprehensive Pilot Zone was announced in 2015, and the second batch, including Beijing, Tianjin, Inner Mongolia, Hebei, Liaoning, Chongqing, Guangdong, Henan, and Shanghai, was announced in 2016. Then, we set the baseline regression model (difference-in-differences) as follows:
G T F P i t = α 0 + α 1 D I D + α c C o n t r o l i t + μ i + δ t + ε i t
In Formula (1),  i  and  t  represent city and year, respectively.  G T F P i t  represents the green total factor productivity of city  i  in year  t D I D  represents the pilot dummy variable of the NBDCPZ.  α 1  is the coefficient of the core explanatory variable,   C o n t r o l i t  represents a set of control variables,  μ i  and  δ i  represent the individual-fixed and time-fixed effects, respectively, and  ε i t  represents the random perturbation term.

3.3. Variable Selection

(1) Explained variable: GTFP.
GTFP is a measure of the balance between economic development and environmental protection. It assesses the level of green development over a period of time, taking into account total output, resource inputs, and environmental impacts within a nation or region. Considering environmental pollution as an unexpected output, Chung et al. (1997) [58] measured GTFP by adopting a directional distance function and the Malmquist–Luenberger index. Since the non-expected outputs have been added to the traditional DDF, this index has been referred to as the green total factor productivity. GTFP introduces energy consumption and environmental pollution into the Total Factor Productivity (TFP) framework [59]. In this study, we selected the Global MLPI (GMLPI) to measure GTFP. For output indicators, we selected real GDP, after eliminating the influence of price changes, to represent the expected outputs. We selected PM2.5 and SO2 to represent the unexpected outputs. For input indicators, we selected the number of employed people to represent the labor input (L). We selected the fixed asset investments, estimated by the perpetual inventory method, to represent the capital input (K). We selected energy consumption to represent the energy input (E). The raw data are compiled from the China Energy Statistical Yearbook, China Urban Statistical Yearbook, and the Statistical Yearbooks of provinces and cities. For cities with missing data, we used linear interpolation to fill the gaps. It is important to note that linear interpolation is a convenient and widely used method for handling missing data points. Still, it does operate under the assumption of a linear relationship between two adjacent data points, which may not always hold in real-world situations. It might oversimplify complex trends or patterns in the data or introduce bias if gaps are large. Considering the data magnitude, the measured GTFP are all multiplied by 100.
(2) Core explanatory variable: DID
The basic idea behind difference-in-differences (DID) is to estimate the causal effect of a treatment by comparing changes in the treated and control groups before and after the treatment. The core explanatory variable DID is the cross product of the policy dummy variable Treat and the policy time dummy variable Post. (DID = Treat*Post). The value of the dummy variable Treat is set to 1 if a city was selected as an NBDCPZ and otherwise is set to 0. The value of the dummy variable Post is set to 1 from the year in which a city was selected as an NBDCPZ and otherwise is set to 0. Although all the NBDCPZs were approved in 2016, Guizhou Province had already laid out the construction in advance in 2015. Therefore, the start time is set to 2015 for Guizhou Province, and the start time is set to 2016 for the other pilot cities.
(3) Control variables
In accordance with the existing literature, we include additional control variables to ensure that our model captures the broad range of factors that could potentially influence green total factor productivity (GTFP). ① The level of economic development (GDPR): The relationship between the level of economic development and GTFP is complex and may exhibit non-linear characteristics. ② The level of market activity (MI): Private and individual entrepreneurs are more flexible and innovative in market competition, thereby promoting an increase in GTFP. ③ The level of fiscal autonomy (FA): According to fiscal decentralization theories, enhanced fiscal autonomy allows local governments to better adapt to specific regional economic structures and needs. They can establish more flexible and targeted economic policies, optimizing resource allocation. Conversely, higher fiscal autonomy might lead to myopic fiscal behaviors on the part of local governments, adversely affecting GTFP. ④ The level of financial development (FIN): An improved level of financial development can spur effective resource allocation and innovation activities, stimulating growth in GTFP. ⑤ The level of openness to the outside world (FOR): Opening up to foreign influences can facilitate the absorption of advanced international technology and production factors, boosting technological advances and innovation. However, unequal trade relations and market access barriers could possibly lead to imbalanced resource allocation and loss of technological spill-over. ⑥ The level of comprehensive utilization of resources (REC): The comprehensive utilization of resources represents the emission reduction capabilities and environmental governance level of a region. Generally, the higher the resource recovery rate, the greater the GTFP.
Table 1 shows the specific calculation method of the variables.
(4) Moderating variables: environmental regulation (ER).
We select three types of environmental regulation, namely, command and control environmental regulation (CCER), social participation environmental regulation (SPER), and market incentive environmental regulation (MIER). Table 1 shows the specific calculation method of the variables.
This section presented the research hypotheses, modeling, and variable selection. In the next section, the empirical tests will be carried out in depth and the results will be analyzed.

4. Result and Analysis

4.1. Basic Description

As shown in Figure 4, the treatment group’s GTFP was slightly ahead of the control group’s GTFP prior to the start of the pilot. However, this difference was quite small, and both groups showed similar trends in their respective changes. During the early stages of the pilot program (2015–2017), the treatment group continued to have higher GTFP levels than the control group, and the gap began to widen. During the later stages of the pilot program (2018–2019), a significant divergence in GTFP persisted between the control group and the treatment group, which even exceeded the magnitude of the prepilot disparity. This evidence implies that the policy interventions had a tangible effect, significantly increasing GTFP in the cities participating in the pilot program.

4.2. Baseline Regression

This study performs a baseline regression analysis, taking into account city and time-fixed effects. Table 2 shows the results of the baseline regression. Columns (1) and (2) depict the regression outcomes without and with additional control variables, correspondingly. In column (1), the estimated coefficient of DID is 0.2291, and it is significant at the 1% level. This indicates that the construction of the NBDCPZ can markedly increase the GTFP of the pilot cities. The policy shock of the NBDCPZ has led to a 0.2291% increase in GTFP in pilot cities relative to non-pilot cities. In column (2), after adding the control variables, the estimated coefficient of DID decreased to 0.2074, but it is still significant at the 1% level. This indicates that the construction of NBDCPZ can markedly increase the GTFP of the pilot cities. This result provides confirmatory evidence supporting hypothesis H1, “Big data increases GTFP”. In addition, the estimated coefficients of economic development and market activity are both significantly positive, suggesting that the higher levels of urban economic development and marketization correspond to an elevated GTFP level. The level of comprehensive utilization of resources is positive but insignificant. It is notable that the estimated coefficients of fiscal autonomy, financial development, and openness to the outside world are significantly negative, suggesting their suppressing effect on GTFP.

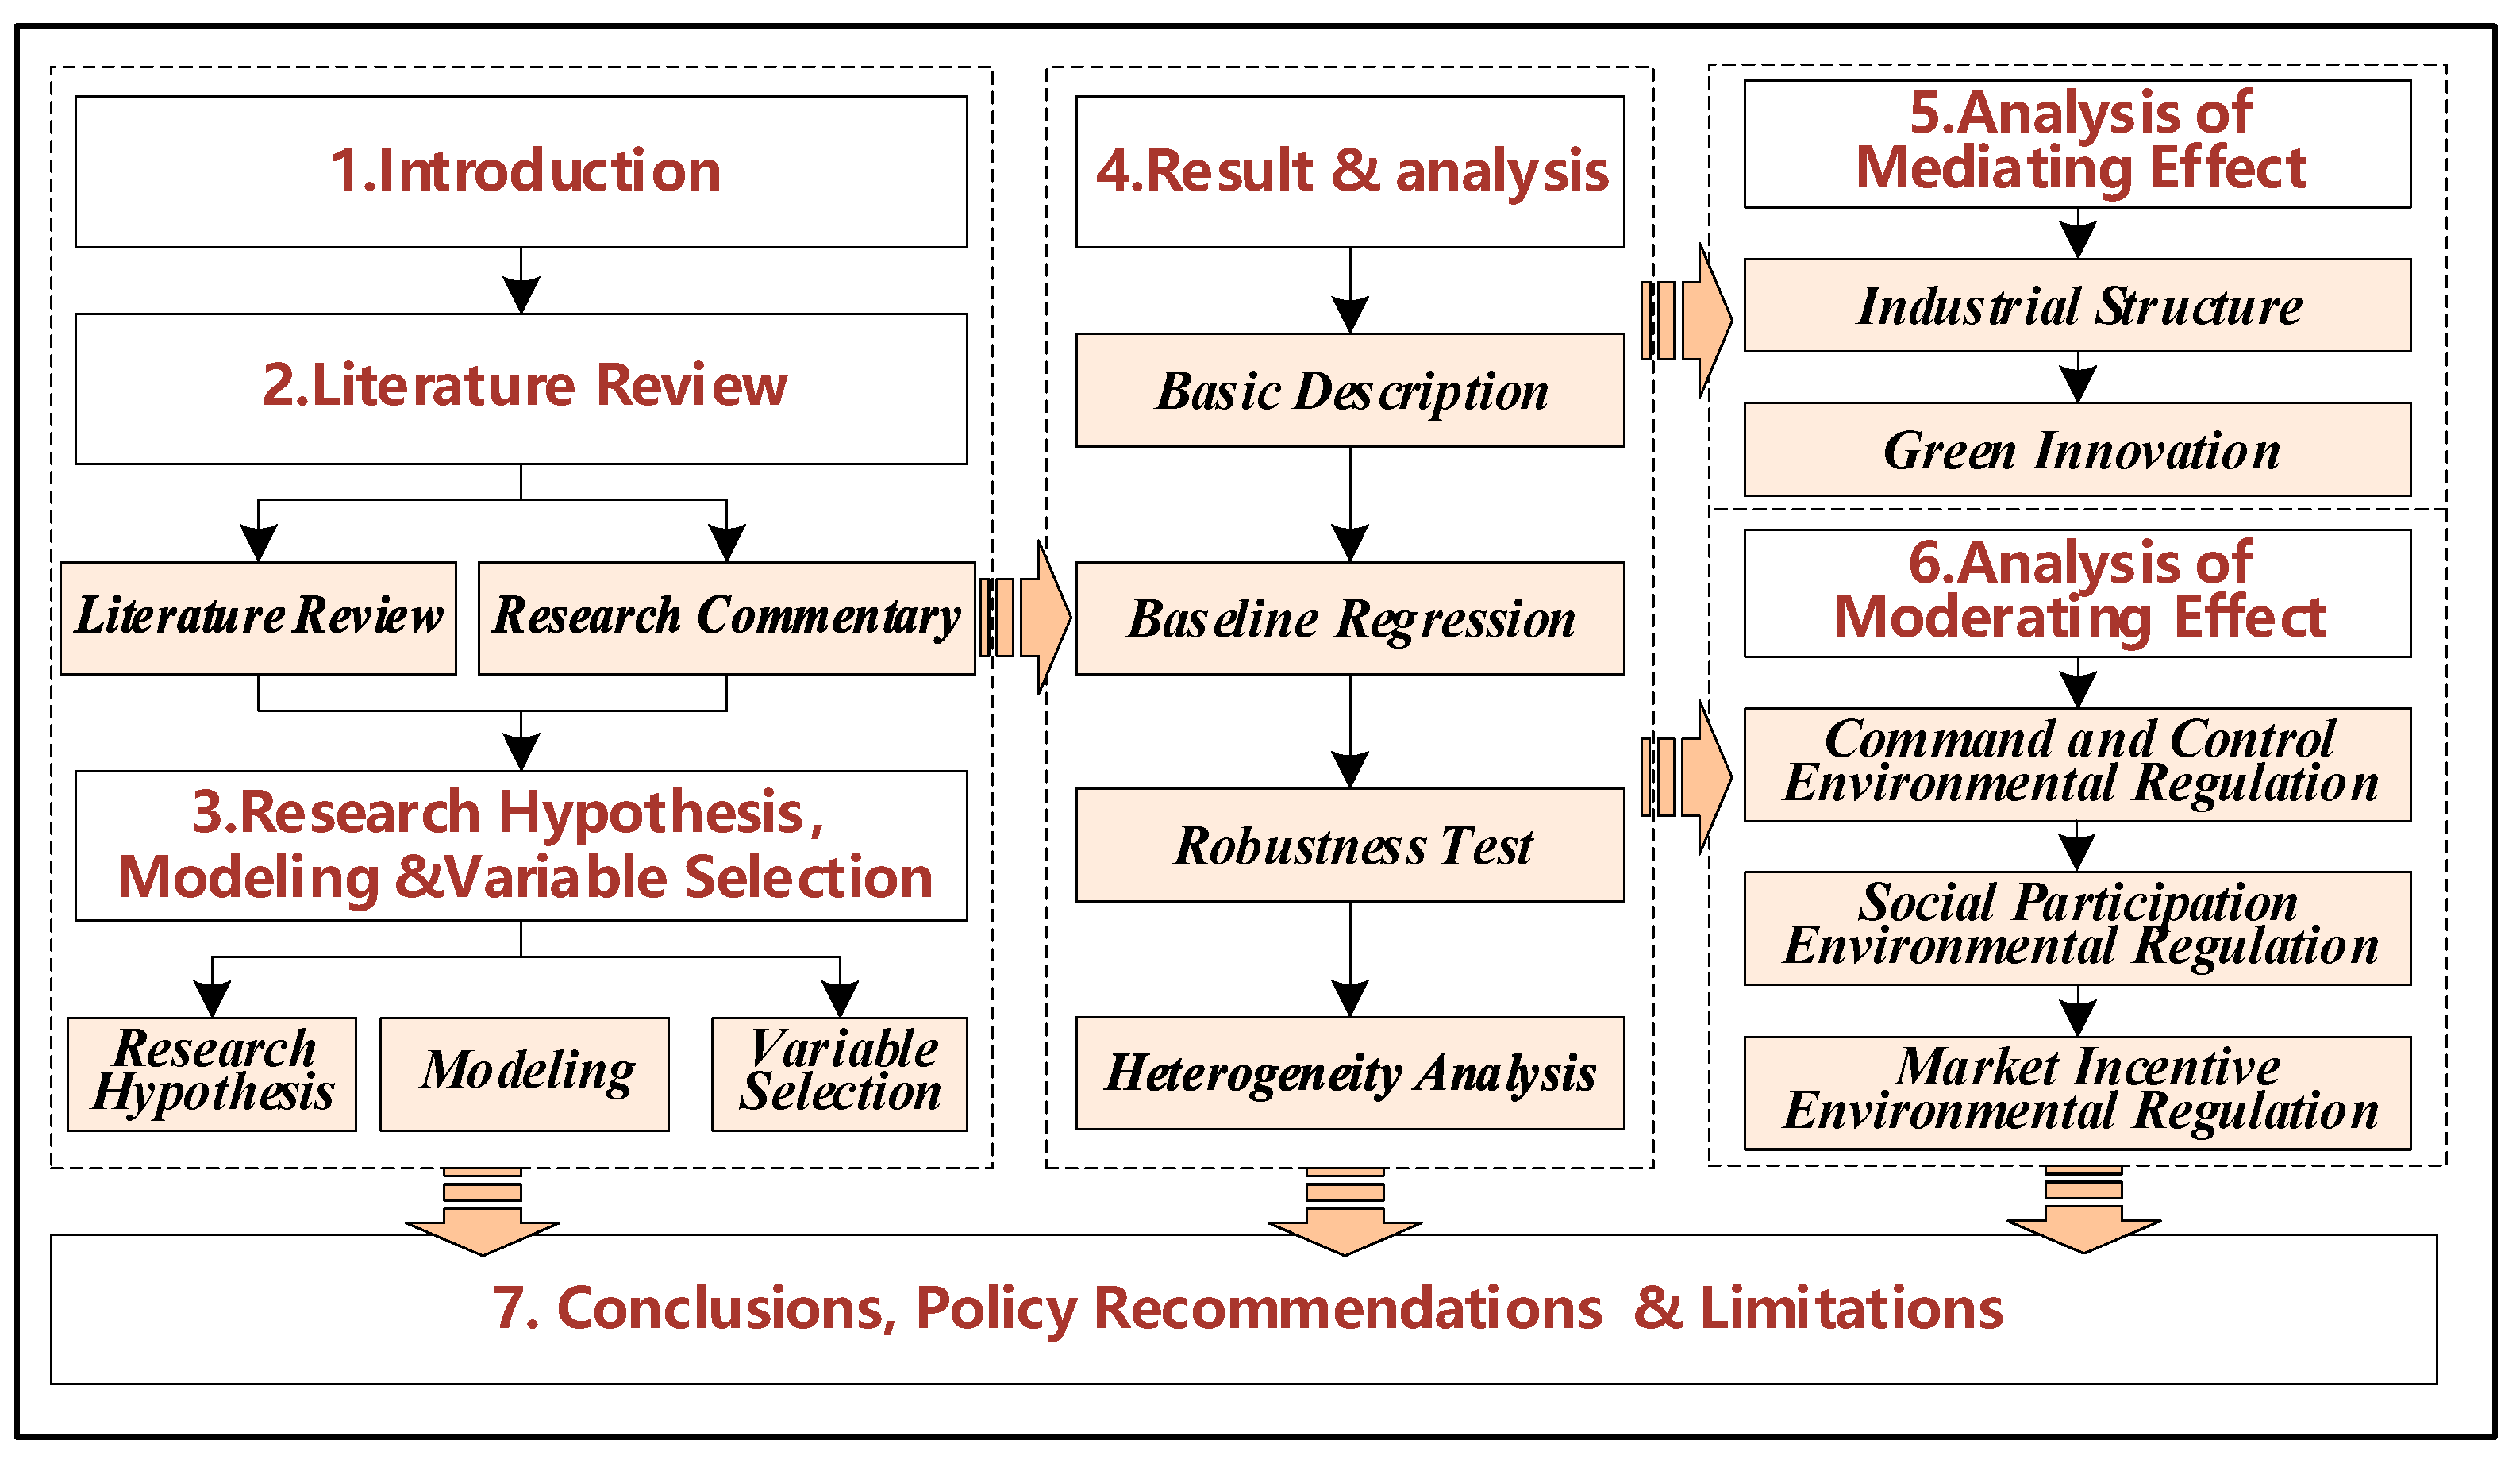
4.3. Robustness Test

Furthermore, we have incorporated robustness tests into our analysis to ensure that the results are reliable and valid, even when data deviate from ideal conditions or violate statistical assumptions. These tests bolster our confidence in the consistency of our primary findings by reassuring us that they are not artifacts of particular model specifications or data characteristics.
(1) Parallel trend test
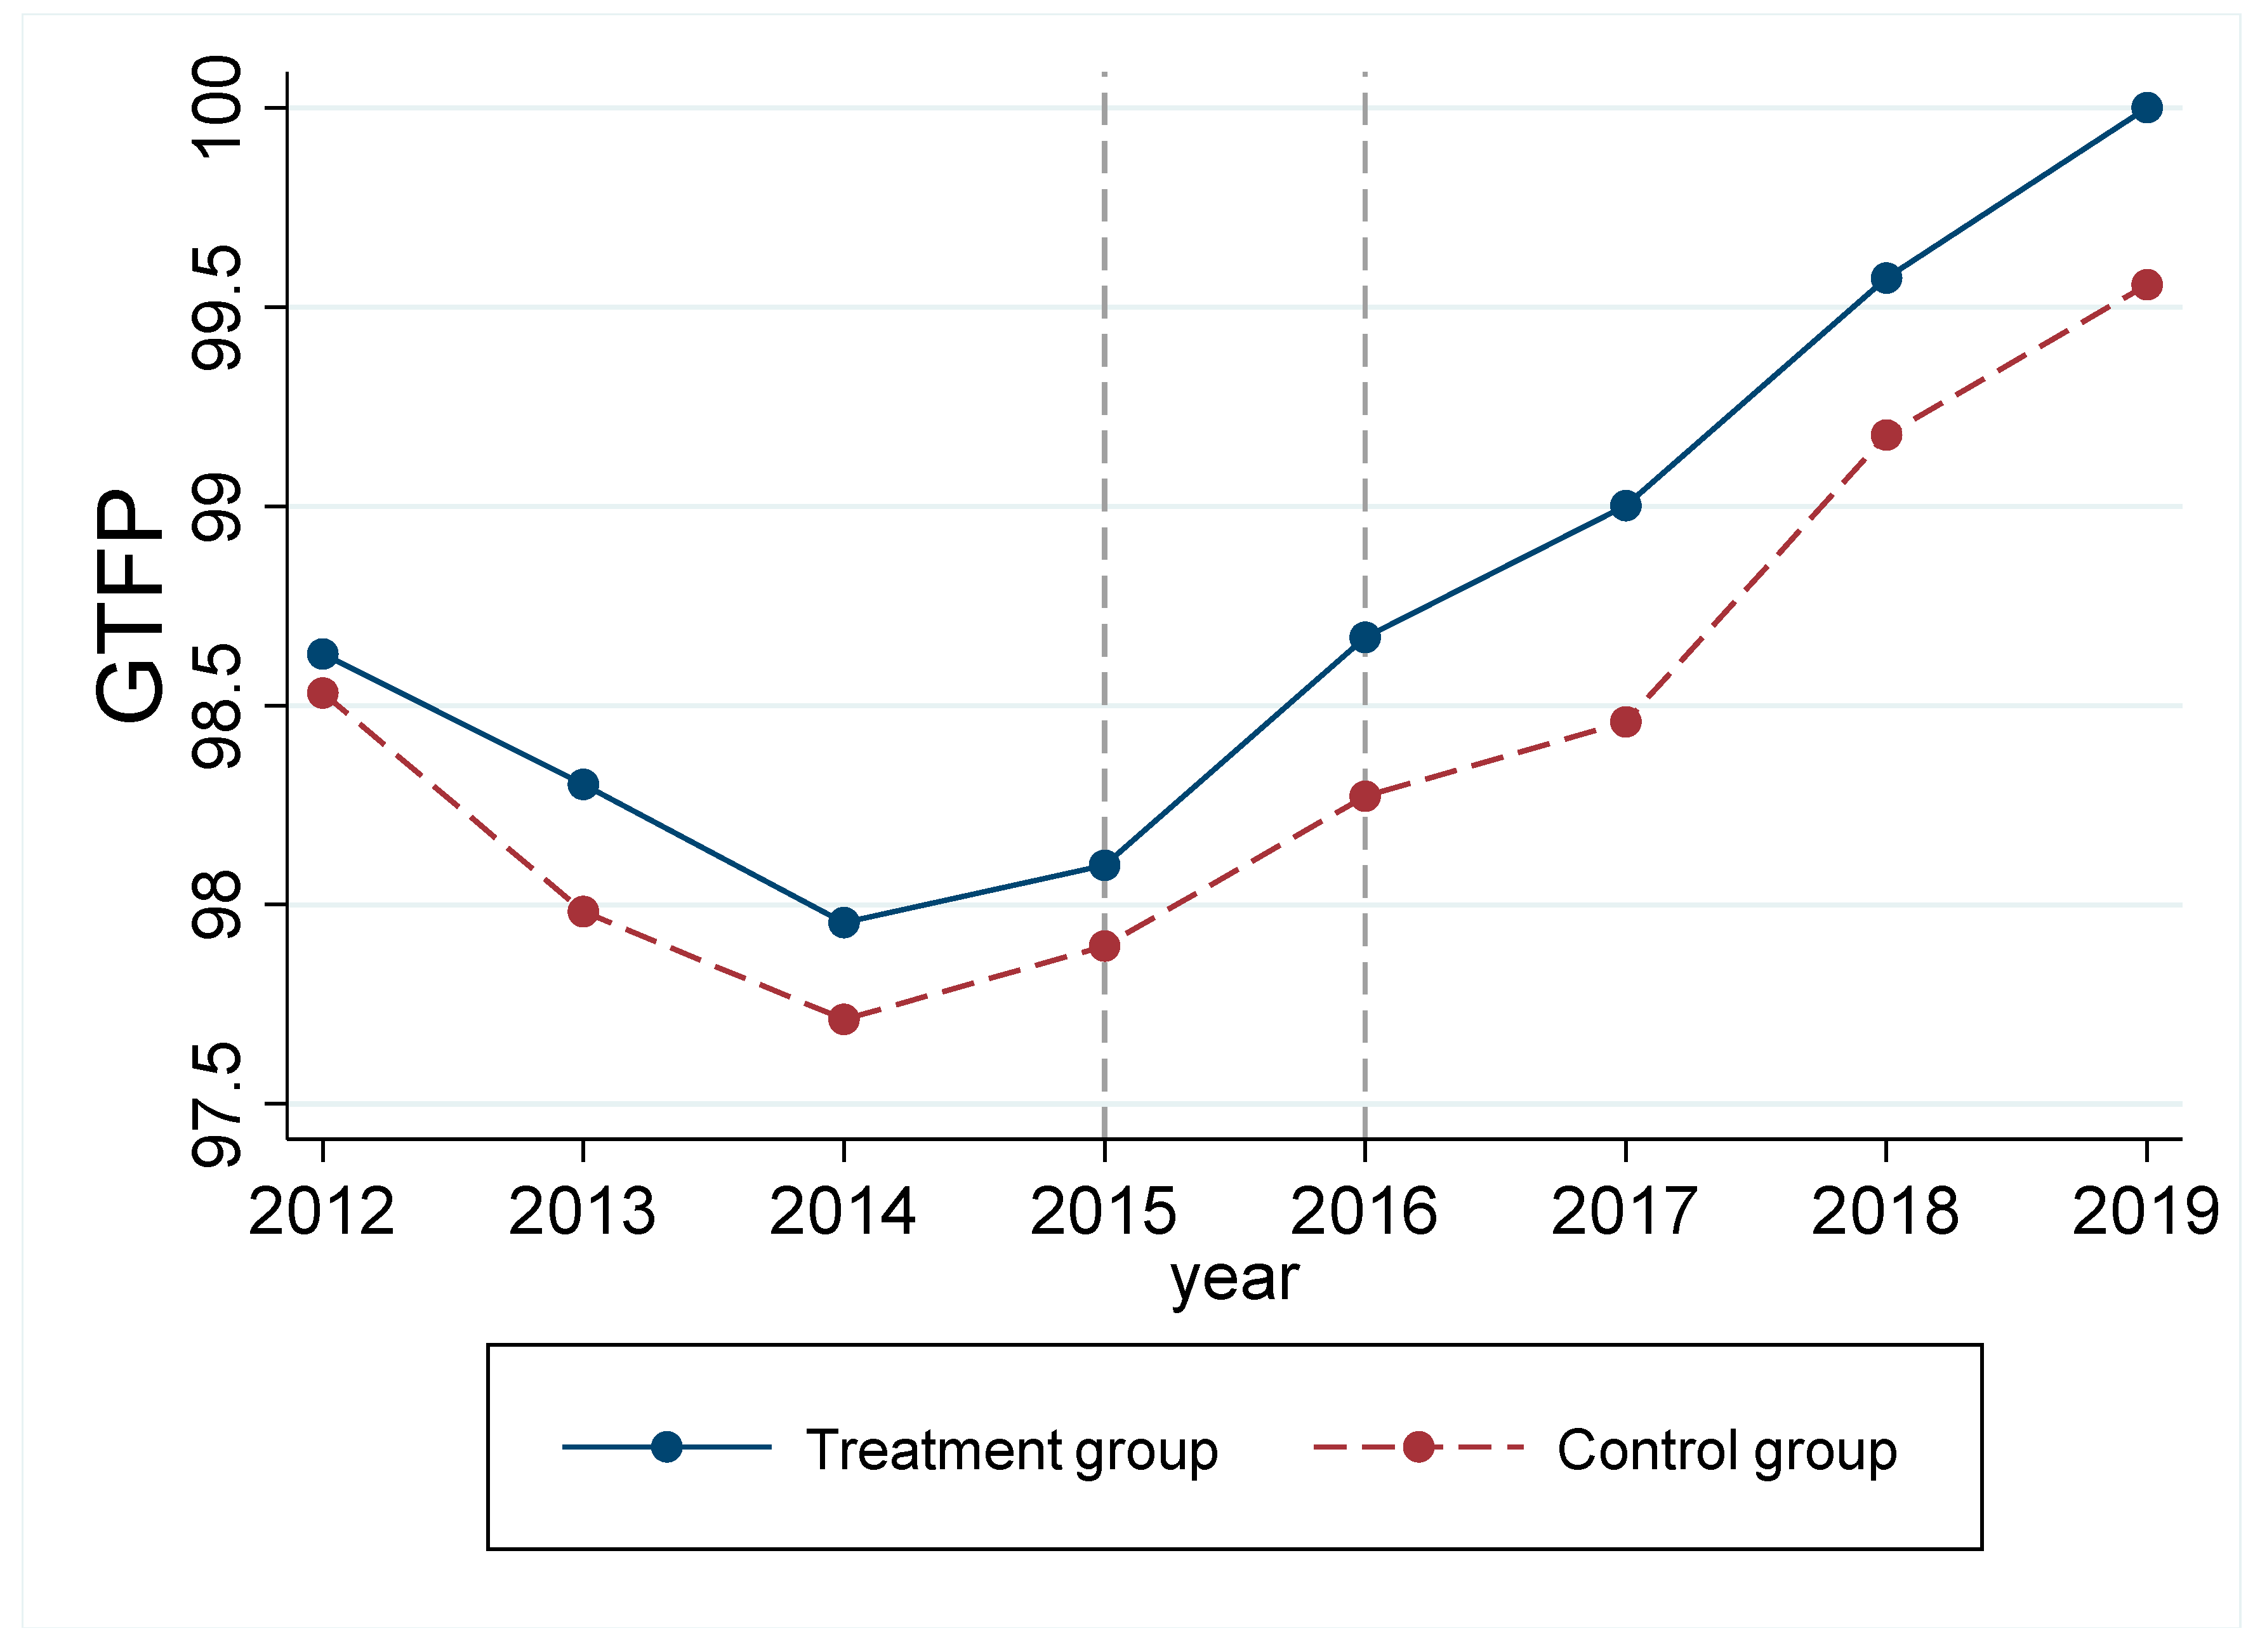
A critical assumption for policy evaluation using the DID model is satisfying the parallel trend condition. This implies that in the absence of the NBDCPZ implementation, the GTFP change trends between the control group and treatment group should show no significant differences. To verify this assumption, this study employs event analysis following Jacobson et al. (1993) [60]. As shown in Formula (2),  D c t + k  is a series of dummy variables, which denote whether the NBDCPZ pilot policy was implemented in year k in city c β k  is the difference between the control group and treatment group at year k. If any of  β k  is significant during  k   <   0 , it indicates that the control group and treatment group fulfill the parallel trend assumption prior to the policy’s implementation. This study chooses the first period before the pilot as the base period. 
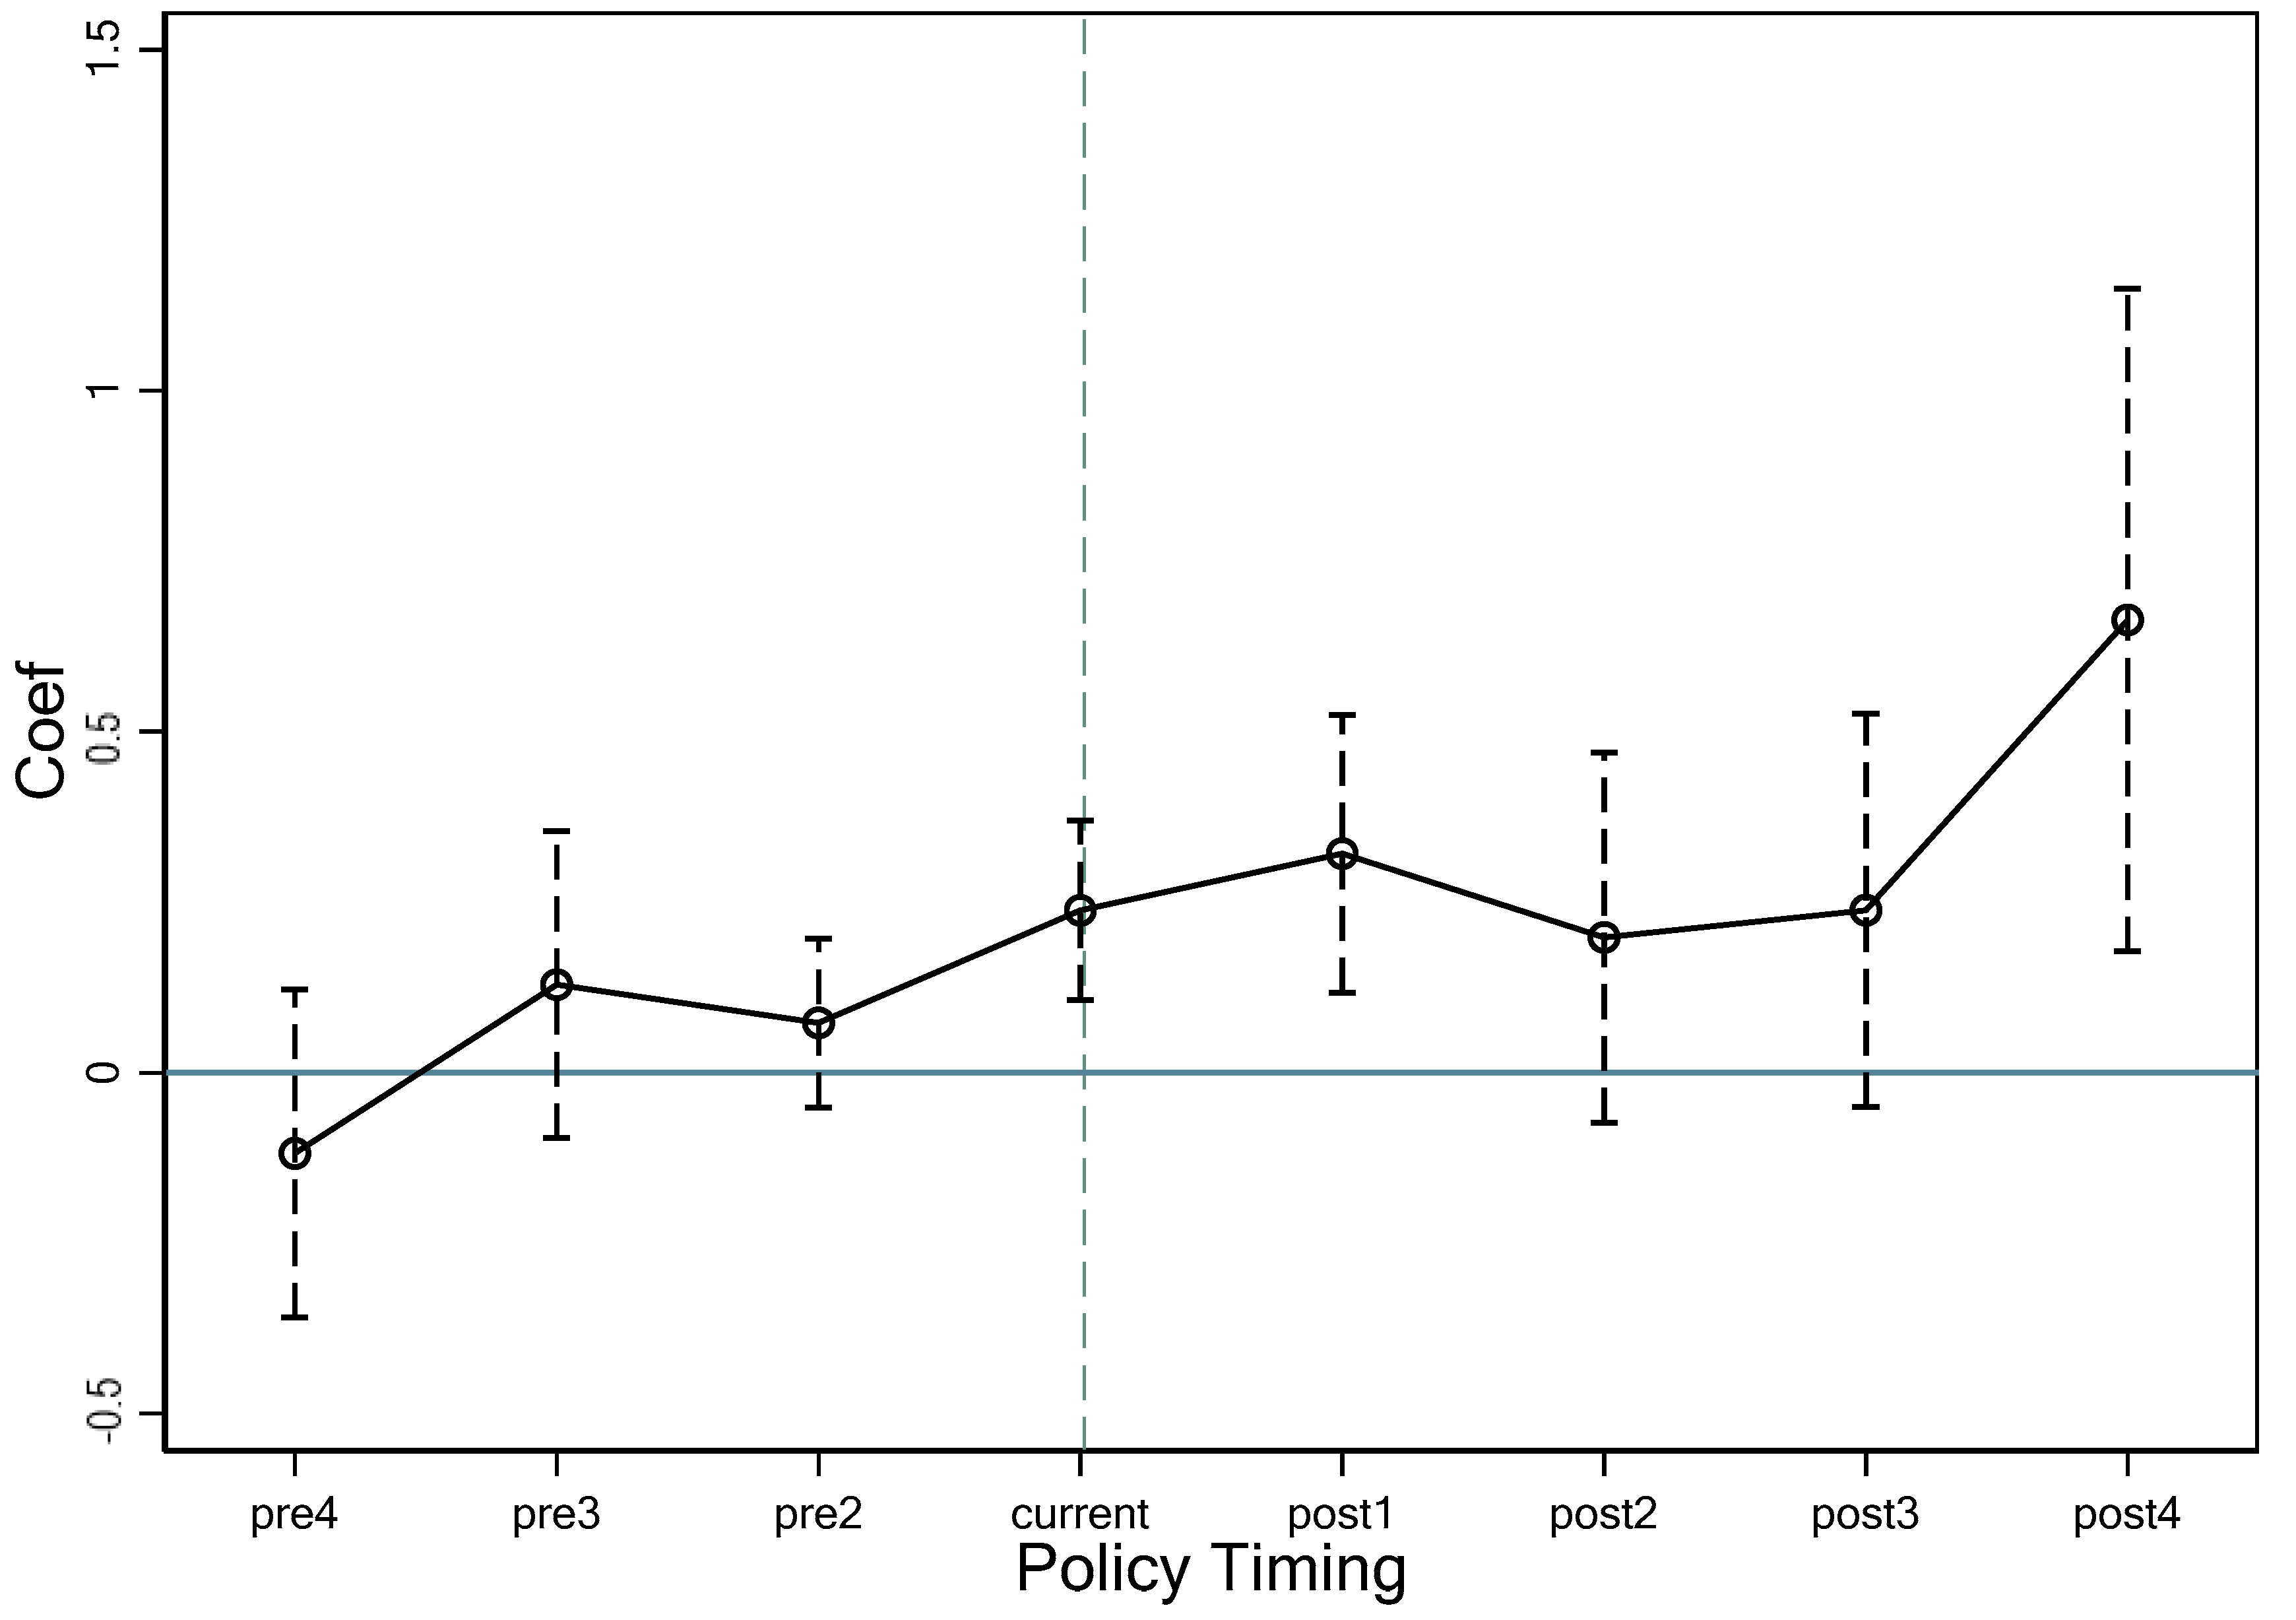
Figure 5 shows the 95% confidence intervals for the dynamic effect’s estimated coefficients, which are not significant in the years before the pilot implementation. This reveals that the GTFPs of the treatment and control groups have a relatively similar change trend before the pilot, thus satisfying the assumption. Furthermore, for the first and fourth periods after the pilot, the estimated coefficients are significantly positive. These demonstrate that the construction of NBDCPZ does, indeed, have a substantial promotional influence on GTFP.
G T F P i t = α + k = - 4 k = 3 β k × D c t + k + C o n t r o l s i t + ε it
(2) Placebo test
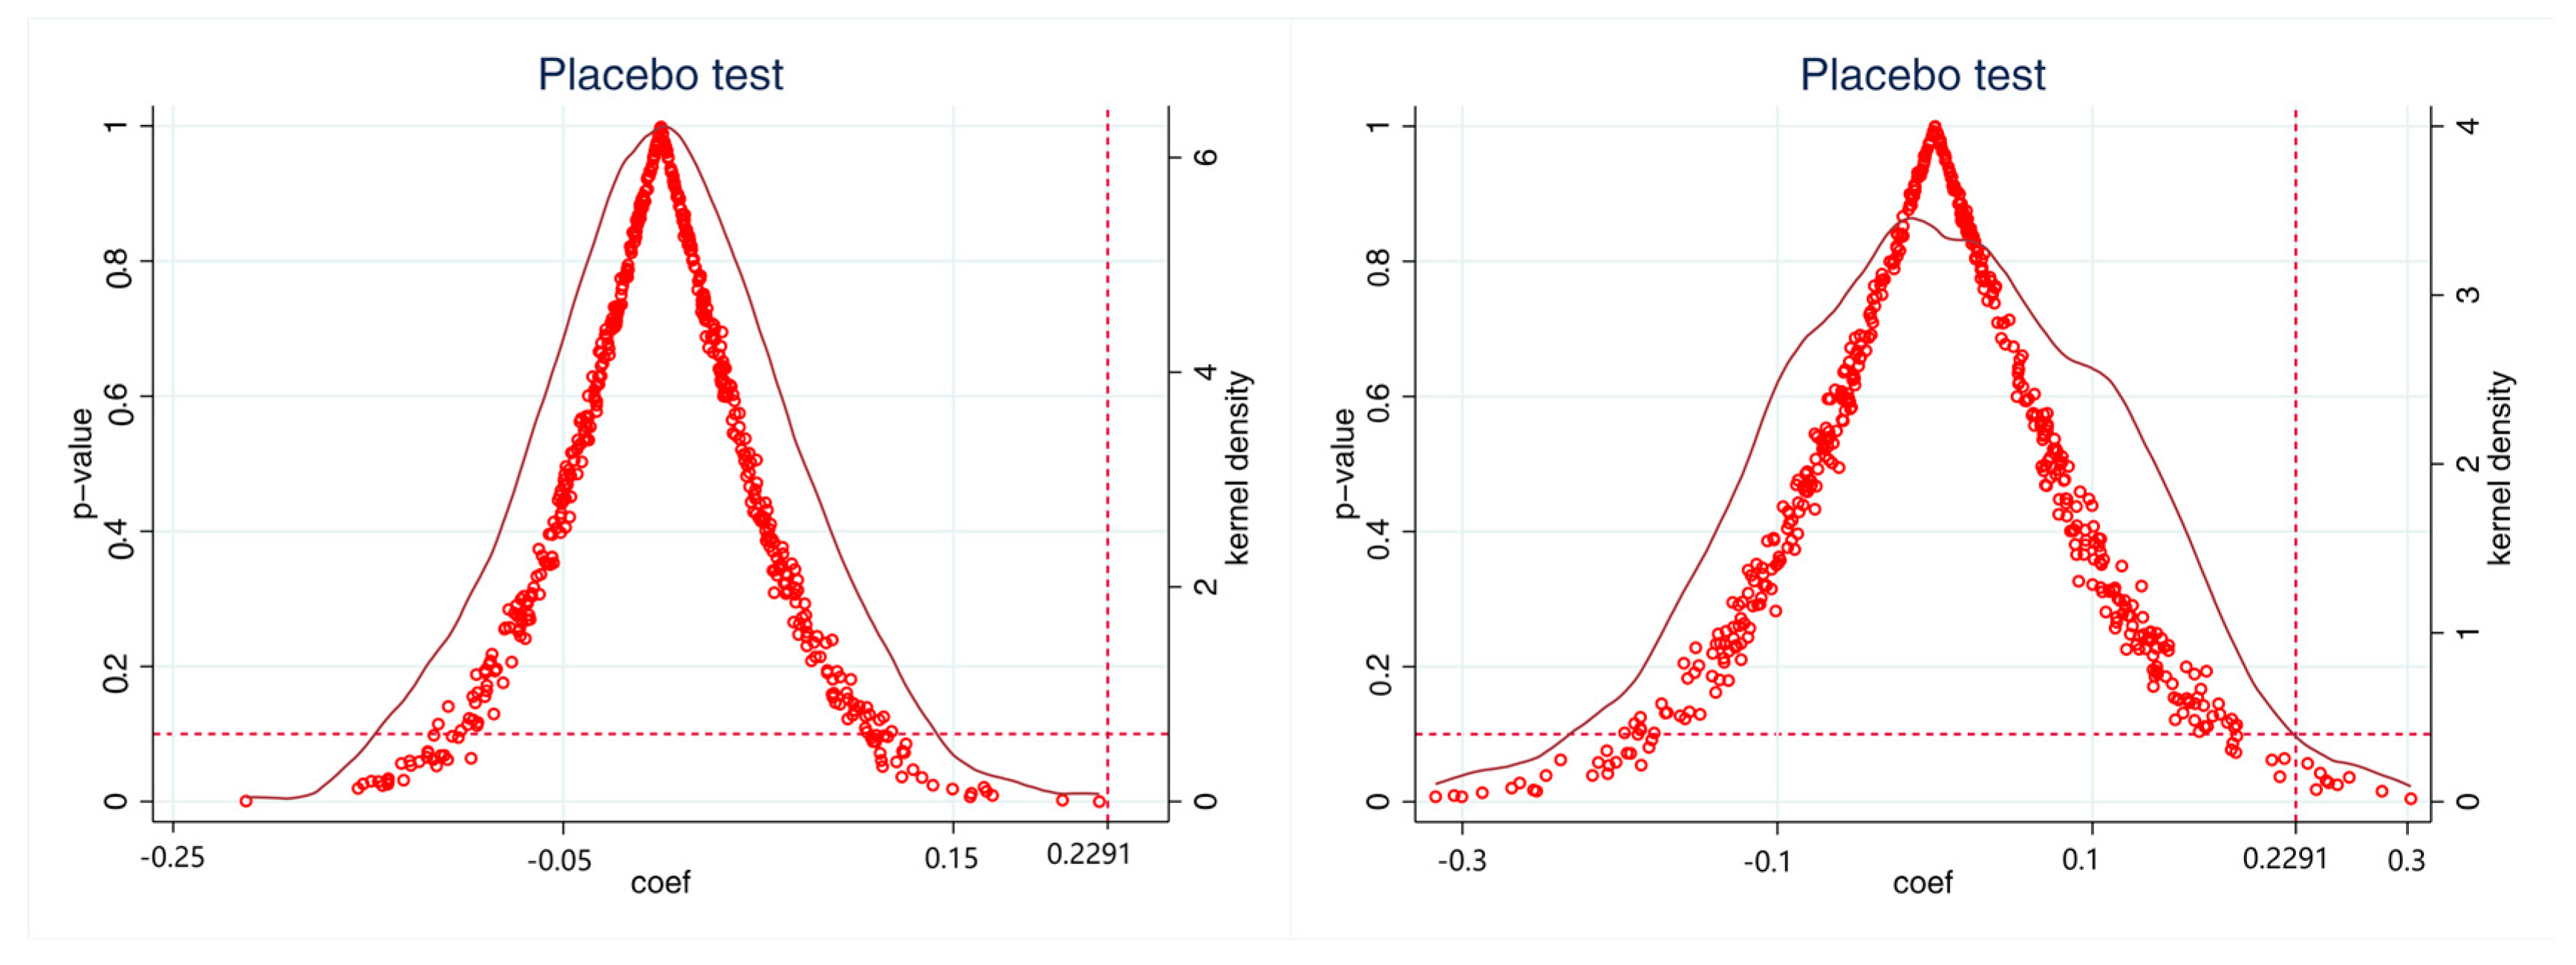
In order to exclude the impact of other random variables, this study executes an individual placebo test and a time placebo test by selecting treatment groups at random. This involves randomly selecting cities in our sample as pilot zones for the NBDCPZ, while preserving the same data distribution, to construct fictional treatment and control groups for regression analysis. If no interference from other random effects exists, the estimated coefficients corresponding to these fictitious policy dummy variables should be insignificantly distinct from zero. This suggests that the random selection of pilot cities has no significant effect on urban GTFP. To ensure the robustness of our findings, we repeat this random selection process 500 times via bootstrapping. Figure 6 (left) shows the kernel densities of the estimated coefficients and p-value distributions. The distributed coefficients randomly cluster around zero, with their corresponding p-values basically bigger than 0.1. Meanwhile, the coefficient of the real policy dummy variable DID is 0.2291, marked by the dashed line in Figure 6, and it is obviously different from those obtained in the placebo test. Additionally, this study conducts a time-point placebo test with the generated kernels of estimated coefficients and their p-value distributions plotted in Figure 6 (right). Similar to the individual placebo test, the distributed coefficients randomly cluster around zero, with their corresponding p-values basically bigger than 0.1. Therefore, we conclude that random factors do not disrupt the NBDCPZ’s influence on GTFP. The policy effect of the NBDCPZ is not a coincidence, which bolsters the robustness of our baseline conclusions.
(3) PSM-DID
This study incorporates the propensity score matching (PSM) method to alleviate the endogeneity problem caused by the potential sample selection bias. The primary aim of this method is to select control groups. Here, we pick control groups from non-pilot cities, using the previously used control variables in regression as covariates. Next, we use the logit model to estimate the propensity score values. By employing radius matching with a radius of 0.05 for each period, the cities with the closest scores are chosen as the matched control group for the pilot cities of the NBDCPZ. The balance test shows that the standardized deviation of all covariates is less than 10%, and the t-value is not significant. This indicates that the standardized deviations of the covariates with significant differences have been significantly reduced, implying that all covariates pass the balance test. After obtaining the new control groups, we re-examine the relationship between NBDCPZ and GTFP. In Table 3, columns (1) and (2), similar to the baseline regression results, the core explanatory variable DID is significantly positive. Moreover, to ensure the robustness of the results, we use the period-by-period 1:4 nearest-neighbor matching method. In Table 3, columns (3) and (4), the core explanatory variable DID is still significantly positive. After alleviating potential sample selection bias and self-selection bias, this study employs the PSM-DID method to obtain consistent estimation results, further demonstrating that the research conclusions are not influenced by specific samples, and the conclusions remain robust.
(4) Instrumental Variable (IV) Approach
In order to mitigate the endogeneity problems caused by simultaneity bias and omitted variable bias, this study uses the instrumental variable (IV) approach. Taking cues from studies by Barone et al. (2015) [61] and Tian et al. (2022) [62], we use the distance from each city to the nodal city of “Eight Verticals and Eight Horizontals” fiber optic trunk network as our instrumental variable. In the past few decades, China has built up an “Eight Verticals and Eight Horizontals” fiber optic trunk network that covers all provincial capital cities and key areas across the nation. From the standpoint of correlation, the “Eight Verticals and Eight Horizontals” fiber optic trunk network forms the basic framework of China’s communication network and lays the foundation for subsequent regional digital infrastructure development. From an exogenous standpoint, the impact of the “Eight Verticals and Eight Horizontals” fiber optic trunk network project in history has little impact on green development. Therefore, it meets the exogenous requirements. Our instrumental variable regression results, represented in Table 4, reveal that after satisfying the weak instrument test, the pilot policies of the NBDCPZ continue to have a significantly positive impact on urban GTFP growth. In column (2), the estimated coefficient of DID is 0.1834 and is significant at the 5% level. This indicates that the policy shock of NBDCPZ has led to a 0.1834% increase in GTFP in pilot cities relative to non-pilot cities. The instrumented DID coefficient (0.1843, Column (2) of Table 4) is somewhat smaller than the OLS estimate (0.2074, Column (2) of Table 2), suggesting that the endogenous explanatory variable leads to overestimating the impact of the NBDCPZ on GTFP. However, we also deduce that the construction of the NBDCPZ robustly fosters urban GTFP escalation.
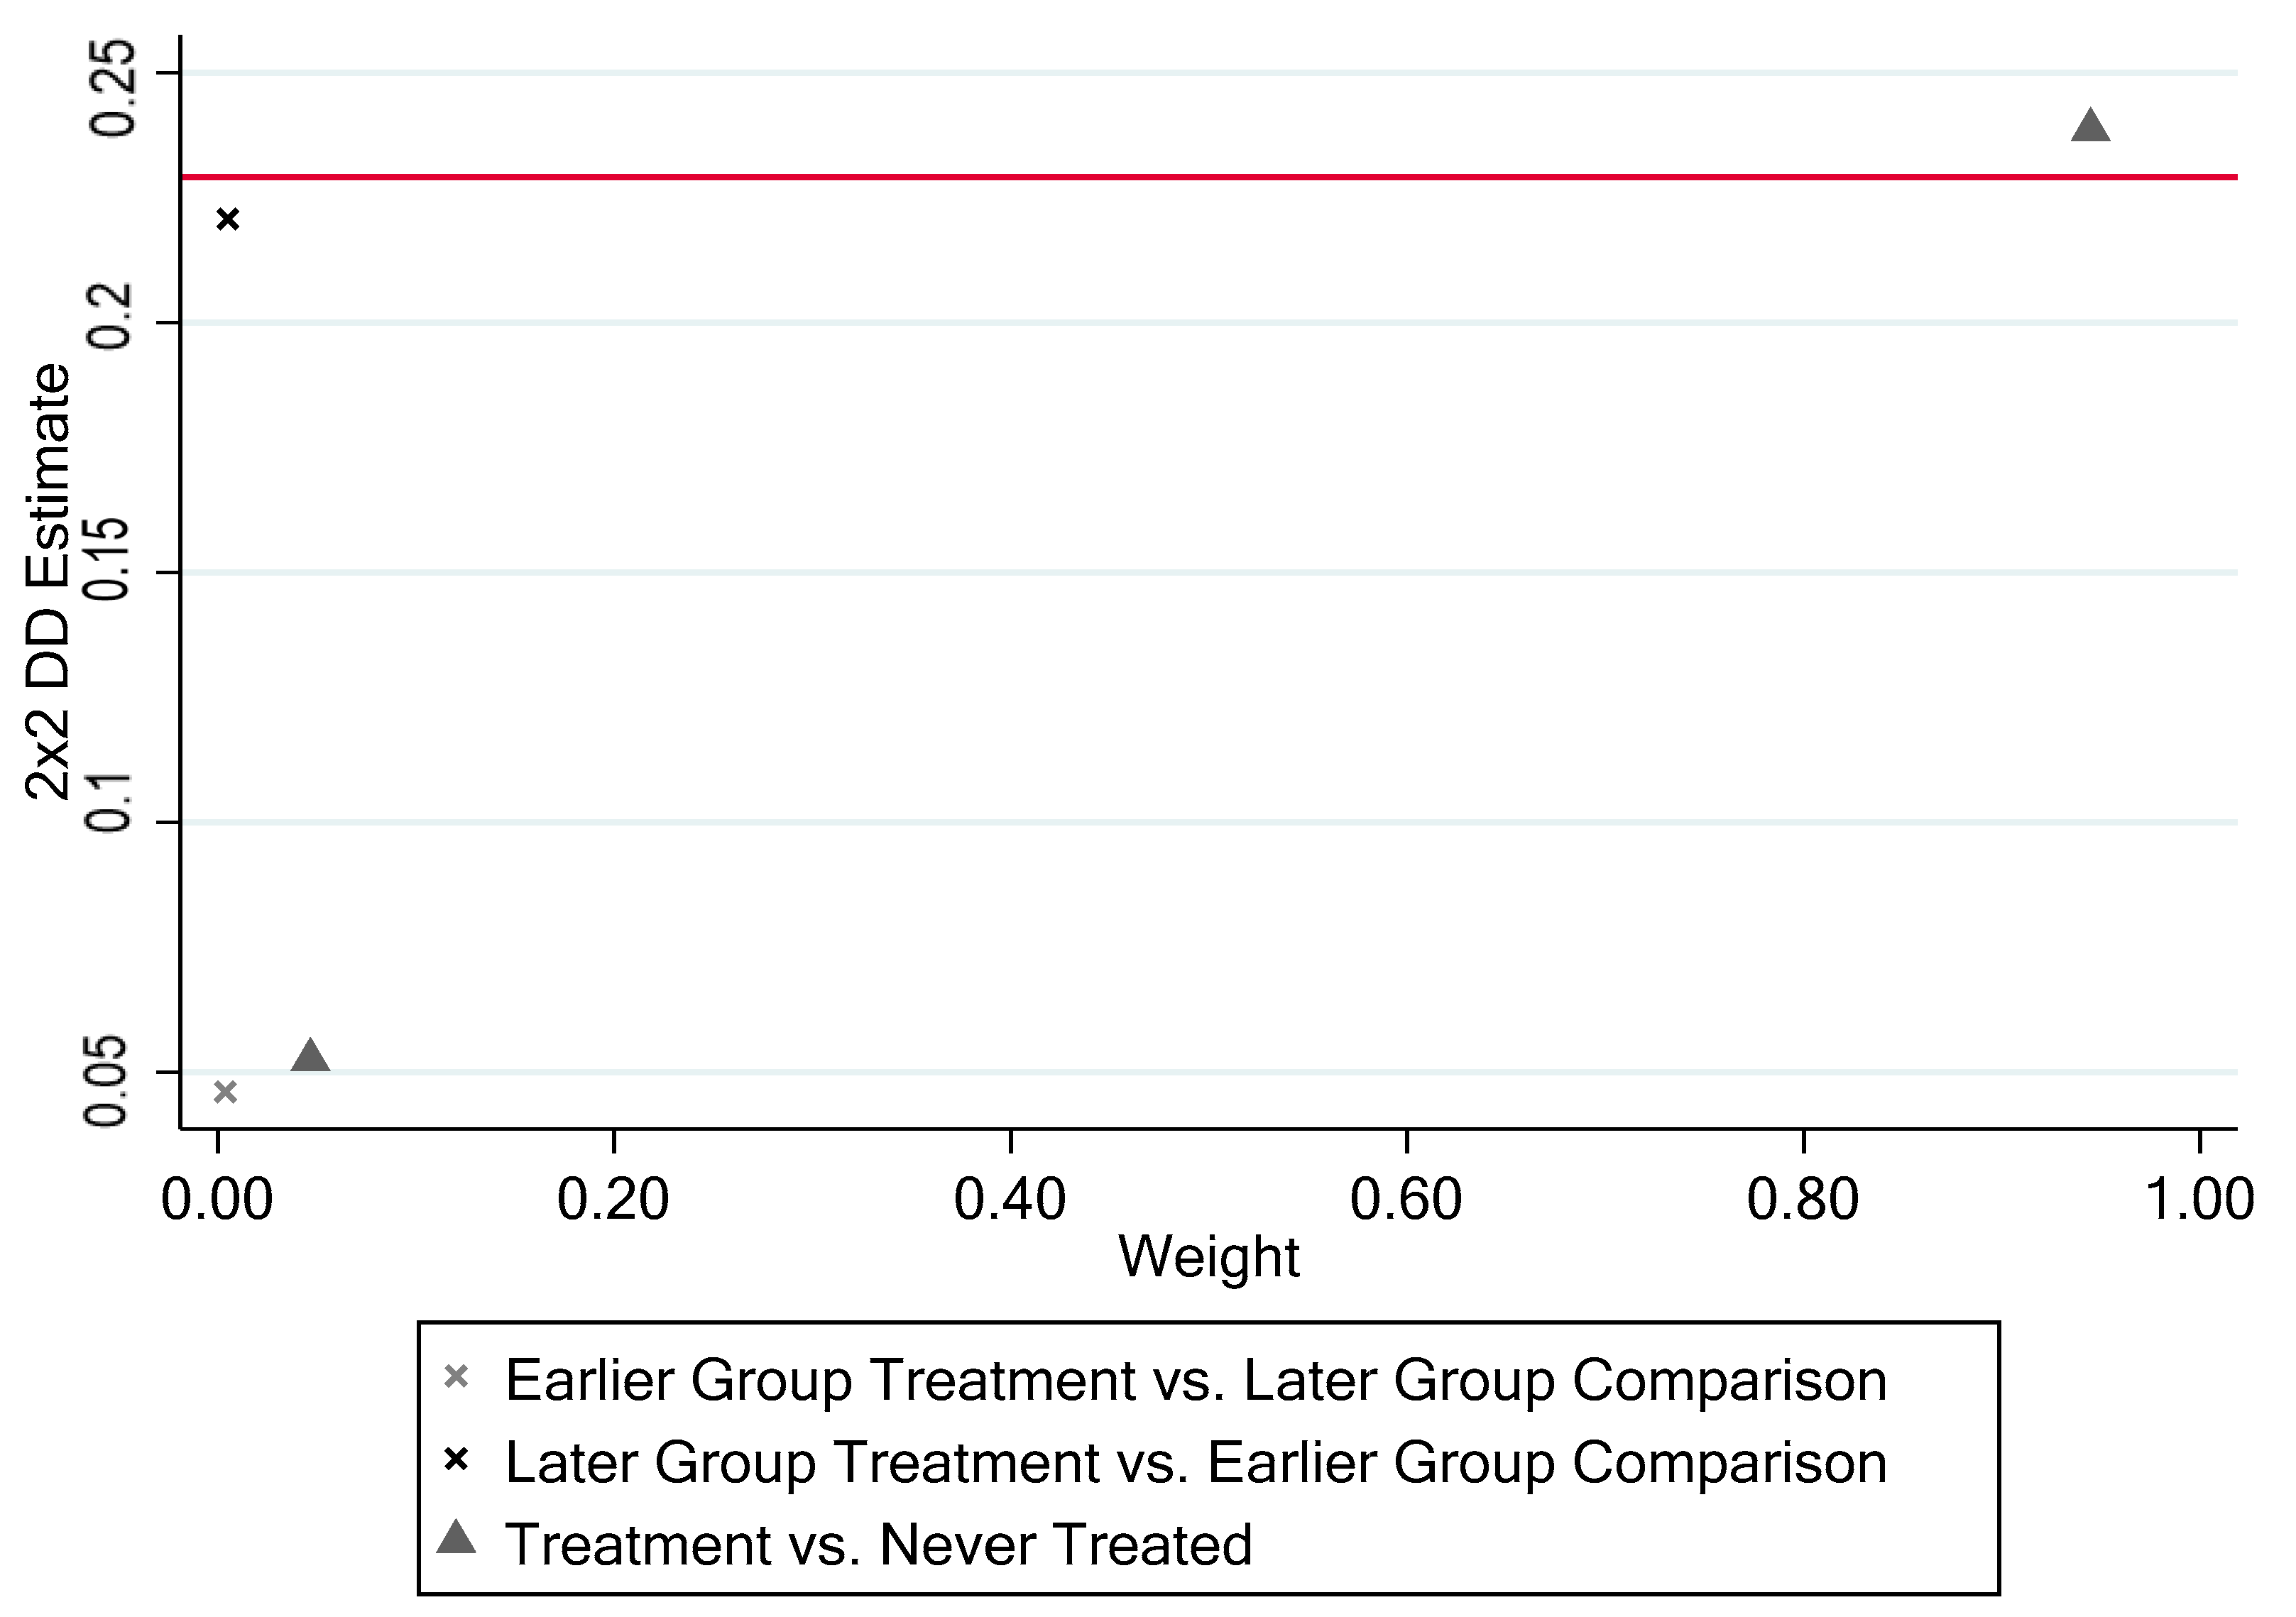
(5) Treatment effect heterogeneity
Considering that the policy’s pilot project was implemented in two separate phases, potential biases might be present. This is because the staggered difference-in-differences estimation is essentially a weighted average of varying treatment effects. In instances where negative weights occur, the weighted average of treatment effects may significantly diverge from the true average treatment effect. Therefore, the Goodman-Bacon decomposition method is implemented (Goodman-Bacon, 2021) [63] to assess the degree of bias within DID estimations. The results of this decomposition, as illustrated in Figure 7, indicate that an appropriate weighting of treatment effects results in a remarkably high convergence rate of 99.96%. This lends further support to the robustness and reliability of our findings.
Additionally, using the CSDID method provided by Callaway and Sant’ Anna (2021) [64], the average estimated treatment effect calculated through aggregation is shown in Table 5. The treatment group’s average treatment effects (ATT) are significantly positive at a 5% confidence level, demonstrating that the research findings remain robust even after mitigating the heterogeneity in treatment effects.
(6) Other robustness tests
Several robustness tests were implemented in this study as follows: ① Outlier removal: The dependent variable was winsorized at the 1% and 99% percentiles to mitigate the influence of extreme values. As Table 6, column (1) shows, the direction and significance of the core explanatory variable (DID) remained consistent with the baseline regression results. ② Substituting the dependent variable: We changed the input–output variable combination, and only PM2.5 was selected as the non-desired output to measure GTFP. As Table 6, column (2) shows, the coefficient on the core explanatory variable (DID) remained significantly positive. ③ Excluding other policy effects: We selected the “Broadband China” program, conducted in three batches from 2014 to 2016, to exclude the competitive effects of other policies on urban GTFP. As Table 6, column (3) shows, the coefficient on the core explanatory variable (DID) remained significantly positive. ④ Excluding specific cities: The sample excludes four municipalities and a number of provincial capitals. As 
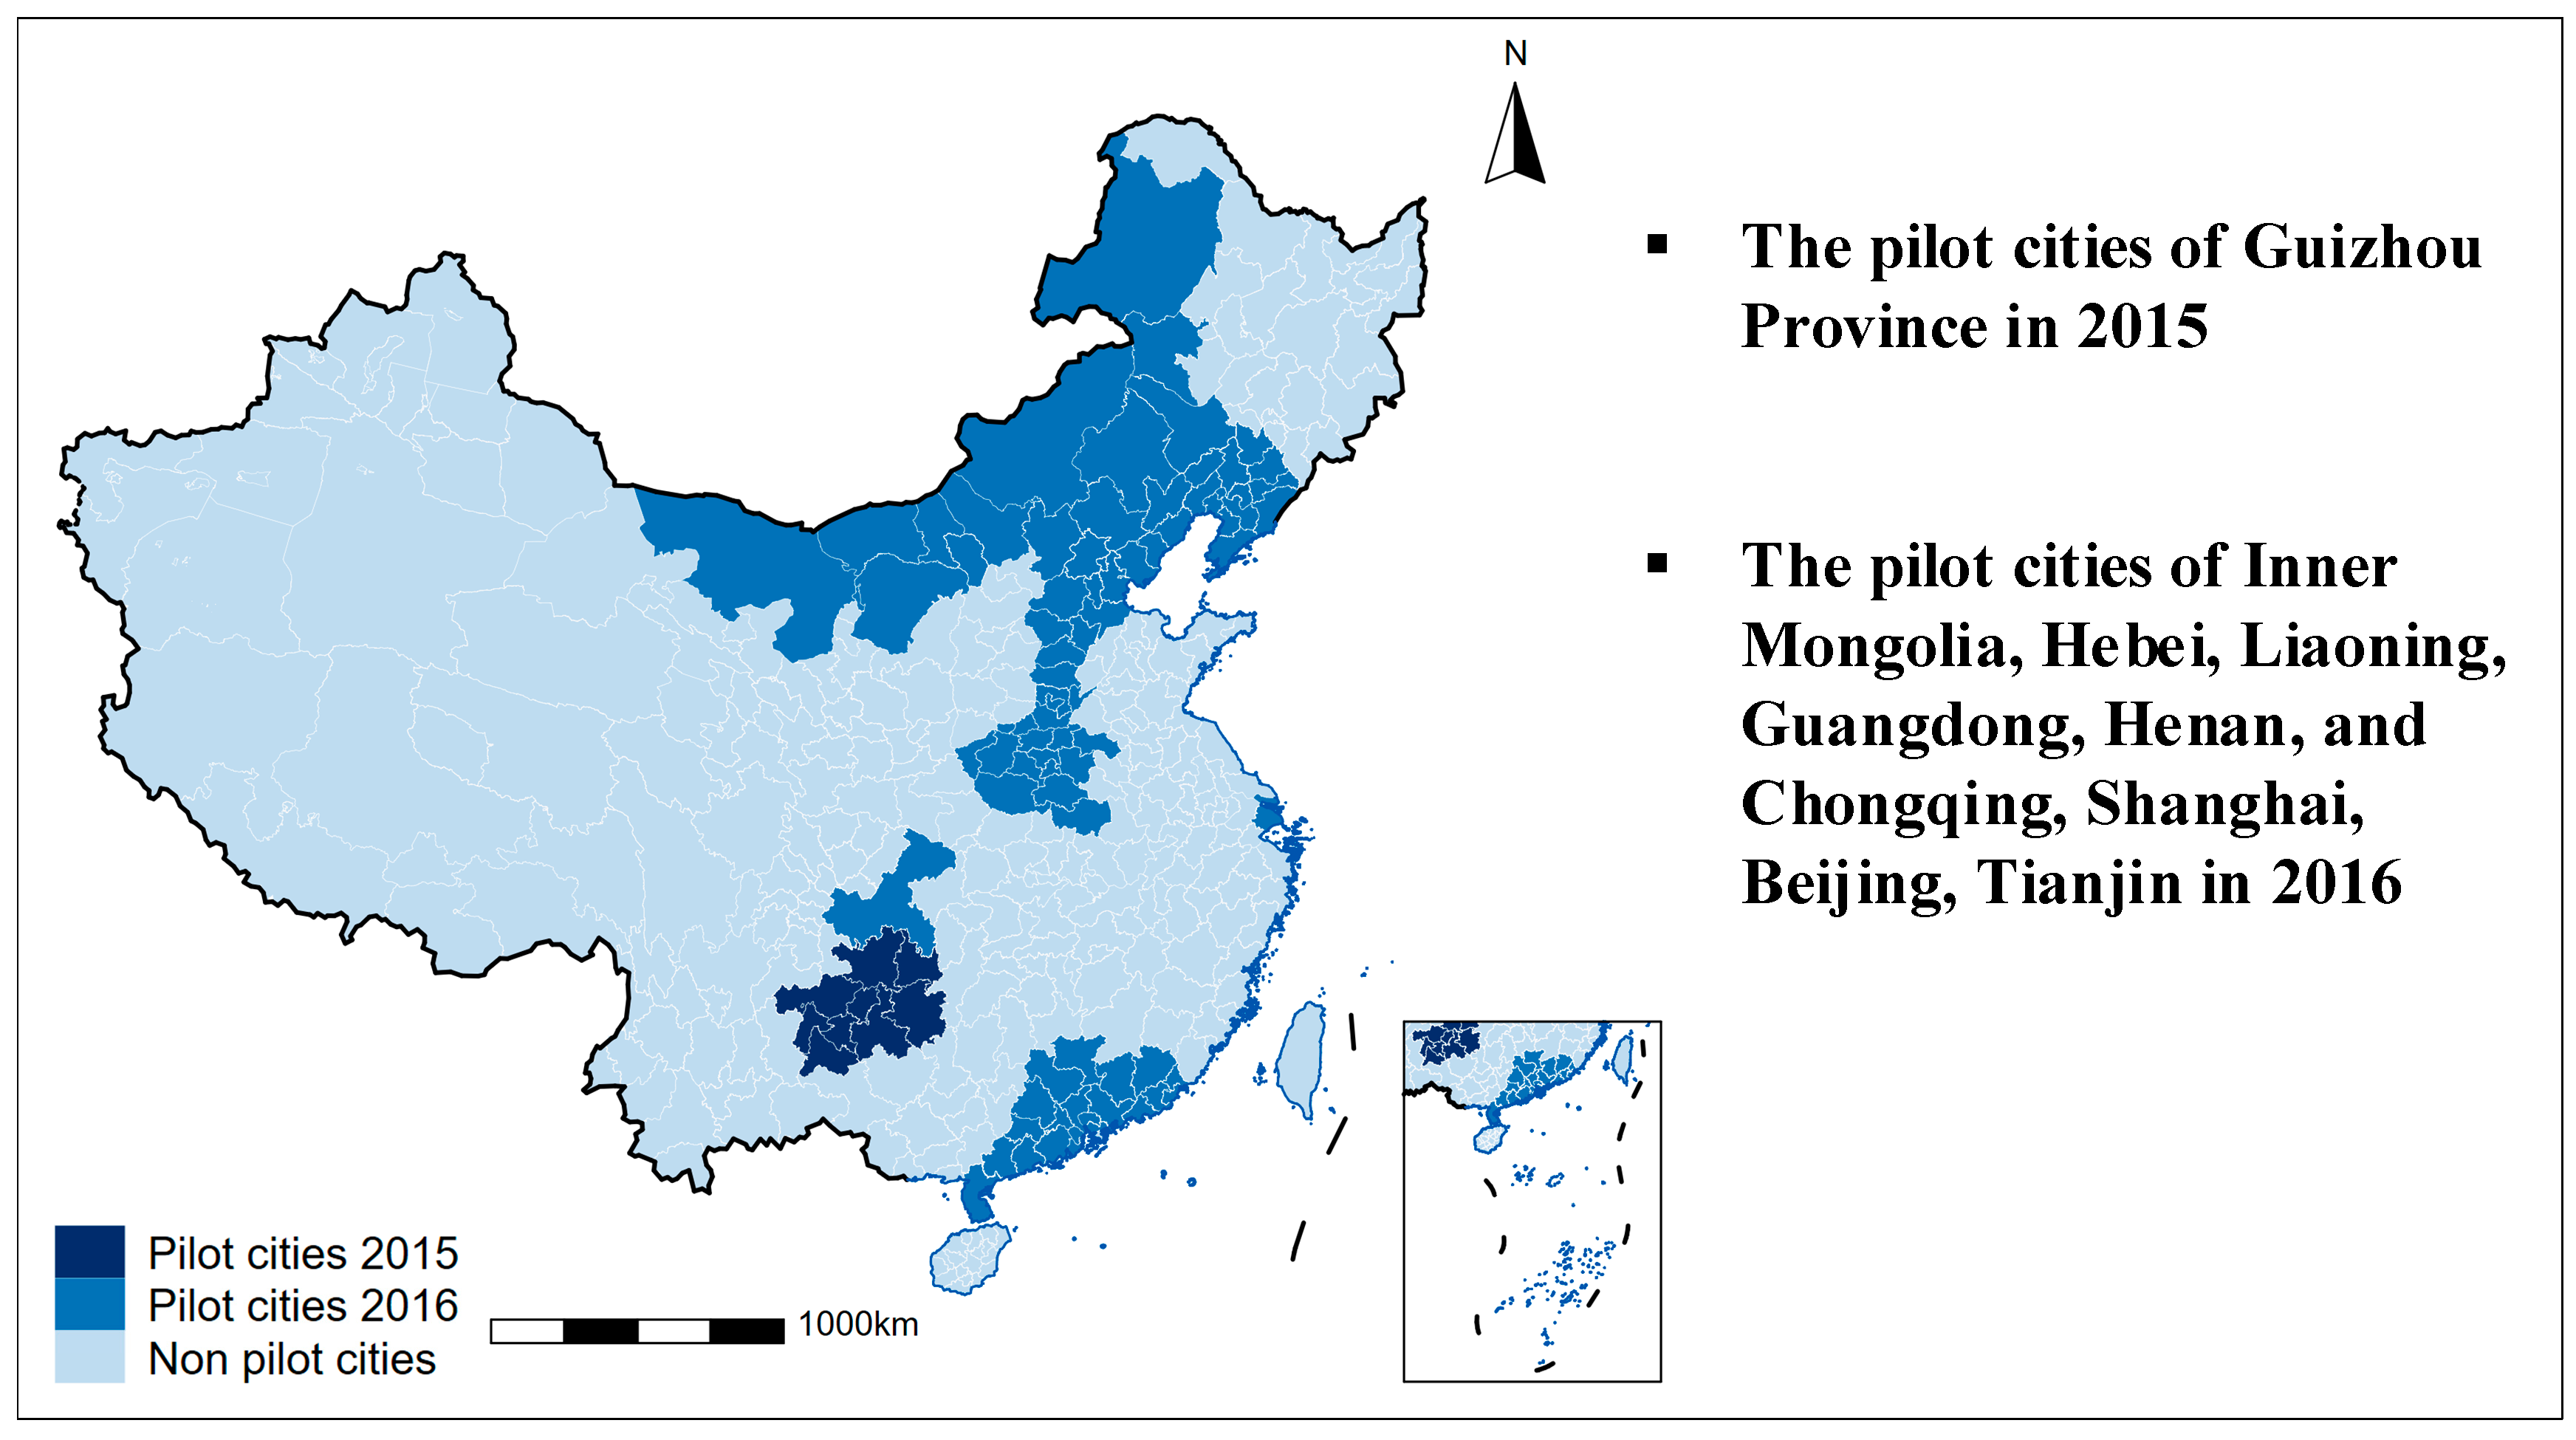
Table 6, column (4) shows, the regression results remained robust. ⑤ Adjusting the timing of the pilot implementation: The times of the pilot implementation for all cities in Guizhou Province were set to 2016. As Table 6, column (5) shows, these findings collectively underscore that our baseline regression results retain their robustness across multiple test conditions performed in this study. ⑥ Introducing regional fixed effects: This study further controls for regional fixed effects. As Table 6, column (6) shows, the coefficient of the core explanatory variable (DID) remained significantly positive.

4.4. Heterogeneity Analysis

The impact of big data on GTFP could differ among various cities. This study conducts heterogeneity analysis based on three aspects: industrial foundation, resource foundation, and urban scale.
Firstly, according to the industrial foundation, we categorize our sample cities into traditional industrial cities and other cities. Traditional industrial cities refer to the industrial cities that were established in the early stages of China’s national development, with a focus on heavy industry backbone enterprises. In Table 7, columns (1) and (2), the results show that in the traditional industrial cities, urban digital transformation significantly increases GTFP, while the effect is not significant for other cities. A possible reason is that the impact of urban digital transformation on GTFP requires a developed industrial system as support.
Secondly, according to the resource bases, we categorize our sample cities into resource-based cities and other cities. Resource-based cities are mainly dominated by local mineral, forest, and other natural resources and mining and processing industries. In Table 7, columns (3) and (4), the results show that for resource-based cities, the effect of urban digital transformation on GTFP is not significant, whereas other cities experience a significant improvement in GTFP through digital transformation. This can be attributed to the fact that resource-based cities rely heavily on natural resources, thereby diminishing the impact of urban digital transformation on GTFP. Meanwhile, the other cities are more likely to break away from traditional development paths and are inclined to increase GTFP through dedicated efforts in digital transformation.
Thirdly, according to the urban scale, we categorize our sample cities into large cities and small cities. Large cities are defined as those with a permanent population of over 500,000, while small cities have a permanent population of below 500,000. In columns (5) and (6) of Table 7, the results show that for large cities, the effect of urban digital transformation on GTFP is not significant, whereas in small cities, digital transformation significantly improves GTFP. The possible reason might be that small cities selected for the NBDCPZ have a stronger desire for digital transformation, resulting in more investment in elements such as digital capital and digital technology. Consequently, the pilot project of the NBDCPZ has a more significant effect on improving GTFP.
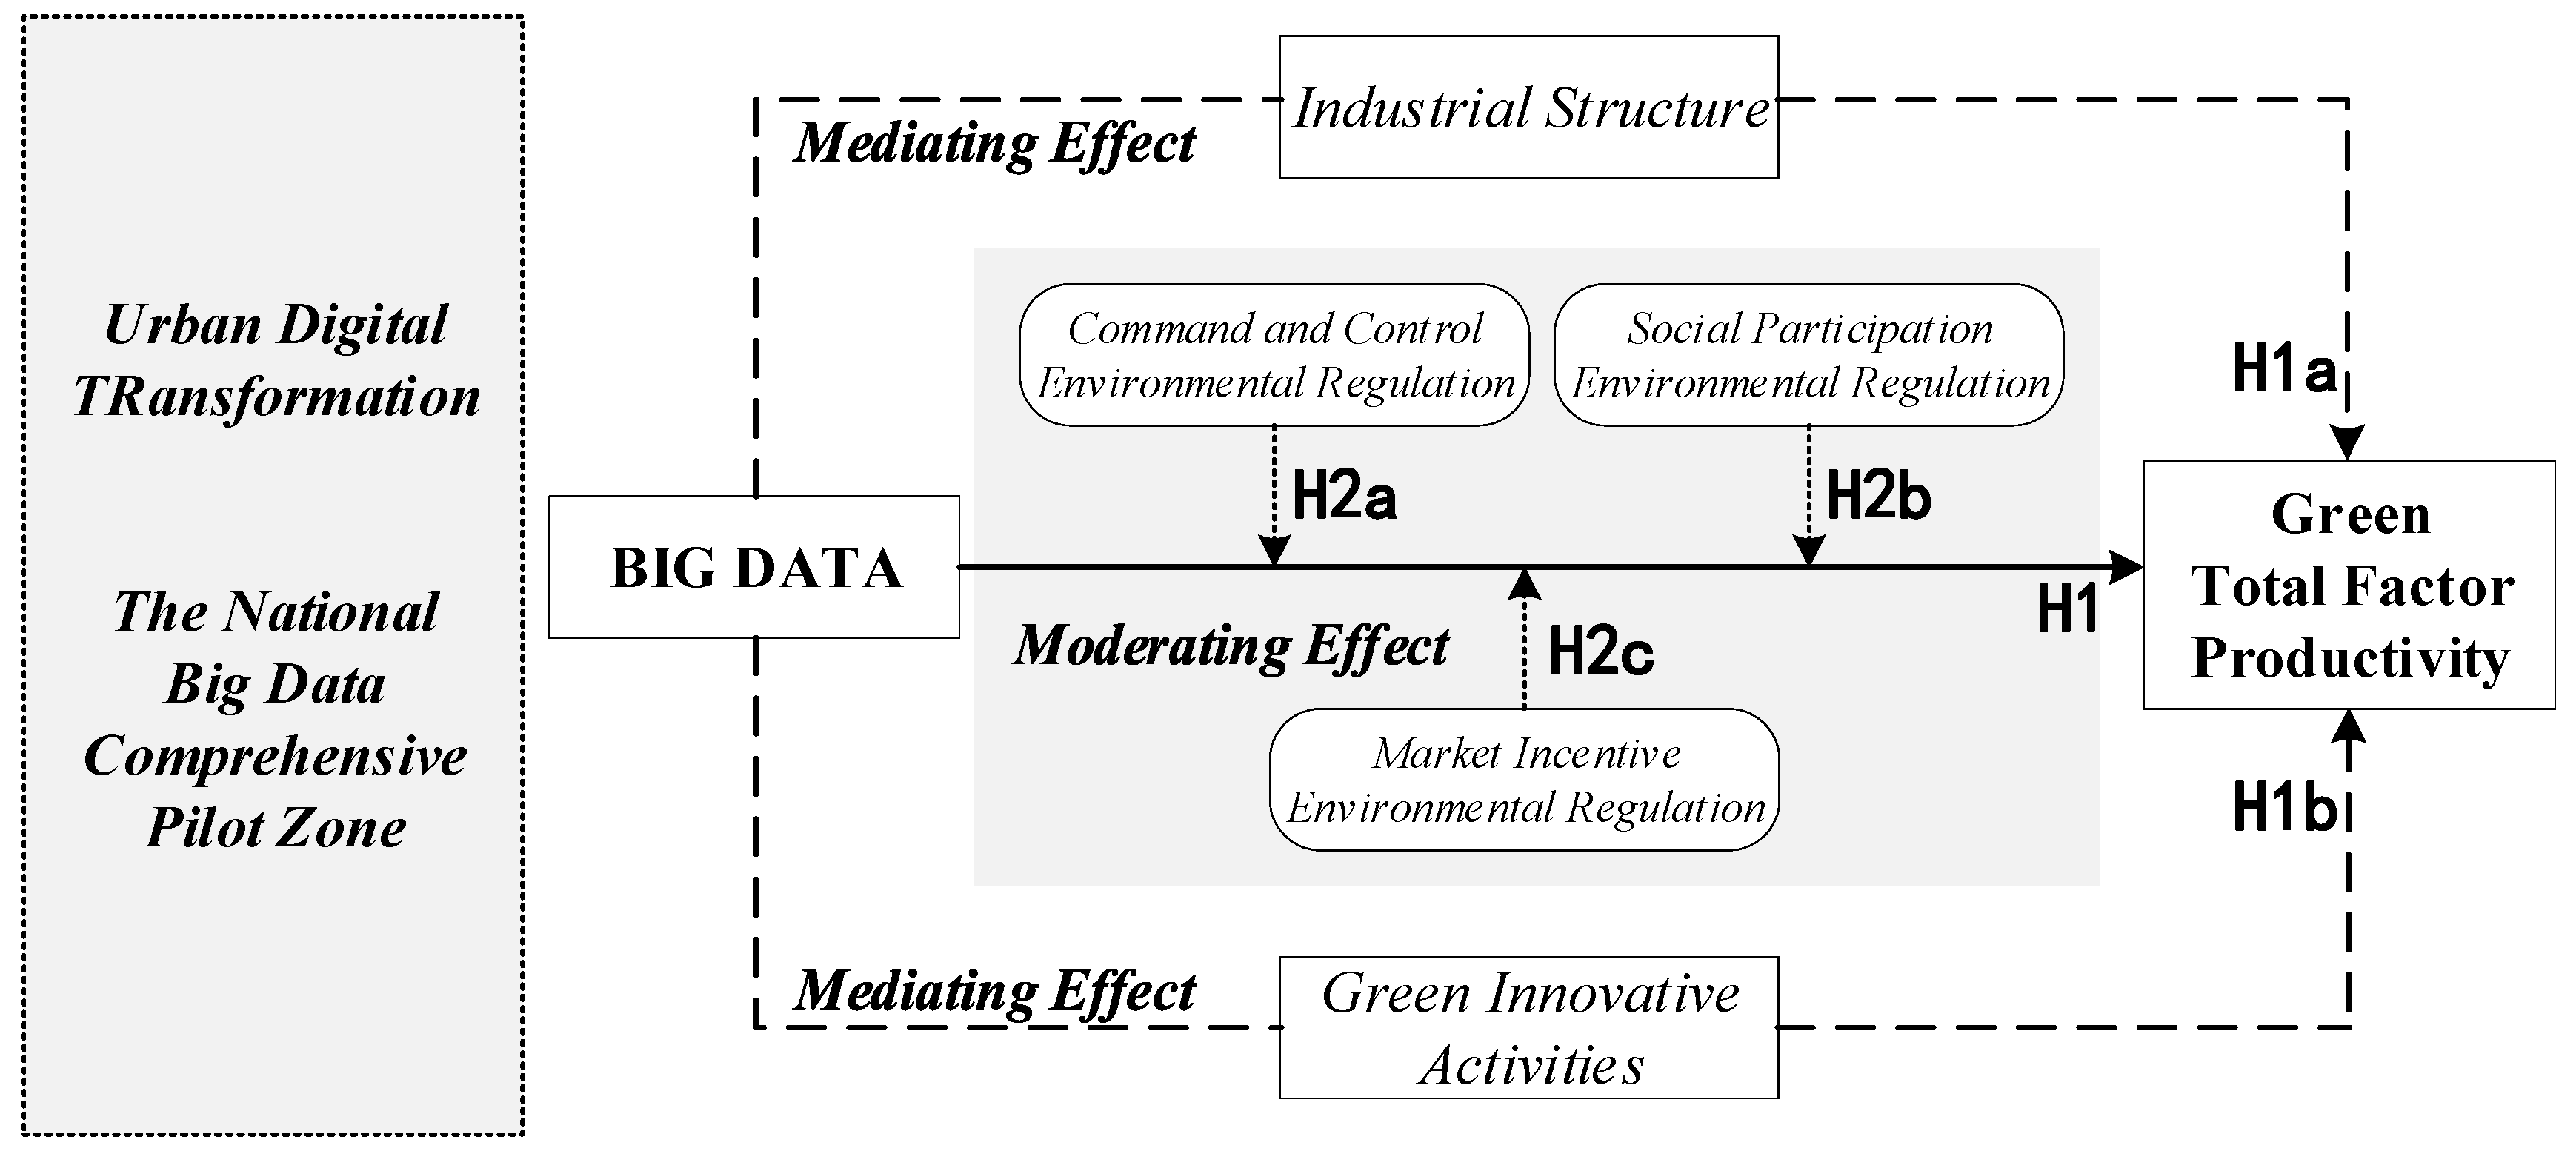
This section presented the empirical evidence of this study, as well as a number of robustness checks, and the results show that the construction of the NBDCPZ increases GTFP. The next section will carry out the mediating effects test.

5. Analysis of Mediating Effects

The previously discussed baseline regression results along with pertinent robustness checks validate that the construction of the NBDCPZ has led to a significant enhancement in the GTFP of the pilot cities in comparison to the cities of the control group. Our focus now shifts to identifying the specific mechanisms through which the construction of the NBDCPZ affects GTFP. For this purpose, the study mainly selects two perspectives: macro-industrial structure and micro-green innovation.

5.1. Industrial Structure as a Channel

The transformation and upgrading of industrial structures have a crucial impact on GTFP [65]. This evolution involves optimizing resource allocations among various industries to achieve a rationalized industrial structure, driving the industry’s shift from lower to higher levels, thus resulting in an advanced industrial structure. In this study, we gauge the optimization of the industrial structure across various cities using indices for rationalization (Theil) and advancement (AIS) of the industrial structure. The Theil index is employed to measure industrial structure rationalization, as shown in Formula (3), where  y i , m , t  represents the share of the GDP for industry m in region i during period t, and  l i , m , t  represents the share of employment for industry m in period t. The advancement (AIS) of the industrial structure is characterized using the industrial structure hierarchy coefficient, which reflects the changing proportions of the industrial structure. As shown in Formula (4),  y i , m , t  represents the share of the GDP for industry m in region i during period t. This index can be described as follows:
Theil i , t = m = 1 3 y i , m , t ln ( y i , m , t / l i , m , t ) , m = 1 , 2 , 3
Ais i , t = m = 1 3 y i , m , t m m = 1 , 2 , 3
The results in columns (1) and (2) of Table 8 show that the coefficients of DID are significantly positive, indicating that the construction of the NBDCPZ can notably enhance the rationalization level of the industrial structure. Big data has facilitated cooperation among regional enterprises, further enhancing the level of inter-industry relationships and resource allocation efficiency, and then bolstering the transformation and upgrading of the industrial structure, which positively influences GTFP. The results in columns (3) and (4) of Table 8 show that the coefficient of DID is not significant, indicating that the construction of the NBDCPZ has not effectively improved the advanced level of the industrial structure. These results suggest that the construction of the NBDCPZ primarily influence GTFP by promoting regional enterprise collaboration, enhancing the level of inter-industry relationships and thereby facilitating the transformation and upgrading of the industrial structure. These results provide confirmatory evidence supporting hypothesis H1a, “Big data increases GTFP by elevating the level of industrial structure”.

5.2. Green Innovation as a Channel

Green innovation, being a leading driver of green development, plays an integral role in aiding countries around the world to actualize environmental value (Han and Mao, 2023) [66]. This study investigates whether the construction of the NBDCPZ significantly bolsters regional green technological innovation, subsequently impacting GTFP. We use two indicators, the number of green invention patents and the number of green utility model patents, to measure the level of green technological innovation. It is crucial to note that green invention patents refer to new technical solutions that are proposed for products or methods, emphasizing originality and novelty. They have outstanding substantive characteristics and lead to significant progress compared to existing technologies, making them the highest in technical value among all types of patents. The rationale behind including both these patent types in our regression analysis is twofold: Firstly, it offers solid evidence regarding the robustness of big data’s promotional effect on green technological innovation. Secondly, it allows us to examine the heterogeneity of regression results for the two types of patents. The results in columns (1) and (2) of Table 9 show that the coefficient of DID is positive but not significant, indicating that the construction of the NBDCPZ has not significantly increased the number of green invention patents. The result in columns (3) and (4) of Table 9 show that the coefficient of the DID is significantly positive, indicating that the construction of the NBDCPZ can significantly increase the number of green utility model patents. These results suggest that the NBDCPZ can enhance the level of urban green innovation, thereby increasing the level of GTFP. These results provide confirmatory evidence supporting hypothesis H1b, “Big data increases GTFP by fostering the level of green innovative activities”. However, we also found that big data’s positive promotional effect is not as significant for green invention patents, which typically denote higher innovative quality, as it is for green utility model patents”.
This section carried out the mediating effects test from the perspectives of macro-industrial structure and micro-green innovation. The results show that the construction of the NBDCPZ primarily influenced GTFP by facilitating the transformation and upgrading of the industrial structure and enhancing the level of urban green innovation. The next section will carry out the moderating effects test.

6. Analysis of Moderating Effects

China’s socio-economic landscape is marked by enduring regional development imbalances, largely due to its expansive territory coupled with discrepancies in geographical advantages and resource endowments across various regions. The degree of environmental regulation mirrors a city’s preference for and vigor in addressing environmental issues. Given that differing levels of environmental regulation could potentially affect how urban digitization influences GTFP, it is vital to further investigate these moderating impacts. This study explores the heterogeneity of urban digitization that impacts GTFP from the perspective of environmental regulation. We classified environmental regulation based on the strength of constraints into three categories: command and control environmental regulation (CCER), social participation environmental regulation (SPER), and market incentive environmental regulation (MIER). CCER is assessed by the frequency of environmentally focused terms in local government work reports, serving as a reliable indicator of the intensity of command-type environmental regulation. SPER is measured by the number of environment-related suggestions from the People’s Congress and the Political Consultative Conference in the respective provinces where each city is located. This reflects the degree of public participation in environmental regulation. MIER is calculated as the proportion of investment in environmental pollution control to the gross domestic product in each province where each city is located. To ensure the exogeneity of the moderating variable, this study selects the values of the moderating variable in the base year of 2012.
The results of the regression equations, incorporating different types of environmental regulation indicators as a moderating variable, indicate that the coefficients of the interaction terms of the CCER and the DID in columns (1) and (2) of Table 10 are positive but not statistically significant. Similarly, the coefficients of the interaction terms of the SPER and the DID in columns (3) and (4) are positive but also not statistically significant. In contrast, the coefficients of the interaction terms of the MIER and the DID in columns (5) and (6) are both statistically significant and positive. These findings imply that market incentive environmental regulation exhibits a substantial positive moderating effect. Cities with higher levels of market incentive environmental regulation exhibit a more pronounced enhancement in GTFP as a result of the construction of the NBDCPZ. This can be ascribed to the fact that, when compared with command and control environmental regulation and social participation environmental regulation, market incentive environmental regulation proves more effective incentives. This encourages market entities to pursue green innovation through digital transformation, subsequently increasing urban GTFP. These results provide confirmatory evidence supporting hypothesis H2c, “Big data increasing GTFP is positively moderated by MIER. The higher the level of MIER, the more evident the impact of big data on increasing GTFP is”.
This section carried out the moderating effects test from the perspective of environmental regulation. The results show that big data increasing GTFP is positively moderated by MIER. The higher the level of MIER, the more evident the impact of big data on increasing GTFP is. The next section will present the conclusions, policy recommendations and limitations.

7. Conclusions, Policy Recommendations, and Limitations

7.1. Conclusions

Taking the construction of the National Big Data Comprehensive Pilot Zone as the entry point, this study uses the balanced panel data of 276 Chinese cities from 2012 to 2019 to conduct an empirical test of big data and GTFP with a DID model. The main conclusions of this study are as follows: (1) The estimated coefficient of DID is 0.2291 and significant at the 1% level in the baseline regression, which indicates that the policy shock of the NBDCPZ has led to a 0.2291% increase in GTFP in pilot cities relative to non-pilot cities. The construction of the NBDCPZ significantly increases GTFP in the pilot area, a result that still holds after a series of robustness tests. This result provides confirmatory evidence supporting hypothesis H1. (2) The impact of urban digital transformation on GTFP varies across different city features. Through the heterogeneity analysis, we find that the better the industrial foundation, or the lower the natural resource base, or the smaller the scale of the city is, the better the impact of big data on enhancing GTFP is. This result reinforces the causal relationship between big data improving GTFP. (3) In the process of the urban digital transformation of cities, big data increased GTFP, mainly by facilitating industrial upgrading at the macro level and green innovation activities at the micro level. These results provide confirmatory evidence supporting hypotheses H1b and H1b. (4) Environmental regulation has a moderating effect on the relationship between big data and GTFP. After testing different types of environmental regulation, we find that only market incentive environmental regulation has a significant positive moderating effect. The stronger the degree of the market incentive environmental regulation is, the more pronounced the impact of big data on increasing GTFP is. These results provide confirmatory evidence supporting hypothesis H2c.

7.2. Policy Recommendations

Based on these findings, this study puts forward the following four policy recommendations: (1) Local governments must recognize the role of big data in enhancing GTFP and formulate policies to encourage big data development. Local governments should promote the construction of big data infrastructure, big data public resource trading platforms, and big data trading platforms. Local governments need to provide incentives and grants to companies and individuals who are engaged in big data research and development. The central government should establish data standards and protocols to facilitate data sharing and develop big data talent pipelines through education and training programs. (2) Local governments should formulate more scientific, reasonable, and feasible big data policies, highlight the unique characteristics and resource advantages of localities, and provide strong support and guarantee for the digital transformation of cities. At the same time, they should promote cooperation and exchanges among cities to form a pattern of healthy competition and synergistic development and promote the development of big data throughout the country and region. (3) It is necessary to leverage big data to promote industrial upgrading and foster green innovation activities. The advantages of big data should be fully utilized to guide and support enterprises to use big data for green technological innovation, as well as to promote industrial structure transformation and upgrading. The government should seize the opportunity of big data development, use the accurate analysis of big data to better understand and predict market trends, and formulate more scientific and rational industrial development strategies. Enterprises should take advantage of big data to improve their operational efficiency, bring unprecedented innovative perspectives, and explore more business opportunities. In short, it is very important to take big data as an important tool to promote industrial upgrading and green innovation and contribute to building a greener and more efficient industrial system. (4) Local governments need to strengthen the construction of the market incentive environmental regulation system, including establishing a green financial system, enhancing tax incentives, and encouraging the participation of social capital. Strengthening the integration of big data technologies with market-based environmental regulatory tools will improve the capability of governments in environmental governance and create synergies to sustainably promote green innovation and green total factor productivity.

7.3. Limitations

There are still some shortcomings in this study that need to be addressed in follow-up research. On the one hand, differences in the measurement of big data development may have led to some estimation bias in this study. Given the current lack of macro statistics on big data, this study chooses the difference-in-differences model to identify the impact of big data on GTFP. However, the selection of policy pilot projects is not a random process and is likely to be influenced by other factors, leading to some estimation bias. In future research, more attention should be paid to the statistical methods of relevant proxy variables of big data, for instance, word frequency analysis, data crawling, etc., which more intuitively reflect the development level of big data. On the other hand, there is insufficient discussion of firm-level research, especially the issue of big data decision making and innovation in enterprises. Future research should pay more attention to micro firms’ big data strategies, examine the impact of big data technology applications on firm-level GTFP, and continue to provide cases for research in this area.

Author Contributions

Conceptualization, J.X.; methodology J.X.; software J.X.; formal analysis, J.X.; investigation J.X., Z.T. and J.H.; resources, J.X. and J.H.; data curation, J.X. and J.H.; writing—original draft preparation J.X.; writing—review and editing, J.X. and J.H.; visualization, J.X. and J.H.; supervision, Z.T.; funding, Z.T. All authors have read and agreed to the published version of the manuscript.

Funding

The authors declare that financial support was received from the National Social Science Foundation of China (NSSFC) (23BJL010).

Data Availability Statement

The data used for this study were obtained from the following public networks: https://data.stats.gov.cn/ (accessed on 20 November 2023).

Conflicts of Interest

The authors declare no conflict of interest.

References

  1. Upadhyay, E. A critical evaluation of handling uncertainty in Big Data processing. Adv. Eng. Softw. 2022, 173, 103246. [Google Scholar] [CrossRef]
  2. Kloppenburg, S.; Gupta, A.; Kruk, S.R.L.; Makris, S.; Bergsvik, R.; Korenhof, P.; Solman, H.; Toonen, H.M. Scrutinizing environmental governance in a digital age: New ways of seeing, participating, and intervening. One Earth. 2022, 5, 232–241. [Google Scholar] [CrossRef]
  3. Wang, J.; Dong, K.; Dong, X.; Taghizadeh-Hesary, F. Assessing the digital economy and its carbon-mitigation effects: The case of China. Energy Econ. 2022, 113, 106198. [Google Scholar] [CrossRef]
  4. Li, G.; Jin, Y.; Gao, X. Digital transformation and pollution emission of enterprises: Evidence from China’s micro-enterprises. Energy Rep. 2023, 9, 552–567. [Google Scholar] [CrossRef]
  5. Zhang, W.; Zhao, J. Digital transformation, environmental disclosure, and environmental performance: An examination based on listed companies in heavy-pollution industries in China. Int. Rev. Econ. Financ. 2023, 87, 505–518. [Google Scholar] [CrossRef]
  6. Zhang, D.; Vigne, S.A. How does innovation efficiency contribute to green productivity? A financial constraint perspective. J. Clean. Prod. 2021, 280, 124000. [Google Scholar] [CrossRef]
  7. Hao, X.; Hao, X.; Li, Y.; Ren, S.; Wu, H.; Hao, Y. The role of digitalization on green economic growth: Does industrial structure optimization and green innovation matter? J. Environ. Manag. 2023, 325, 116504. [Google Scholar] [CrossRef]
  8. Li, H.; Peng, X.; Zhang, J.; Ballesteros-Perez, P.; Philbin, S.P.; Li, Z.; Tang, X.; Cheng, J. Enabling the green total factor productivity of the construction industry with the prospect of digital transformation. Environ. Dev. Sustain. 2023, 1–28. [Google Scholar] [CrossRef]
  9. McAfee, A.; Brynjolfsson, E.; Davenport, T.H.; Patil, D.J.; Barton, D. Big data: The management revolution. Harv. Bus. Rev. 2012, 90, 60–68. [Google Scholar]
  10. Lycett, M. ‘Datafication’: Making sense of (big) data in a complex world. Eur. J. Inf. Syst. 2013, 22, 381–386. [Google Scholar] [CrossRef]
  11. Erevelles, S.; Fukawa, N.; Swayne, L. Big Data consumer analytics and the transformation of marketing. J. Bus. Res. 2016, 69, 897–904. [Google Scholar] [CrossRef]
  12. Wamba, S.F.; Akter, S.; Edwards, A.; Chopin, G.; Gnanzou, D. How ‘big data’can make big impact: Findings from a systematic review and a longitudinal case study. Int. J. Prod. Econ. 2015, 165, 234–246. [Google Scholar] [CrossRef]
  13. Wang, X.; White, L.; Chen, X. Big data research for the knowledge economy: Past, present, and future. Ind. Manag. Data Syst. 2015, 115, 1566–1576. [Google Scholar] [CrossRef]
  14. Sadowski, J. When data is capital: Datafication, accumulation, and extraction. Big Data Soc. 2019, 6, 2053951718820549. [Google Scholar] [CrossRef]
  15. Romer, P.M. Increasing returns and long-run growth. J. Political Econ. 1986, 94, 1002–1037. [Google Scholar] [CrossRef]
  16. Shahiduzzaman, M.; Alam, K. Information technology and its changing roles to economic growth and productivity in Australia. Telecommun. Policy 2014, 38, 125–135. [Google Scholar] [CrossRef]
  17. Goldfarb, A.; Tucker, C. Digital Economics, NBER.; Working Paper, (23684); 2017; 89. Available online: https://www.nber.org/system/files/working_papers/w23684/w23684.pdf. (accessed on 20 November 2023).
  18. Jones, C.I.; Tonetti, C. Nonrivalry and the Economics of Data. Am. Econ. Rev. 2020, 110, 2819–2858. [Google Scholar] [CrossRef]
  19. Oussous, A.; Benjelloun, F.Z.; Lahcen, A.A.; Belfkih, S. Big Data technologies: A survey. J. King Saud Univ.-Comput. Inf. Sci. 2018, 30, 431–448. [Google Scholar] [CrossRef]
  20. Anagnostopoulos, I.; Zeadally, S.; Exposito, E. Handling big data: Research challenges and future directions. J. Supercomput. 2016, 72, 1494–1516. [Google Scholar] [CrossRef]
  21. Lynch, C. How do your data grow? Nature 2008, 455, 28–29. [Google Scholar] [CrossRef]
  22. Addison, T.; Heshmati, A. The New Global Determinants of FDI Flows to Developing Countries: The Importance of ICT and Democratization (No. 2003/45); WIDER Discussion Paper. Available online: https://www.econstor.eu/bitstream/10419/52914/1/36756565X.pdf (accessed on 20 November 2023).
  23. Svahn, F.; Mathiassen, L.; Lindgren, R. Embracing digital innovation in incumbent firms. MIS Q. 2017, 41, 239–254. [Google Scholar] [CrossRef]
  24. Curry, E. The big data value chain: Definitions, concepts, and theoretical approaches. In New Horizons for a Data-Driven Economy: A Roadmap for Usage and Exploitation of Big Data in Europe; Springer: Cham, Switzerland, 2016; pp. 29–37. [Google Scholar] [CrossRef]
  25. Niebel, T.; Rasel, F.; Viete, S. BIG data–BIG gains? Understanding the link between big data analytics and innovation. Econ. Innov. New Technol. 2019, 28, 296–316. [Google Scholar] [CrossRef]
  26. Thelen, K. Transitions to the knowledge economy in Germany, Sweden, and the Netherlands. Comp. Politics 2019, 51, 295–315. [Google Scholar] [CrossRef]
  27. Borkar, V.R.; Carey, M.J.; Li, C. Big data platforms: What’s next? XRDS Crossroads ACM Mag. Stud. 2012, 19, 44–49. [Google Scholar] [CrossRef]
  28. Mayer-Schönberger, V. Big Data–Eine Revolution, die unser Leben verändern wird. Bundesgesundheitsblatt-Gesundheitsforschung-Gesundheitsschutz 2015, 8, 788–793. [Google Scholar] [CrossRef] [PubMed]
  29. Kaginalkar, A.; Kumar, S.; Gargava, P.; Kharkar, N.; Niyogi, D. SmartAirQ: A big data governance framework for urban air quality management in smart cities. Front. Environ. Sci. 2022, 10, 785129. [Google Scholar] [CrossRef]
  30. Bibri, S.E. Data-driven smart eco-cities and sustainable integrated districts: A best-evidence synthesis approach to an extensive literature review. Eur. J. Futures Res. 2021, 9, 16. [Google Scholar] [CrossRef]
  31. Del Río Castro, G.; González Fernández, M.C.; Uruburu Colsa, Á. Unleashing the convergence amid digitalization and sustainability towards pursuing the Sustainable Development Goals (SDGs): A holistic review. J. Clean. Prod. 2021, 280, 122204. [Google Scholar] [CrossRef]
  32. Huber, J. Towards industrial ecology: Sustainable development as a concept of ecological modernization. J. Environ. Policy Plan. 2000, 2, 269–285. [Google Scholar] [CrossRef]
  33. Manyika, J.; Chui, M.; Brown, B.; Bughin, J.; Dobbs, R.; Roxburgh, C.; Hung Byers, A. Big Data: The Next Frontier for Innovation, Competition, and Productivity; McKinsey Global Institute Ltd.: Chicago, IL, USA, 2014; pp. 1–156. Available online: http://dln.jaipuria.ac.in:8080/jspui/bitstream/123456789/14265/1/mgi_big_data_full_report.pdf (accessed on 20 November 2023).
  34. Kitchin, R. The Data Revolution: Big Data, Open Data, Data Infrastructures and Their Consequences; SAGE Publications Ltd.: London, UK, 2014; pp. 1–240. [Google Scholar]
  35. Gale, F.; Ascui, F.; Lovell, H. Sensing reality? New monitoring technologies for global sustainability standards. Glob. Environ. Politics 2017, 17, 65–83. [Google Scholar] [CrossRef]
  36. Fang, S.; Da Xu, L.; Zhu, Y.; Ahati, J.; Pei, H.; Yan, J.; Liu, Z. An integrated system for regional environmental monitoring and management based on internet of things. IEEE Trans. Ind. Inform. 2014, 10, 1596–1605. [Google Scholar] [CrossRef]
  37. Wu, M.; Yan, B.; Huang, Y.; Sarker, M.N.I. Big data-driven urban management: Potential for urban sustainability. Land 2022, 11, 680. [Google Scholar] [CrossRef]
  38. Wang, Z.; Yin, Z.; Caers, J.; Zuo, R. A Monte Carlo-based framework for risk-return analysis in mineral prospectivity maping. Geosci. Front. 2020, 11, 2297–2308. [Google Scholar] [CrossRef]
  39. Cui, S.; Zhou, K.; Ding, R.; Wang, J.; Cheng, Y.; Jiang, G. Monitoring the soil copper pollution degree based on the reflectance spectrum of an arid desert plant. Spectrochim. Acta Part A Mol. Biomol. Spectrosc. 2021, 263, 120186. [Google Scholar] [CrossRef] [PubMed]
  40. Song, M.; Fisher, R.; Kwoh, Y. Technological challenges of green innovation and sustainable resource management with large scale data. Technol. Forecast. Soc. Chang. 2019, 144, 361–368. [Google Scholar] [CrossRef]
  41. Can, U.; Alatas, B. Big social network data and sustainable economic development. Sustainability 2017, 9, 2027. [Google Scholar] [CrossRef]
  42. Khan SA, R.; Yu, Z.; Umar, M. A road map for environmental sustainability and green economic development: An empirical study. Environ. Sci. Pollut. Res. 2022, 29, 16082–16090. [Google Scholar] [CrossRef]
  43. Li, J.; Chen, L.; Chen, Y.; He, J. Digital economy, technological innovation, and green economic efficiency—Empirical evidence from 277 cities in China. Manag. Decis. Econ. 2022, 43, 616–629. [Google Scholar] [CrossRef]
  44. Deng, Y.; You, D.; Wang, J. Optimal strategy for enterprises’ green technology innovation from the perspective of political competition. J. Clean. Prod. 2019, 235, 930–942. [Google Scholar] [CrossRef]
  45. Chen, X.; Wang, X.; Zhou, M. Firms’ green R&D cooperation behaviour in a supply chain: Technological spillover, power and coordination. Int. J. Prod. Econ. 2019, 218, 118–134. [Google Scholar] [CrossRef]
  46. Du, K.; Li, J. Towards a green world: How do green technology innovations affect total-factor carbon productivity. Energy Policy 2019, 131, 240–250. [Google Scholar] [CrossRef]
  47. Albort-Morant, G.; Leal-Millán, A.; Cepeda-Carrión, G. The antecedents of green innovation performance: A model of learning and capabilities. J. Bus. Res. 2016, 69, 4912–4917. [Google Scholar] [CrossRef]
  48. Meng, F.; Zhao, Y. How does digital economy affect green total factor productivity at the industry level in China: From a perspective of global value chain. Environ. Sci. Pollut. Res. 2022, 29, 79497–79515. [Google Scholar] [CrossRef] [PubMed]
  49. Cao, X.; Deng, M.; Li, H. How does e-commerce city pilot improve green total factor productivity? Evidence from 230 cities in China. J. Environ. Manag. 2021, 289, 112520. [Google Scholar] [CrossRef] [PubMed]
  50. Wang, Q.; Hu, A.; Tian, Z. Digital transformation and electricity consumption: Evidence from the Broadband China pilot policy. Energy Econ. 2022, 115, 106346. [Google Scholar] [CrossRef]
  51. Zhang, Y. The development strategy and main tasks of the digital economy driving the industrial structure to the middle and high end. Econ. Rev. J. 2018, 9, 85–91. [Google Scholar] [CrossRef]
  52. Guo, Q.; Ma, X. How Does the Digital Economy Affect Sustainable Urban Development? Empirical Evidence from Chinese Cities. Sustainability 2023, 15, 4098. [Google Scholar] [CrossRef]
  53. Liu, Y.; Yang, Y.; Li, H.; Zhong, K. Digital economy development, industrial structure upgrading and green total factor productivity: Empirical evidence from China’s cities. Int. J. Environ. Res. Public Health 2022, 19, 2414. [Google Scholar] [CrossRef]
  54. Fan, M.; Yang, P.; Li, Q. Impact of environmental regulation on green total factor productivity: A new perspective of green technological innovation. Environ. Sci. Pollut. Res. 2022, 29, 53785–53800. [Google Scholar] [CrossRef]
  55. Zou, H.; Zhang, Y. Does environmental regulatory system drive the green development of China’s pollution-intensive industries? J. Clean. Prod. 2022, 330, 129832. [Google Scholar] [CrossRef]
  56. Dong, Y.; Ishikawa, M.; Liu, X.; Hamori, S. The determinants of citizen complaints on environmental pollution: An empirical study from China. J. Clean. Prod. 2011, 19, 1306–1314. [Google Scholar] [CrossRef]
  57. Li, H.L.; Zhu, X.H.; Chen, J.Y.; Jiang, F.T. Environmental regulations, environmental governance efficiency and the green transformation of China’s iron and steel enterprises. Ecol. Econ. 2019, 165, 106397. [Google Scholar] [CrossRef]
  58. Chung, Y.H.; Färe, R.; Grosskopf, S. Productivity and undesirable outputs: A directional distance function approach. J. Environ. Manag. 1997, 51, 229–240. [Google Scholar] [CrossRef]
  59. Färe, R.; Grosskopf, S.; Norris, M.; Zhang, Z. Productivity growth, technical progress, and efficiency change in industrialized countries. Am. Econ. Rev. 1994, 84, 66–83. Available online: http://www.jstor.org/stable/2117971 (accessed on 20 November 2023).
  60. Jacobson, L.S.; LaLonde, R.J.; Sullivan, D.G. Earnings losses of displaced workers. Am. Econ. Rev. 1993, 83, 685–709. Available online: https://www.jstor.org/stable/2117574 (accessed on 20 November 2023).
  61. Barone, G.; D’Acunto, F.; Narciso, G. Telecracy: Testing for channels of persuasion. Am. Econ. J. Econ. Policy 2015, 7, 30–60. [Google Scholar] [CrossRef]
  62. Tian, G.; Zhang, X. Digital economy, non-agricultural employment and social division of labor. Manag. World 2022, 38, 72–84. [Google Scholar] [CrossRef]
  63. Goodman-Bacon, A. Difference-in-differences with variation in treatment timing. J. Econom. 2021, 225, 254–277. [Google Scholar] [CrossRef]
  64. Callaway, B.; Sant’Anna, P.H. Difference in differences with multiple time periods. J. Econom. 2021, 225, 200–230. [Google Scholar] [CrossRef]
  65. Zhao, X.; Guo, Y.; Liu, Z.; Xiu, A. Boosting green recovery: The impact of green fiscal policy on green total factor productivity. Econ. Chang. Restruct. 2023, 56, 2601–2619. [Google Scholar] [CrossRef]
  66. Han, F.; Mao, X. Impact of intelligent transformation on the green innovation quality of Chinese enterprises: Evidence from corporate green patent citation data. Appl. Econ. 2023, 1–18. [Google Scholar] [CrossRef]
Figure 1. The research framework of this study.
Systems 12 00004 g001
Figure 2. The research hypotheses of this study.
Systems 12 00004 g002
Figure 3. The pilot cities of the National Big Data Comprehensive Pilot Zone.
Systems 12 00004 g003
Figure 4. GTFP comparison between treatment and control group.
Systems 12 00004 g004
Figure 5. The dynamic effect regression results.
Systems 12 00004 g005
Figure 6. Individual placebo test (left) and time placebo test (right).
Systems 12 00004 g006
Figure 7. The results of Bacon weight decomposition.
Systems 12 00004 g007
Table 1. The variable definitions and descriptions of this study.
Variable NameVariable SymbolVariable Description
Dependent variable GTFPGTFPMeasuring the Malmquist Index using the DEA methodology
Explanatory variableNational Big Data Comprehensive Pilot ZoneDIDDID = treat × post
Control variableThe Level of Economic DevelopmentGDPRMeasured by GDP per capita indicators
The level of Market ActivityMIMeasured by the ratio of employment in non-public enterprises to total employment
The level of Fiscal AutonomyFAMeasured by the ratio of local fiscal revenues to local fiscal expenditures
The Level of Financial DevelopmentFINMeasured by year-end financial institution deposit balances
The Level of Openness to the Outside WorldFORMeasured by the amount of foreign investment
The Level of Comprehensive Utilization of Resources RECMeasured by comprehensive utilization rate of industrial solid waste
Moderating variableCommand and Control Environmental RegulationCCERMeasured by frequency of words related to the theme of environmental protection in the work reports of local governments
Social Participation Environmental RegulationSPERMeasured by the number of environment-related NPC and CPPCC recommendations hosted by each province where the city is located
Market Incentive Environmental RegulationMIERMeasured by the ratio of investment in environmental pollution control to GDP
Table 2. The results of baseline regression.
(1)(2)
DID0.2291 **0.2074 **
(0.1113)(0.1011)
GDPR 0.7882 **
(0.3851)
MI 0.1428 **
(0.0640)
FA −1.0153 ***
(0.2117)
FIN −0.9326 ***
(0.3420)
FOR −0.0948 ***
(0.0253)
REC 0.0427
(0.1003)
Constant98.5601 ***104.5790 ***
(0.0521)(7.2138)
Year FEYESYES
City FEYESYES
R20.46980.5159
N22082208
***, **, and * represent significance at the 1%, 5%, and 10% levels, respectively.
Table 3. The results of PSM-DID estimation.
(1)(2)(3)(4)
Radius MatchingRadius MatchingNeighbor MatchingNeighbor Matching
DID0.2804 **0.2419 **0.2976 ***0.2780 ***
(0.1144)(0.1040)(0.1143)(0.1051)
Constant98.5413 ***103.2697 ***98.5864 ***103.9152 ***
(0.0532)(6.9756)(0.0581)(6.9041)
ControlNOYESNOYES
Year FEYESYESYESYES
City FEYESYESYESYES
R20.46930.51470.50310.5433
N2052205216951695
***, **, and * represent significance at the 1%, 5%, and 10% levels, respectively.
Table 4. The results of instrumental variable estimation.
First StageSecond Stage
DID 0.1834 **
(0.0770)
IV0.1788 ***
(0.0021)
Control YESYES
Year FEYESYES
City FEYESYES
KP rk LM524.10 ***
CD Wald F3146.491
KP rk Wald F6910.26
R2 0.7234
N22082208
***, **, and * represent significance at the 1%, 5%, and 10% levels, respectively.
Table 5. The results of estimated average treatment effects (ATT).
GTFP
DID0.2545 **
(0.1028)
ControlNO
Fixed EffectsYES
N2208
***, **, and * represent significance at the 1%, 5%, and 10% levels, respectively.
Table 6. The results of other robustness tests.
(1)(2)(3)(4)(5)(6)
DID0.2086 **0.3157 ***0.2065 **0.2366 **0.2029 **0.2307 **
(0.1000)(0.1201)(0.1015)(0.1071)(0.1008)(0.1020)
Constant104.2799 ***131.3460 ***104.6919 ***104.2183 ***104.6122 ***104.8206
(7.0295)(10.8313)(7.2607)(8.0800)(7.2088)(7.3138)
Control YESYESYESYESYESYES
Year FEYESYESYESYESYESYES
City FEYESYESYESYESYESYES
Regiom FENONONONONOYES
R20.53090.46230.51590.51960.51580.5233
N220822082208196822082208
***, **, and * represent significance at the 1%, 5%, and 10% levels, respectively.
Table 7. The heterogeneity analysis of this study.
Industrial FoundationResource FoundationUrban Scale
(1)(2)(3)(4)(5)(6)
Traditional Industrial CitiesOther CitiesResource-Based CitiesOther CitiesLarge CitiesSmall Cities
DID0.2756 *0.18150.25050.2168 *0.16470.3222 **
(0.1579)(0.1553)(0.2455)(0.1259)(0.1401)(0.1558)
Constant98.5717 ***98.5515 ***97.9533 ***98.7783 ***99.2032 ***98.2003 ***
(0.0728)(0.0732)(0.1124)(0.0584)(0.0660)(0.0726)
Control NONONONONONO
Year FEYESYESYESYESYESYES
City FEYESYESYESYESYESYES
R20.55920.41370.46940.47200.49150.4720
N936127258416247921416
***, **, and * represent significance at the 1%, 5%, and 10% levels, respectively.
Table 8. The results of mediating effects of industrial structure.
TheilAis
(1)(2)(3)(4)
DID0.1293 **0.1231 **−0.0018−0.0007
(0.0592)(0.0619)(0.0021)(0.0019)
Constant−1.6936 ***−1.73571.8515 ***1.4012 ***
(0.0276)(4.6397)(0.0006)(0.1677)
Control NOYESNOYES
Year FEYESYESYESYES
City FEYESYESYESYES
R20.02380.02950.71890.7794
N2208220822081968
***, **, and * represent significance at the 1%, 5%, and 10% levels, respectively.
Table 9. The results of mediating effects of green innovation.
Green Invention PatentsGreen Utility Model Patents
(1)(2)(3)(4)
DID0.02230.04100.1014 *0.1391 ***
(0.0573)(0.0561)(0.0522)(0.0521)
Constant3.6160 ***−10.4940 **3.8188 ***−9.8538 ***
(0.0294)(4.5759)(0.0249)(3.5739)
Control NOYESNOYES
Time FEYESYESYESYES
City FEYESYESYESYES
R20.69290.70090.80090.8046
N2208220822081968
***, **, and * represent significance at the 1%, 5%, and 10% levels, respectively.
Table 10. The results of moderating effects.
CCERSPERMIER
(1)(2)(3)(4)(5)(6)
DID0.20600.20220.60420.4877−0.1003−0.0075
(0.2321)(0.2083)(0.9552)(1.0109)(0.1424)(0.1355)
DID*ER20120.00170.0011−0.0530−0.039117.9563 ***12.1950 **
(0.0041)(0.0041)(0.1506)(0.1600)(5.2867)(4.7490)
Constant 96.2790 ***99.8028 ***98.5934 ***100.6331 ***98.5601 ***102.6734 ***
(0.4518)(6.8062)(0.0537)(6.8186)(0.0519)(7.0978)
Control NOYESNOYESNOYES
Time FEYESYESYESYESYESYES
City FEYESYESYESYESYESYES
R20.47550.52130.46520.51680.47600.5186
N210421042056205622082208
***, **, and * represent significance at the 1%, 5%, and 10% levels, respectively.
Disclaimer/Publisher’s Note: The statements, opinions and data contained in all publications are solely those of the individual author(s) and contributor(s) and not of MDPI and/or the editor(s). MDPI and/or the editor(s) disclaim responsibility for any injury to people or property resulting from any ideas, methods, instructions or products referred to in the content.

