1. Introduction
In manufacturing and production lines, improving the quality control of products is an essential task prior to delivering them to consumers. Several factories and production companies strive to eliminate all defects from their products, aiming to bring the success of products to the market. To achieve zero defect manufacturing strategies [
1,
2,
3,
4], many factories employ various techniques and processes to detect and prevent any defects that may appear in the final products [
5,
6,
7,
8].
With the current trend of outstanding electronic development, rechargeable batteries has become indispensable parts in electronic devices such as laptops, phones, and electric vehicles. In these devices, the rechargeable battery is the most important part that affects the speed, price, and performance of the device. Furthermore, the rechargeable battery also affects the safety and potential risk of using the devices. In order to create quality rechargeable battery products and minimize risks such as potential explosions, the quality of each part of the rechargeable battery must be ensured during the production process. Among these components are fastening parts used in battery assembly. These parts are shaped through the physical process of forging metals or alloys at high pressure and temperature. During the forging process, defects such as cracks or scratches on the surface cannot be avoided. So, in order to prevent these defects from affecting the final product, researchers have studied different approaches to identify defects in the parts of the battery [
9,
10,
11] or to improve battery manufacturing processing [
12].
For several years, using workers to detect defects on battery surfaces has been a widely adopted practice in manufacturing. This approach laboriously relies on the expertise and visual acuity of workers to identify any abnormalities or defects that appear in the products. This method requires skilled workers who have undergone thorough training to identify and categorize various types of defects accurately. Additionally, workers may employ their finger to identify surface defects that may not be clear. It is inevitable that these methods are subjective in person and can require significant time to implement. With the fast development of current deep learning algorithms, more and more methods [
13,
14] have been proposed, introduced, and applied to automatically identify defects on the surface of products in manufacturing during the production process. Some recent methods are as follows: using a probabilistic defect model [
15], using contextual features and multi-view ensemble learning [
16], using computed tomography [
17], using ultrasound acoustic measurements [
18], and using deep learning approaches [
19,
20,
21,
22,
23].
This paper aims to assess and compare the effectiveness of different deep learning-based methods for the automated classification of surface defects on microfasteners utilized in rechargeable batteries. Furthermore, we propose an architecture that integrates SQC to improve the efficiency and accuracy of product quality continually. By integrating deep learning-based methods, we aim to achieve a sufficient solution to enhance the quality control process in battery component manufacturing. Building on these goals, we applied and evaluated the results of different deep learning-based direct and indirect methods in automatically classifying surface defects on microfasteners used in rechargeable batteries during production. In the next section, we discuss recent research related to the application of deep learning and neural networks in defect detection in manufacturing and its applications.
Section 3 presents the relevant basic knowledge mentioned in this paper.
Section 4 details the dataset, proposed methods, and architecture and analyzes the effectiveness of each method.
Section 5 presents the experimental results.
Section 6 discusses the obtained results and directions for future research.
2. Related Works
In this section, we discuss some recent research on effects of defects and defect detection in manufacturing, especially related to the rechargeable battery manufacturing sector. By examining the results acquired from related studies, we can accumulate effective defect detection methods and hence give the appropriate methods to detect and predict defects in this study.
In ref. [
24], Cannarella et al. investigated the effects of defects in the form of localized plating in lithium-ion batteries. They developed a model of the defect containing coin cell geometry to gain further insights into this the effects of these defects. The simulations demonstrated that the closed pores acted as “electrochemical concentrators”, resulting in elevated currents and overpotentials in the adjacent electrodes in lithium-ion batteries. The research also analyzed the impact of other factors, such as materials, geometry, and operating parameters, on the localized plating behavior in batteries. The study established a link between electrochemical degradation/failure and internal mechanical stress in lithium-ion batteries. Defects like separator pore closure, which can be induced or exacerbated by mechanical stress, generate localized regions of heightened electrochemical activity that lead to lithium plating. The findings in this study indicated that it is important to detect defects that occur in battery manufacturing, and defects greatly affect battery performance, as well as being a high risk of fire and explosion.
In ref. [
17], Yi Wu et al. introduced a computed tomography (CT)-based non-destructive approach to evaluate the quality, identify defects, and assess structural deformation in batteries. The main ideas of the approach were that they used a CT system to scan the battery and then visualized the information in the 3D structure. After that, the 3D structure provided insight into its internal structure as well as material composition. The deformed structural and defects could be detected by directly observing the CT images from different angles. In this study, the authors proposed a useful method using the CT system to scan and visualize the structure of the battery. However, detecting defects on the surface or inside the product was still performed by direct observation.
In ref. [
9], Changlu xu et al. presented an approach using multi-feature fusion and particle swarm optimization for a support vector machine model to detect defects in lithium batteries. The author explained that their approach reached an accuracy of 98.3% on a dataset containing 840 images of the battery surface. The methodology of their approach was that first, they preprocessed the defect image with image subtraction and contrast adjustment. After that, the Canny algorithm with the AND logical operation was used to extract the defect area on the image. Consequently, the features of the defect area were extracted using texture, edge, and HOG features. Finally, the particle swarm optimization method was used to optimize the support vector machine model to train and detect the defect on the image.
In ref. [
10], Choudhary et al. introduced an autonomous visual detection method for detecting defects from battery electrode manufacturing. In particular, the YOLOv5 architecture was proposed in their approach for identifying the visual defects on the coated electrode from the battery. In the experiment, they captured 882 images of battery electrodes containing four types of defects in some images (agglomerate, bubble, foil, and scratch) and used these images for training and prediction to evaluate the model. The study showed that the model achieved 9.5 ms inference time and 88% mAP for predicting all combined classes. Their study presented evidence of effectively using the YOLO architecture to predict defects in battery manufacturing and efficient use in the web environment.
In ref. [
25], Badmos et al. proposed a method using convolutional neural networks (CNNs) for detecting defects in lithium-ion battery electrodes. In the study, the authors attempted to achieve the best parameters for creating precise models to predict battery defects. They compared obtained inference results with different CNN models, i.e., Baseline, Sigmoid, SoftMax, VGG19, InceptionV3, and Xception. A dataset containing 3286 original images of battery electrodes was used to train and infer the four types of defects in the battery. Through experimental results, the VGG19 model performed best (with an F1 score of 0.99), followed by the InceptionV3 (with an F1 score of 0.97). Using the VGG19 architecture could be an effective solution for creating an accurate model to detect defects in images of lithium-ion battery electrodes.
The uniqueness of our method is that we proposed an architecture that integrated deep learning-based defect detection methods with the SQC method for enhancing quality control in battery component manufacturing. By leveraging the power of these methodologies, we aimed to overcome the shortcomings of manual evaluation and provide a more efficient and precise solution. Furthermore, we conducted an in-depth analysis using a real dataset of 1150 microfastener surface images from a factory in Korea and compared the results of the direct and indirect prediction methodologies. The results indicated that the indirect prediction approach outperformed the direct method with the best accuracy of 0.91. The next section presents the related knowledge and background used in our approach for creating an efficient framework and precise inference models to detect and classify scratches on the surface of microfasteners used in battery manufacturing.
3. Background Theory and Concepts
This section summarizes the concept of the EfficientDet, YOLO models, and statis-tical process control method used in our study for classifying defects from the surface of the batteries and enhancing quality control in lithium-ion battery manufacturing.
3.1. EfficientDet
In the past five years, many research groups have introduced different neural network models to improve image classification and object detection results. One recent high-accuracy and efficient model is the EfficientDet [
26], introduced by Mixing Tan and his colleagues in 2020. The model uses ImageNet pre-trained EfficientNets [
27] as the backbone network for detecting and classifying objects in the images.
In ref. [
27], the authors introduced the EfficientNet to scale all dimensions of a neural network, i.e., the depth, width, and resolution, by using an effective compound coefficient.
Depth (d): Scaling network by depth. The idea of scaling depth is that by using the deeper ConvNet, we can receive more features from the object.
Width (w): Scaling network by width. Scaling networks by widths are commonly used for a small-size network. The wider networks can capture more detailed features, and it is easier to train these networks.
Resolution (r): Scaling network with different resolutions of input images. This method allows ConvNets to capture more detailed patterns from the images.
The main idea for building EfficientNet was derived from the following observations by the authors:
Using different scaling dimensions is not independent of creating an efficient network.
To achieve accuracy and efficient networks, continuously balancing the depth, width, and resolution of the network is crucial.
With this approach, the authors created the baseline model EfficientNet-B0 and applied the compound scaling method with the below equation to obtain EfficientNet-B1 to B7.
where α, β, and γ are constants. ϕ is a user-specified coefficient.
In EfficientDet, the authors adapted the EfficientNet as the backbone network and proposed the BiFPN, a weighted bi-directional feature pyramid network that serves as the feature network to learn the cruciality of different input features. They repeatedly applied this method by using top-down and bottom-up multi-scale feature fusion. The idea behind the BiFPN is that nodes with only one input edge without feature fusion have reduced contributions to the network. If the nodes are at the same level, they add an extra edge from the original input to the output node. Furthermore, the model treats each bidirectional path as a feature layer. Recently, EfficientDet has become one of the state-of-the-art neural networks in detecting features of objects from images, and it is highly capable of detecting defects from the surface of batteries.
3.2. YOLO [28]
Introduced in 2015 by Redmon and his colleagues, YOLO (You only look once) [
28] is a state-of-the-art model that outperforms several methods in obtaining high prediction accuracy while keeping a fast processing time. Due to its fast inference processing, it is highly suitable for implementation in real-time object prediction projects. Unlike other object detection algorithms, YOLO directly predicts the bounding boxes and classes of objects by dividing the input image into a grid of cells. The authors framed object detection as a regression problem to separate bounding boxes and the associated class probabilities. Using this strategy, YOLO’s inference time is extremely fast. The first model processed images in real time at 45 FPS. Furthermore, a smaller version processed 155 FPS while keeping a reasonable mAP. The principle and strategy of YOLO are as follows. The algorithm performs detecting objects as a regression problem and divides the input image into an S × S grid and predicts B bounding boxes for each grid cell. Thanks to its excellent strategy, YOLO has been upgraded through many versions since its first introduction.
Table 1 illustrates the evolution history of YOLO over the years from 2015 to 2023. As shown in
Table 1, Joseph Redmon et al. are the authors who introduced the YOLO algorithm and developed versions 1, 2, and 3 from the years 2015 to 2018. After that, YOLO received the research community’s attention and was developed with many upgraded versions to optimize prediction accuracy and improve inference speed.
3.3. Statistical Quality Control (SQC) and Control Charts [29]
In this subsection, we summarize the statistical quality control [
29] concepts and some control charts used in our study to support quality control in manufacturing products.
According to [
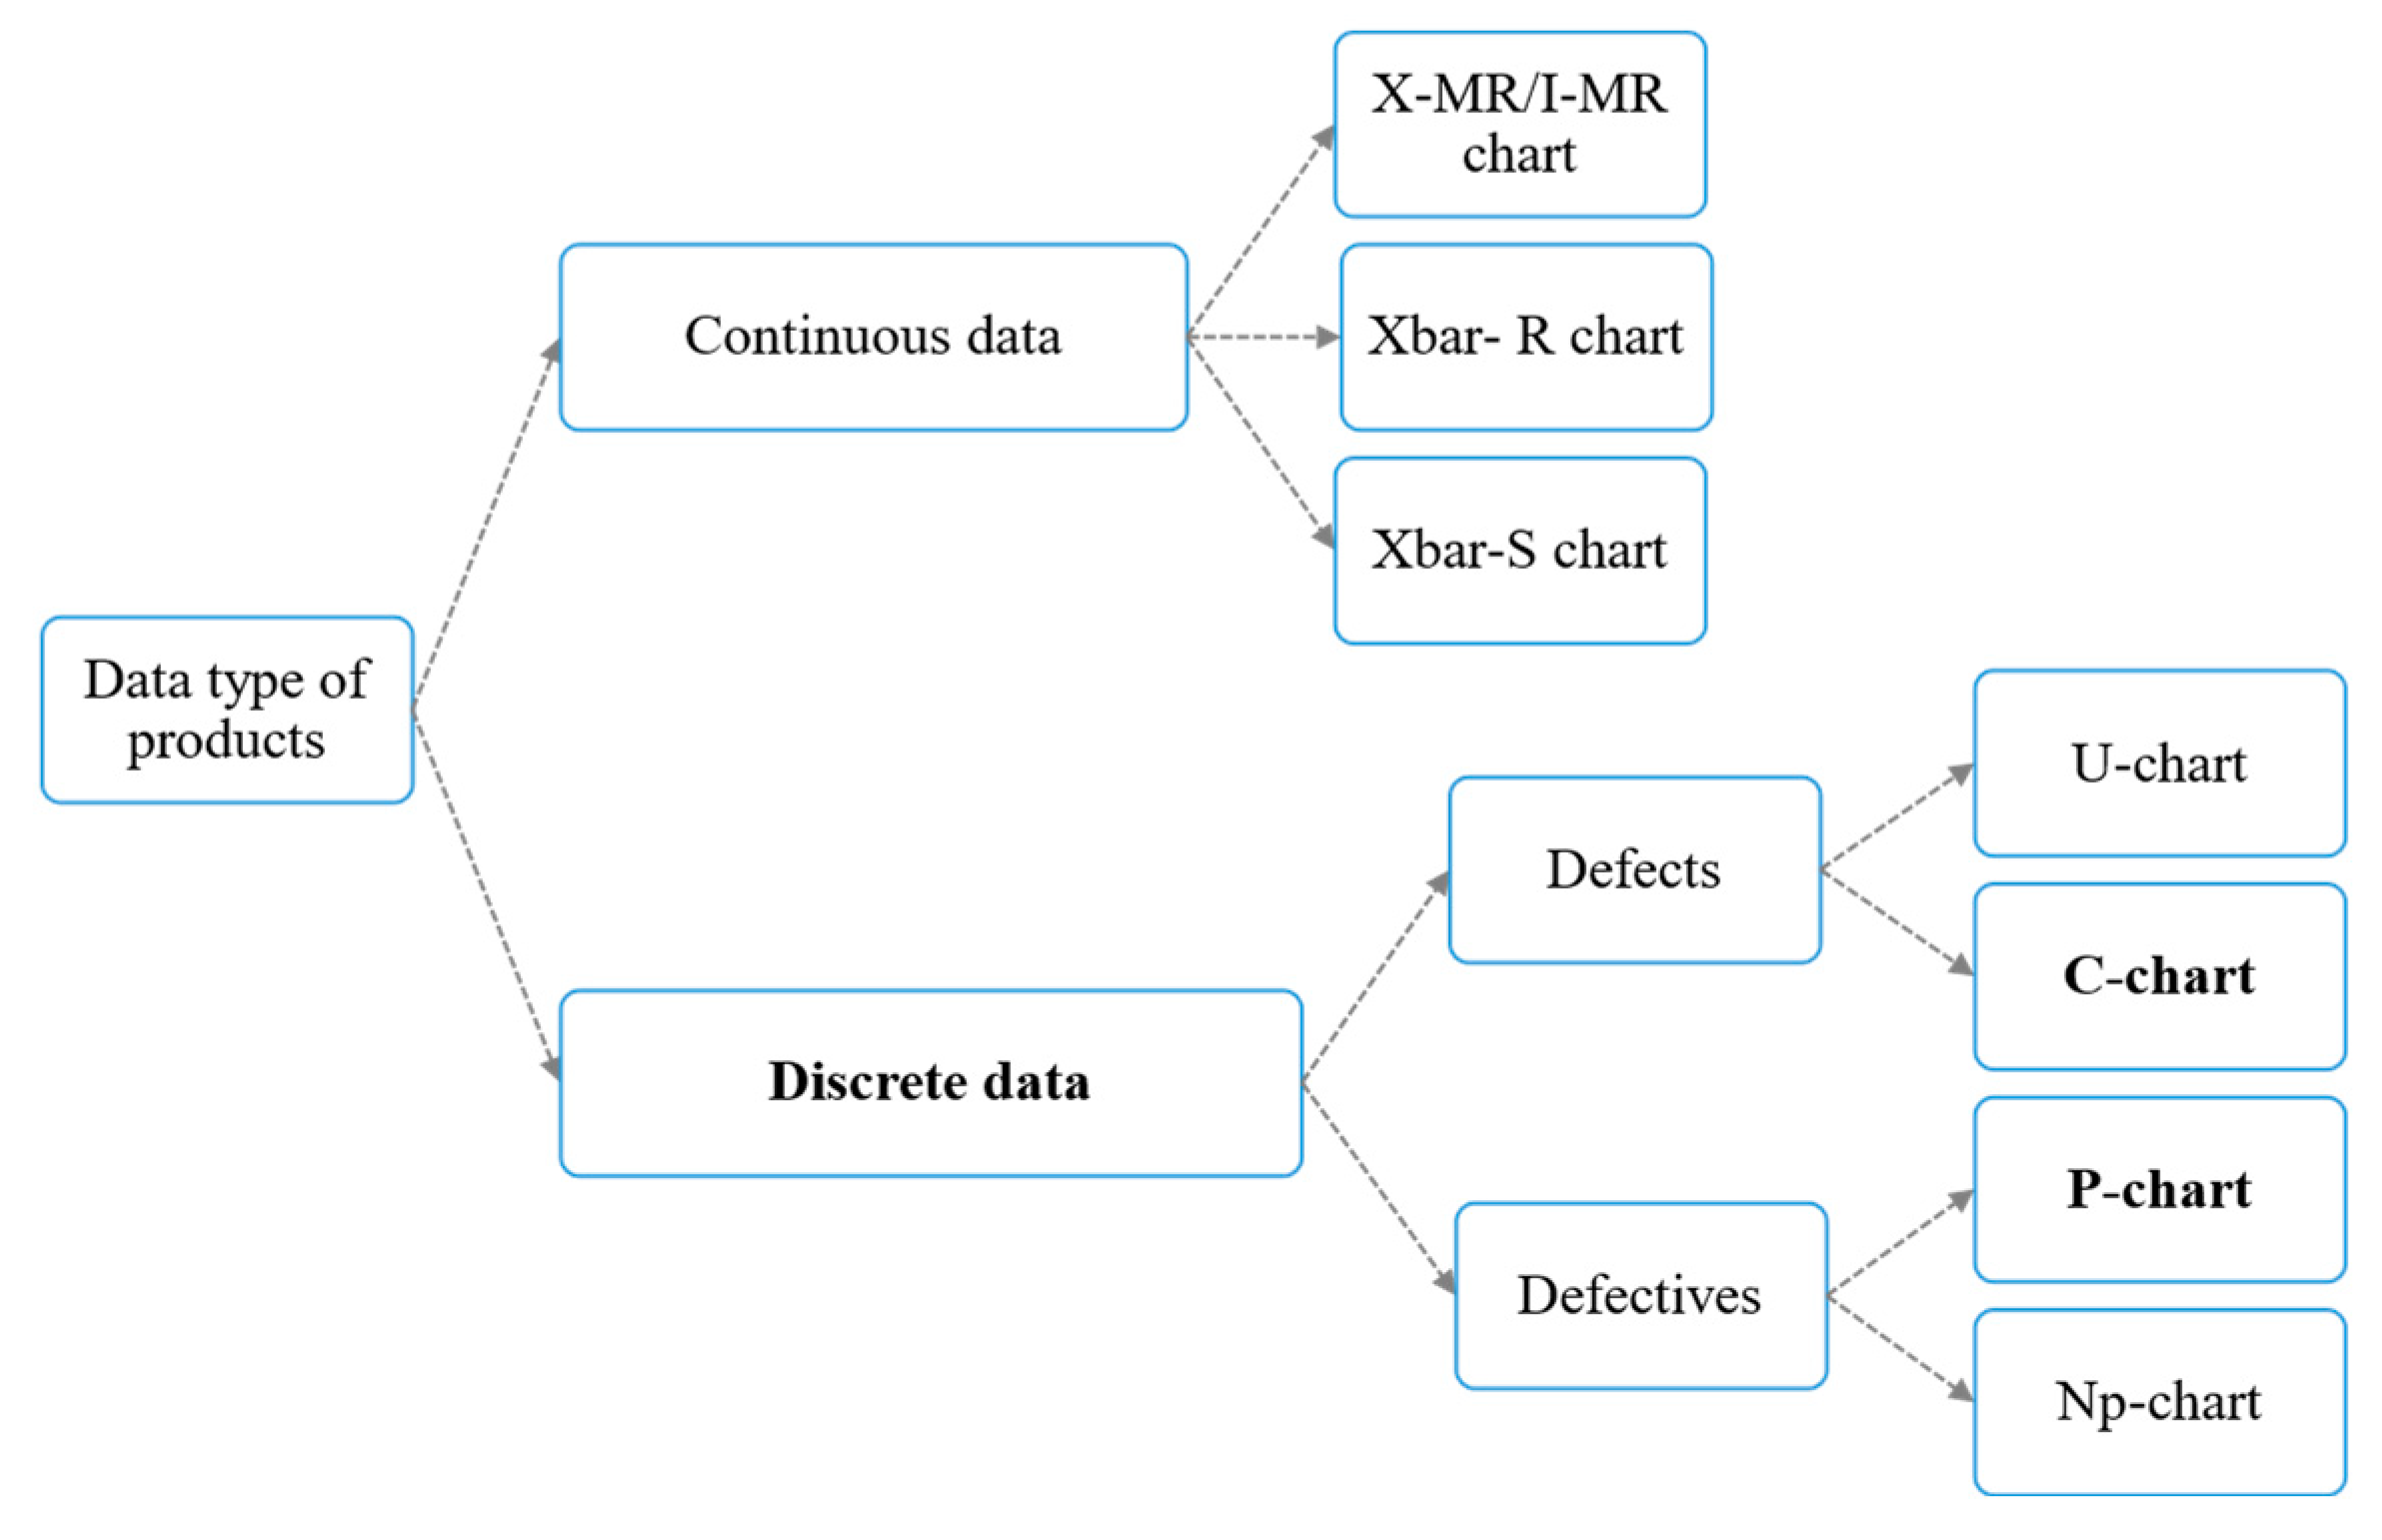
29], statistical quality control (SQC) is the process of using statistical data from the processing of producing products to evaluate and control the quality of products in a production line. SQC focuses on practical statistical methods in quality control and improvement. Not only analyzing the continuous data for exploring the quality of products, SQC also examines the discrete data to investigate the defects or nonconformities in products. In a nutshell, using the SQC method is suitable for enhancing quality control in microfastener manufacturing. In this study, we propose a method combining deep learning approaches with control charts in SQC to detect defects and improve the quality of products. As shown in
Figure 1, there are some different statistical models in the SQC for controlling the quality of products. Based on the characteristics, we selected the C-chart and P-chart for analyzing the defects occurring on the microfastener used in rechargeable batteries and hence improving product quality management.
C-Chart: The C-chart or the control chart for nonconformities is a specific type of control chart in SQC to monitor and evaluate the count value of particular data and usually the number of defects per product in manufacturing.
where
D: Total number of defects
n: Total number of samples
UCL: Upper control limit
LCL: Lower control limit.
If LCL < 0, set LCL = 0.
P-Chart: The P-chart or the control chart for fraction nonconforming is a different type of control chart in SQC to monitor the proportion of defective units in a sample. The proportion of defects in a product is defined as the value between the number of defects and the sample sizes. In the P-chart, the center line and control limits are as follows:
where
D: Total number of defects
n: Total number of samples
UCL: Upper control limit
LCL: Lower control limit.
If LCL < 0, set LCL = 0.
4. Dataset and Proposed Method
4.1. Dataset Description
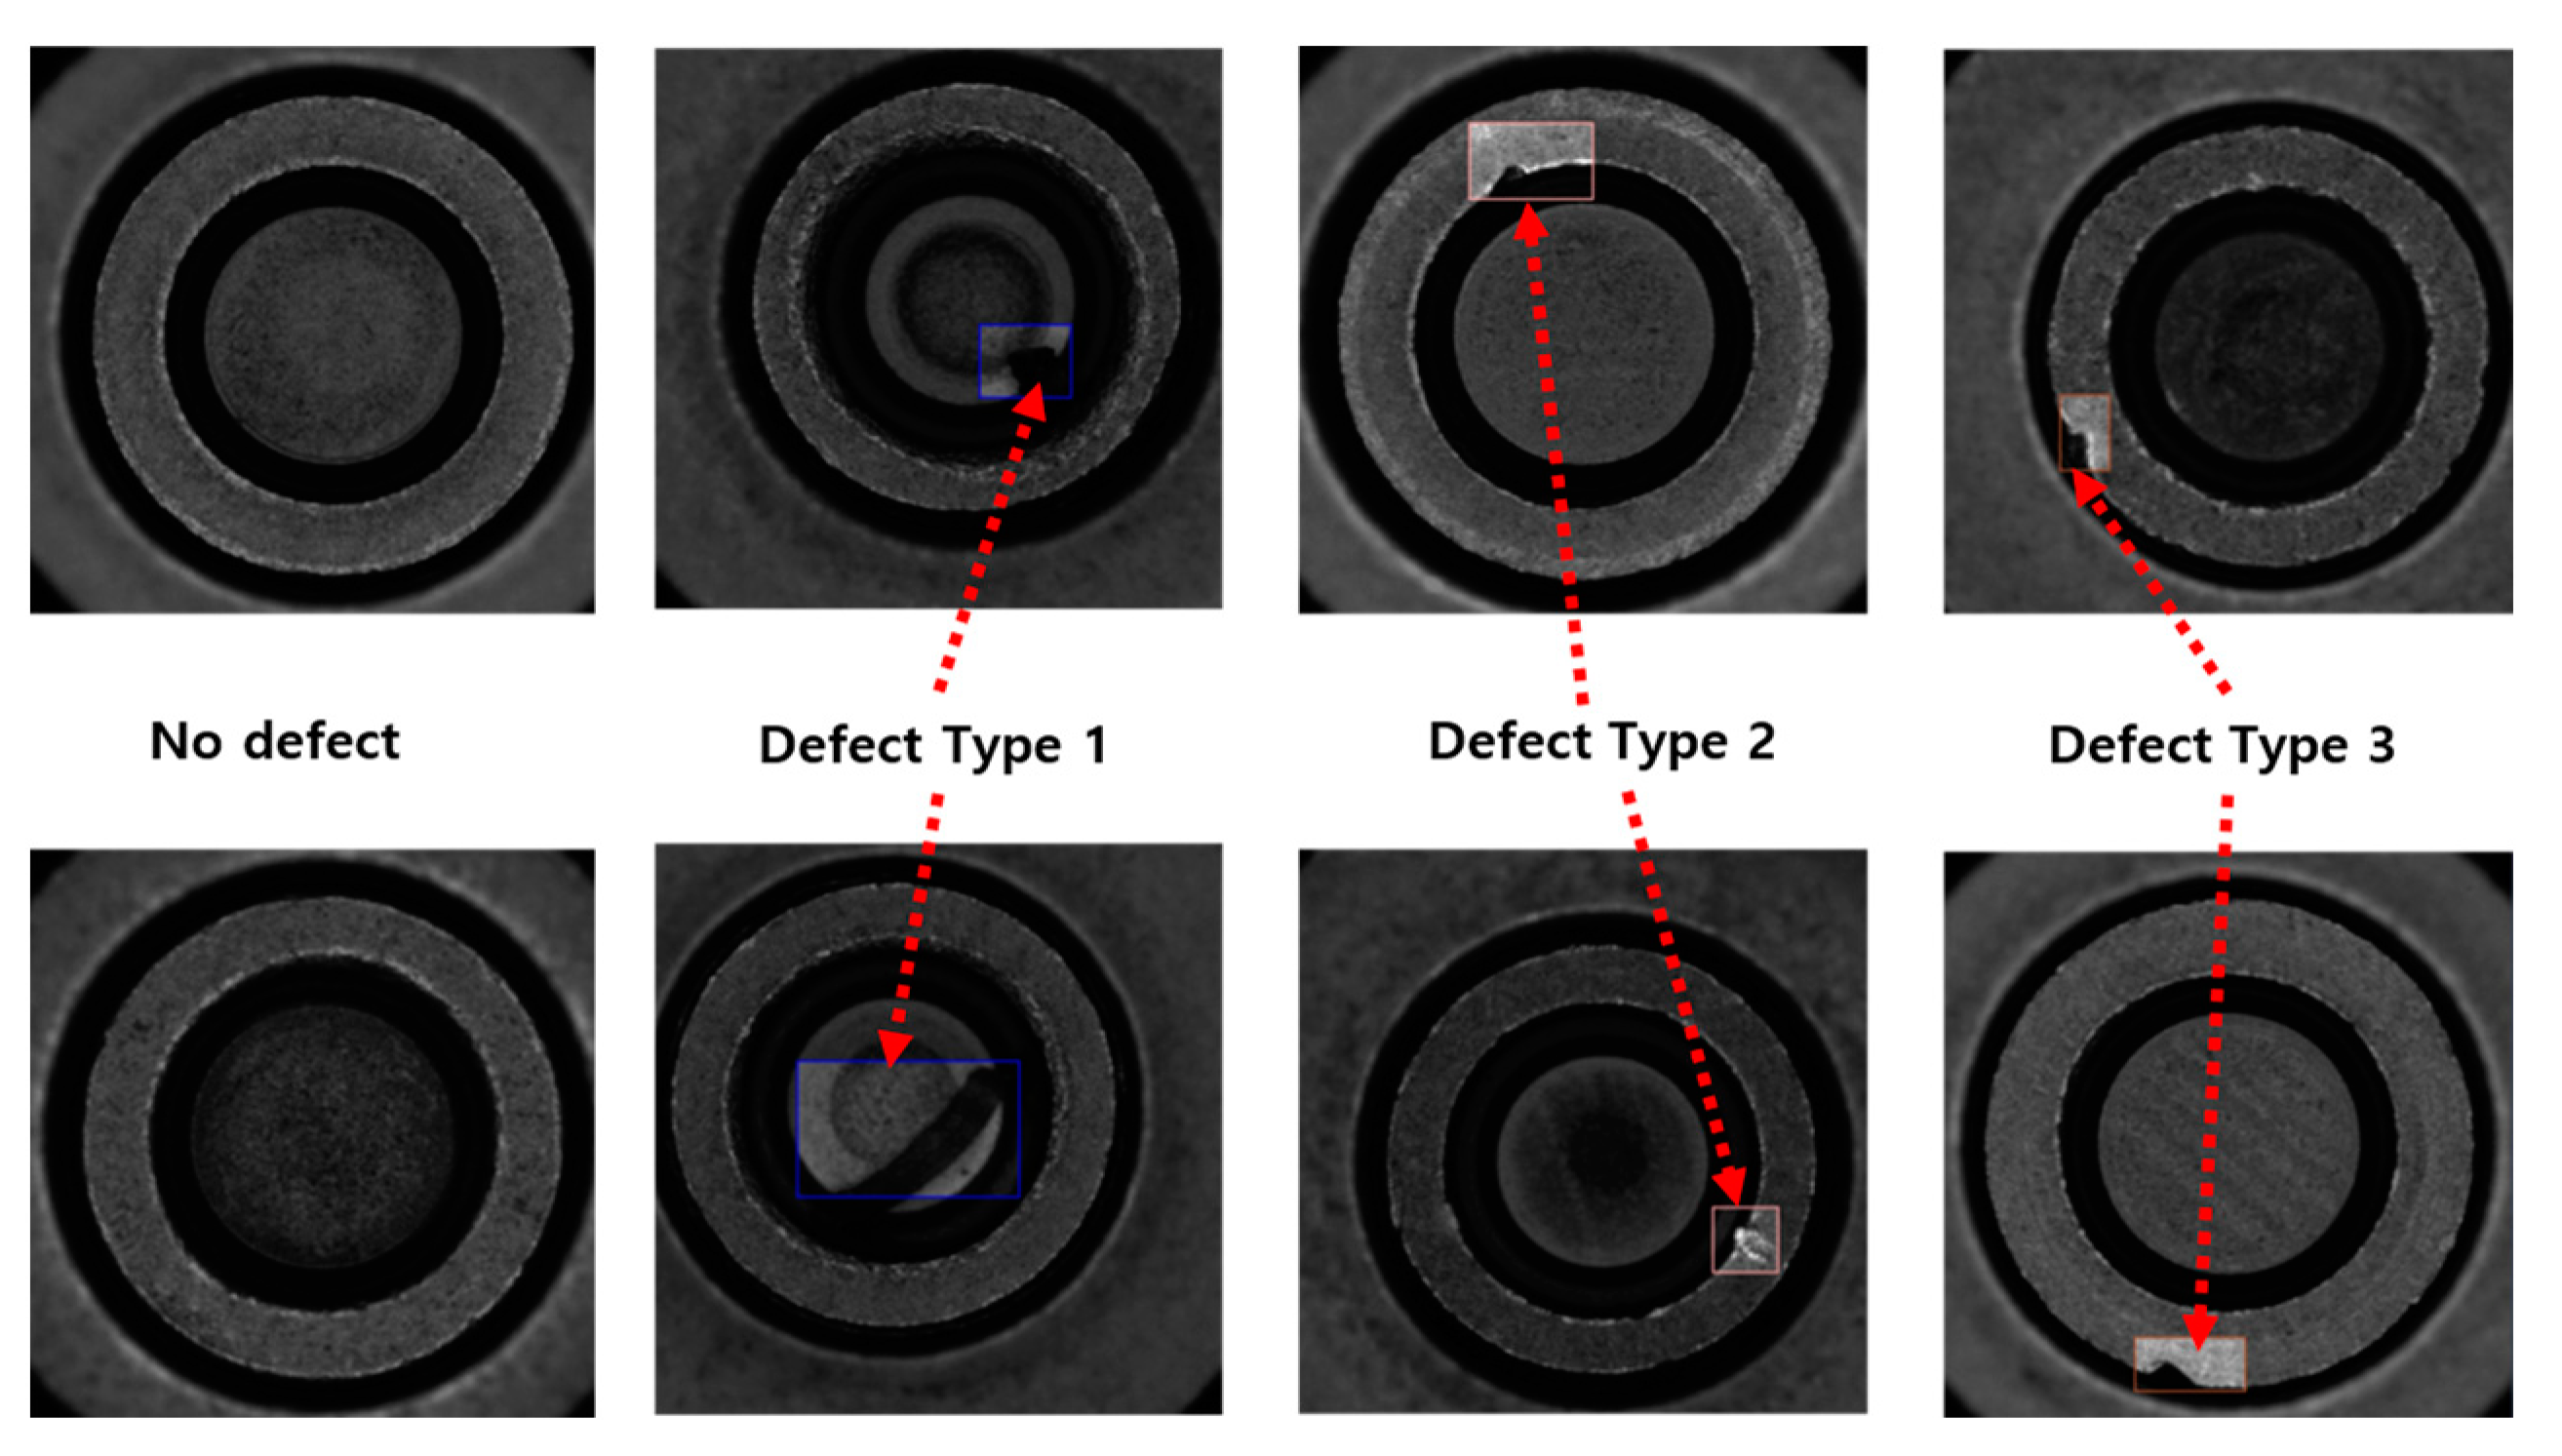
The dataset was provided from a real factory that supplies components for the production of batteries in Korea. It contained 1150 captured images of microfasteners used to produce rechargeable batteries. In the microfastener production process, there are three different types of defects that can appear on the surface of the product. The category of defects depends on the location of its appearance.
Figure 2 describes the dataset collection method and the differences between defect type 1, type 2, and type 3.
Definition of defection types: On the microfastener’s surface, captured from a top-down perspective (refer to the filming direction in
Figure 2), three circles—circle 1, circle 2, and circle 3—were observed. The classification of defect types was as follows:
Type 1: A scratch, a flaw, or damage was located within the boundary of circle 1.
Type 2: A scratch, a flaw, or damage was located within the region between circle 2 and circle 3, in proximity to circle 2.
Type 3: A scratch, a flaw, or damage was identified within the area between circle 2 and circle 3, close to circle 3.
In this study, the authors intended to create a system to automatically detect different defects on the fastener’s surface and then enhance the product quality, subsequently optimizing production lines and reducing the participation of workers in the manufacturing process, as well as saving operating costs.
4.2. Proposed Methods and Architecture
Defect Detection
To detect defects and types of defects on the microfasteners, we used two different methods and then compared the results between them to obtain the efficient solution.
Method 1—Direct: In method 1, we directly annotated the defects that appeared on the surface of products. These defects were then categorized and named as type 1, type 2, and type 3. After that, we used EfficientDet and YOLO to train the models on this annotated dataset. The model aimed to learn the defects and features distinguishing the different defect types. After training the models, we used them to infer the defects category on the new images directly.
Figure 3 represents some examples of annotating defects with this method.
Method 2—Indirect: In this method, similar to method 1, the initial step involved annotating defects on the surfaces of products. However, instead of categorizing them directly as type 1, type 2, or type 3, they were uniformly labeled as “defect”. Subsequently, we annotated three circles (“circle 1”, “circle 2”, and “circle 3”) on the images, each representing specific regions corresponding to the bordering circles on the surfaces of the microfasteners (see
Figure 4).
Following the annotation of defects and circles, the models were trained to predict both the presence of defects (labeled as “defect”) and the locations of the circles (labeled as “circle 1”, “circle 2”, and “circle 3”). Finally, the categorization of defects was determined by comparing the location of the “defect” with the locations of “circle 1”, “circle 2”, and “circle 3”. In a nutshell, the type of defects was given by comparing the location of detected defects with the locations of detected circles from the images.
The following instruction determines the type of a predicted defect label as shown in
Figure 5:
Let the area of the circles be θ_1, θ_2, θ_3. The area of the bounding box containing the defect is ϵ.
Calculate the area of the overlap of bounding box ϵ and three circles. Suppose we have three values β_1, β_2, β_3 corresponding to the area of overlap of ϵ with θ_1, θ_2, θ_3.
Give the acceptance rates to decide which circle the defect belongs to as ε_1, ε_2, ε_3.
The selection of the defect’s type is as follows:
Proposed Architecture:
After predicting the types of defects appearing on the product surface, we used C-chart and P-chart to visualize and analyze information about product defects. This function helps production line operators quickly obtain general information about product quality, thereby making appropriate decisions.
Figure 6 depicts the general architecture of using deep learning models with control charts to help production line operators control and improve product quality, thereby enhancing quality control in manufacturing.
The operational principle of this architecture is as follows: In the traditional manufacturing process, the operators control the molding machine initially, producing microfasteners. Subsequently, defect-checking workers inspect and remove defective products from the production line before packaging. In the proposed architecture, we employ a camera positioned above to capture images of microfasteners. The defect detection module then utilizes pretrained models to identify defects in the product images. Information about defect types per product and per lot will be displayed in C-chart and P-chart formats. These charts provide operators with insights into the number of defects in each product and batch. If the defect count exceeds the allowable threshold ( is a value set by the operators to allow maximum defects on each lot), operators will adjust the production line and molding machine to fix the issues, thus enhancing the quality of subsequent product manufacturing.
5. Experimental Results and Discussion
This section presents the results of our experiments on the dataset and some potential applications of our proposed method for quality management in manufacturing. We organized the dataset chronologically based on image capture time and subsequently divided it using a 90/10 split, with 90% allocated for training and model refinement (70% for training and 20% for fine-tuning the model during the training phase) and 10% (test set) for testing and visualization with the C-chart and P-chart.
When preparing the models for training, we utilized the pretrained YOLOv8n [
30] and EfficientDet_D0 models [
31] and then applied transfer learning to train the models with method 1 (direct) and method 2 (indirect).
Table 2 describes the parameters for presenting the experimental results in this section.
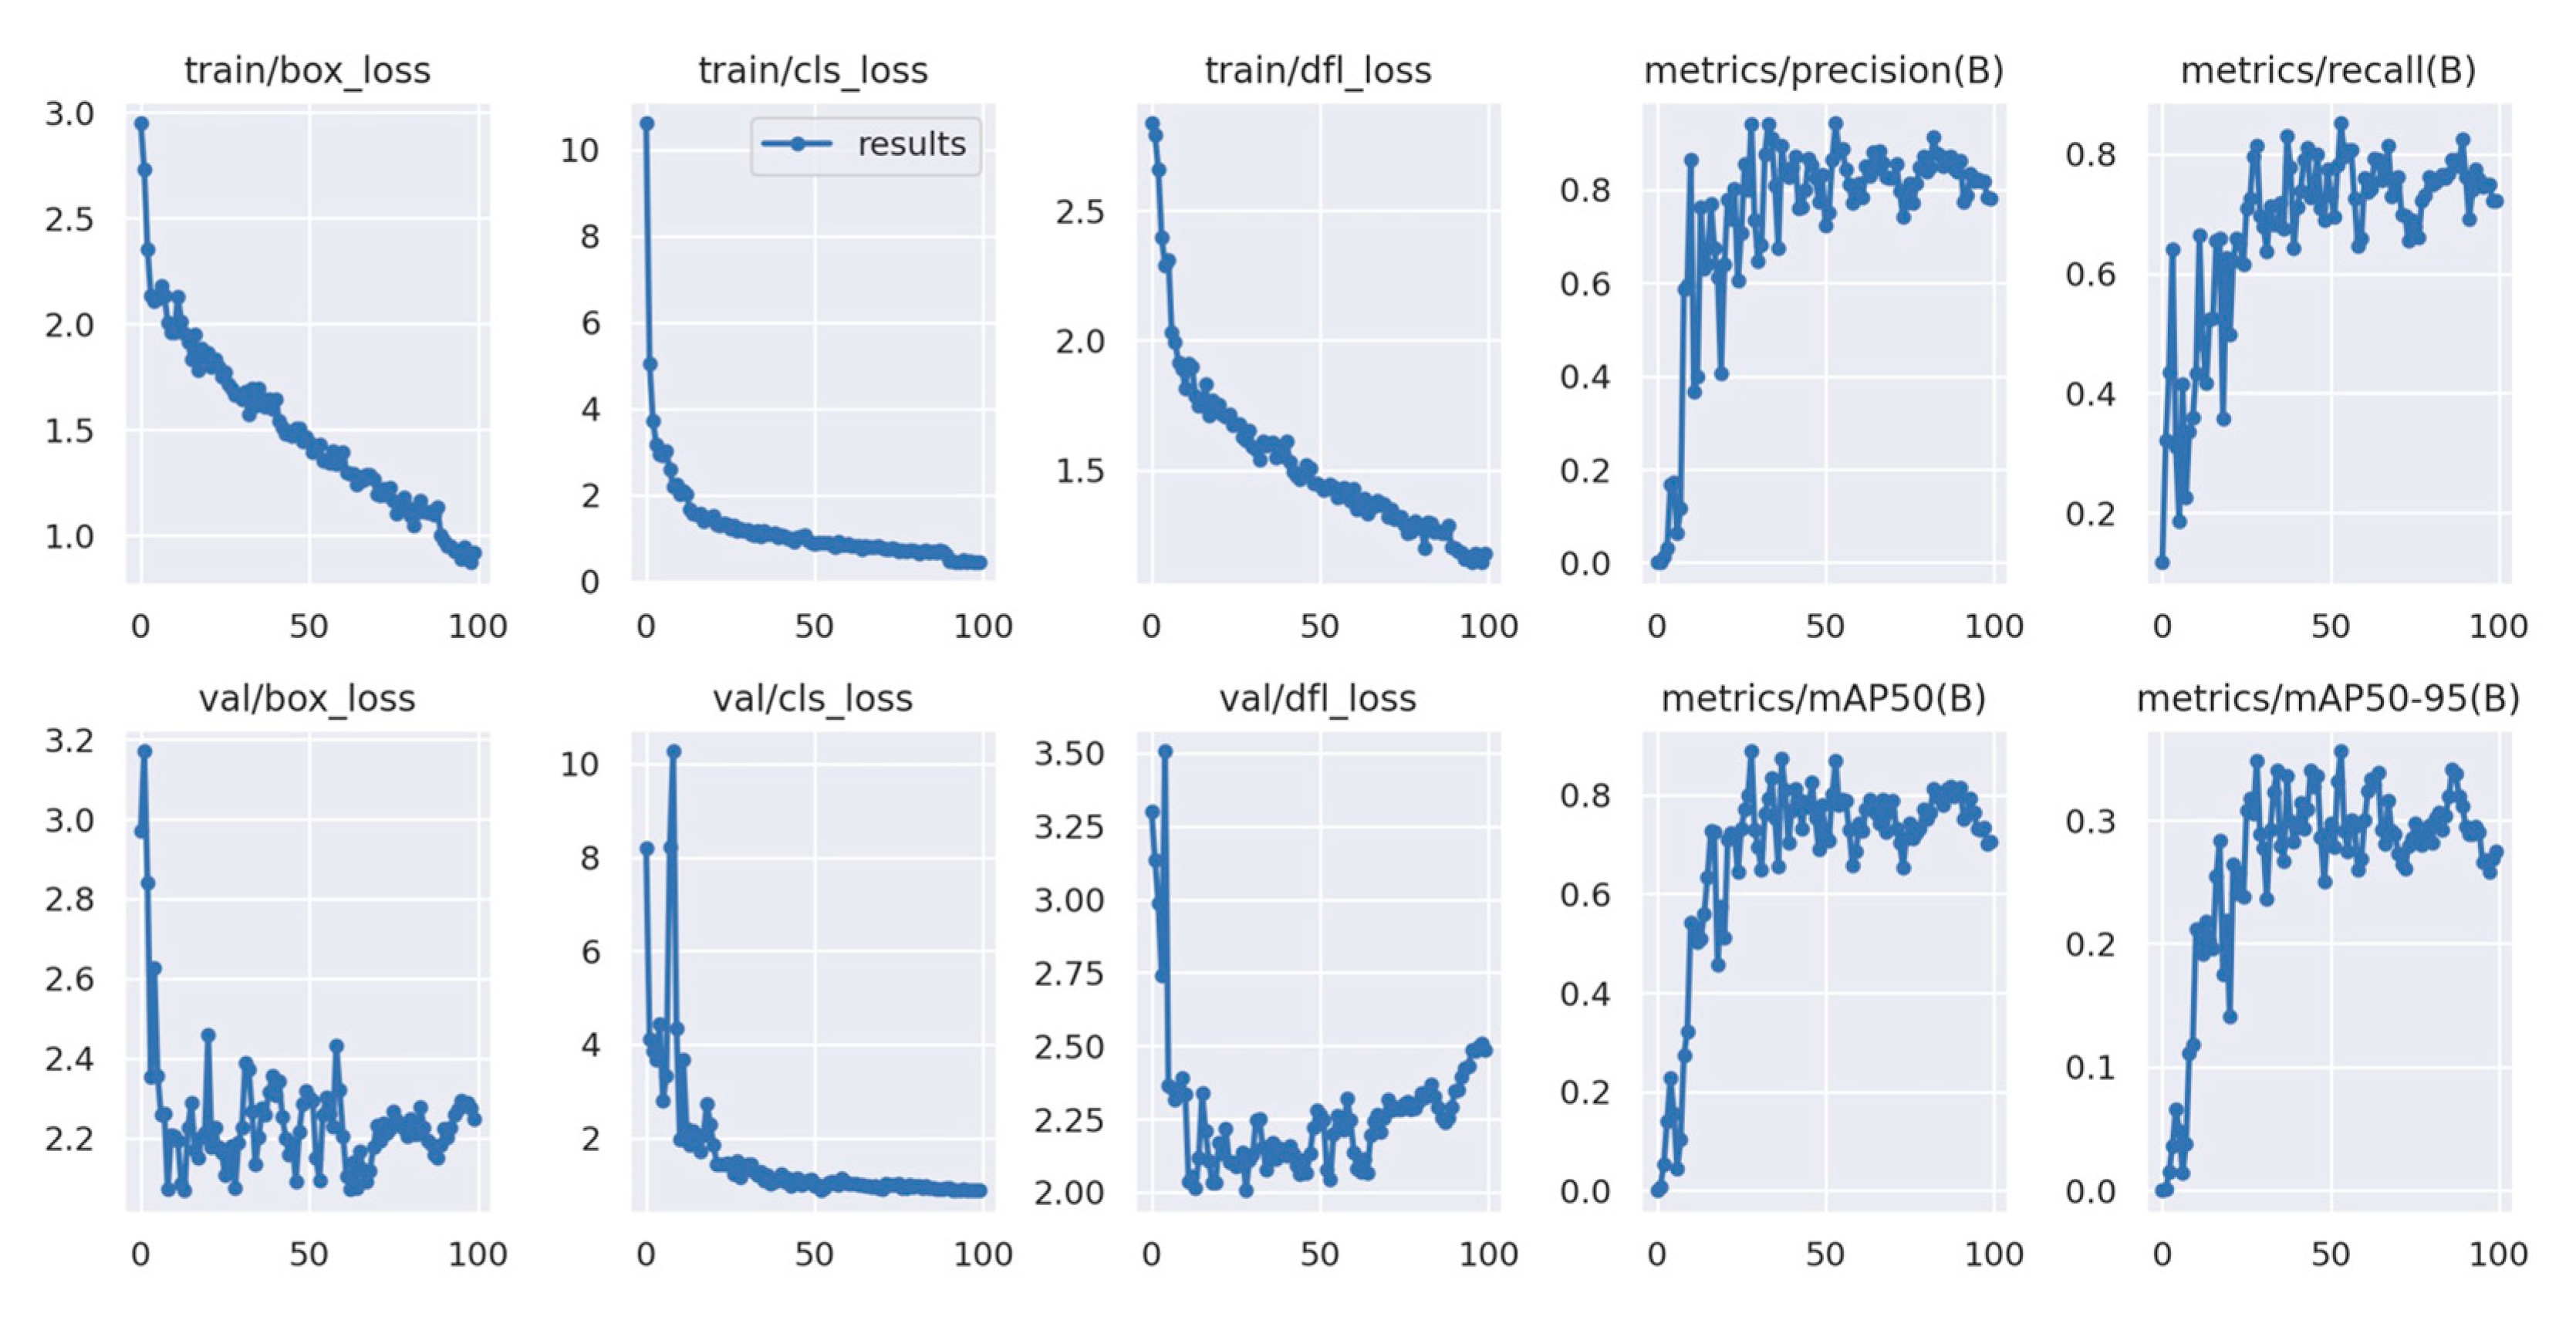
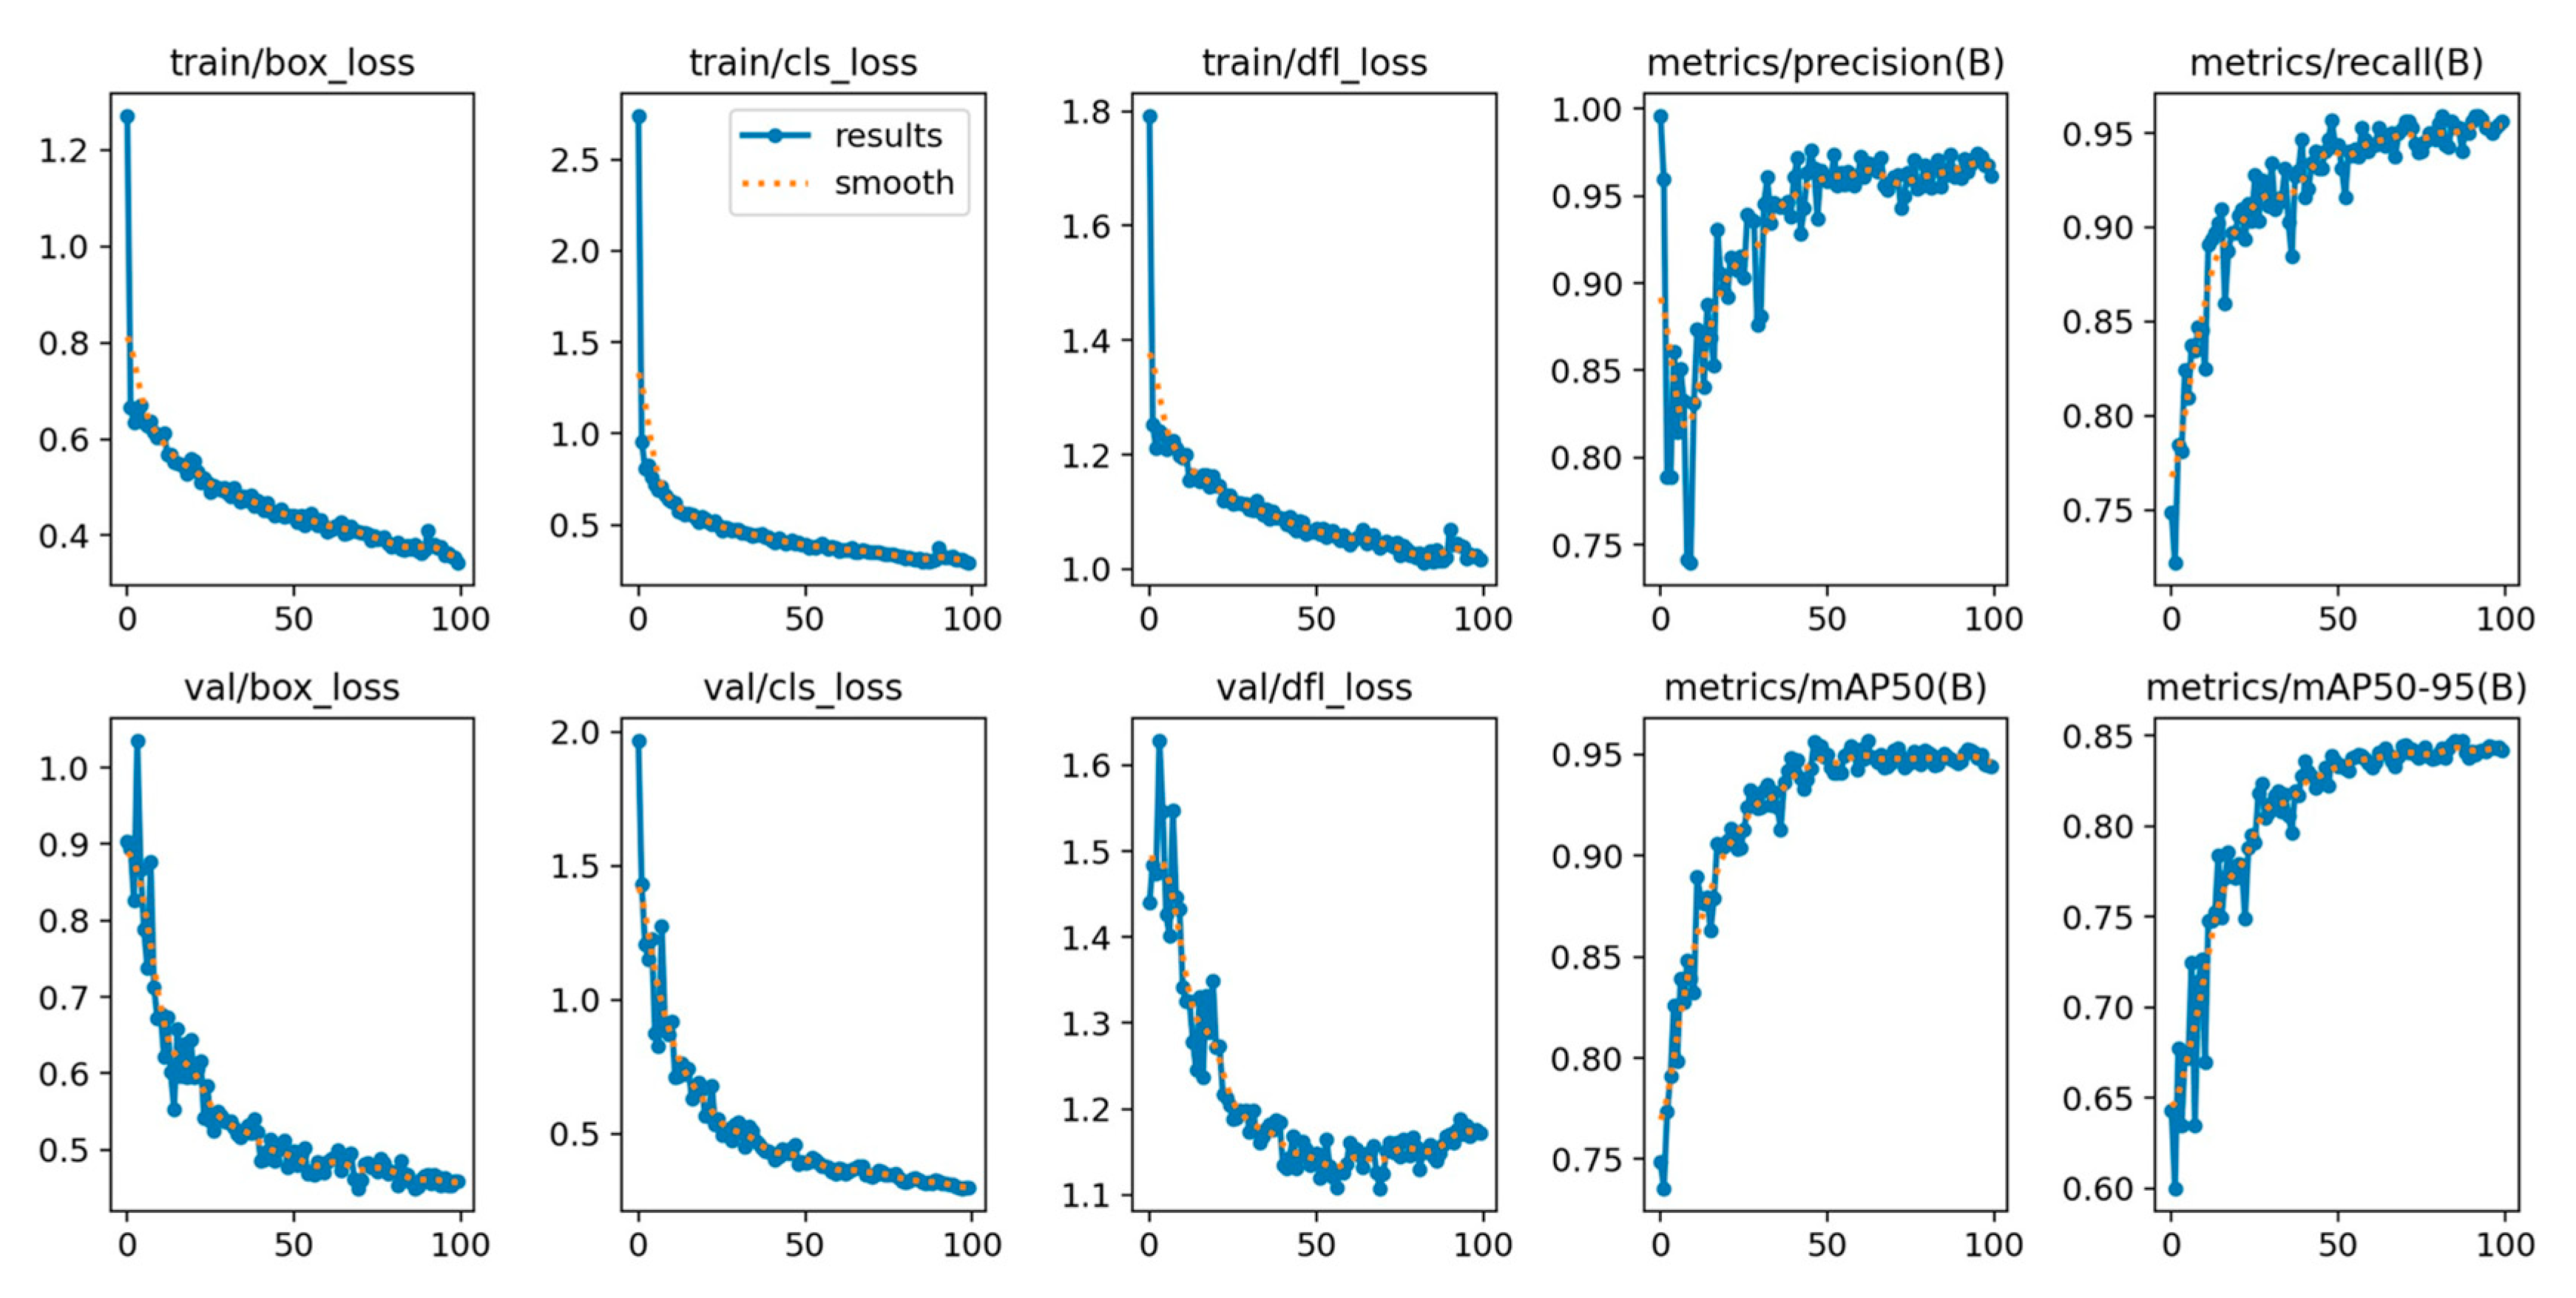
As we can see in
Figure 7 and
Figure 8, using method 2 provided better results with YOLOv8n. In method 2, the mAP50-95 obtained a value of 0.84, while using method 1 only obtained a value of 0.29. Similarly, the precision and recall values in method 2 were above 90% and better than those of method 1, which were only approximately 78%. Regarding using the EfficientDet model, the AP and AR values (
Table 3) of the model using method 2 were also higher than those of method 1, and the highest values were AP (0.845) and AR (0.808). Assessing the trained models on the test set using method 2 with YOLO and EfficientDet, we achieved accuracies of 0.91 and 0.73, respectively.
Therefore, we can see that using the indirect method achieves better performance than predicting the type of defect on the product surface directly.
Results on Method 1: This method directly predicted the category type of defects, but it did not determine the defect’s relative position on the product’s surface, so the results were less accurate than using method 2.
Figure 9 depicts the finding. For more information on other results, please refer to the Repository section.
Results on Method 2: As explained in
Section 4, the process of selecting the category for the detected defect involved calculating the overlap area between the defect’s bounding box and three circles, followed by a comparison with the acceptance rates (ε_1, ε_2, ε_3) to make the final decision.
Figure 10 illustrates certain results obtained using YOLOv8 that had the highest accuracies with the acceptance rate values (0.6, 0.3, 0.1). For additional information on other results, please refer to the Repository section.
Quality management: After detecting defects on 115 images of the test set, we analyzed it with the C-chart and P-chart to obtain information for assisting the operator in controlling the quality of the production process.
Table 4 represents the ImageID and the total detected defects on each image using YOLOv8 with method 2 in the test set.
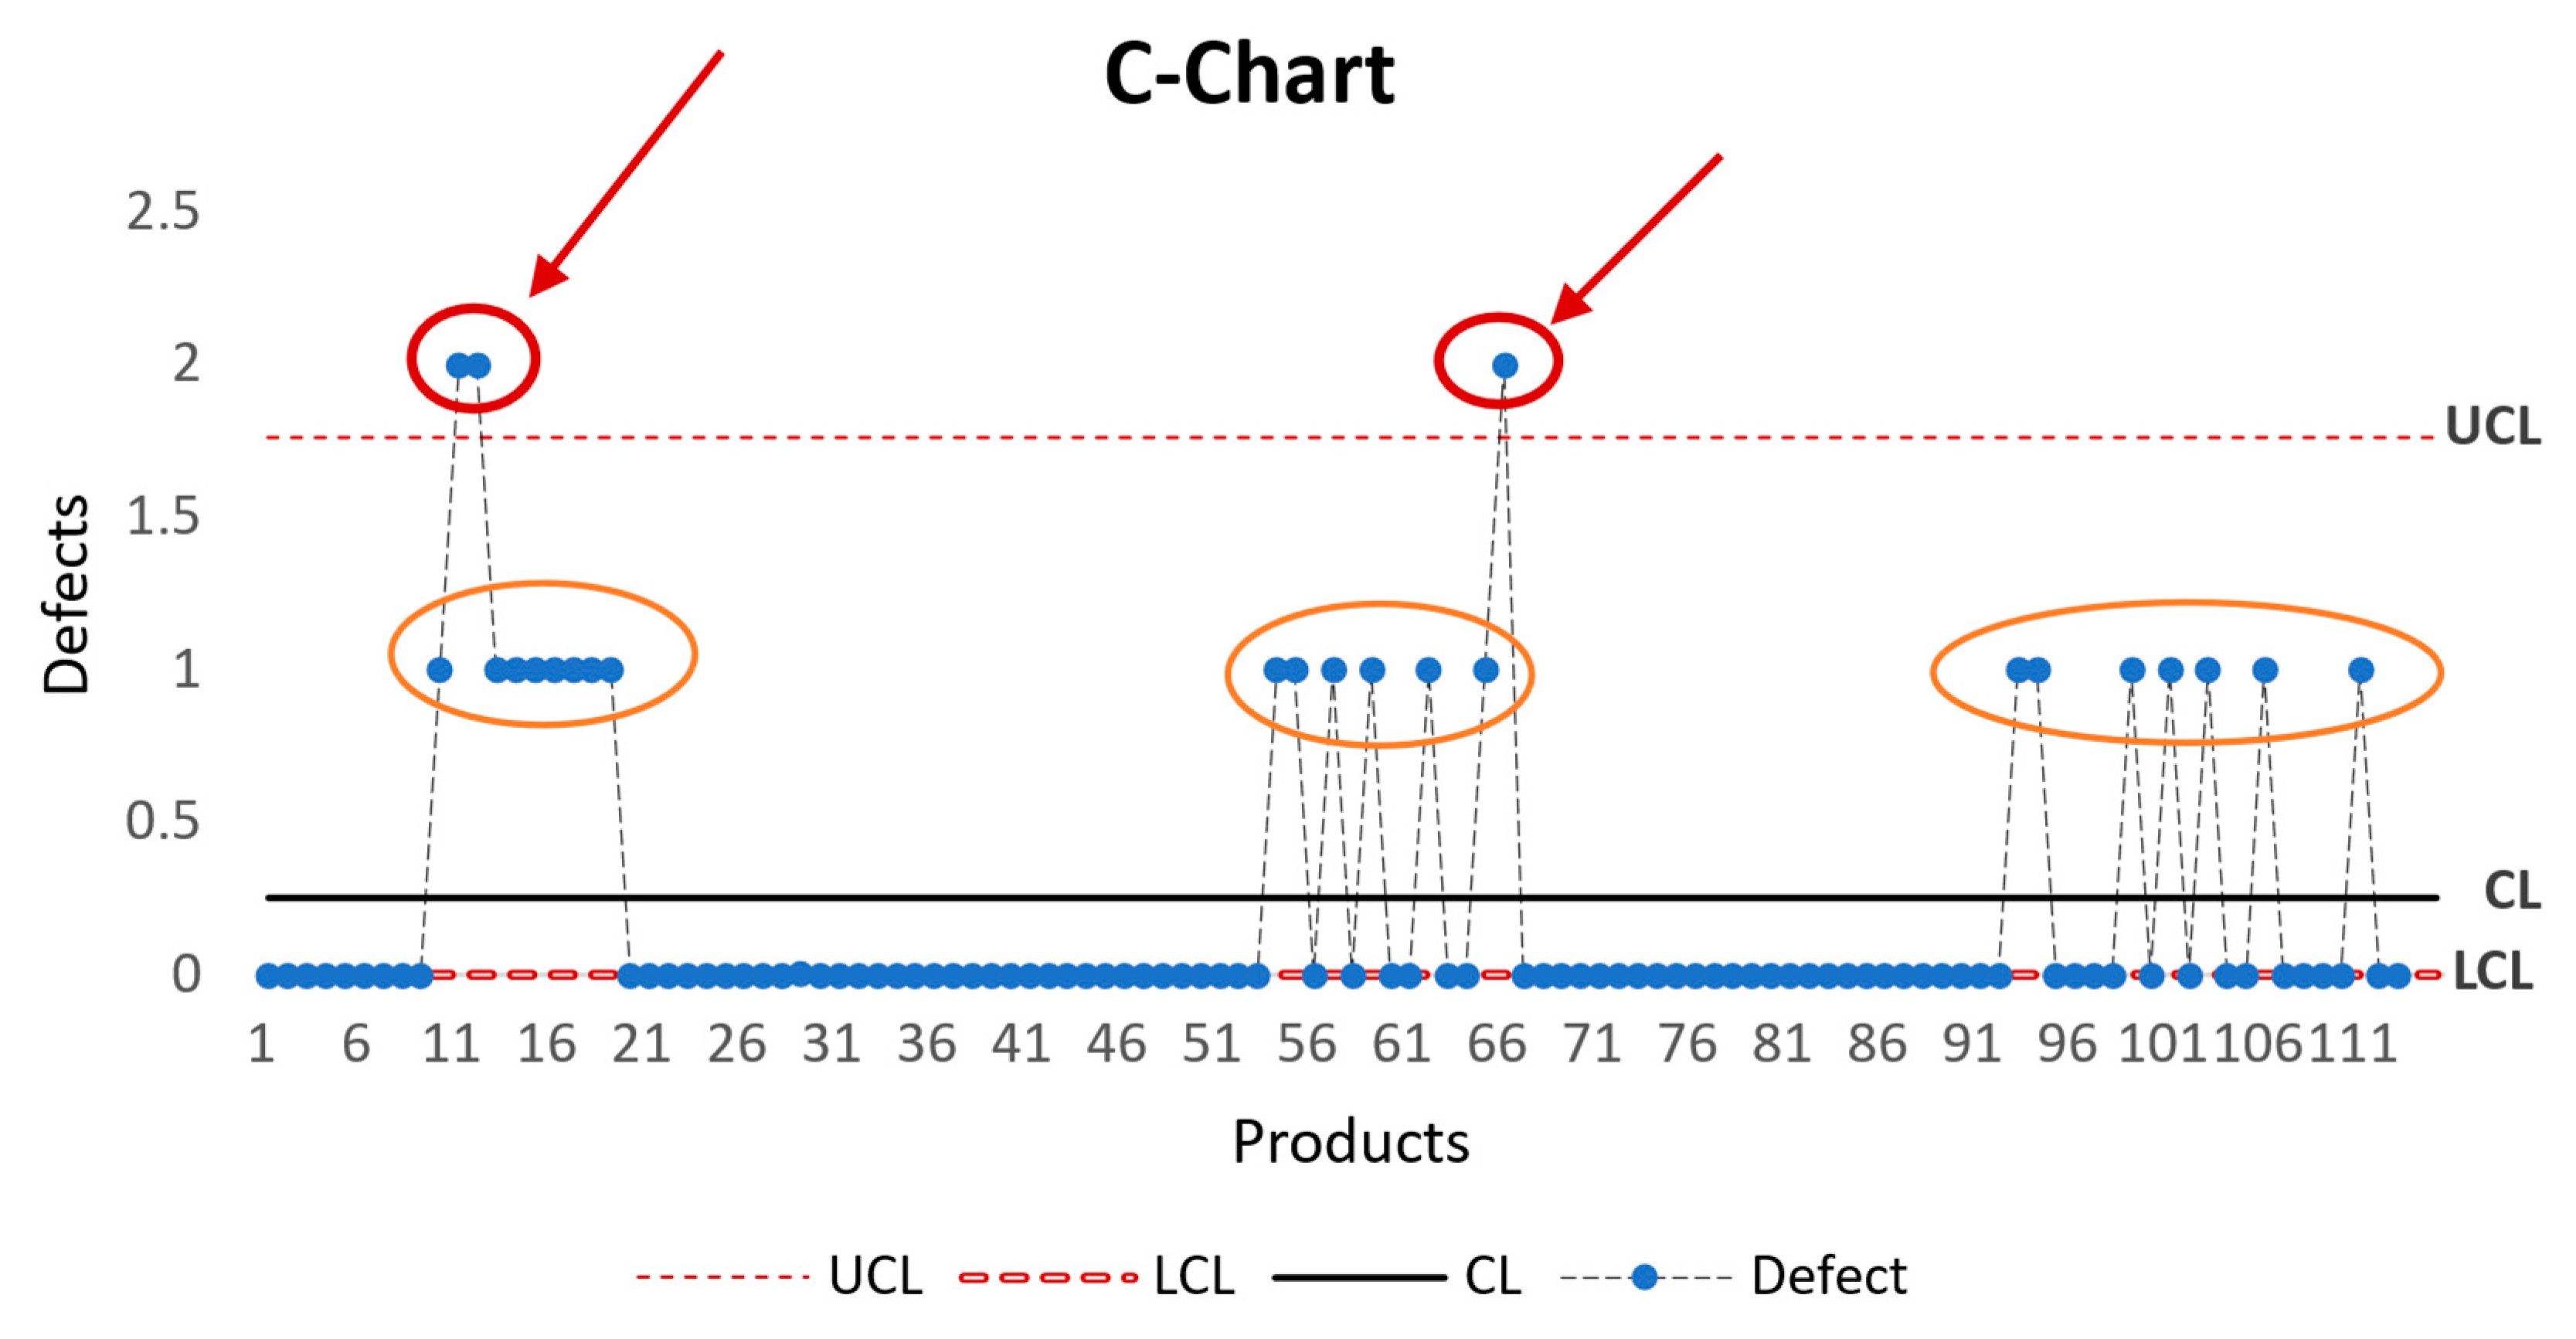
Based on the equation for calculating the parameters in the C-chart described in
Section 3.3, we obtained the following values:
, UCL = 1.758681536, LCL = 0.
Figure 11 represents the C-chart with the information on defects detected from the test set. As we can easily realize from the chart, some highlighted points indicate the frequency of defects on the surface of the products, especially those with defects higher than the UCL line (marked in red circles) or those with defects higher than the CL (marked in yellow ovals). This information is helpful for the operator to realize the production line status and hence give the appropriate operation.
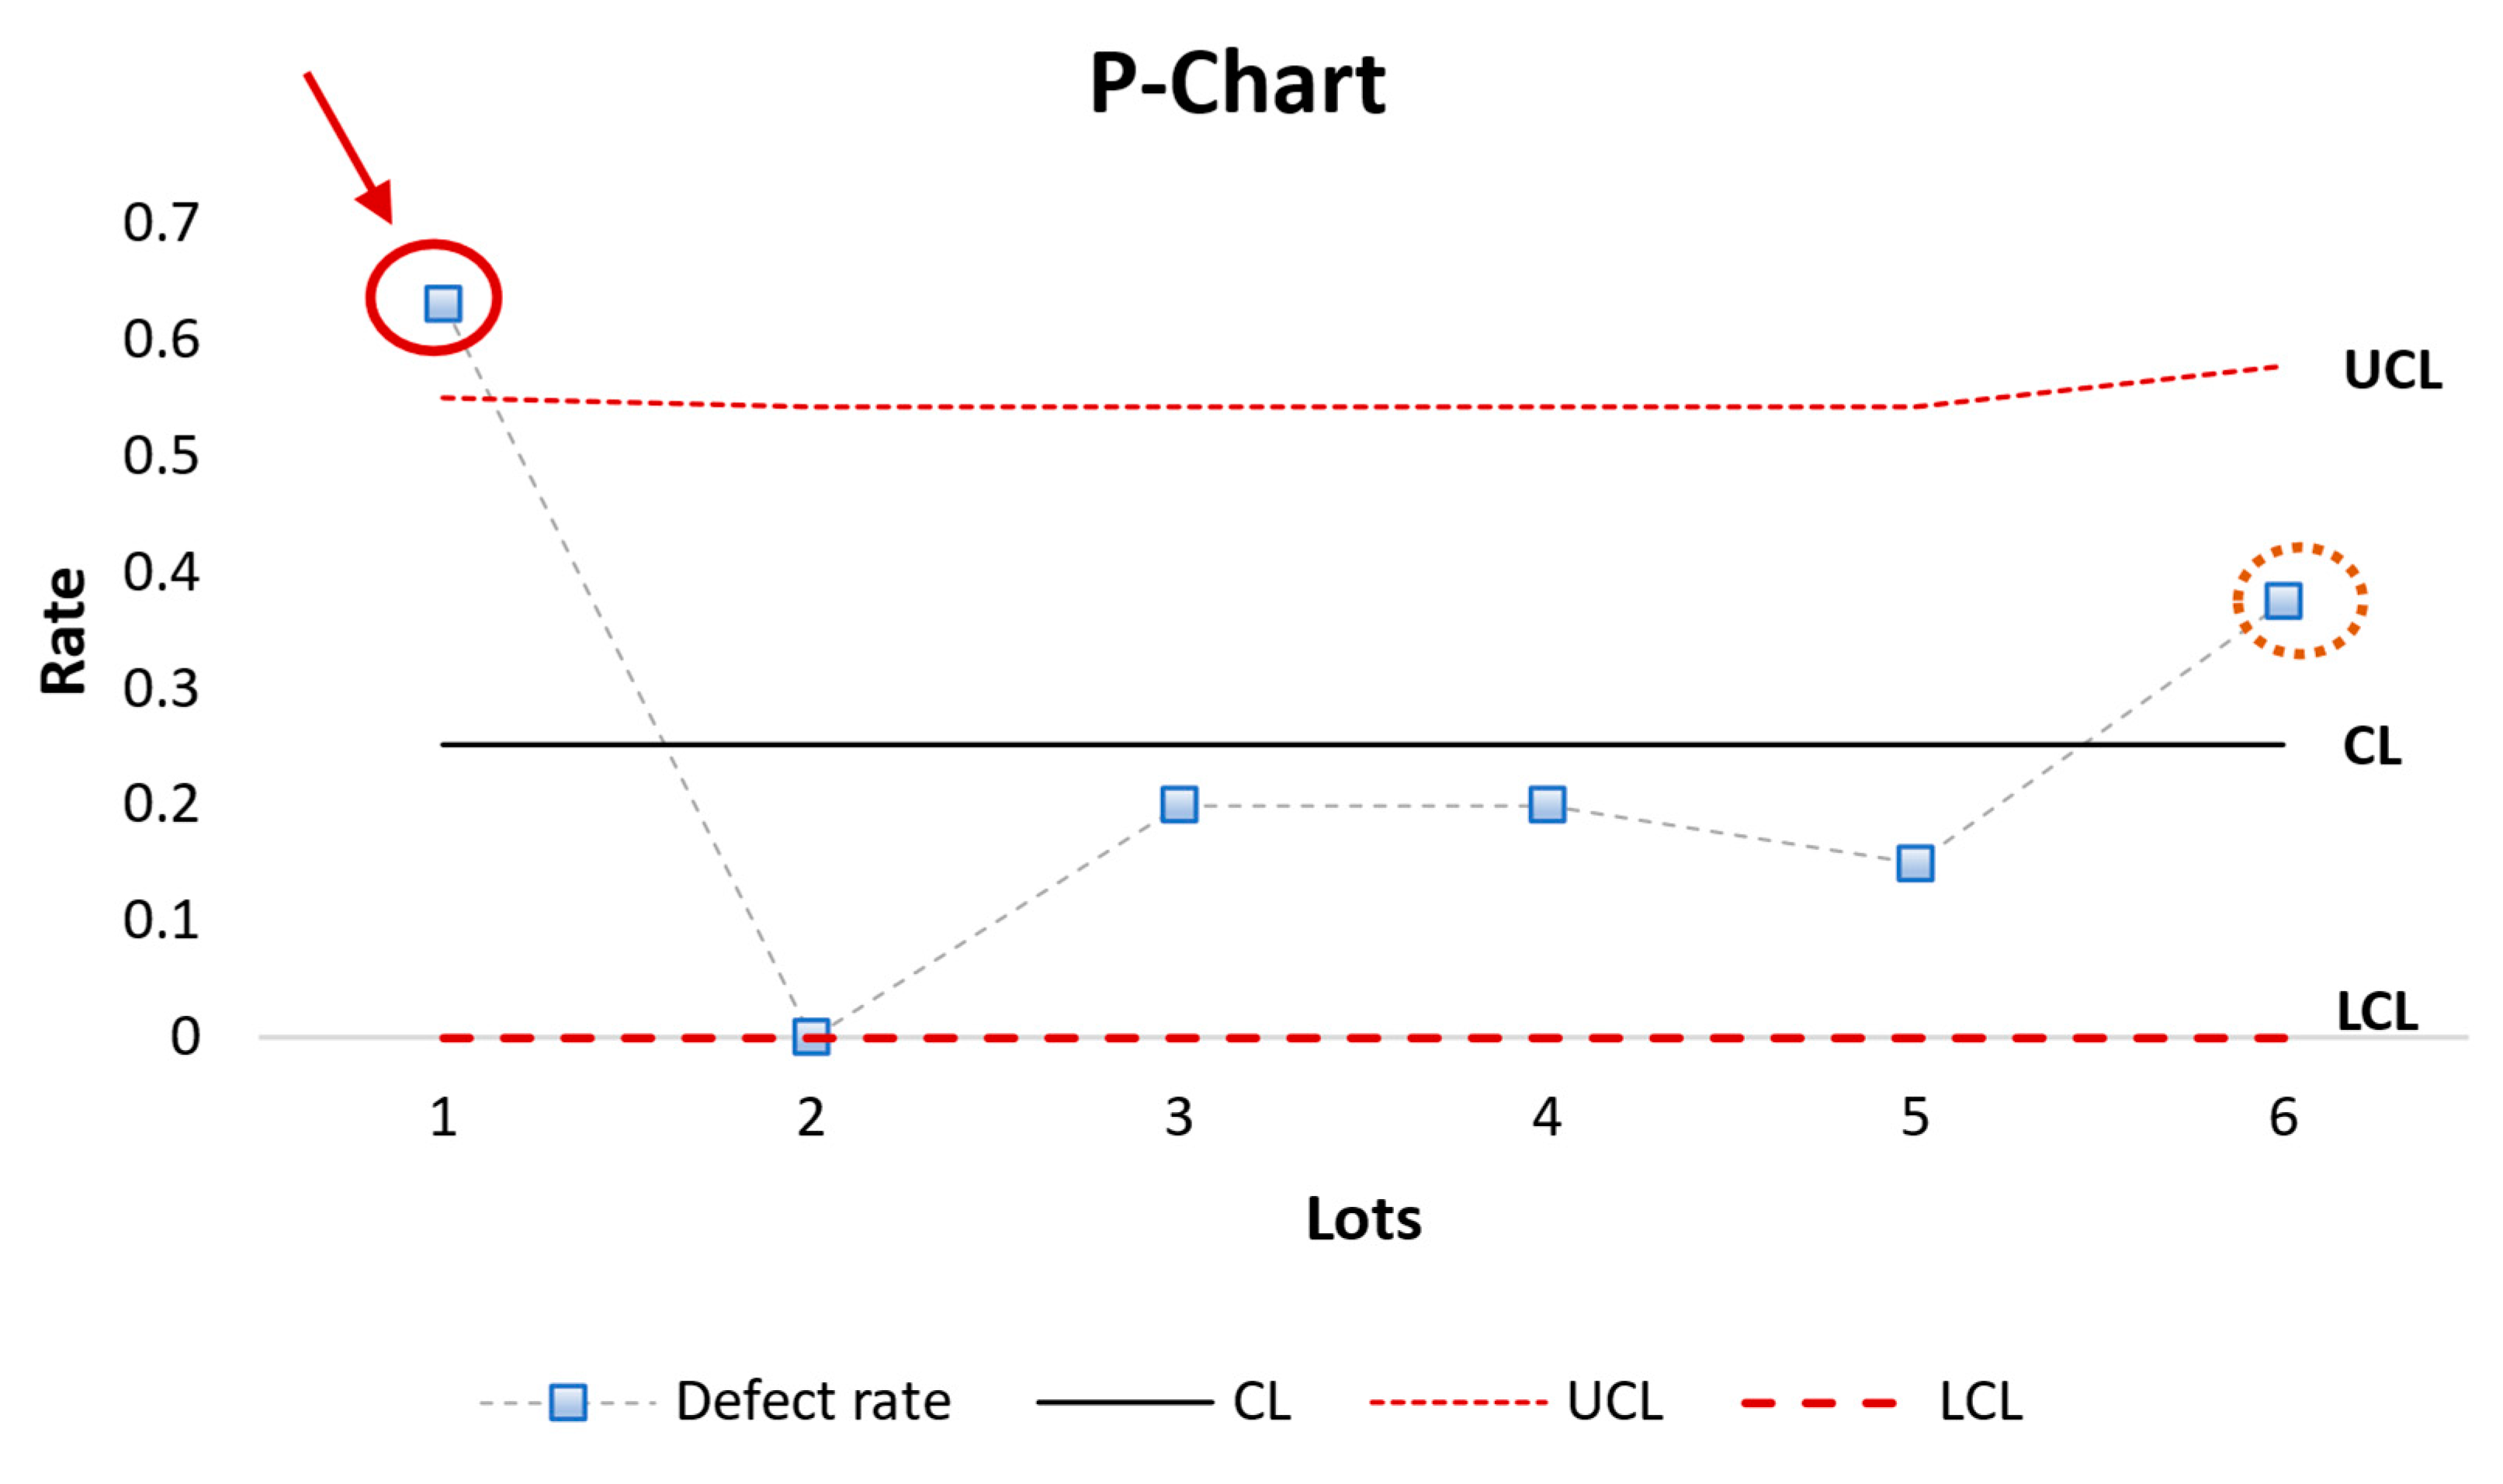
To create the P-chart (
Figure 12), we grouped 20 products into one lot and calculated the UCL, LCL, CL, and defect rate values for each lot. These values are represented in
Table 5 below.
Analyzing the information provided by the P-chart reveals some useful instructions: It becomes evident that lot 1 exhibited a notable quantity of defective products, with a defect rate exceeding the threshold defined by the UCL line (highlighted by the red circle). Moreover, lot 6 represented a raised count of defective products beyond the CL (denoted by the yellow circle). This information is a valuable resource for the operator to control production lines efficiently, mitigating defects in the final products.
6. Conclusions and Future Work
In this study, we introduced an approach and architecture using state-of-the-art object detection algorithms with different strategies to detect defects from microfasteners used in battery component manufacturing. We studied and compared the traditional method (direct) and the indirect method to classify the categories of detected defects using YOLOv8 and EfficientDet. We proposed an effective method to efficiently classify the defect categories by comparing the overlap between defect areas and the circles surrounding them.
The results indicated that YOLOv8 with the indirect detection method achieved the best accuracy at 91% of classifying defects. Furthermore, we used C-chart and P-chart analyses in the statistical quality control domain to extract information from the detected defects and the production line, providing the operator with valuable assistance in managing the quality of the product and the lot. These control charts designate the operator with a strategic perspective, enabling them to make decisions and efficiently control the production line.
In addition to the results obtained in this study, there are still some limitations, as well as issues that need to be addressed in our future research:
This study only focused on the surface defects of microfasteners, not more complex defects that can occur inside the product. To fully enhance quality management in a production line, we need to include internal defects and provide a more comprehensive quality examination.
Although our proposed methods showed high accuracy in defect detection with microfasteners, to develop and use the model in real-world systems, we need to evaluate the performance of the model on different manufacturing and production lines.
The predicted results depended significantly on the labeling results, so in order to run the architecture in practice, it is necessary to study more labeling defect methods.
Despite using information extracted from the C-chart and P-chart with detected defects for assisting the operator, actual use in the real world needs perspective and feedback from production line operators.
In future works, we will try to deal with these concerns and improve the architecture, as well as bring the system to use in factories.
Author Contributions
Conceptualization, T.-T.-H.V. and H.K.; methodology, T.-T.-H.V. and H.K.; validation, T.-T.-H.V. and H.K.; formal analysis, T.-T.-H.V. and H.K.; investigation, T.-W.C.; resources, H.K.; writing—original draft preparation, T.-T.-H.V.; writing—review and editing, H.K. and T.-W.C.; supervision, H.K.; project administration, H.K. and T.-W.C.; funding acquisition, T.-W.C. All authors have read and agreed to the published version of the manuscript.
Funding
This work was supported by the Technology Innovation Program (20019178, Development of AI-based manufacturing process logistics optimization technology that supports operation optimization for each process situation) funded by the Ministry of Trade, Industry & Energy (MOTIE, Korea). This work was also supported by Kyonggi University’s Graduate Research Assistantship 2023.
Data Availability Statement
Conflicts of Interest
The authors declare no conflict of interest.
References
- Psarommatis, F.; Sousa, J.; Mendonça, J.P.; Kiritsis, D. Zero-defect manufacturing the approach for higher manufacturing sustainability in the era of industry 4.0: A position paper. Int. J. Prod. Res. 2022, 60, 73–91. [Google Scholar] [CrossRef]
- Powell, D.; Magnanini, M.C.; Colledani, M.; Myklebust, O. Advancing zero defect manufacturing: A state-of-the-art perspective and future research directions. Comput. Ind. 2022, 136, 103596. [Google Scholar] [CrossRef]
- Psarommatis, F.; May, G.; Dreyfus, P.A.; Kiritsis, D. Zero defect manufacturing: State-of-the-art review, shortcomings and future directions in research. Int. J. Product. Res. 2019, 58, 1–17. [Google Scholar] [CrossRef]
- Eger, F.; Coupek, D.; Caputo, D.; Colledani, M.; Penalva, M.; Ortiz, J.A.; Freiberger, H.; Kollegger, G. Zero defect manufacturing strategies for reduction of scrap and inspection effort in multi-stage production systems. Procedia CIRP 2018, 67, 368–373. [Google Scholar] [CrossRef]
- Liu, K.; Ma, Z.; Liu, Y.; Yang, J.; Yao, Y. Enhanced defect detection in carbon fiber reinforced polymer composites via generative kernel principal component thermography. Polymers 2021, 13, 825. [Google Scholar] [CrossRef]
- Fu, Y.; Downey, A.R.J.; Yuan, L.; Zhang, T.; Pratt, A.; Balogun, Y. Machine learning algorithms for defect detection in metal laser-based additive manufacturing: A review. J. Manuf. Process. 2022, 75, 693–710. [Google Scholar] [CrossRef]
- Wan, P.K.; Leirmo, T.L. Human-centric zero-defect manufacturing: State-of-the-art review, perspectives, and challenges. Comput. Ind. 2022, 144, 103792. [Google Scholar] [CrossRef]
- Chen, Y.; Ding, Y.; Zhao, F.; Zhang, E.; Wu, Z.; Shao, L. Surface Defect Detection Methods for Industrial Products: A Review. Appl. Sci. 2021, 11, 7657. [Google Scholar] [CrossRef]
- Xu, C.; Li, L.; Li, J.; Wen, C. Surface Defects Detection and Identification of Lithium Battery Pole Piece Based on Multi-Feature Fusion and PSO-SVM. IEEE Access 2021, 9, 85232–85239. [Google Scholar] [CrossRef]
- Choudhary, N.; Clever, H.; Ludwigs, R.; Rath, M.; Gannouni, A.; Schmetz, A.; Hülsmann, T.; Sawodny, J.; Fischer, L.; Kampker, A.; et al. Autonomous Visual Detection of Defects from Battery Electrode Manufacturing. Adv. Intell. Syst. 2022, 4, 2200142. [Google Scholar] [CrossRef]
- Schoo, A.; Moschner, R.; Hülsmann, J.; Kwade, A. Coating Defects of Lithium-Ion Battery Electrodes and Their Inline Detection and Tracking. Batteries 2023, 9, 111. [Google Scholar] [CrossRef]
- Niri, M.F.; Liu, K.; Apachitei, G.; Román-Ramírez, L.A.; Lain, M.; Widanage, D.; Marco, J. Quantifying key factors for optimised manufacturing of Li-ion battery anode and cathode via artificial intelligence. Energy AI 2022, 7, 100129. [Google Scholar] [CrossRef]
- Benbarrad, T.; Kenitar, S.B.; Arioua, M. Intelligent machine vision model for defective product inspection based on machine learning. In Proceedings of the 2020 International Symposium on Advanced Electrical and Communication Technologies (ISAECT), Marrakech, Morocco, 25–27 November 2020. [Google Scholar] [CrossRef]
- Adibhatla, V.A.; Chih, H.C.; Hsu, C.C.; Cheng, J.; Abbod, M.F.; Shieh, J.S. Applying deep learning to defect detection in printed circuit boards via a newest model of you-only-look-once. Math. Biosci. Eng. 2021, 18, 4411–4428. [Google Scholar] [CrossRef]
- Zhang, X.; Tang, L.; Fox, E.; Qiao, Z.; Fan, W.; Wang, G.A. Identifying product defects from user complaints: A probabilistic defect model. In Proceedings of the 22nd Americas Conference on Information Systems (AMCIS 2016), San Diego, CA, USA, 11–14 August 2016; pp. 1–10. [Google Scholar]
- Liu, Y.; Jiang, C.; Zhao, H. Using contextual features and multi-view ensemble learning in product defect identification from online discussion forums. Decis. Support Syst. 2018, 105, 1–12. [Google Scholar] [CrossRef]
- Wu, Y.; Saxena, S.; Xing, Y.; Wang, Y.; Li, C.; Yung, W.K.; Pecht, M. Analysis of manufacturing-induced defects and structural deformations in lithium-ion batteries using computed tomography. Energies 2018, 11, 925. [Google Scholar] [CrossRef]
- Robinson, J.B.; Owen, R.E.; Kok, M.D.; Maier, M.; Majasan, J.; Braglia, M.; Stocker, R.; Amietszajew, T.; Roberts, A.J.; Bhagat, R.; et al. Identifying Defects in Li-Ion Cells Using Ultrasound Acoustic Measurements. J. Electrochem. Soc. 2020, 167, 120530. [Google Scholar] [CrossRef]
- Silenzi, A.; Castorani, V.; Tomassini, S.; Falcionelli, N.; Contardo, P.; Bonci, A.; Dragoni, A.F.; Sernani, P. Quality Control of Carbon Look Components via Surface Defect Classification with Deep Neural Networks. Sensors 2023, 23, 7607. [Google Scholar] [CrossRef]
- Lu, B.; Xu, D.; Huang, B. Deep-learning-based anomaly detection for lace defect inspection employing videos in production line. Adv. Eng. Inform. 2022, 51, 101471. [Google Scholar] [CrossRef]
- Kaji, F.; Nguyen-Huu, H.; Budhwani, A.; Narayanan, J.A.; Zimny, M.; Toyserkani, E. A deep-learning-based in-situ surface anomaly detection methodology for laser directed energy deposition via powder feeding. J. Manuf. Process. 2022, 81, 624–637. [Google Scholar] [CrossRef]
- Fang, Q.; Ibarra-Castanedo, C.; Maldague, X. Automatic defects segmentation and identification by deep learning algorithm with pulsed thermography: Synthetic and experimental data. Big Data Cogn. Comput. 2021, 5, 9. [Google Scholar] [CrossRef]
- Sampath, V.; Maurtua, I.; Martin, J.J.A.; Rivera, A.; Molina, J.; Gutierrez, A. Attention Guided Multi-Task Learning for Surface defect identification. IEEE Trans. Ind. Inform. 2023, 19, 9713–9721. [Google Scholar] [CrossRef]
- Cannarella, J.; Arnold, C.B. The Effects of Defects on Localized Plating in Lithium-Ion Batteries. J. Electrochem. Soc. 2015, 162, A1365–A1373. [Google Scholar] [CrossRef]
- Badmos, O.; Kopp, A.; Bernthaler, T.; Schneider, G. Image-based defect detection in lithium-ion battery electrode using convolutional neural networks. J. Intell. Manuf. 2020, 31, 885–897. [Google Scholar] [CrossRef]
- Tan, M.; Pang, R.; Le, Q.V. EfficientDet: Scalable and Efficient Object Detection. In Proceedings of the 2020 IEEE/CVF Conference on Computer Vision and Pattern Recognition (CVPR), Seattle, WA, USA, 13–19 June 2020; pp. 10778–10787. [Google Scholar] [CrossRef]
- Tan, M.; Le, Q.V. EfficientNet: Rethinking Model Scaling for Convolutional Neural Networks. In Proceedings of the 36th International Conference on Machine Learning, Long Beach, CA, USA, 10–15 June 2019; Volume 2019, pp. 10691–10700. Available online: https://arxiv.org/abs/1905.11946v5 (accessed on 13 July 2023).
- Redmon, J.; Divvala, S.; Girshick, R.; Farhadi, A. You Only Look Once: Unified, Real-Time Object Detection. In Proceedings of the 2016 IEEE Conference on Computer Vision and Pattern Recognition (CVPR), Las Vegas, NV, USA, 27–30 June 2016; pp. 779–788. [Google Scholar] [CrossRef]
- Montgomery, D.C. Introduction to Statistical Quality Control. J. R. Stat. Soc. 1986, 35, 81–82. [Google Scholar] [CrossRef]
- Ultralytics/Ultralytics: NEW—YOLOv8. Available online: https://github.com/ultralytics/ultralytics (accessed on 14 November 2023).
- A PyTorch Implementation of EfficientDet. Available online: https://github.com/rwightman/efficientdet-pytorch (accessed on 15 November 2023).
| Disclaimer/Publisher’s Note: The statements, opinions and data contained in all publications are solely those of the individual author(s) and contributor(s) and not of MDPI and/or the editor(s). MDPI and/or the editor(s) disclaim responsibility for any injury to people or property resulting from any ideas, methods, instructions or products referred to in the content. |
© 2024 by the authors. Licensee MDPI, Basel, Switzerland. This article is an open access article distributed under the terms and conditions of the Creative Commons Attribution (CC BY) license (https://creativecommons.org/licenses/by/4.0/).


