


A Change-Sensitive Complexity Measurement for Business Process Models Based on Control Structure

Abstract
1. Introduction
2. Related Work
3. Basic Theories
3.1. BPMN
3.2. Basic Control Structures
- BCS = {seq, AND, OR, XOR, cyc}
- BCS is defined as seq if t0 → tk, where t ∈ Ac
- BCS is defined as AND if t0 has branch t01, t02 …, t0S, where t ∈ Ac
- BCS is defined as OR if t0 has branch t01, t02 …, t0S, where t ∈ Ac
- BCS is defined as XOR if t0 has branch t01, t02 …, t0S, where t ∈ Ac
- BCS is defined as cyc if tk has a loop branch, where t ∈ Ac
3.3. Process Model Complexity Based on the Control Structure
4. The Process Model Complexity Measurement
4.1. Measuring the Branching Structure Complexity
4.1.1. The Branching Structure Complexity
4.1.2. The Connection Forms between the Branching Structures
4.1.3. The Complexity Measurement for Branching Structures
4.2. The Change-Sensitive Complexity Measurement for the Process Model Based on the Control Structure
5. Experiment Design and Theoretical Validation
5.1. Experiment Models

| Group | Purpose | Business Process Model | Figure |
|---|---|---|---|
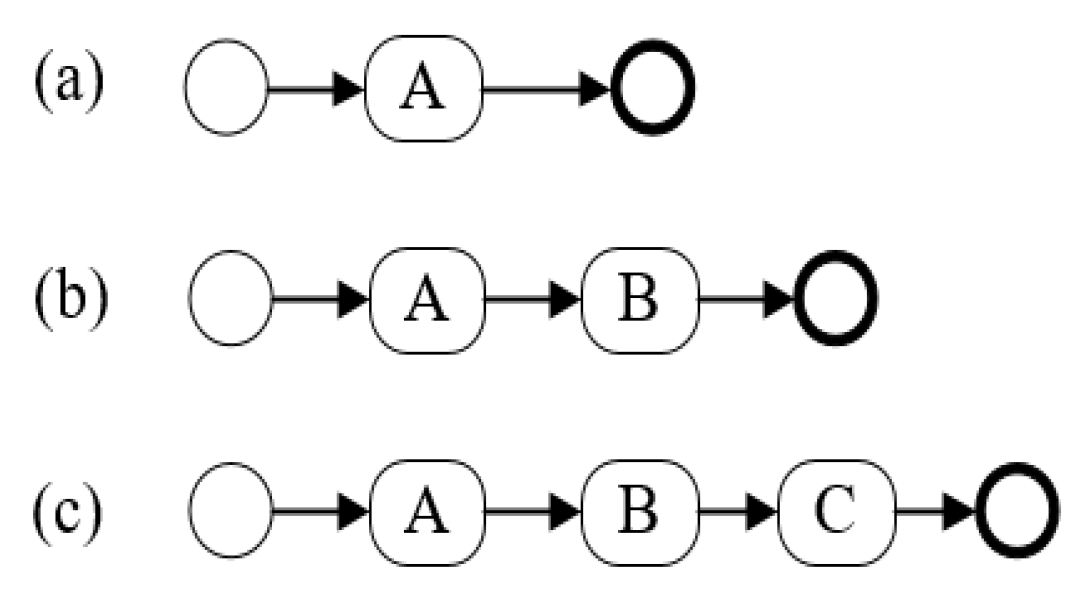
| 1 | This group is intended to show the effect of adding new elements on the process model complexity. | In the first case, as shown in Figure 10, process models b and c are obtained by sequentially adding the activities to the base process model a. | Figure 10 |
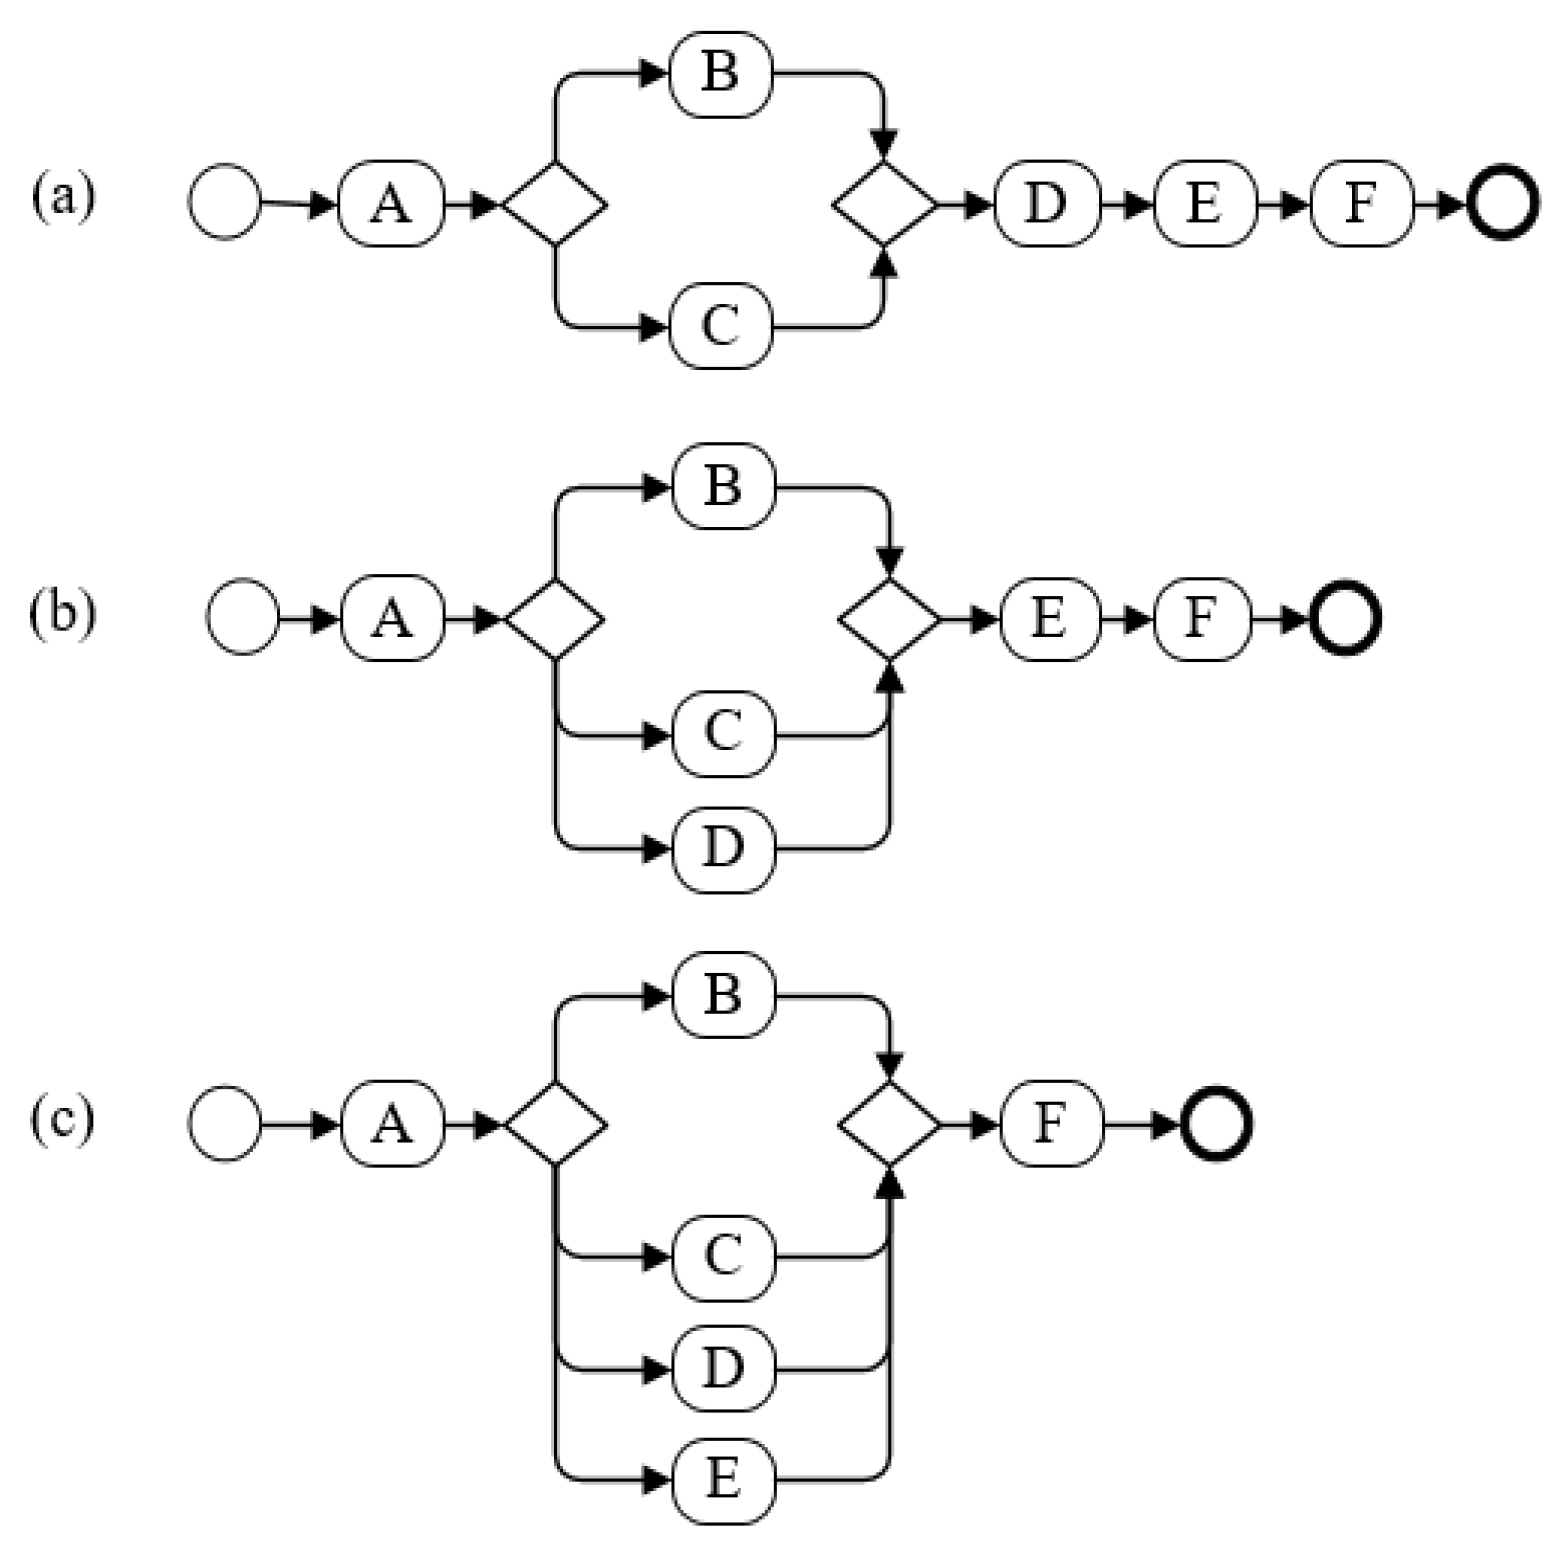
| 2 | This group is intended to show the effect of changes in the number of branches on the complexity of the process model. | In the first case, as shown in Figure 11, process models b and c are obtained by gradually adding activities to the branching structure based on process model a. | Figure 11, Figure 12 and Figure 13 |
| In the second case, as shown in Figure 12, process models b and c are obtained by moving sequential activities to the branching structure based on process model a. | |||
| In the third case, as shown in Figure 13, process models b and c are obtained by changing the positions of activities in the branching structure based on process model a. | |||
| 3 | This group is intended to show the effect of shifting branching locations on the business process complexity. | As shown in Figure 14, process models b and c are obtained by shifting the branching structure based on process model a. | Figure 14 |
| 4 | This group is intended to show the effect of changes in the number of activities on the branch structure on the process model complexity. | In the first case, as shown in Figure 15, process models b and c are obtained by gradually adding new activities to the branching structure based on process model a. | Figure 15 and Figure 16 |
| In the second case, as shown in Figure 16, process models b and c are obtained by gradually moving the sequential activities to the branching structure based on process model a. | |||
| 5 | This group is intended to show the effect of changing the location of activities on the branches on the business process complexity. | As shown in Figure 17, process models b and c are obtained by changing the positions of activities in the branching structure based on process model a. | Figure 17 |
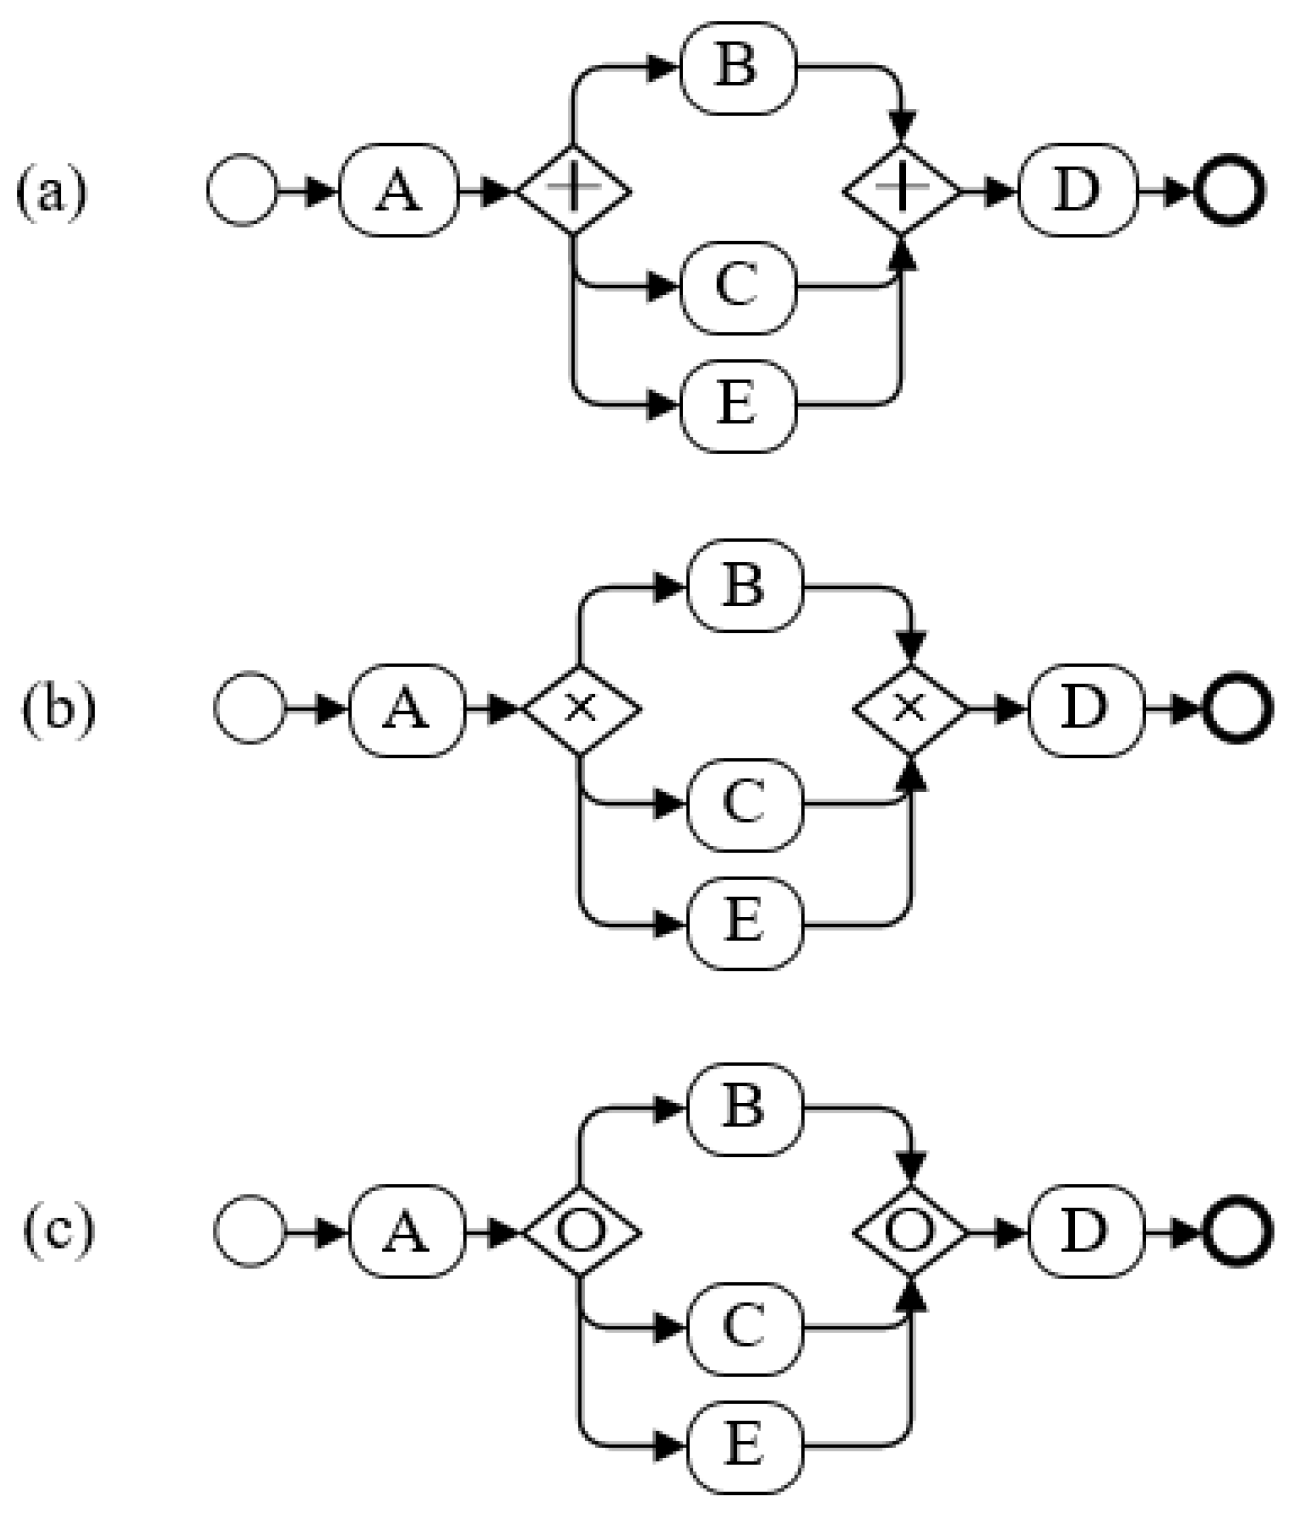
| 6 | This group is intended to show the effect of the change of branch logic type on the process model complexity. | As shown in Figure 18, process models b and c are obtained by changing the branch logic type based on process model a. | Figure 18 |
| 7 | This group is intended to show the effect of exchanging the branch logic type on the process model complexity. | As illustrated in Figure 19, process models b and c are obtained by exchanging the branch logic types based on process model a. | Figure 19 |
| 8 | This group is intended to show the effect of changing the connection forms between the branching structures on the process model complexity. | As shown in Figure 20, process models b and c are obtained by changing the connection form between branching structures based on process model a. | Figure 20 |
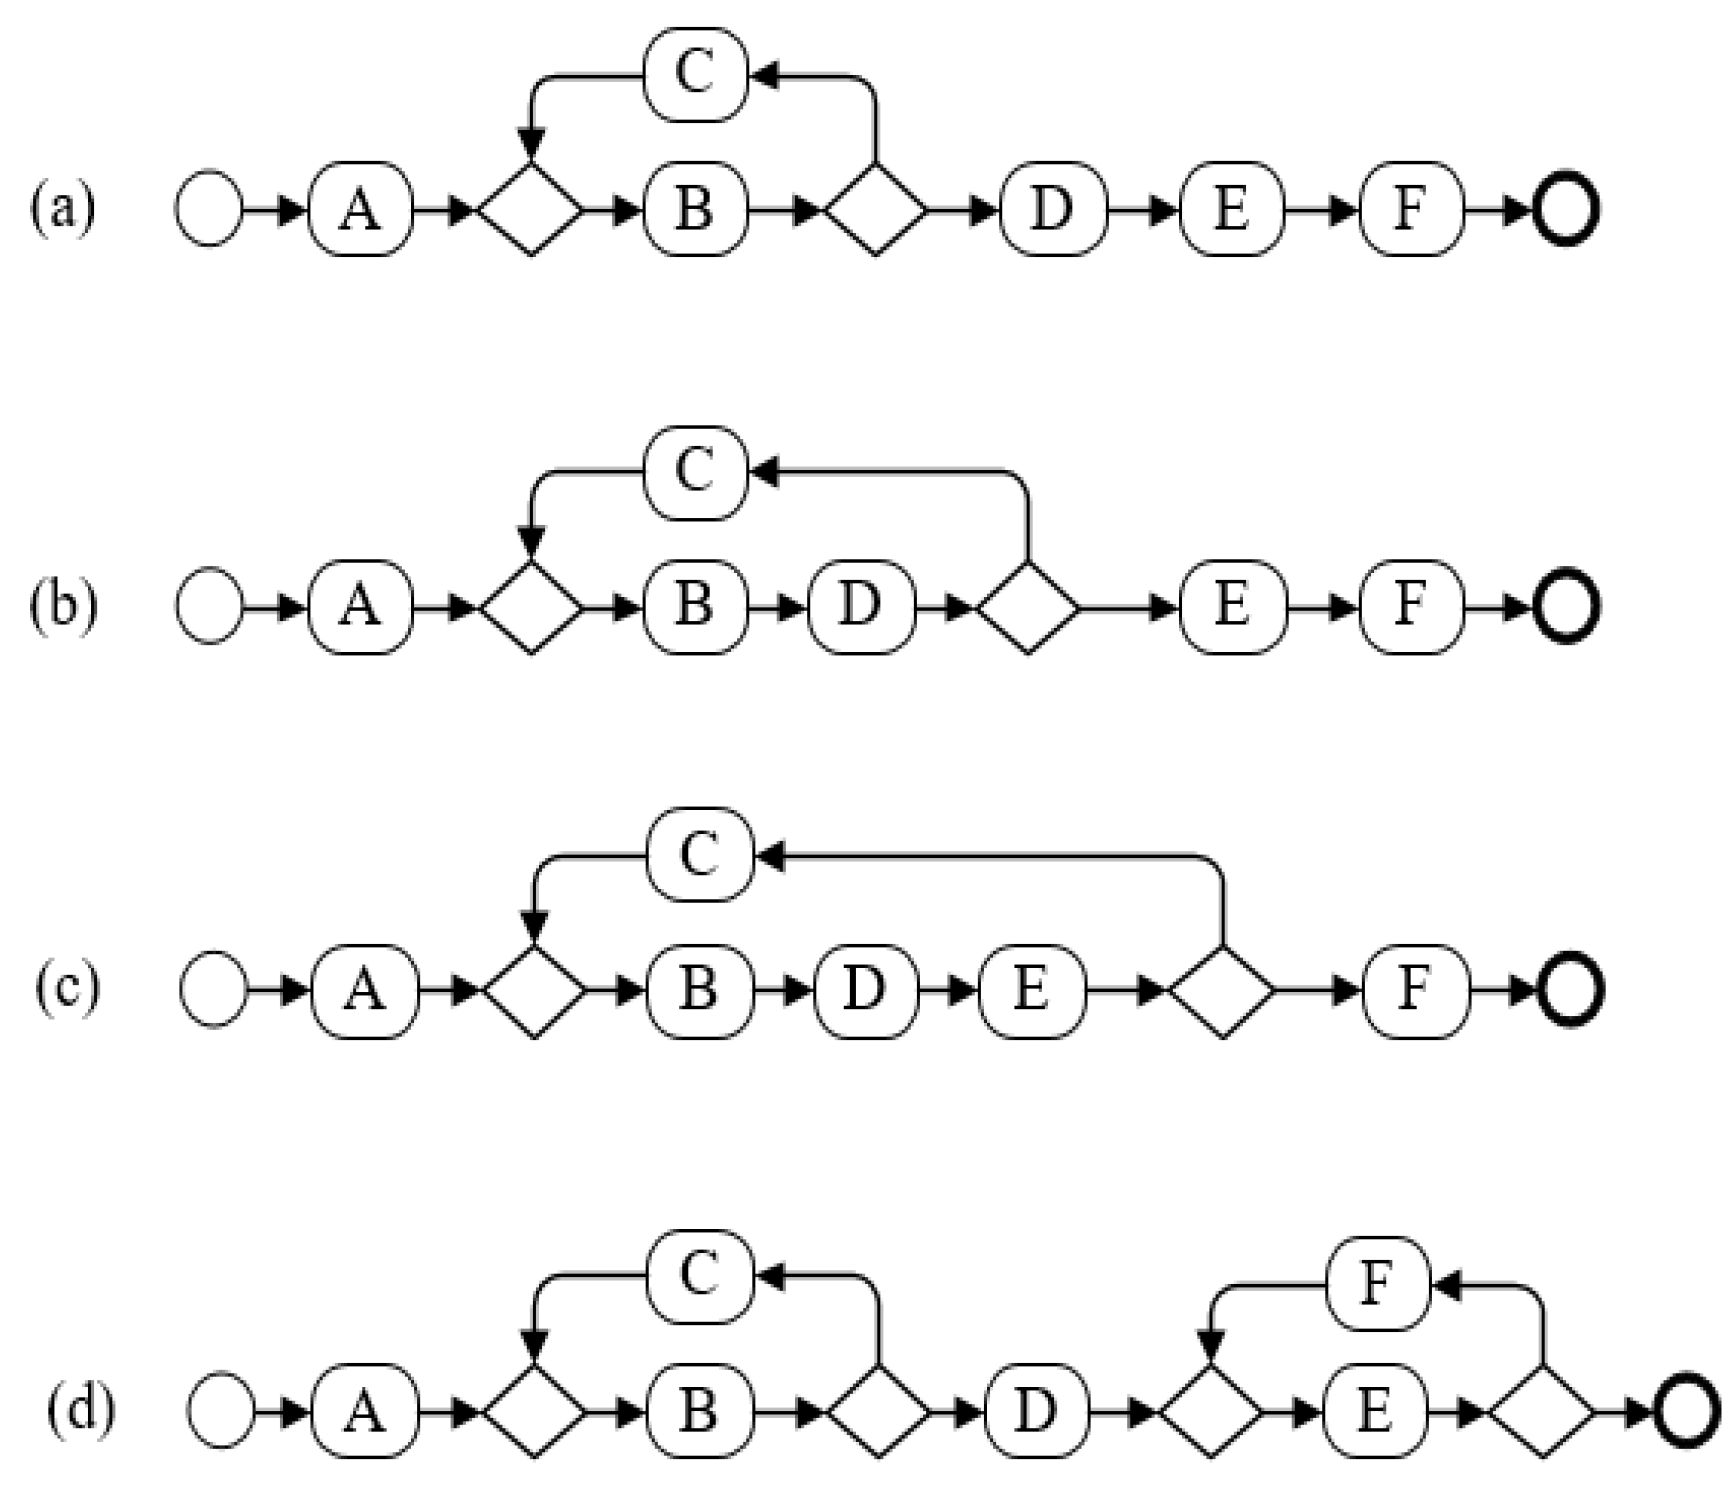
| 9 | This group is intended to show the effect of changing the number of cycles and activities in the loop on the process model complexity. | As shown in Figure 21, process models b, c, and d are obtained by changing the number of activities in the loop and the number of loops based on process model a. | Figure 21 |
5.2. Experiment Data
5.3. Theoretical Validation
- Property 1: (∃P) (∃Q) (|P|≠|Q|). There exist two distinct processes of P and Q, which are not of the same complexity. This property requires that the measure can distinguish at least two different complexity process models, meaning that all process models cannot be considered the same complexity. The CP can differentiate the complexity of the different process models. As shown in Table 3, the results of the complexity measurements of CPs are not the same. Therefore, the CP satisfies property 1.
- Property 2: Let c be a non-negative number. Then there are only finite processes for which |P| = c. This property requires that the result of the complexity measurement must be non-negative. As shown in Table 3, the measurement values of CPs are positive for different process models. Therefore, the CP satisfies Property 2.
- Property 3: There are distinct processes P and Q such that |P| = |Q|. There exist distinct process models P and Q, and their complexity measurements are equal. This property requires that different process models can have the same complexity. As shown in Table 3, the CP measure yields the same complexity for different process models Figure 13a–c. Therefore, the CP satisfies property 3.
- Property 4: (∃P) (∃Q) (P ≡ Q & |P| ≠ |Q|). There exist two process models P and Q with the same function but different structural designs, such that their complexity measurements are not equal. This property requires that the complexity measurement method can distinguish between two process models with the same functionality but different structural designs. The CP describes a process model complexity by analyzing the complexity of its structural design. Thus, the CP can distinguish between two process models with the same functionality but different structural designs. Therefore, the CP satisfies this property.
- Property 5: (∀P) (∀Q); (|P| ≤ |P; Q| &|Q| ≤ |P; Q|). For any two process models P and Q, if they are combined to form a new process model, then the complexity of the combined process model is not less than the complexity of each process model. When two process models are combined in sequence to form a new process model, the CP describes the complexity of the combined process model as the sum of the complexities of the two individual process models. Therefore, the CP satisfies property 5.
- Property 6:a. (∃P) (∃Q) (∃R) (|P| = |Q| & |P; R| ≠ |Q; R|);b. (∃P) (∃Q) (∃R) (|P| = |Q| & | R; P| ≠ |R; Q|)
- Two processes P and Q with the same complexity are combined with process R in the same way to form a new process. The measure can distinguish the complexity of the two process models obtained after composition. When P and Q are sequentially connected to R to form a new process, the CP measures that the complexity of the two resulting process models is the same, meaning that it is impossible to distinguish between the complexity of the two combined process models. Therefore, the CP does not satisfy this property.
- Property 7: If Q is formed by permuting the order of the activities of P, then the complexity of P and Q may be different, |P|≠|Q|. Changes to the position of elements in the process (such as activities) may affect the complexity of the process model. As shown in Table 3, the complexity values of the process models Figure 15a,b change as the positions of the activities are altered. Therefore, the CP satisfies this property.
- Property 8: If P is a renaming of Q, then |P| = |Q|. Changing the names of the components of a process model does not affect its complexity. This property requires that renaming the activity or any other structural components of a model should not change the complexity. The CP describes the complexity of a process model based on its structure, and the measurement results are not affected by changes in the structure’s names. Therefore, the CP satisfies the property.
- Property 9: (∃P) (∃Q); (|P| + |Q| < |P; Q|). There are two processes P and Q, whose complexity when combined into a process model is greater than the sum of the complexities of each process model. This means that the complexity of a whole process model is at least equal to the sum of the complexities of all its local components. When two processes are combined by nesting, the CP describes their complexity to be greater than the sum of their complexities. Therefore, the CP satisfies property 9.
6. Results and Discussion
- Group 1: Adding new elements to the process model
- Group 2: Adding branches to the process model
- Group 3: Shifting the location of the branching structure
- Group 4, 5, 7: Changing the number of activities, activity position, and exchanging branch logic type
- Group 6: Changing the logic type of the branching structure
- Group 8: Changing the connection form between the branching structures
- Group 9: Changing the number of loop nodes and loop in the process model
7. Conclusions
Author Contributions
Funding
Data Availability Statement
Conflicts of Interest
References
- Munoz-Gama, J.; Martin, N.; Fernandez-Llatas, C.; Johnson, O.A.; Sepúlveda, M.; Helm, E.; Zerbato, F. Process mining for healthcare: Characteristics and challenges. J. Biomed. Inform. 2022, 127, 103994. [Google Scholar] [CrossRef] [PubMed]
- Luo, X.; Cao, D.; Tjahjono, B.; Adegbile, A. Business model innovation themes of emerging market enterprises: Evidence in China. J. Bus. Res. 2022, 139, 1619–1630. [Google Scholar] [CrossRef]
- Bag, S.; Wood, L.C.; Mangla, S.K.; Luthra, S. Procurement 4.0 and its implications on business process performance in a circular economy. Resour. Conserv. Recy. 2020, 152, 104502. [Google Scholar] [CrossRef]
- Beerepoot, I.; Di Ciccio, C.; Reijers, H.A.; Rinderle-Ma, S.; Bandara, W.; Burattin, A.; Zerbato, F. The biggest business process management problems to solve before we die. Comput. Ind. 2023, 146, 103837. [Google Scholar] [CrossRef]
- Han, D.; Tian, Y. Analysis and application of transition systems based on petri nets and relation matrices to business process management. Math. Probl. Eng. 2020, 2020, 1–18. [Google Scholar] [CrossRef]
- Wang, S.; Liu, X. Development of EPC model in Chinese public projects: Evolutionary game among stakeholders. J. Asian. Archit. Build. 2022, 21, 2095–2113. [Google Scholar] [CrossRef]
- Choudhary, R.; Riaz, N. A business process re-engineering approach to transform business process simulation to BPMN model. PLoS ONE 2023, 18, e0277217. [Google Scholar] [CrossRef]
- Cardoso, J. Business process control-flow complexity: Metric, evaluation, and validation. Int. J. Web. Serv. Res. 2008, 5, 49–76. [Google Scholar] [CrossRef]
- Mendling, J.; Neumann, G.; Van Der Aalst, W. Understanding the occurrence of errors in process models based on metrics. Lect. Notes Comput. Sci. 2007, 4803, 113–130. [Google Scholar]
- Zhao, W.D.; Sun, Y.M. Business processes complexity based on resource dynamic efficiency perspective. Comput. Integr. Manuf. Syst. 2013, 19, 3202–3209. [Google Scholar]
- Gruhn, V.; Laue, R. Adopting the cognitive complexity measure for business process models. In Proceedings of the 2006 5th IEEE International Conference on Cognitive Informatics, Beijing, China, 17–19 July 2006; pp. 236–241. [Google Scholar]
- Moattar, H.; Bandara, W.; Kannengiesser, U.; Rosemann, M. Control flow versus communication: Comparing two approaches to process modelling. Bus. Process. Manag. J. 2022, 28, 372–397. [Google Scholar] [CrossRef]
- Weyuker, E.J. Evaluating software complexity measures. IEEE. Trans. Softw. Eng. 1988, 14, 1357–1365. [Google Scholar] [CrossRef]
- Ayech, H.B.H.; Ghannouchi, S.A.; Amor, E.A.E.H. Extension of the BPM lifecycle to promote the maintainability of BPMN models. Procedia Comput. Sci. 2021, 181, 852–860. [Google Scholar] [CrossRef]
- Fındık-Coşkunçay, D.; Çakır, M.P. An investigation of the relationship between joint visual attention and product quality in collaborative business process modeling: A dual eye-tracking study. Softw. Syst. Model. 2022, 21, 2429–2460. [Google Scholar] [CrossRef]
- Jošt, G.; Huber, J.; Heričko, M.; Polančič, G. Improving cognitive effectiveness of business process diagrams with opacity-driven graphical highlights. Decis. Support Syst. 2017, 103, 58–69. [Google Scholar] [CrossRef]
- Yaqin, M.A.; Sarno, R.; Fauzan, A.C. Scalability measurement of a business process model using business processes similarity and complexity. In Proceedings of the 2017 4th International Conference on Electrical Engineering, Computer Science and Informatics (EECSI), Yogyakarta, Indonesia, 19–21 September 2017; pp. 1–7. [Google Scholar]
- Polančič, G.; Cegnar, B. Complexity metrics for process models–A systematic literature review. Comput. Stand. Inter. 2017, 51, 104–117. [Google Scholar] [CrossRef]
- Yaqin, M.A.; Sarno, R.; Rochimah, S. Measuring scalable business process model complexity based on basic control structure. Int. J. Intell. Eng. Inf. 2020, 13, 52–65. [Google Scholar] [CrossRef]
- Schffer, E.; Stiehl, V.; Schwab, P.K.; Mayr, A.; Franke, J. Process-driven approach within the engineering domain by combining business process model and notation (bpmn) with process engines. Procedia CIRP 2021, 96, 207–212. [Google Scholar] [CrossRef]
- Bazhenova, E.; Zerbato, F.; Oliboni, B.; Weske, M. From BPMN process models to DMN decision models. Inform. Syst. 2019, 83, 69–88. [Google Scholar] [CrossRef]
- Tsakalidis, G.; Vergidis, K.; Kougka, G.; Gounaris, A. Eligibility of BPMN models for business process redesign. Information 2019, 10, 225. [Google Scholar] [CrossRef]
- Guizani, K.; Ghannouchi, S.A. An approach for selecting a business process modeling language that best meets the requirements of a modeler. Procedia Comput. Sci. 2021, 181, 843–851. [Google Scholar] [CrossRef]
- Wang, Y. On the Big-R Notation for Describing Interactive and Recursive Behaviors. Int. J. Cogn. Inform. Nat. Intell. 2008, 2, 17–28. [Google Scholar] [CrossRef]
- Crasso, M.; Mateos, C.; Zunino, A.; Misra, S.; Polvorin, P. Assessing cognitive complexity in java-based object-oriented systems: Metrics and tool support. Comput. Inform. 2016, 35, 497–527. [Google Scholar]
- Guo, L.; Vardakis, J.C.; Lassila, T.; Mitolo, M. Subject-specific multi-poroelastic model for exploring the risk factors associated with the early stages of Alzheimer’s disease. Interface Focus 2018, 8, 20170019. [Google Scholar] [CrossRef] [PubMed]
- De Haas, H. A theory of migration: The aspirations-capabilities framework. Comp. Migr. Stud. 2021, 9, 1–35. [Google Scholar] [CrossRef]
- Amyot, D.; Akhigbe, O.; Baslyman, M. Combining Goal modelling with Business Process modelling: Two Decades of Experience with the User Requirements Notation Standard. Enterp. Model. Inf. 2022, 17, 1–38. [Google Scholar]
- Lăcătușu, M.; Ionita, A.D.; Anton, F.D.; Lăcătușu, F. Analysis of complexity and performance for automated deployment of a software environment into the cloud. Appl. Sci. 2022, 12, 4183. [Google Scholar] [CrossRef]
- Sungkono, K.R.; Sarno, R.; Amadea, F.D.; Irbah, A.F. Graph-Based Process Model Discovery for Mining Invisible Non-Prime Tasks in Hybrid Choice-Parallel Relationships. Int. J. Intell. Eng. Inf. Syst. 2021, 14, 425–434. [Google Scholar] [CrossRef]
- Aysolmaz, B.; Schunselaar, D.M.; Reijers, H.A.; Yaldiz, A. Selecting a process variant modeling approach: Guidelines and application. Softw. Syst. Model. 2019, 18, 1155–1178. [Google Scholar] [CrossRef]
- Anderson, M.H.; Sun, P.Y. Reviewing leadership styles: Overlaps and the need for a new ‘full-range’theory. Int. J. Manag. Rev. 2017, 19, 76–96. [Google Scholar] [CrossRef]
- Harb, A.; Trad, M. Assessing the Impact of Supply Chain Management Processes on the Lebanese Industry of Goods and Services During Times of Uncertainty. Arab. Econ. Bus. J. 2023, 15, 7. [Google Scholar] [CrossRef]
- Pereira, T.; Kennedy, J.V.; Potgieter, J. A comparison of traditional manufacturing vs additive manufacturing, the best method for the job. Procedia Manuf. 2019, 30, 11–18. [Google Scholar] [CrossRef]


| Control Structure | Weight | Source |
|---|---|---|
| Sequence | 1 | [11] |
| Parallel Split (AND) | 4 | |
| Exclusive Choice (XOR) | 3 | |
| Multiple Choice (OR) | 7 | |
| Looping (Cyclic) | 3 | [19] |
| Process Models | CP | YC | CFC | CADAC | Scale | CW |
|---|---|---|---|---|---|---|
| AND/XOR/OR | AND/XOR/OR | AND/XOR/OR | AND/XOR/OR | AND/XOR/OR | AND/XOR/OR | |
| Figure 10a | 3.00 | 19.00 | 0 | 21 | 0 | 1 |
| Figure 10b | 4.00 | 21.00 | 0 | 23 | 0 | 1 |
| Figure 10c | 5.00 | 23.00 | 0 | 25 | 0 | 1 |
| Figure 11a | 12.00/10.00/13.33 | 45.00/43.00/51.00 | 1/2/3 | 48/46/51 | 16/32/48 | 5/4/8 |
| Figure 11b | 29.00/14.00/17.00 | 65.40/50.40/104.40 | 1/3/7 | 51/49/54 | 19/57/133 | 5/4/8 |
| Figure 11c | 102.00/18.00/23.73 | 141.33/57.33/325.33 | 1/4/15 | 54/52/57 | 22/88/130 | 5/4/8 |
| Figure 12a | 14.00/12.00/15.33 | 46.67/44.67/52.67 | 1/2/3 | 52/50/55 | 20/40/60 | 5/4/8 |
| Figure 12b | 29.00/14.00/17.00 | 66.00/51.00/105.00 | 1/3/7 | 48/46/51 | 21/63/147 | 5/4/8 |
| Figure 12c | 100.00/16.00/21.73 | 141.33/57.33/325.33 | 1/4/15 | 51/49/54 | 22/88/330 | 5/4/8 |
| Figure 13a | 24.00/10.00/20.33 | 54.00/52.00/60.00 | 1/2/3 | 54/52/57 | 22/44/66 | 5/4/8 |
| Figure 13b | 84.00/13.00/30.00 | 71.00/56.00/110.00 | 1/3/7 | 55/53/58 | 23/69/161 | 5/4/8 |
| Figure 13c | 244.00/16.00/38.53 | 144.00/60.00/328.00 | 1/4/15 | 56/54/59 | 24/96/360 | 5/4/8 |
| Figure 14a | 30.00/15.00/18.00 | 46.67/31.67/85.67 | 1/3/7 | 52/50/55 | 20/60/140 | 5/4/8 |
| Figure 14b | 30.00/15.00/18.00 | 46.67/31.67/85.67 | 1/3/7 | 52/50/55 | 20/60/140 | 5/4/8 |
| Figure 14c | 30.00/15.00/18.00 | 46.67/31.67/85.67 | 1/3/7 | 52/50/55 | 20/60/140 | 5/4/8 |
| Figure 15a | 12.00/10.00/13.33 | 45.00/43.00/51.00 | 1/2/3 | 48/46/51 | 16/32/48 | 5/4/8 |
| Figure 15b | 17.00/11.00/16.67 | 49.40/47.40/55.40 | 1/2/3 | 50/48/53 | 18/36/54 | 5/4/8 |
| Figure 15c | 30.00/12.00/24.67 | 51.33/49.33/57.33 | 1/2/3 | 52/50/55 | 20/40/60 | 5/4/8 |
| Figure 16a | 14.00/12.00/15.33 | 46.67/44.67/52.67 | 1/2/3 | 52/50/55 | 20/40/60 | 5/4/8 |
| Figure 16b | 17.00/11.00/16.67 | 46.67/44.67/52.67 | 1/2/3 | 52/50/55 | 20/40/60 | 5/4/8 |
| Figure 16c | 28.00/10.00/22.67 | 46.67/44.67/52.67 | 1/2/3 | 52/50/55 | 20/40/60 | 5/4/8 |
| Figure 17a | 124.00/13.00/40.00 | 73.50/58.50/112.50 | 1/3/7 | 57/55/60 | 25/75/175 | 5/4/8 |
| Figure 17b | 244.00/13.00/70.00 | 73.50/58.50/112.50 | 1/3/7 | 57/55/60 | 25/75/175 | 5/4/8 |
| Figure 17c | 364.00/13.00/100.00 | 73.50/58.50/112.50 | 1/3/7 | 57/55/60 | 25/75/175 | 5/4/8 |
| Figure 18a | 28.00 | 65.40 | 1 | 51 | 19 | 5 |
| Figure 18b | 13.00 | 40.50 | 3 | 49 | 57 | 4 |
| Figure 18c | 4.00 | 104.50 | 7 | 54 | 133 | 8 |
| Figure 19a | 372.00 | 93.50 | 6 | 85 | 204 | 15 |
| Figure 19b | 108.00 | 93.50 | 6 | 85 | 204 | 15 |
| Figure 19c | 4.00 | 93.50 | 6 | 85 | 204 | 15 |
| Figure 20a | 21.00/17.00/23.67 | 65.00/61.00/77.00 | 2/4/6 | 61/57/67 | 54/108/162 | 9/7/15 |
| Figure 20b | 101.00/41.00/113.89 | 69.00/65.00/81.00 | 2/4/6 | 75/71/81 | 54/108/162 | 9/7/15 |
| Figure 20c | 196.00/40.00/178.22 | 71.00/67.00/83.00 | 2/4/6 | 75/71/81 | 54/108/162 | 9/7/15 |
| Figure 21a | 7.20/7.20/7.20 | 39.42/39.42/39.42 | 1/2/3 | 48/46/51 | 20/40/60 | 4/4/4 |
| Figure 21b | 6.50/6.50/6.50 | 42.13/42.13/42.13 | 1/2/3 | 48/46/51 | 20/40/60 | 4/4/4 |
| Figure 21c | 5.80/5.80/5.80 | 44.83/44.83/44.83 | 1/2/3 | 48/46/51 | 20/40/60 | 4/4/4 |
| Figure 21d | 6.75/6.75/6.75 | 47.50/47.50/47.50 | 2/4/6 | 51/47/57 | 50/100/150 | 7/7/7 |
| Properties | CP | YC | Scale | CADAC | CFC | CW |
|---|---|---|---|---|---|---|
| 1 | √ | √ | √ | √ | √ | √ |
| 2 | √ | √ | √ | √ | × | √ |
| 3 | √ | √ | √ | √ | √ | √ |
| 4 | √ | √ | √ | √ | √ | √ |
| 5 | √ | √ | √ | √ | √ | √ |
| 6 | × | × | × | × | × | × |
| 7 | √ | √ | × | × | √ | √ |
| 8 | √ | √ | √ | √ | √ | √ |
| 9 | √ | √ | √ | √ | √ | √ |
| Groups | CP | YC | Scale | CADAC | CFC | CW |
|---|---|---|---|---|---|---|
| 1 | √ | √ | × | √ | × | × |
| 2 | √ | √ | √ | √ | × | × |
| 3 | × | × | × | × | × | × |
| 4 | √ | √ | × | × | × | × |
| 5 | √ | × | × | × | × | × |
| 6 | √ | √ | √ | √ | √ | √ |
| 7 | √ | × | × | × | × | × |
| 8 | √ | √ | × | √ | × | × |
| 9 | √ | √ | × | × | × | × |
Disclaimer/Publisher’s Note: The statements, opinions and data contained in all publications are solely those of the individual author(s) and contributor(s) and not of MDPI and/or the editor(s). MDPI and/or the editor(s) disclaim responsibility for any injury to people or property resulting from any ideas, methods, instructions or products referred to in the content. |
© 2023 by the authors. Licensee MDPI, Basel, Switzerland. This article is an open access article distributed under the terms and conditions of the Creative Commons Attribution (CC BY) license (https://creativecommons.org/licenses/by/4.0/).
Share and Cite
Zhou, C.; Zhang, D.; Chen, D.; Liu, C. A Change-Sensitive Complexity Measurement for Business Process Models Based on Control Structure. Systems 2023, 11, 250. https://doi.org/10.3390/systems11050250
Zhou C, Zhang D, Chen D, Liu C. A Change-Sensitive Complexity Measurement for Business Process Models Based on Control Structure. Systems. 2023; 11(5):250. https://doi.org/10.3390/systems11050250
Chicago/Turabian StyleZhou, Changhong, Dengliang Zhang, Deyan Chen, and Cong Liu. 2023. "A Change-Sensitive Complexity Measurement for Business Process Models Based on Control Structure" Systems 11, no. 5: 250. https://doi.org/10.3390/systems11050250
APA StyleZhou, C., Zhang, D., Chen, D., & Liu, C. (2023). A Change-Sensitive Complexity Measurement for Business Process Models Based on Control Structure. Systems, 11(5), 250. https://doi.org/10.3390/systems11050250