

Decision-Making Models and Coordination in a Closed-Loop Supply Chain Considering Patent Protection for DfR

1
School of Modern Posts, Chongqing University of Posts and Telecommunications, Chongqing 400065, China
2
International College, Krirk University, Bangkok 10220, Thailand
*
Author to whom correspondence should be addressed.
Systems 2023, 11(3), 127; https://doi.org/10.3390/systems11030127
Submission received: 28 December 2022
/
Revised: 23 February 2023
/
Accepted: 23 February 2023
/
Published: 27 February 2023
(This article belongs to the Special Issue System Dynamics Modeling for Green Supply Chain Management)
Abstract
:With improvement in consumers’ environmental awareness and the level of design for remanufacturing (DfR), the traditional supply chain is gradually changing into a closed-loop supply chain (CLSC). However, a high level of remanufacturing design will increase design costs for manufacturers, while also reducing the cost for remanufacturers. Moreover, manufacturers usually use patent barriers to restrict the development of remanufacturers. The main aims of this study were to explore how manufacturers and remanufacturers can benefit each other, taking into account patent protection and carbon emissions. Firstly, we adopted game theory to establish four decision-making models of the manufacturer and remanufacturer regarding DfR. Secondly, we designed a cost-sharing contract for DfR based on the decentralized decision-making model to coordinate a CLSC. The results of this study showed that under the patent-protected market environment, DfR increased the manufacturer’s profit but did not necessarily promote the remanufacturer’s profit growth. A cost-sharing contract can effectively achieve improvements in the presence of DfR, increase profits for both parties, and improve the economic and environmental benefits of the CLSC.
1. Introduction
In recent years, due to the rapid growth in demand for material consumption, resource shortages and environmental pollution have become increasingly serious issues. In addition, an increasing number of countries and international organizations have recognized the importance of energy saving and reducing polluting emissions in sustainable remanufacturing [1,2]. Remanufacturing is a key link in closed-loop supply chains (CLSCs). It effectively reduces the demand for resources and improves the utilization rate of waste products, thus reducing pollution in the environment from waste. This is of great significance in achieving green, low-carbon, and sustainable development. Many independent third-party remanufacturers in the market, such as Recycle Assist (RA) companies and Repeat-O-Type companies, have access to more professional technology and equipment, and they can provide recycling and remanufacturing services for numerous enterprises, thus forming a scale effect. Approximately 90% of the recycling volume in the market is remanufactured by them, and third-party remanufacturers have become the main force in the remanufacturing industry [3]. Due to the existence of a large number of independent remanufacturers in the market, DfR reduces the cost of remanufacturing but greatly increases the design and production costs of manufacturers, resulting in the phenomenon of “free-riding” by remanufacturers. As a result, manufacturers are reluctant to implement high-level DfR and tend to pursue only the minimum government-required level, or even false DfR. In addition, with the increasing awareness of the need for intellectual property protection, manufacturers tend to set up patent barriers to restrain remanufacturers, which also limits the development of remanufacturing.
To further explore the impact of a closed-loop supply chain on the decision-making of manufacturers and remanufacturers, scholars have shifted the focus of their research to patent protection. A number of scholars have proposed that the supplier holding the patent should calculate the intellectual property licensing fees, either as a percentage of the sales prices of its manufactured products (i.e., a product-based strategy) or as a percentage of the wholesale price of its components (i.e., a component-based strategy) [4,5]. In addition, some scholars have studied the various models that arise when manufacturers license the patents of DfR to different parties, such as the manufacturer assuming the responsibility for remanufacturing, the manufacturer authorizing distributors to remanufacture, or the manufacturer authorizing third parties to remanufacture [6,7]. To date, there have been many studies regarding CLSCs, but most of them have focused on the model of the patent license fee or the forms of patent assignment. Few scholars have focused on the coordination of CLSCs considering patent protection under DfR. The following questions, therefore, remain unanswered: How can the conflict between manufacturers and remanufacturers be effectively resolved while improving DfR? How should DfR affect the decisions of both parties in a patent-protected market environment? How should coordination mechanisms be developed to improve the economic and environmental performance of a closed-loop supply chain in the context of DfR?
The questions mentioned above have been addressed by this study. Firstly, we established a closed-loop supply chain game model consisting of manufacturers and remanufacturers in a patent-protected market environment. This specifically included building a closed-loop supply chain game model with decentralized decision-making without DfR, decentralized decision-making with DfR, centralized decision-making, and coordinated decision-making. Moreover, we solved the model and analyzed the impact of remanufacturing design on the decision-making of both parties. Secondly, this study introduced a DfR cost-sharing contract to coordinate a closed-loop supply chain, solving the equilibrium solution under cost-sharing contract coordination and comparing the equilibrium results prior to its implementation. After the coordination of the cost-sharing contract, we then tested the effect of the contract coordination.
This paper is organized as follows: Section 2 presents a literature review undertaken to provide a comprehensive analysis of previous studies. Section 3 describes and assumes the supply chain models and symbols. Section 4 establishes a closed-loop supply chain game model consisting of manufacturers and remanufacturers in the market environment of patent protection and then introduces a DfR cost-sharing contract to coordinate the closed-loop supply chain. Section 5 carries on the numerical example analysis to the model result to provide further enlightenment related to management. Section 6 provides the conclusion of the study and future directions, and Section 7 concludes the paper.
2. Literature Review
2.1. Overview of a Closed-Loop Supply Chain
With the emphasis of the global society on environmental protection and sustainable development, an increasing number of scholars have become devoted to research on closed-loop supply chains (CLSC). As a result, the literature on this topic is relatively abundant. Regarding the concept of a closed-loop supply chain, as early as 2003, Fleischmann [8] first proposed the definition as the reverse logistics of recycling and DfR relating to waste products in a traditional forward supply chain system. Later, Van and Guide [9] proposed that a CLSC is a closed-loop system composed of forward and reverse supply chains, which has become a more authoritative definition recognized by the academic community today. Ferguson and Toktay [10] analyzed the competition between new products and remanufactured products produced by monopoly manufacturers and identified the boundary conditions for manufacturers to remanufacture themselves. Furthermore, they proposed remanufacturing and preemptive recycling to prevent profit losses for manufacturers due to external remanufacturing. Orsdemir et al. [11] constructed a game model between manufacturers and remanufacturers. They found that when the original manufacturer had a stronger competitive position, they were more inclined to change the quality design of the new product to restrict remanufacturing. On the other hand, when the original manufacturer had a weaker competitive position, they were more inclined to restrict the quantity of the new product. Wu and Zhou [12] studied manufacturers’ recycling strategies from a competitive perspective and found that manufacturers recycled their used products more effectively than retailers. Huang et al. [13] developed a two-cycle, two-oligopoly, closed-loop supply chain game model to explore the production of manufacturers and their pricing strategies in the face of a competitive environment. This model was also extended to multi-cycle and wireless cycle cases. Chai et al. [14] explored the optimal competitive strategy of the original manufacturer in the face of remanufacturer threats and environmental regulation in terms of carbon emission limits and trade policies. They showed that when the carbon emission cap allocated to the original manufacturer was small, it faced an unfavorable position when competing with remanufacturers. Qiao and Su [15] studied the optimal price and quality of new and remanufactured products and discussed the quality adjustment of original manufacturers in the new market segment. They found that, when original manufacturers compete with remanufacturers, the original manufacturers cannot reduce the product quality. Soon et al. [16] used the augmented epsilon constraint (AEC) method, which provided an efficient set of solutions for the decision-making layer of the closed-loop supply chain model.
The above studies examined manufacturer and remanufacturer decision-making problems in closed-loop supply chains from several perspectives. While earlier scholars focused on the pricing decisions of manufacturers and remanufacturers, more recent studies have considered additional external influences, such as carbon emissions, remanufacturing cycles, etc. With reference to the previous research results, this paper also considered the carbon emission factor when building the model.
2.2. The Influence of DfR on a Closed-Loop Supply Chain
Recent research concerning DfR has focused on the methods and influencing factors of DfR and its impact on closed-loop-supply-chain decision-making. Ijomah et al. [17] reviewed the relevant research on DfR, analyzed the technical factors affecting it (including the material, structure, connection method, etc.) in a UK industrial case study, and proposed methods and basic steps for optimizing DfR. Hatcher et al. [18] analyzed problems in the DfR process and conducted a feasibility analysis of DfR. In addition, they further analyzed the case of the UK machinery industry, identified the internal and external factors affecting DfR, and proposed an integrated network model to map the relationship between the factors identified. In addition, some scholars have also considered DfR in the decision-making of closed-loop supply chains. Wu [19] examined manufacturers’ DfR decisions and supply chain members’ competitive pricing strategies and showed that it is effective for manufacturers to respond to the threat of remanufacturers by standardizing their DfR. Subramanian et al. [20] believed that this would be useful in extending other seminal operations and marketing models to account for the different costs and market effects of remanufacturing.
The above literature concerning the impact of DfR on closed-loop supply chain decisions provided inspiration for this study. The aforementioned literature mostly explored how manufacturers can adjust their DfR to cope with the threat of remanufacturers from a competitive perspective. Few scholars have considered how to effectively resolve the conflict between manufacturers and remanufacturers while also improving the level of DfR. This is a pressing issue requiring resolution.
2.3. Patent Protection of DfR
In supply chain studies considering patent protection, most have discussed the use of DfR or patent protection by manufacturers to meet the challenges of remanufacturers from a competitive perspective. Kamien and Tauman [21] compared the models that were most conducive to reducing patent license fees and found that patent owners preferred a per-product royalty model, while patent buyers preferred a lump-sum payment model. Hong et al. [22] explored the effects of fixed patent license models and commission licensing models on recycling and remanufacturing in the context of manufacturers producing both new and remanufactured goods in a Gounod duopoly model. Chen et al. [4] explored the impact of product-based and component-based strategies for patent license fees in a supply chain consisting of a component supplier and two double-oligopolistic manufacturers. Ghosh et al. [23] investigated the impact of a lump-sum unit royalty model and a revenue-sharing royalty model on the decisions of manufacturers and remanufacturers. Zhang and Ren [1] investigated the impact of patent licensing on each decision in a closed-loop supply chain system consisting of manufacturing, retailers, and third-party remanufacturers. Huang and Wang [6] explored the decisions of manufacturers, distributors, and remanufacturers under three different patent licensing models in the context of a demand for information-sharing and found that information-sharing always helps enhance both manufacturer and remanufacturer profits.
The CLSC studies above that have considered patent protection have mostly discussed the use of remanufactured designs or patent protection by manufacturers to meet the challenges of remanufacturers from a competitive perspective.
2.4. The Coordination between Manufacturers and Remanufacturers
Regarding contract coordination, it can mainly be divided into the following three categories: cost-sharing contract coordination, revenue-sharing contract coordination, and two-part contract coordination. Zhou et al. [24] designed a service-cost-sharing contract to address the phenomenon of manufacturers’ online channels piggybacking onto retailers’ presale services. This effectively resolved the conflict between the two parties and improved the service level and overall performance of the supply chain. He et al. [25] established a supply chain system consisting of a carbon emission reduction service provider (SP) and a low-carbon advertising service integrator (SI). Then, they explored the optimal strategies of both parties under three cost-sharing models. Finally, they found that two-way cost-sharing could achieve mutual benefits and win–win situations. Chen et al. [26] studied the remanufacturing process innovations, pricing decisions, and cost-sharing mechanisms of closed-loop supply chains under different power structures and compared the optimal cost-sharing mechanisms of retailers under each model. Wu et al. [27] established a dual-channel reverse supply chain consisting of recycling centers and third-party recyclers, obtained their optimal decisions through decentralized and centralized decision-making, and designed a revenue-sharing contract between recycling centers and recyclers to improve the supply chain. Rezayat et al. [28] introduced a hierarchical revenue-sharing contract in a closed-loop supply chain of waste electronics consisting of coordinated manufacturers, retailers, and recyclers. Jian et al. [29] constructed a centralized and decentralized decision-making model for manufacturers’ equity concerns by considering retailers’ sales efforts. They also designed a profit-sharing pact to coordinate a green closed-loop supply chain. Feng et al. [30] used a two-part pact and a revenue-sharing pact to successfully coordinate a dual-channel, two-level reverse supply chain system consisting of distributors and recyclers. Shi et al. [31] compared the different coordination performances of two-part and reversed revenue-sharing contracts in a closed-loop supply chain system.
In conclusion, a large amount of research exists on DfR and the decision-making and coordination of CLSCs; however, patent protection and environmental performance have received less attention in the models used in the existing research in terms of the impact of DfR on the decision-making of CLSCs. Contractual designs in the context of DfR have not been included in studies on the contractual coordination of closed-loop supply chains to coordinate their economic and environmental benefits. In the study, we investigated a new model of cooperation between manufacturers and remanufacturers in DfR and patent protection, assuming that manufacturers were the dominant market player. We then compared this with the competitive model to explore whether the cooperative model could improve DfR while successfully resolving conflicts between the two parties. To raise the level of DfR and efficiently coordinate the closed-loop supply chain to increase economic and environmental benefits, we also created a contractual mechanism for sharing the cost of DfR.
3. Problem Description
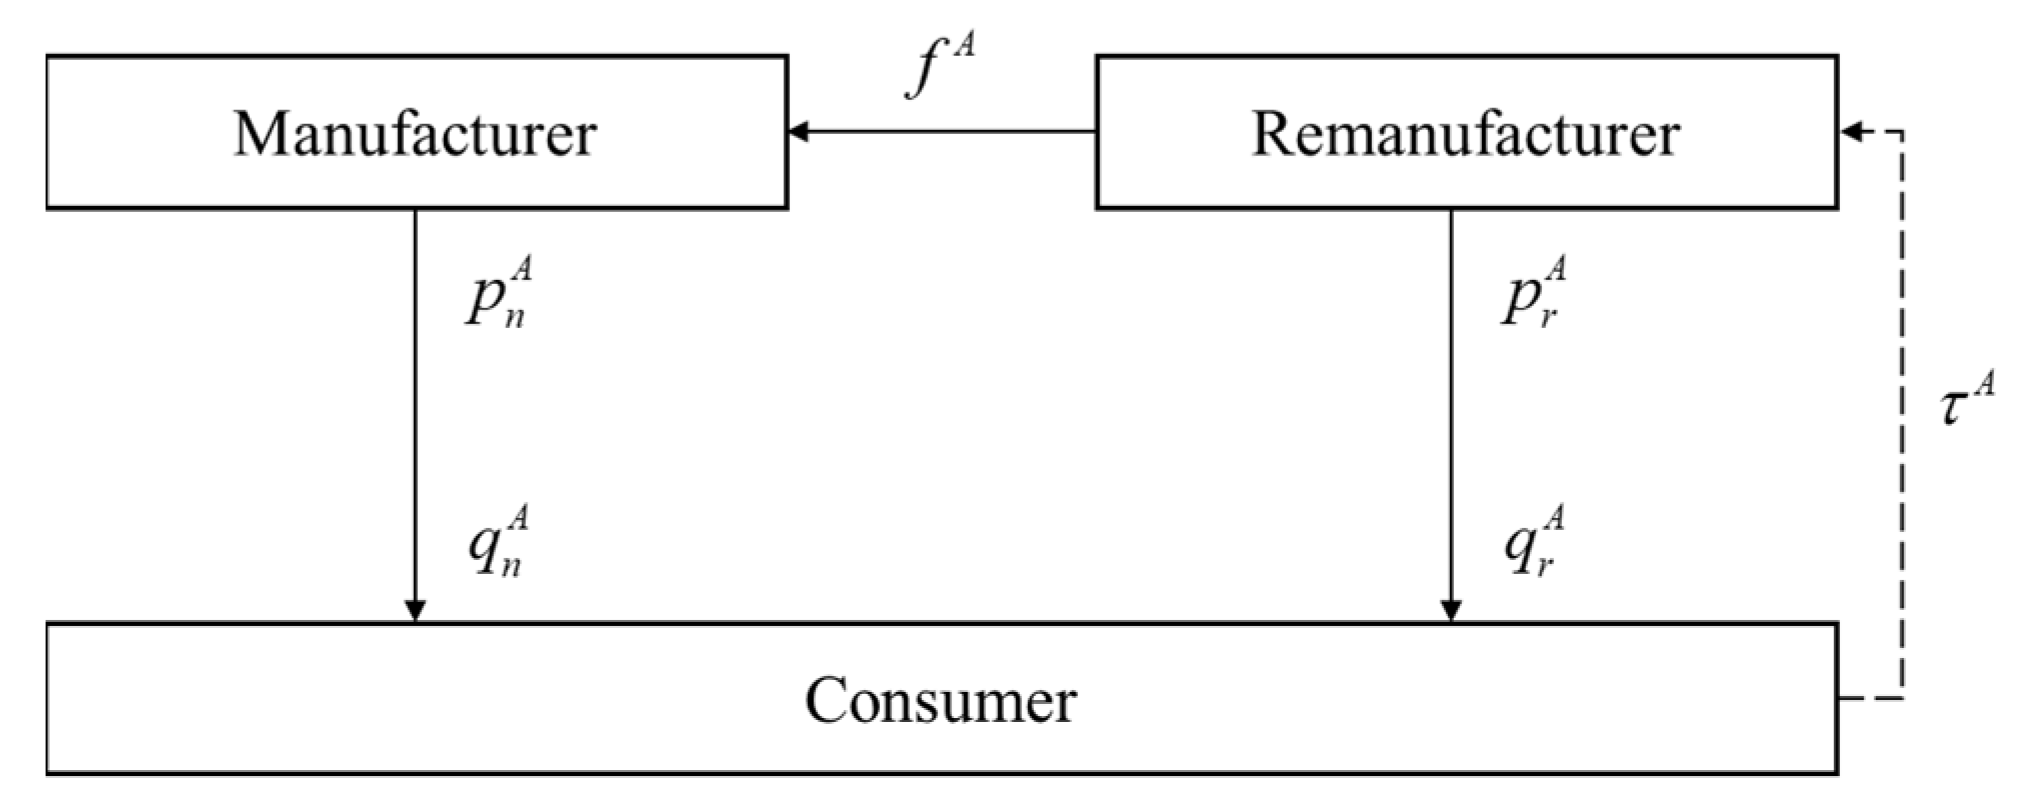
The closed-loop supply chain system considered in this paper consisted of a single manufacturer and a remanufacturer. The remanufacturing models in this paper were divided into four types: A, B, C, and D. These four models are shown in Figure 1, Figure 2, Figure 3 and Figure 4, below. In Model A, the manufacturer does not implement DfR, and the remanufacturer has to pay the patent license fee to the manufacturer before producing and selling the remanufactured product. Model B involves decentralized decision-making. The manufacturer implements DfR and bears the corresponding design cost. In addition, the remanufacturer pays the patent license fee to the manufacturer before producing and selling the remanufactured goods. As an example, businesses such as Sany Heavy Industry (China) and Peterbilt Motors (U.S.) permit remanufacturing enterprises to conduct recycling and remanufacturing through patent authorization [32]. Model C involves centralized decision-making. The manufacturer implements DfR; however, the manufacturer and remanufacturer, as a whole, jointly decide on the level of DfR, the production volume of each product, etc. The remanufacturer does not need to pay royalties to the manufacturer at this time. Model D involves coordinated decision-making. The manufacturer implements DfR and provides the contract. In addition, the remanufacturer remanufactures with an appropriate patent license fee and shares a proportionate share of the cost of DfR. Each member’s profits after coordination are no less than before coordination.
4. Notation and Assumptions
The notation in this paper is illustrated in Table 1, where denotes decentralized decision-making without DfR, decentralized decision-making with DfR, centralized decision-making, and contractual coordination decision-making, respectively.
To facilitate the analysis and discussion of the problem, we set the following assumptions:
Assumption 1.
The product is in the maturity stage of its life cycle when the output and price of the product are relatively stable. The manufacturer and remanufacturer pursue profit maximization with symmetric and complete information, where the manufacturer is the dominant player in the Stackelberg game.
Assumption 2.
The remanufacturer will put all the used products into remanufacturing, and all the remanufactured products will be put on the market. As the number of recycled products increases, the difficulty of recycling increases. The recycling cost function of used products is a quadratic function of the number of recycled products; the function of the recycling cost is , and reflects the difficulty of recycling [33].
Assumption 3.
The unit production cost of the remanufactured product is smaller than the unit production cost of the new product. According to the literature, the DfR cost is a quadratic function of the DfR level; when , the DfR factor is .
Assumption 4.
When , the function of the carbon emissions per unit of remanufactured product without DfR is .
Assumption 5.
According to consumer utility theory, the price of a new product is related to demand as , and the price of a remanufactured product is related to demand as .
5. Decision-Making and Coordination Model
5.1. Decentralized Decision-Making without DfR
In the decentralized decision-making model, where the manufacturer does not implement DfR, the decision sequence between the two parties is as follows: In the first stage, the manufacturer decides the production volume of the new product, , and the unit patent license fees, . In the second stage, the remanufacturer decides the recycling rate of the used product, , based on the manufacturer’s decisions. The manufacturer’s profits and the remanufacturer’s profit optimization problems can be described as follows:
The total closed-loop supply chain carbon emissions can be described as follows:
The above problem is a full-information dynamic game, which is solved using the inverse induction method; i.e., induction is reasoned step-by-step from the last stage of the dynamic game to solve the equilibrium result of the dynamic game. The solution process is as follows:
In the second stage, the remanufacturer’s profit maximization, , is solved. Finding the second-order derivative of over provides the result ; therefore, is a concave function of . According to the extreme value condition of the unitary function, the function has an optimal solution. The first-order derivative and the reaction function of concerning are as follows:
In the first stage, the manufacturer’s profit maximization, , is solved. Equation (5) is substituted into Equation (1), and the Hessian matrix of is obtained as
Since and , then is a strictly concave function concerning and . The first-order derivatives of with respect to and are set to zero.
Solving Equations (7) and (8) jointly yields and as follows:
Substituting and into Equation (5) yields
From , is obtained as
For simplicity, we assumed that and . The optimal profits of the manufacturer and remanufacturer and the total supply chain carbon emissions are as follows:
Proposition 1.
Impact of the carbon tax rate on the manufacturer: As the carbon tax rate increases, the manufacturer’s new product output, royalties per unit, and profits decrease.
Proof 1.
The first-order partial derivatives of the carbon tax rate, , were solved for new product production, ; royalties, ; and manufacturer’s profit, ; therefore, , , and . Since, and , we learned that and , which leads to . □
Proposition 2.
As the carbon tax rate increases, (1) when , the recycling rate of used products increases; (2) when , the output of remanufactured products and the profits of the remanufacturer increase.
Proof 2.
The first-order partial derivatives of the carbon tax rate, , for the recycling rate, ; the output of remanufactured goods, ; and the profit of remanufacturer, , were obtained as follows: , , and . From proof 1, we can see that and ; therefore, when and , and ; similarly, when , ; vice versa, when , . □
5.2. Decentralized Decision-Making of DfR
In the decentralized decision-making model where the manufacturer implements DfR, the decision sequence of the two parties is as follows: In the first stage, the manufacturer decides the level of DfR for a new product, . In the second stage, the manufacturer decides the production volume of the new product, , and the unit patent license fee, . In the final stage, the remanufacturer decides the recycling rate as of the used product according to the manufacturer’s decision. The manufacturer’s profits and the remanufacturer’s profit optimization problems are as follows:
The total closed-loop supply chain carbon emission, , can be shown as the following equation:
The above problem is a complete information dynamic game, which is solved using the inverse induction method. The solution process is similar to that of Section 5.1; therefore, the solution steps are omitted. When is satisfied, it is thought that , and a level of DfR that maximizes the manufacturer’s profits exists. Furthermore, consistent with the above, let , , , and . Finally, each optimal solution is found as follows:
The optimal profits and total supply chain carbon emissions for the manufacturer and remanufacturer, respectively, are shown as follows:
Proposition 3.
The impact of DfR on the manufacturer’s decision. The new product output, unit patent license fee, and manufacturer’s profit all increase.
Proposition 3 shows that the manufacturer reduces the carbon emissions of the new product through DfR, which further reduces the cost of carbon emissions, and has more cost space to produce the new product; therefore, the new product output increases. On the other hand, although the manufacturer has to bear the cost of DfR, it can pass on that part of the cost by increasing the patent license fee due to the patent-protected market environment. At the same time, the manufacturer’s profits mainly come from the sales revenue of new products and the patent license fee, which can be adjusted to ensure its revenue; therefore, the manufacturer’s profits also increase.
Proof 3.
The difference between the optimal new product yield, patent license fee, and manufacturer’s profits under the two models before and after the implementation of DfR can be obtained as follows: , , and . Since and , can be obtained as ; therefore, , , and . □
Proposition 4.
The impact of DfR on the remanufacturer’s decision: (1) when , the recycling rate of used products decreases; (2) when , both the output of the remanufactured products and the remanufacturer’s profits decrease.
Proposition 4 shows that (1) when , consumers’ preference for remanufactured products is relatively high, remanufactured products are more threatening to new products, and the manufacturer will increase the unit patent license fee to weaken the remanufacturer. For the remanufacturer, the cost of carbon emission reduction through DfR is smaller than the increase in the unit patent license fee; therefore, its profits are reduced, the recycling incentive is weakened, and the recycling rate is reduced. Conversely, when , the preference for remanufactured goods is low, and the carbon emission cost reduced by DfR is greater than the patent license fees; therefore, its profitability increases, the recycling incentive is enhanced, and the recycling rate increases. (2) Similarly, when , DfR inhibits remanufacturing, and when , DfR promotes remanufacturing. This shows that under a market environment of patent protection, DfR does not necessarily increase the profits of the remanufacturer.
Proof 4.
The optimal waste product recycling rate, remanufactured product yield, and remanufacturer profits under the two models before and after the implementation of DfR are different, as follows: , , and . If , , and , when , it can be concluded that the magnitude of the product recovery rate under both models A and B is ; when , . Furthermore, from we can obtain ; therefore, when , there are and ; when , there are and . □
5.3. Centralized Decision-Making
In the case of centralized decision-making, the manufacturer and the remanufacturer are considered as a whole, and they jointly decide on the level of DfR, ; the new product yield, ; and the recycling rate, , of the used product. Moreover, the manufacturer does not charge the remanufacturer a royalty to make the whole supply chain system optimal. The decision-making problem is as follows:
When , the overall profit of the supply chain is optimal and is satisfied. According to the previous calculation, if , , , and , we finally find each optimal solution as follows:
The total profits of the closed-loop supply chain and the total carbon emissions of the supply chain are as follows:
Proposition 5.
The recycling rate of used products, the yield of remanufactured products, and the total profits of the supply chain will be better under centralized decision-making than decentralized decision-making.
Proposition 5 shows that under decentralized decision-making, the manufacturer will pay high costs to implement DfR and increase the patent license fees to prevent remanufacturers from “free-riding”, which will reduce the incentives of remanufacturers. On the contrary, under centralized decision-making, the manufacturer and the remanufacturer make a unified decision to maximize the profits of the supply chain. Therefore, the manufacturer no longer charges the remanufacturer the patent license fee, which effectively avoids the double marginal effect, promotes recycling and remanufacturing, and increases the overall profits of the supply chain. Consequently, under centralized decision-making, the product recycling rate, the output of remanufactured goods, and the total supply chain profit are all higher than under decentralized decision-making.
Proof 5.
The difference between the optimal new product output, the recycling rate of used products, the output of remanufactured products, and the total profits of the supply chain under centralized and decentralized decision-making can be obtained as follows: , , and . From proof 4, we know that when , , and , . In addition, from , we know that . Since , we obtain , and ; therefore, , and . From , can be obtained, and from , can be obtained. The two equations can be combined to know that and ; thus, we can prove that . □
Proposition 6.
The level of DfR and total supply chain carbon emissions are lower under centralized decision-making when compared with decentralized decision-making.
Proposition 6 shows that, when , the preference for remanufactured goods is higher, and carbon emissions are lower; both parties will focus on selling remanufactured products under centralized decision-making compared with decentralized decision-making. Therefore, lower remanufactured carbon emissions result in the manufacturer requiring lower efforts regarding DfR and a lower level of DfR, while the focus on producing and selling remanufactured products with low carbon emissions also results in lower total carbon emissions. Conversely, when , the preference for remanufactured products is lower, and carbon emissions are higher; the manufacturer needs to undertake a higher level of DfR to reduce emissions, and the total carbon emissions of the supply chain are also higher.
Proof 6.
The difference between the optimal level of DfR and total supply chain carbon emissions under centralized and decentralized decision-making can be obtained as follows: , , where . From proof 4, we know that and . From proof 5, we know that . Thus, when , we obtain and ; when , we obtain and . □
5.4. Coordinated Decision-Making
The manufacturer’s implementation of DfR increases its profits; however, DfR leads to higher royalty fees, which is detrimental to the recycling and remanufacturing of used products, and the remanufacturer’s profits may not increase. Therefore, the contract to coordinate the supply chain is as follows: the manufacturer provides the contract, , and the remanufacturer remanufactures at an appropriate royalty fee, , while sharing a portion of the cost of DfR in the proportion . The profits of each member after coordination are no less than before coordination: and . The remanufacturer considers whether to accept the covenant or not depending on the proportional share. The profit functions for the manufacturer and the remanufacturer are as follows:
If the total profits of the coordinated supply chain are the same as centralized decision-making, it is necessary to satisfy , , and . The optimal contract can be calculated as , , and , and the values of and are as follows:
Proposition 7.
Under coordinated decision-making, (1) the total profits of the supply chain are higher than under decentralized decision-making and the same as under centralized decision-making; (2) when, the unit patent license fee and the total carbon emissions are lower than under decentralized decision-making, and the total carbon emissions are the same as under centralized decision-making.
Proposition 7 shows that when the remanufacturer shares part of the cost of DfR, prompting the manufacturer to reduce the patent license fee charged to the remanufacturer. Furthermore, the reduction in the patent license fee further enhances the remanufacturer’s enthusiasm. After coordination through the DfR cost-sharing contract, the benefits to the manufacturer and remanufacturer will be higher than before coordination, and the total profits of the supply chain are higher. This is the same as under centralized decision-making.
Proof 7.
The difference between the optimal unit royalty before and after coordination can be obtained as . In addition, from , , and , it follows that when , ; when , there is . From , , and , we know that and , and from Proposition 5, we also know that ; therefore, . From Proposition 6, we know that when , ; therefore, . □
6. Numerical Simulation
We compared each equilibrium solution of the above four models via numerical simulation and tested the models and propositions. Referring to the case of a previous study [34,35], each parameter was assigned the following values: , , , , , , , , and . The range of cost-sharing ratios under coordinated decision-making can be expressed as . The outcomes under the different decision-making models are shown in Table 2.
The following conclusions can be drawn from the comparison in Table 2.
- (1)
- When the level of DfR satisfies , it shows that, for a given value, there is a higher preference for remanufactured goods and lower carbon emissions, and both parties will focus on selling remanufactured goods under centralized decision-making. Furthermore, lower remanufacturing carbon emissions result in a lower level of DfR required by the manufacturer and, thus, a lower DfR level, which also verifies Proposition 6.
- (2)
- When the unit patent license fee satisfies , it shows that the manufacturer has to bear the design cost under the decentralized decision-making of DfR compared with no DfR. Therefore, a higher patent license fee is needed to pass on this part of the cost, which verifies Proposition 3. Under coordinated decision-making, the patent license fee is minimized because the remanufacturer shares part of the DfR cost, which verifies Proposition 7.
- (3)
- When the recycling rate of used products satisfies , it shows that, compared with without DfR, the carbon emission costs reduced by the remanufacturer under the decentralized decision-making of DfR are smaller than the increased royalties. Therefore, its profits are reduced, the recycling incentive is weakened, and the recycling rate is reduced, which verifies Proposition 4. Under centralized decision-making, the unified decision-making of both parties maximizes the profits of the supply chain, effectively avoids the double marginal effect, and promotes recycling remanufacturing. In addition, the recycling rate is the highest, which verifies Proposition 5.
- (4)
- When the manufacturer’s profits satisfy , it shows that the new product output increases after DfR, and the manufacturer’s sales revenue increases; it can also secure revenue by adjusting the patent license fee, so the profit increases compared with the pre-DfR, which verifies Proposition 3. The manufacturer’s profits are further increased compared with decentralized decision-making via contract coordination.
- (5)
- When the remanufacturer profits satisfy , it shows that, for a given value of , DfR acts as a disincentive to remanufacturing, and the remanufacturer’s profits are the lowest, which verifies Proposition 4. The remanufacturer’s profits are significantly enhanced and peak after contract coordination.
- (6)
- When the total profits of the supply chain satisfy , and the total carbon emissions satisfy , it shows that DfR can effectively increase the total profit of the supply chain and reduce carbon emissions. In addition, centralized decision-making avoids the double marginal effect, maximizes the total profits of the supply chain, and minimizes carbon emissions. Coordinated decision-making can achieve same the total profits and carbon emissions of a closed-loop supply chain with centralized decision-making, and, at the same time, the respective profits of the manufacturer and the remanufacturer will be higher than under decentralized decision-making. Coordinated decision-making can achieve the same total profits and carbon emissions for a closed-loop supply chain as centralized decision-making can, and, at the same time, it can increase the profits of both the manufacturer and remanufacturer compared with decentralized decision-making. This shows that DfR can improve both overall economic efficiency and environmental performance. Moreover, a cost-sharing DfR contract can improve both the economic and environmental efficiency of a closed-loop supply chain.
6.1. Impact of Carbon Tax Rates on Manufacturer/Remanufacturer Decisions
With the increase in the carbon tax rate, the level of DfR increased and then decreased, as shown in Figure 5. This shows that increasing the carbon tax within a reasonable range will increase the carbon emission costs of enterprises; however, it also will force enterprises to make more efforts in DfR and improve the level of DfR to promote energy saving and emission reduction. On the other hand, a high carbon tax rate will increase the carbon emission burden of enterprises, which will counterproductively weaken the enthusiasm of enterprises for production and emission reduction and lead to a decrease in the level of DfR.
From Figure 6, it can be seen that the patent license fee decreased as the carbon tax rate increased. This shows that, as the carbon tax rate increases, it reduces the output of remanufactured products, which leads to a decrease in the patent license fee that the manufacturer can obtain; therefore, it promotes remanufacturing to obtain more patent revenue by reducing the unit patent license fee, which verifies Proposition 1.
As shown in Figure 7, the recycling rate of used products increased as the carbon tax rate increased. This shows that, at a given value, an increase in the carbon tax rate aggravates the carbon emission costs of the remanufacturer. The consumers’ willingness to pay for remanufactured products is relatively high at this time, and the market advantage of remanufactured products is significant. Therefore, the recycling rate of used products increases, which verifies Proposition 2.
Figure 8 and Figure 9 show that, as the carbon tax rate increased, the production of remanufactured products increased, but the production of new products decreased. Therefore, as the carbon tax rate increases, the carbon costs of the manufacturer increase, its revenue suffers, and the production of new products decreases. Since the carbon tax rate promotes remanufacturing, when the carbon tax rate increases, the production of remanufactured goods increases as the carbon tax rate increases, which verifies Proposition 2.
Figure 10 and Figure 11 show that as the carbon tax rate increased, the manufacturer’s profits decreased, while the remanufacturer’s profits increased. It can be seen that the carbon tax rate increases the carbon emission costs of the manufacturer. In addition, the manufacturer’s profit decreases when the carbon tax rate increases.
6.2. Impact of Carbon Emission Ratios on Manufacturer/Remanufacturer Decisions
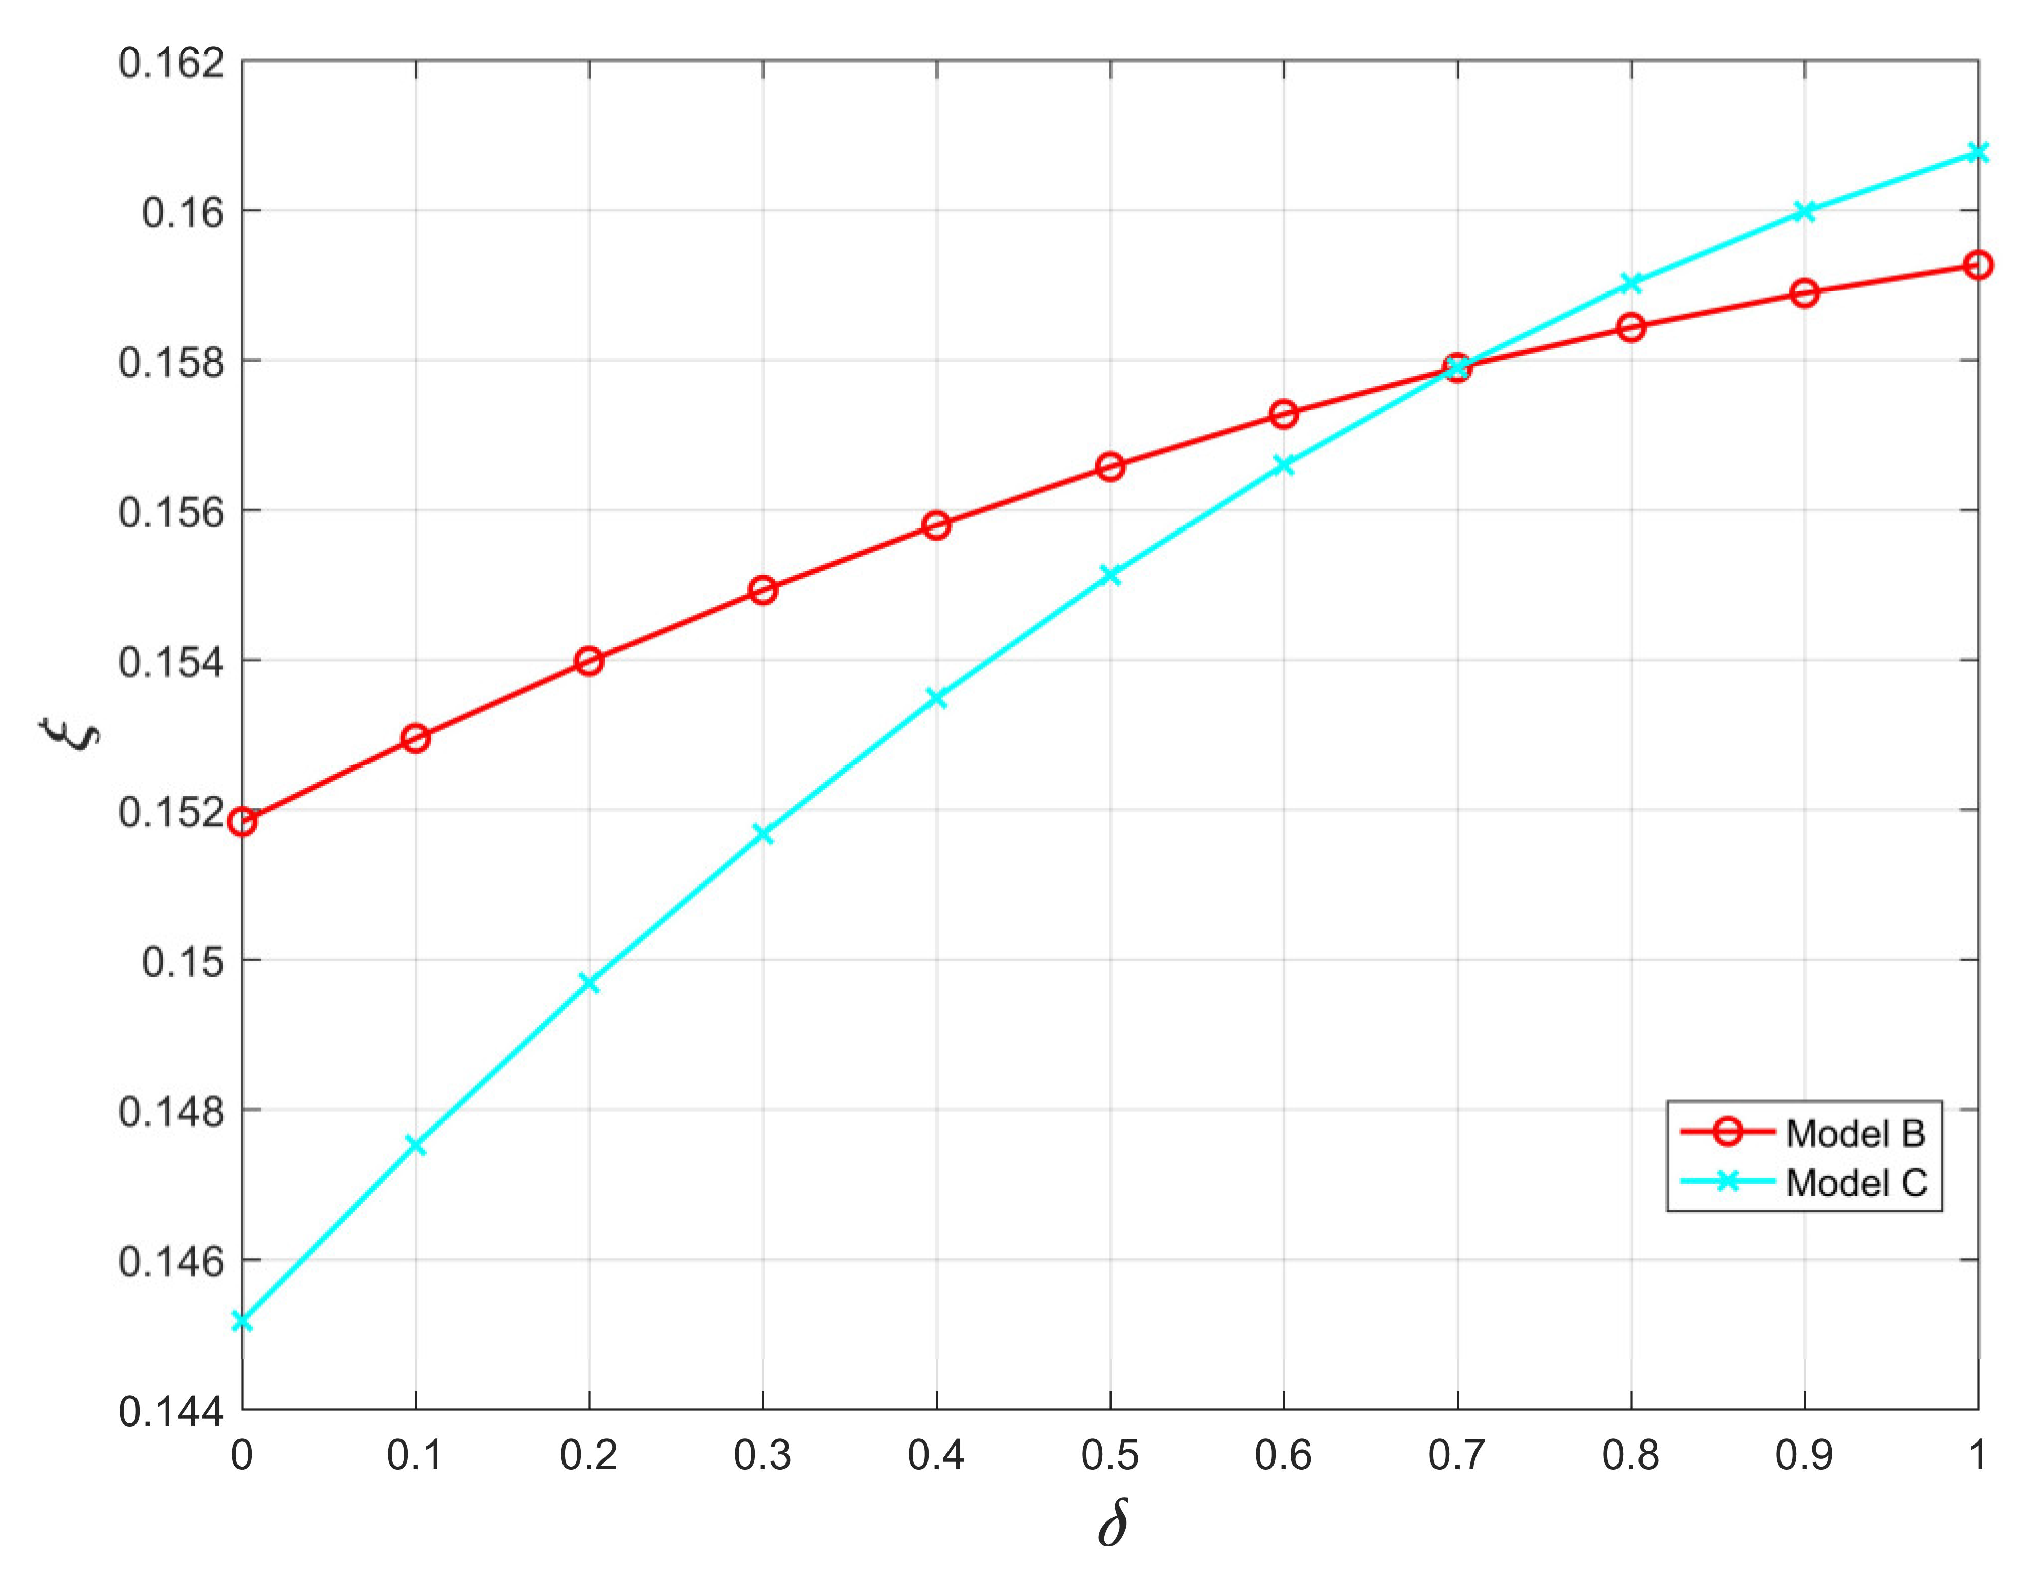
From Figure 12, it can be seen that, with the increase in the carbon emission ratio, the DfR level increased. When the ratio of carbon emissions from remanufactured products to new products was lower than 0.7, the level of DfR in Model B was improved compared with Model C. This shows that, as the carbon emission ratio increases, the carbon emission of remanufactured goods also increases. In addition, the environmental pressure of remanufacturing borne by the manufacturer increases. Therefore, the DfR level is improved to save energy and reduce emissions. When the ratio of carbon emissions from remanufactured products to carbon emissions from new products is lower than 0.7, the preference for remanufactured goods will be higher, and carbon emissions will be lower. Therefore, both parties will focus on selling remanufactured goods under centralized decision-making. In addition, the DfR level required will be lower than that under decentralized decision-making. Conversely, when the ratio of carbon emissions from remanufactured products to carbon emissions from new products is higher than 0.7, the preference of remanufactured goods will be lower, and carbon emissions will be higher. Furthermore, the DfR level under centralized decision-making will be higher, which verifies Proposition 6.
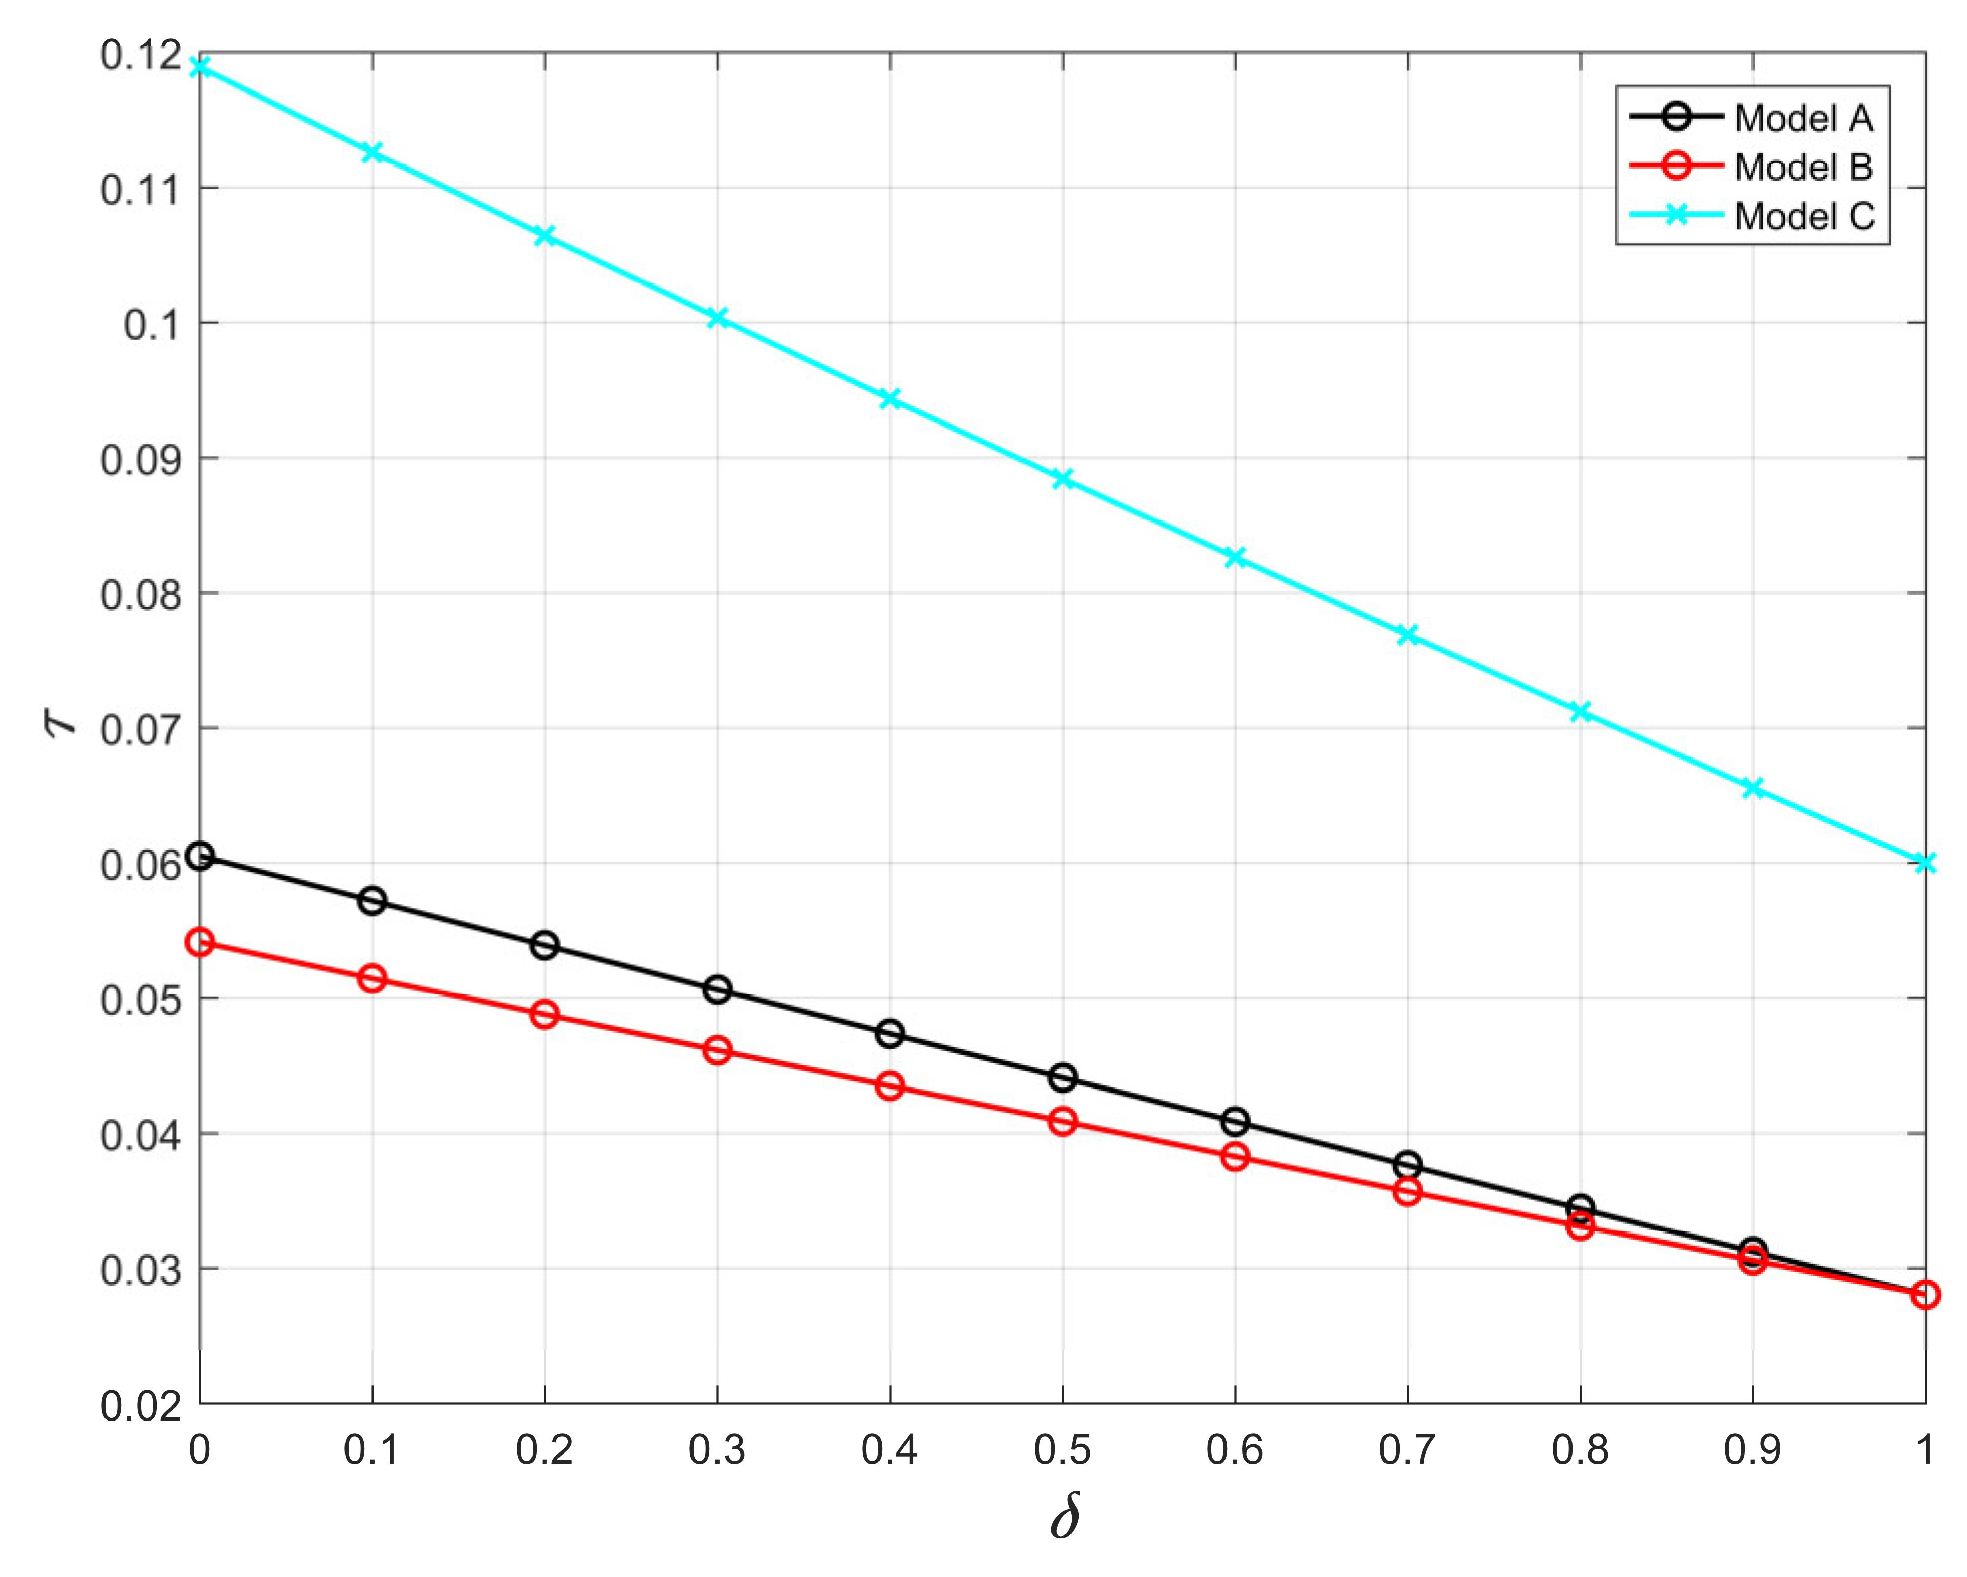
From Figure 13, it can be seen that the recycling rate decreased as the carbon emission ratio increased. This shows that, with an increase in the carbon emission ratio, the carbon emissions of remanufactured products increase, the costs of carbon emissions increase, the benefit is impaired, and the decline in recycling motivation leads to a decrease in the recycling rate.
Figure 14 and Figure 15 show that, with the increase in the carbon emission rate, the production of new products increased, but the production of remanufactured products decreased. In addition, it can be seen that as the carbon emission rate increased, the carbon emissions of remanufactured products increased. This acts as a disincentive for remanufacturing, and the production of remanufactured products will decrease. On the contrary, when the carbon emissions of remanufactured products increase, competitiveness decreases, which increases the production of new products.
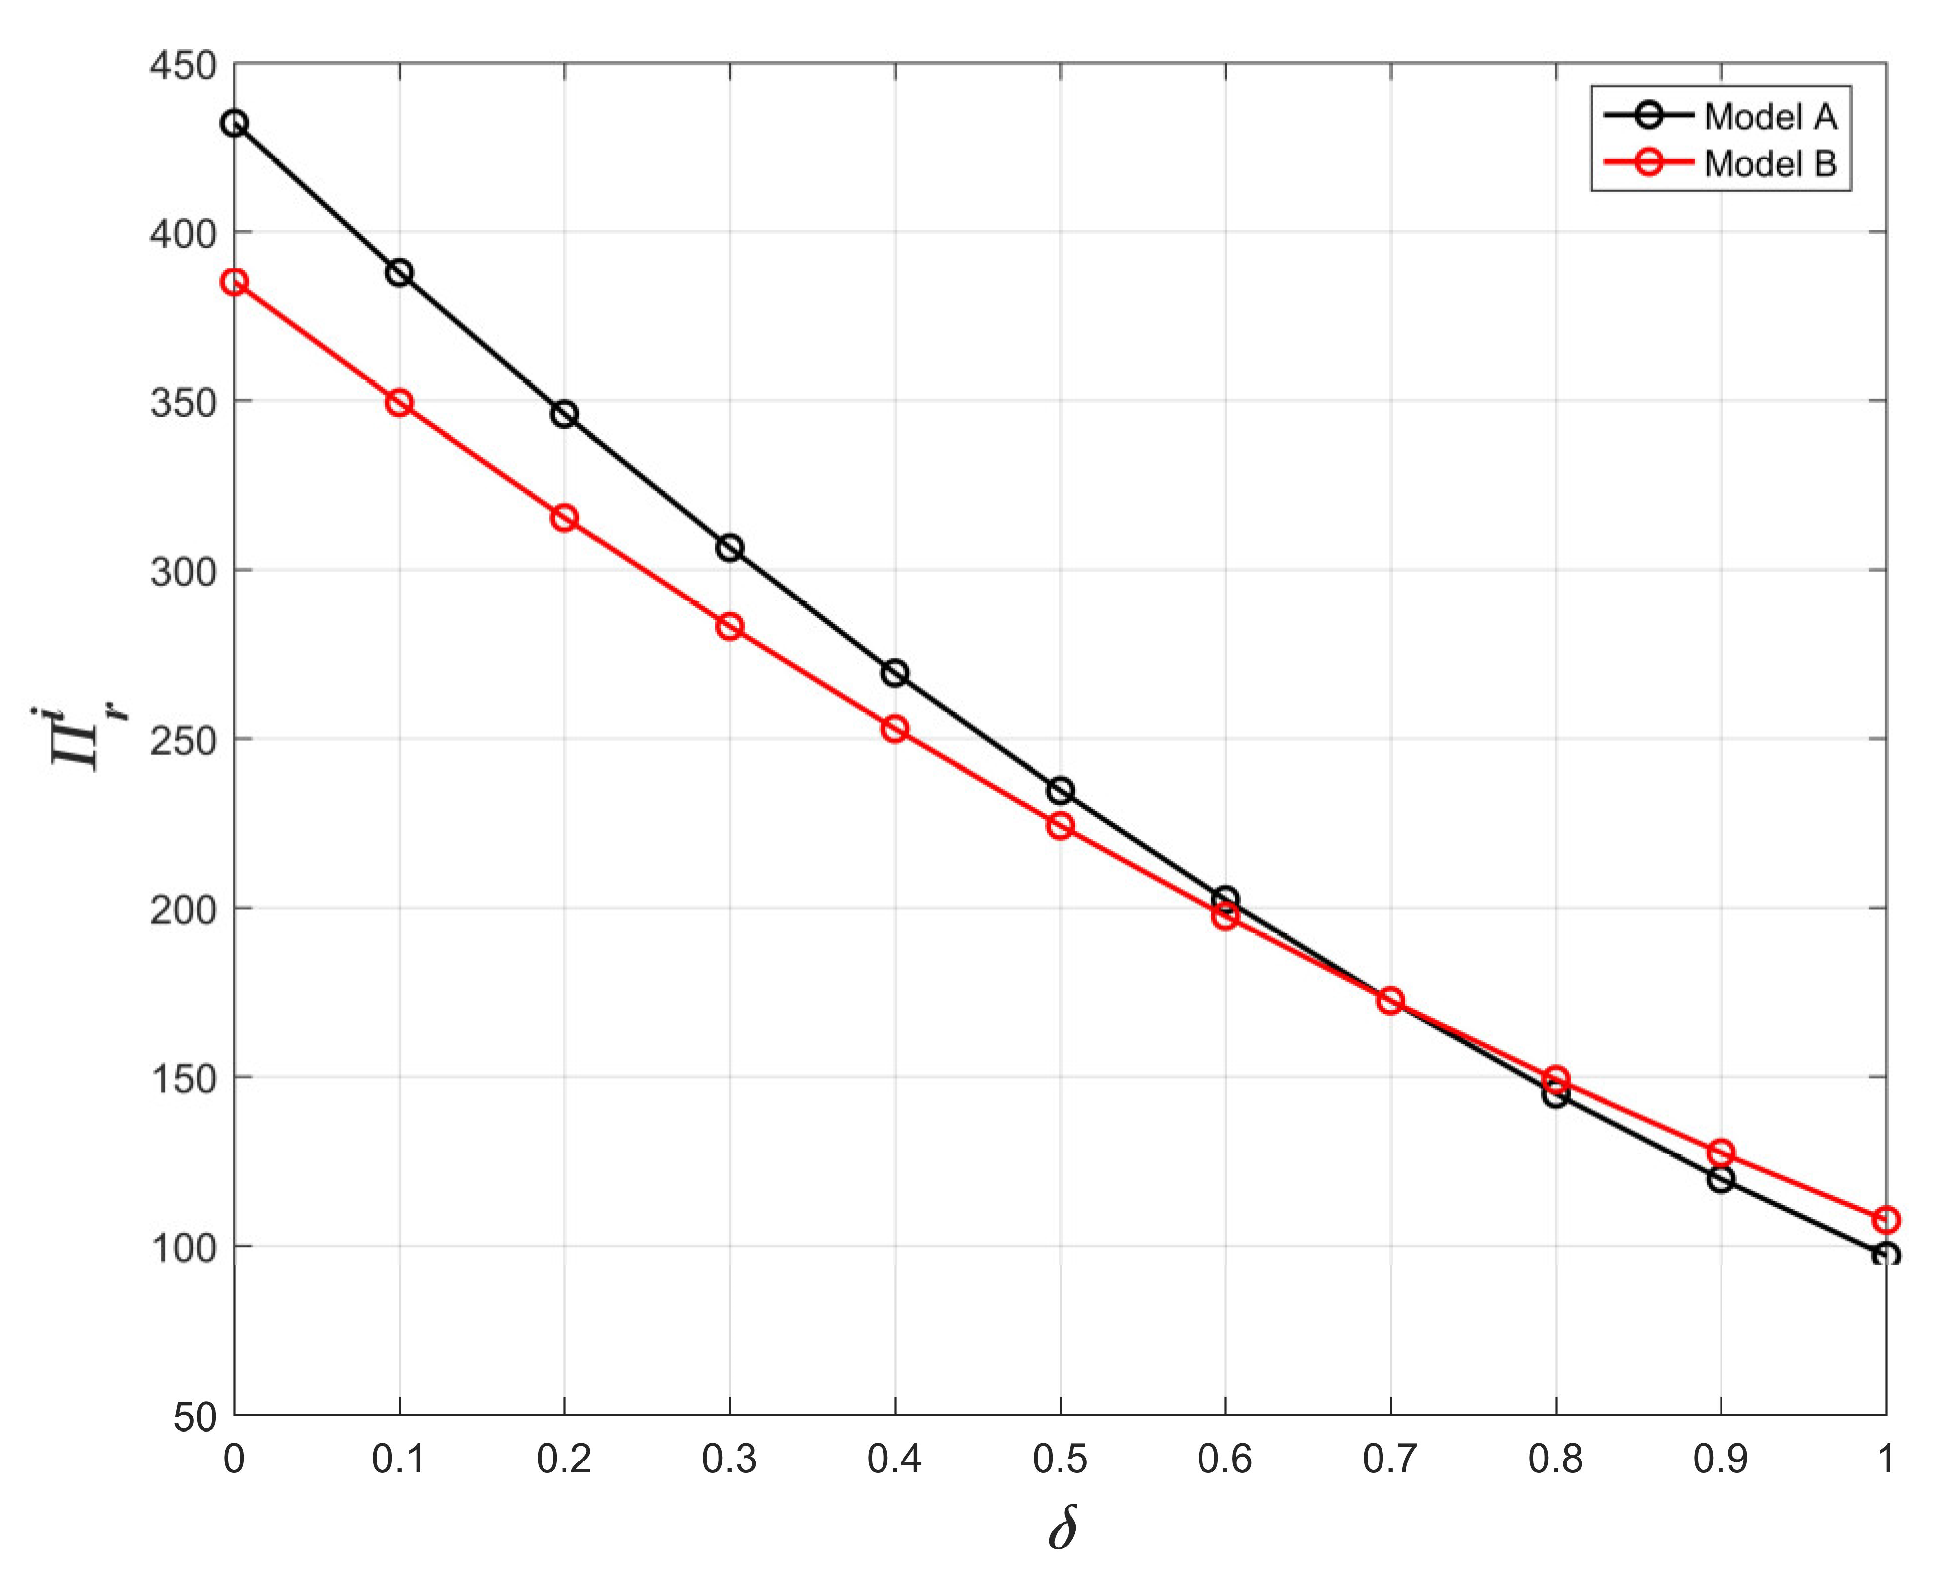
Figure 16 and Figure 17 show that, with the increase in the carbon emission rate, the manufacturer and remanufacturer’s profits gradually decreased. When the ratio of carbon emissions from remanufactured products to carbon emissions from new products is lower than 0.7, customers will be more willing to pay for remanufactured products. Furthermore, DfR plays a suppressive role in remanufacturing, and the profits are lower. When the carbon emission ratio of remanufactured products to new products is higher than 0.7, customers’ willingness to pay for remanufactured products will decline. Moreover, DfR plays a promotional role in remanufacturing, and the profits will be higher. Consequently, Proposition 4 is proven.
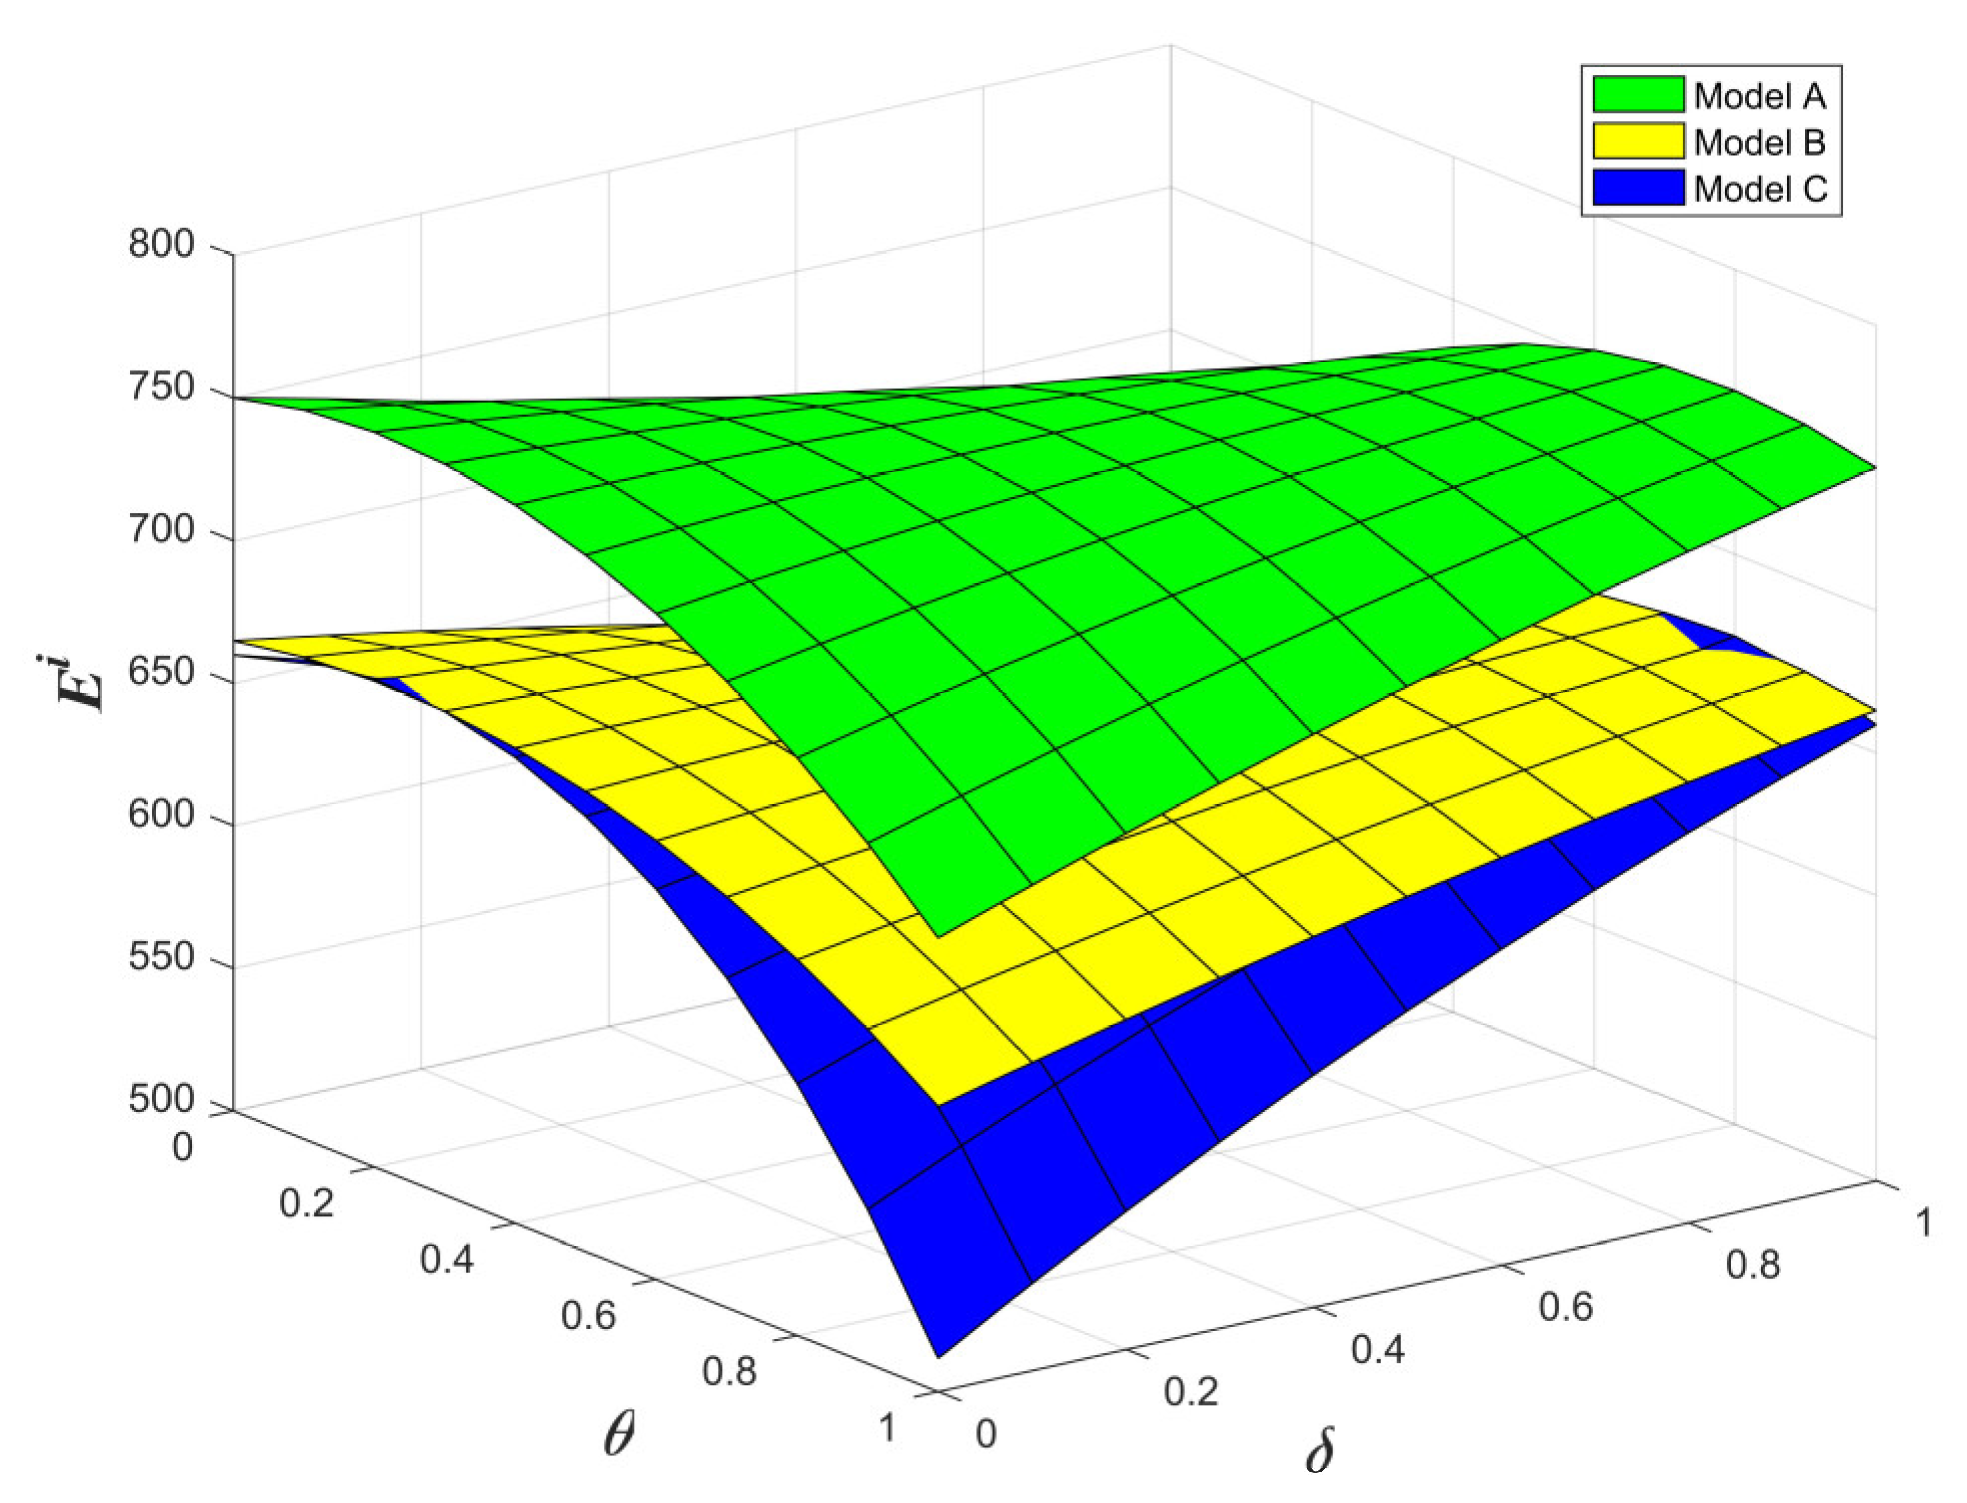
6.3. Impact of Preference for Remanufactured Products and Carbon Emission Ratio
Figure 18 and Figure 19 show that the total supply chain profits satisfy . DfR can effectively improve the total supply chain profits, and centralized decision-making avoids the double marginal effect; therefore, the total supply chain profits reach their peak. DfR can effectively reduce the total carbon emissions of the supply chain when , and centralized decision-making can further reduce the carbon emission of the supply chain. Thus, it can be seen that DfR can improve both overall economic efficiency and environmental performance, and centralized decision-making further promotes the optimization of the economy and environment.
7. Conclusions
In this study, we established four decision-making models: decentralized decision-making without DfR, decentralized decision-making with DfR, centralized decision-making, and coordinated decision-making. We introduced consumers’ willingness to pay for remanufactured products and compared the price, the patent license fee, the recovery rate, and profits under the three models using inverse induction and numerical simulation. In addition, the effects of the carbon tax, the carbon emission rate, and remanufactured goods preference on each equilibrium solution and profits were further analyzed. The main conclusions are as follows: (1) Although the carbon tax reduces the manufacturer’s profits, it encourages the manufacturer to take environmental responsibility, which leads to a higher level of DfR and lower patent license fees. When the consumer preference for remanufactured goods is greater than the carbon emission rate, the carbon tax encourages remanufacturing. Simultaneously, this results in an increase in the recycling rate and the remanufacturer’s profits. (2) Under a market environment of patent protection, DfR increases the manufacturers’ profits, new product output, and patent license fees. In contrast, consumers’ willingness to pay for remanufactured goods is greater than the carbon emission rate. Moreover, the carbon tax promotes remanufacturing, and the recycling rate and remanufacturers’ profits also increase. When consumers’ willingness to pay for remanufactured goods is greater than the carbon emission ratio, DfR inhibits remanufacturing, the remanufacturer’s profits decrease, and remanufactured product yields and the recycling rate decrease. (3) Through a DfR cost-sharing contract, the remanufacturer pays an appropriate royalty for remanufacturing while sharing the cost of DfR proportionally. In addition, the total profits and total carbon emissions of the closed-loop supply chain can be equal to those under centralized decision-making. At the same time, the profits of both the manufacturer and the remanufacturer are higher than under decentralized decision-making, and the economic and environmental benefits of the CLSC improve. This can effectively improve the economic and environmental benefits of the closed-loop supply chain, and, thus, the closed-loop supply chain is effectively coordinated.
The following is an overview of the novel contributions of this paper: (1) The competition model takes into account how DfR, patent protection, and carbon emissions may affect both manufacturer and remanufacturer strategies, which is more in line with reality. (2) In examining the impact of DfR, we were surprised to find that, although the carbon tax reduced manufacturer profits, it pushed manufacturers to take on environmental responsibility, resulting in higher levels of DfR. (3) This study will encourage manufacturers to support DfR and foster the growth of remanufacturing. The economic and environmental benefits of a closed-loop supply chain are improved when remanufacturers pay appropriate royalties for remanufacturing while sharing a proportion of the costs associated with the design.
Although we considered the behavior of closed-loop supply chain members under DfR and patent protection in this study, there were some limitations. The closed-loop supply chain studied in this paper included only a single manufacturer and remanufacturer. We did not consider other organizations such as retailers or recyclers or the introduction of multiple manufacturers and remanufacturers. Therefore, in the future, multiple manufacturers, retailers, recyclers, and remanufacturers could be introduced to the model, depicting a complete CLSC. In addition, multi-party strategic selection and the coordination of patent protection under DfR should be studied. The market demand considered in this paper was determined and the Stackelberg game was based on a completely informational market environment. However, in a real business environment, product requirements are often relatively random, and the information between enterprises is relatively confidential and asymmetrical. Therefore, in the future, this research could be extended to represent a market environment of random demand and information asymmetry.
Author Contributions
Conceptualization, J.J. and J.S.; methodology, G.W. and H.H.; software, J.S. and G.W.; formal analysis, H.H.; resources, J.J.; writing—original draft preparation, G.W. and H.H.; writing—review and editing, J.S. All authors have read and agreed to the published version of the manuscript.
Funding
This work was supported by the National Social Science Foundation Project of China (20XSH001) and the Major Project of Chongqing Social Science Planning for the Construction of Twin-City Economic Circle in Chengdu-Chongqing Region (2021ZDSC05).
Institutional Review Board Statement
Not applicable.
Informed Consent Statement
Informed consent was obtained from all subjects involved in the study.
Data Availability Statement
The data used to support the findings of this study are included within the article.
Conflicts of Interest
The authors declare no conflict of interest.
References
- Zhang, C.T.; Ren, M.L. Coordination strategy of closed-loop supply chain for remanufacture of patented products under competitive demands. Appl. Math. Model. 2016, 40, 6243–6255. [Google Scholar] [CrossRef]
- Su, J.; Li, C.; Zeng, Q.; Yang, J.; Zhang, J. A greeIn Proceedings of then closed-loop supply chain coordination mechanism based on third-party recycling. Sustainability 2019, 11, 5335. [Google Scholar] [CrossRef] [Green Version]
- Jian, J.; Guo, Y.; Jiang, L.; An, Y.; Su, J. A multi-objective optimization model for green supply chain considering environmental benefits. Sustainability 2019, 11, 5911. [Google Scholar] [CrossRef] [Green Version]
- Chen, J.; Liang, L.; Yao, D.Q. An analysis of intellectual property licensing strategy under duopoly competition: Component or product-based? Int. J. Prod. Econ. 2017, 193, 502–513. [Google Scholar] [CrossRef]
- Puška, A.; Stojanović, I. Fuzzy Multi-Criteria Analyses on Green Supplier Selection in an Agri-Food Company. J. Intell. Manag. Decis. 2022, 1, 2–16. [Google Scholar] [CrossRef]
- Huang, Y.; Wang, Z. Information sharing in a closed-loop supply chain with technology licensing. Int. J. Prod. Econ. 2017, 191, 113–127. [Google Scholar] [CrossRef]
- Chen, L.; Su, S. Optimization of the Trust Propagation on Supply Chain Network Based on Blockchain Plus. J. Intell. Manag. Decis. 2022, 1, 17–27. [Google Scholar] [CrossRef]
- Fleischmann, M. Reverse Logistics Network Structures and Design; SSRN: Rochester, NY, USA, 2003. [Google Scholar]
- Van Wassenhove, L.N.; Guide, V.D.R. The Evolution of Closed-Loop Supply Chain Research; INSEAD: Fontainebleau, France, 2008. [Google Scholar]
- Ferguson, M.E.; Toktay, L.B. The effect of competition on recovery strategies. Prod. Oper. Manag. 2006, 15, 351–368. [Google Scholar] [CrossRef] [Green Version]
- Örsdemir, A.; Kemahlıoğlu-Ziya, E.; Parlaktürk, A.K. Competitive quality choice and remanufacturing. Prod. Oper. Manag. 2014, 23, 48–64. [Google Scholar] [CrossRef]
- Wu, X.; Zhou, Y. The optimal reverse channel choice under supply chain competition. Eur. J. Oper. Res. 2017, 259, 63–66. [Google Scholar] [CrossRef]
- Huang, H.; Meng, Q.; Xu, H.; Zhou, Y. Cost information sharing under competition in remanufacturing. Int. J. Prod. Res. 2019, 57, 6579–6592. [Google Scholar] [CrossRef]
- Chai, Q.; Xiao, Z.; Zhou, G. Competitive strategies for original equipment manufacturers considering carbon cap and trade. Transp. Res. Part D Transp. Environ. 2020, 78, 102193. [Google Scholar] [CrossRef]
- Qiao, H.; Su, Q. The prices and quality of new and remanufactured products in a new market segment. Int. Trans. Oper. Res. 2021, 28, 872–903. [Google Scholar] [CrossRef]
- Soon, A.; Heidari, A.; Khalilzadeh, M.; Antucheviciene, J.; Zavadskas, E.K.; Zahedi, F. Multi-Objective Sustainable Closed-Loop Supply Chain Network Design Considering Multiple Products with Different Quality Levels. Systems 2022, 10, 94. [Google Scholar] [CrossRef]
- Ijomah, W.L.; McMahon, C.A.; Hammond, G.P.; Newman, S.T. Development of robust design-for-remanufacturing guidelines to further the aims of sustainable development. Int. J. Prod. Res. 2007, 45, 4513–4536. [Google Scholar] [CrossRef]
- Hatcher, G.; Ijomah, W.; Windmill, J. Integration of remanufacturing issues into the design process. The Design Society. In Proceedings of the 18th International Conference on Engineering Design (ICED 11), Impacting Society through Engineering Design, Lyngby, Denmark, 15–19 August 2011. [Google Scholar]
- Wu, C.H. OEM product design in a price competition with remanufactured product. Omega 2013, 41, 287–298. [Google Scholar] [CrossRef]
- Subramanian, R.; Ferguson, M.E.; Beril Toktay, L. Remanufacturing and the component commonality decision. Prod. Oper. Manag. 2013, 22, 36–53. [Google Scholar] [CrossRef]
- Kamien, M.I.; Tauman, Y. Patent licensing: The inside story. Manch. Sch. 2002, 70, 7–15. [Google Scholar] [CrossRef]
- Hong, X.; Govindan, K.; Xu, L.; Du, P. Quantity and collection decisions in a closed-loop supply chain with technology licensing. Eur. J. Oper. Res. 2017, 256, 820–829. [Google Scholar] [CrossRef]
- Ghosh, D.; Gouda, S.; Shankar, R.; Swami, S.; Thomas, V.C. Strategic decision making under subscription-based contracts for remanufacturing. Int. J. Prod. Econ. 2018, 200, 134–150. [Google Scholar] [CrossRef]
- Zhou, Y.W.; Guo, J.; Zhou, W. Pricing/service strategies for a dual-channel supply chain with free riding and service-cost sharing. Int. J. Prod. Econ. 2018, 196, 198–210. [Google Scholar] [CrossRef]
- He, P.; He, Y.; Shi, C.V.; Xu, H.; Zhou, L. Cost-sharing contract design in a low-carbon service supply chain. Comput. Ind. Eng. 2020, 139, 106160. [Google Scholar] [CrossRef]
- Chen, H.; Dong, Z.; Li, G.; He, K. Remanufacturing process innovation in closed-loop supply chain under cost-sharing mechanism and different power structures. Comput. Ind. Eng. 2021, 162, 107743. [Google Scholar] [CrossRef]
- Wu, D.; Chen, J.; Li, P.; Zhang, R. Contract coordination of dual channel reverse supply chain considering service level. J. Clean. Prod. 2020, 260, 121071. [Google Scholar] [CrossRef]
- Rezayat, M.R.; Yaghoubi, S.; Fander, A. A hierarchical revenue-sharing contract in electronic waste closed-loop supply chain. Waste Manag. 2020, 115, 121–135. [Google Scholar] [CrossRef]
- Jian, J.; Li, B.; Zhang, N.; Su, J. Decision-making and coordination of green closed-loop supply chain with fairness concern. J. Clean. Prod. 2021, 298, 126779. [Google Scholar] [CrossRef]
- Feng, L.; Govindan, K.; Li, C. Strategic planning: Design and coordination for dual-recycling channel reverse supply chain considering consumer behavior. Eur. J. Oper. Res. 2017, 260, 601–612. [Google Scholar] [CrossRef]
- Shi, Z.; Wang, N.; Jia, T.; Chen, H. Reverse revenue sharing contract versus two-part tariff contract under a closed-loop supply chain system. Math. Probl. Eng. 2016, 2016, 5464570. [Google Scholar] [CrossRef] [Green Version]
- Cao, J.; Zhao, Y.W.; Wu, S.S.; Zhou, G.G. Remanufacturing game with patent protection and government regulation. J. Manag. Sci. 2020, 23, 1–23. [Google Scholar]
- Zhu, X.; Ding, L.; Guo, Y.; Zhu, H. Decision and coordination analysis of extended warranty service in a remanufacturing closed-loop supply chain with dual price sensitivity under different channel power structures. RAIRO Oper. Res. 2022, 56, 1149–1166. [Google Scholar] [CrossRef]
- Wang, N.; Zhang, Y. Carbon emission reduction and coordination decisions of closed-loop supply chain under patent protection. J. Control. Decis. 2020, 1378–1388. [Google Scholar] [CrossRef]
- Su, J.; Zhang, F.; Hu, H.; Jian, J.; Wang, D. Co-Opetition Strategy for Remanufacturing the Closed-Loop Supply Chain Considering the Design for Remanufacturing. Systems 2022, 10, 237. [Google Scholar] [CrossRef]
Figure 1.
Decentralized decision-making without DfR.

Figure 2.
Decentralized decision-making with DfR.
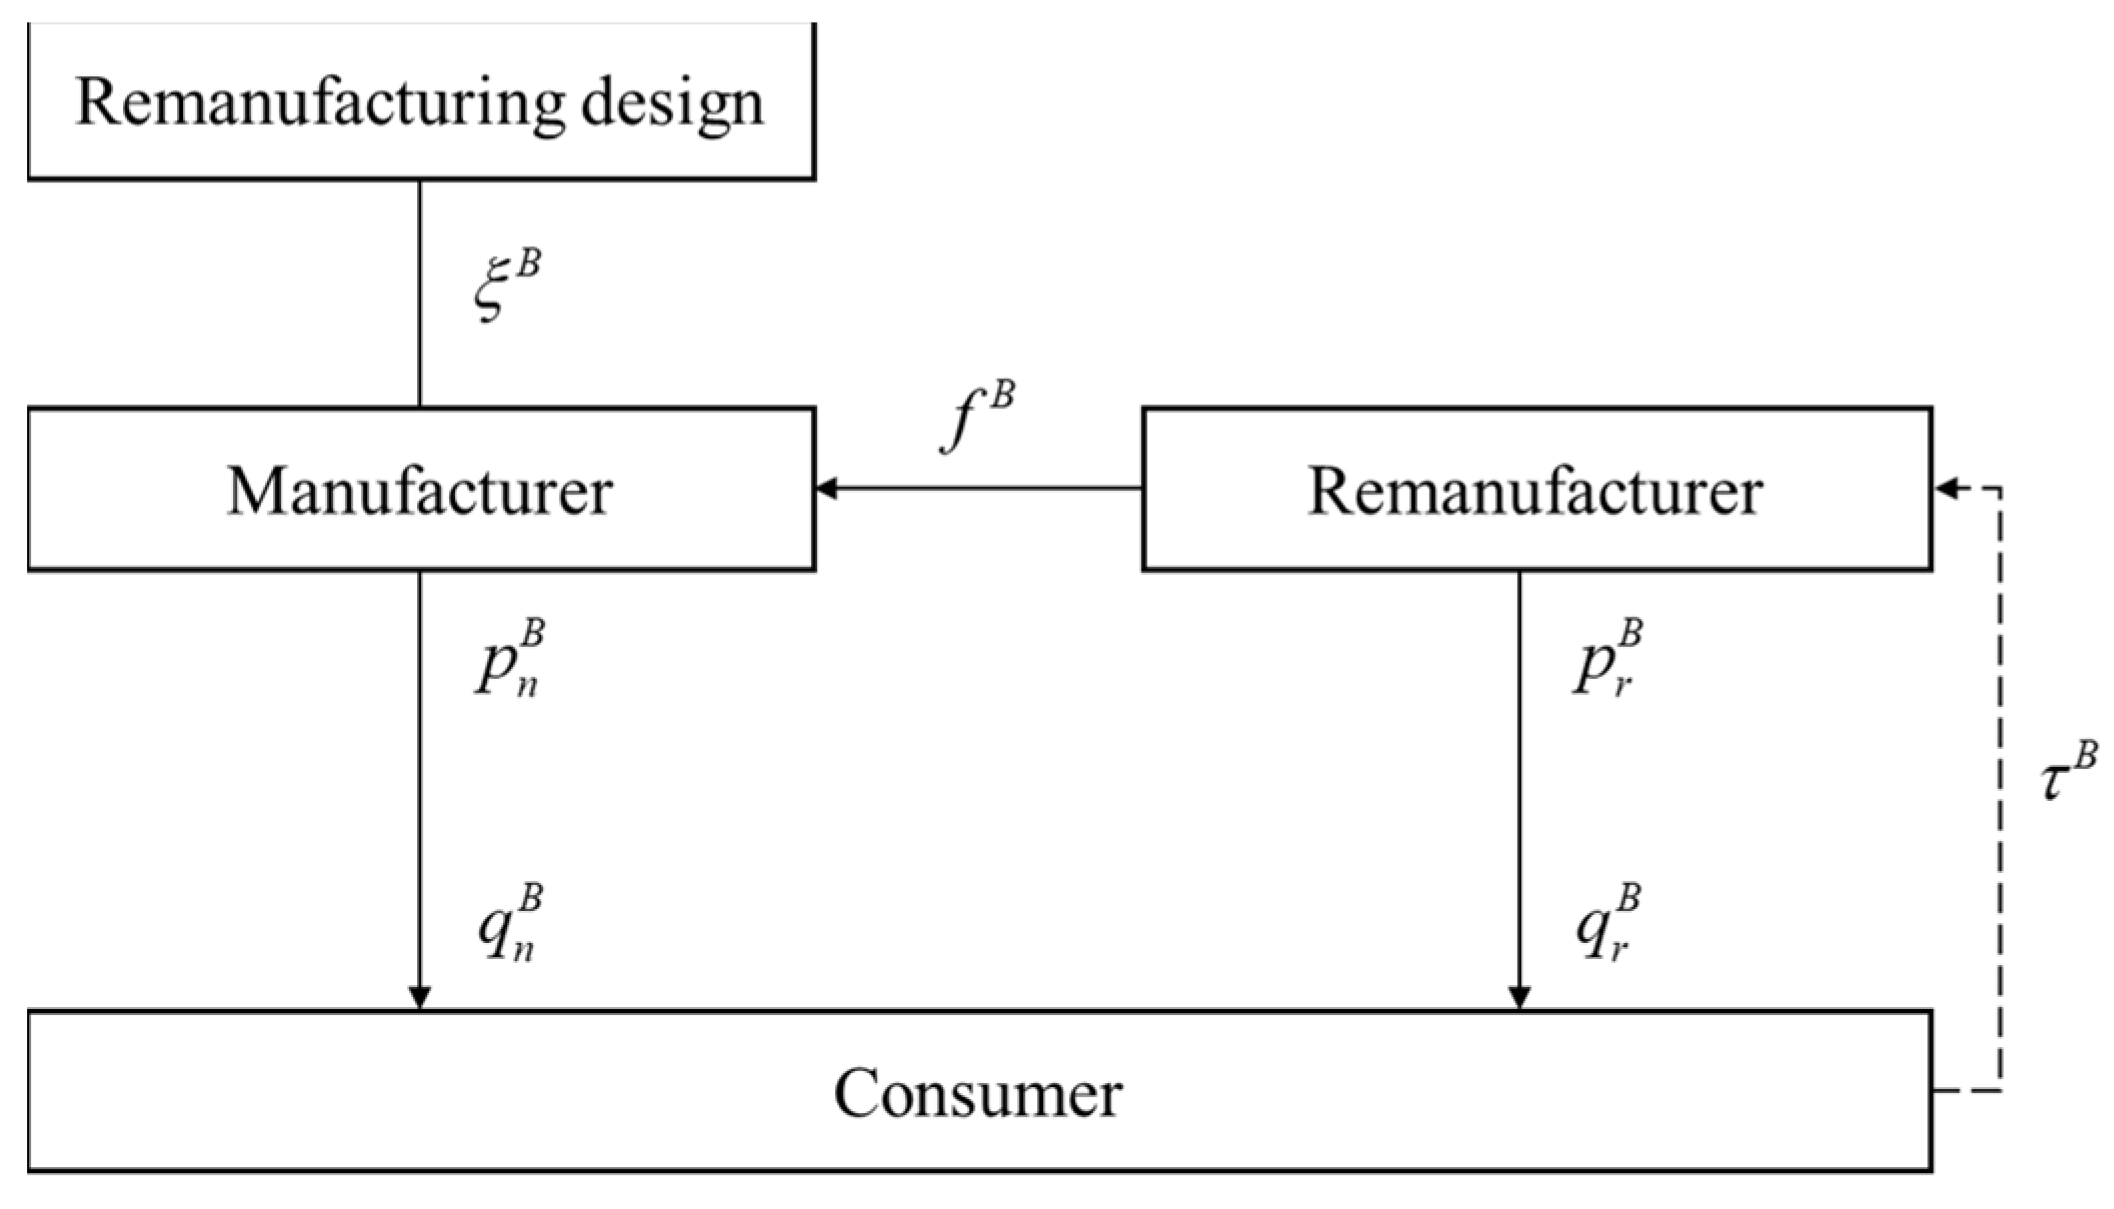
Figure 3.
Centralized decision-making.
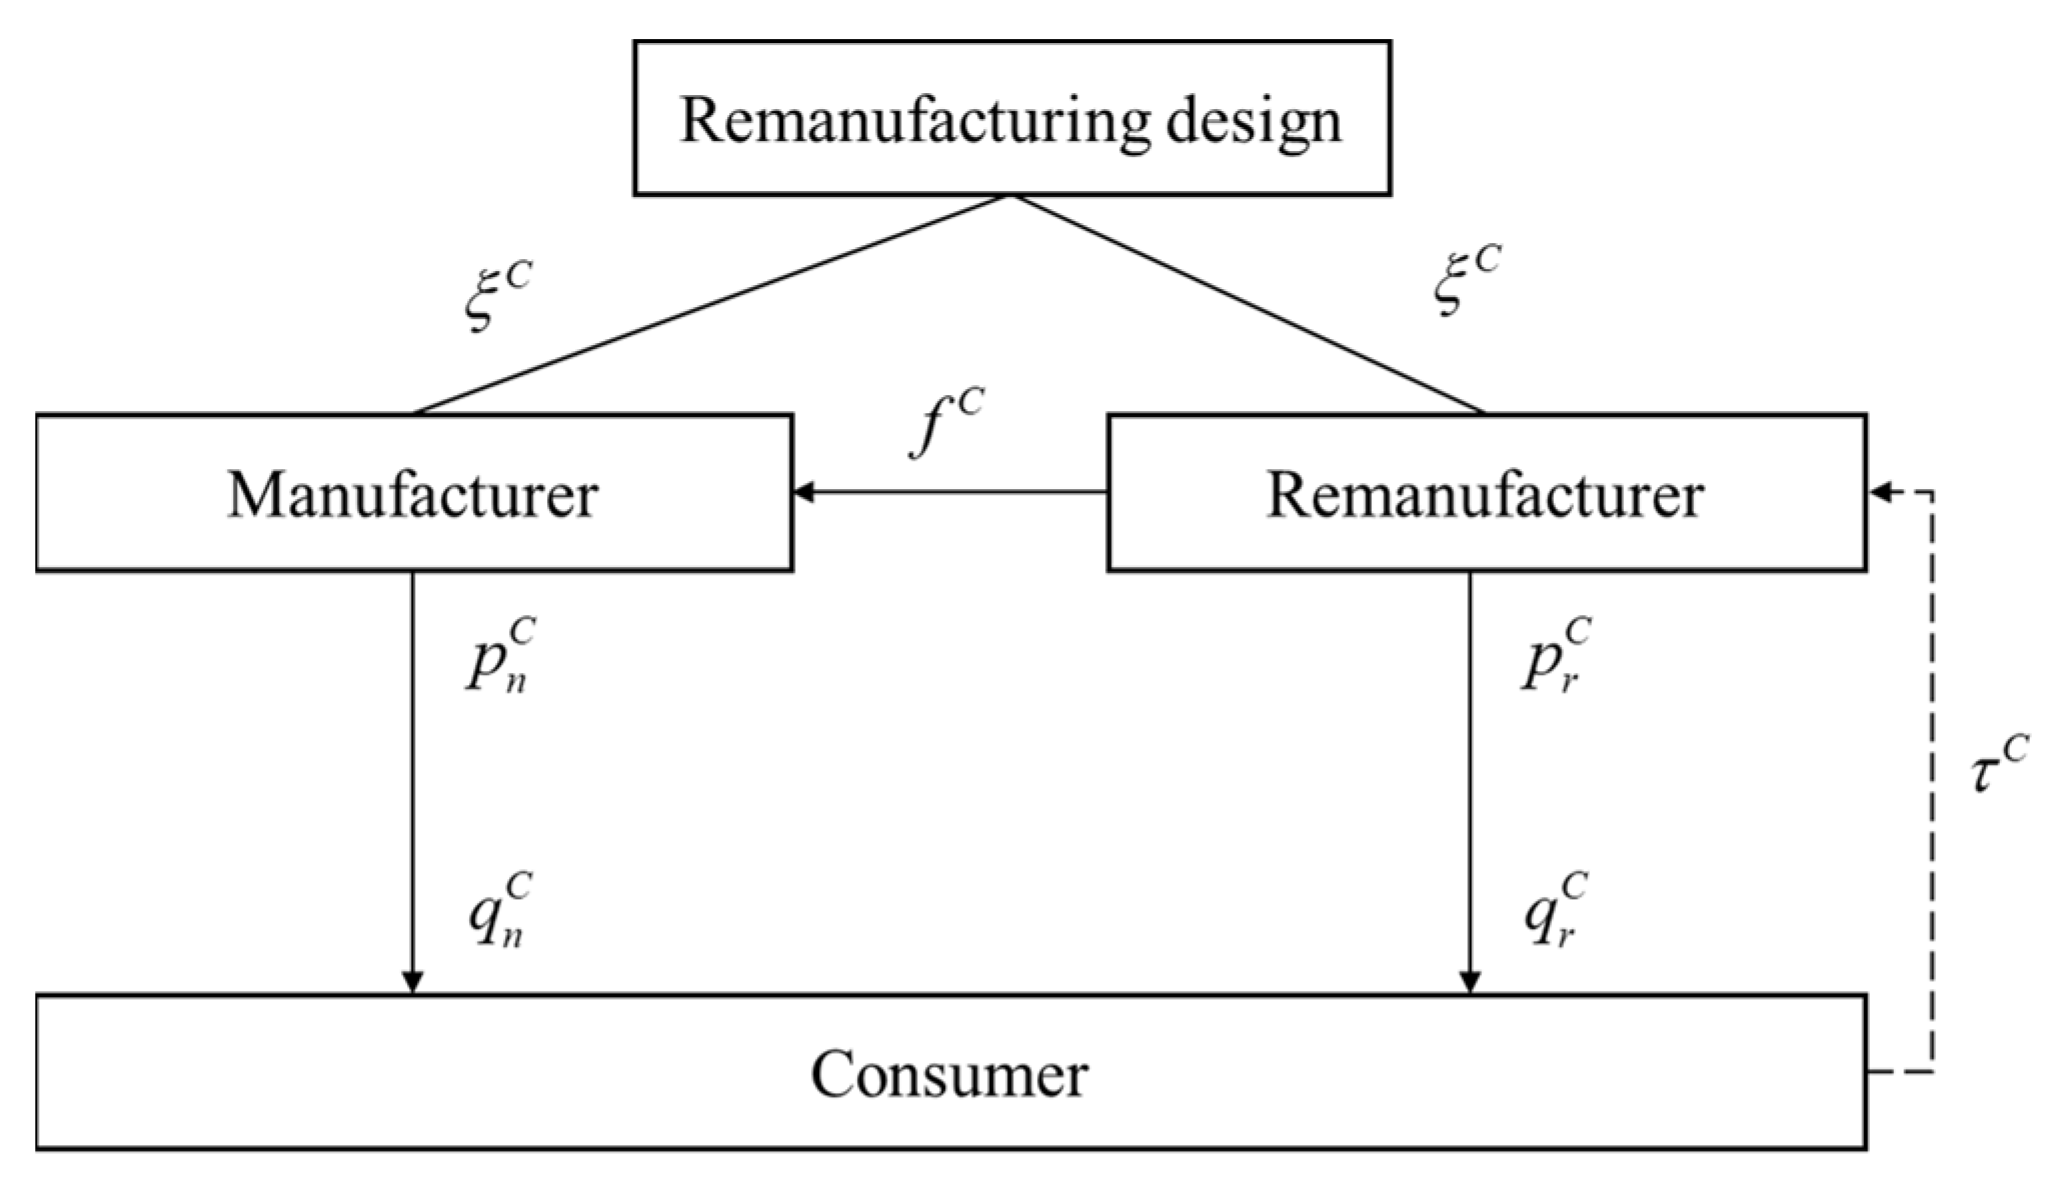
Figure 4.
Contractual coordination decision-making.
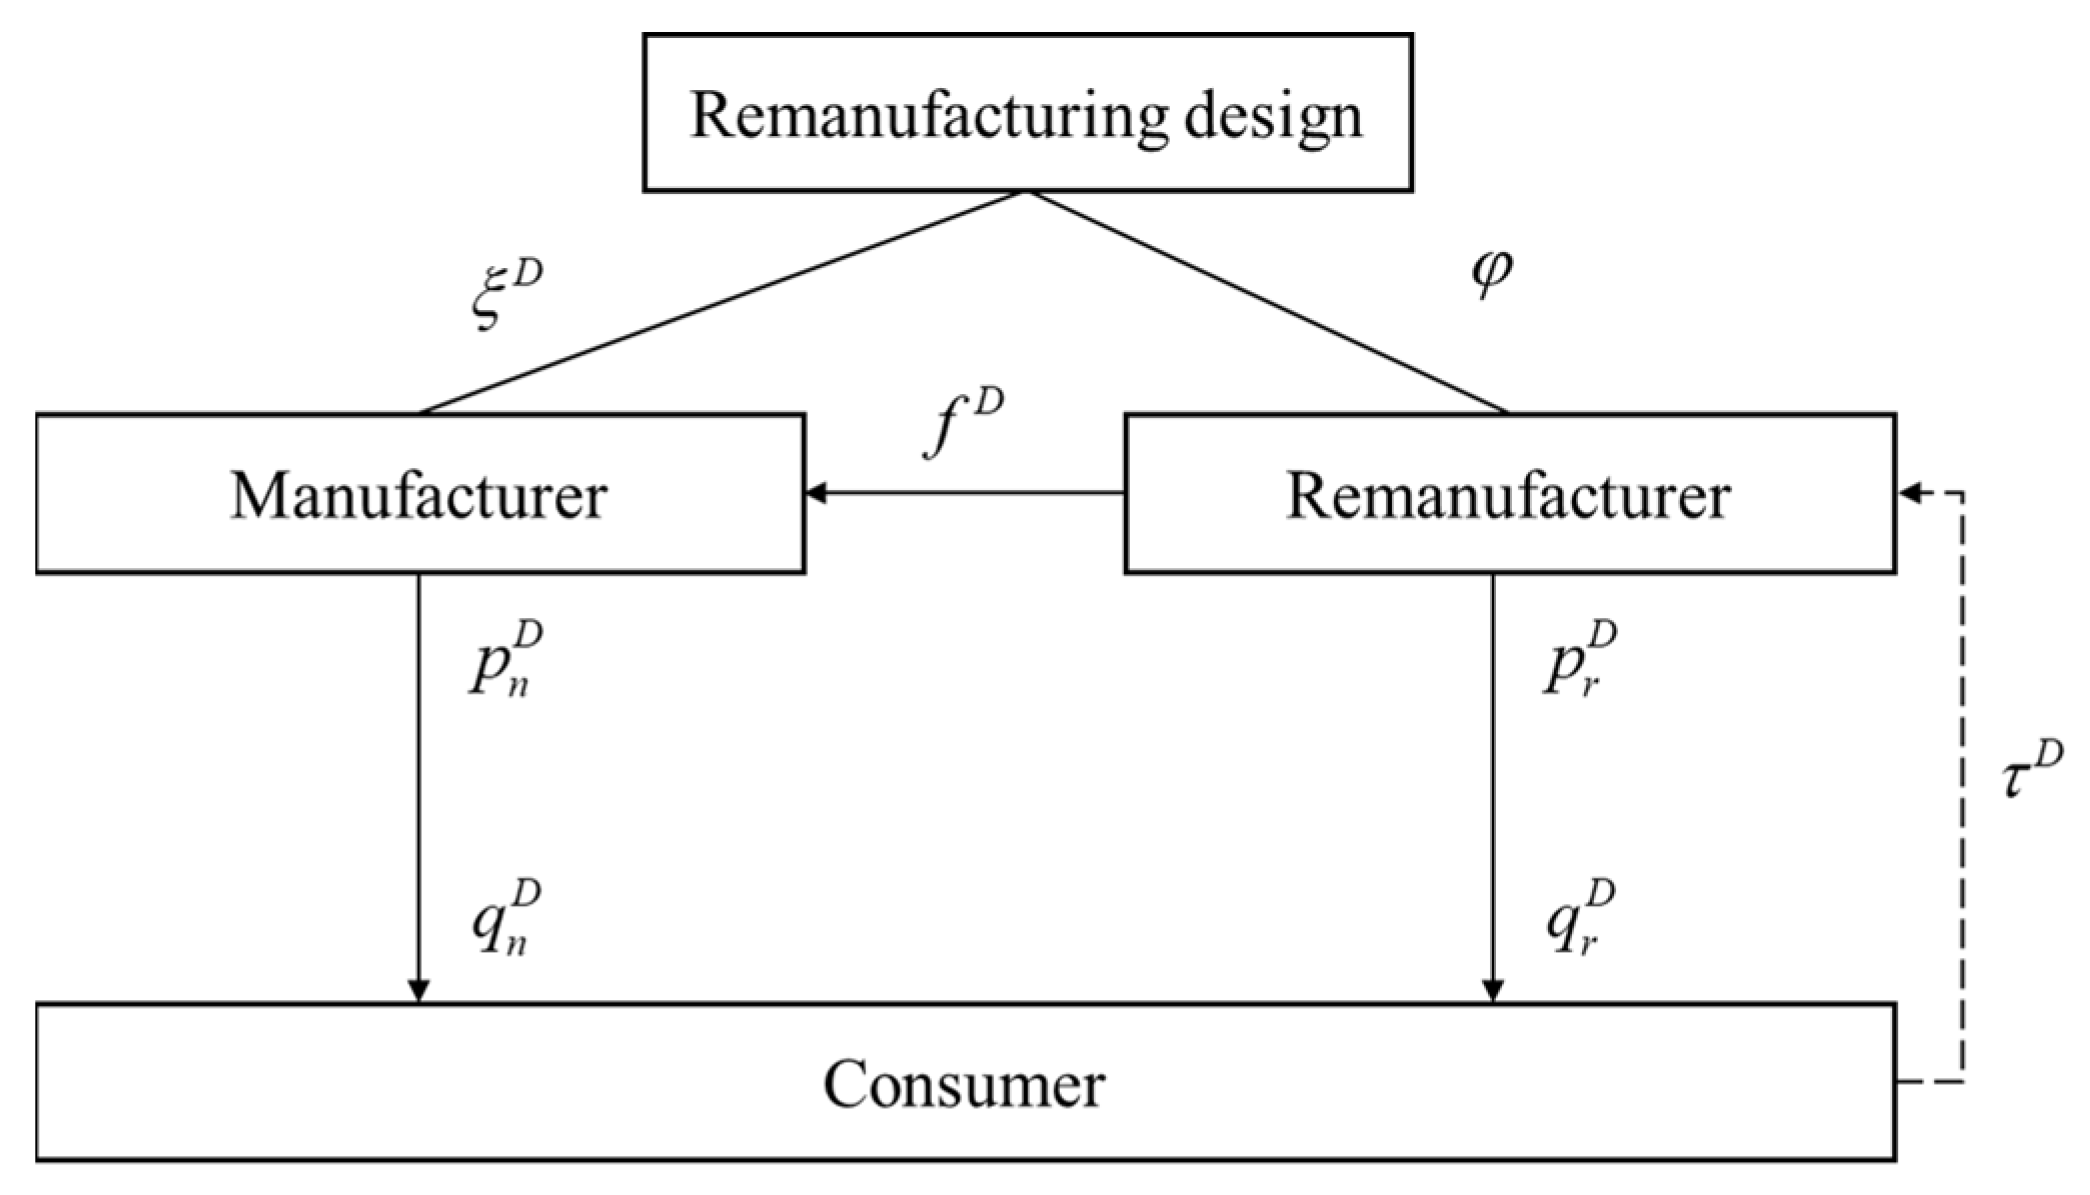
Figure 5.
The effect of on .
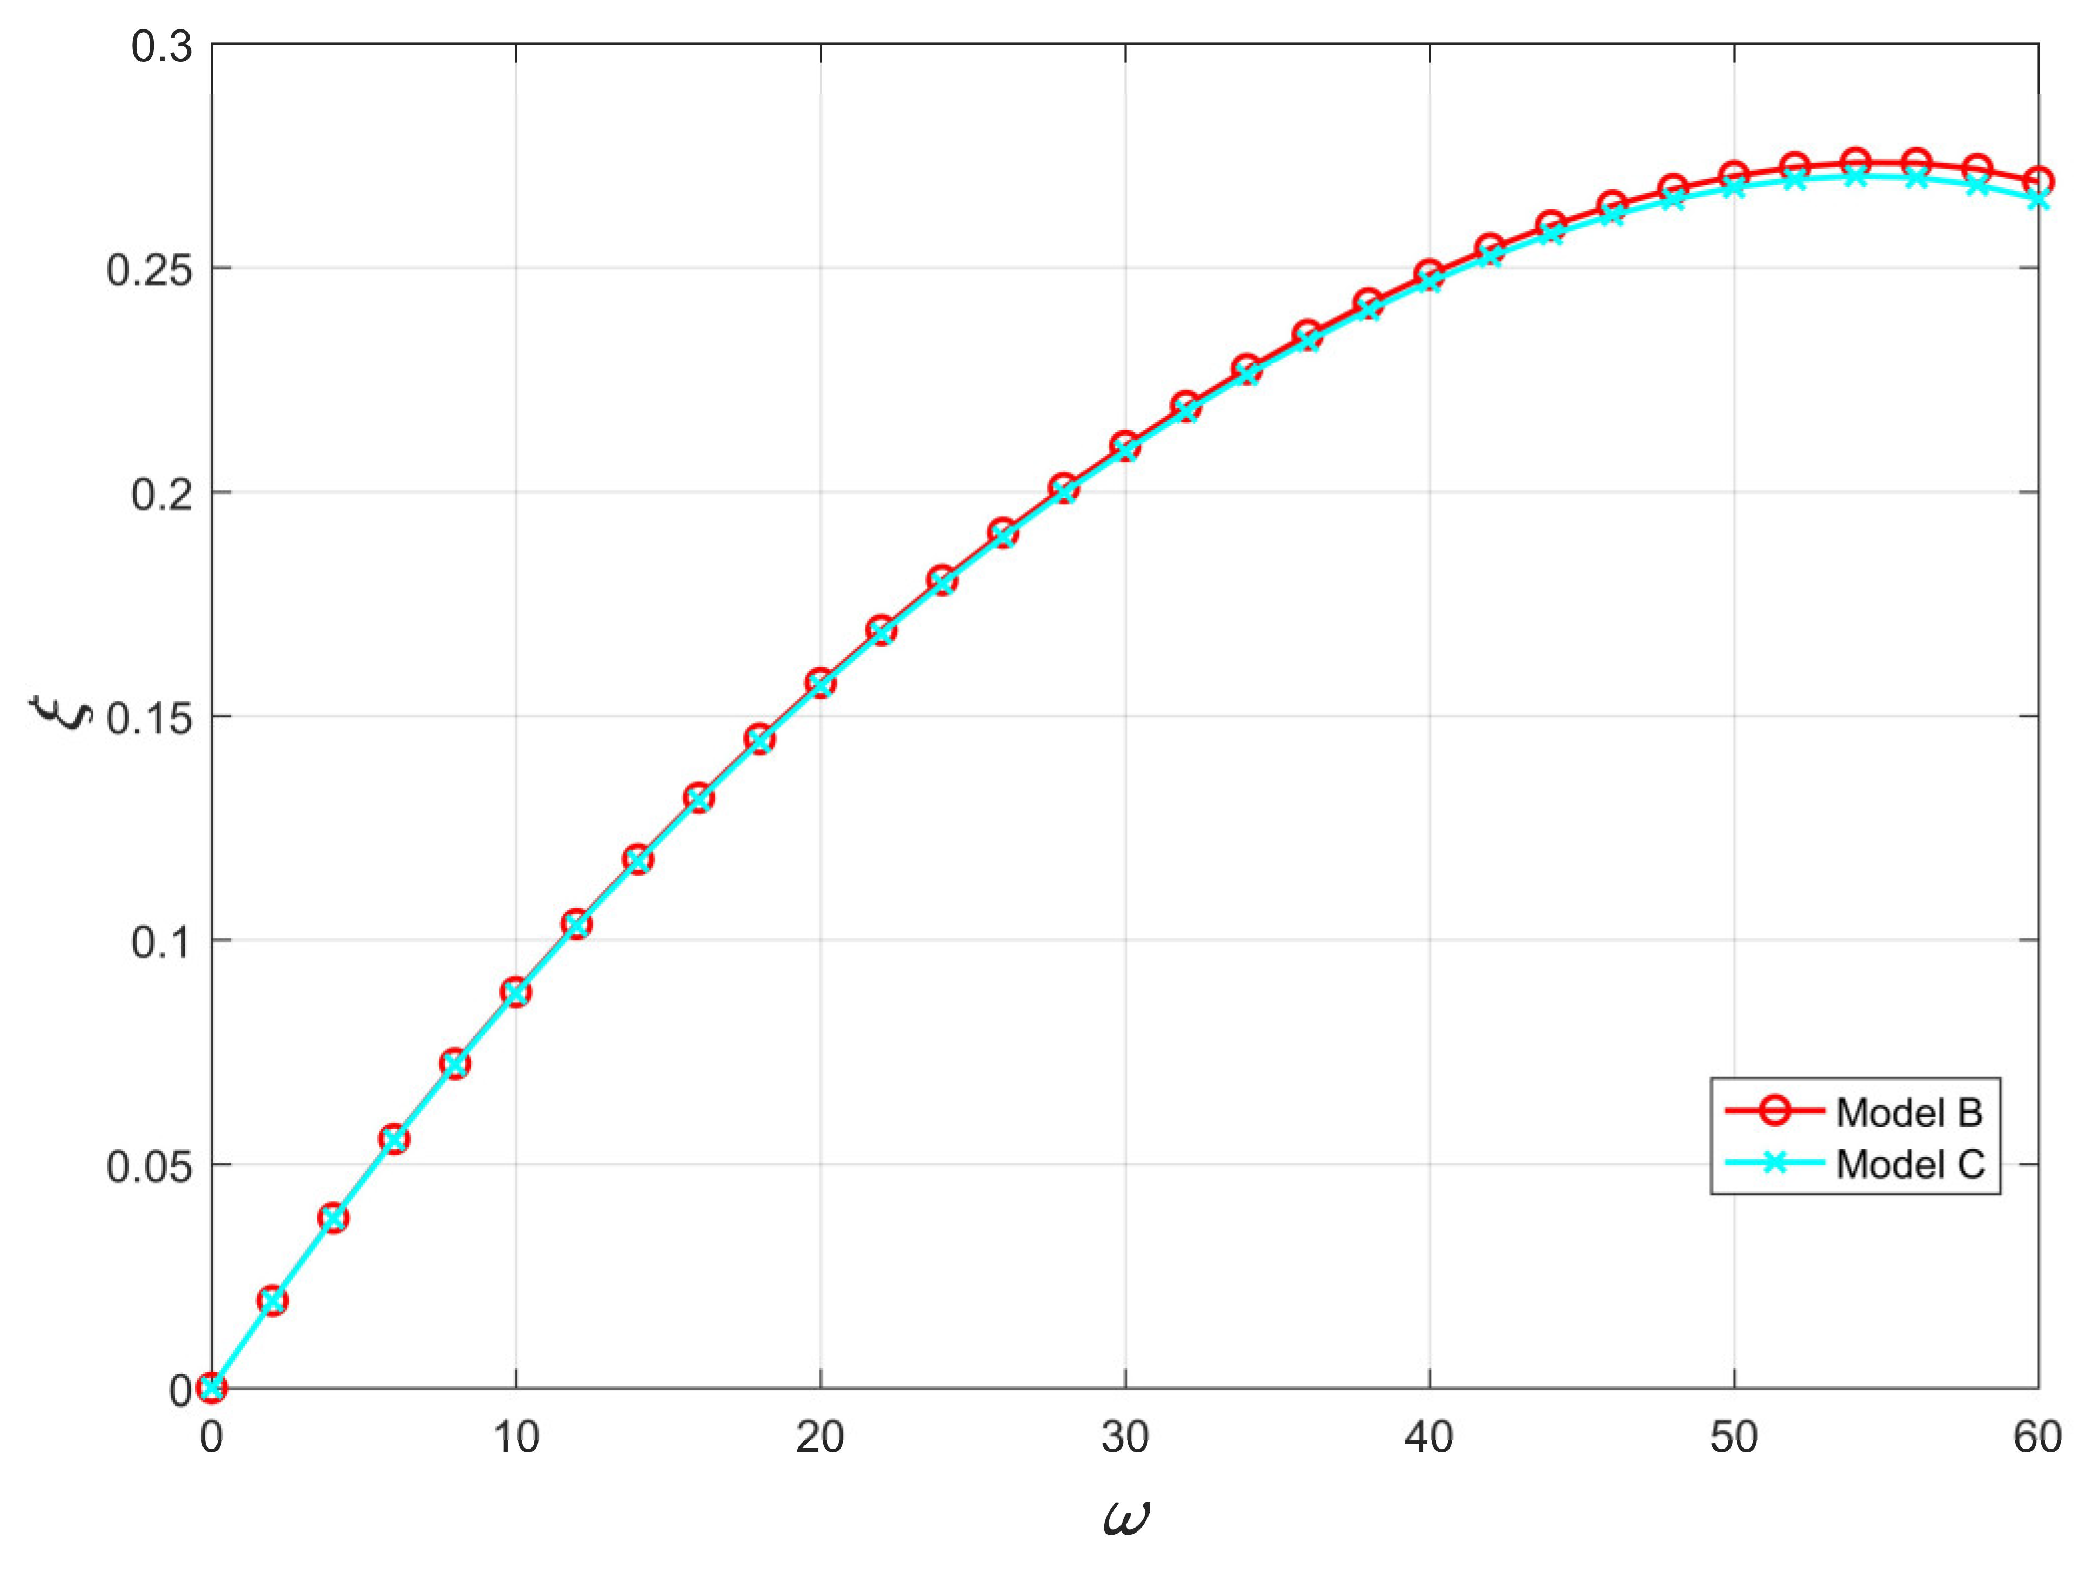
Figure 6.
The effect of on .
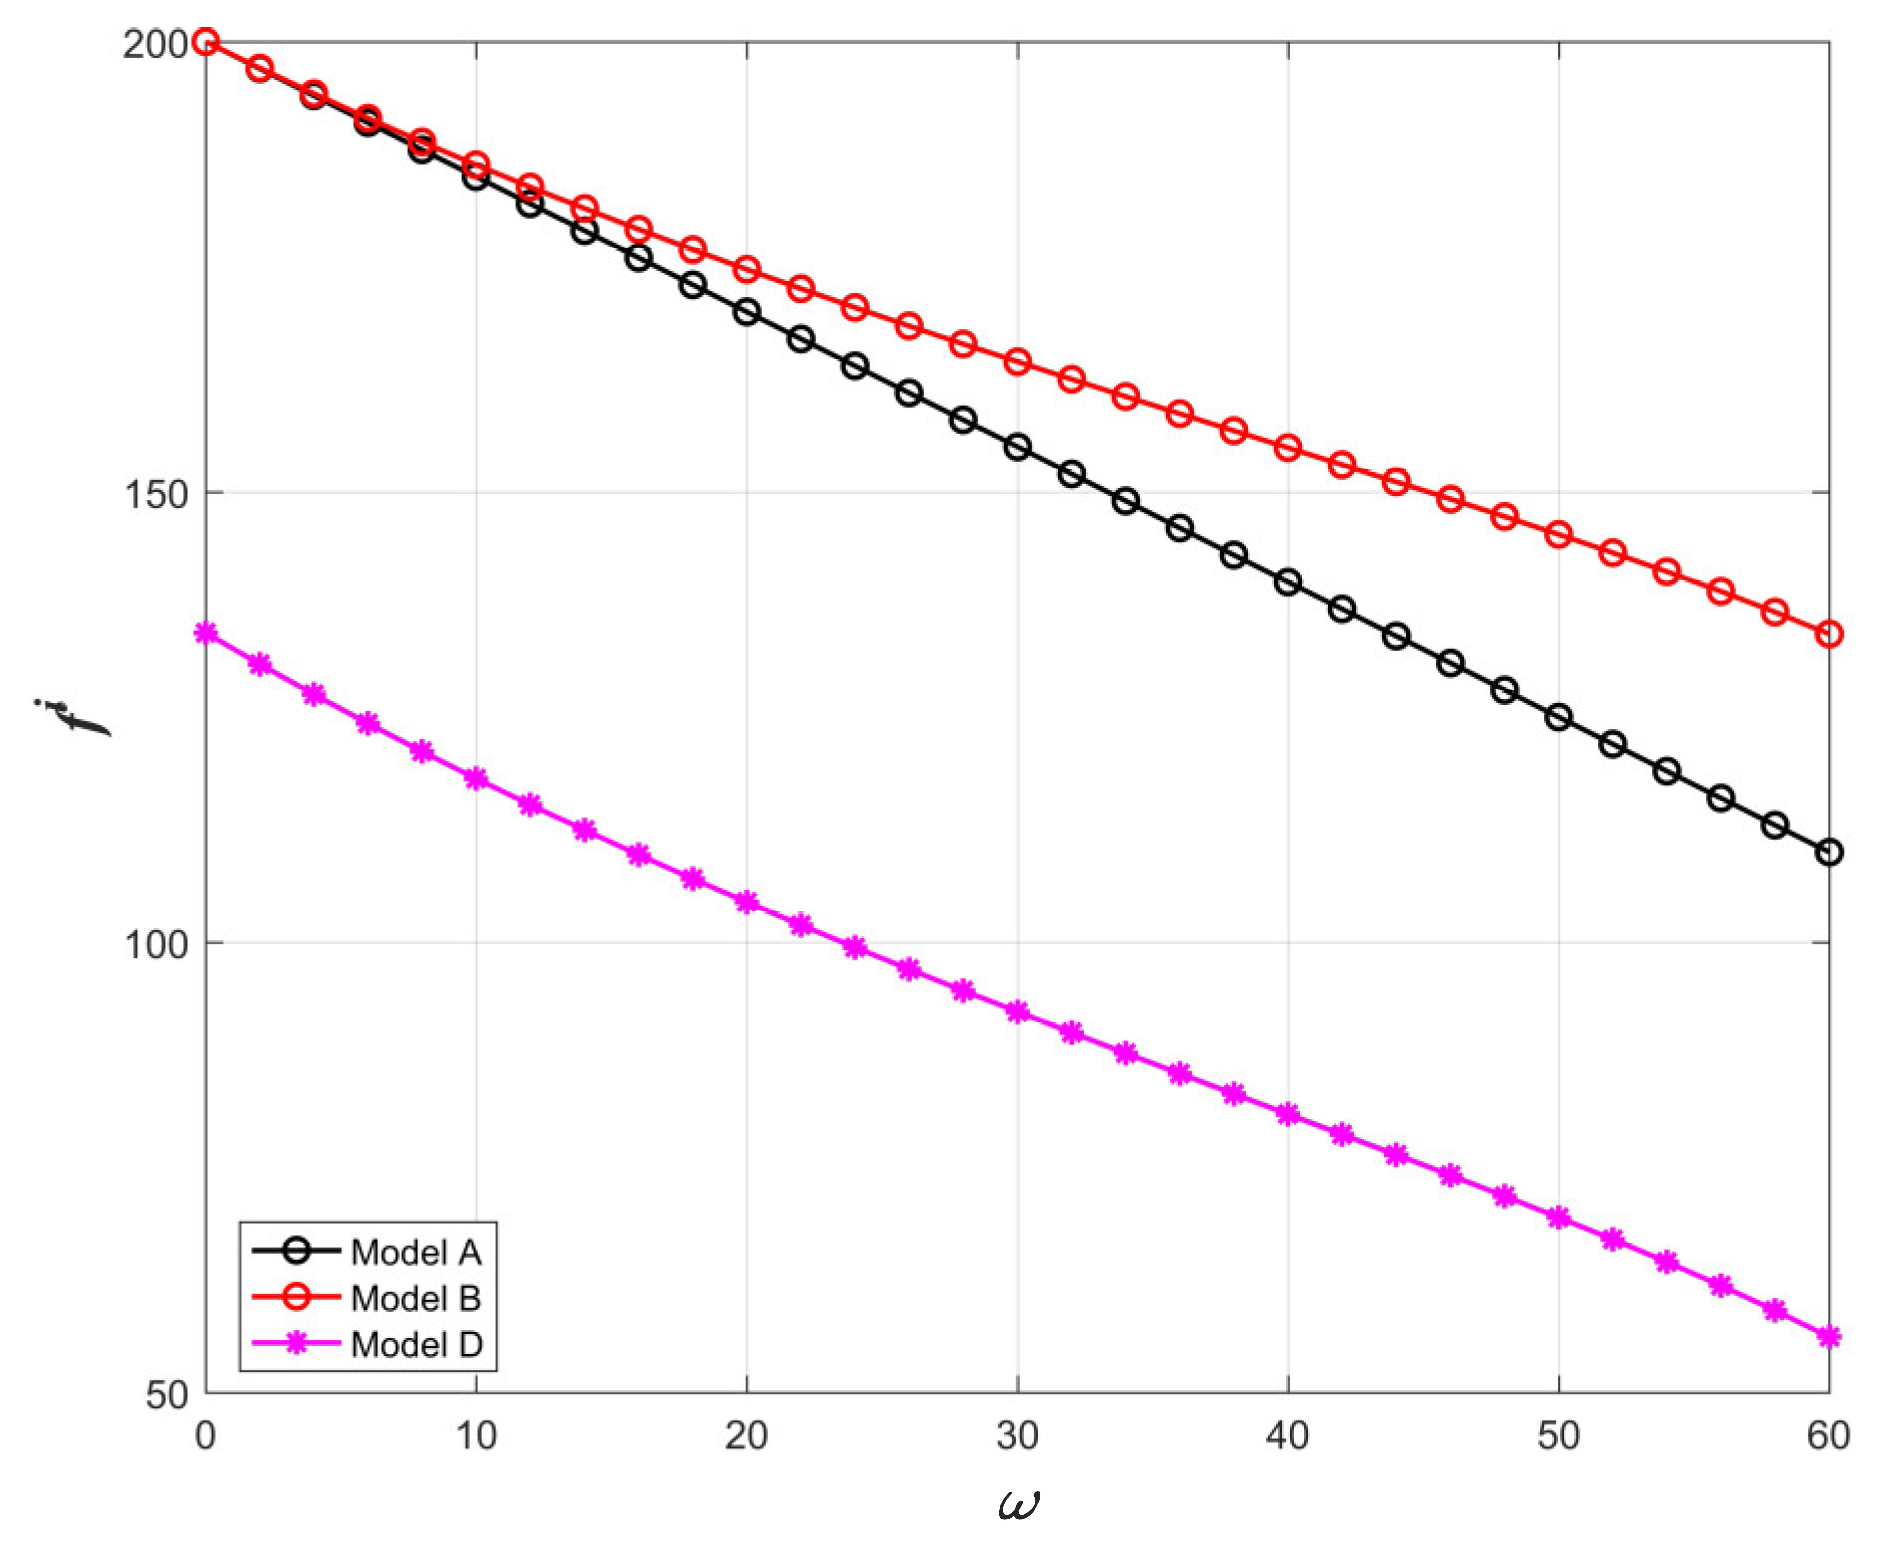
Figure 7.
The effect of on .
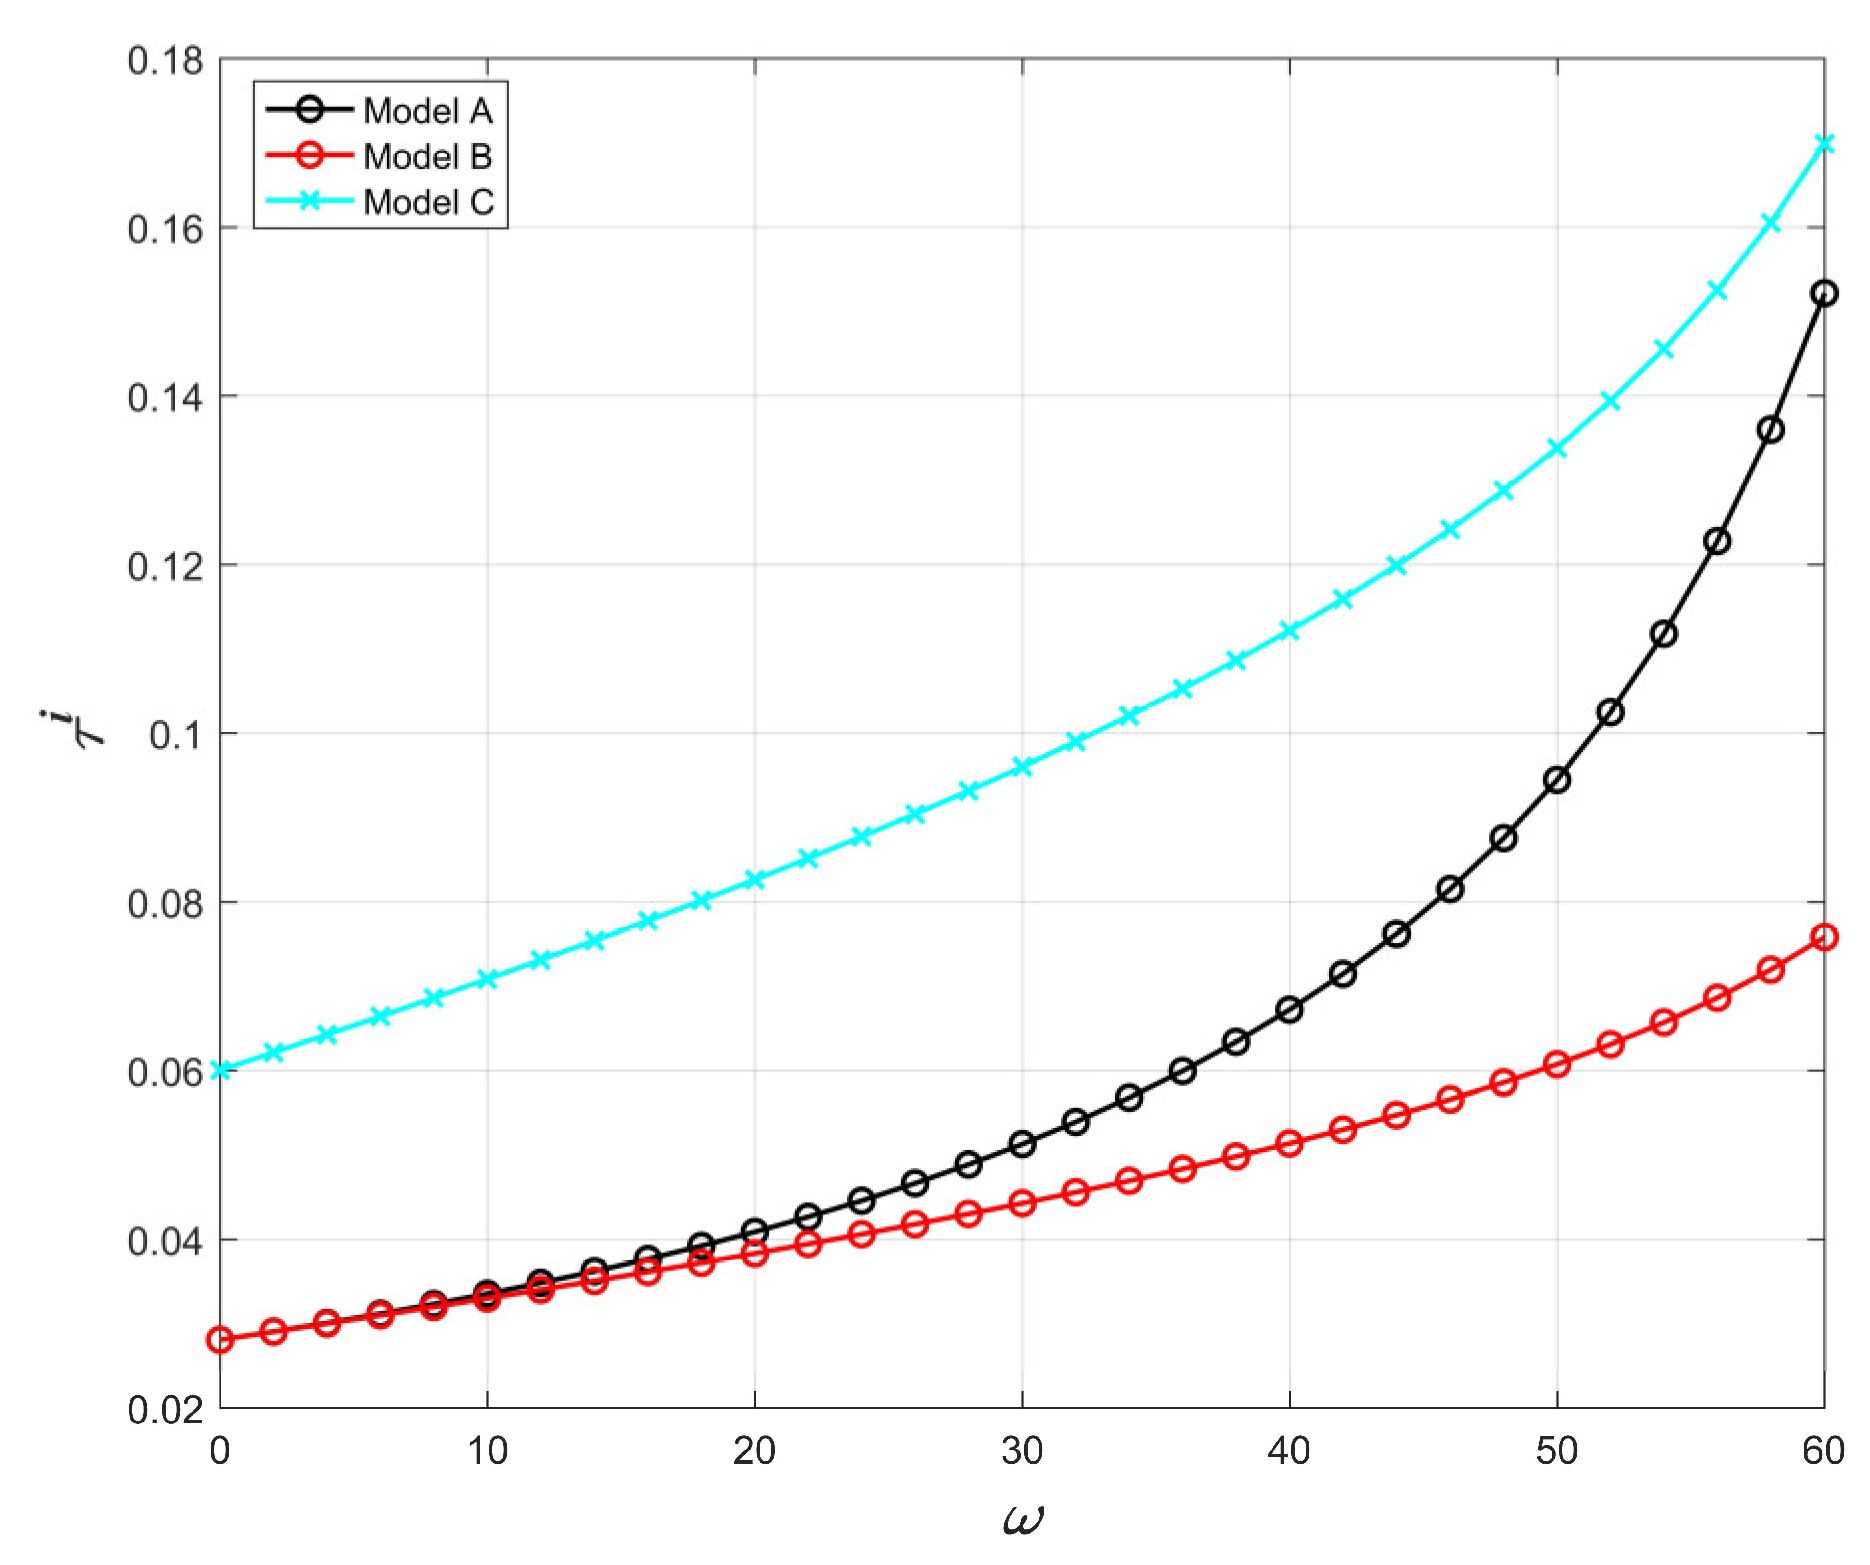
Figure 8.
The effect of on .
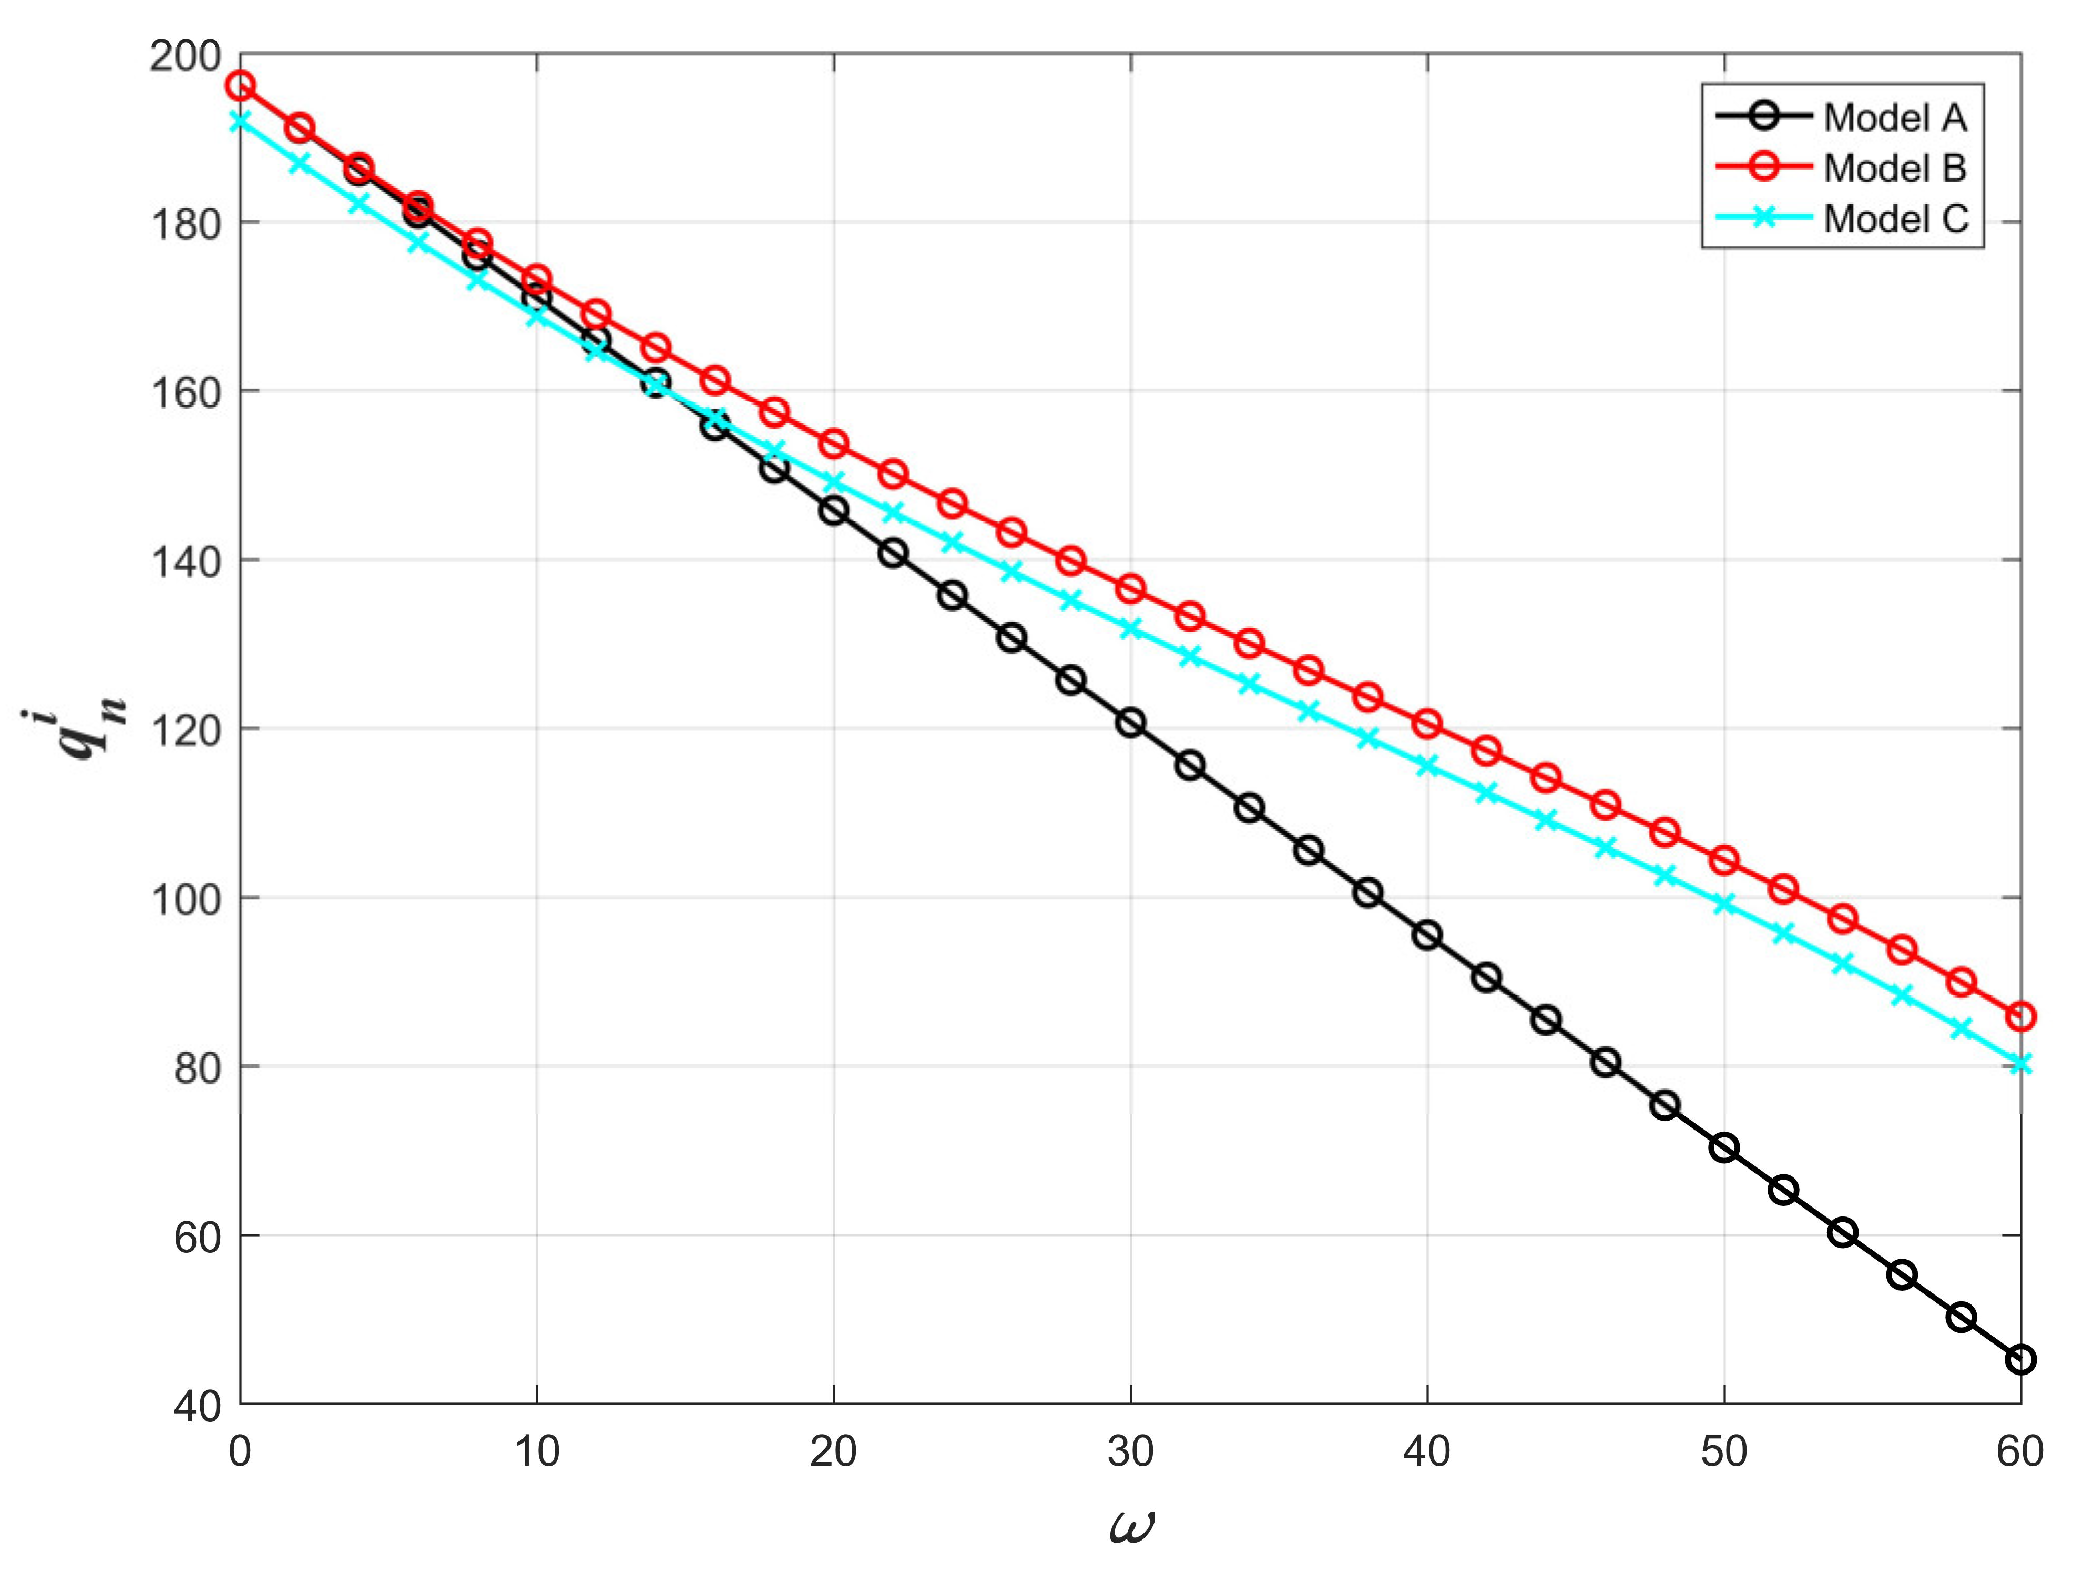
Figure 9.
The effect of on .
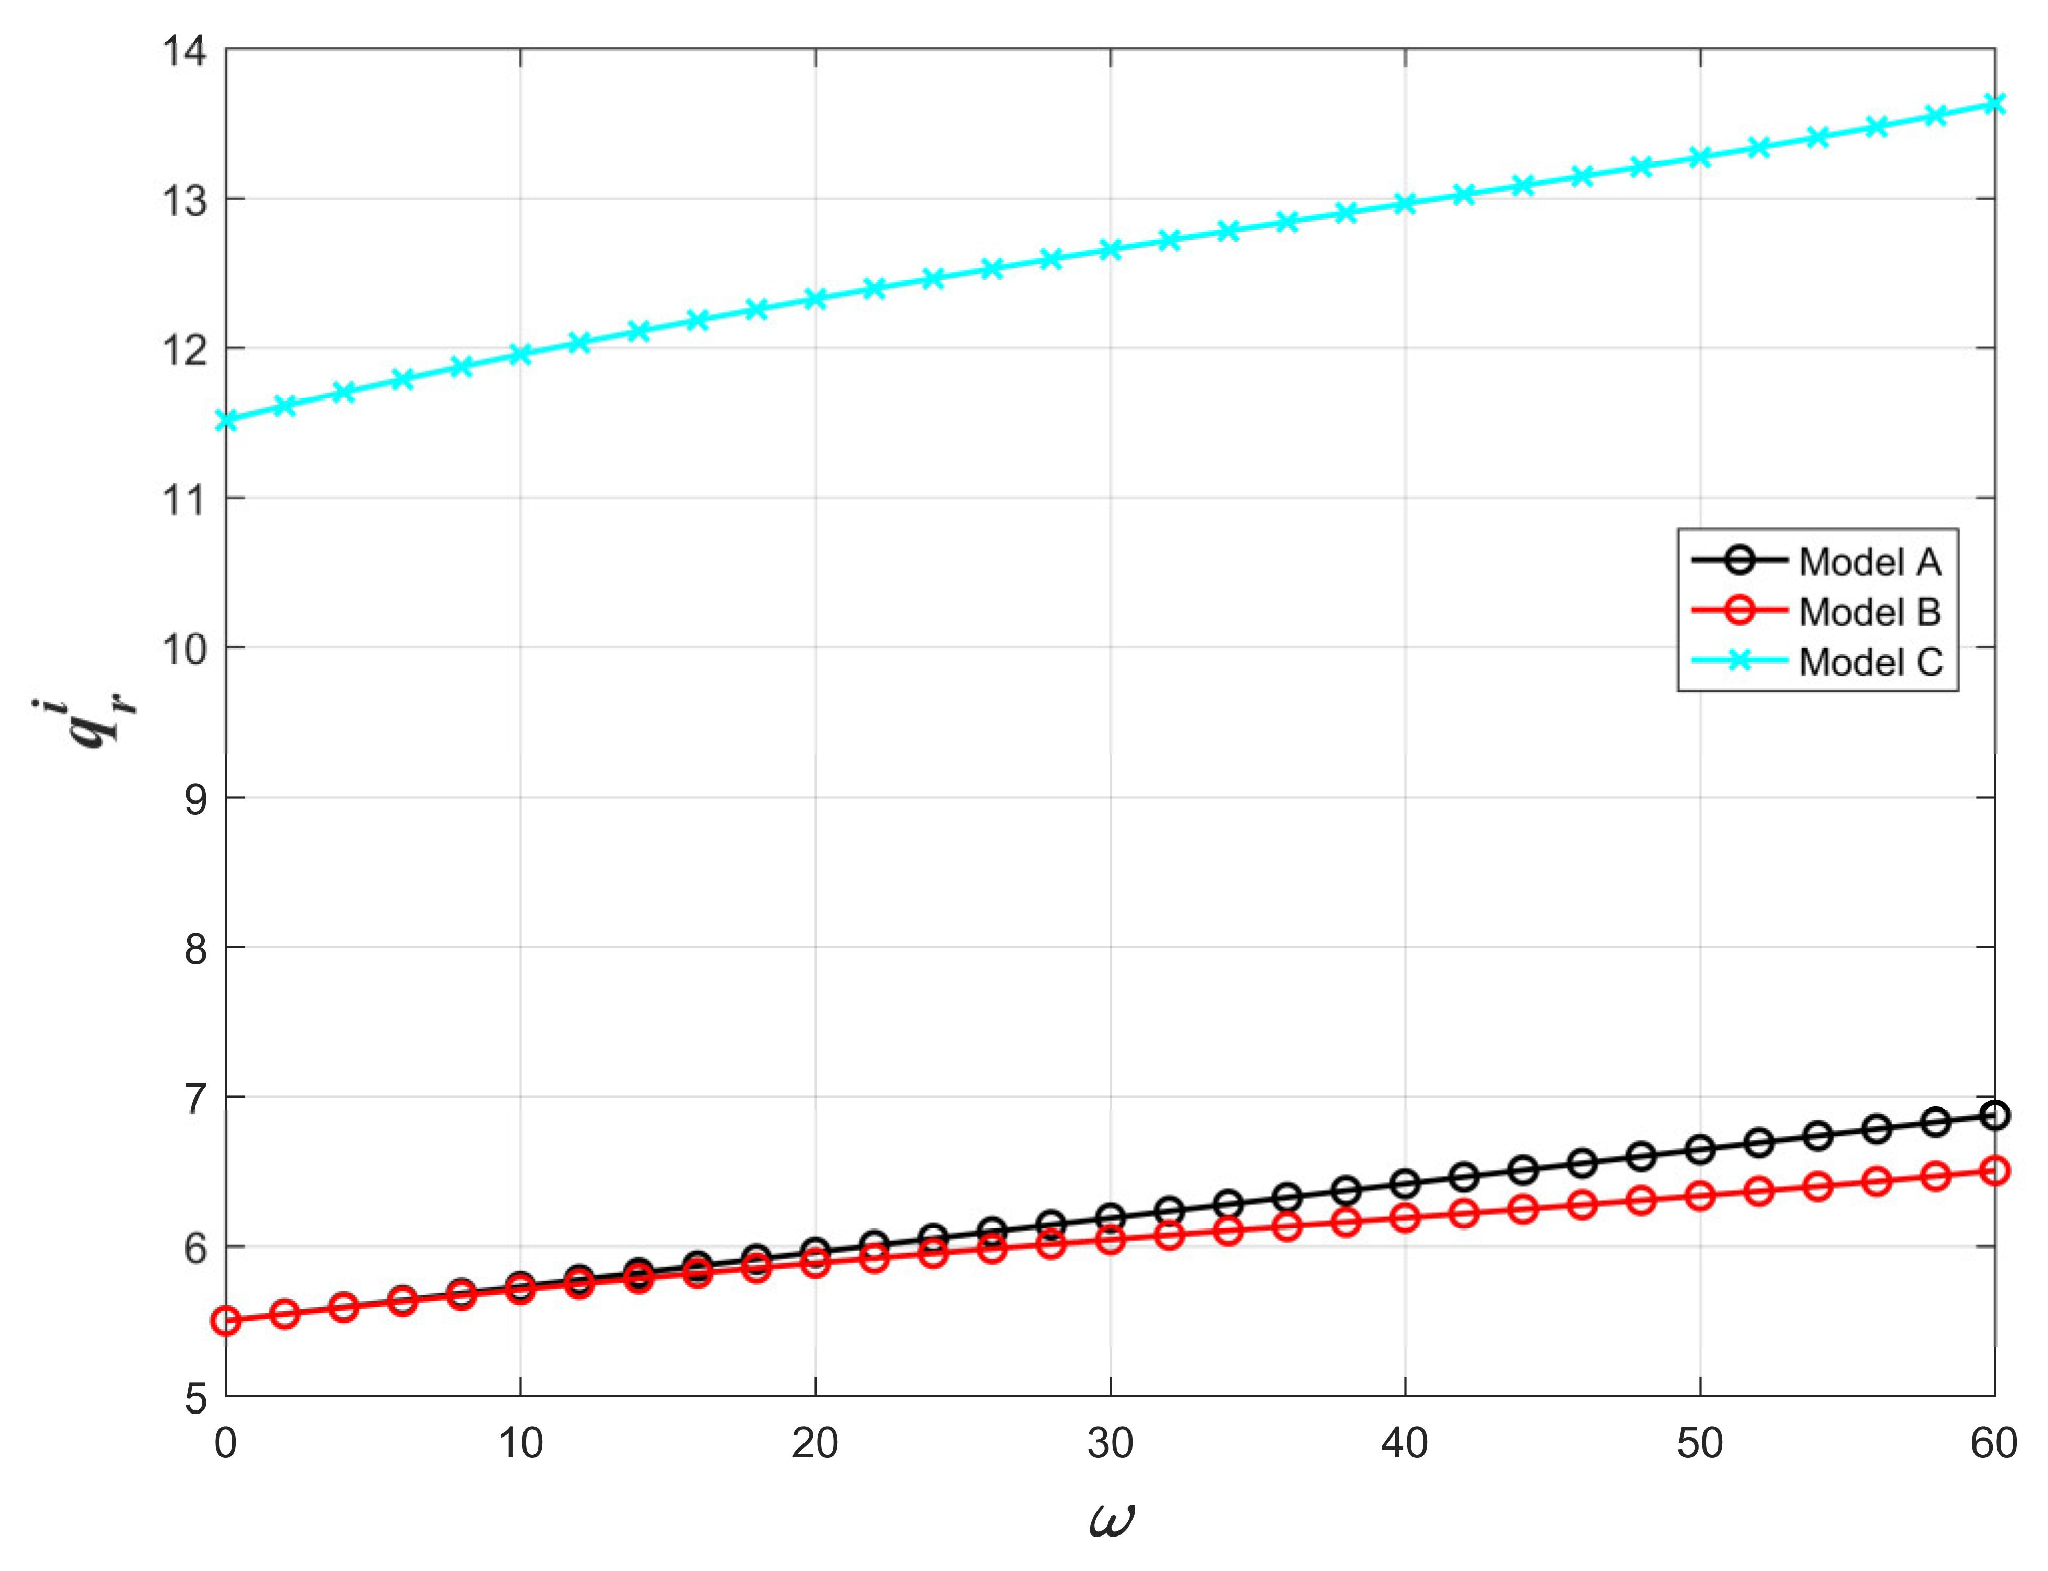
Figure 10.
The effect of on .
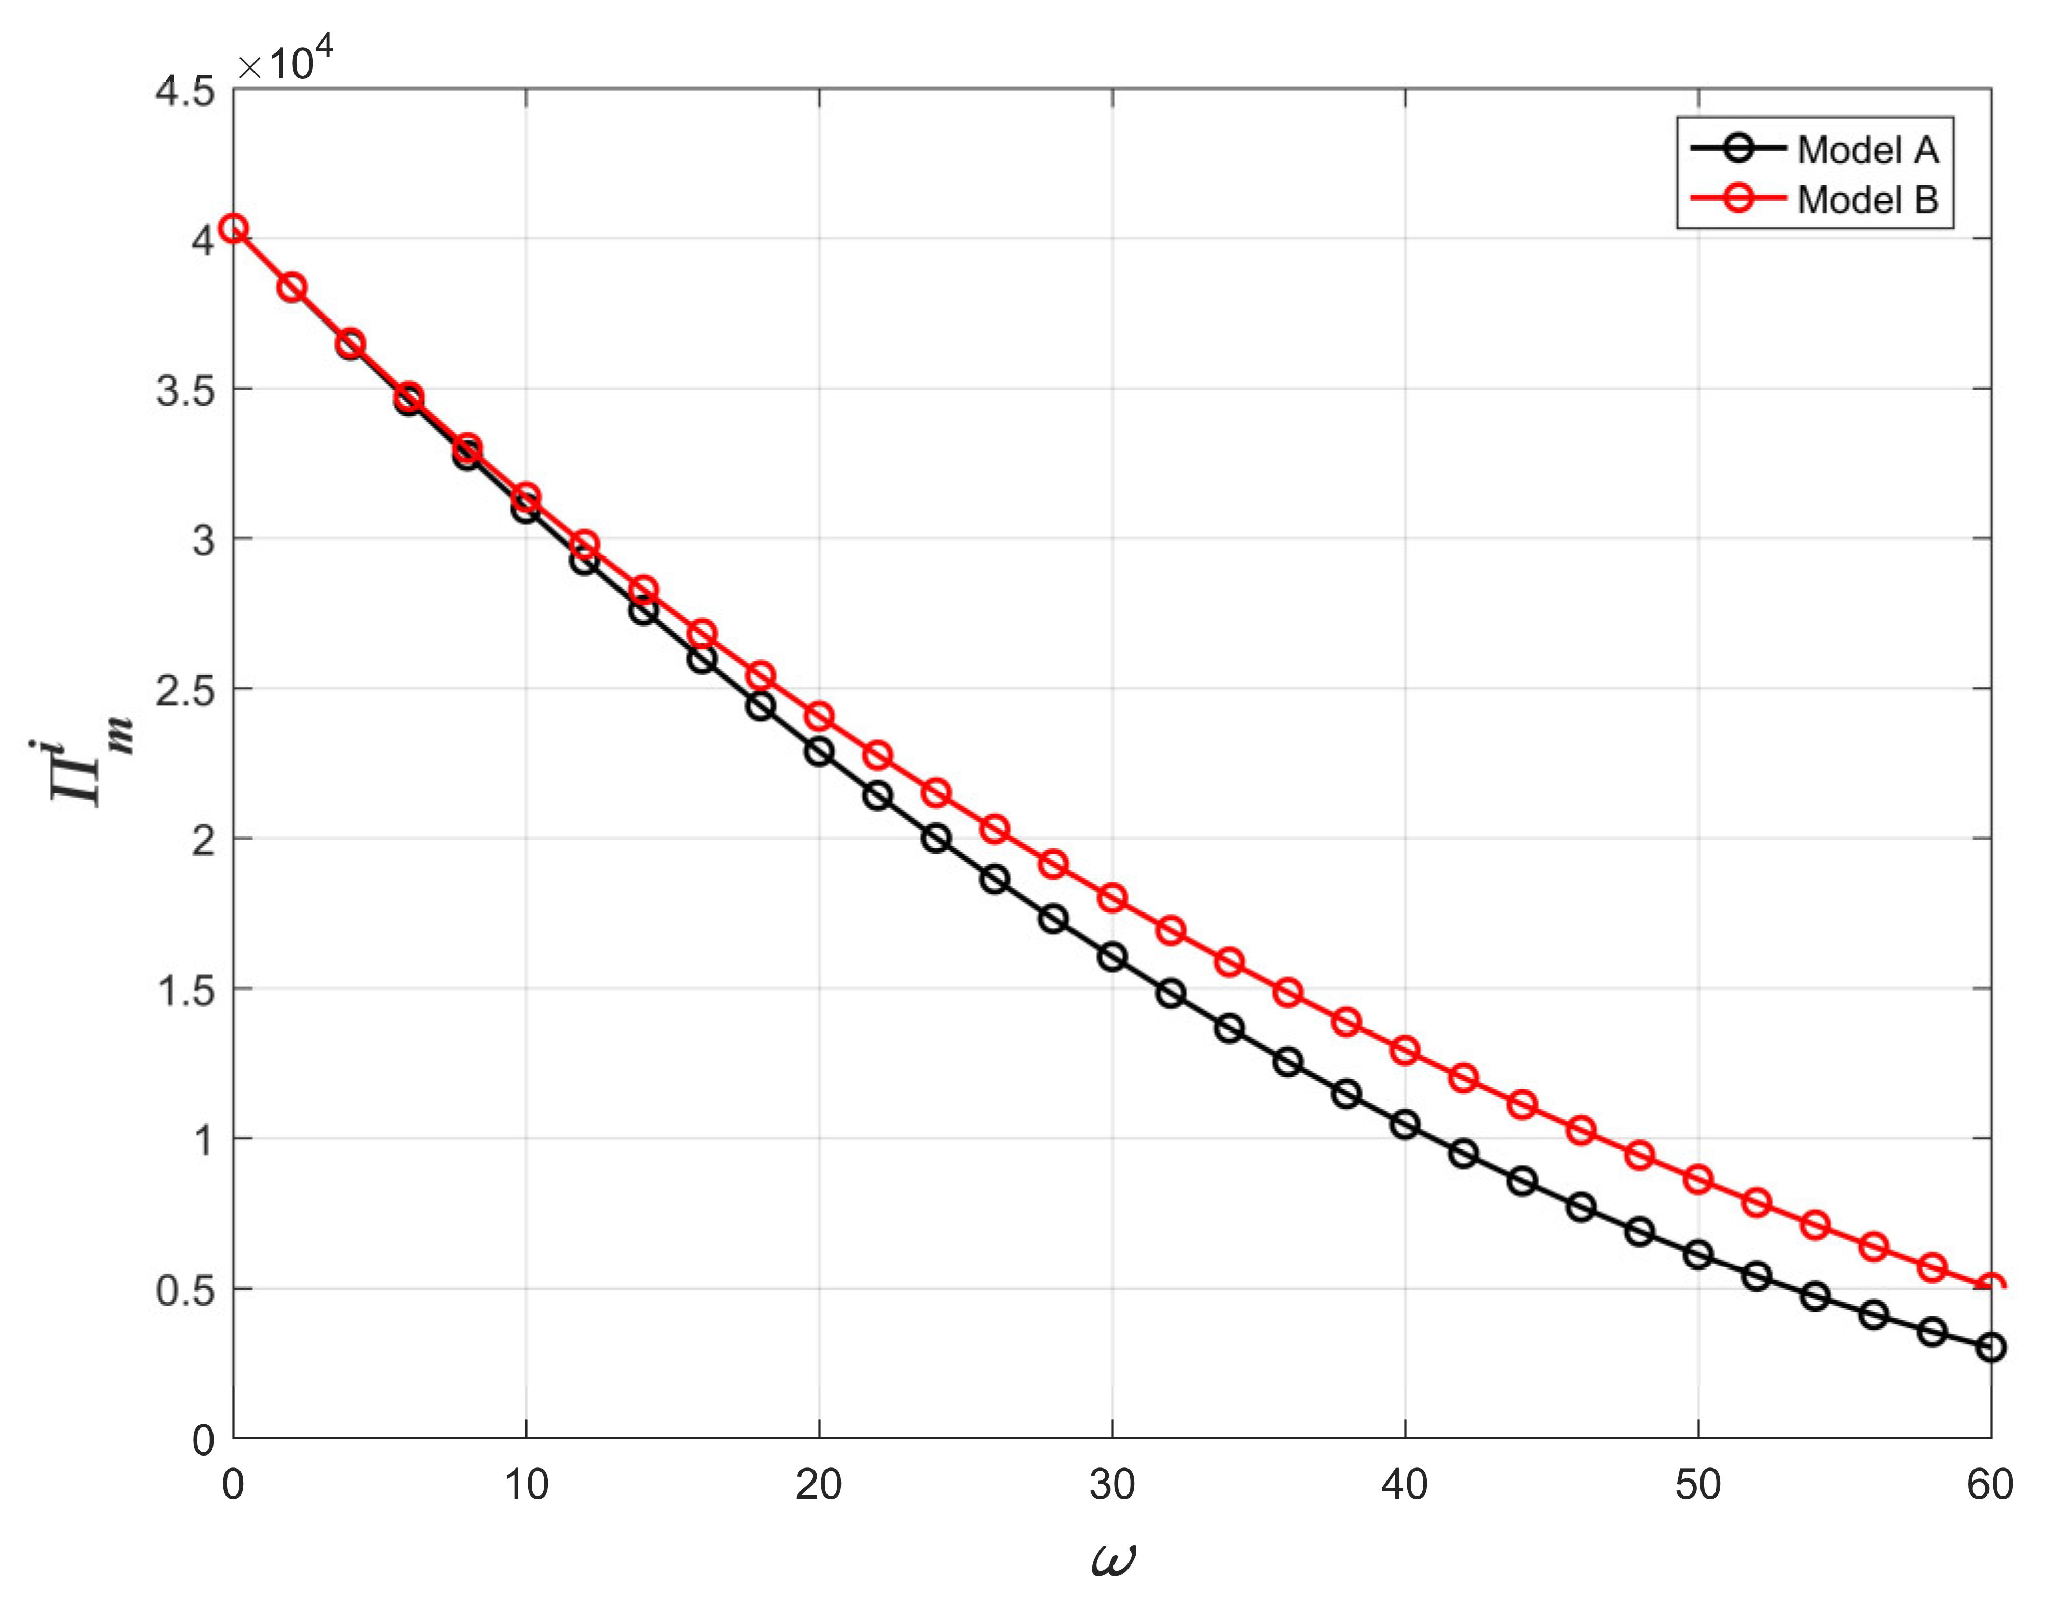
Figure 11.
The effect of on .
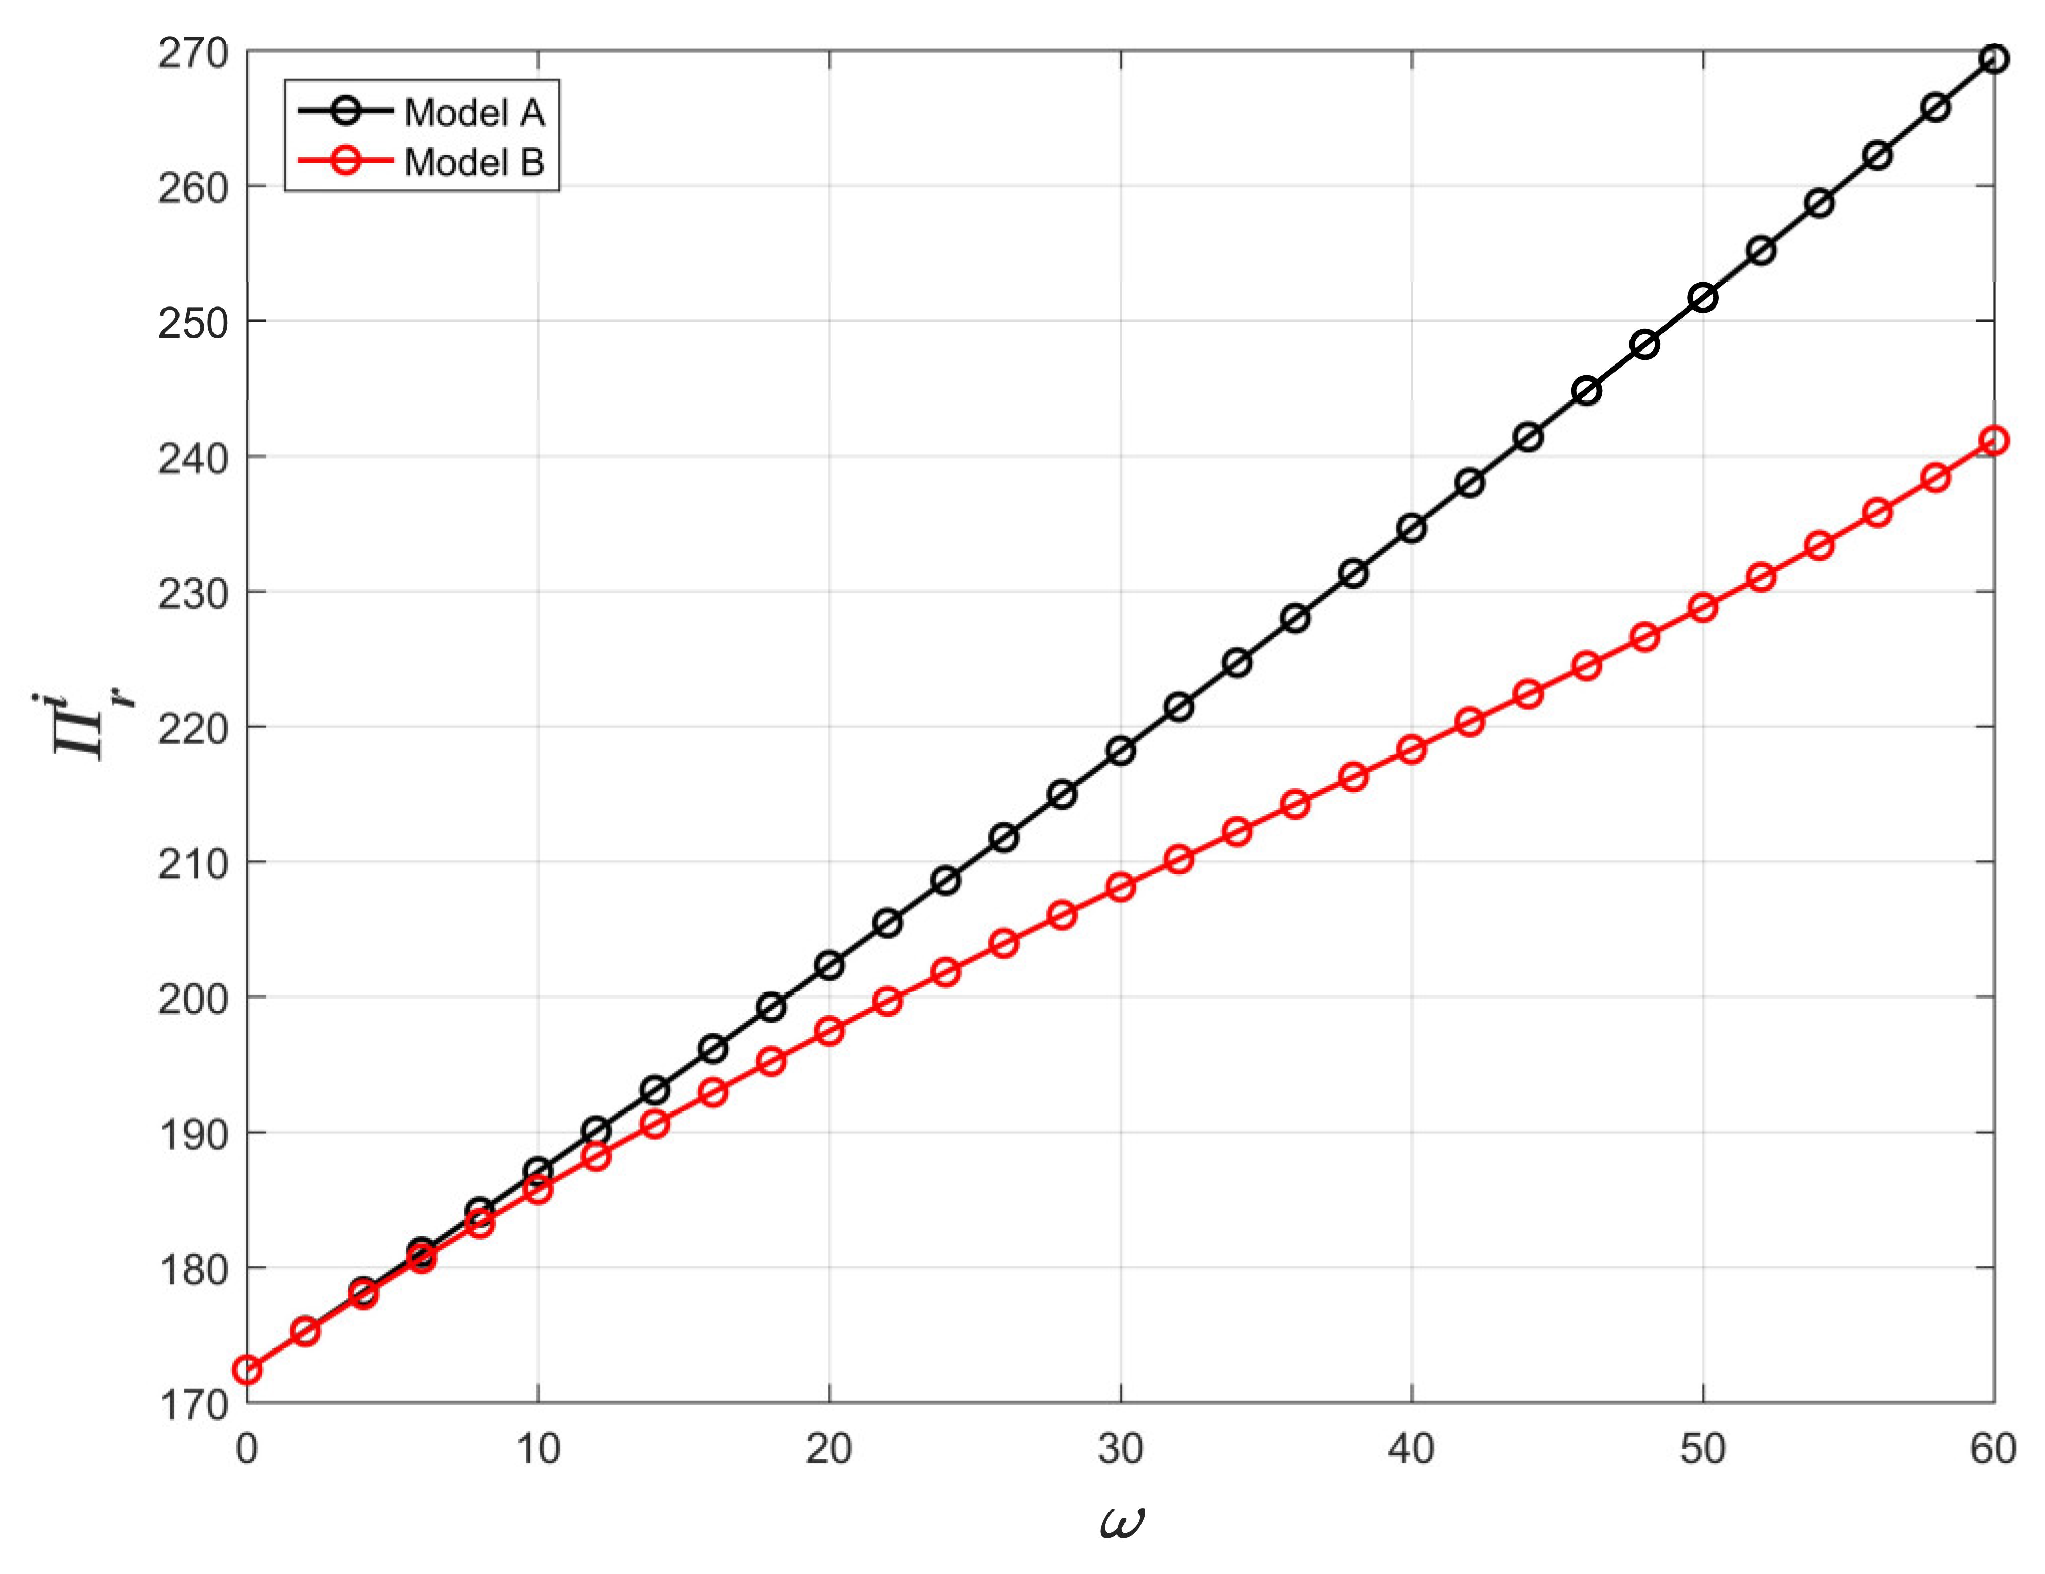
Figure 12.
The effect of on .

Figure 13.
The effect of on .

Figure 14.
The effect of on .
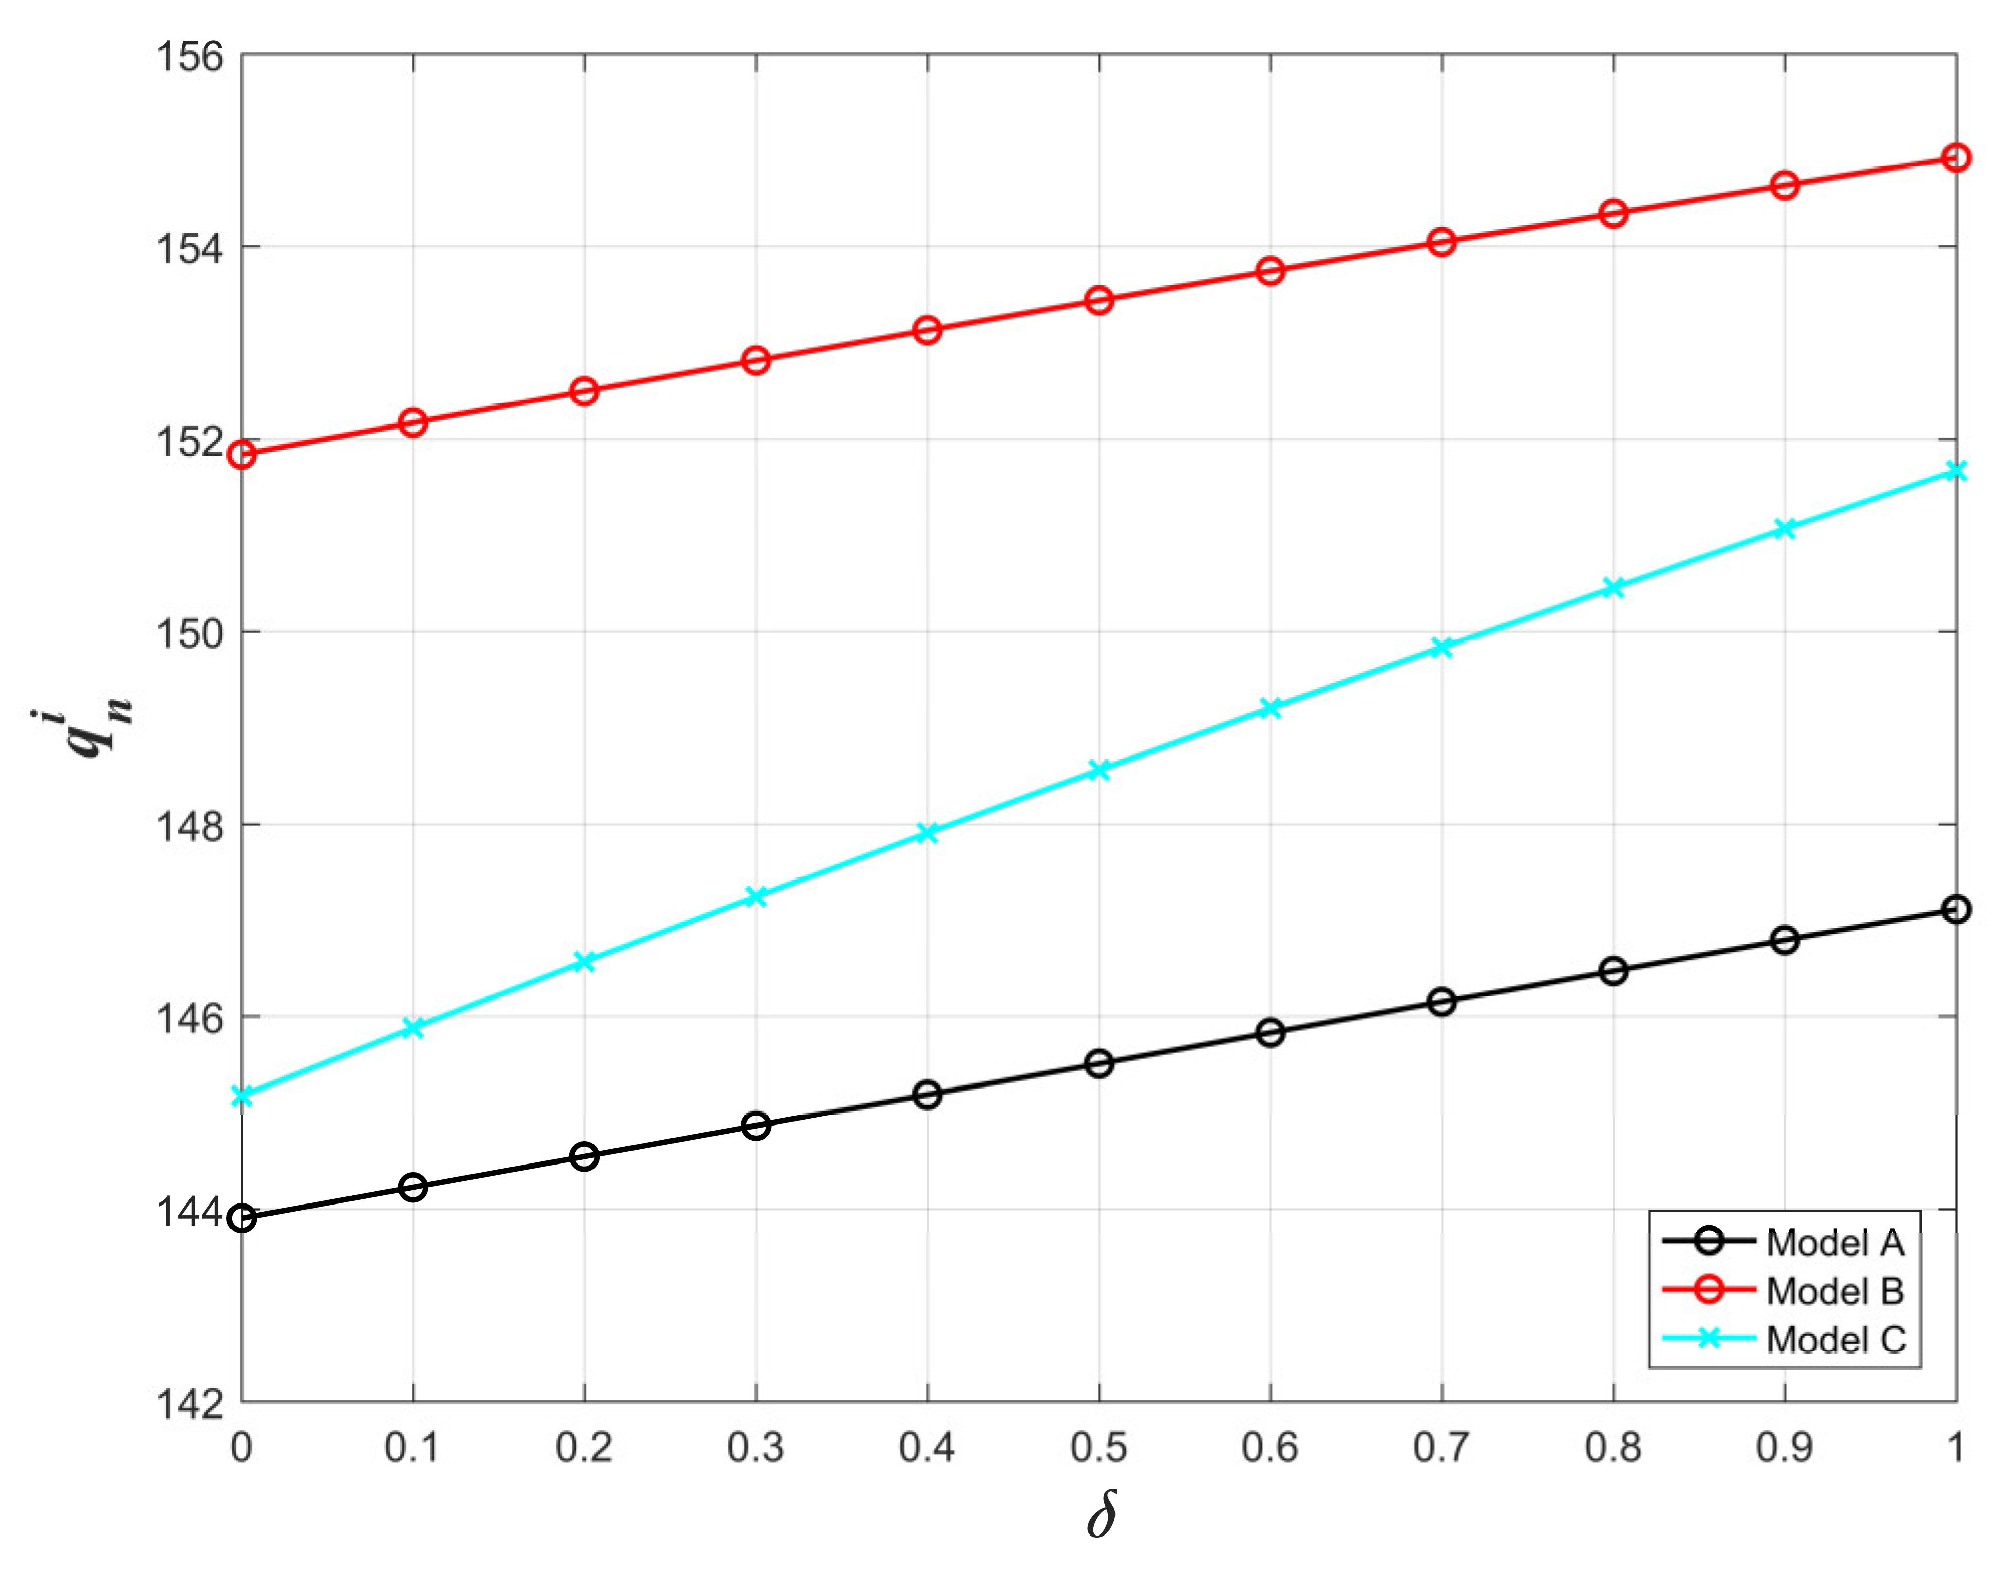
Figure 15.
The effect of on .
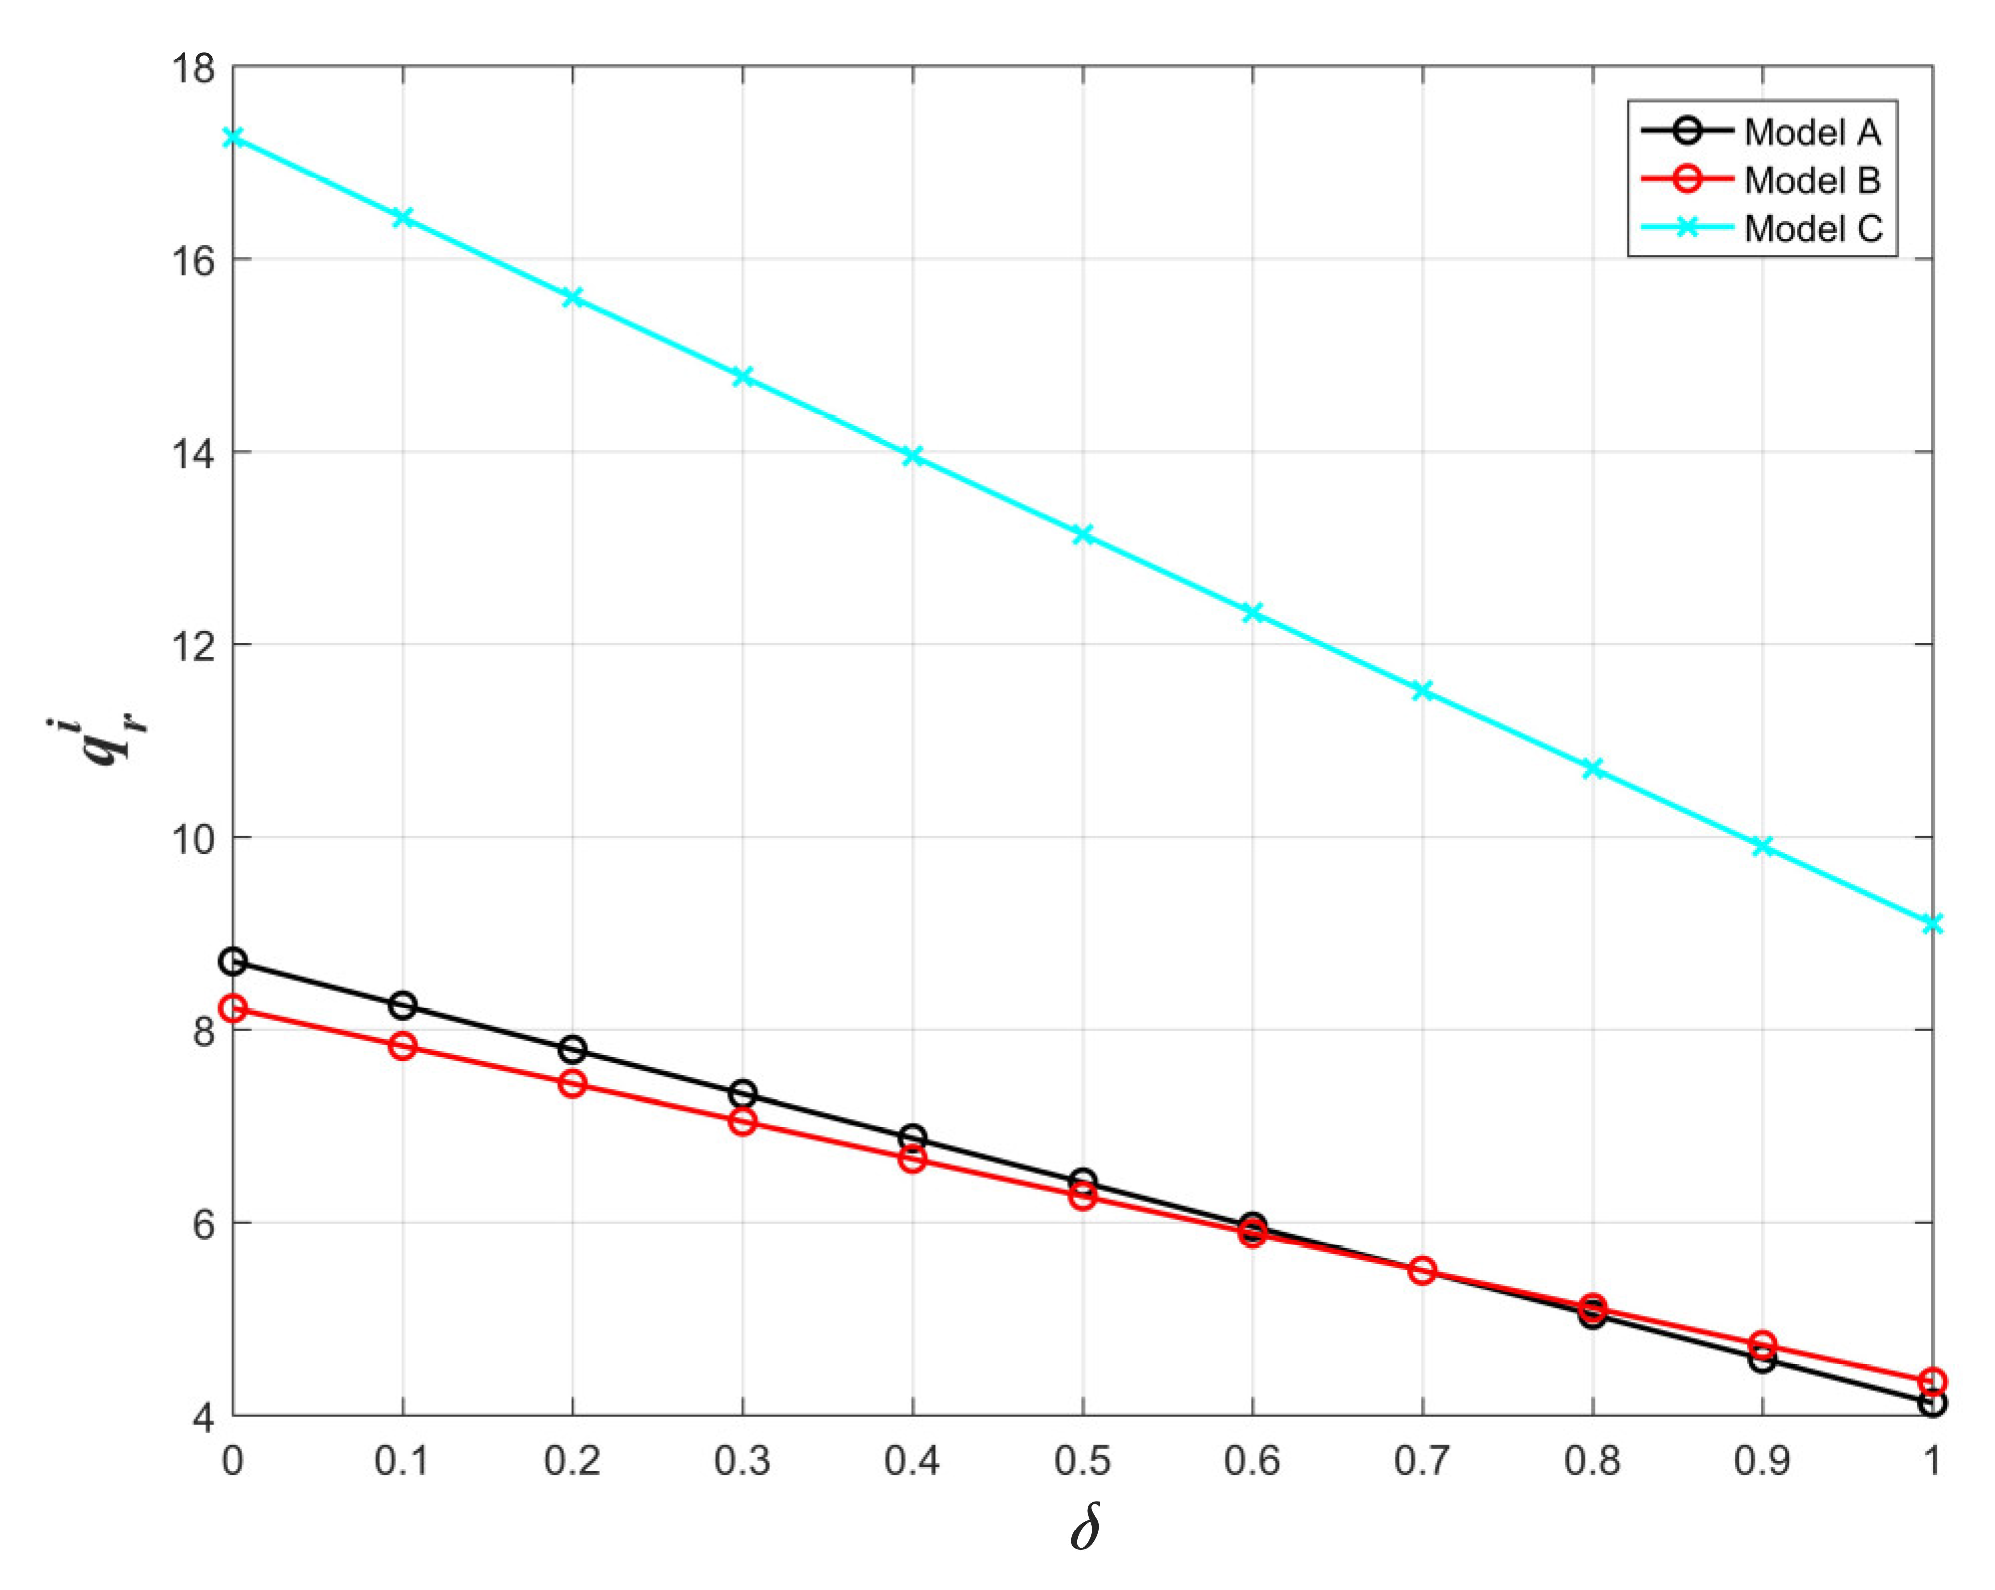
Figure 16.
The effect of on .
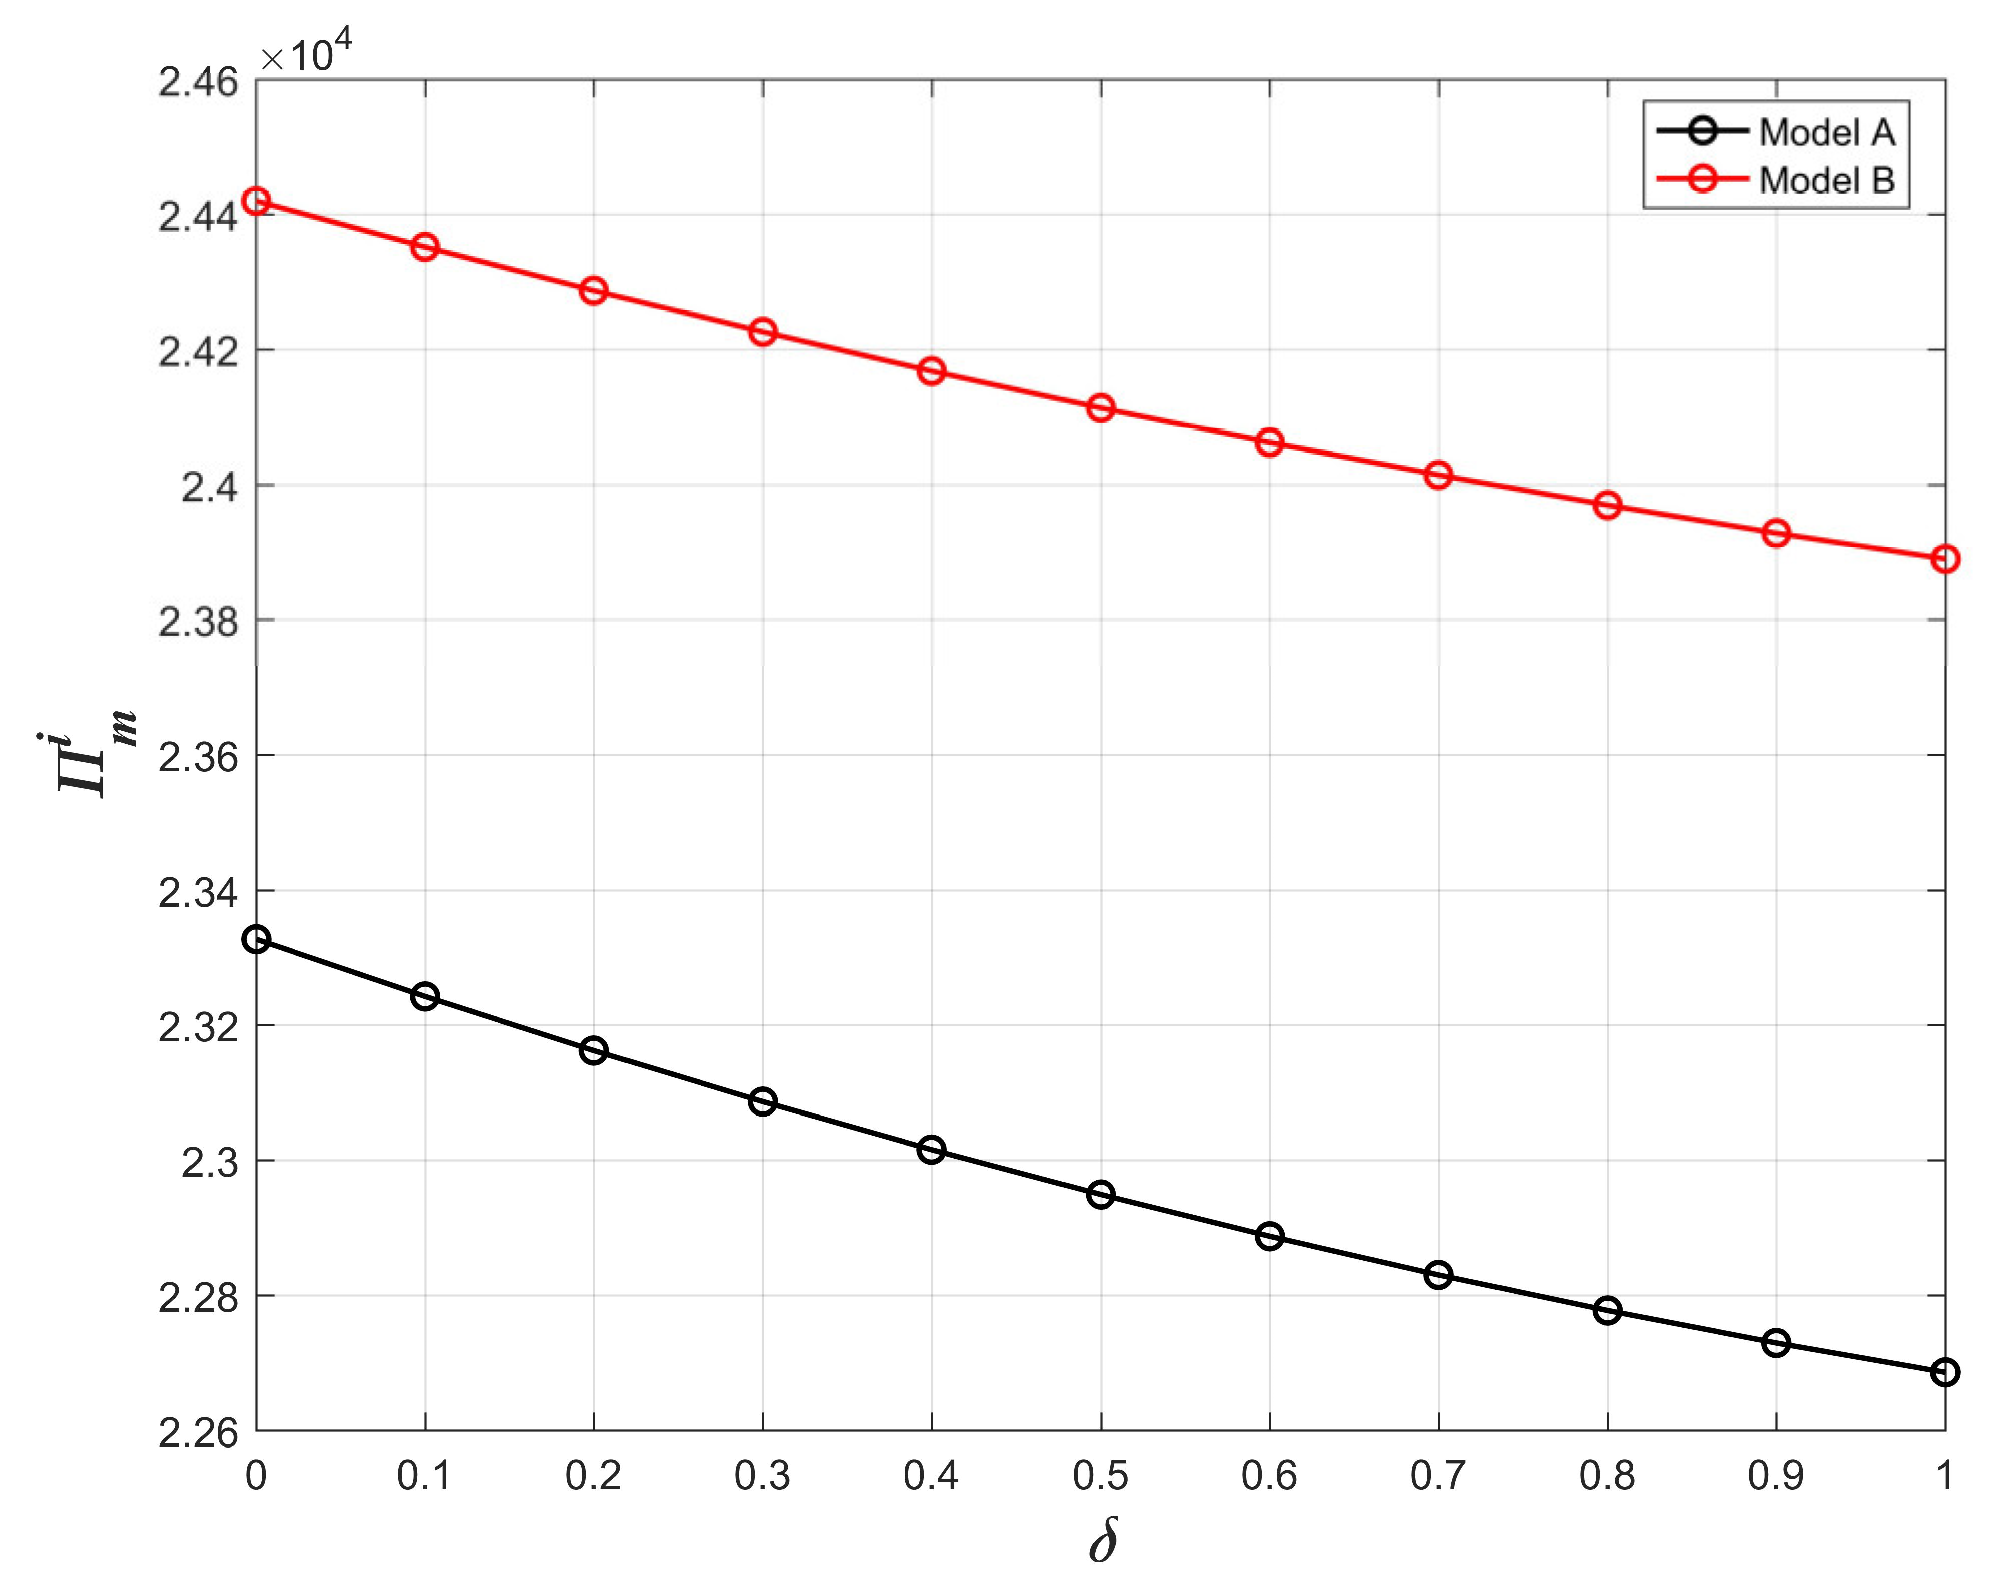
Figure 17.
The effect of on .

Figure 18.
The effect of and on .
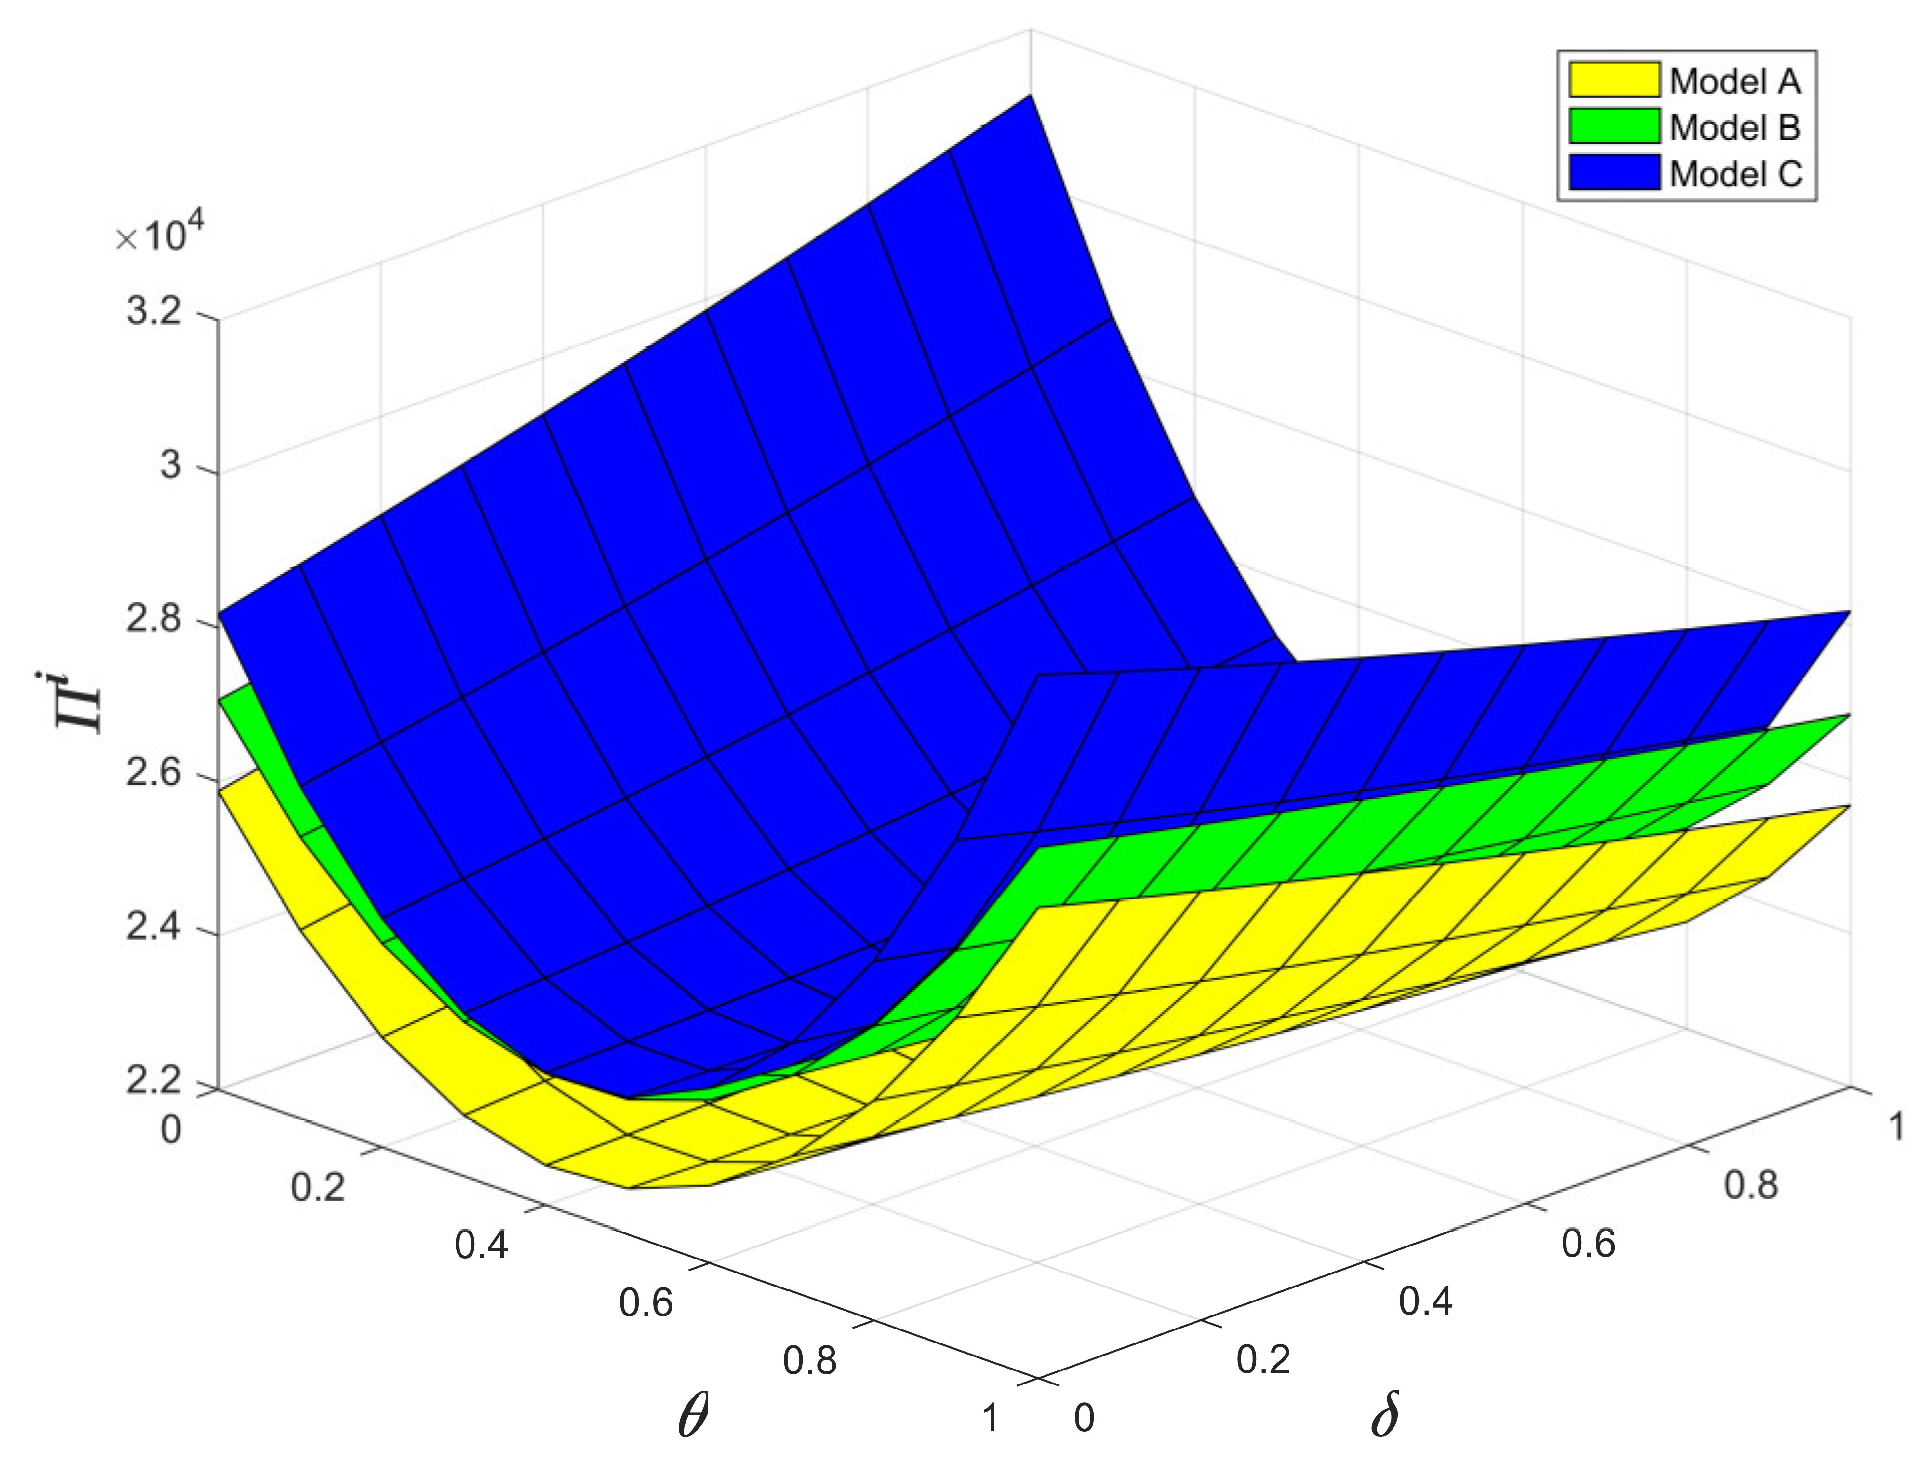
Figure 19.
The effect of and on .

Table 1.
Symbol description.
| Symbol | Meaning |
|---|---|
| Price/quantity of new products, | |
| Price/quantity of remanufactured products, | |
| Unit production cost of new/remanufactured products | |
| Unit patent license fee | |
| Carbon tax rate | |
| Total market volume | |
| Consumers’ willingness to pay for remanufactured products | |
| Cost factor of recycling waste products | |
| Recycling rate of used products, | |
| The coefficient of DfR | |
| The level of DfR, | |
| Unit carbon emissions of new products without DfR | |
| Ratio of carbon emissions from remanufactured products to carbon emissions from new products | |
| Carbon emissions, | |
| Manufacturer’s profit, | |
| Remanufacturer’s profit, | |
| Total supply chain profit, |
Table 2.
Equilibrium results under different decision-making models.
| Variants | Model A | Model B | Model C | Model D | ||
|---|---|---|---|---|---|---|
| - | 0.4255 | 0.4219 | 0.4219 | 0.4219 | 0.4219 | |
| 142.30 | 163.83 | 154.85 | 154.85 | 154.85 | 154.85 | |
| 170.00 | 182.77 | - | 108.40 | 108.40 | 108.40 | |
| 0.08 | 0.06 | 0.15 | 0.15 | 0.15 | 0.15 | |
| 11.00 | 10.64 | 23.21 | 23.21 | 23.21 | 23.21 | |
| 23,214.89 | 26,382.98 | - | 26,446.62 | 26,589.04 | 26,731.47 | |
| 387.08 | 362.15 | - | 726.38 | 583.96 | 441.53 | |
| 23,601.97 | 26,745.13 | 27,173.00 | 27,173.00 | 27,173.00 | 27,173.00 | |
| 744.50 | 488.91 | 487.81 | 487.81 | 487.81 | 487.81 | |
Disclaimer/Publisher’s Note: The statements, opinions and data contained in all publications are solely those of the individual author(s) and contributor(s) and not of MDPI and/or the editor(s). MDPI and/or the editor(s) disclaim responsibility for any injury to people or property resulting from any ideas, methods, instructions or products referred to in the content. |
© 2023 by the authors. Licensee MDPI, Basel, Switzerland. This article is an open access article distributed under the terms and conditions of the Creative Commons Attribution (CC BY) license (https://creativecommons.org/licenses/by/4.0/).
Share and Cite
MDPI and ACS Style
Jian, J.; Wang, G.; Hu, H.; Su, J. Decision-Making Models and Coordination in a Closed-Loop Supply Chain Considering Patent Protection for DfR. Systems 2023, 11, 127. https://doi.org/10.3390/systems11030127
AMA Style
Jian J, Wang G, Hu H, Su J. Decision-Making Models and Coordination in a Closed-Loop Supply Chain Considering Patent Protection for DfR. Systems. 2023; 11(3):127. https://doi.org/10.3390/systems11030127
Chicago/Turabian StyleJian, Jie, Gan Wang, Hongyuan Hu, and Jiafu Su. 2023. "Decision-Making Models and Coordination in a Closed-Loop Supply Chain Considering Patent Protection for DfR" Systems 11, no. 3: 127. https://doi.org/10.3390/systems11030127
Note that from the first issue of 2016, this journal uses article numbers instead of page numbers. See further details here.