
A Systematic Literature Review of the Blood Supply Chain through Bibliometric Analysis and Taxonomy

1
Department of Industrial Engineering, Karadeniz Technical University, Trabzon 61080, Turkey
2
Department of Industrial Engineering, Istanbul Technical University, Istanbul 34367, Turkey
3
Department of Industrial Engineering, Yildiz Technical University, Istanbul 34349, Turkey
*
Author to whom correspondence should be addressed.
Systems 2023, 11(3), 124; https://doi.org/10.3390/systems11030124
Submission received: 26 December 2022
/
Revised: 29 January 2023
/
Accepted: 22 February 2023
/
Published: 25 February 2023
(This article belongs to the Section Supply Chain Management)
Abstract
:The blood supply chain is an inseparable part of health systems. The importance of blood and the difficulties of managing the blood supply chain have led to numerous publications on this topic over the last two decades. This study seeks to reveal the state of the art of the blood supply chain and provide research gaps and future research directions. For this purpose, a mixed review methodology is conducted that includes bibliometric analysis, network analysis, and a six-dimension taxonomy. Bibliometric analysis identifies the most contributing journals, authors, and countries as well as provides popular keywords, while network analysis reveals interactions between these components. Taxonomy clarifies decision models and research gaps with a deeper examination. The electronic database Web of Science is examined to uncover relevant articles. In total, 265 articles are analyzed in detail. The findings reveal that the blood supply chain gathers more interest from researchers, and despite the continuing dominance of the inventory stage, there is an upward trend in the literature for the research of the blood supply chain as a whole. Optimization techniques come forward in the blood supply chain topic as solution methodology. In accordance with the results of bibliometric analysis, network analysis, and taxonomy, six prospective directions for future research are emphasized.
1. Introduction
Blood is needed for almost all healthcare services, including surgeries, blood disorder treatments, and cancer treatments. Despite the advances in technologies, the need for volunteer donors remains to obtain blood and blood products [1]. In case of demand, the availability of blood products in the right place, at the right time, and in sufficient quantity is vital. On the other hand, outdates are inadmissible since blood is a scarce source.
Blood is not an ordinary product that is easy to manage. After donation, the blood becomes perishable and has many restrictions on storage. At the same time, as blood is provided by volunteer donors, the amount of it obtained cannot be known in advance. Blood demand is also an uncertain environment. The presence of different blood groups and products and various blood group compatibilities between blood groups for each blood product complicates the situation even further. Taken together, matching blood supply and demand becomes a challenging problem.
The blood supply chain (BSC) covers the entire period, starting with the extraction of blood from volunteers and ending with the transfusion of the blood product to a patient. The BSC is generally accepted in the literature to be comprised of four echelons at a basic level, as can be seen in Figure 1 [2]. However, these echelons are not entirely separated from each other, and there are some interactions.
The vital importance and challenges of providing the necessary blood lead researchers to take a great interest in the blood supply chain. Early examples of research on the BSC mainly focus on one or two echelons of the BSC instead of the BSC as a whole [3,4,5,6,7]. However, recently, more attention has been given to the entire BSC [3,8,9,10,11,12].
Despite extensive literature on the field of BSC, there are relatively few review articles on this topic. In order to cover all the articles of structured reviews and bibliometric analysis on BSC, the databases of EBSCO, Emerald Insight, IEEE Xplore, SCOPUS, and Web of Science (WoS) are examined. Review articles that deal with the BSC topic from a holistic perspective are presented in Table 1. Beliën and Forcé [1] categorize publications through different perspectives, such as blood product, hierarchical level, solution methods, etc. Osorio et al. [2] focus solely on quantitative models about the BSC and deeply analyze every decision at every level of the supply chain covered in existing studies. Piraban et al. [13] enhance the literature review on BSC up to 2019 and propose new classifications for studies, such as the decision environment and planning horizon. In addition to these BSC reviews, there are brief reviews for specific BSC echelons. Prastacos [5] presents a review of inventory management of blood products. Likewise, Blake [14] focuses on the studies on platelet inventory management. Baş Güre et al. [15] analyze studies on donation scheduling and propose new research perspectives. Khomenko et al. [16] cover studies on marketing activities in the blood service and present a bibliometric analysis. Asadpour et al. [17] provide an update for the literature considering only the disaster perspective. A review by Meneses et al. [18] only handles mathematical modeling studies on the BSC between 2019–2021 and analyzes decision problems in each stage of the BSC. The only bibliometric analysis on BSC is provided by Eghtesadifard and Jozan [19]. However, they fail to exclude irrelevant research as they only searched the database according to keywords and skipped over reading the abstracts. Topics like the usage of blood products for disease treatment, supply chain management of blood pressure monitors, and blood drugs, which are quite different topics than BSC, are also included in the bibliometric analysis of Eghtesadifard and Jozan [19].
Previous reviews of the BSC do not deal with advanced analyses such as citation analysis, co-authorship analysis, and keyword co-occurrence analysis. On the other hand, the only bibliometric analysis in the BSC field does not comprise a detailed analysis of considered studies. The main advantages of this study over previous reviews are as follows.
- This study fills the gap of the last three years, which has not yet been systematically reviewed in the BSC literature.
- This study is the first scientometric review of the BSC that is able to exclude irrelevant articles from the BSC.
- The classified 262 articles are almost twice the number of articles considered by Osorio et al. [2], which is the most comprehensive systematic review of the BSC up to date.
- To the best of the authors’ knowledge, there is no other study containing both taxonomy and bibliometric and network analysis on the BSC field as conducted in this study.
The aim of this study is to conduct a bibliometric analysis and network analysis as well as a taxonomy to reveal important attributes of BSC studies, identify the most influential works, ascertain insights for the emerging areas of research, and provide directions for future research. The research question (RQ) of this study can be expressed as follows.
RQ: In what directions can the literature on quantitative models applied to the BSC be improved?
This study systematically reviews the available literature on BSC between 1985 and 2022 in the WOS database to provide insights on the topic. As Pierskalla [20] states, while studies earlier than the mid-1980s focus on inventory management of BSC, after the mid-1980s, studies expand to include different topics. That is why the research range starts with the year 1985.
To this end, a mixed review method is conducted, consisting of a scientometric review and a systematic review. Both bibliometric and network analysis are conducted under the head of the scientometric review to provide useful information about the research area. Moreover, a six-dimension taxonomy is performed under the systematic review, with new perspectives to provide an update of the literature review on the BSC. Figure 2 demonstrates the adopted mixed-review methodology. To the best of the authors’ knowledge, this is the first study to undertake both qualitative and quantitative reviews on the BSC.
The rest of the study is organized as follows. Section 2 presents the adopted research methodology where the research question, the achievement of data, and analysis methods are mentioned in detail, together with the initial statistics. The application of bibliometric analysis is given in Section 3. The findings obtained from network analysis are presented in Section 4. Section 5 provides the classification of BSC articles according to the six-dimension taxonomy. Finally, conclusions are provided in Section 6.
2. Research Methodology and Data Statistics
Literature research is a systematic approach to present emerging topical areas, methods, and research gaps on a subject. Rowley and Slack [21] emphasize that literature research should be within conceptual frameworks. They propose a five-step methodology of scanning documents, making notes, structuring the literature review, writing the literature review, and building the bibliography. Rowley and Slack [21]’s method is used in order to minimize the risk of bias in the process of literature search. The proposed method is frequently used in highly cited bibliometric analysis publications such as Fahimnia, Tang, et al. [22], Fahimnia, Sarkis, et al. [23], Mishra et al. [24], and Davarzani et al. [25].
2.1. Defining Appropriate Keywords
Determining relevant, comprehensive, and sufficient keywords is essential to detect all studies related to a research topic. This review aims to capture all studies that apply quantitative models for handling BSC problems as a whole or just some specific echelons. That is why three groups of keywords, i.e., blood products, decision problems in BSC stages, and solution methods, are created and used together in the keyword combination. In addition, only studies published in ISI (Institute for Scientific Information) indexed journals, including BSC-related medical journals, are included.
During the keyword selection process, first, the current review studies in the field are scrupulously examined. Among the available studies, Piraban et al. [13] and Eghtesadifard and Jozan [19] are the only studies that can be referenced for keyword selection since Beliën and Forcé [1] and Osorio et al. [2] do not mention the keywords they used. However, since the keywords of the studies of Piraban et al. [13] and Eghtesadifard and Jozan [19] do not cover specific blood products like ‘platelets’ and ’plasma’ and commonly used keywords like ‘robust’ and ‘disaster’, a more detailed keyword selection is needed by examining the keywords of the highly cited studies on the BSC topic.
During the article searching process, pre-created groups of keywords are used as a combination, as shown in Table 2.
The combination of the keywords is searched on WoS in the titles, abstracts, and keywords of the articles published between 1985 and 2022. WoS is selected because it is one of the most recommended multidisciplinary databases for academic research, especially in engineering and natural sciences. It covers more than 20,000 highly reputable and ISI indexed journals [26,27]. The literature search is performed between 10 December 2021 and 21 January 2023.
2.2. Search Results
The initial search reveals 887 studies for the combination of keywords. Then, the search is restricted by excluding conference papers, books, and book chapters. The refined search result yields 700 articles. After the exclusion of non-English articles, 686 articles remain.
Several disciplines study blood and blood products, and not all of these are within the scope of this research topic. Therefore, irrelevant topics are determined through a consensus of the authors. The excluded topics are examinations of the use of blood and blood products in the treatment of a disease, examinations of blood group compatibility, supply chain of any type of blood drugs, information technologies for continuous monitoring of blood pressure, and any other topics based on medical and clinical research. At this point, all abstracts are read, and the articles focused on BSC are identified. As a result of this, 289 articles are obtained. Finally, after reading the full texts of 289 articles, articles that do not contain quantitative models are eliminated, and 265 articles are determined for future analysis. Figure 3 shows the applied literature searching process.
2.3. Initial Data Statistics
First, the distribution of the BSC articles published each year between 1985 and 2022 is analyzed. As can be seen in Figure 4, during this period, although some fluctuations occurred, it can be said that there is an increasing trend on the BSC topic.
We can conclude that 107 journals published 265 BSC articles based on journal-wise distribution. Among published articles, 155 of them (nearly 60%) are published in the most contributing 20 journals. Table 3 exhibits the number of articles published in the top 20 journals each year. Although the most contributing journals are mostly about operation research, health care management and supply chain management, the existence of two journals, namely ‘Transfusion’ and ‘Vox Sanguinıs’, is remarkable. Both of these journals mainly focus on medical research areas.
The number of contributing authors in each article may provide an insight into the size of the research groups. Table 4 shows the distribution of the number of authors involved in each article. As can be seen, most of the articles have 2, 3, or 4 authors. The average number of authors per article is computed as 3.49.
2.4. Data Analysis
Data analysis is performed in three parts: The first part is the bibliometric analysis, where additional descriptive statistics such as the most contributed authors, the most contributed countries, and the most used keywords are analyzed. The second part consists of network analysis, revealing relations among keywords, authors, and the most influential articles. The third part consists of the categorization of the articles according to six dimensions: Stage of BSC, Blood Products, Solution Methods, Nature of the Parameters, Solution Approach, and Disaster-Mass Casualty Events (MCE) versus Status Quo.
Various types of softwares are available for bibliometric analysis and network analysis. BibExcel, HisCite, CiteSpace, and Publish or Perish are some of the most frequently used bibliometric analysis tools. They have superiorities and weaknesses according to features such as database compatibility, different analysis offers, visual analysis provision, and the maximum number of articles that can be examined [28]. For instance, Publish or Perish provides ease of use and compatibility with different databases. In contrast, it cannot provide data suitable for network analysis, offers only a limited number of analyses, and deals with up to 1000 articles [29]. On the other hand, BibExcel offers a high degree of flexibility and several kinds of bibliometric analysis—although it is not easy to use, especially for new users [30]. BibExcel software is preferred in this study since it is compatible with many databases such as WoS and SCOPUS, and it offers several descriptive analyses. Furthermore, outputs can be imported and processable in powerful visualization tools. BibExcel is used for bibliometric and statistical analysis and the preparation of suitable data to conduct network analysis.
Likewise, many network analysis tools are available such as Gephi, Pajek, VOSviewer, and UCINET. Gephi is preferred for this study due to advanced filtering and visualization techniques, handling big datasets, and providing innovative analyses [24].
In the third part of data analysis, taxonomy, all the statistics are calculated using Microsoft Excel software. The visual graphics in the taxonomy are also drawn using Microsoft Excel software.
3. Bibliometric Analysis
The bibliometric analysis provides valuable objective information about a field, such as revealing frequent keywords and how often they appear together, contributing authors, main topics, and prestigious publications. Because of these contributions, bibliometric analysis is a widely used methodology in various fields. For instance, Danesh et al. [31] provide a holistic view of the literature on innovation systems through bibliometric analysis. For the evolution and structure of the implementations of particle swarm optimization to vehicle routing problems, Reong et al. [32] utilize the Bibliometrix R software package and VOSViewer. Diaby et al. [33] use bibliometric analysis to examine 521 articles on the use of multi-criteria decision analysis in healthcare. Mishra et al. [24] provide a bibliometric analysis study that contains valuable information like key research topics, contributing authors, and influential articles on big data applications in the supply chain.
In this study, the implementation of bibliometric analysis to the BSC is addressed. The bibliographic data, which include full records and cited references, are obtained from WoS in plain text format. The plain text is firstly converted to dialog format for future analyses in BibExcel.
3.1. Author Influence
To reveal the most contributing authors, a new file, which only covers authors’ information and corresponding articles, is extracted from the input data. Then, the frequencies of the authors are determined. Table 5 presents the top 10 authors based on the number of articles they contributed. The most contributing author is ‘Hosseini-Motlagh S.M.’ with 17 articles, followed by ‘Samani M.R.G’ and ‘Abbasi B.’.
While examining authors’ contributions to the field, aside from the number of articles the authors present, the influence of their articles should also be noticed. To this end, the total number of citations of the articles contributed by each author is determined. Table 6 presents the top 10 authors with the highest total number of citations to their articles.
As can be seen, by comparison of Table 5 and Table 6, the ranking changes completely. The only four authors who belong to both tables are Haijema R., Nagurney A., Samani M.R.G., and Jabbarzadeh A. There are several possible explanations for this result. One might be that the articles of the most contributing authors are not momentous studies and are, therefore, not highly cited articles. Another possible explanation is that the articles of the most contributing authors might be relatively new.
3.2. Affiliation Statistics
The affiliations of the authors are examined to identify the countries where the BSC is most frequently studied. For this purpose, the affiliation of each author is extracted from the whole record file using BibExcel. Then, the corresponding country to each affiliation is taken out. In this context, if more than one author from the same country contributed to an article, this country is counted once. The resulting top 20 contributing countries can be seen in Table 7 where Iran, followed by the USA, is the dominant affiliated country.
3.3. Keyword Statistics
Keyword analysis provides a basic guide to researchers related to the blood supply chain at critical points such as the used techniques, the decision environment, and the subject covered. Bibexcel reveals the frequencies of the keywords, as well as the words that appeared in the article titles. The 20 most popular keywords and title words are shown in the first and third columns of Table 8, respectively. ‘Blood supply chain’ is the most popular keyword, while the three words that compose it are the most popular title words. This result is not surprising, as the subject is the blood supply chain and its phases. One worth mentioning issue is the frequency of keywords that address the uncertainty situation, such as ‘Robust optimization’, ‘Uncertainty’, and ‘Stochastic programming’. Likewise, ‘Robust’ and ‘Stochastic’ are commonly used words in titles. Another remarkable point is the frequent use of perishability. Surprisingly, even though ‘Simulation’ is the 4th most popular keyword, no related word to ‘Simulation’ is seen in popular title words.
4. Network Analysis
Gephi needs a data set consisting of nodes and arcs to construct maps and visualization. For a citation analysis, nodes represent articles, and arcs represent citations among articles. The bibliometric data obtained from WoS are not suitable to use directly in Gephi and need to be processed in a graph dataset. This transformation is conducted by utilizing BibExcel.
4.1. Citation Analysis
Citation analysis reveals the influence of an article, an author, or a journal on a particular research area. More cited articles are likely to be of high quality and more influential in the field. In the reviewed 265 articles, a total of 6213 studies are cited. As examining so many studies will be impracticable, the most cited 20 studies and the number of citations are taken into consideration, and presented in Table 9.
The most cited article, titled ‘Supply chain management of blood products: A literature review’ by Beliën and Forcé [1], appears 114 times in the reference list of 265 articles. It is not surprising that Beliën and Forcé [1] is cited frequently since it is the first literature review on the topic. In second place, a real-world application, Jabbarzadeh et al. [7] with 74 citations, takes place. This study proposes a network design by utilizing a robust optimization model for post-disaster BSC. Thirdly, another literature review, Osorio et al. [2] has 73 citations.
Some of the studies in Table 9 are incompatible with the inclusion criteria of this study, like the year or document type. This is because the studies in Table 9 are not from the selected 265 articles; instead, they are compiled from the selected 265 articles’ reference list.
The most cited 20 articles from the selected 265 articles are presented in Table 10. Here, just like the usage of Fahimnia, Tang, et al. [22], ‘local citations’ represent the number of citations of the corresponding article within the 265 selected articles, and ‘global citations’ represent the corresponding article’s actual number of WoS citations of the corresponding article. The differences become more noticeable in articles like Katsaliaki and Brailsford [34] and Hemmelmayr et al. [35]. This result may be due to the interaction of these studies with medical and clinical studies.

Table 9.
Most cited 20 publications on blood supply chain.
| Publication | Citation | Publication | Citation |
|---|---|---|---|
| Beliën and Forcé [1] | 114 | Dillon et al. [36] | 58 |
| Jabbarzadeh et al. [7] | 74 | Duan and Liao [37] | 53 |
| Osorio et al. [2] | 73 | Ramezanian and Behboodi [38] | 47 |
| Gunpinar and Centeno [39] | 66 | Van Dijk et al. [40] | 47 |
| Haijema et al. [41] | 64 | Şahin et al. [6] | 46 |
| Zahiri and Pishvaee [12] | 62 | Hosseinifard and Abbasi [42] | 45 |
| Nagurney et al. [43] | 61 | Pierskalla [20] | 44 |
| Prastacos [5] | 61 | Zhou et al. [44] | 43 |
| Fahimnia et al. [3] | 61 | Sha and Huang [45] | 41 |
| Nahmias [46] | 61 | Ghandforoush and Sen [47] | 41 |
4.2. PageRank Analysis
Citation analysis, the number of times a publication is cited by other publications, is the most commonly used methodology to measure the popularity of a publication in literature. Nevertheless, there are noteworthy criticisms of the method regarding the necessity of considering the prestige of citations aside from the popularity of the publication [52,53,54]. A highly cited publication does not necessarily have high prestige, and vice versa. To consider both the number of citations and the prestige of these citations, PageRank analysis was introduced by Brin and Page [55]. Equation (1) shows the PageRank calculation of a publication.
In Equation (1), suppose document A has cited by N papers, say . A parameter d is set for the damping factor between 0 and 1, to represent the fraction of random walks that generate through the citations. In addition, is defined as the number of times publication i cites other publications, and the PageRank of document A is defined as PR(A).
Table 11 presents the top 20 studies according to PageRank analysis. When comparing the citation analysis and the PageRank analysis (Table 9 and Table 11), the rank of the first publication, Beliën and Forcé [1], does not change. However, the rankings of Osorio et al. [2] and Jabbarzadeh et al. [7] change places with each other. Fahimnia et al. [3] moves up three places to 6th place in PageRank analysis while it comes 9th in citation analysis. Thus, it can be concluded that Fahimnia et al. [3] was cited by more cited publications. On the other hand, the publication of Haijema et al. [38] regresses three places and ranks 8th.
4.3. Co-Occurrence Analysis
Co-occurrence analysis can be conducted on authors, keywords, and references to reveal their relationship network. Every different co-occurrence analysis provides different information about the research area. While a keyword co-occurrence analysis will help researchers to find out topics that are frequently used together, an author co-occurrence analysis will provide information about study groups and collaboration between authors. Likewise, co-citation analysis, which focuses on the co-occurrence of two studies in any other study reference list, reveals the studies that focus on the same topic. Co-occurrence analyses are also conducted in this study to provide significant information about the research area.
4.3.1. Co-Citation Analysis
According to the citation, there are two main groups of mapping methods for bibliometric analysis. These are bibliometric coupling and co-citation analysis. For the former, two studies (say A and B) are said to be bibliometric coupling if they have at least one common publication (say C) in their reference list. The bibliometric coupling strength becomes more powerful for two publications as the number of common references increases. On the other hand, two studies (say A and B) are said to be co-cited if they are both cited by any other publication (say C). Likewise, the strength of the co-citation relation of two publications becomes more powerful with an increase in the number of two documents cited together. Previous research has established that, more often, co-cited articles have higher relevance and are more likely to focus on the same topic [56]. Because of this, constructing a co-citation map is important to understand research area clusters and see frequently co-cited articles. That is why, for the mapping of citation analysis, co-citation analysis is preferred in this study.
The co-citation map, a visualization tool to show co-cited articles and the frequency of co-occurrences, consists of articles represented as nodes and the number of co-citations represented as edges. With the help of a co-citation map, it is possible to understand research area clusters and see frequently co-cited publications.
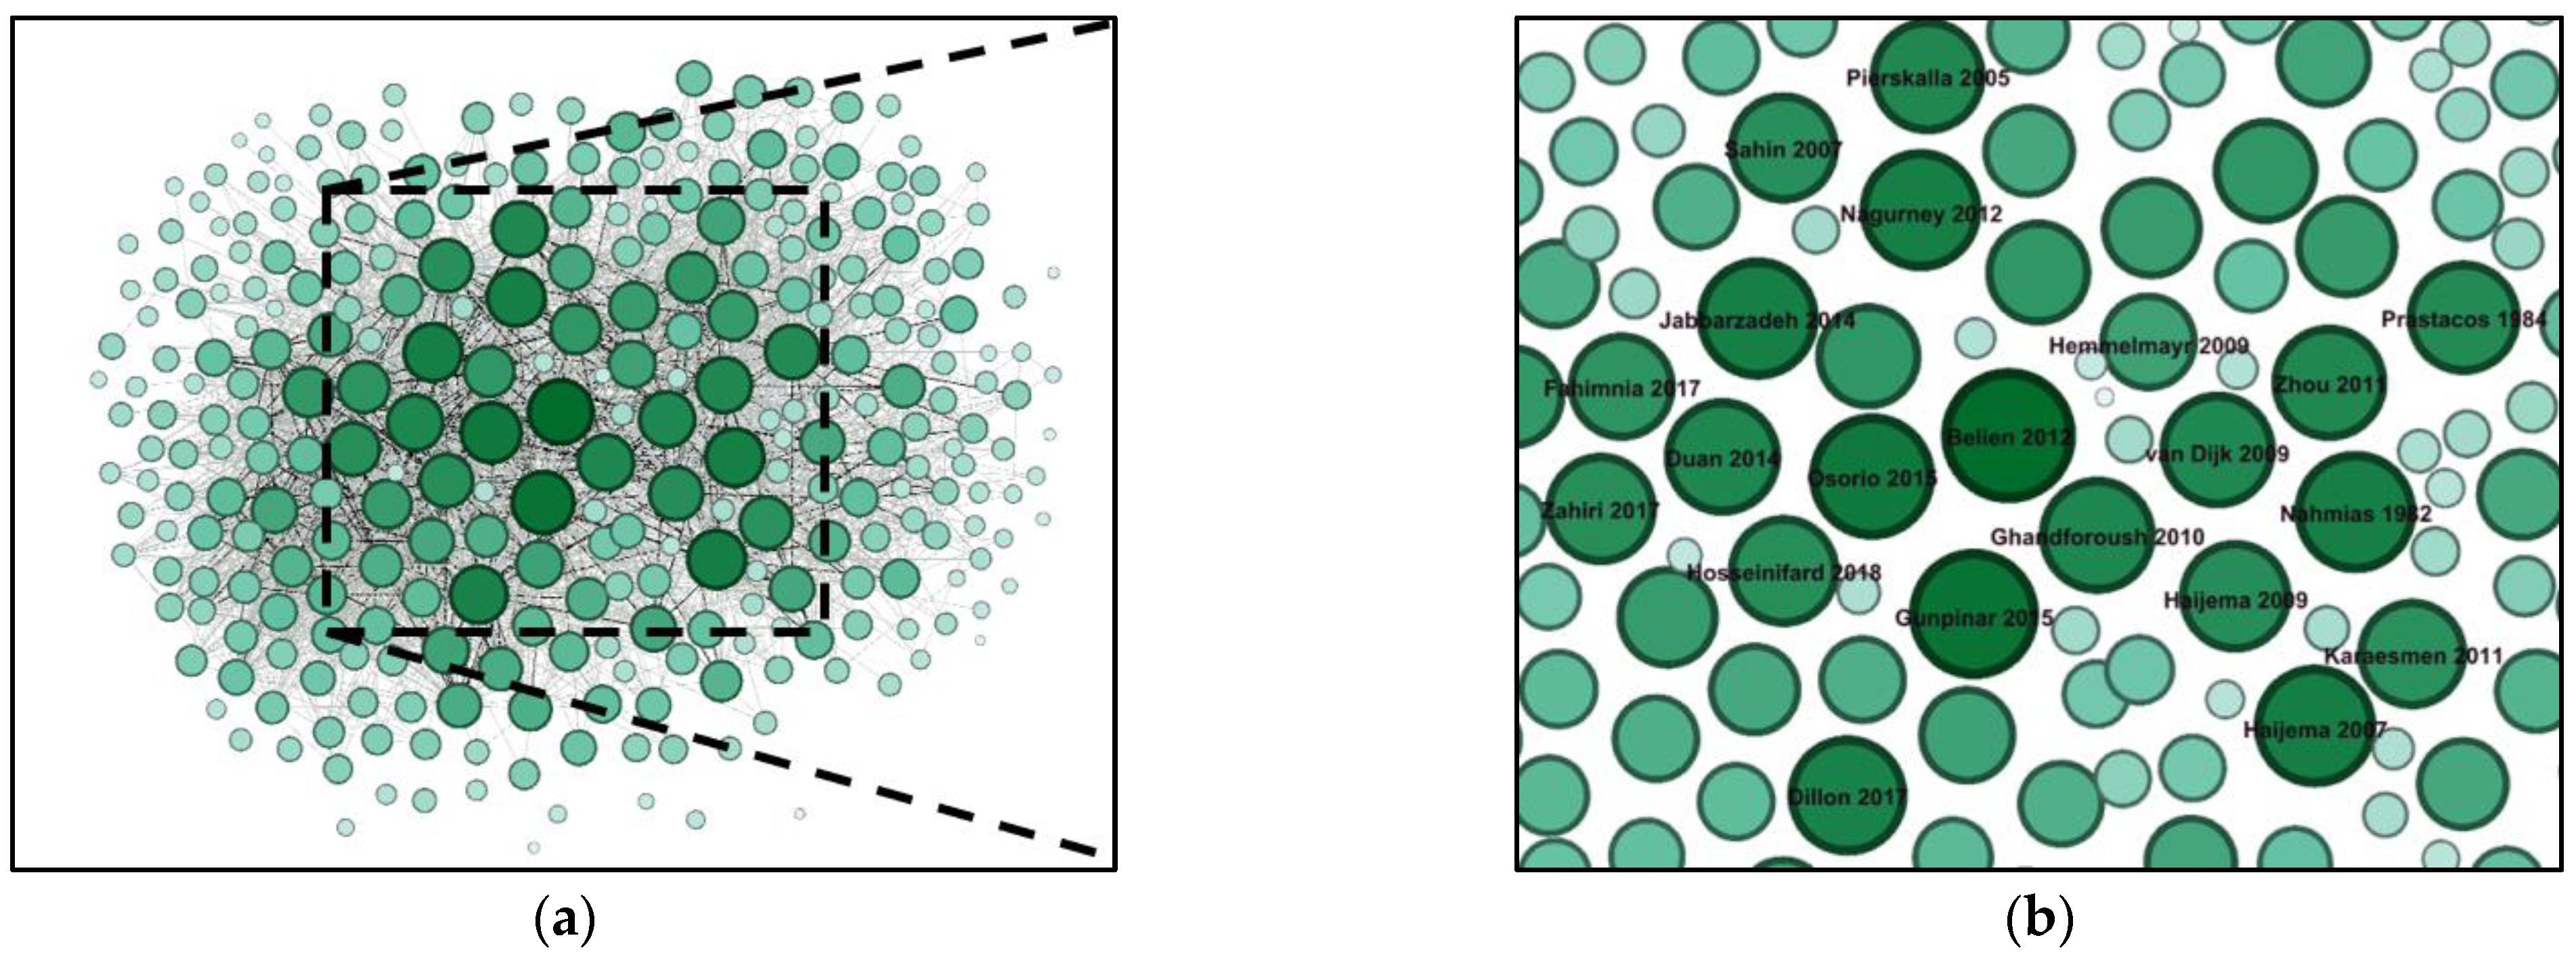
To construct a co-citation map, the plain text file obtained from WoS is processed in BibExcel to obtain a Gephi-compatible net file. The co-citation map is structured based on the references of the selected articles. There are a total of 6213 publications cited by the selected 265 articles. In order to avoid complications, when constructing the co-citation net file, only 300 publications that are cited by five or more times are taken into consideration instead of the 6213 publications. It is seen that all of 300 publications are co-cited at least once. So, there are 300 nodes, and 18,917 edges among these nodes in the co-citation map. The initial random map created by Gephi does not provide a visual pattern, so the map is re-arranged with the ‘Force Atlas’ layout algorithm. This algorithm provides nodes with a high number of connections to be placed to the center and nodes with low connections placed to the borders. Furthermore, the more co-cited articles/nodes are colored darker and represented with larger circles, while articles/nodes with fewer co-citations are colored lighter and represented with smaller circles.
In Figure 5a, a holistic view of the co-citation map is presented. As shown in Figure 5a, the co-citation map is not fragmented into separate clusters. One reason for this situation is the exclusion of irrelevant publications by detailed examination after the keyword-based search. Another important reason is that the decision problems in BSC are affected by each other, and several of them are handled together as different combinations. A close look at the co-citation map is given in Figure 5b. To avoid complication, only 20 publications with more than 230 co-citations are labeled with the first author’s surname and publication year.
4.3.2. Keyword Co-Occurrence Analysis
For the co-occurrence analysis, out of 723 keywords in total, 24 keywords, which appear six or more times, are considered. Using the ‘Force Atlas’ layout algorithm provided by Gephi, a keyword co-occurrence network is obtained, as shown in Figure 6. The keywords that are more frequently used with other keywords in the network are depicted bolder and larger, while the less frequently co-occurred keywords are shown paler and smaller.
It is no surprise that ‘Blood Supply Chain’ is the most remarkable element in the network since it is the most frequently used keyword (see Table 8). The most commonly used keywords with ‘Blood Supply Chain’ are ‘Robust Optimization’ (3rd most popular keyword), ‘Disaster’ (9th most popular keyword), ‘Inventory Management’ (2nd most popular keyword), and ‘Uncertainty’ (5th most popular keyword). Another noteworthy co-occurrence is between the keywords ‘Inventory Management’ (2nd most popular keyword) and ‘Simulation’ (4th most popular keyword).
4.3.3. Co-Authorship Analysis
Co-authorship network is a favorable tool for visualizing research groups and social networks in a research area. Although Yan and Ding [57] state that co-authorship and topical networks have the lowest similarity, co-authorship networks provide worthy information about social networks in the field. To avoid simplifying, 50 authors who contributed to 3 or more publications are taken into consideration while preparing the co-authorship network. Out of these 50 authors, 41 of them have co-authorship relations among each other; that is why there are 41 nodes in the co-authorship network presented in Figure 7. Figure 7 and Table 5 illustrate that the two most contributing authors, namely ‘Hosseini-Motlagh S.M.’ and ‘Samani M.R.G.’, are the two most collaborated authors. ‘Hosseini-Motlagh S.M.’ and ‘Blake J. ‘are the most remarkable authors in the co-authorship network, as each is the focal point of a crowded working group. Another intense working group consists of five authors, namely, ‘Arovilta P.’, ‘Linna M.’, ‘Kekomaki R’, ‘Sintonen H.’, and ‘Veihola M’. Interestingly, none of these authors are featured in Table 5 as the most contributing top 10 authors.
4.4. Topical Data Clustering
In a bibliography, data clustering seeks to reveal publications focused on similar research topics, considered connected to each other due to frequent co-citation. Well-connected publications compose a cluster, while publications with limited connections to them take part in the other clusters.
Gephi has a tool for clustering that relies on the Louvain algorithm. The Louvain algorithm is a greedy search heuristic method for modularity optimization [58]. The modularity index is the proportion of connections within the clusters to connections between the clusters and varies between the values of −1 and +1. The modularity index in a weighted network can be calculated as in Equation (2) [58]:
where is the weight of the edge between the nodes i and j, is the sum of the weights of edges that are attached to node i, is the cluster that node i belong to, for the function is equal to 1 only if , and finally, m is equal to .
Since Hjørland [56] states that the most relevant identifier to the topical similarity is co-citation, clustering is conducted on the co-citation network. Applying the algorithm to the network of 300 nodes create four clusters. The positions of the clusters and their relations are presented in Figure 8. As can be seen, interactions among the clusters cannot be underestimated. On the other hand, the calculated modularity index of 0.229 is decent enough to say that the clustering is well-structured.
The most crowded cluster is Cluster 1, having 129 publications and consisting of 43.00% of the total number of publications. The second most crowded cluster is Cluster 2, with 76 publications and a 25.33% share. Cluster 3 contains 75 publications and has 25.00% of the publications. Finally, Cluster 4 is the smallest cluster, with 22 publications. To provide insight into clusters, the top 10 articles according to the centrality of the eigenvector in each cluster are presented in Table 12.
As all the 20 most cited publications (see Table 9) belong to Cluster 1, the deduction that publications in Cluster 1 are highly influential studies in the research topic can be made. All, except one, of the top ten publications according to eigenvector centrality in Cluster 1 utilize mathematical modeling approaches to optimize a decision problem of BSC. The remaining one, Osorio et al. [2], is a reputable review for quantitative modeling of BSC. In Cluster 2, seven publications out of the top ten focus on platelet inventory or production management. The remaining three publications concentrate on perishable inventories. As the most perishable blood product is platelets, it is not surprising that these three studies fall into the cluster of platelets. In the examination of Cluster 3, it is seen that eight publications out of the top ten focus on inventory management solely or inventory distribution decisions, mostly utilizing simulation and Markov chain methods. The remaining two publications, namely Beliën and Forcé [1] and Pierskalla, which rank the top two places according to eigenvector centrality, are two reviews. Lastly, for Cluster 4, nine publications out of the top ten focus on modifications for BSC, including lateral transshipment, substitutions, and threshold-based age policies.
5. Taxonomy of BSC
Taxonomy provides a holistic perspective of a research area by identifying commonly utilized solution methods, popular research topics, and valuable information. Along with providing ideas for future research, taxonomy serves as a summary for the researchers that are new to the research topic. A six-dimension novel taxonomy is provided to update existing literature on BSC with this motivation. The classification fields used in this study are as follows:
- Stage of BSC
- Blood Products
- Solution Methods
- Nature of the Parameters
- Solution Approach
- Disaster–Mass Casualty Events (MCE) versus Status Quo
The last dimension is a novel dimension that does not exist in the current BSC literature. Here, one point that needs to be mentioned is that 3 out of 265 articles are not included in the taxonomy, as they are literature review studies. Researchers will find descriptive information for their research questions through provided classifications according to the different dimensions. In the process of categorizing articles and visualizing these categories, a Microsoft Excel spreadsheet is used.
5.1. Hierarchical Level of BSC
The blood supply chain basically consists of four stages, as presented in Figure 1. These are collection, production (processing), inventory, and distribution. Some studies only focus on a specific stage in the literature, while others focus on two or more stages simultaneously and can capture interactions among these stages. Under the Hierarchical Level classification, studies focusing on different stages of BSC are summarized. For this purpose, partitioning decision problems according to BSC stages presented by Osorio et al. [2] are utilized as a guideline to determine the focus of the articles.
Although BSC studies go back to the 1960s, studies handling BSC as a whole go back only a decade and a half. Early studies generally focused on inventory management of blood products [78,79]. Afterwards, topics such as location analysis and evaluation of blood centers, as well as routing both for blood products and mobile blood centers, arose [6,80,81]. In the late 2000s, studies that consider the whole BSC emerged to evaluate systems [82]. Eventually, the network design for the whole BSC came up only in the late 2010s [83]. The publication trend of BSC according to a single or multi-stage is presented in Figure 9.
5.1.1. Collection
The collection stage usually consists of mobile blood centers (MBCs), local blood centers (LBCs), and regional blood centers; however, these facilities may vary according to countries’ regulations. MBCs and LBCs are places that are responsible for only blood collection. After collecting blood in these centers, the collected blood is transported to the regional blood centers for testing and centrifuging into components. MBCs differ from LBCs as they can be easily relocated over time, while LBCs are permanent facilities. On the other hand, regional blood centers can collect, test, centrifuge, and store whole blood and blood products [11,84].
A noticeable part of single-stage studies deals with the collection stage. Among the 32 single-stage collection focused studies, the most frequent topics are perceiving donors’ behavior [85,86,87,88,89]; prediction of donations [90,91,92]; determination of donor arrival policy [93,94,95,96]; location allocation [6,49], and vehicle routing [97,98,99,100,101,102,103]. The most utilized solution methods for this stage are stochastic/robust programming, deterministic mixed-integer programming, and statistical analysis techniques, with 25, 24, and 5 implementations, respectively. The main usage topic of stochastic/robust programming is BSC management in disasters while methods of deterministic mixed integer programming are mostly used for vehicle routing from MBCs and LBCs to regional blood centers and donation scheduling. The statistical analysis techniques are mostly applied to the prediction of donations and determining factors that affect blood donations.
5.1.2. Production
The least popular research area in the BSC is the production stage. There are only two single-stage articles that focus on the production stage. In the first article, Veihola et al. [104] propose an evaluation method for different platelet production techniques in various blood centers. In the second one, Veihola et al. [81] conduct an efficacy analysis of 16 blood centers’ blood component preparation units, using DEA. In addition, out of 262 classified articles, only 80 of them consider the production stage coupled with other stages. Furthermore, many of these articles only consider the cost or duration of testing blood products but not the separation of whole blood into blood products [105,106,107,108,109,110]. However, the centrifugation proportion of whole blood is vital because when there is a waste in a blood product, a shortage may occur in another blood product.
5.1.3. Inventory
Early studies in the blood supply chain focus on inventory management. Early examples mainly focus on issuance policies [4,75,78] and optimal inventory levels [79]. Although new subjects have been studied over time, inventory management has not lost its popularity. Among the single-stage articles, more than half focus on the inventory stage. The most studied stage in BSC, the inventory stage, is considered in 153 articles out of the total 262 classified articles. A great part of the latter-day studies focused on the inventory stage try to determine optimal or near-optimal ordering policies [44,111,112,113,114]. Some consider issuance policies along with ordering policies [69,115,116,117]; however, only a limited number of articles focus on issuance policies alone [68,74]. Demand forecasting is another popular perspective for the inventory stage [112,118,119,120,121]. Finally, a recently popular research area is determining the effects of changing the shelf life of blood products [37,71,122,123].
5.1.4. Distribution
The last stage of BSC, the distribution stage, covers the transshipment of blood products to hospitals (or other demand points), lateral transshipments between hospitals, as well as allocation within the hospital. Generally, hospitals report their demands for blood products to blood centers daily before the actual demand is revealed. To achieve this, hospital managers forecast daily demand based on historical data and personal judgments. According to the reported amounts, shipments of blood products are planned by blood centers. In case of an emergency demand occasion, additional requests are reported and new shipments are planned with backup vehicles [2]. Although the first studies about the distribution stage do not date back to the 1970s, like the inventory stage, the distribution stage has gained significant interest, especially in the last decade. With the emergence of new transportation opportunities like unmanned vehicles, the usage of these vehicles for the distribution of blood products has become one of the popular research areas for the distribution phase [124,125,126,127,128]. Other topics that receive attention from researchers are minimizing the lead time for blood products post-disaster [3,8,129,130] and determining the effects of lateral transshipment opportunities [59,131,132,133].
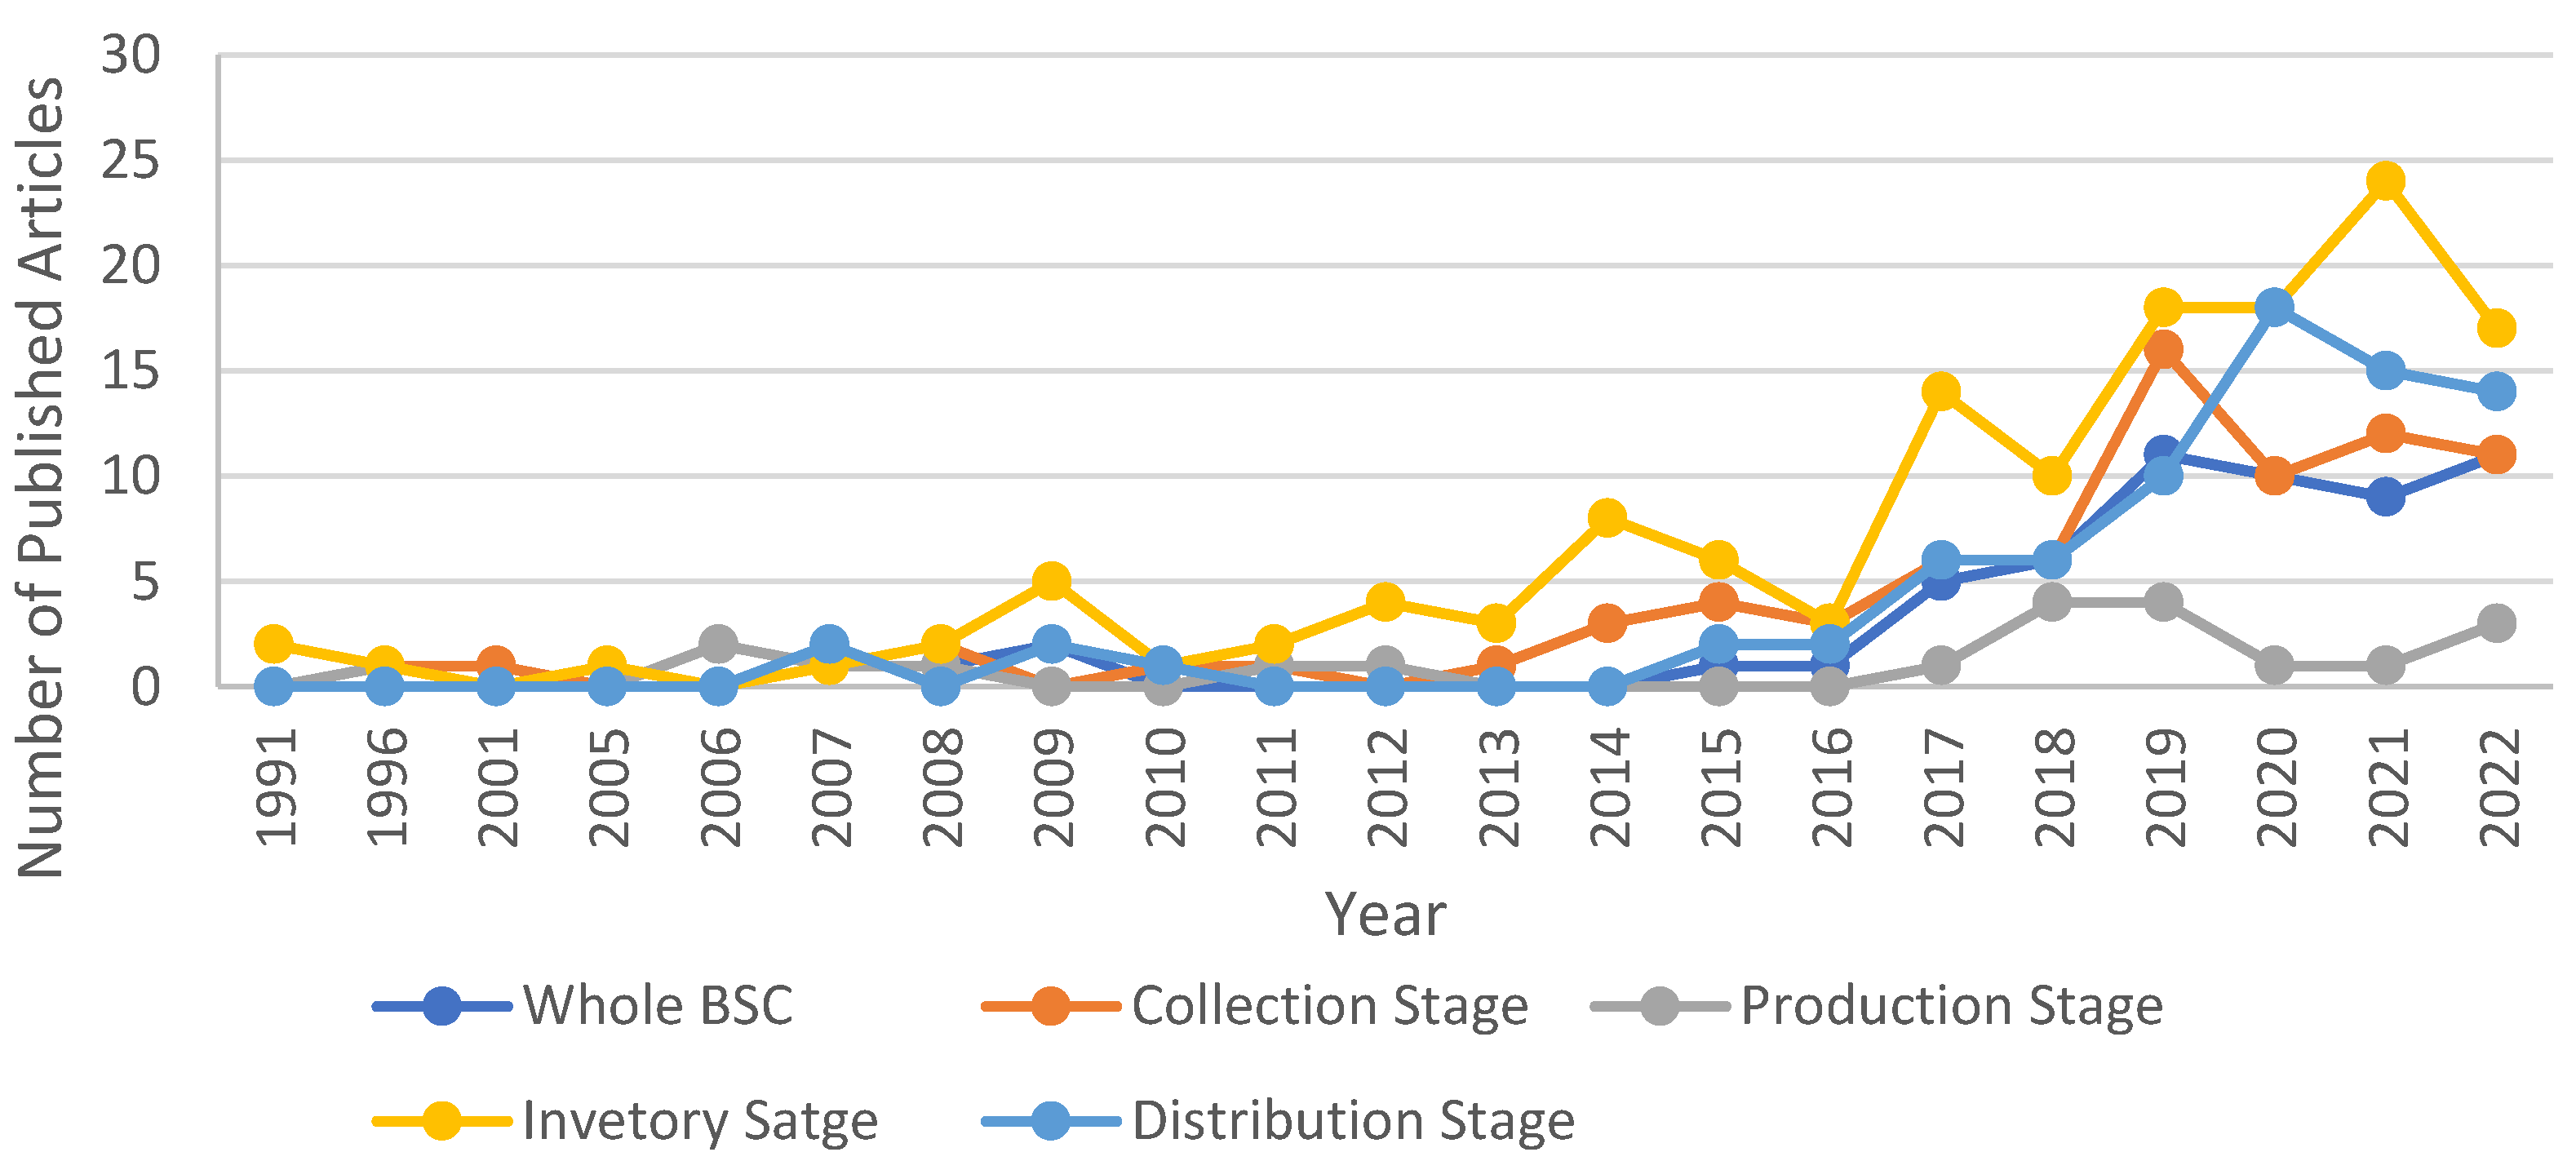
5.1.5. Trends in Stage of the BSC
The research trend of BSC stages is presented in Figure 10 to provide a better insight into the topic. It is apparent from Figure 10 that the clear dominance of the inventory stage persists from the beginning to the end of the time range. Despite some fluctuations, the whole BSC studies tend to increase over time. This trend is expected to continue since providing an improvement is more likely when the BSC is handled as a whole due to the interactions between stages of the BSC. What stands out is that the distribution stage, which was almost never studied before 2015, has been studied frequently in the last few years and is the second most popular BSC stage in the last three years.
5.2. Blood Products
Nowadays, blood demand does not only consist of whole blood. Instead, blood products constitute the majority of blood demand. Blood is provided by whole blood donation and then decomposed into components by centrifugation. However, a more expensive but more efficient technique called apheresis exists to obtain blood products [134]. In the apheresis process, only the necessary blood components are extracted from the blood, and the remaining blood is given back to the donor. While a unit of platelet can be obtained with an apheresis donation, three whole blood donations are barely enough to obtain the same amount.
Although more than 100 blood products exist, four of them are considered as the most important in terms of blood demand. These are red blood cells with 63.4% of overall blood demand, plasma with 17.8%, platelets with 13.6%, and cryoprecipitate with 5% [2]. In accordance, these four types of blood products as well as whole blood are considered for the taxonomy. It is noteworthy that some studies did not mention the blood product they focused on. The authors of this study share the idea that the aforementioned studies did not state their focus, but focused on whole blood. These studies will be referred to as not clear according to the considered blood product in the remaining part of this study.
Among the classified 262 studies, 189 of them consider only 1 blood product while the remaining 73 studies focus simultaneously on 2 or more blood products, and only 4 of them deal with all 4 most important blood products.
5.2.1. Whole Blood
After donation, whole blood is suitable for transfusion for up to 35 days; however, to separate into its components, it needs to be processed within six hours [96,135]. The number of whole blood transfusions is only a small part of the total transfusion, yet it is still needed in some unique treatments. Further, most of the blood donation is provided by whole blood donation, so whole blood is still in researchers’ interest. Of the 189 studies that focus on a single blood product, whole blood and not clear constitute 92 of them. Out of the 32 studies that focus only on the collection stage of BSC, 7 studies only consider whole blood, and 14 do not state the blood product. Likewise, 50 out of 73 multi-product studies consider whole blood. Another point worth mentioning is that more than 50% of Disaster-MCE studies consider only whole blood or undefined product type.
5.2.2. Red Blood Cells
The most frequently transfused blood product, red blood cells (RBCs) comprise more than half of the total blood demand. In general, RBCs are used for people who need a transfusion. To be more specific, for surgeries, treatment of premature infants, and patients with anemia, RBCs are needed [2]. Although RBCs have a relatively long shelf life of 42 days, they are the second most frequently studied blood product. One possible explanation for this may be that red blood cells are the most needed blood product. It is worth mentioning that of the 41 studies that only consider RBCs, 22 address the inventory stage alone, while 7 tackle inventory-routing problems. As RBCs comprise more than half of transfusion demands and can remain in stock for more than eight times longer than platelets, it will not be erroneous to say that RBCs constitute most of the blood product stock. As a result, the existence of a broad number of publications on the inventory management of RBCs is not surprising.
5.2.3. Platelets
Platelets are required to treat cancer patients, accident victims, and patients with blood clotting problems and excessive bleeding [96]. However, platelets are the most challenging blood product to handle due to their very limited shelf life of five days [65]. Consequently, platelets are the most studied blood product. Among the 189 publications that consider only one product type, 52 focus on platelets. The proportion of platelets considered increases even more for the studies that handle multi-products. The whole BSC model has been studied more frequently for platelets than other blood products. Almost one in three studies consider the whole BSC.
5.2.4. Plasma
The main usage of plasma is for the treatment of burns, shock, hemophilia, and immune deficiency disorders [137]. Plasma attracts little attention from researchers, as it has one year of shelf life. The longer shelf life enables plasma storage, and unmet demand is hardly possible. However, with the COVID-19 outbreak, plasma usage gained a new format. Patients who suffer from COVID-19 can be treated with plasma taken from those who recently recovered from COVID-19. Accordingly, Asadpour et al. [138] present a mixed integer programming (MIP) model to design a BSC network for plasma in COVID-19 treatment. For the same decision problem as Asadpour et al. [138], Baghbani [139] employs a fuzzy programming method, while Ghasemi et al. [140] utilize a novel mixed possibilistic-robust-fuzzy programming approach. Li et al. [141] propose an allocation model for COVID-19 convalescent plasma. On the other hand, Hosseini-Motlagh et al. [142] focus on the production method of plasma and propose a robust programming model to determine both operational and tactical decisions. Out of the 262 articles reviewed, only these 5 studies focus solely on plasma; in total, 40 articles consider plasma with other blood products. It is undeniable that new studies are needed for the plasma product due to the emergence of new usage areas due to the COVID-19 pandemic.
5.2.5. Cryoprecipitate
Among the reviewed 262 articles, only 7 of them cover cryoprecipitate. The only article that focuses solely on cryoprecipitate examines the collection stage of BSC as collected whole blood needs to be processed within eight hours to extract cryoprecipitate [143]. The long shelf life of cryoprecipitate and its relatively low usage proportion may explain a very limited number of studies on it.
5.2.6. Trends in Blood Product
Figure 11 compares the number of publications for different blood products over the years. Although there are sharp rises and drops, studies for all blood products except cryoprecipitate have an increased tendency. RBCs and platelets are the most studied blood products in the time range. Interestingly, studies that do not state blood product focus have increased over time, especially after 2018.
5.3. Solution Method
Numerous methods have been utilized in BSC management, as the BSC involves many different types of decision problems. These methods are basically classified into nine categories as follows according to their similarities:
- Optimization techniques under uncertain environment
- Optimization techniques under deterministic environment
- Simulation techniques
- Meta-heuristics
- Statistical Analysis
- Machine learning
- Multi-Criteria Decision-Making Techniques
- Markov Decision Process
- Others
5.3.1. Optimization Techniques under Uncertain Environment
Although all values are adopted as certain numbers for many optimization models, many parameters involve uncertainty in real life. Accordingly, optimization approaches involving uncertainty tackle this issue. BSC involves uncertain factors such as demand, supply, transportation time, etc. Consequently, out of 262 classified articles, 99 of them utilize optimization techniques oriented for uncertain environments. The optimization techniques included in this class are stochastic optimization, robust optimization, fuzzy programming, stochastic dynamic programming, and probabilistic programming. Among them, robust optimization is the most popular approach. The most likely explanations for the frequent usage of robust optimization are the relatively reasonable solution time with respect to other methods in this class and the capability to handle disaster scenarios. While robust optimization is often utilized alone, hybrid utilization with other approaches such as two-stage stochastic optimization [9,51,144] and possibilistic programming [49,145,146] also exists. Following robust optimization, scenario-based two-stage stochastic optimization [3,36,147,148,149,150] is the most popular second approach.
It is worth mentioning that there is only one multi-stage stochastic optimization model [151] among 262 classified articles. In two-stage stochastic optimization, uncertain parameters are realized once, and subsequent periods are free from uncertainty. However, in the BSC, especially for the status quo, uncertain parameters are valid for each period. In accordance, it would be more appropriate to use multi-stage stochastic optimization rather than two-stage multi-period stochastic optimization for future works.
5.3.2. Optimization Techniques under Deterministic Environment
Optimization Techniques Under Deterministic Environment class has the second-highest number of articles, with 56 articles. Techniques such as MIP, goal programming, and dynamic programming belong to this class. Since in the BSC, many parameters such as demand and donation involve uncertainty, the majority of articles using optimization techniques for deterministic environments focus on vehicle routing problems [97,98,101,152,153,154,155,156,157]. Haitam et al. [98] propose a mixed-integer linear programming model for vehicle routing problems with time windows. The authors focus on collecting blood samples from patients’ homes and transporting them to test centers. Kurt et al. [152] propose a mixed integer linear programming model for distributing blood products from regional blood centers to demand points as a vehicle routing problem and solve the model by using a genetic algorithm. Wen et al. [154] propose a capacitated vehicle routing problem for the use of unmanned aerial vehicles in blood transport with the extension of the blood temperature model during transportation. On the other hand, in some early studies, these techniques are utilized for BSC network design by ignoring uncertainties [6].
5.3.3. Simulation
Simulation is the third most utilized technique with 49 articles. Comparing and verifying the results of simulation models is challenging and burdensome; however, applications of simulation increase day by day. The opportunity to model the uncertain environment of BSC with considerably low computational time is an important reason for the authors’ tendency to use simulation methods.
Among the 49 articles in which simulation is used, more than half conduct discrete event simulation. However, a limited number of Monte Carlo simulations are encountered [150,158]. The only agent-based simulation study focuses on inventory management of platelets [159]. Among these simulation articles, more than half focus solely on the inventory stage of the BSC, while only six consider all BSC stages.
5.3.4. Meta-Heuristics
BSC management has difficulties with as uncertain environment, perishable products, and interdependencies between the stages. Consequently, it is burdensome to optimize many decision models of the BSC. For this reason, researchers have been led to near-optimal solutions. There are 36 articles that benefitted from different meta-heuristic methods. Most of these studies use several meta-heuristics [127,151,160,161,162]. The most encountered metaheuristics for BSC are genetic algorithm, simulation annealing, particle swarm optimization, and tabu search algorithm, with nine, six, five, and four implementations, respectively.
5.3.5. Statistical Analysis
This category contains methods like regression analysis, time series, ANOVA, MANOVA, as well as all descriptive and inferential statistical analyses. Out of 262 articles, 25 of them fall into this category. A considerable part of articles in this category use time series analysis to predict blood demand [94,119,120,156] or supply [86,91,92]. Some other articles utilize inferential statistics in accordance with a survey [89,163,164]. In addition, another remarkable topic in this category is the optimization of ordering decisions along with demand forecasting by the usage of statistical analyzes together with integer programming [119,156].
5.3.6. Machine Learning
BSC management is a complex system that involves many uncertainties and depends on many factors. It is quite challenging to reveal the embedded complex patterns in such systems with human intelligence. Consequently, attempts to reveal meaningful conclusions from big data about BSC have been applied with machine learning techniques. This category contains machine learning techniques like hierarchical clustering, decision trees, Random Forest, and Gradient Boosting, as well as a deep learning technique, namely Artificial Neural Networks (ANN). Despite the suitability of the BSC topic for artificial intelligence applications, the existing literature is relatively limited, with 20 articles. ANN is the most popular technique among these articles, with six implementations. Unlike statistical analysis, some intelligence system implementations are used to predict optimal decision values, such as inventory level [165,166].
5.3.7. Multi-Criteria Decision-Making Techniques
A relatively least-utilized solution approach is Multi-Criteria Decision-Making (MCDM) Techniques, with only 15 applications. Techniques like the Analytical Hierarchy Process (AHP), Technique for Order Preference by Similarity to Ideal Solution (TOPSIS), VIseKriterijumsa Optimizacija I Kompromisno Resenje (VIKOR), and Data Envelopment Analysis (DEA) are grouped under this class. In this category, the most utilized technique is DEA, with eight implementations. Hosseini-Motlagh, Samani, and Cheraghi [167] benefit from DEA for location selection of collection, production, and distribution centers in the BSC according to technical efficiency measurements. Hosseini-Motlagh et al. [142] benefit from DEA for location selection of plasma collection centers. Likewise, Haeri et al. [168] utilize DEA for relief centers location selection. On the other hand, DEA is applied by Şahin et al. [6] to compare regional blood centers’ efficiencies and Veihola et al. [169] to compare blood centers’ technical efficiencies of blood products preparation. Finally, Moslemi and Mirzazadeh (2017) utilize network DEA with subjective inputs and outputs to measure the efficiency of the BSC as a whole.
5.3.8. Markov Decision Process
Another solution method that has relatively few applications encountered is the Markov Decision Process (MDP). Seven of twelve articles that utilize MDP use it along with other solution methods, namely Simulation [111,170], Stochastic Dynamic Programming [115,143], and Stochastic Optimization [158]. Almost all these articles focus on inventory management of blood products. Haijema [111] proposes an ordering policy for blood products by MDP and simulation. In order to improve this study, Haijema [115] adds issuing and disposal policies to the model.
5.3.9. Others
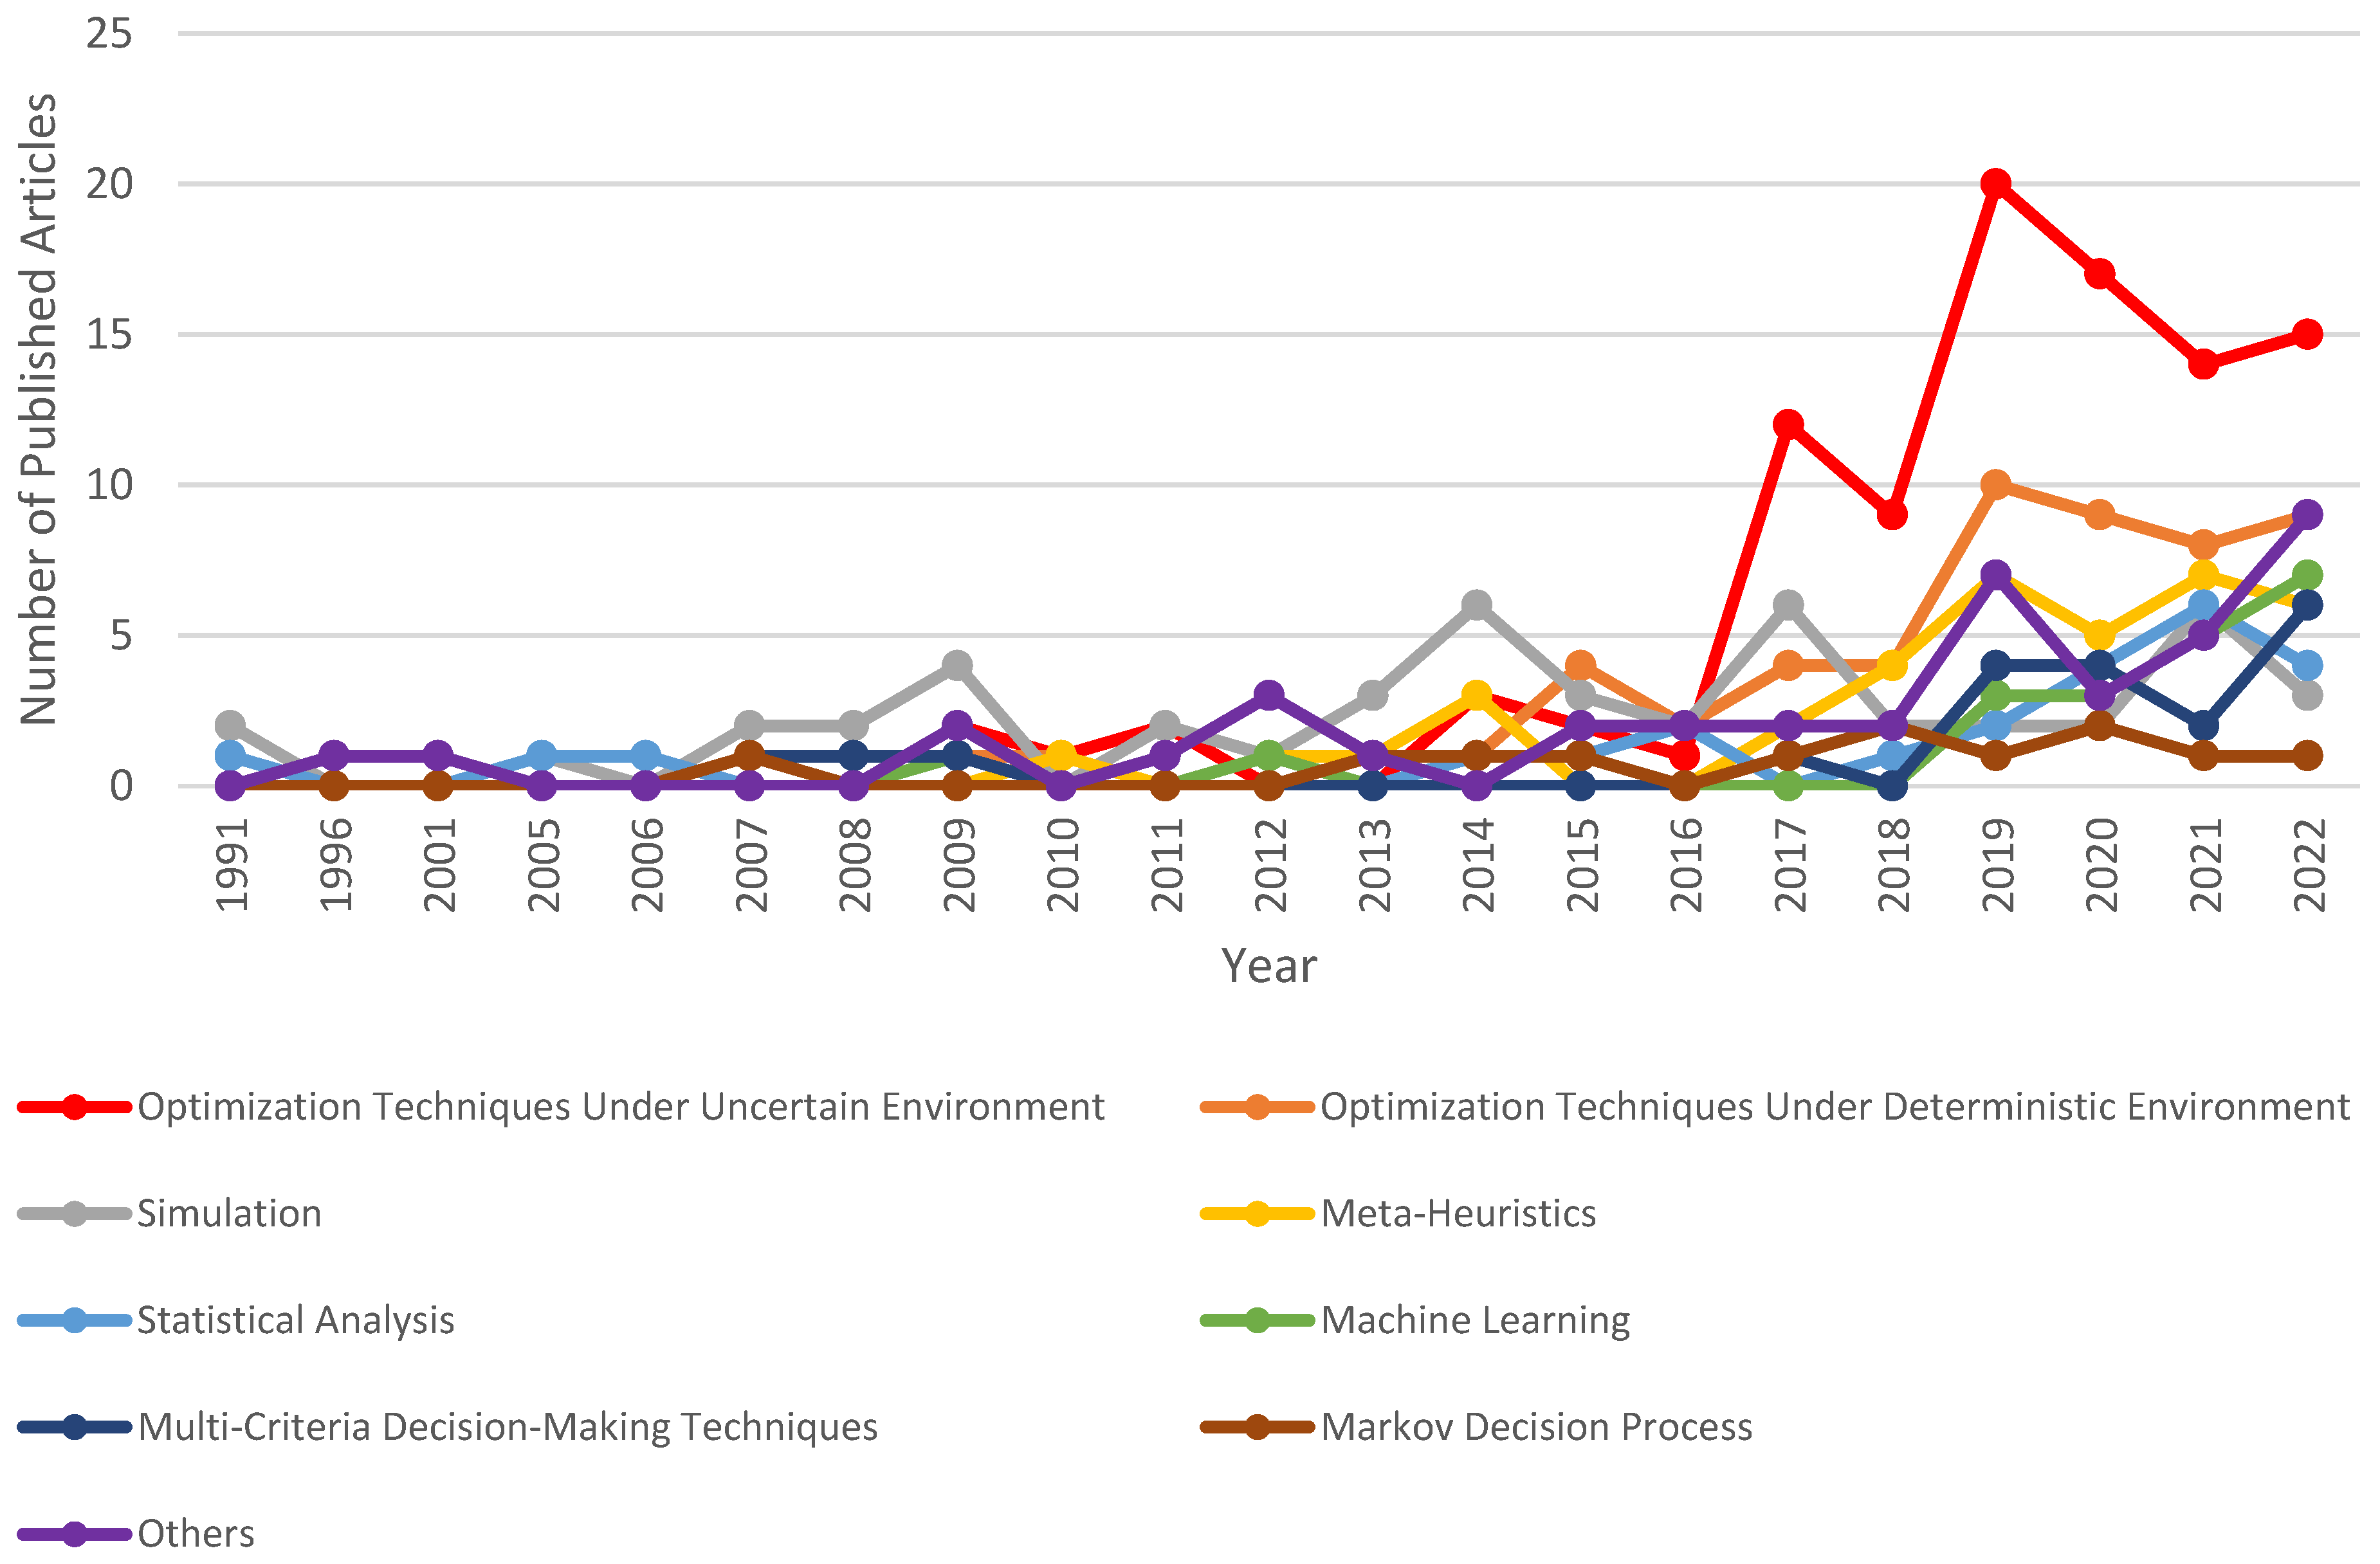
5.3.10. Trends in Solution Methods
The solution method trend with respect to years is visualized in Figure 12. As seen from trend lines, simulation is one of the dominant techniques as a solution method for the first three-quarters of the time range. However, in the last quarter, mathematical modeling techniques came into fashion and surpassed simulation. The clear dominance of Optimization Techniques Under Uncertain Environments after 2016 is striking. This result can be related to advances in computer technology. The increase in the use of mathematical modeling techniques has led to an increase in the use of Meta-Heuristic techniques. Another point worth mentioning is that the usage of Machine Learning techniques has continuously increased since 2017.
5.4. Nature of the Parameters
Another noteworthy classification of BSC studies is the type of decision environment. The distinction in this regard consists of two classes, stochastic and deterministic. The main constituents of stochastic applications are prediction models, simulation models, stochastic optimization, and robust optimization. On the other hand, deterministic applications are non-probabilistic models in which each parameter is known precisely. Out of 262 articles, only 71 are classified as deterministic applications. They mostly consist of descriptive statistics, MCDM applications, and mixed-integer linear programming models for vehicle routing. The publication trend in accordance with the nature of parameters is presented in Figure 13. Examining Figure 13 reveals that stochastic applications have numerical superiority over deterministic applications, especially over the last decade. In 2022, however, this difference is diminished. The main reason for this decrease is the increase in data-dependent applications.
5.5. Solution Approach
For this category, 73 of 262 articles are excluded as irrelevant; namely, the ones that use solution approaches like simulation, machine learning, statistical analysis, and MCDM, which are neither heuristics nor exact solutions. When the remaining 189 articles are classified according to their solution approach, it is seen that 98 articles benefit from heuristic solution approaches. Among these articles, the most utilized methods are meta-heuristics, with 36 implementations (see Section 5.3.4 for detail). Lagrange relaxation-based near-optimal solution techniques come second after the meta-heuristics, with 14 implementations. Another popular near-optimal solution technique is Sample Average Approximation, a scenario-based decomposition method for Stochastic Optimization.
Apart from these, NSGA-II, a heuristic for multi-objective optimization [177], Benders Decomposition, a stage based decomposition algorithm [110,134], and the Column Generation Algorithm [102] are some other near-optimal solution techniques with few applications in BSC topic. Figure 14 demonstrates the number of publications with exact versus heuristic approaches over the years.
5.6. Disaster-MCE versus Status Quo
Another categorization that needs to be considered for BSC studies is focused circumstances. Distinct from most other supply chains, the BSC is more intensely affected by unexpected incidents. Blood demand may increase severely in cases of mass casualty events (MCE) or disasters like earthquakes. In addition, pandemics may cause a severe reduction in blood donations. Consequently, researchers frequently studied these particular scenarios. Among the 262 studies that are classified, 65 of them focus on these specific circumstances. The first Disaster-MCE focused study was published in 2005, and as can be seen from Figure 15, the proportion of Disaster-MCE studies to overall studies has grown since then.
6. Research Gaps and Future Research Directions
According to performed scientometric and systematic reviews, six remarkable opportunities for further investigation are identified. Addressing these research gaps will be interesting to researchers and, what is more to the point, will help to prevent potentially fatal outcomes through the efficient management of the BSC.
- As mentioned in Section 5.1.2, the production stage is the least researched stage of the BSC, and most of the studies that focused on production only considered the cost or duration of blood tests. In line with this information, more research that considers the rate of separation of whole blood into blood products is required. In addition, the efficiency of different blood collection and separation methods still needs to be further explored.
- Another area that needs attention is the evaluation of supply points. The placement of a collection facility is a strategic decision that causes significant financial burdens. Apart from the number of potential donors, there are other critical factors that need to be considered for this decision, such as the seasonal continuity of the population, the eligibility of the population to donate blood, and the possibility of finding volunteer workers. The determination of critical factors for the evaluation of alternate locations and determination of their importance is another topic regarding the BSC that needs to be explored. To the best of the authors’ knowledge, there is also no research on the efficiency measurement of MBCs.
- Due to imprecise parameters in the BSC, the utilization of ‘optimization techniques under uncertain environments’ increased, especially after 2016. The authors also believe that the dominance of these methods will continue. The majority of these studies employ two-stage stochastic optimization. In a two-stage stochastic optimization, uncertain parameters are realized once, and subsequent periods are free from uncertainty. This condition is likely in situations such as disasters. However, for the status quo in the BSC, uncertain parameters are valid for each period and need to be handled with multi-stage stochastic optimization. In the current literature on the BSC, only one study employs multi-stage stochastic optimization. Hence, more studies that utilize multi-stage stochastic optimization are needed.
- The magnitude of the data on hand regarding the BSC and the variety of its sources indicate that big data applications are a good candidate for future studies in this field. Thus, an overlooked research area—causes of wastage and scarcity—can be better handled. Although some quite new studies employ big data applications in the BSC, they are mainly focused on the number of donations or demand. However, the whole BSC may be a good candidate for big data application in order to determine disruptions in the supply chain.
- In the existing literature, features like different donation technologies, lateral transshipment opportunities, and mismatching policies are mainly investigated in the single stage. However, a holistic view with multi-product, multi-stage consideration will reveal the actual effect of these modifications. Since the model grows bigger when it is addressed with a holistic view, it will be harder to find a solution. Accordingly, it would be appropriate to obtain near-optimal solutions by developing heuristic methodologies for these models.
- Adapting new technologies to the BSC is another research direction for future works. Blockchain implementation may be an opportunity to increase the perception of equal treatment in product allocation, as well as promote the collaboration between the non-interacted units in the same horizontal stage of the BSC hierarchy like hospitals. Since there is a time limit to separate whole blood into blood products, the internet of things (IoT) will be an appropriate way to increase the traceability of whole blood in the collection stage. Likewise, tracing the blood products may be more practical thanks to the IoT.
7. Conclusions
The complication of managing the BSC raises many decision problems that have attracted many researchers to this field. Considering the number of recent studies, it is evident that the interest in the research area continues. However, the BSC is handled from different aspects regarding many decision problems. This study aims to reveal the state-of-the-art of BSC management as well as present research gaps and future directions for researchers. For this purpose, a mixed review methodology, scientometric, and systematic review is conducted.
The scientometric review is comprised of bibliometric analysis and network analysis. Bibliometric analysis reveals some descriptive statistics for the field, such as most contributing authors and countries, as well as popular keywords. Through this analysis, the prominent elements of the BSC field are provided to the researchers. Furthermore, meaningful knowledge is presented for collaboration opportunities. Network analysis clarifies the most influential publications and helps to visualize interactions within keywords, authors, and publications.
The results of the scientometric review that should be highlighted can be summarized as follows: (i) The countries of Iran and the USA dominated the BSC field in terms of publication numbers; (ii) Three out of four of the most contributed authors (Hosseini-Motlagh S.M., Samani M.R.G., and Yaghoubi S.) are from same working group, however, four out of ten most-cited authors do not even appear in the co-authorship network; (iii) The frequency of the keywords related to inventory management, optimization techniques, and uncertainty is remarkable. In addition, the co-occurrence frequency of the keywords inventory management—simulation, robust optimization—uncertainty—disaster are worth mentioning; (iv) The four clusters obtained by topical clustering mainly focus on mathematical modeling applications, platelet inventory management, inventory management with simulation or Markov chains, and inventory distribution problems with modifications like lateral transshipment, substitution, and threshold-based age policies.
On the other hand, to provide a deeper insight into the BSC, a six-dimension taxonomy is conducted in the systematic review part. Apart from updating previously used classification dimensions like the stage of the BSC, blood products, solution methods, nature of the parameters, and solution approach, a new classification dimension, ‘Disaster/MCE versus Status Quo’, is used for the first time. As the BSC is affected by MCEs in terms of not only disruption but also intense blood demand occurrence, many publications focus on these specific circumstances.
Despite a few literature reviews on the BSC, articles published in the last three years have not been handled as a systematic review. An update of the BSC systematic review is provided to address the growing research area. The 262 classified articles are almost twice that of the number of articles considered by Osorio et al. [2], which is the most comprehensive study up to date. Another contribution of this study is the scientometric review of BSC studies. Although one bibliometric review for the BSC exists, it misses the exclusion of irrelevant medical and clinical studies. Consequently, this study is the first implementation of a scientometric review of the quantitative models for the BSC field.
Despite extensive research, there are still some limitations to this study. First, the included articles only cover the English language. Second, some publications are excluded based on quality criteria (non-articles, non-indexed, etc.). Finally, the classification of publications is conducted based on the six dimensions that are considered the most important ones according to the judgments of the authors. Hence, some other classification dimensions can be added to enlarge the taxonomy for future studies.
The provided results contain valuable information for those interested in the BSC. The identified influential publications may serve as a guide for new researchers in the field. Further, revealing contributing researchers to the topic may lead to new collaborations. Finally, different types of problems related to the BSC and research directions are provided for practitioners and researchers.
Author Contributions
Conceptualization, Y.I.T. and G.I.; methodology, G.I., Y.I.T. and N.A.; software, G.I.; investigation, G.I.; data curation, G.I.; writing—original draft preparation, G.I., Y.I.T. and N.A. writing—review and editing, Y.I.T. and N.A.; visualization, G.I. and N.A.; supervision Y.I.T. and N.A. All authors have read and agreed to the published version of the manuscript.
Funding
This research received no external funding.
Data Availability Statement
The search strings are mentioned in Section 2.1.
Conflicts of Interest
The authors declare no conflict of interest.
References
- Beliën, J.; Forcé, H. Supply Chain Management of Blood Products: A Literature Review. Eur. J. Oper. Res. 2012, 217, 1–16. [Google Scholar] [CrossRef]
- Osorio, A.F.; Brailsford, S.C.; Smith, H.K. A Structured Review of Quantitative Models in the Blood Supply Chain: A Taxonomic Framework for Decision-Making. Int. J. Prod. Res. 2015, 53, 7191–7212. [Google Scholar] [CrossRef]
- Fahimnia, B.; Jabbarzadeh, A.; Ghavamifar, A.; Bell, M. Supply Chain Design for Efficient and Effective Blood Supply in Disasters Behnam. Int. J. Prod. Econ. 2017, 183, 700–709. [Google Scholar] [CrossRef]
- Kendall, K.E.; Lee, S.M. Formulating Blood Rotation Policies with Multiple Objectives. Manag. Sci. 1980, 26, 1145–1157. [Google Scholar] [CrossRef]
- Prastacos, G.P. Blood Inventory Management: An Overview of Theory and Practice. Manag. Sci. 1984, 30, 777–800. [Google Scholar] [CrossRef]
- Şahin, G.; Süral, H.; Meral, S. Locational Analysis for Regionalization of Turkish Red Crescent Blood Services. Comput. Oper. Res. 2007, 34, 692–704. [Google Scholar] [CrossRef]
- Jabbarzadeh, A.; Fahimnia, B.; Seuring, S. Dynamic Supply Chain Network Design for the Supply of Blood in Disasters: A Robust Model with Real World Application. Transp. Res. Part E Logist. Transp. Rev. 2014, 70, 225–244. [Google Scholar] [CrossRef]
- Hamdan, B.; Diabat, A. A Two-Stage Multi-Echelon Stochastic Blood Supply Chain Problem. Comput. Oper. Res. 2019, 101, 130–143. [Google Scholar] [CrossRef]
- Hamdan, B.; Diabat, A. Robust Design of Blood Supply Chains under Risk of Disruptions Using Lagrangian Relaxation. Transp. Res. Part E Logist. Transp. Rev. 2020, 134, 101764. [Google Scholar] [CrossRef]
- Osorio, A.F.; Brailsford, S.C.; Smith, H.K.; Blake, J. Designing the Blood Supply Chain: How Much, How and Where? Vox Sang. 2018, 113, 760–769. [Google Scholar] [CrossRef]
- Samani, M.R.G.; Torabi, S.A.; Hosseini-Motlagh, S.M. Integrated Blood Supply Chain Planning for Disaster Relief. Int. J. Disaster Risk Reduct. 2018, 27, 168–188. [Google Scholar] [CrossRef]
- Zahiri, B.; Pishvaee, M.S. Blood Supply Chain Network Design Considering Blood Group Compatibility under Uncertainty. Int. J. Prod. Res. 2017, 55, 2013–2033. [Google Scholar] [CrossRef]
- Pirabán, A.; Guerrero, W.J.; Labadie, N. Survey on Blood Supply Chain Management: Models and Methods. Comput. Oper. Res. 2019, 112, 104756. [Google Scholar] [CrossRef]
- Blake, J.T. An Introduction to Platelet Inventory and Ordering Problems. In Wiley Encyclopedia of Operations Research and Management Science; Wiley: Hoboken, NJ, USA, 2010. [Google Scholar]
- Baş Güre, S.; Carello, G.; Lanzarone, E.; Yalçındağ, S. Unaddressed Problems and Research Perspectives in Scheduling Blood Collection from Donors. Prod. Plan. Control 2018, 29, 84–90. [Google Scholar] [CrossRef]
- Khomenko, L.; Saher, L.; Jan, P. Analysis of the Marketing Activities in the Blood Service: Bibliometric Analysis. Health Econ. Manag. Rev. 2020, 1, 20–36. [Google Scholar] [CrossRef]
- Asadpour, M.; Olsen, T.L.; Boyer, O. An Updated Review on Blood Supply Chain Quantitative Models: A Disaster Perspective. Transp. Res. Part E Logist. Transp. Rev. 2022, 158, 102583. [Google Scholar] [CrossRef]
- Meneses, M.; Santos, D.; Barbosa-Póvoa, A. Modeling the Blood Supply Chain–From Strategic to Tactical Decisions. Eur. J. Oper. Res. 2023, 307, 499–518. [Google Scholar] [CrossRef]
- Eghtesadifard, M.; Jozan, F. A Systematic Literature Review on the Blood Supply Chain: Exploring the Trend and Future Research Directions. J. Ambient Intell. Humaniz. Comput. 2022, 13, 1173–1200. [Google Scholar] [CrossRef]
- Pierskalla, W.P. Supply Chain Management of Blood Banks. In Operations Research and Health Care; Kluwer Academic Publishers: Dordrecht, The Netherlands, 2005; pp. 103–145. [Google Scholar]
- Rowley, J.; Slack, F. Conducting a Literature Review. Manag. Res. News 2004, 27, 31–39. [Google Scholar] [CrossRef]
- Fahimnia, B.; Tang, C.S.; Davarzani, H.; Sarkis, J. Quantitative Models for Managing Supply Chain Risks: A Review. Eur. J. Oper. Res. 2015, 247, 1–15. [Google Scholar] [CrossRef]
- Fahimnia, B.; Sarkis, J.; Davarzani, H. Green Supply Chain Management: A Review and Bibliometric Analysis. Int. J. Prod. Econ. 2015, 162, 101–114. [Google Scholar] [CrossRef]
- Mishra, D.; Gunasekaran, A.; Papadopoulos, T.; Childe, S.J. Big Data and Supply Chain Management: A Review and Bibliometric Analysis. Ann. Oper. Res. 2018, 270, 313–336. [Google Scholar] [CrossRef] [Green Version]
- Davarzani, H.; Fahimnia, B.; Bell, M.; Sarkis, J. Greening Ports and Maritime Logistics: A Review. Transp. Res. Part D Transp. Environ. 2016, 48, 473–487. [Google Scholar] [CrossRef]
- Mongeon, P.; Paul-Hus, A. The Journal Coverage of Web of Science and Scopus: A Comparative Analysis. Scientometrics 2016, 106, 213–228. [Google Scholar] [CrossRef]
- Web of Science. Available online: https://clarivate.libguides.com/webofscienceplatform/coverage (accessed on 10 November 2021).
- Moral-Muñoz, J.A.; Herrera-Viedma, E.; Santisteban-Espejo, A.; Cobo, M.J. Software Tools for Conducting Bibliometric Analysis in Science: An up-to-Date Review. Prof. Inf. 2020, 29, 1–20. [Google Scholar] [CrossRef] [Green Version]
- Chehbi-Gamoura, S.; Derrouiche, R.; Damand, D.; Barth, M. Insights from Big Data Analytics in Supply Chain Management: An All-Inclusive Literature Review Using the SCOR Model. Prod. Plan. Control 2020, 31, 355–382. [Google Scholar] [CrossRef]
- Persson, O.; Danell, R.D.; Schneider, J.W. Celebrating Scholarly Communication Studies: A Festschrift for Olle Persson at His 60th Birthday; ISSI; International Society for Scientometrics and Informetrics: Bloomington, IN, USA, 2009; pp. 1–95. [Google Scholar]
- Dahesh, M.B.; Tabarsa, G.; Zandieh, M.; Hamidizadeh, M. Reviewing the Intellectual Structure and Evolution of the Innovation Systems Approach: A Social Network Analysis. Technol. Soc. 2020, 63, 101399. [Google Scholar] [CrossRef]
- Reong, S.; Wee, H.M.; Hsiao, Y.L. 20 Years of Particle Swarm Optimization Strategies for the Vehicle Routing Problem: A Bibliometric Analysis. Mathematics 2022, 10, 3669. [Google Scholar] [CrossRef]
- Diaby, V.; Campbell, K.; Goeree, R. Multi-Criteria Decision Analysis (MCDA) in Health Care: A Bibliometric Analysis. Oper. Res. Health Care 2013, 2, 20–24. [Google Scholar] [CrossRef]
- Katsaliaki, K.; Brailsford, S.C. Using Simulation to Improve the Blood Supply Chain. J. Oper. Res. Soc. 2007, 58, 219–227. [Google Scholar] [CrossRef]
- Hemmelmayr, V.; Doerner, K.F.; Hartl, R.F.; Savelsbergh, M.W.P. Vendor Managed Inventory for Environments with Stochastic Product Usage. Eur. J. Oper. Res. 2010, 202, 686–695. [Google Scholar] [CrossRef]
- Dillon, M.; Oliveira, F.; Abbasi, B. A Two-Stage Stochastic Programming Model for Inventory Management in the Blood Supply Chain. Int. J. Prod. Econ. 2017, 187, 27–41. [Google Scholar] [CrossRef]
- Duan, Q.; Liao, T.W. Optimization of Blood Supply Chain with Shortened Shelf Lives and ABO Compatibility. Int. J. Prod. Econ. 2014, 153, 113–129. [Google Scholar] [CrossRef]
- Ramezanian, R.; Behboodi, Z. Blood Supply Chain Network Design under Uncertainties in Supply and Demand Considering Social Aspects. Transp. Res. Part E Logist. Transp. Rev. 2017, 104, 69–82. [Google Scholar] [CrossRef]
- Gunpinar, S.; Centeno, G. Stochastic Integer Programming Models for Reducing Wastages and Shortages of Blood Products at Hospitals. Comput. Oper. Res. 2015, 54, 129–141. [Google Scholar] [CrossRef]
- Van Dijk, N.; Haijema, R.; Van Der Wal, J.; Sibinga, C.S. Blood Platelet Production: A Novel Approach for Practical Optimization. Transfusion 2009, 49, 411–420. [Google Scholar] [CrossRef] [PubMed]
- Haijema, R.; van der Wal, J.; van Dijk, N.M. Blood Platelet Production: Optimization by Dynamic Programming and Simulation. Comput. Oper. Res. 2007, 34, 760–779. [Google Scholar] [CrossRef]
- Hosseinifard, Z.; Abbasi, B. The Inventory Centralization Impacts on Sustainability of the Blood Supply Chain. Comput. Oper. Res. 2018, 89, 206–212. [Google Scholar] [CrossRef]
- Nagurney, A.; Masoumi, A.; Yu, M. Supply Chain Network Operations Management of a Blood Banking System with Cost and Risk Minimization. Comput. Manag. Sci. 2012, 9, 205–231. [Google Scholar] [CrossRef]
- Zhou, D.; Leung, L.C.; Pierskalla, W.P. Inventory Management of Platelets in Hospitals: Optimal Inventory Policy for Perishable Products with Emergency Replenishments. Manuf. Serv. Oper. Manag. 2011, 13, 420–438. [Google Scholar] [CrossRef]
- Sha, Y.; Huang, J. The Multi-Period Location-Allocation Problem of Engineering Emergency Blood Supply Systems. Syst. Eng. Procedia 2012, 5, 21–28. [Google Scholar] [CrossRef] [Green Version]
- Nahmias, S. Perishable Inventory Theory: A Review. Oper. Res. 1982, 30, 680–708. [Google Scholar] [CrossRef] [PubMed]
- Ghandforoush, P.; Sen, T.K. A DSS to Manage Platelet Production Supply Chain for Regional Blood Centers. Decis. Support. Syst. 2010, 50, 32–42. [Google Scholar] [CrossRef]
- Haijema, R.; van Dijk, N.; van der Wal, J.; Smit Sibinga, C. Blood Platelet Production with Breaks: Optimization by SDP and Simulation. Int. J. Prod. Econ. 2009, 121, 464–473. [Google Scholar] [CrossRef]
- Zahiri, B.; Torabi, S.A.; Mousazadeh, M.; Mansouri, S.A. Blood Collection Management: Methodology and Application. Appl. Math. Model. 2015, 39, 7680–7696. [Google Scholar] [CrossRef]
- Abdulwahab, U.; Wahab, M.I.M. Approximate Dynamic Programming Modeling for a Typical Blood Platelet Bank. Comput. Ind. Eng. 2014, 78, 259–270. [Google Scholar] [CrossRef]
- Salehi, F.; Mahootchi, M.; Husseini, S.M.M. Developing a Robust Stochastic Model for Designing a Blood Supply Chain Network in a Crisis: A Possible. Ann. Oper. Res. 2017, 283, 679–703. [Google Scholar] [CrossRef]
- Narin, F.; Hamilton, K.S. Bibliometric Performance Measures. Budapest Sci. 1996, 36, 293–310. [Google Scholar] [CrossRef]
- Bollen, J.; Rodriguez, M.A.; Van De Sompel, H. Journal Status. Budapest Sci. 2006, 69, 669–687. [Google Scholar] [CrossRef] [Green Version]
- Garfield, E. Is Citation Analysis a Legitimate Evaluation Tool? Scientometrics 1979, 1, 359–375. [Google Scholar] [CrossRef]
- Brin, S.; Page, L. The Anatomy of a Large-Scale Hypertextual Web Search Engine. Comput. Netw. ISDN Syst. 1998, 30, 107–117. [Google Scholar] [CrossRef]
- Hjørland, B. Citation Analysis: A Social and Dynamic Approach to Knowledge Organization. Inf. Process. Manag. 2013, 49, 1313–1325. [Google Scholar] [CrossRef]
- Yan, E.; Ding, Y. Scholarly Network Similarities: How Bibliographic Coupling Networks, Citation Networks, Cocitation Networks, Topical Networks, Coauthorship Networks, and Coword Networks Relate to Each Other. J. Am. Soc. Inf. Sci. Technol. 2012, 63, 1313–1326. [Google Scholar] [CrossRef]
- Blondel, V.D.; Guillaume, J.L.; Lambiotte, R.; Lefebvre, E. Fast Unfolding of Communities in Large Networks. J. Stat. Mech. Theory Exp. 2008, 2008, P10008. [Google Scholar] [CrossRef] [Green Version]
- Dehghani, M.; Abbasi, B. An Age-Based Lateral-Transshipment Policy for Perishable Items. Int. J. Prod. Econ. 2018, 198, 93–103. [Google Scholar] [CrossRef]
- Wang, K.M.; Ma, Z.J. Age-Based Policy for Blood Transshipment during Blood Shortage. Transp. Res. Part E Logist. Transp. Rev. 2015, 80, 166–183. [Google Scholar] [CrossRef]
- Rajendran, S.; Ravi Ravindran, A. Inventory Management of Platelets along Blood Supply Chain to Minimize Wastage and Shortage. Comput. Ind. Eng. 2019, 130, 714–730. [Google Scholar] [CrossRef]
- Katsaliaki, K. Cost-Effective Practices in the Blood Service Sector. Health Policy 2008, 86, 276–287. [Google Scholar] [CrossRef]
- Clay, N.M.N.; Abbasi, B.; Research, A.E.; Eberhard, A.; Hearne, J. On the Volatility of Blood Inventories. Int. Trans. Oper. Res. 2018, 25, 215–242. [Google Scholar] [CrossRef]
- Rytile, J.S.; Spens, K.M. Using Simulation to Increase Efficiency in Blood Supply Chains. Manag. Res. News 2006, 29, 801–819. [Google Scholar] [CrossRef]
- Rajendran, S.; Ravindran, A.R. Platelet Ordering Policies at Hospitals Using Stochastic Integer Programming Model and Heuristic Approaches to Reduce Wastage. Comput. Ind. Eng. 2017, 110, 151–164. [Google Scholar] [CrossRef]
- Karaesmen, I.Z.; Scheller-Wolf, A.; Deniz, B. Managing Perishable and Aging Inventories: Review and Future Research Directions. In International Series in Operations Research and Management Science; Springer: New York, NY, USA, 2011; Volume 151, pp. 393–436. [Google Scholar]
- Hemmelmayr, V.; Doerner, K.F.; Hartl, R.F.; Savelsbergh, M.W.P. Delivery Strategies for Blood Products Supplies. OR Spectr. 2009, 31, 707–725. [Google Scholar] [CrossRef]
- Abbasi, B.; Hosseinifard, S.Z. On the Issuing Policies for Perishable Items Such as Red Blood Cells and Platelets in Blood Service. Decis. Sci. 2014, 45, 995–1020. [Google Scholar] [CrossRef]
- Civelek, I.; Karaesmen, I.; Scheller-Wolf, A. Blood Platelet Inventory Management with Protection Levels. Eur. J. Oper. Res. 2015, 243, 826–838. [Google Scholar] [CrossRef]
- Kopach, R.; Balcioǧlu, B.; Carter, M. Tutorial on Constructing a Red Blood Cell Inventory Management System with Two Demand Rates. Eur. J. Oper. Res. 2008, 185, 1051–1059. [Google Scholar] [CrossRef]
- Abbasi, B.; Vakili, G.; Chesneau, S. Impacts of Reducing the Shelf Life of Red Blood Cells: A View from down Under. Interfaces 2017, 47, 336–351. [Google Scholar] [CrossRef]
- Duan, Q.; Liao, T.W. A New Age-Based Replenishment Policy for Supply Chain Inventory Optimization of Highly Perishable Products. Int. J. Prod. Econ. 2013, 145, 658–671. [Google Scholar] [CrossRef]
- Delen, D.; Erraguntla, M.; Mayer, R.J.; Wu, C.-N.; Delen, D.; Erraguntla, M.; Mayer, R.J.; Wu, C.-N.; Mayer, R.J. Better Management of Blood Supply-Chain with GIS-Based Analytics. Ann. Oper. Res. 2011, 185, 181–193. [Google Scholar] [CrossRef]
- Sarhangian, V.; Abouee-Mehrizi, H.; Baron, O.; Berman, O. Threshold-Based Allocation Policies for Inventory Management of Red Blood Cells. Manuf. Serv. Oper. Manag. 2018, 20, 347–362. [Google Scholar] [CrossRef]
- Pierskalla, W.P.; Roach, C.D. Optimal Issuing Policies for Perishable Inventory. Manag. Sci. 1972, 19, 603–614. [Google Scholar] [CrossRef]
- Brodheim, E.; Derman, C.; Prastacos, G. On the Evaluation of a class of inventory policies for perishable products such as blood. Manage. Sci. 1975, 21, 1320–1325. [Google Scholar] [CrossRef]
- Rajendran, S.; Srinivas, S. Hybrid Ordering Policies for Platelet Inventory Management under Demand Uncertainty. IISE Trans. Healthc. Syst. Eng. 2019, 10, 113–126. [Google Scholar] [CrossRef]
- Pegels, C.C.; Jelmert, A.E. An Evaluation of Blood-Inventory Policies: A Markov Chain Application. Oper. Res. 1970, 18, 1087–1098. [Google Scholar] [CrossRef]
- Cohen, M.A.; Pierskalla, W.P. Target Inventory Levels for a Hospital Blood Bank or a Decentralized Regional Blood Banking System. Transfusion 1979, 19, 444–454. [Google Scholar] [CrossRef] [PubMed]
- Alshamrani, A.; Mathur, K.; Ballou, R.H. Reverse Logistics: Simultaneous Design of Delivery Routes and Returns Strategies. Comput. Oper. Res. 2007, 34, 595–619. [Google Scholar] [CrossRef]
- Veihola, M.; Aroviita, P.; Linna, M.; Sintonen, H.; Kekomäki, R. International Comparison of the Technical Efficiency of Component Preparation. Transfusion 2006, 46, 2109–2114. [Google Scholar] [CrossRef] [PubMed]
- Mustafee, N.; Taylor, S.J.E.; Katsaliaki, K.; Brailsford, S. Facilitating the Analysis of a UK National Blood Service Supply Chain Using Distributed Simulation. Simulation 2009, 85, 113–128. [Google Scholar] [CrossRef] [Green Version]
- Masoumi, A.H.; Yu, M.; Nagurney, A. Mergers and Acquisitions in Blood Banking Systems: A Supply Chain Network Approach. Int. J. Prod. Econ. 2017, 193, 406–421. [Google Scholar] [CrossRef]
- Yaghoubi, S.; Hosseini-Motlagh, S.M.; Cheraghi, S.; Gilani Larimi, N. Designing a Robust Demand-Differentiated Platelet Supply Chain Network under Disruption and Uncertainty. J. Ambient Intell. Humaniz. Comput. 2020, 11, 3231–3258. [Google Scholar] [CrossRef]
- Salazar-Concha, C.; Ramírez-Correa, P.; Karwowski, W.; Parsaei, B.; Parsaei, H.R.; Carlos, J.; Alcantud, R. Predicting the Intention to Donate Blood among Blood Donors Using a Decision Tree Algorithm. Symmetry 2021, 13, 1460. [Google Scholar] [CrossRef]
- Lin, S.W.; Anisa, K.N.; Chen, Y.C. Effects of Meteorological Factors on Blood Donation. Transfus. Apher. Sci. 2020, 59, 102901. [Google Scholar] [CrossRef] [PubMed]
- Chen, X.; Liu, L.; Guo, X. Analysing Repeat Blood Donation Behavior via Big Data. Ind. Manag. Data Syst. 2021, 121, 192–208. [Google Scholar] [CrossRef]
- AlZu’bi, S.; Aqel, D.; Lafi, M. An Intelligent System for Blood Donation Process Optimization-Smart Techniques for Minimizing Blood Wastages. Cluster Comput. 2022, 25, 3617–3627. [Google Scholar] [CrossRef]
- Saltzmann, C.; Boenigk, S. Blood Donors’ Usage Intentions of Donation Appointment-Scheduling Systems during the COVID-19 Pandemic and Beyond. J. Philanthr. Mark. 2022, 27, e1756. [Google Scholar] [CrossRef]
- Kauten, C.; Gupta, A.; Qin, X.; Richey, G. Predicting Blood Donors Using Machine Learning Techniques. Inf. Syst. Front. 2021, 24, 1547–1562. [Google Scholar] [CrossRef]
- Zhang, X.; Zhao, X.; Mou, X.; Tan, M. Mixed Time Series Approaches for Forecasting the Daily Number of Hospital Blood Collections. Int. J. Health Plan. Manag. 2021, 36, 1714. [Google Scholar] [CrossRef]
- Shih, H.; Rajendran, S. Comparison of Time Series Methods and Machine Learning Algorithms for Forecasting Taiwan Blood Services Foundation’s Blood Supply. J. Healthc. Eng. 2019, 2019, 6123745. [Google Scholar] [CrossRef] [PubMed]
- Özener, O.Ö.; Ekici, A.; Çoban, E. Improving Blood Products Supply Through Donation Tailoring. Comput. Oper. Res. 2019, 102, 10–21. [Google Scholar] [CrossRef]
- Fortsch, S.M.; Perera, S. A Resilient Donor Arrival Policy for Blood. Oper. Res. Health Care 2018, 19, 165–174. [Google Scholar] [CrossRef]
- Yalçındağ, S.; Baş Güre, S.; Carello, G.; Lanzarone, E. A Stochastic Risk-Averse Framework for Blood Donation Appointment Scheduling under Uncertain Donor Arrivals. Health Care Manag. Sci. 2020, 23, 535–555. [Google Scholar] [CrossRef]
- Mobasher, A.; Ekici, A.; Özener, O.Ö.; Örsan, O. Computers & Industrial Engineering Coordinating Collection and Appointment Scheduling Operations at the Blood Donation Sites Q. Comput. Ind. Eng. 2015, 87, 260–266. [Google Scholar] [CrossRef]
- Şahinyazan, F.G.; Kara, B.Y.; Taner, M.R. Selective Vehicle Routing for a Mobile Blood Donation System. Eur. J. Oper. Res. 2015, 245, 22–34. [Google Scholar] [CrossRef] [Green Version]
- Haitam, E.; Najat, R.; Abouchabaka, J. A Vehicle Routing Problem for the Collection of Medical Samples at Home: Case Study of Morocco. Int. J. Adv. Comput. Sci. Appl. 2021, 12, 2021. [Google Scholar] [CrossRef]
- Özener, O.Ö.; Ekici, A. Managing Platelet Supply through Improved Routing of Blood Collection Vehicles. Comput. Oper. Res. 2018, 98, 113–126. [Google Scholar] [CrossRef]
- Rabbani, M.; Aghabegloo, M.; Farrokhi-Asl, H. Solving a Bi-Objective Mathematical Programming Model for Bloodmobiles Location Routing Problem. Int. J. Ind. Eng. Comput. 2017, 8, 19–32. [Google Scholar] [CrossRef]
- Doerner, K.F.; Gronalt, M.; Hartl, R.F.; Kiechle, G.; Reimann, M. Exact and Heuristic Algorithms for the Vehicle Routing Problem with Multiple Interdependent Time Windows. Comput. Oper. Res. 2008, 35, 3034–3048. [Google Scholar] [CrossRef]
- Gunpinar, S.; Centeno, G. An Integer Programming Approach to the Bloodmobile Routing Problem. Transp. Res. Part E Logist. Transp. Rev. 2016, 86, 94–115. [Google Scholar] [CrossRef]
- Pirabán-Ramírez, A.; Guerrero-Rueda, W.J.; Labadie, N. The Multi-Trip Vehicle Routing Problem with Increasing Profits for the Blood Transportation: An Iterated Local Search Metaheuristic. Comput. Ind. Eng. 2022, 170, 108294. [Google Scholar] [CrossRef]
- Veihola, M.; Aroviita, P.; Linna, M.; Sintonen, H.; Kekomäki, R. Variation of Platelet Production and Discard Rates in 17 Blood Centers Representing 10 European Countries from 2000 to 2002. Transfusion 2006, 46, 991–995. [Google Scholar] [CrossRef]
- Mousazadeh, S.; Darestani, S.A. Modeling a Production-Inventory-Routing Problem of Blood Products Using Heuristic Solution Methods. J. Intell. Fuzzy Syst. 2019, 37, 5589–5609. [Google Scholar] [CrossRef]
- Attari, M.Y.N.; Jami, E.N. Robust Stochastic Multi-Choice Goal Programming for Blood Collection and Distribution Problem with Real Application. J. Intell. Fuzzy Syst. 2018, 35, 2015–2033. [Google Scholar] [CrossRef]
- Habibi-Kouchaksaraei, M.; Paydar, M.M.; Asadi-Gangraj, E. Designing a Bi-Objective Multi-Echelon Robust Blood Supply Chain in a Disaster. Appl. Math. Model. 2018, 55, 583–599. [Google Scholar] [CrossRef]
- Eskandari-Khanghahi, M.; Tavakkoli-Moghaddam, R.; Taleizadeh, A.A.; Amin, S.H. Designing and Optimizing a Sustainable Supply Chain Network for a Blood Platelet Bank under Uncertainty. Eng. Appl. Artif. Intell. 2018, 71, 236–250. [Google Scholar] [CrossRef]
- Glasgow, S.M.; Perkins, Z.B.; Tai, N.R.M.; Brohi, K.; Vasilakis, C. Development of a Discrete Event Simulation Model for Evaluating Strategies of Red Blood Cell Provision Following Mass Casualty Events. Eur. J. Oper. Res. 2018, 270, 362–374. [Google Scholar] [CrossRef]
- Yousefi Nejad Attari, M.; Pasandideh, S.H.R.; Akhavan Niaki, S.T. A Hybrid Robust Stochastic Programming for a Bi-Objective Blood Collection Facilities Problem (Case Study: Iranian Blood Transfusion Network). J. Ind. Prod. Eng. 2019, 36, 154–167. [Google Scholar] [CrossRef]
- Haijema, R. A New Class of Stock-Level Dependent Ordering Policies for Perishables with a Short Maximum Shelf Life. Int. J. Prod. Econ. 2013, 143, 434–439. [Google Scholar] [CrossRef]
- Li, N.; Arnold, D.M.; Down, D.G.; Barty, R.; Blake, J.; Chiang, F.; Courtney, T.; Waito, M.; Trifunov, R.; Heddle, N.M. From Demand Forecasting to Inventory Ordering Decisions for Red Blood Cells through Integrating Machine Learning, Statistical Modeling, and Inventory Optimization. Transfusion 2022, 62, 87–99. [Google Scholar] [CrossRef]
- Luo, Z.; Chen, X. Ordering Policies for Heterogeneous Platelets Demand with Unreliable Supply and Substitution. J. Oper. Res. Soc. 2021, 73, 919–935. [Google Scholar] [CrossRef]
- Meneses, M.; Marques, I.; Barbosa-Póvoa, A. Blood Inventory Management: Ordering Policies for Hospital Blood Banks under Uncertainty. Int. Trans. Oper. Res. 2021, 30, 273–301. [Google Scholar] [CrossRef]
- Haijema, R. Optimal Ordering, Issuance and Disposal Policies for Inventory Management of Perishable Products. Int. J. Prod. Econ. 2014, 157, 158–169. [Google Scholar] [CrossRef]
- Lowalekar, H.; Nilakantan, R.; Ravichandran, N. Analysis of an Order-up-to-Level Policy for Perishables with Random Issuing. J. Oper. Res. Soc. 2016, 67, 483–505. [Google Scholar] [CrossRef]
- Sarhangian, V.; Abouee-Mehrizi, H.; Baron, O.; Berman, O.; Heddle, N.M.; Barty, R. Reducing the Age of Transfused Red Blood Cells in Hospitals: Ordering and Allocation Policies. Vox Sang. 2016, 110, 385–392. [Google Scholar] [CrossRef]
- Fanoodi, B.; Malmir, B.; Jahantigh, F.F. Reducing Demand Uncertainty in the Platelet Supply Chain through Artificial Neural Networks and ARIMA Models. Comput. Biol. Med. 2019, 113, 103415. [Google Scholar] [CrossRef]
- Li, N.; Chiang, F.; Down, D.G.; Heddle, N.M. A Decision Integration Strategy for Short-Term Demand Forecasting and Ordering for Red Blood Cell Components. Oper. Res. Health Care 2021, 29, 100290. [Google Scholar] [CrossRef]
- Fortsch, S.M.; Khapalova, E.A. Reducing Uncertainty in Demand for Blood. Oper. Res. Health Care 2016, 9, 16–28. [Google Scholar] [CrossRef]
- Sun, X.; Xu, Z.; Feng, Y.; Yang, Q.; Xie, Y.; Wang, D.; Yu, Y. RBC Inventory-Management System Based on XGBoost Model. Indian J. Hematol. Blood Transfus. 2021, 37, 126–133. [Google Scholar] [CrossRef]
- Grasas, A.; Pereira, A.; Bosch, M.A.; Ortiz, P.; Puig, L. Feasibility of Reducing the Maximum Shelf Life of Red Blood Cells Stored in Additive Solution: A Dynamic Simulation Study Involving a Large Regional Blood System. Vox Sang. 2015, 108, 233–242. [Google Scholar] [CrossRef]
- Blake, J.T. Determining the Inventory Impact of Extended-Shelf-Life Platelets with a Network Simulation Model. Transfusion 2017, 57, 3001–3008. [Google Scholar] [CrossRef]
- Rashidzadeh, E.; Mohammad, S.; Molana, H.; Soltani, R.; Hafezalkotob, A. Assessing the Sustainability of Using Drone Technology for Last-Mile Delivery in a Blood Supply Chain. J. Model. Manag. 2021, 16, 1376–1402. [Google Scholar] [CrossRef]
- Dhote, J.; Limbourg, S. Designing Unmanned Aerial Vehicle Networks for Biological Material Transportation–The Case of Brussels. Comput. Ind. Eng. 2020, 148, 106652. [Google Scholar] [CrossRef]
- Farrokhizadeh, E.; Seyfi-Shishavan, S.A.; Satoglu, S.I. Blood Supply Planning during Natural Disasters under Uncertainty: A Novel Bi-Objective Model and an Application for Red Crescent. Ann. Oper. Res. 2022, 319, 73–113. [Google Scholar] [CrossRef]
- Khan, S.I.; Qadir, Z.; Munawar, H.S.; Nayak, S.R.; Budati, A.K.; Verma, K.D.; Prakash, D. UAVs Path Planning Architecture for Effective Medical Emergency Response in Future Networks. Phys. Commun. 2021, 47, 101337. [Google Scholar] [CrossRef]
- Nisingizwe, M.P.; Ndishimye, P.; Swaibu, K.; Nshimiyimana, L.; Karame, P.; Dushimiyimana, V.; Musabyimana, J.P.; Musanabaganwa, C.; Nsanzimana, S.; Law, M.R. Effect of Unmanned Aerial Vehicle (Drone) Delivery on Blood Product Delivery Time and Wastage in Rwanda: A Retrospective, Cross-Sectional Study and Time Series Analysis. Lancet Glob. Health 2022, 10, e564–e569. [Google Scholar] [CrossRef]
- Beiki, H.; Seyedhosseini, S.M.; Mihardjo, L.W.W.; Seyedaliakbar, S.M. Multiobjective Location-Routing Problem of Relief Commodities with Reliability. Environ. Sci. Pollut. Res. 2021, 1–10. [Google Scholar] [CrossRef]
- Hosseini-Motlagh, S.M.; Samani, M.R.G.; Homaei, S. Toward a Coordination of Inventory and Distribution Schedules for Blood in Disasters. Socioecon. Plan. Sci. 2020, 72, 100897. [Google Scholar] [CrossRef]
- Shokouhifar, M.; Sabbaghi, M.M.; Pilevari, N. Inventory Management in Blood Supply Chain Considering Fuzzy Supply/Demand Uncertainties and Lateral Transshipment. Transfus. Apher. Sci. 2021, 60, 103103. [Google Scholar] [CrossRef]
- Arani, M.; Chan, Y.; Liu, X.; Momenitabar, M. A Lateral Resupply Blood Supply Chain Network Design under Uncertainties. Appl. Math. Model. 2021, 93, 165–187. [Google Scholar] [CrossRef]
- Gilani Larimi, N.; Yaghoubi, S.; Hosseini-Motlagh, S.M. Itemized Platelet Supply Chain with Lateral Transshipment under Uncertainty Evaluating Inappropriate Output in Laboratories. Socioecon. Plan. Sci. 2019, 68, 100697. [Google Scholar] [CrossRef]
- Osorio, A.F.; Brailsford, S.C.; Smith, H.K. Whole Blood or Apheresis Donations? A Multi-Objective Stochastic Optimization Approach. Eur. J. Oper. Res. 2018, 266, 193–204. [Google Scholar] [CrossRef] [Green Version]
- American Red Croos Plasma, Platelets and Whole Blood|Red Cross Blood Services. Available online: https://www.redcrossblood.org/donate-blood/how-to-donate/types-of-blood-donations/blood-components.html (accessed on 26 March 2022).
- Turkulainen, E.V.; Wemelsfelder, M.L.; Janssen, M.P.; Arvas, M. A Robust Autonomous Method for Blood Demand Forecasting. Transfusion 2022, 62, 1261–1268. [Google Scholar] [CrossRef]
- Hosseini, K.M.; Ghasemzadeh, M. Implementation of Plasma Fractionation in Biological Medicines Production. Iran. J. Biotechnol. 2016, 14, 213. [Google Scholar] [CrossRef] [Green Version]
- Asadpour, M.; Boyer, O.; Tavakkoli-Moghaddam, R. A Blood Supply Chain Network with Backup Facilities Considering Blood Groups and Expiration Date: A Real-World Application. Int. J. Eng. Trans. B Appl. 2021, 34, 470–479. [Google Scholar] [CrossRef]
- Baghbani, B. A Mixed Integer Programming Optimization of Blood Plasma Supply Chain in the Uncertainty Conditions during COVID-19: A Real Case in Iran. Discret. Dyn. Nat. Soc. 2022, 2022, 3783119. [Google Scholar] [CrossRef]
- Ghasemi, P.; Goodarzian, F.; Abraham, A.; Khanchehzarrin, S. A Possibilistic-Robust-Fuzzy Programming Model for Designing a Game Theory Based Blood Supply Chain Network. Appl. Math. Model. 2022, 112, 282–303. [Google Scholar] [CrossRef] [PubMed]
- Li, N.; Zeller, M.P.; Shih, A.W.; Heddle, N.M.; St. John, M.; Bégin, P.; Callum, J.; Arnold, D.M.; Akbari-Moghaddam, M.; Down, D.G.; et al. A Data-Informed System to Manage Scarce Blood Product Allocation in a Randomized Controlled Trial of Convalescent Plasma. Transfusion 2022, 62, 2525–2538. [Google Scholar] [CrossRef] [PubMed]
- Hosseini-Motlagh, S.M.; Gilani Larimi, N.; Oveysi Nejad, M. A Qualitative, Patient-Centered Perspective toward Plasma Products Supply Chain Network Design with Risk Controlling. Oper. Res. 2022, 22, 779–824. [Google Scholar] [CrossRef]
- Ayer, T.; Zhang, C.; Zeng, C.; White, C.C.; Roshan Joseph, V. Analysis and Improvement of Blood Collection Operations. Manuf. Serv. Oper. Manag. 2019, 21, 29–46. [Google Scholar] [CrossRef]
- Haeri, A.; Hosseini-Motlagh, S.M.; Ghatreh Samani, M.R.; Rezaei, M. A Mixed Resilient-Efficient Approach toward Blood Supply Chain Network Design. Int. Trans. Oper. Res. 2020, 27, 1962–2001. [Google Scholar] [CrossRef]
- Kazemi, S.M.; Rabbani, M.; Tavakkoli-Moghaddam, R.; Shahreza, F.A. Blood Inventory-Routing Problem under Uncertainty. J. Intell. Fuzzy Syst. 2017, 32, 467–481. [Google Scholar] [CrossRef]
- Pouraliakbari-Mamaghani, M.; Ghodratnama, A.; Hamid Reza Pasandideh, S.; Saif, A.; Pouraliakbari-Mamaghani, M. A Robust Possibilistic Programming Approach for Blood Supply Chain Network Design in Disaster Relief Considering Congestion. Oper. Res. 2021, 2021, 1–46. [Google Scholar] [CrossRef]
- Kenan, N.; Diabat, A. The Supply Chain of Blood Products in the Wake of the COVID-19 Pandemic: Appointment Scheduling and Other Restrictions. Transp. Res. Part E Logist. Transp. Rev. 2022, 159, 102576. [Google Scholar] [CrossRef]
- Guo, X.; Liu, A.; Li, X.; Liu, T. A Two-Stage Stochastic Model for Daily Reserve in Inventory Management of Rh-Negative Red Blood Cells. J. Intell. Fuzzy Syst. 2020, 39, 6919–6933. [Google Scholar] [CrossRef]
- Chen, S.; Wang, C. Incorporating a Bayesian Network into Two-Stage Stochastic Programming for Blood Bank Location-Inventory Problem in Case of Disasters. Discret. Dyn. Nat. Soc. 2019, 2019, 7214907. [Google Scholar] [CrossRef] [Green Version]
- Zarezadeh, M.; Naji-Azimi, Z.; Morovati, A.; Pirayesh, M. A New Model and a Monte Carlo Based Particle Swarm Optimization Algorithm for the Stochastic Blood Assignment Problem. RAIRO-Oper. Res. 2020, 54, 1013–1025. [Google Scholar] [CrossRef]
- Zahiri, B.; Torabi, S.A.; Mohammadi, M.; Aghabegloo, M. A Multi-Stage Stochastic Programming Approach for Blood Supply Chain Planning. Comput. Ind. Eng. 2018, 122, 1–14. [Google Scholar] [CrossRef]
- Kurt, A.; Çetinkaya, F.C.; Azizoğlu, M. A Blood Distribution Problem with New Transportation Options-an Application for the Turkish Red Crescent. Eur. J. Ind. Eng. 2019, 13, 332. [Google Scholar] [CrossRef]
- Kurt, A.; Azizoglu, M.; Çetinkaya, F.C. Solution Approaches to the Blood Distribution Problem of the Turkish Red Crescent. Eur. J. Ind. Eng. 2018, 12, 405–441. [Google Scholar] [CrossRef]
- Wen, T.; Zhang, Z.; Wong, K.K.L. Multi-Objective Algorithm for Blood Supply via Unmanned Aerial Vehicles to the Wounded in an Emergency Situation. PLoS ONE 2016, 11, e0155176. [Google Scholar] [CrossRef] [Green Version]
- Kaya, O.; Ozkok, D. A Blood Bank Network Design Problem with Integrated Facility Location, Inventory and Routing Decisions. Netw. Spat. Econ. 2020, 20, 757–783. [Google Scholar] [CrossRef]
- Dharmaraja, S.; Narang, S.; Jain, V. A Mathematical Model for Supply Chain Management of Blood Banks in India. Opsearch 2020, 57, 541–552. [Google Scholar] [CrossRef]
- Al-Rabiaah, S.; Hosny, M.; AlMuhaideb, S. A Greedy Heuristic Based on Optimizing Battery Consumption and Routing Distance for Transporting Blood Using Unmanned Aerial Vehicles. Electronics 2022, 11, 3399. [Google Scholar] [CrossRef]
- Ensafian, H.; Yaghoubi, S.; Modarres Yazdi, M. Raising Quality and Safety of Platelet Transfusion Services in a Patient-Based Integrated Supply Chain under Uncertainty. Comput. Chem. Eng. 2017, 106, 355–372. [Google Scholar] [CrossRef]
- Ejohwomu, O.A.; Too, J.; Edwards, D.J. A Resilient Approach to Modelling the Supply and Demand of Platelets in the United Kingdom Blood Supply Chain. Int. J. Manag. Sci. Eng. Manag. 2021, 16, 143–150. [Google Scholar] [CrossRef]
- Ezugwu, A.E.; Olusanya, M.O.; Govender, P. Mathematical Model Formulation and Hybrid Metaheuristic Optimization Approach for Near-Optimal Blood Assignment in a Blood Bank System. Expert Syst. Appl. 2019, 137, 74–99. [Google Scholar] [CrossRef]
- Qamsari, A.S.N.; Hosseini-Motlagh, S.M.; Ghannadpour, S.F. A Column Generation Approach for an Inventory Routing Problem with Fuzzy Time Windows. Oper. Res. 2022, 22, 1157–1207. [Google Scholar] [CrossRef]
- Ghorashi, S.B.; Hamedi, M.; Sadeghian, R. Modeling and Optimization of a Reliable Blood Supply Chain Network in Crisis Considering Blood Compatibility Using MOGWO. Neural Comput. Appl. 2020, 32, 12173–12200. [Google Scholar] [CrossRef]
- Whitaker, B.; Rajbhandary, S.; Kleinman, S.; Harris, A.; Kamani, N. Trends in United States Blood Collection and Transfusion: Results from the 2013 AABB Blood Collection, Utilization, and Patient Blood Management Survey. Transfusion 2016, 56, 2173–2183. [Google Scholar] [CrossRef]
- Basavarajegowda, A.; Bajpai, M.; Arora, S.; Maheshwari, A.; Dua, S.; Sahoo, D. Survey Based Cross-Sectional Study to Analyse the Variation of Practices at Blood Centres during COVID-19 Pandemic in India. Transfus. Apher. Sci. 2021, 60, 103131. [Google Scholar] [CrossRef]
- Ahmadimanesh, M.; Tavakoli, A.; Pooya, A.; Dehghanian, F. Designing an Optimal Inventory Management Model for the Blood Supply Chain: Synthesis of Reusable Simulation and Neural Network. Medicine 2020, 99, e21208. [Google Scholar] [CrossRef]
- Abbasi, B.; Babaei, T.; Hosseinifard, Z.; Smith-Miles, K.; Dehghani, M. Predicting Solutions of Large-Scale Optimization Problems via Machine Learning: A Case Study in Blood Supply Chain Management. Comput. Oper. Res. 2020, 119, 104941. [Google Scholar] [CrossRef]
- Hosseini-Motlagh, S.M.; Samani, M.R.G.; Cheraghi, S. Robust and Stable Flexible Blood Supply Chain Network Design under Motivational Initiatives. Socioecon. Plan. Sci. 2020, 70, 100725. [Google Scholar] [CrossRef]
- Haeri, A.; Hosseini Motlagh, S.M.; Samani, M.R.G.; Rezaei, M. A Bi-Level Programming Approach for Improving Relief Logistics Operations: A Real Case in Kermanshah Earthquake. Comput. Ind. Eng. 2020, 145, 106532. [Google Scholar] [CrossRef]
- Veihola, M.; Aroviita, P.; Kekomäki, R.; Linna, M.; Sintonen, H. Discarded Cellular Components and the Technical Efficiency of Component Preparation. Eur. J. Health. Econ. 2008, 9, 325–331. [Google Scholar] [CrossRef] [PubMed]
- Abbaspour, A.; Jahan, A.; Rezaiee, M. A Simple Empirical Model for Blood Platelet Production and Inventory Management under Uncertainty. J. Ambient Intell. Humaniz. Comput. 2021, 12, 1783–1799. [Google Scholar] [CrossRef]
- Nagurney, A.; Dutta, P. Competition for Blood Donations. Omega 2019, 85, 103–114. [Google Scholar] [CrossRef]
- Dutta, P.; Nagurney, A. Multitiered Blood Supply Chain Network Competition: Linking Blood Service Organizations, Hospitals, and Payers. Oper. Res. Health Care 2019, 23, 100230. [Google Scholar] [CrossRef]
- Nagurney, A.; Dutta, P. Supply Chain Network Competition among Blood Service Organizations: A Generalized Nash Equilibrium Framework. Ann. Oper. Res. 2019, 275, 551–586. [Google Scholar] [CrossRef]
- Wilding, R.; Cotton, S.; Dobbin, J.; Chapman, J.; Yates, N. Time-Based Analysis of the Apheresis Platelet Supply Chain in England. Vox Sang. 2011, 101, 247–249. [Google Scholar] [CrossRef]
- Sharma, B.; Ramkumar, M.; Subramanian, N.; Malhotra, B. Dynamic Temporary Blood Facility Location-Allocation during and Post-Disaster Periods. Ann. Oper. Res. 2019, 283, 705–736. [Google Scholar] [CrossRef]
- Li, Y.C.; Liao, H.C. The Optimal Parameter Design for a Blood Supply Chain System by the Taguchi Method. Int. J. Innov. Comput. Inf. Control. 2012, 8, 7697–7712. [Google Scholar]
- Behroozi, F.; Monfared, M.A.S.; Hosseini, S.M.H. Investigating the Conflicts between Different Stakeholders’ Preferences in a Blood Supply Chain at Emergencies: A Trade-off between Six Objectives. Soft Comput. 2021, 25, 13389–13410. [Google Scholar] [CrossRef]
Figure 1.
Main echelons of the blood supply chain.

Figure 2.
Mixed review methodology.
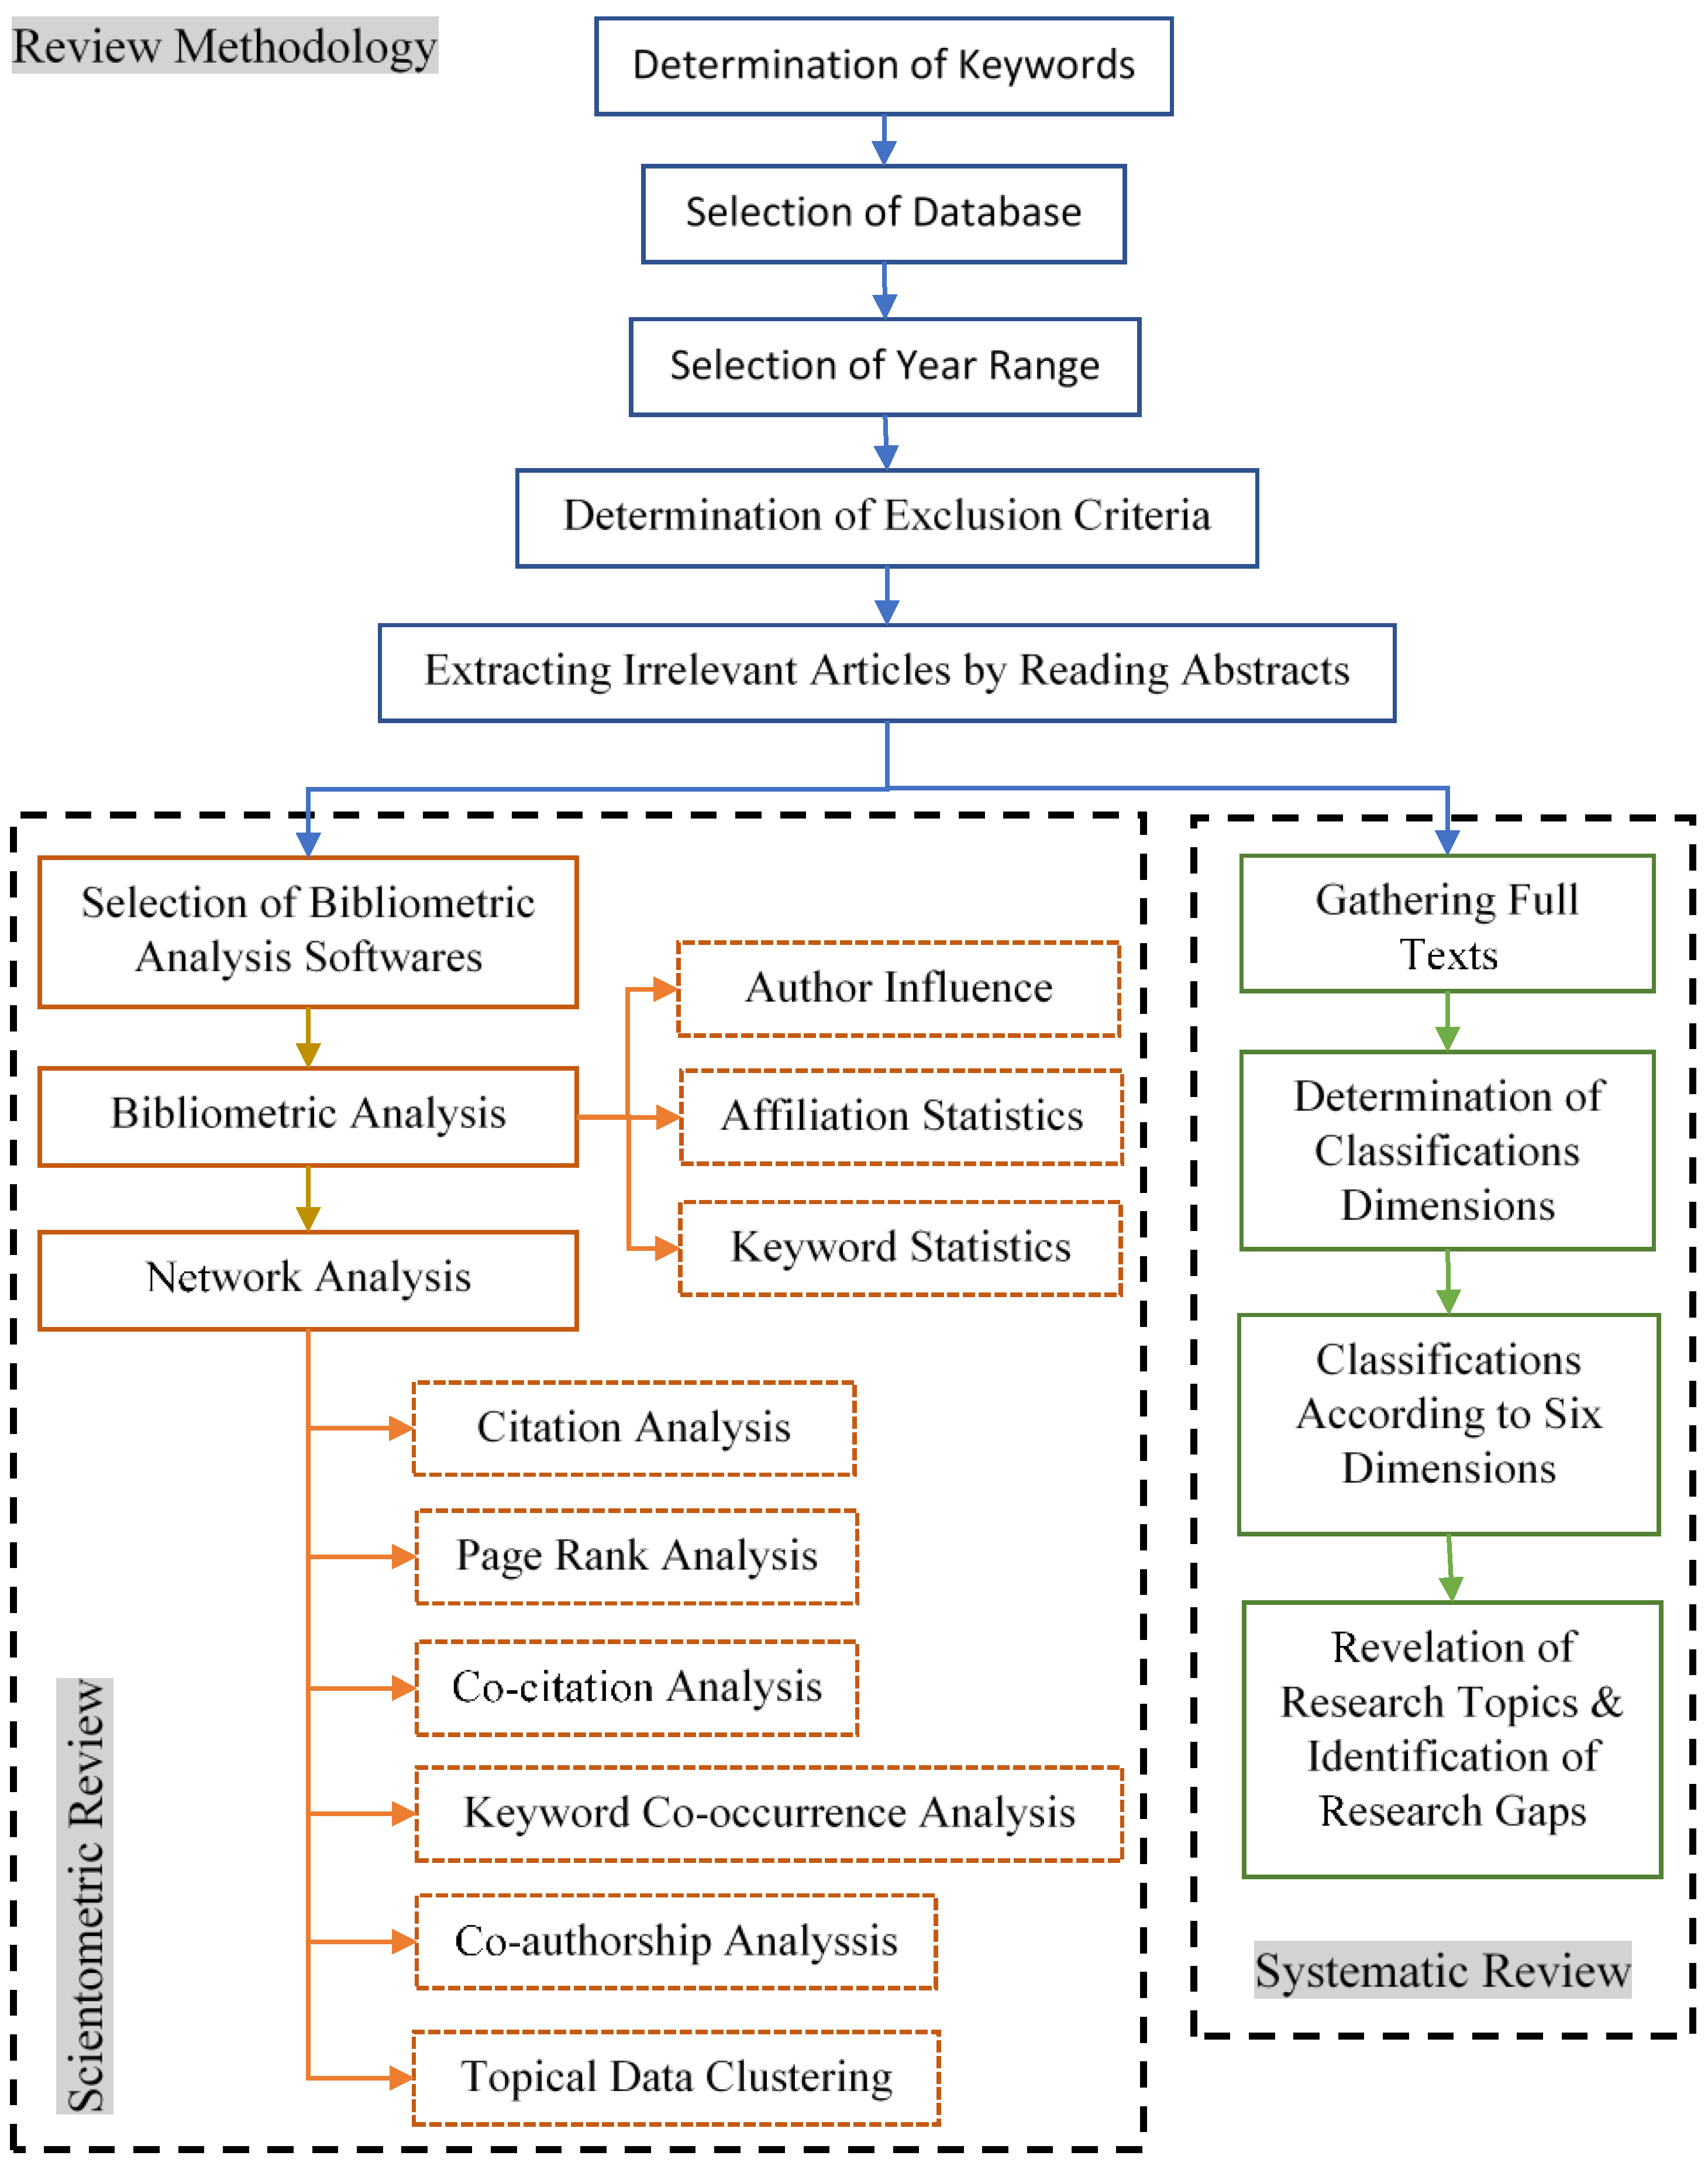
Figure 3.
Systematic literature searching process.
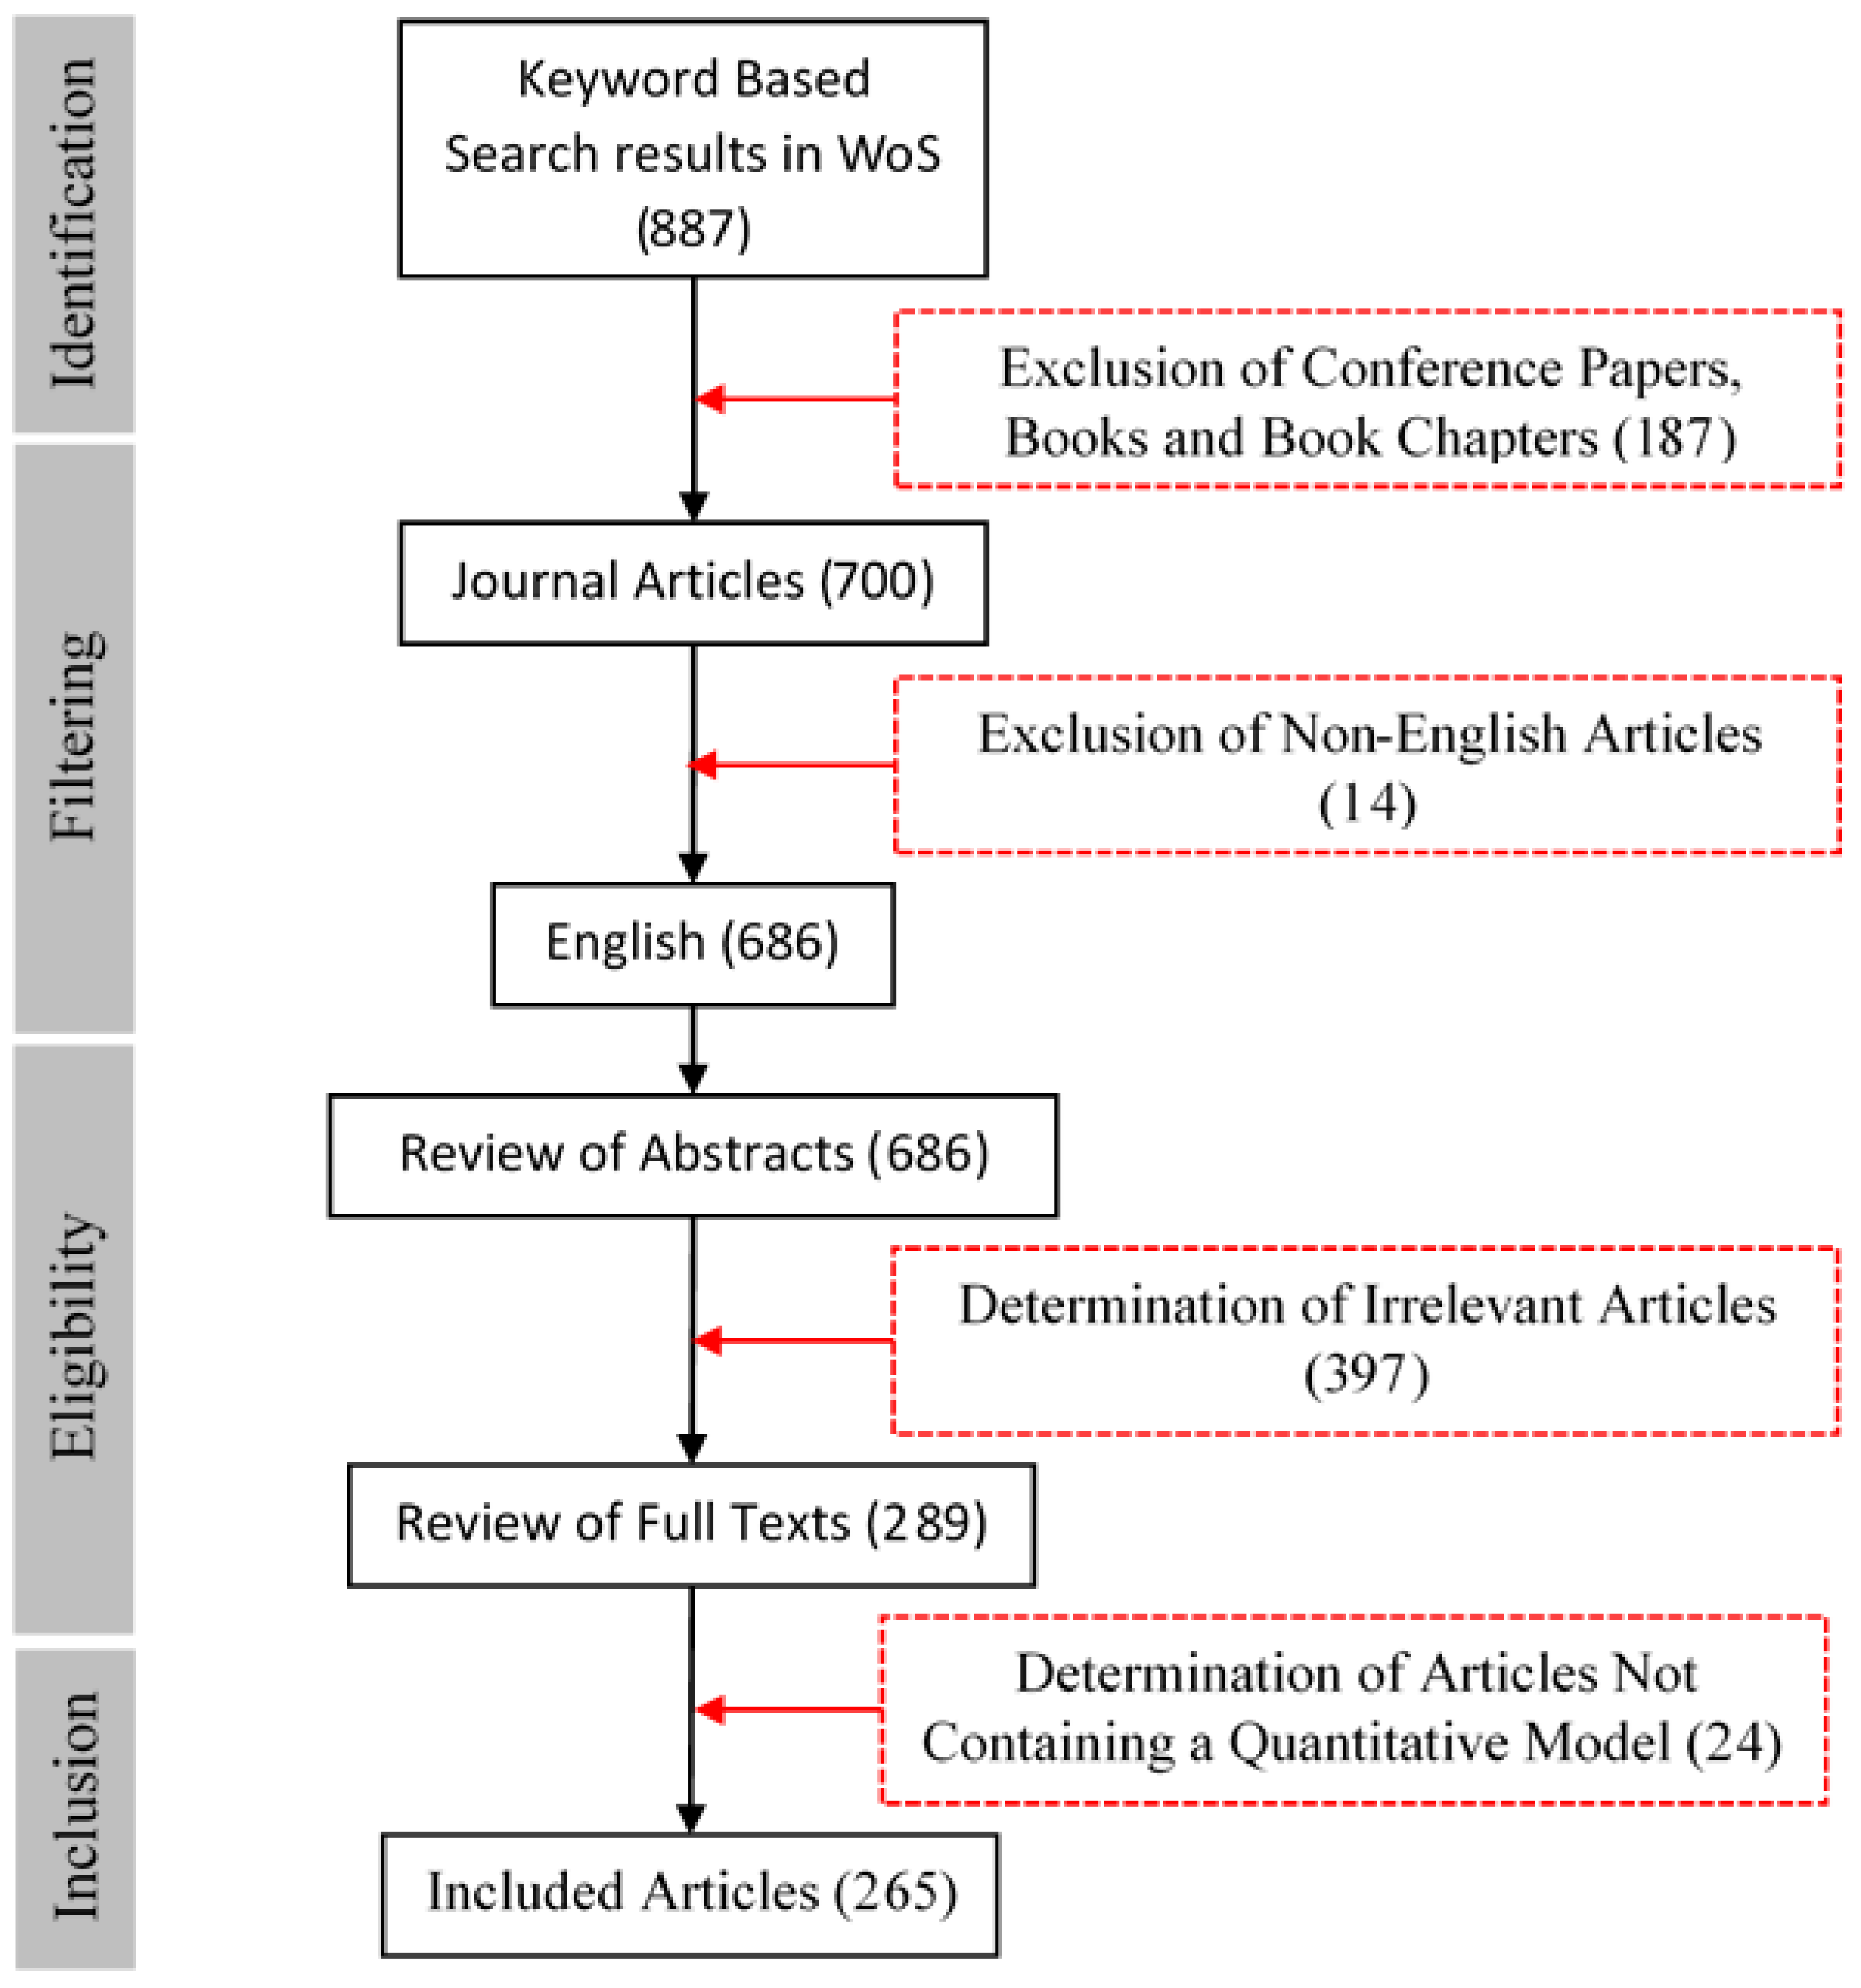
Figure 4.
Publication trend.
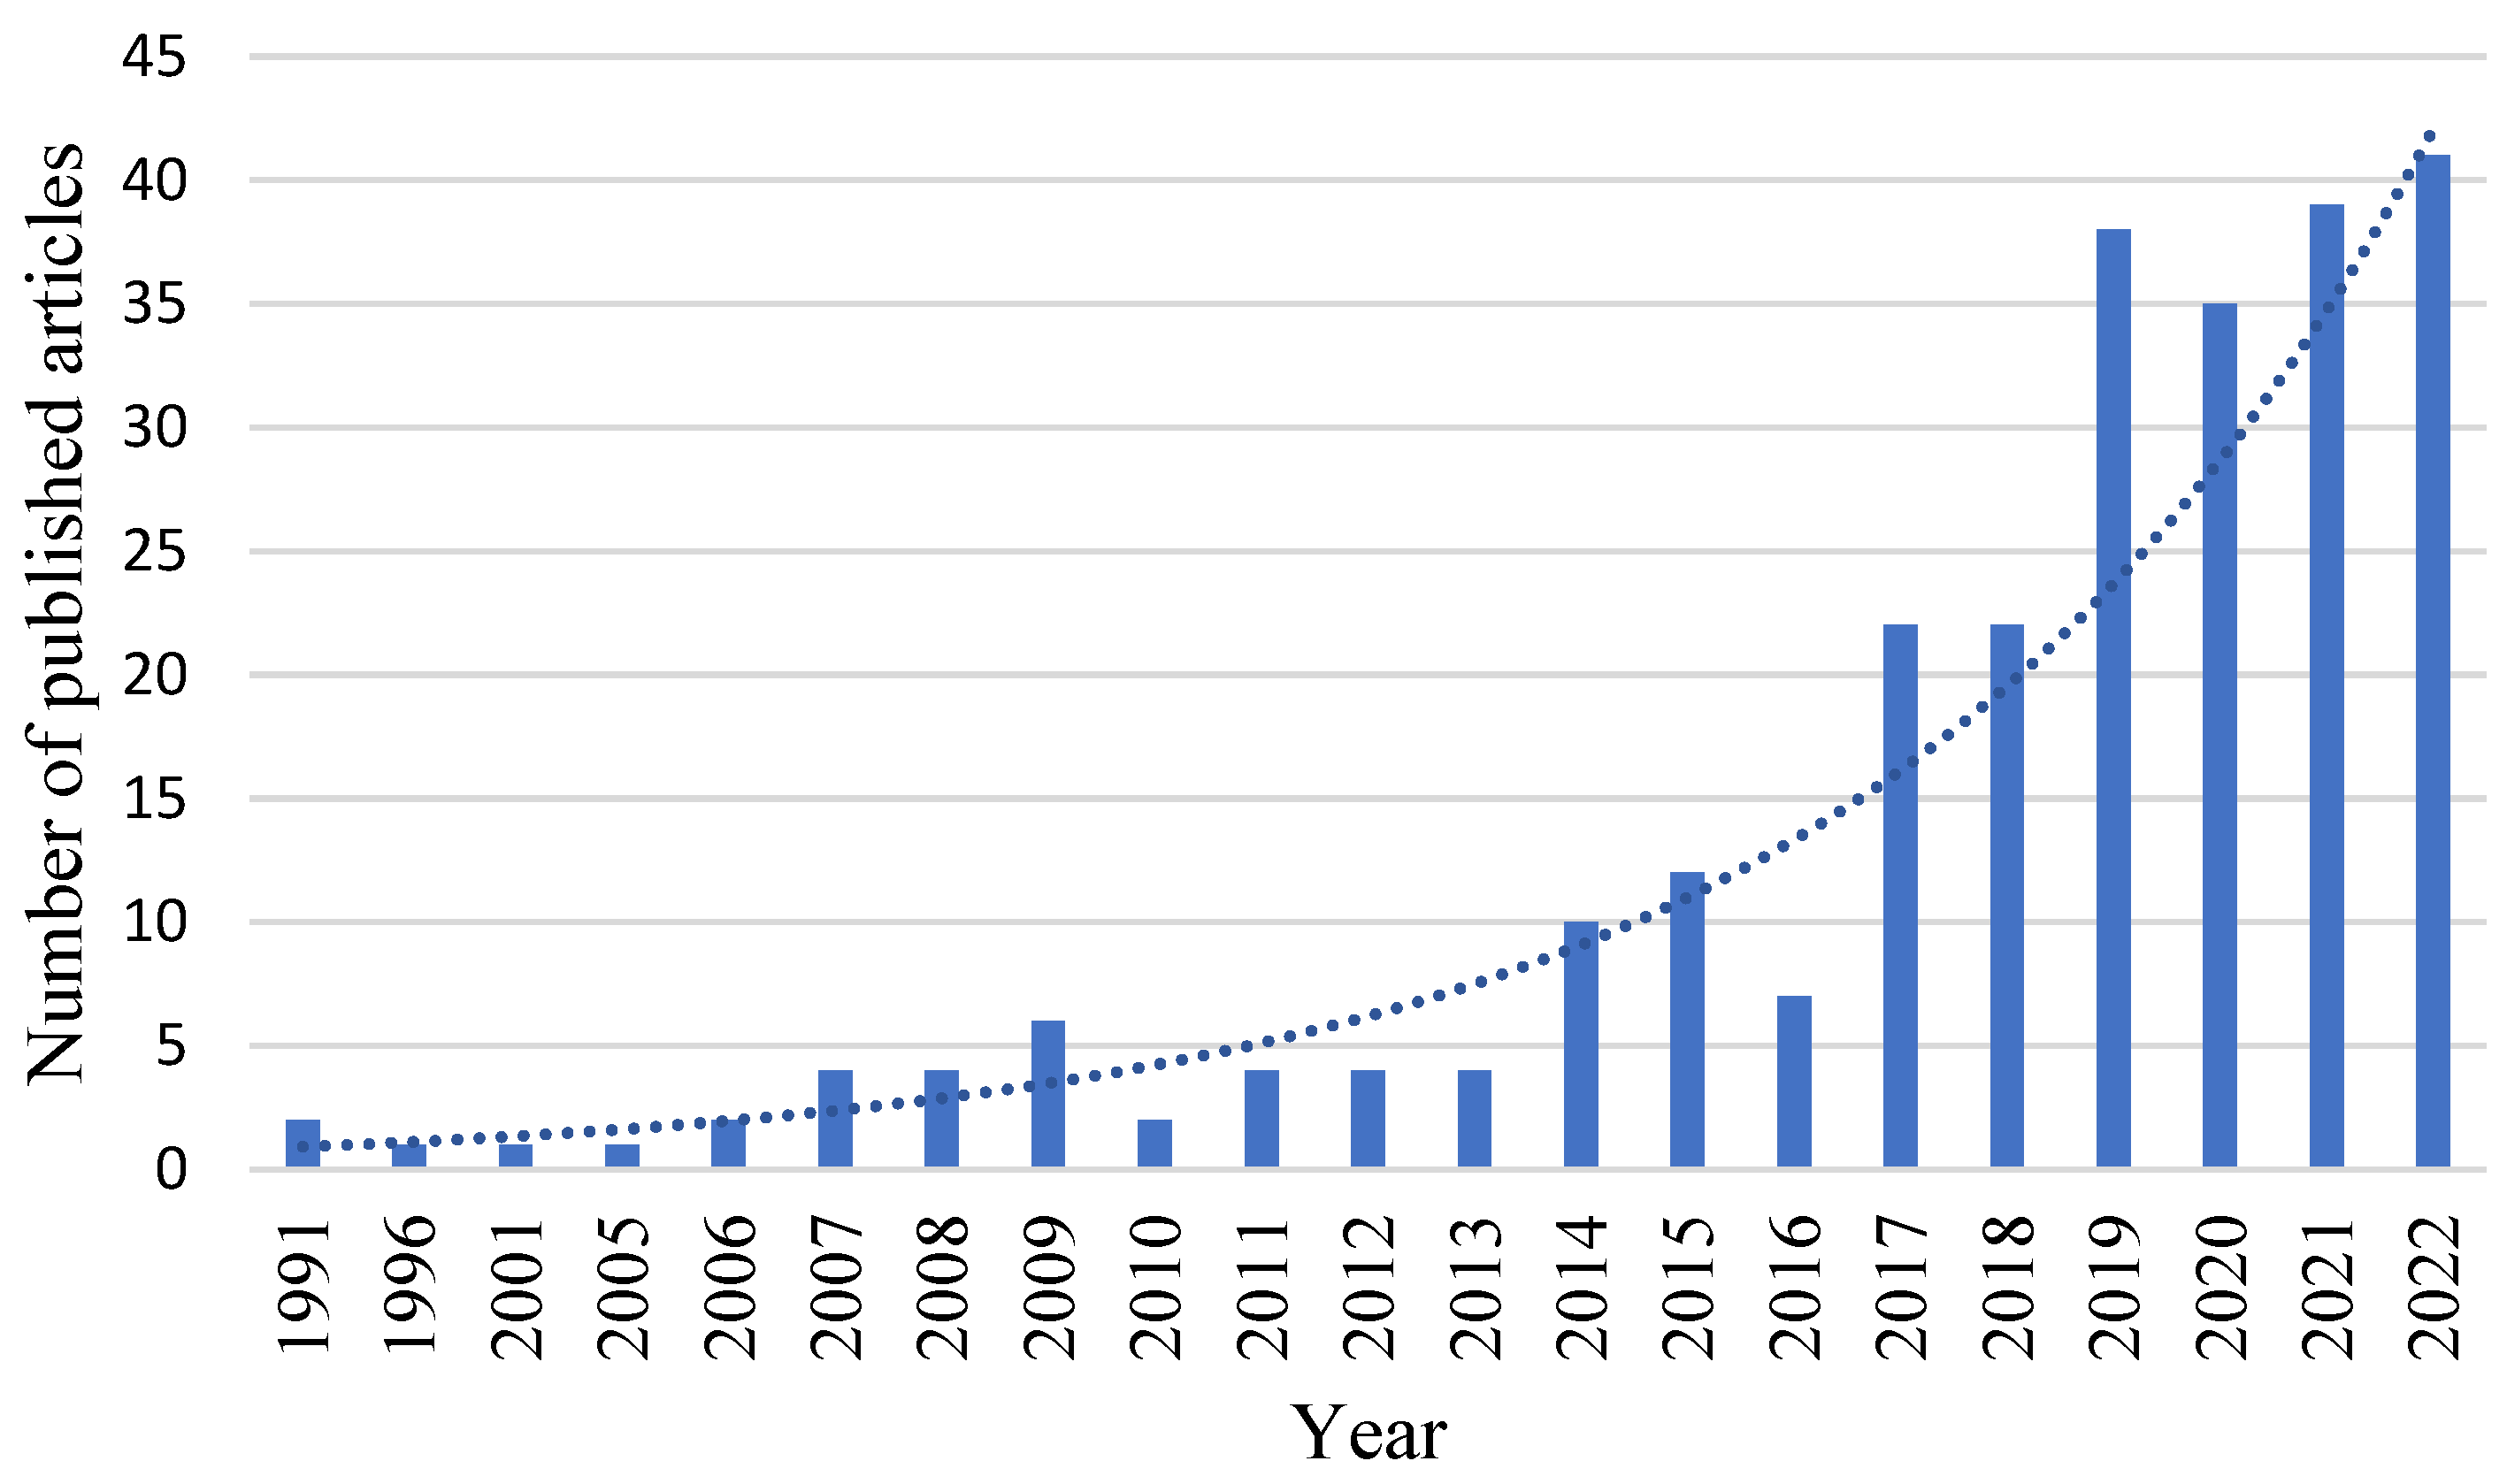
Figure 5.
(a) Force Atlas layout of 300 articles according to co-citation; (b) zoomed-in image of shaded area.
Figure 5.
(a) Force Atlas layout of 300 articles according to co-citation; (b) zoomed-in image of shaded area.

Figure 6.
Force Atlas layout of 23 most used keywords according to co-occurrence.

Figure 7.
Force Atlas layout of co-authorship network.
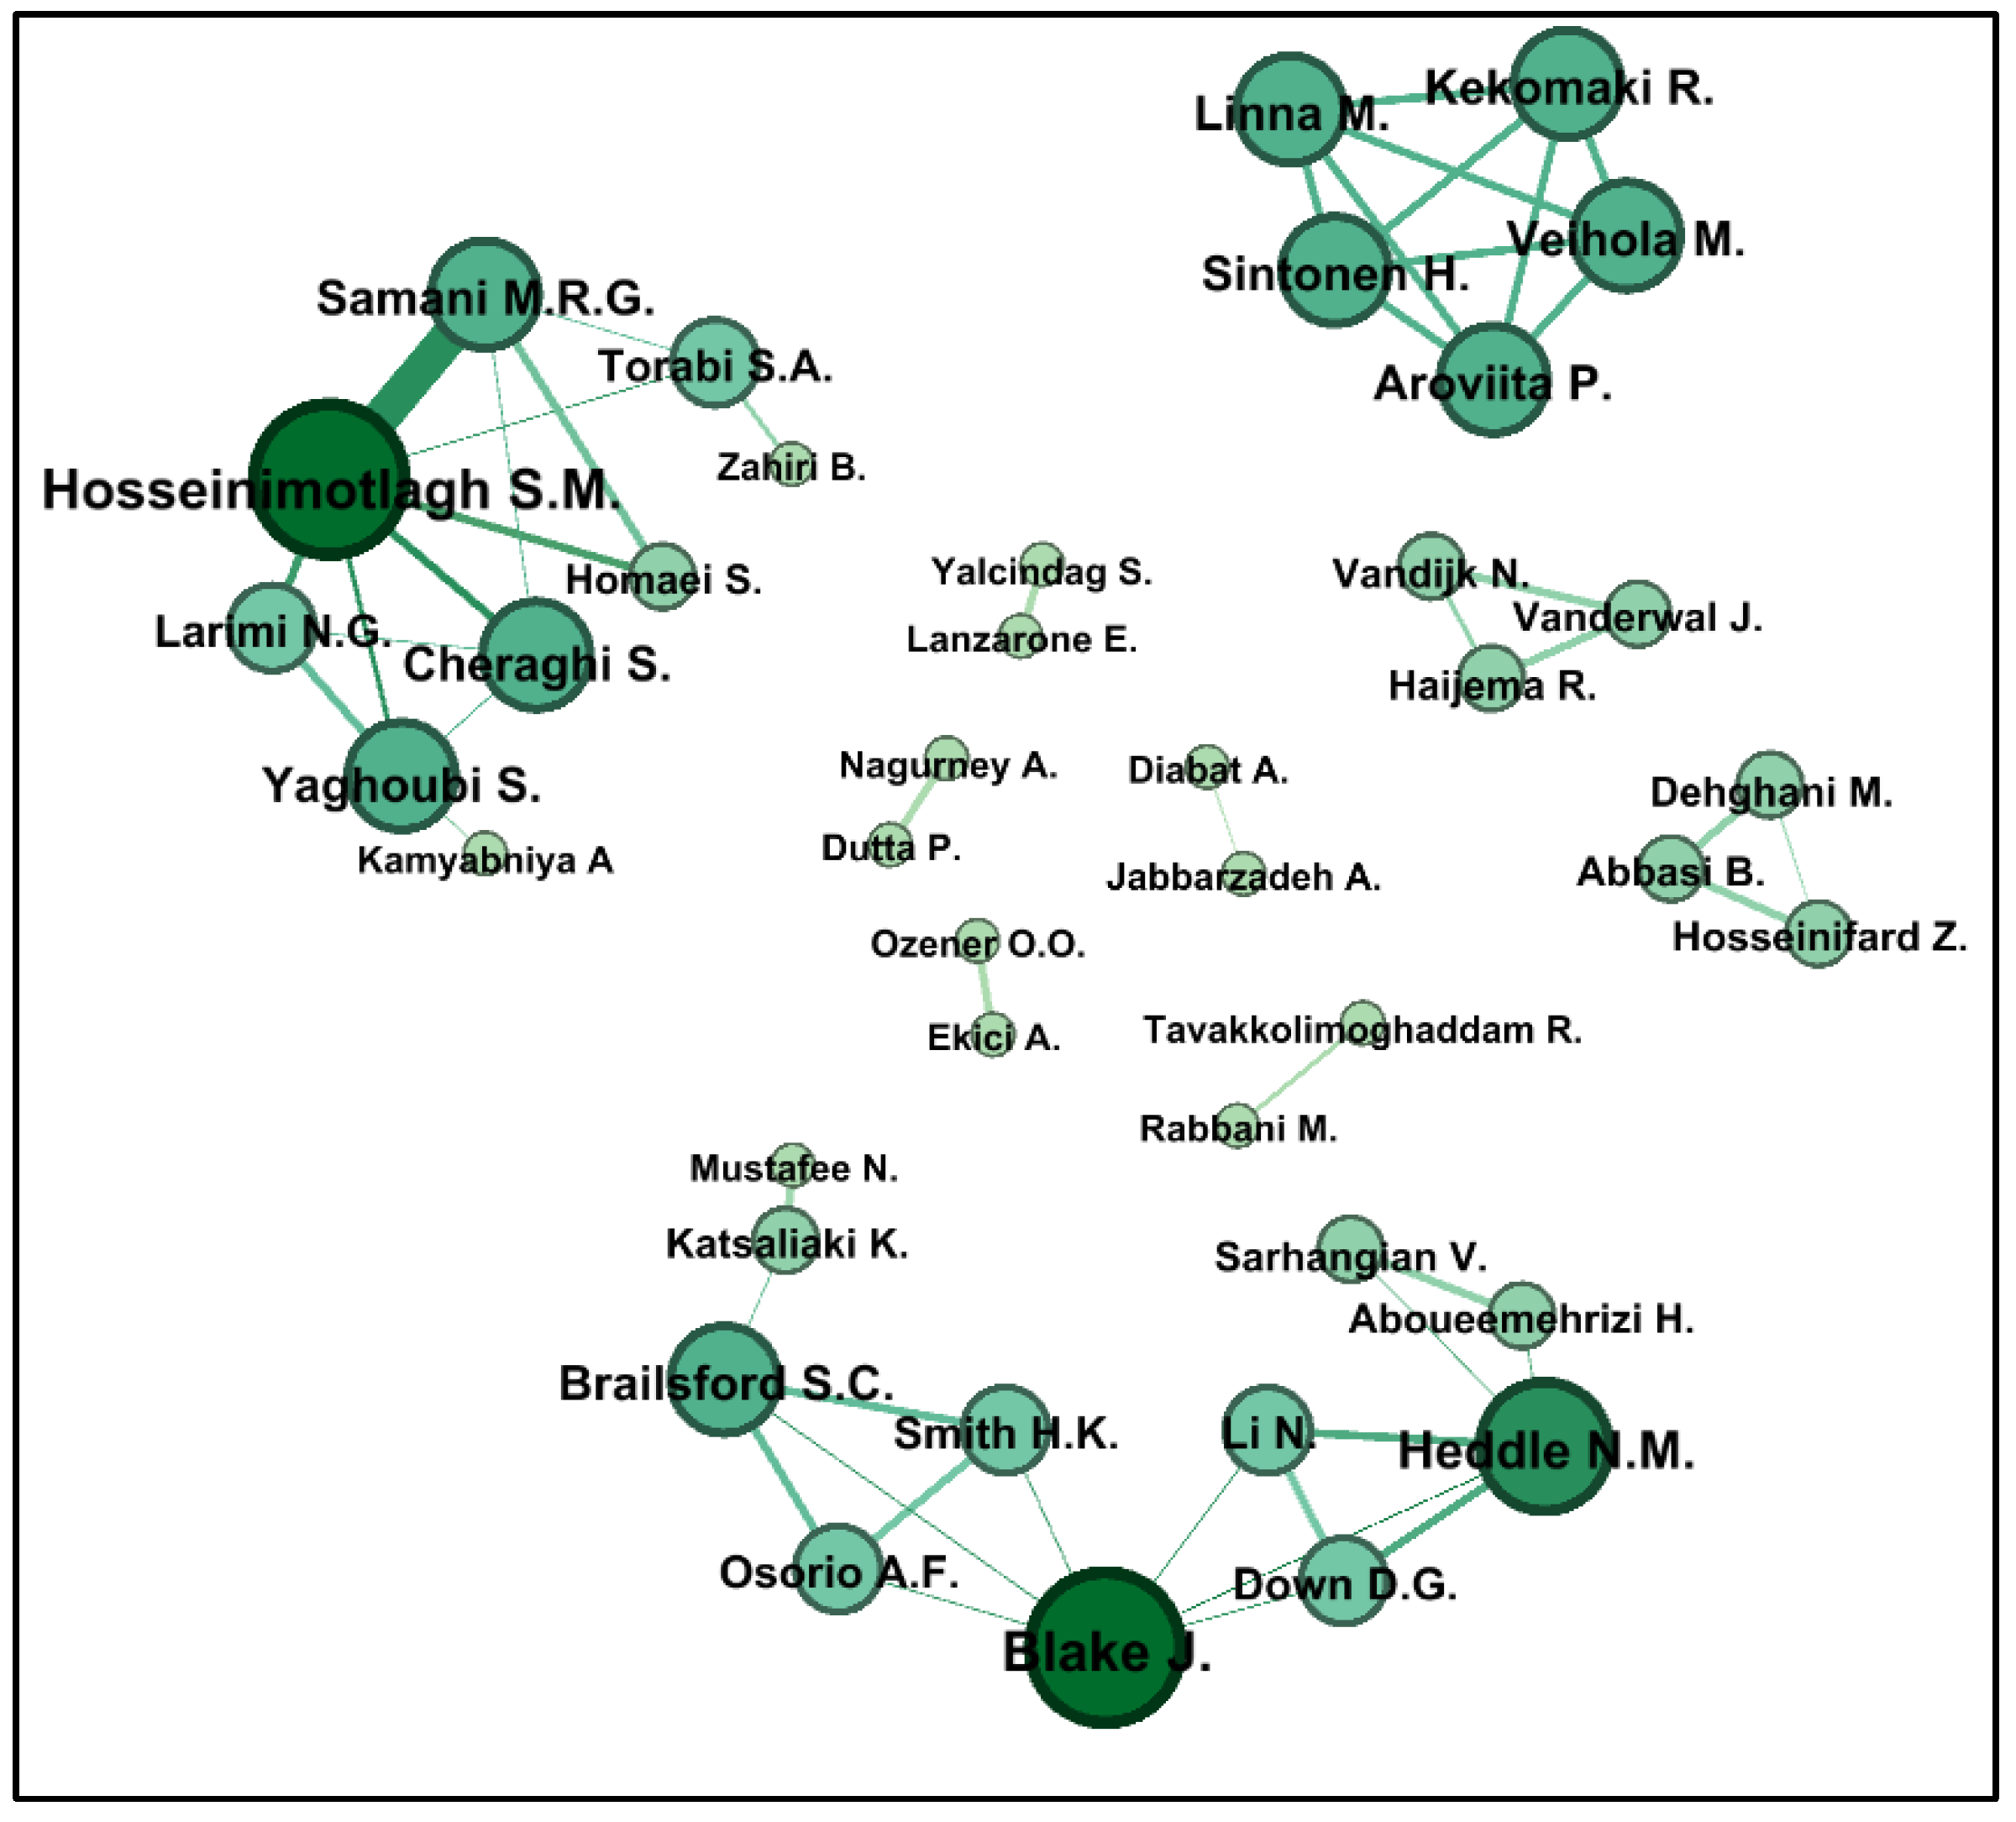
Figure 8.
Configuration of four clusters.
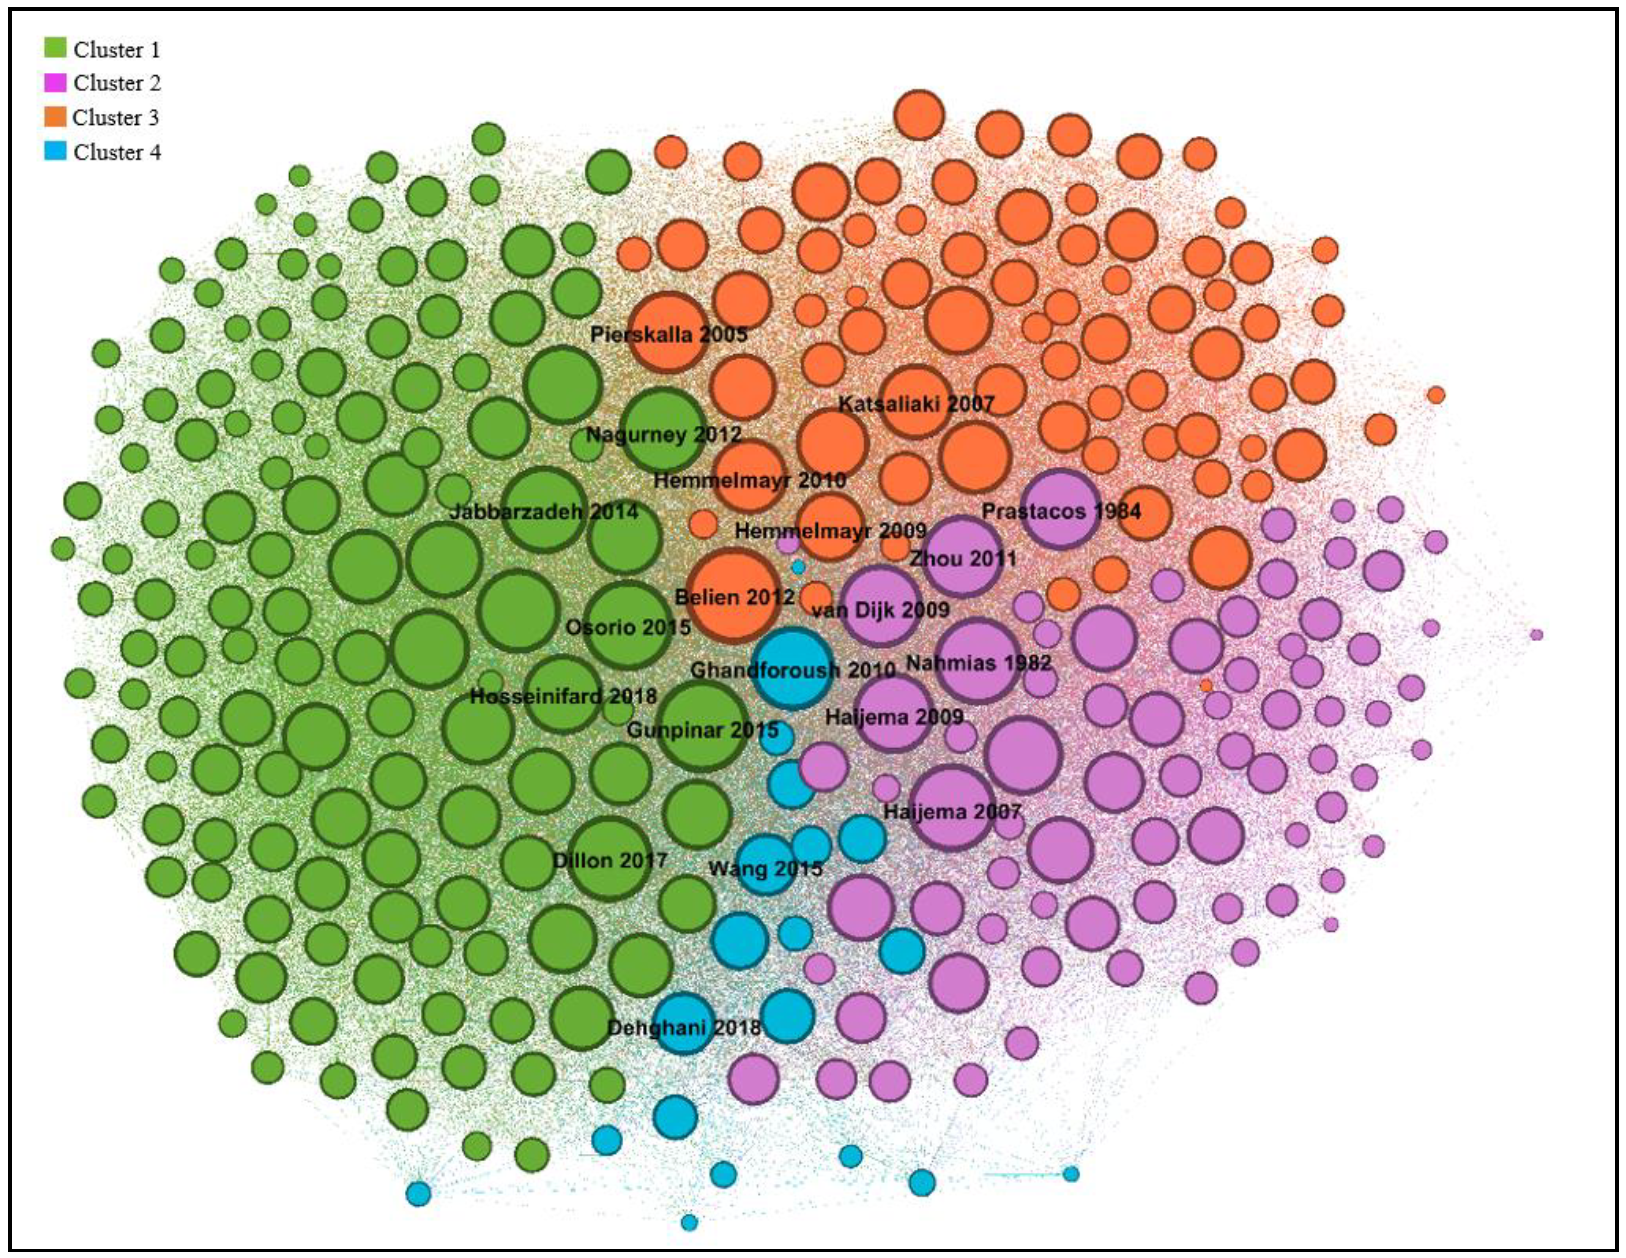
Figure 9.
Publication trend according to single or multi-stage.
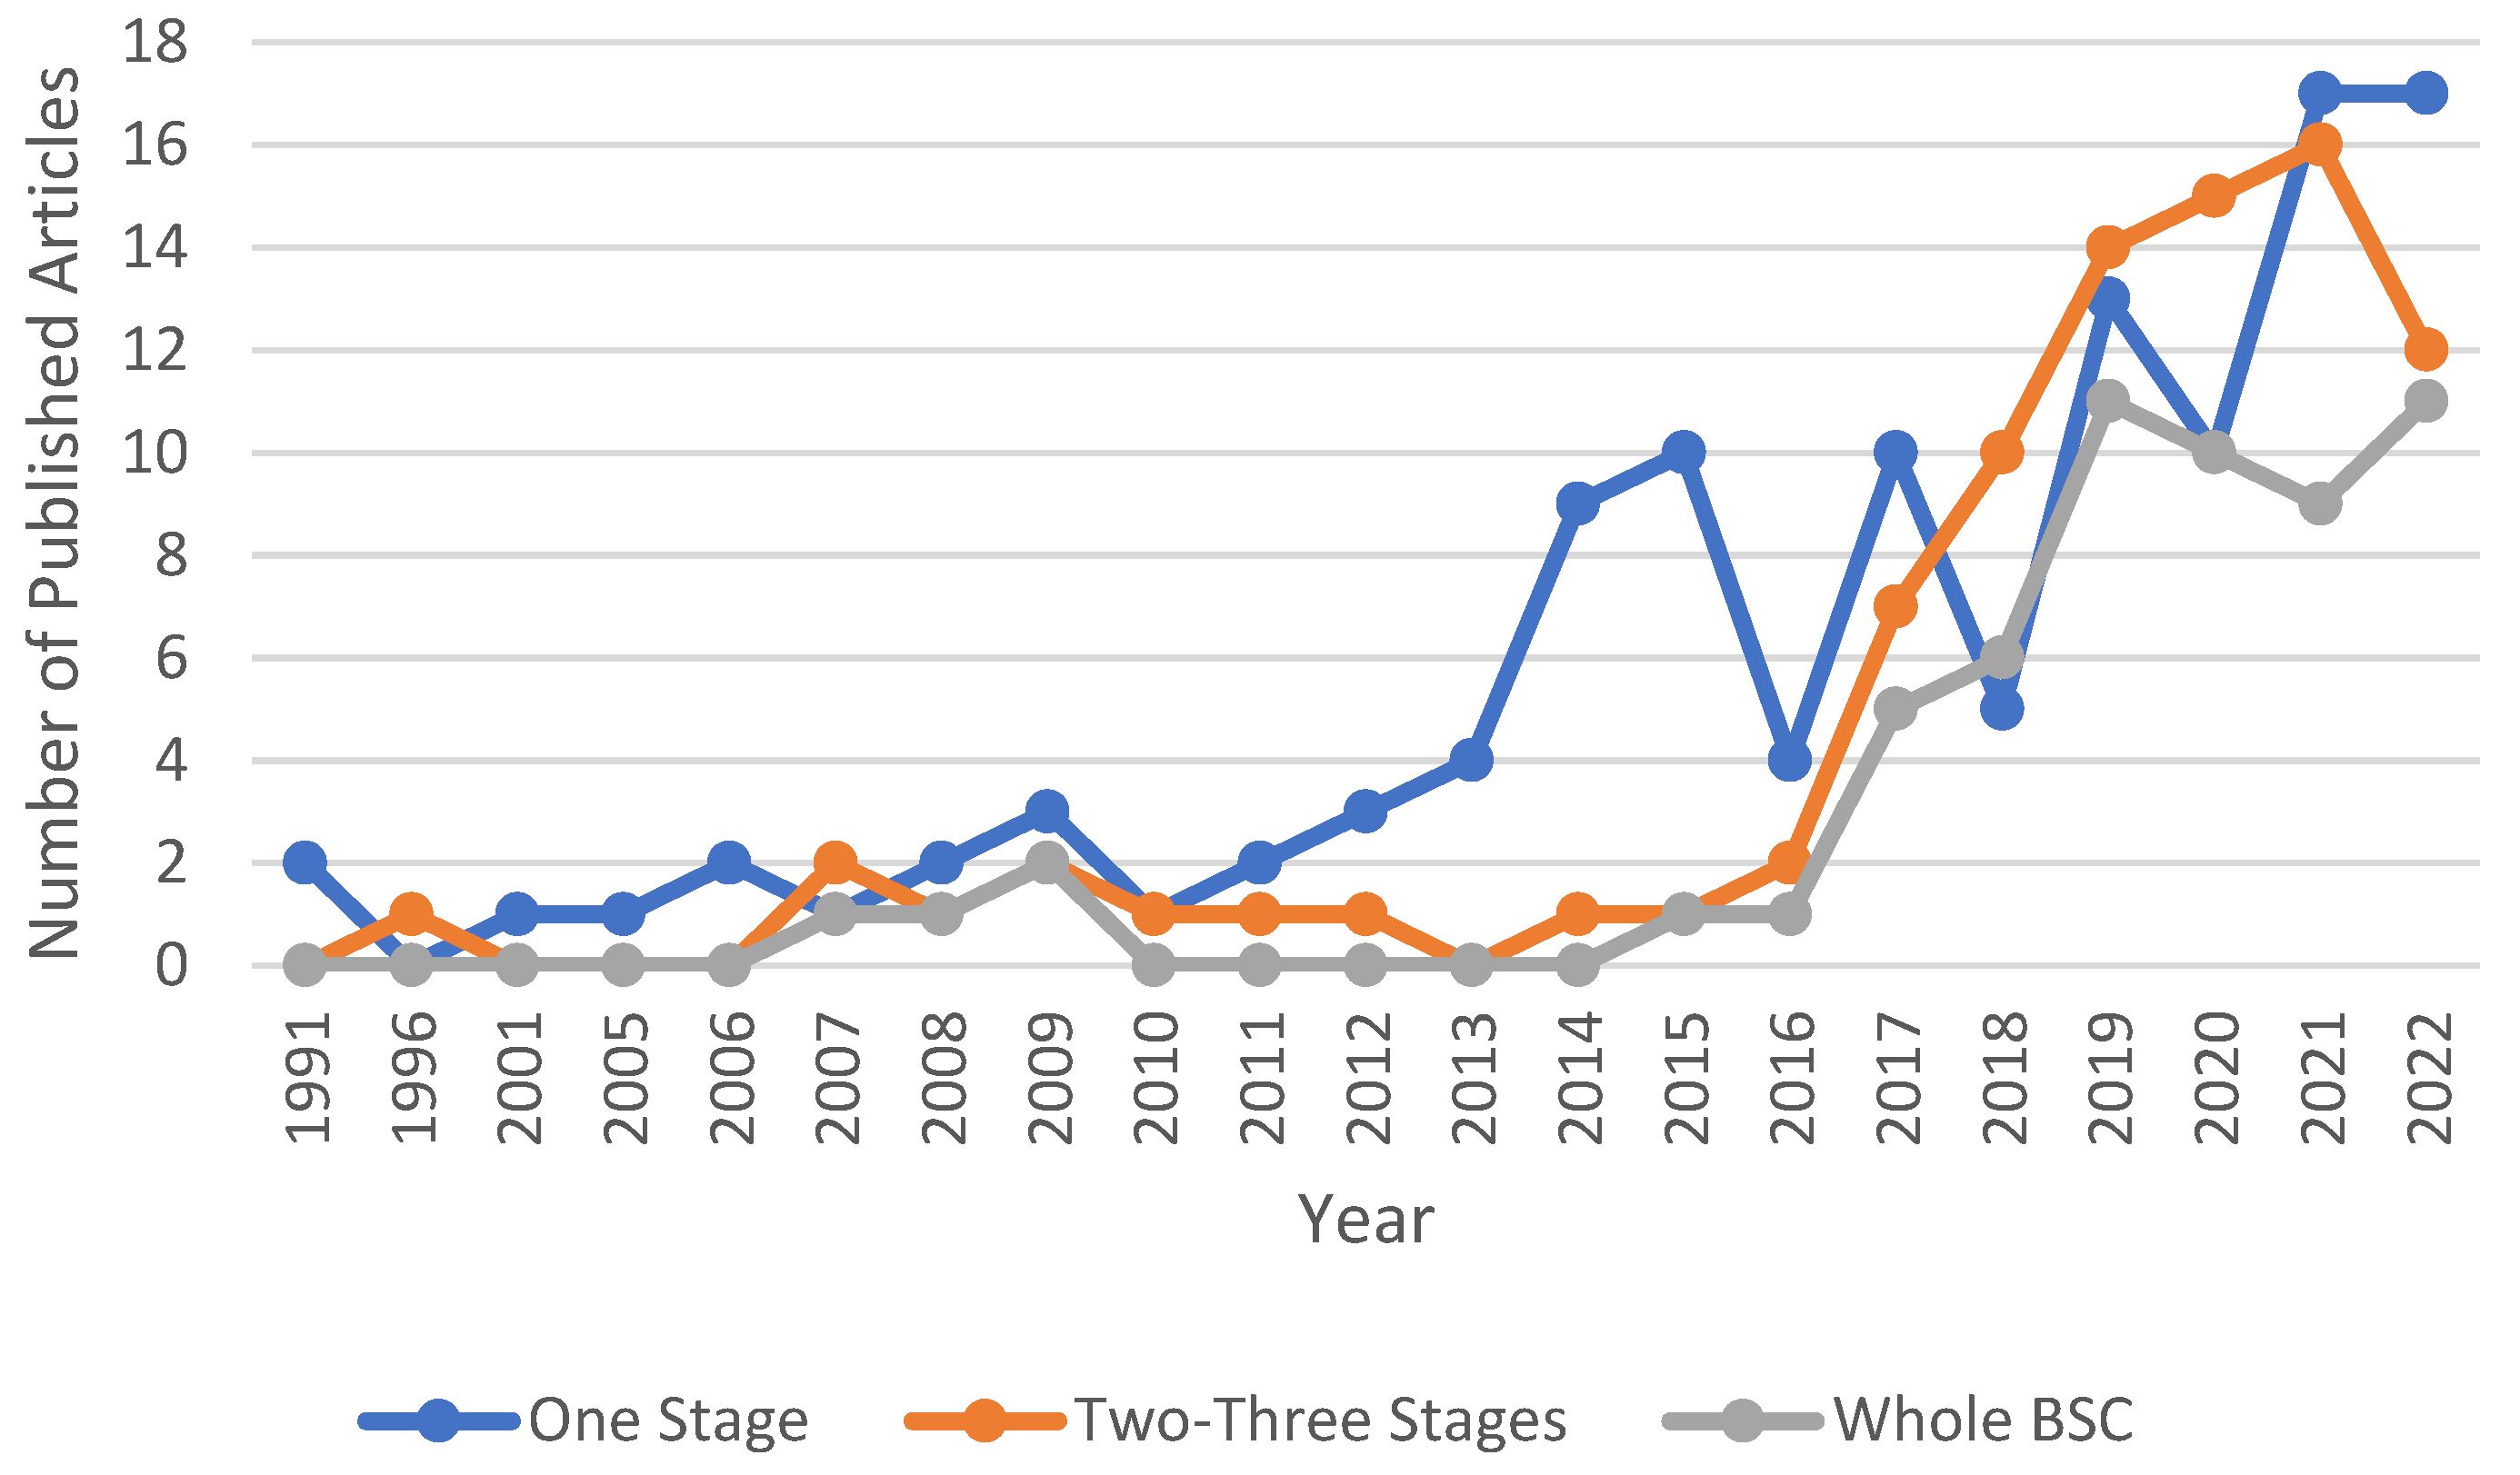
Figure 10.
Trends in Stage of BSC.

Figure 11.
Trends in Blood Product.

Figure 12.
Trends in Solution Methods.

Figure 13.
Trends in Nature of Parameters.
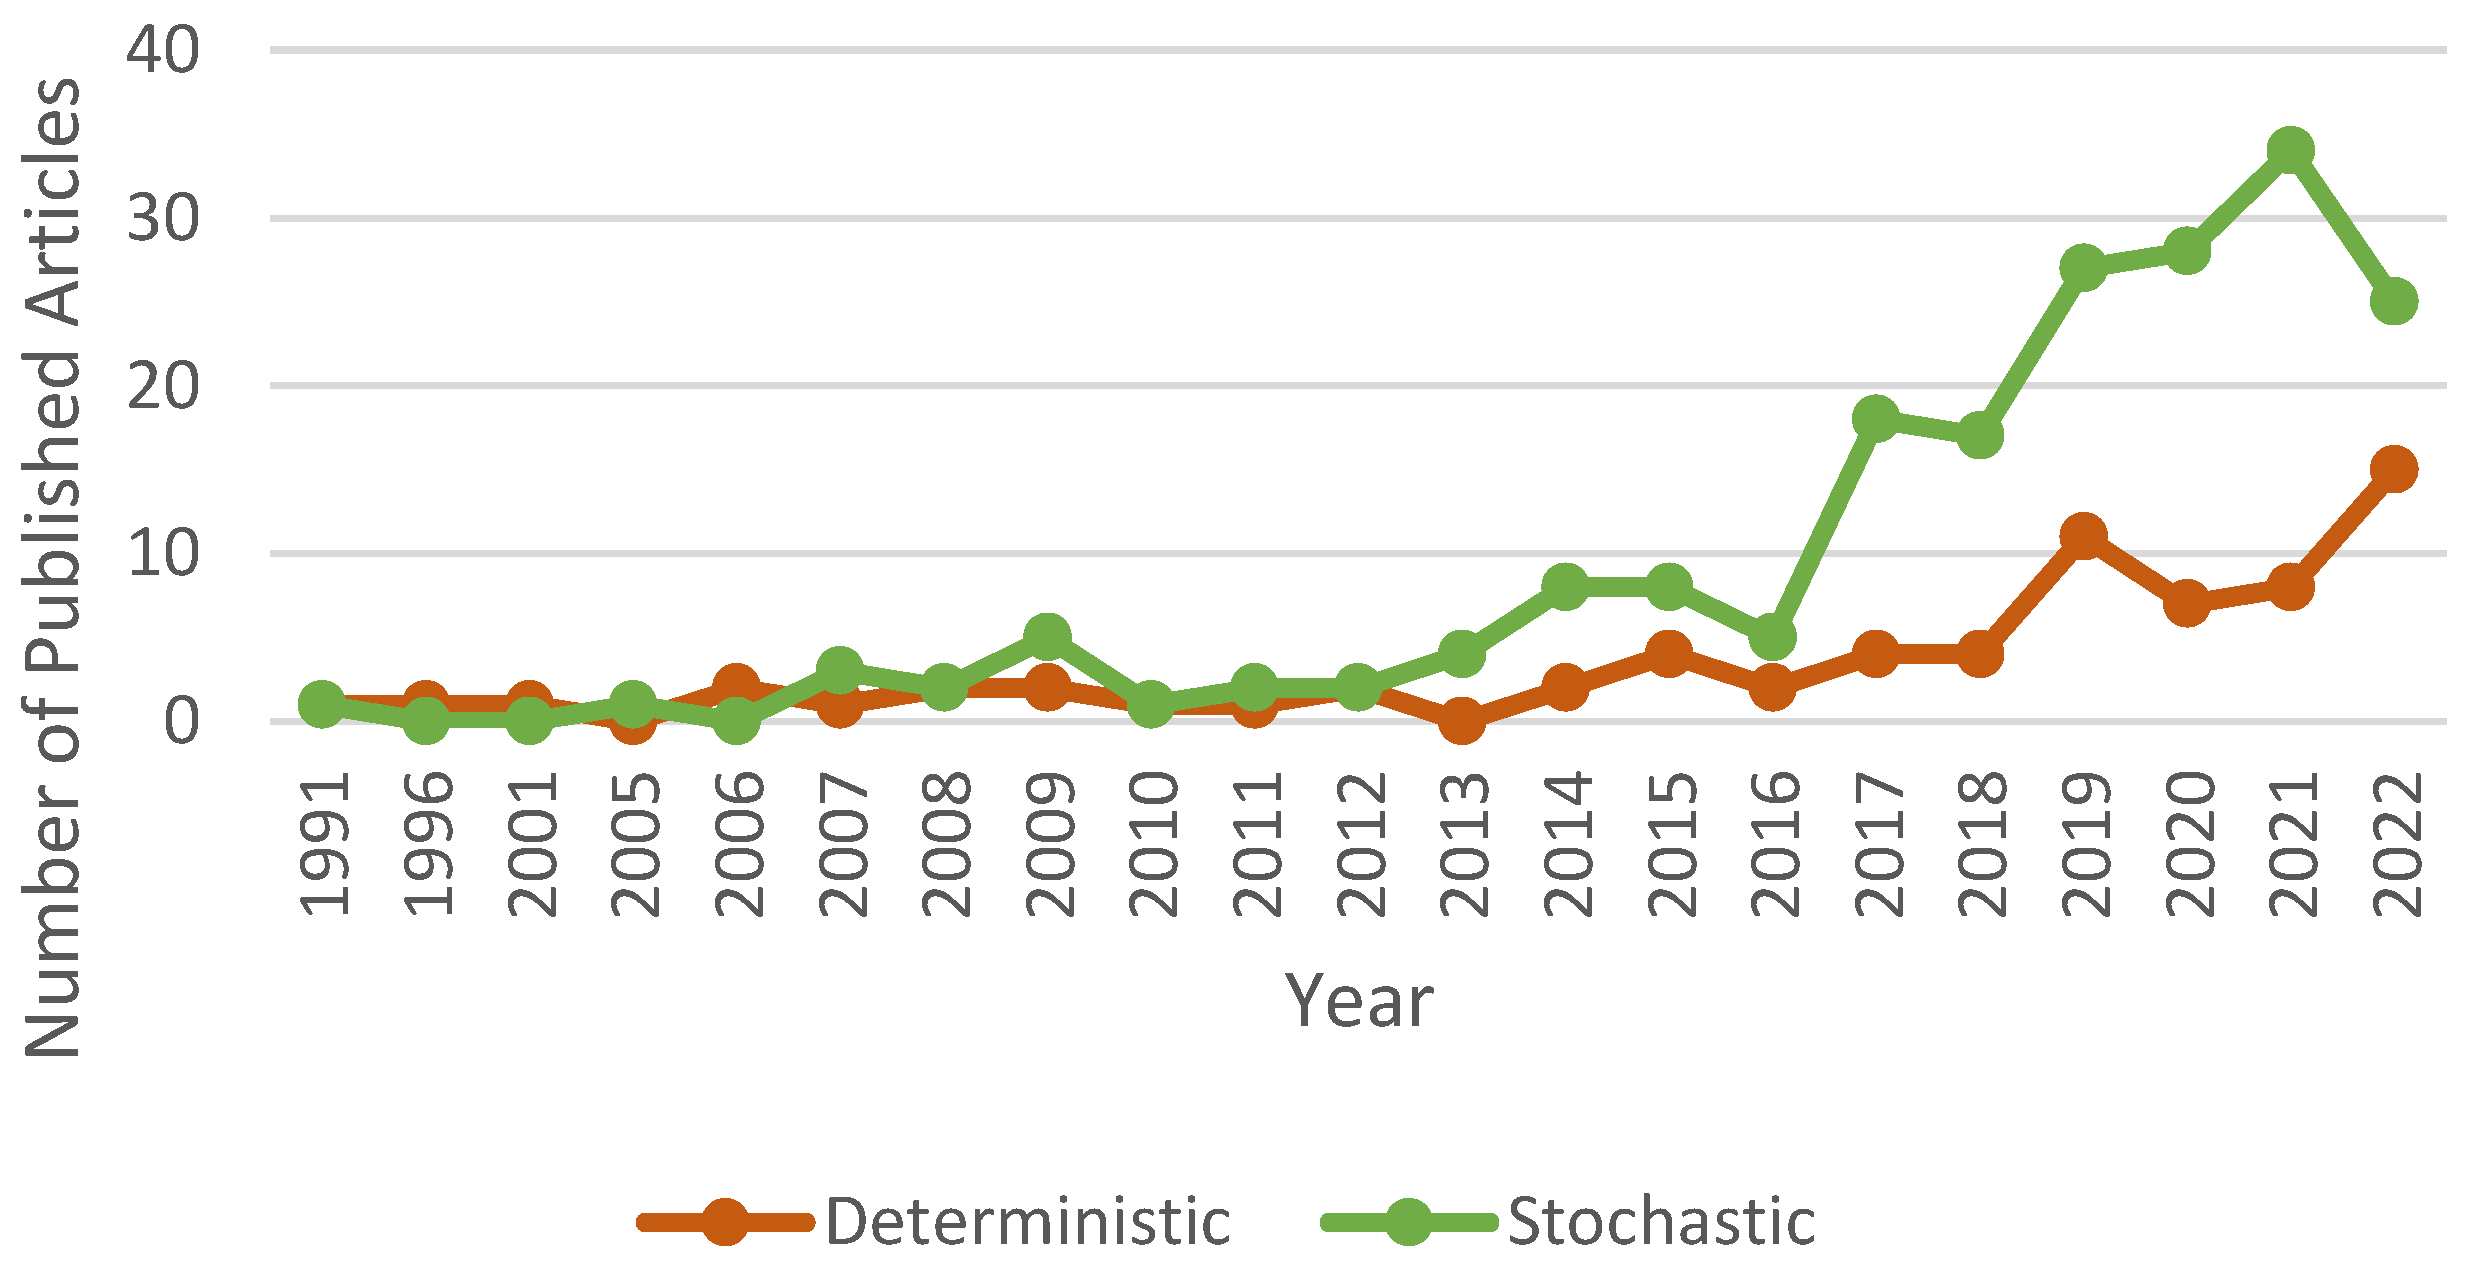
Figure 14.
Trends in Solution Approach.
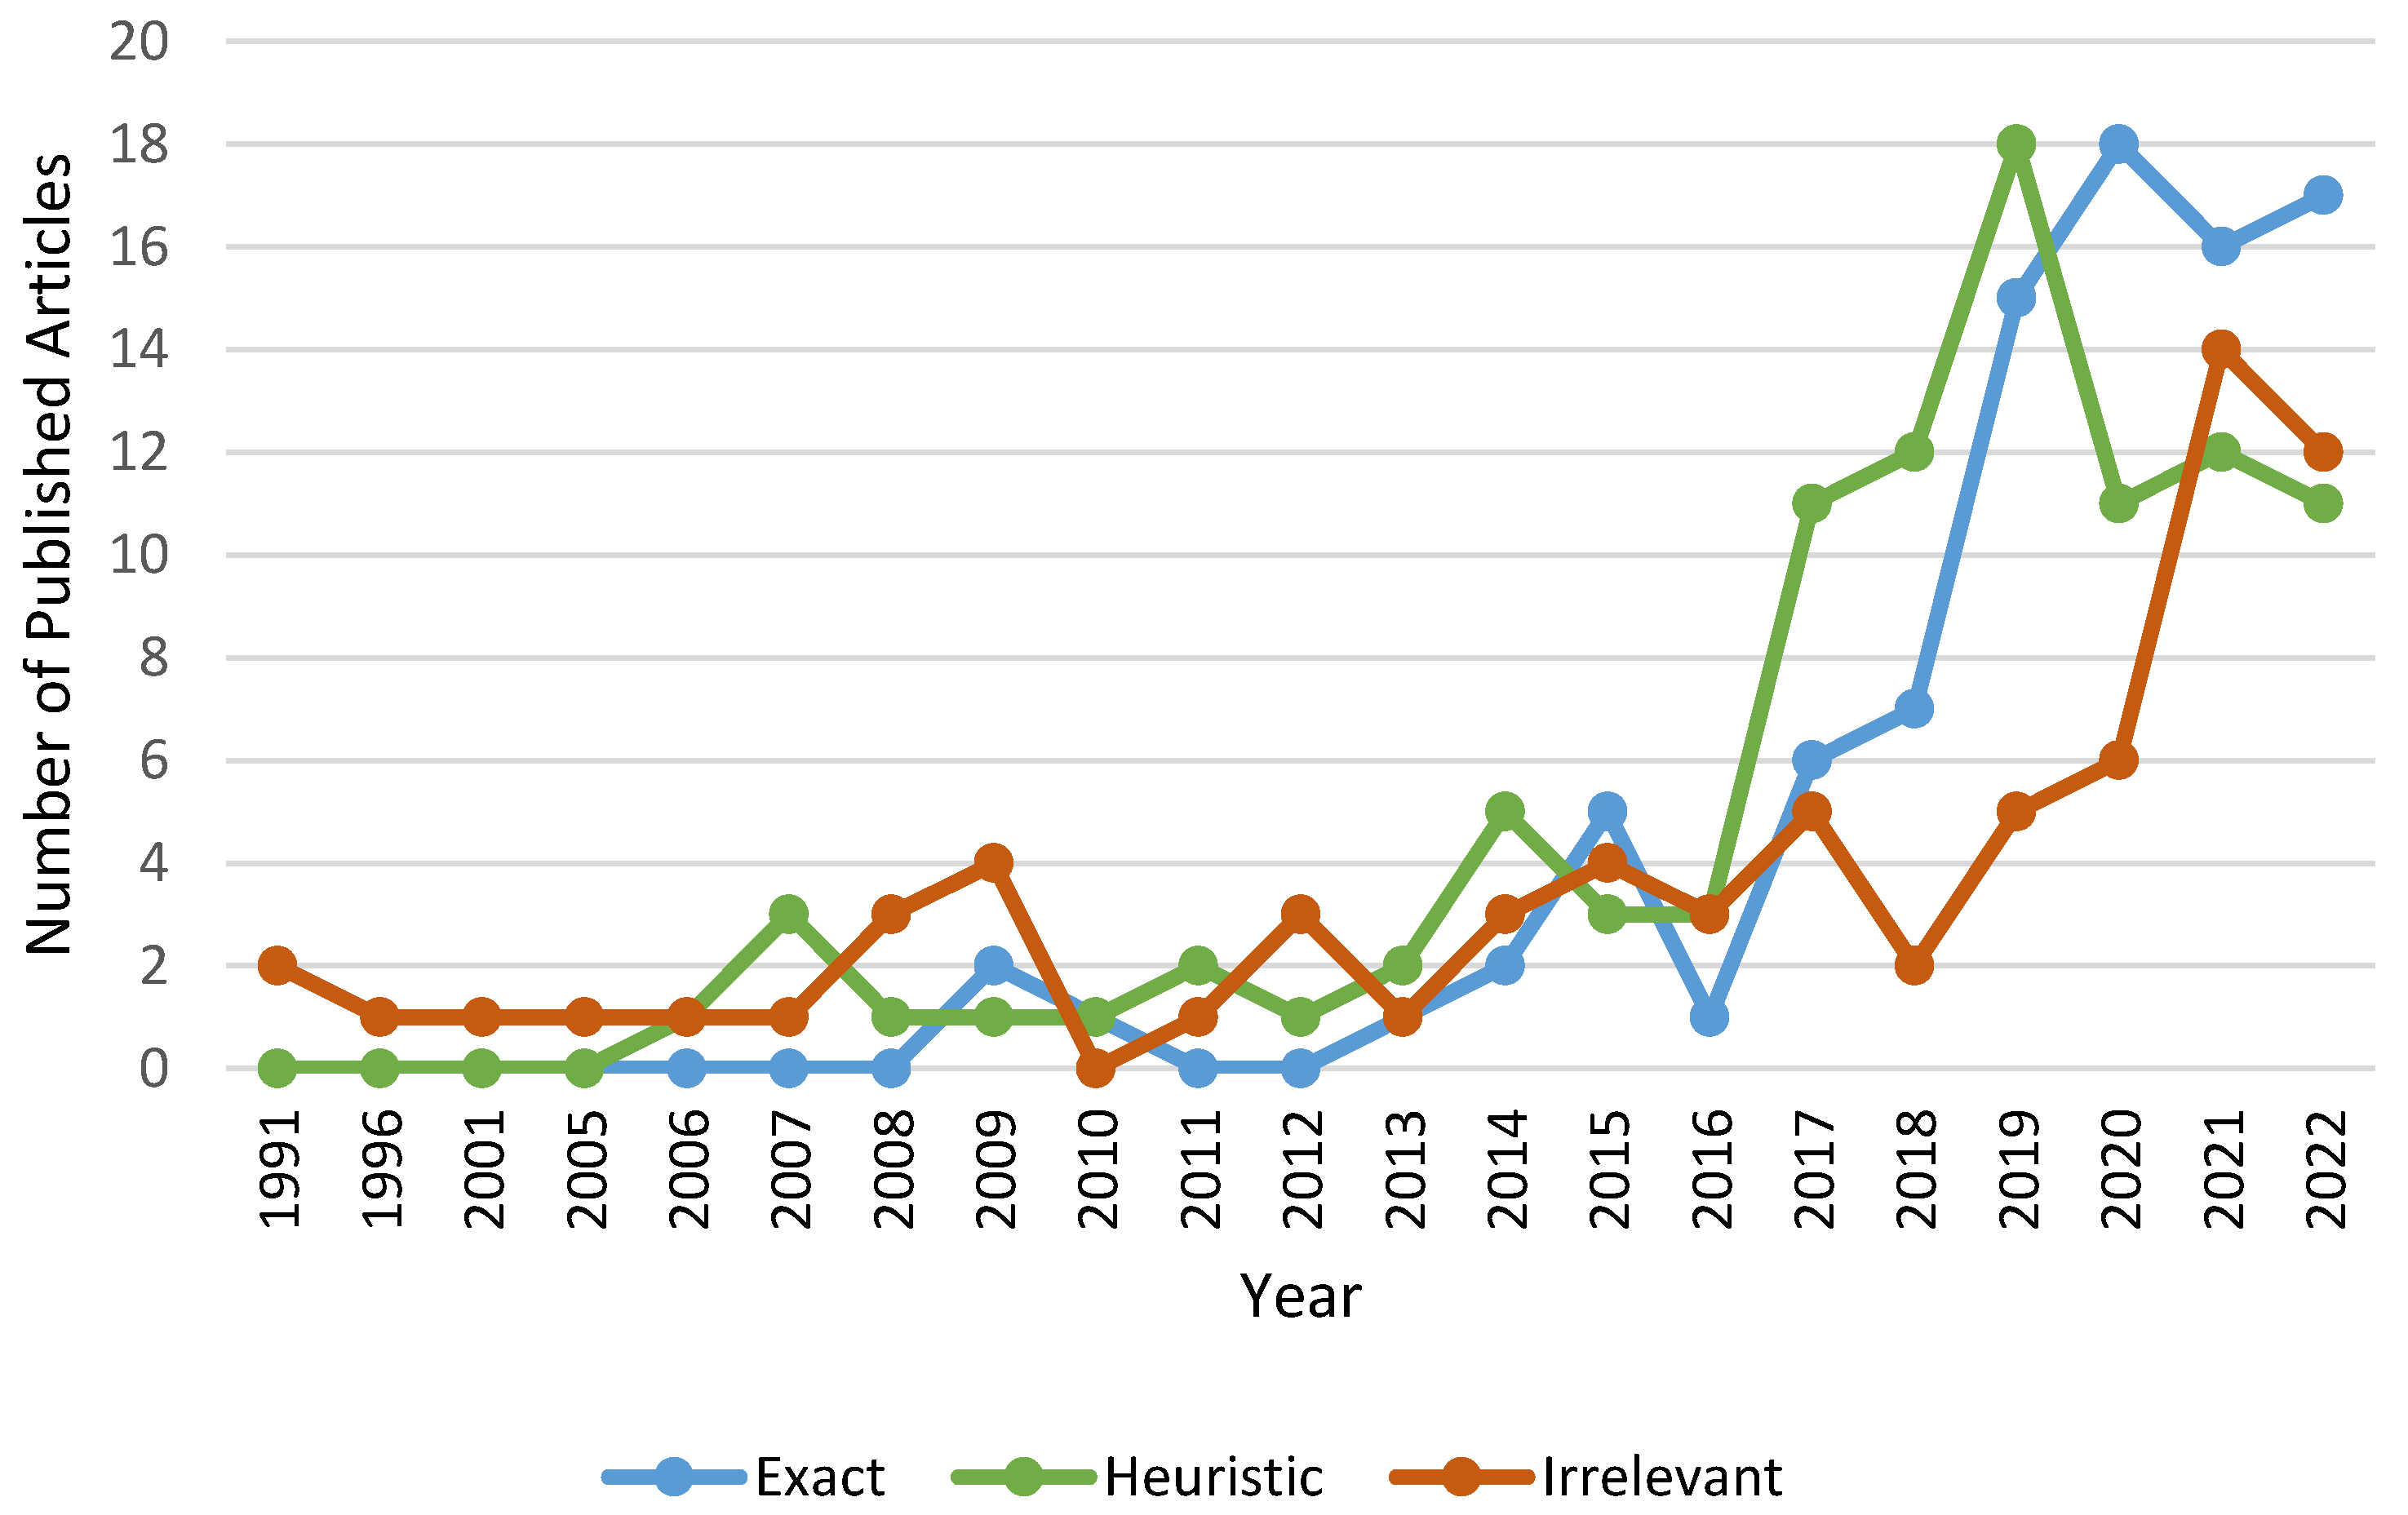
Figure 15.
Trends in Focused Circumstances.
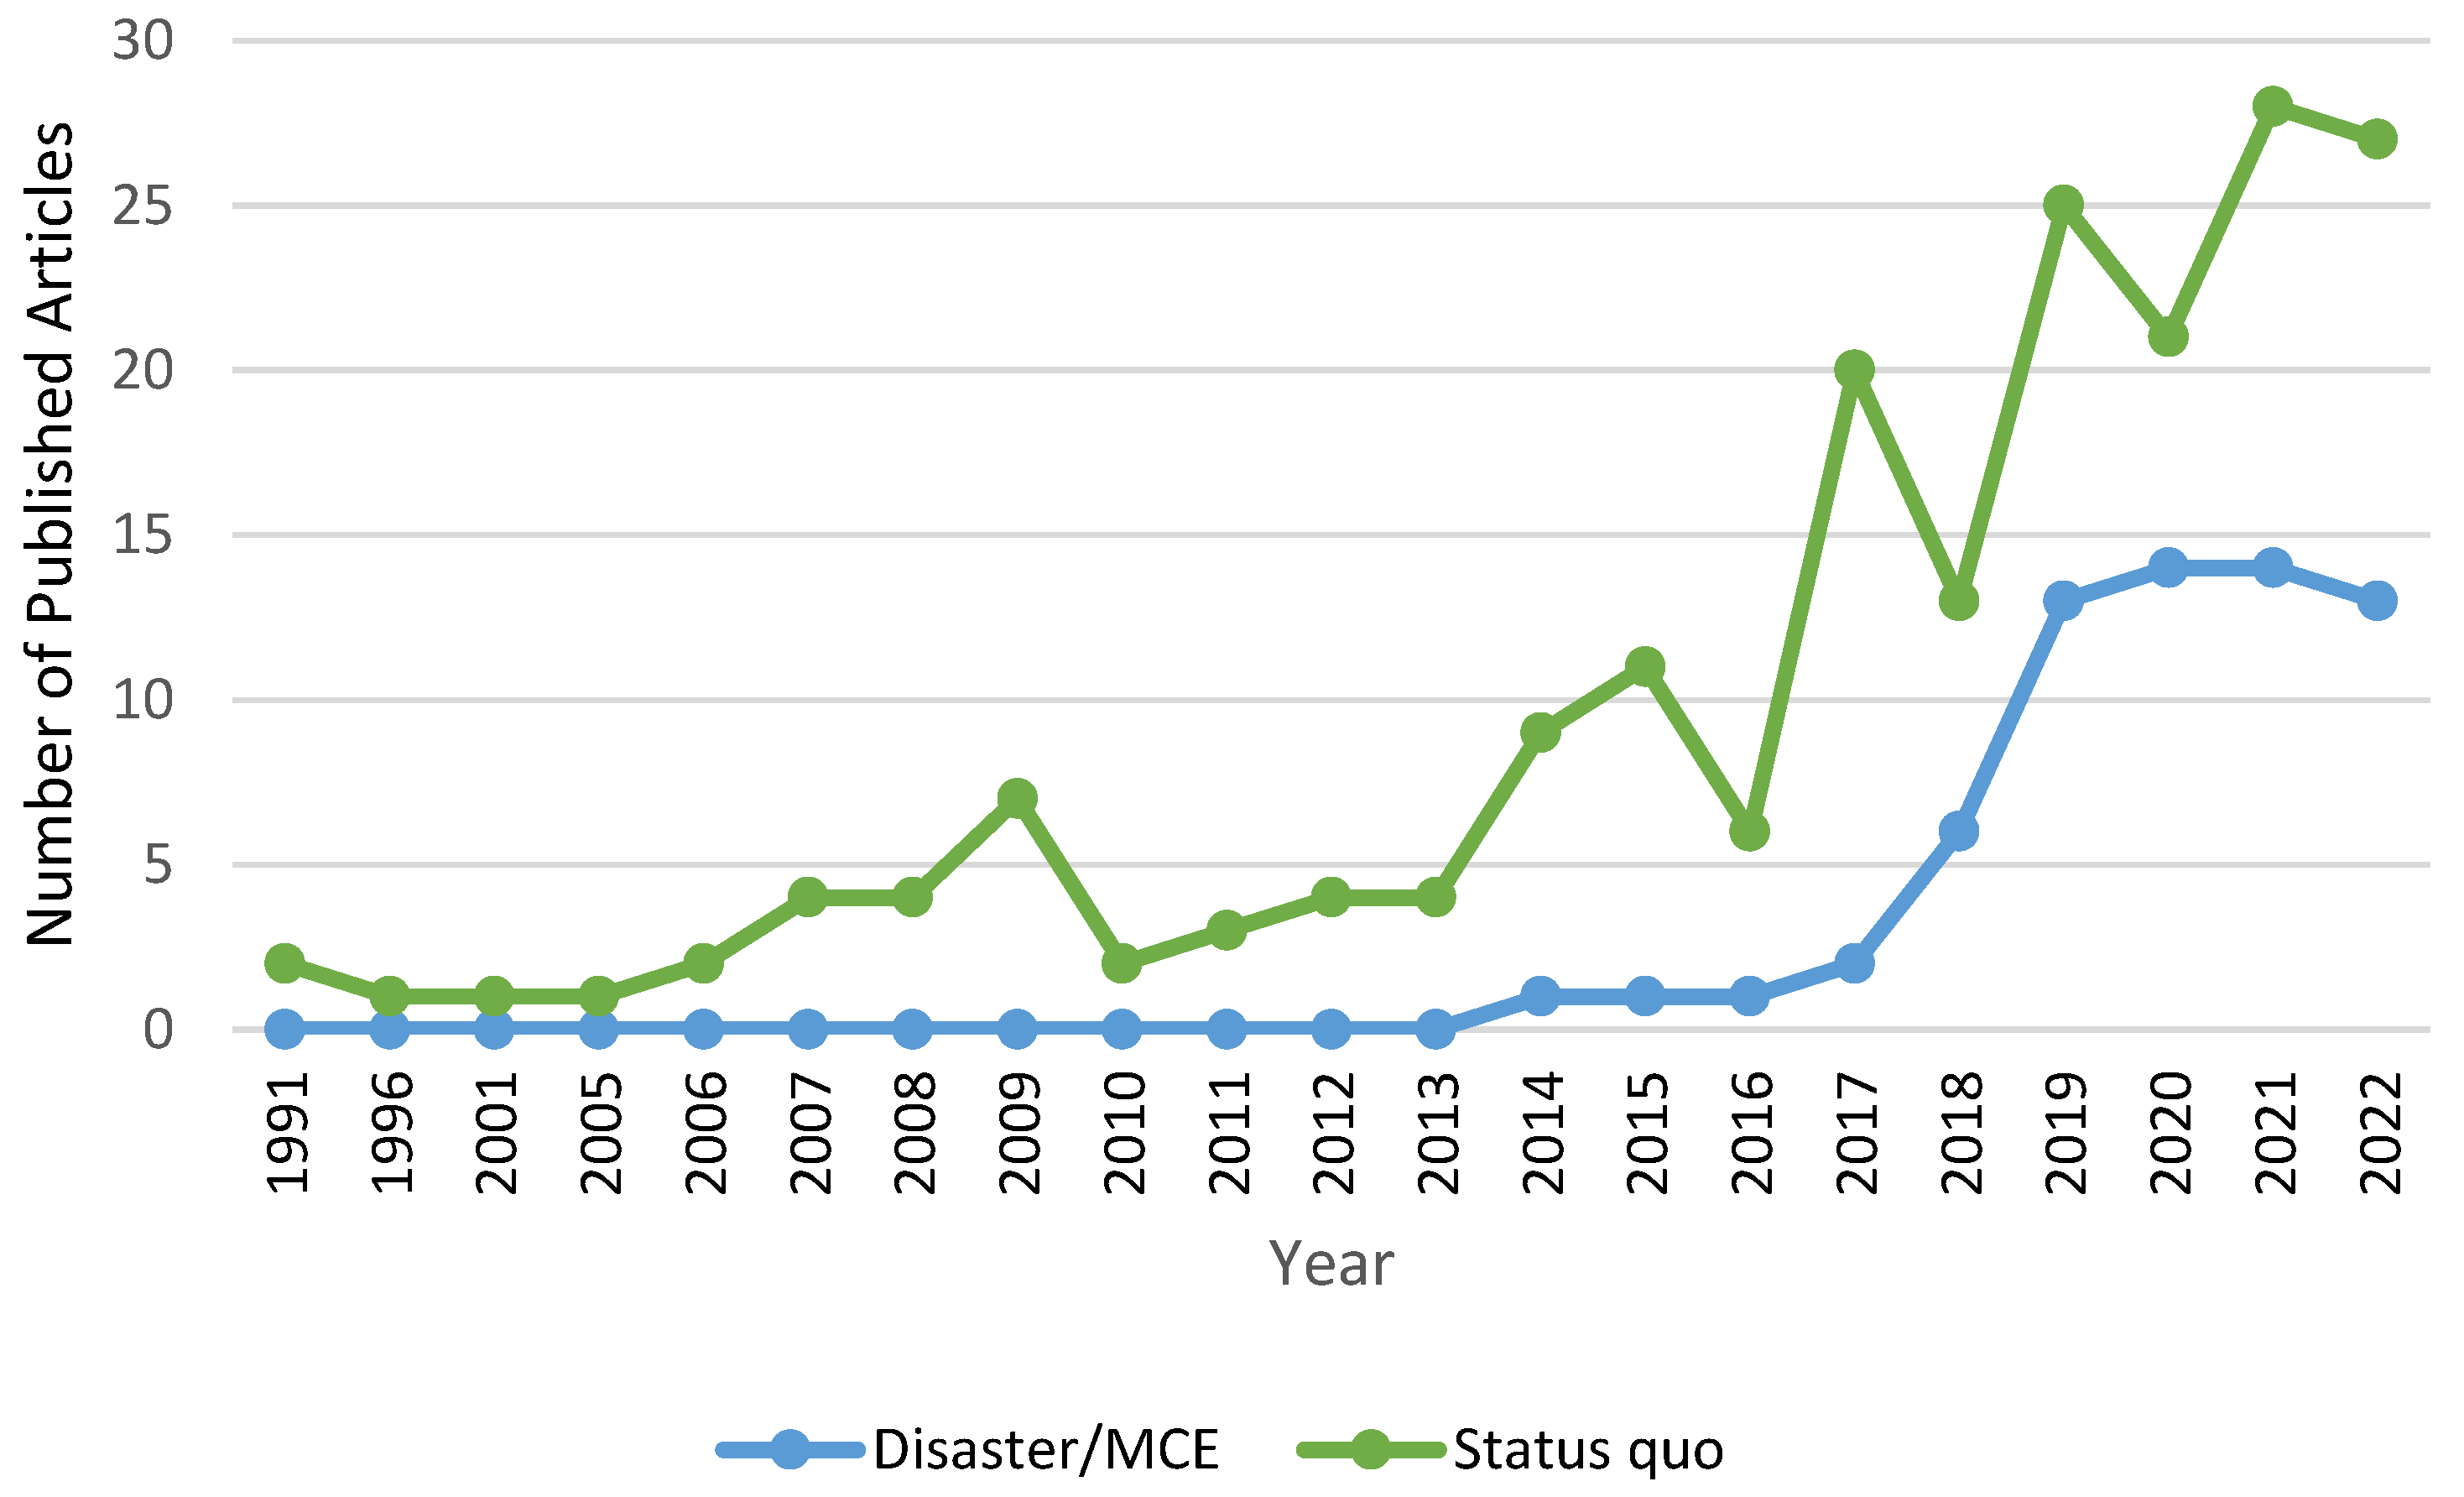
Table 1.
Review articles on BSC.
| Review | Database | Number of Articles Considered | Year Range |
|---|---|---|---|
| Beliën and Forcé [1] | WoS, Pubmed, Academic Search Premier, Business Source Premier, Econlit, SCIRIUS | 98 | 1966–2010 |
| Osorio et al. [2] | N/A | 127 | 1963–2014 |
| Piraban et al. [13] | SCOPUS | 100 | 2005–2019 |
| Eghtesadifard and Jozan [19] | WoS | 485 | 1990–2021 * |
* August 2021.
Table 2.
The combination of keywords.
| Groups | Keywords |
|---|---|
| Group 1 | “blood” OR “blood product” OR “blood bank” OR “whole blood” or “red blood cells” OR “platelets” OR “plasma” OR “frozen blood” OR “cryoprecipitate” |
| Group 2 | “supply chain” OR “network design” OR “humanitarian logistics” OR “disaster relief” OR “location-allocation” OR “location selection” OR “routing” OR “donation planning” OR “donation tailoring” OR “donation management” OR “ collection planning” OR “collection management” OR “collection tailoring” OR ”production planning” OR “process planning” OR ” inventory planning” OR “inventory management” OR “inventory control” OR “distribution management” OR “distribution planning” OR “demand match” OR “ blood match” OR “group compatibility” |
| Group 3 | “optimization” OR “simulation” OR “scheduling” OR “optimal” OR “heuristic” OR “stochastic” OR “robust” OR “uncertain” OR “predict” OR “forecast” OR “analysis” OR “model” OR “method” OR “algorithm” |
| Search Query | (Group 1) AND (Group 2) AND (Group 3) |
Table 3.
Top 20 contributing journals in conjunction with publication years.
| Source | 2005 | 2006 | 2007 | 2008 | 2009 | 2010 | 2011 | 2012 | 2013 | 2014 | 2015 | 2016 | 2017 | 2018 | 2019 | 2020 | 2021 | 2022 | TOTAL |
|---|---|---|---|---|---|---|---|---|---|---|---|---|---|---|---|---|---|---|---|
| Transfusion | 2 | 2 | 1 | 1 | 1 | 2 | 2 | 1 | 2 | 2 | 4 | 20 | |||||||
| Computers and Industrial Engineering | 1 | 1 | 1 | 3 | 4 | 2 | 1 | 2 | 15 | ||||||||||
| Annals of Operations Research | 1 | 7 | 2 | 2 | 12 | ||||||||||||||
| Transportation Research Part E-Logistics and Transportation Review | 1 | 1 | 1 | 2 | 4 | 1 | 2 | 12 | |||||||||||
| Computers and Operations Research | 3 | 1 | 1 | 2 | 2 | 2 | 11 | ||||||||||||
| International Journal of Production Economics | 1 | 2 | 2 | 4 | 1 | 1 | 11 | ||||||||||||
| Vox Sanguinis | 1 | 1 | 1 | 1 | 2 | 1 | 1 | 2 | 10 | ||||||||||
| European Journal of Operational Research | 1 | 1 | 2 | 1 | 2 | 7 | |||||||||||||
| Journal of the Operational Research Society | 1 | 1 | 1 | 3 | 6 | ||||||||||||||
| Operations Research for Health Care | 2 | 1 | 1 | 1 | 1 | 6 | |||||||||||||
| Journal of Ambient Intelligence and Humanized Computing | 2 | 1 | 2 | 5 | |||||||||||||||
| Production and Operations Management | 2 | 1 | 2 | 5 | |||||||||||||||
| International Transactions in Operational Research | 1 | 2 | 1 | 1 | 5 | ||||||||||||||
| Journal of Intelligent and Fuzzy Systems | 1 | 1 | 1 | 1 | 1 | 5 | |||||||||||||
| Operational Research | 1 | 4 | 5 | ||||||||||||||||
| Discrete Dynamics in Nature and Society | 1 | 3 | 4 | ||||||||||||||||
| Omega-International Journal of Management Science | 1 | 2 | 1 | 4 | |||||||||||||||
| Applied Mathematical Modelling | 1 | 1 | 1 | 1 | 4 | ||||||||||||||
| European Journal of Industrial Engineering | 1 | 2 | 1 | 4 | |||||||||||||||
| Socio-Economic Planning Sciences | 1 | 2 | 1 | 4 |
Table 4.
Distribution of articles according to the number of contributing authors.
| Number of Authors | 1 | 2 | 3 | 4 | 5 | 6 | 7 | 8 | 9 | 10 | 12 | 13 | Average |
|---|---|---|---|---|---|---|---|---|---|---|---|---|---|
| Number of Articles | 8 | 66 | 85 | 65 | 19 | 9 | 3 | 2 | 2 | 3 | 2 | 1 | 3.49 |
Table 5.
Top 10 contributing authors.
| Author | Hosseini-Motlagh S.M. | Samani M.R.G. | Abbasi B. | Yaghoubi S. | Heddle N.M. | Larimi N.G. | Katsaliaki K. | Tavakkoli-Moghaddam R. | Haijema R. | Jabbarzadeh A. |
|---|---|---|---|---|---|---|---|---|---|---|
| Number of articles | 17 | 12 | 9 | 7 | 5 | 5 | 5 | 5 | 5 | 4 |
Table 6.
Top 10 authors according to total citations their articles have.
| Author | Nahmias S. | Osorio A.F. | Zahiri B. | Haijema R. | Belien J. | Prastacos G.P. | Nagurney A. | Samani M.R.G. | Pierskalla W.P. | Jabbarzadeh A. |
|---|---|---|---|---|---|---|---|---|---|---|
| Number of citation | 155 | 140 | 135 | 134 | 117 | 97 | 96 | 94 | 85 | 83 |
Table 7.
Top 20 contributing countries.
| Country | Number of Articles | Country | Number of Articles |
|---|---|---|---|
| Iran | 80 | Colombia | 6 |
| USA | 62 | Finland | 6 |
| Canada | 32 | Germany | 5 |
| People’s Republic China | 30 | Spain | 5 |
| United Kingdom | 22 | United Arab Emirates | 5 |
| Australia | 18 | Brazil | 4 |
| Turkey | 15 | Italy | 4 |
| India | 12 | Saudi Arabia | 4 |
| Netherlands | 10 | Austria | 3 |
| France | 8 | South Korea | 3 |
Table 8.
Top 20 most commonly used keywords; and top 20 most commonly used words in the titles.
| Keyword | Frequency | Word in Title | Frequency |
|---|---|---|---|
| Blood supply chain | 75 | Blood | 228 |
| Inventory management | 22 | Supply | 116 |
| Robust optimization | 22 | Chain | 90 |
| Simulation | 17 | Inventory | 48 |
| Uncertainty | 16 | Network | 44 |
| Optimization | 12 | Model | 40 |
| Supply chain | 11 | Management | 37 |
| Perishable inventory | 10 | Platelet | 31 |
| Disaster | 9 | Approach | 30 |
| Platelets | 8 | Robust | 29 |
| Blood bank | 8 | Optimization | 28 |
| Blood products | 7 | Under | 26 |
| Supply chain management | 7 | Design | 24 |
| Perishable inventory management | 7 | Case | 22 |
| Perishable product | 7 | Demand | 22 |
| Healthcare | 7 | Study | 21 |
| Stochastic programming | 7 | Stochastic | 21 |
| Vehicle routing | 6 | Problem | 21 |
| Supply chain network design | 6 | Red | 20 |
| Multi-objective optimization | 6 | Collection | 19 |
Table 10.
Most cited 20 articles in the selected 265.
| Article | Citation | Article | Citation | ||
|---|---|---|---|---|---|
| Local | Global | Local | Global | ||
| Jabbarzadeh et al. [7] | 74 | 204 | Hosseinifard and Abbasi [42] | 45 | 63 |
| Gunpinar and Centeno [39] | 66 | 88 | Zhou et al. [44] | 43 | 87 |
| Haijema et al. [41] | 64 | 139 | Ghandforoush and Sen [47] | 41 | 71 |
| Fahimnia et al. [3] | 61 | 132 | Haijema et al. [48] | 39 | 75 |
| Zahiri and Pishvaee [12] | 62 | 99 | Katsaliaki and Brailsford [34] | 38 | 113 |
| Dillon et al. [36] | 58 | 107 | Samani et al. [11] | 38 | 67 |
| Duan and Liao [37] | 53 | 82 | Zahiri et al. [49] | 34 | 99 |
| Ramezanian and Behboodi [38] | 47 | 75 | Abdulwahab and Wahab [50] | 33 | 47 |
| Van Dijk et al. [40] | 47 | 84 | Hemmelmayr et al. [35] | 31 | 77 |
| Şahin et al. [6] | 46 | 99 | Salehi et al. [51] | 31 | 69 |
Table 11.
Top 20 publications according to PageRank Analysis.
| Publication | PageRank | Publication | PageRank |
|---|---|---|---|
| Beliën and Forcé [1] | 0.02229 | Nahmias [46] | 0.01148 |
| Osorio et al. [2] | 0.01472 | Duan and Liao [37] | 0.01093 |
| Jabbarzadeh et al. [7] | 0.01466 | Ramezanian and Behboodi [38] | 0.01009 |
| Gunpinar and Centeno [39] | 0.01371 | Zhou et al. [44] | 0.00976 |
| Zahiri and Pishvaee [12] | 0.01262 | van Dijk et al. [40] | 0.00959 |
| Fahimnia et al. [3] | 0.01259 | Şahin et al. [6] | 0.00921 |
| Nagurney et al. [43] | 0.01194 | Hosseinifard and Abbasi [42] | 0.00898 |
| Haijema et al. [41] | 0.01189 | Ghandforoush and Sen [47] | 0.00867 |
| Dillon et al. [36] | 0.01186 | Sha and Huang [45] | 0.00854 |
| Prastacos [5] | 0.01161 | Haijema et al. [48] | 0.00849 |
Table 12.
The most centralized top ten publication for each cluster.
| Cluster 1 | Cluster 2 | Cluster 3 | Cluster 4 |
|---|---|---|---|
| Gunpinar and Centeno [39] | Haijema et al. [41] | Beliën and Forcé [1] | Ghandforoush and Sen [47] |
| Osorio et al. [2] | Nahmias [46] | Pierskalla [20] | Dehghani and Abbasi [59] |
| Jabbarzadeh et al. [7] | Van Dijk et al. [40] | Hemmelmayr et al. [35] | Wang and Ma [60] |
| Nagurney et al. [43] | Zhou et al. [44] | Katsaliaki and Brailsford [34] | Rajendran and Ravindran [61] |
| Dillon et al. [36] | Prastacos [5] | Katsaliaki [62] | Clay et al. [63] |
| Duan and Liao [37] | Haijema et al. [48] | Rytile and Spens [64] | Rajendran and Ravindran [65] |
| Zahiri and Pishvaee [12] | Karaesmen et al. [66] | Hemmelmayr et al. [67] | Abbasi and Hosseinifard [68] |
| Hosseinifard and Abbasi [42] | Civelek et al. [69] | Kopach et al. [70] | Abbasi et al. [71] |
| Şahin et al. [6] | Duan and Liao [72] | Delen et al. [73] | Sarhangian et al. [74] |
| Fahimnia et al. [3] | Pierskalla and Roach [75] | Brodheim et al. [76] | Rajendran and Srinivas [77] |
Disclaimer/Publisher’s Note: The statements, opinions and data contained in all publications are solely those of the individual author(s) and contributor(s) and not of MDPI and/or the editor(s). MDPI and/or the editor(s) disclaim responsibility for any injury to people or property resulting from any ideas, methods, instructions or products referred to in the content. |
© 2023 by the authors. Licensee MDPI, Basel, Switzerland. This article is an open access article distributed under the terms and conditions of the Creative Commons Attribution (CC BY) license (https://creativecommons.org/licenses/by/4.0/).
Share and Cite
MDPI and ACS Style
Imamoglu, G.; Topcu, Y.I.; Aydin, N. A Systematic Literature Review of the Blood Supply Chain through Bibliometric Analysis and Taxonomy. Systems 2023, 11, 124. https://doi.org/10.3390/systems11030124
AMA Style
Imamoglu G, Topcu YI, Aydin N. A Systematic Literature Review of the Blood Supply Chain through Bibliometric Analysis and Taxonomy. Systems. 2023; 11(3):124. https://doi.org/10.3390/systems11030124
Chicago/Turabian StyleImamoglu, Gul, Y. Ilker Topcu, and Nezir Aydin. 2023. "A Systematic Literature Review of the Blood Supply Chain through Bibliometric Analysis and Taxonomy" Systems 11, no. 3: 124. https://doi.org/10.3390/systems11030124
Note that from the first issue of 2016, this journal uses article numbers instead of page numbers. See further details here.