

Earned Value Management Agent-Based Simulation Model

 , , , , and
Abstract
:1. Introduction
2. Problem Statement
3. Methodology
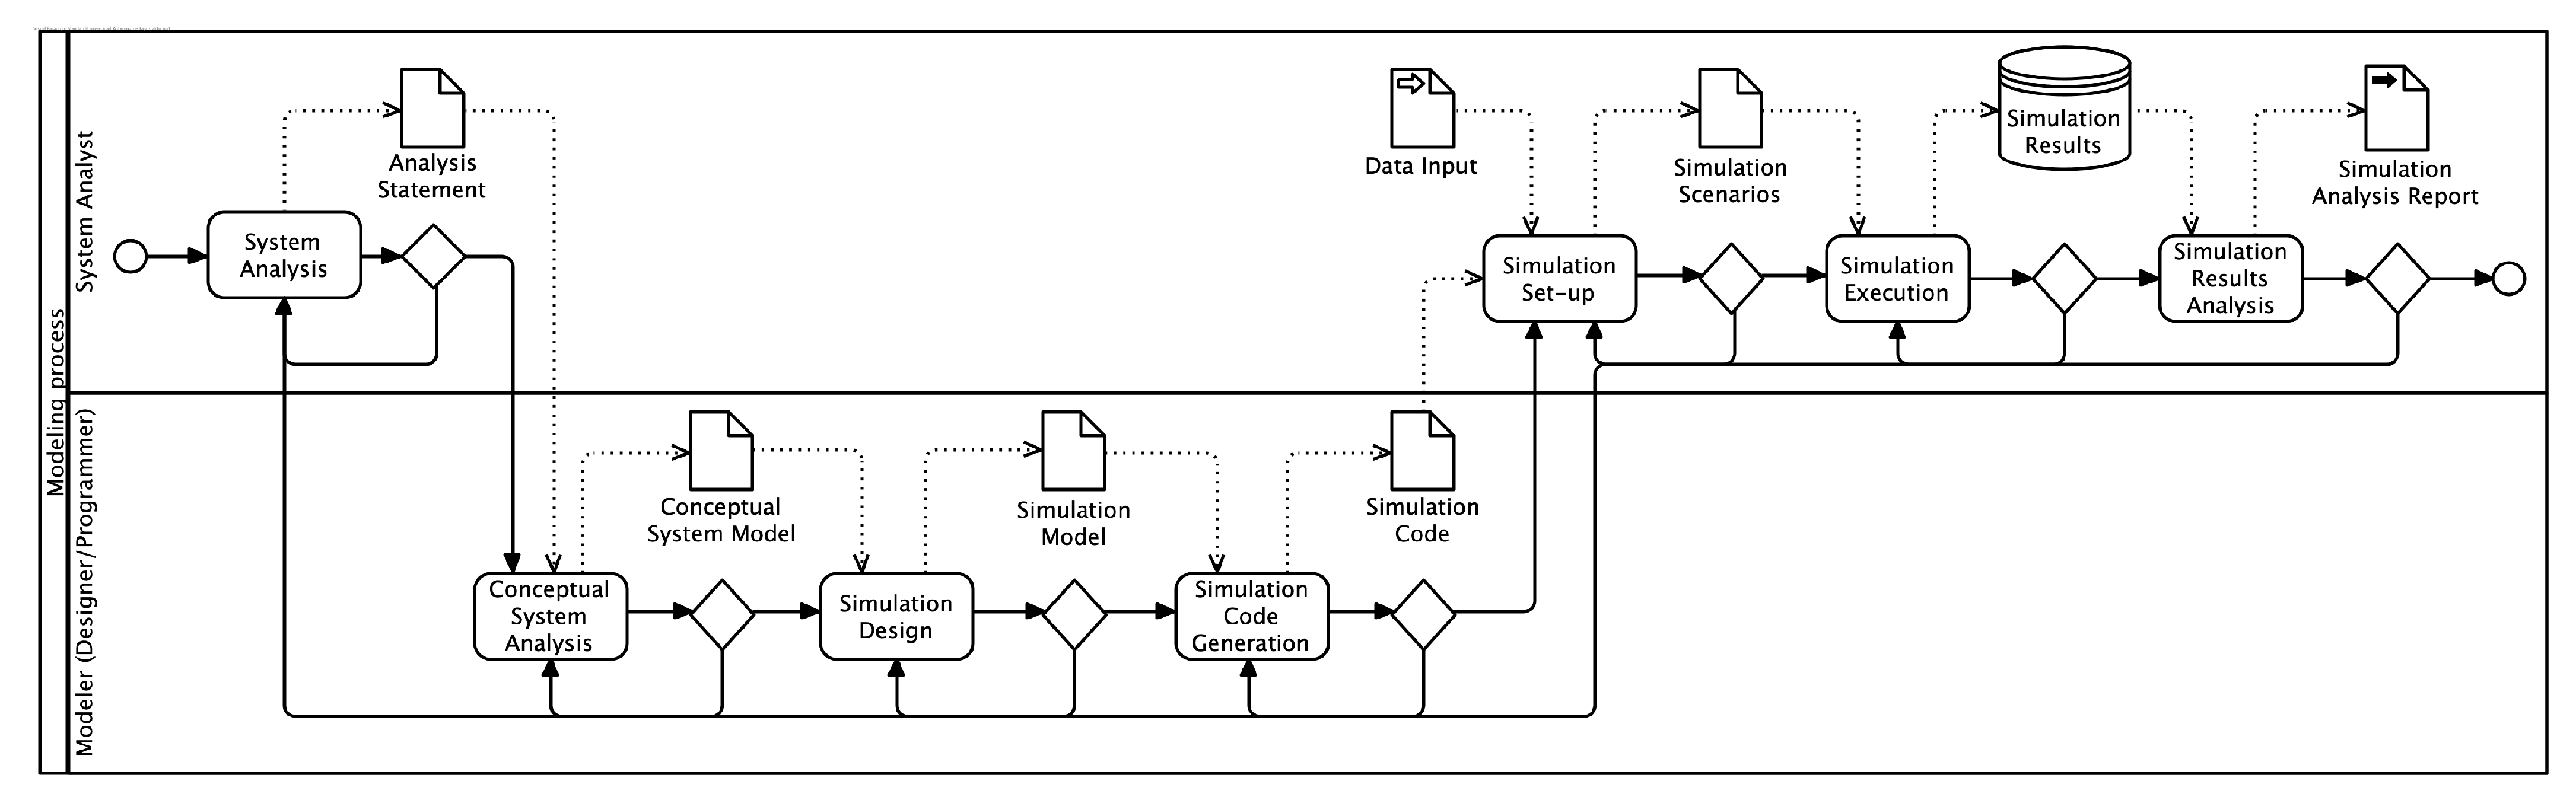
3.1. Modeling and Simulation Method
- System analysis. In this activity, we establish the aim of the model based on the research questions. The result is an analysis statement. In our case, it is a narrative document based on the ODD protocol that defines the purpose and details of the model we built.
- Conceptual modeling of the system. In this activity, we analyze the problem domain’s language to make a first approximation. The result is a conceptual system model. We use the Unified Modeling Language (UML) to represent the abstractions produced in the analysis of the problem language.
- Simulation design. In this activity, we design the simulation. The result is a simulation model based on a specific framework or tool. We use the Netlogo tool as the technological basis for the design.
- Simulation Code Generation. In this activity, we write a computer executable code that implements the designed model in the selected tool. The result is a simulation code. The generated code is written in Logo for Netlogo and implements the simulator design.
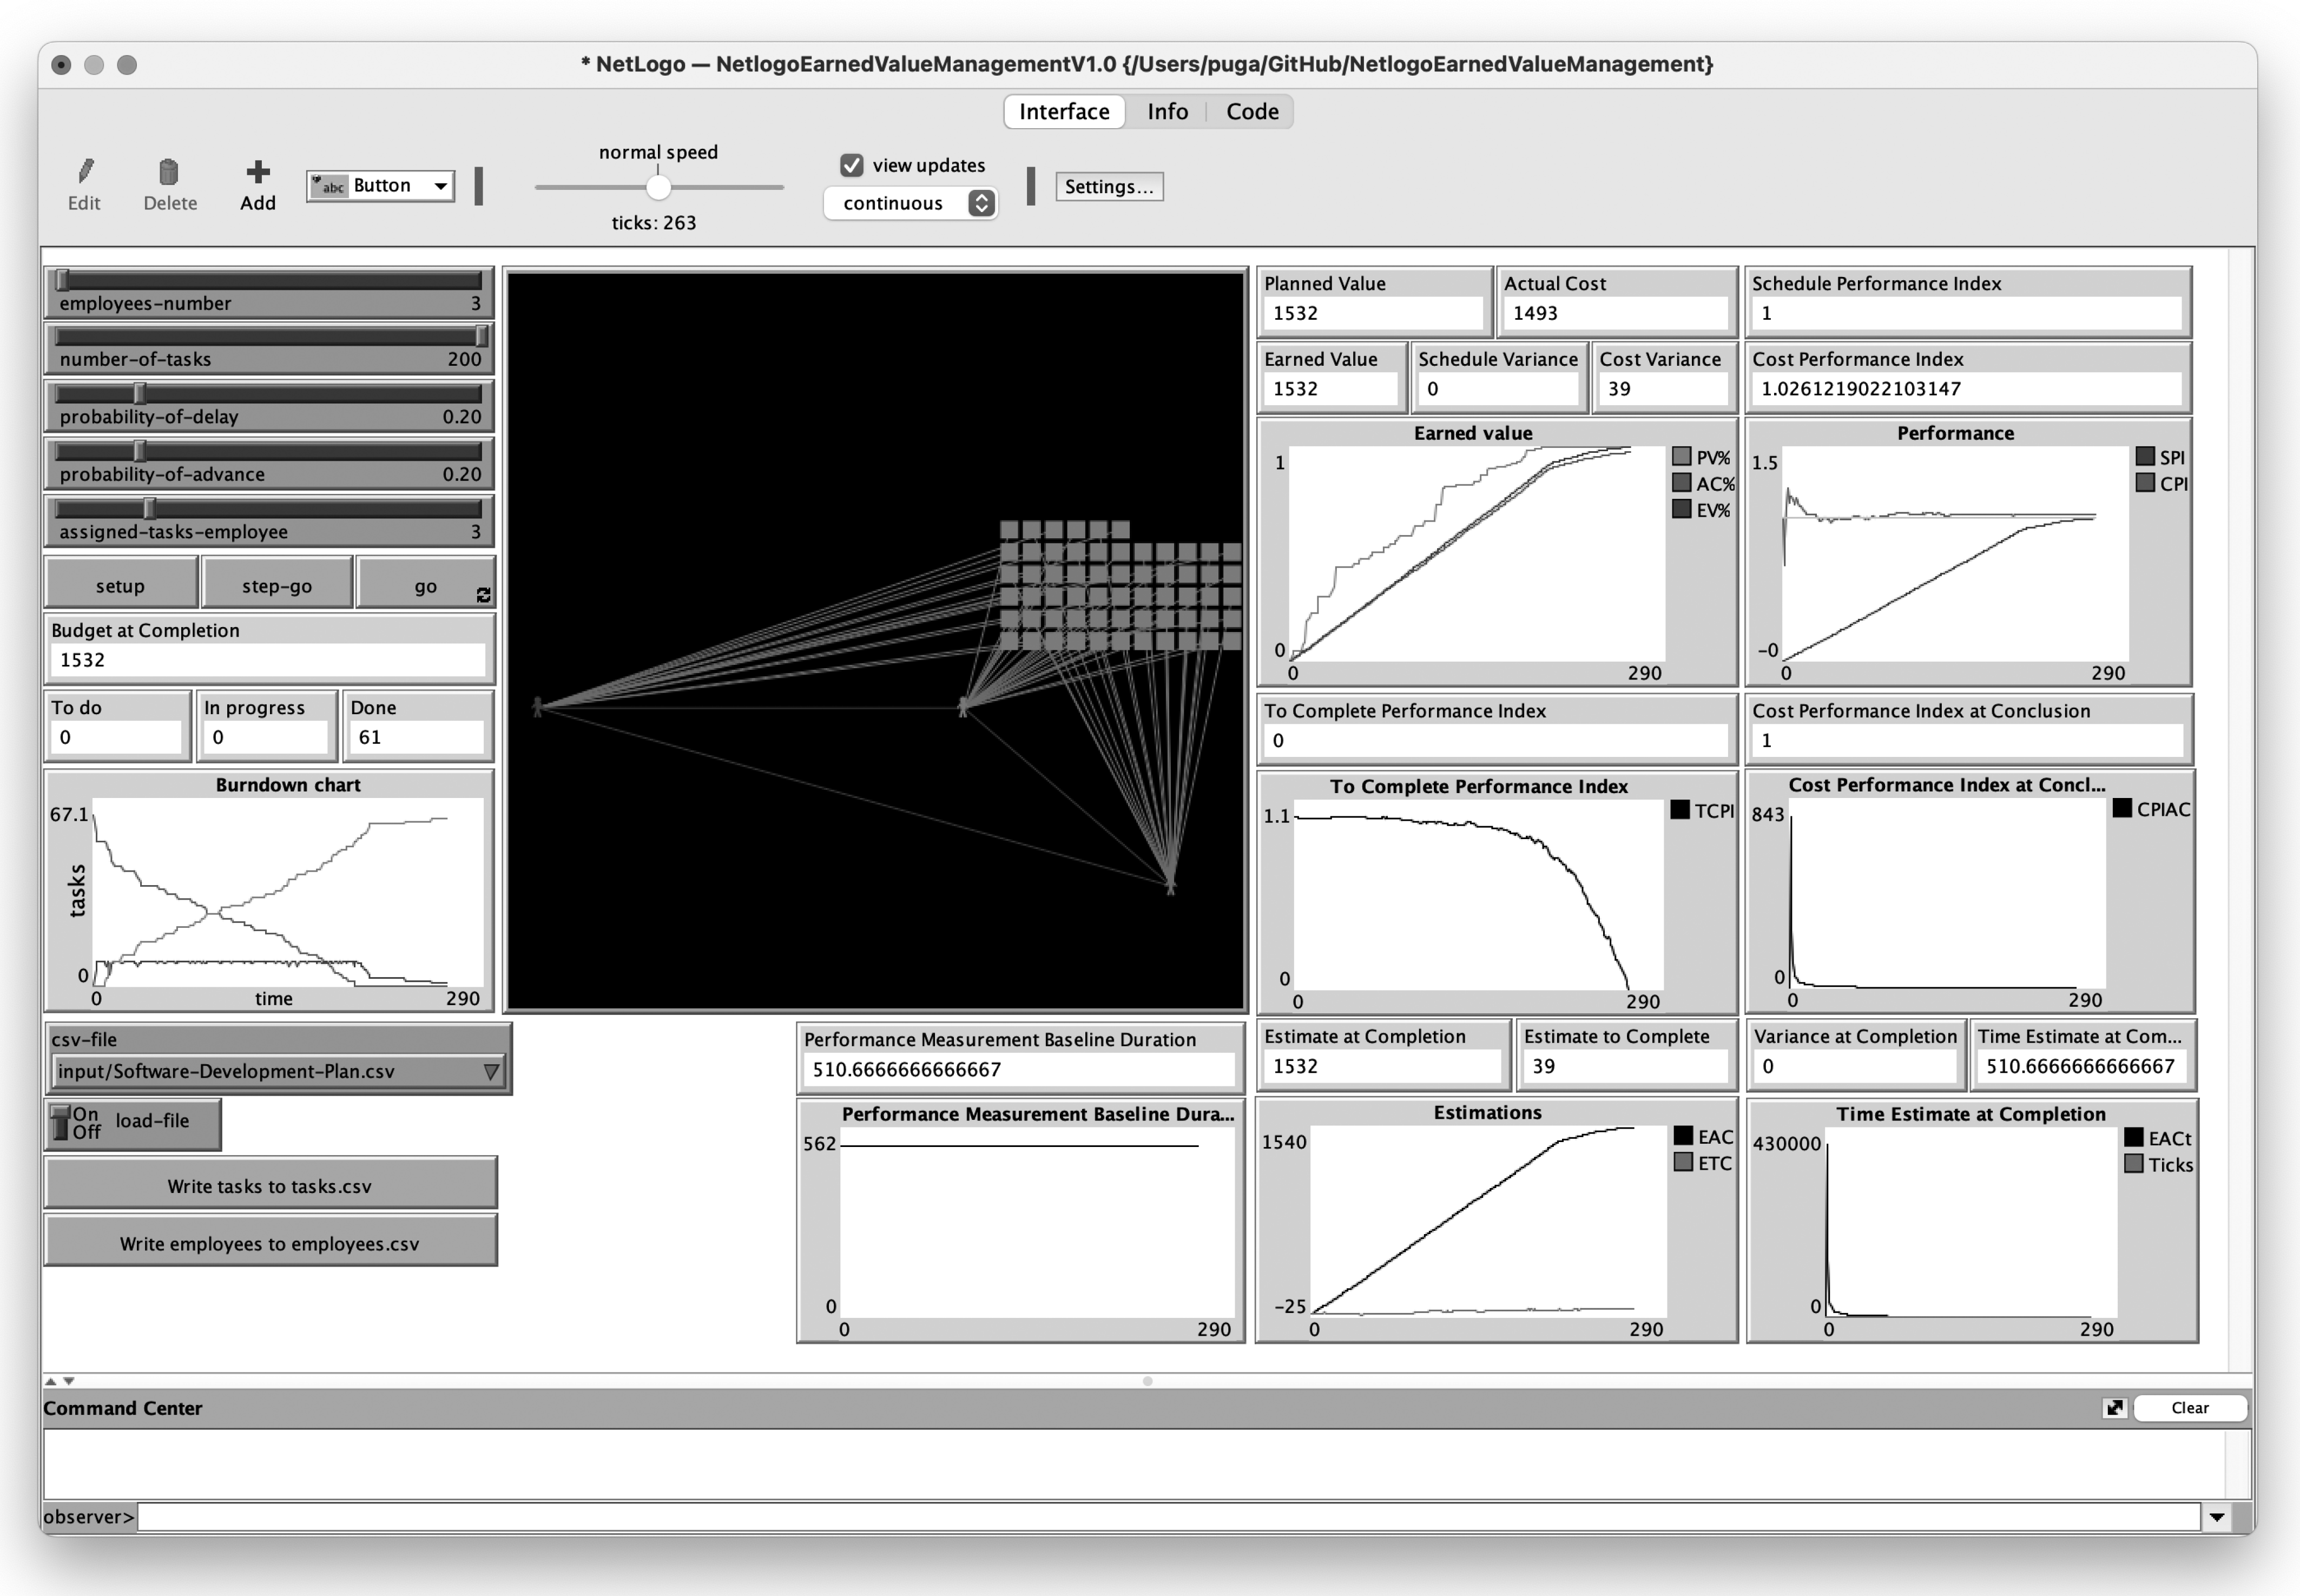
- Simulation Setup. In this activity, we configure the experiment in the simulator. Using input data, we specify simulation scenarios. We used Netlogo’s BehaviorSpace tool to experiment with a dataset based on a typical software project management template with 61 core tasks and a max of seven employees. This experimentation consisted of 2100 runs resulting from the combination of input variables and their possible valid values.
- Simulation execution. In this activity, we ran the experiment within the pre-set parameters. We obtained simulation results. The data obtained are the product of each “tick” (the discrete-time in Netlogo) and the states of all the input variables, agents, and earned value management metrics produced in each of the 2100 runs. The resulting data give us system state information in the entire parameter space.
- Simulation Results Analysis. In this activity, we analyze the results to contribute to the clarification of the proposed research questions. We use the resulting data to generate a simulation analysis report. We performed the following: (a) a t-Student test to compare dissimilarities in the results of simple scenario simulations between our prototype and tools suggested by PMI to analyze the EVM in hypothetical projects; (b) a sensitivity assessment to support the interpretation; (c) an explanation of simulation model outcomes and an active nonlinear test to examine the necessary considerations in the simulation structure and thereby begin to approach complexity.
3.2. Model Description
3.3. Model Validation
4. Results
4.1. Netlogo Prototype
4.2. Model Validation
5. Discussion
- 1.
- We provide a simulation tool to explore the relationship between task planned and performance conditions and the effect in the EVM metrics observations. Additionally, the model shows a typical task board tool to visualize the job backlog processing as most managers used to. This experimentation could help EVM learners and managers explore scenarios to understand how the metrics perform in different conditions.
- 2.
- The model is inspired by agency theory, specifically by Yolles’s cultural agency theory. Under this theoretical perspective, the model could have sense in the rationale of complexity. As the theory proposed, we can consider new features to add individual behavior and cultural factors.
- 3.
- We defined the model according to the ODD protocol. The ODD is a protocol recommended by the social simulation scientific community to overview the model and describe design concepts and implementation details to communicate agent-based models.
- 4.
- We programmed an agent-based model in a freely available tool. Netlogo is friendly for unskilled programmers and easily adaptable for new purposes.
- 5.
- The PMI considers the EVM a standard in project management.
- 1.
- The tool has limitations to building high-performance simulations.
- 2.
- The implicit systematic EVM limitations to assess other aspects of agile development management.
- 3.
- It is limited to the execution and control processes of the tasks where the promoting and executing agents have direct participation.
6. Conclusions
Author Contributions
Funding
Institutional Review Board Statement
Informed Consent Statement
Data Availability Statement
Acknowledgments
Conflicts of Interest
Abbreviations
| AC | Actual Cost |
| ABM | Agent-Based Model |
| CPI | Cost Performance Index |
| EV | Earned Value |
| EVM | Earned Value Management |
| ODD | “Overview, Design Concepts, Details” protocol |
| PV | Planned Value |
| PM | Project Management |
| PMB | Performance Measurement Baseline |
| PMBOOK | Project Management Body of Knowledge |
| PMI | Project Management Institute |
| SPI | Scheduled Performance Index |
| WBS | Work Breakdown Structure |
Appendix A. The Earned Value Management Model
Appendix A.1. Overview
Appendix A.1.1. Purpose and Patterns
Appendix A.1.2. Entities, State Variables, and Scales
Entities
- 1.
- The employee-agent, representing the developers (i.e., team leaders, team members, architects, and stakeholders);
- 2.
- The task-agent, representing the tasks (i.e., the work breakdown structure and tasks);
- 3.
- The employee-task-link, representing the employee-task assignations (i.e., the tasks backlog);
- 4.
- The global environment, representing the task board and the workspace (i.e., the Kan-ban board).
State Variables

| Entity | Variable Name | Variable Type | Meaning |
|---|---|---|---|
| Task | status | Integer | The task status |
| task-number | Integer | The task number | |
| task-description | String | The task description | |
| priority | Integer | The task priority | |
| planned-start | String | A planned task start date | |
| planned-finish | String | A planned task finish date | |
| planned-hours | Integer | Planned task execution hours | |
| complete-hours | Integer | Complete task execution planned hours | |
| actual-hours | Integer | Real/actual task execution hours | |
| Employee | employee-number | Integer | The employee ID number |
| status | Integer | The employee status | |
| role | String | The employee role |
Scales
| Scale | Values | Meaning |
|---|---|---|
| Grid | 16 × 32 | The task board and color tags. |
| Grid | 16 × 32 | The workspace and employees. |
| Ticks | 0–n | The working hours |
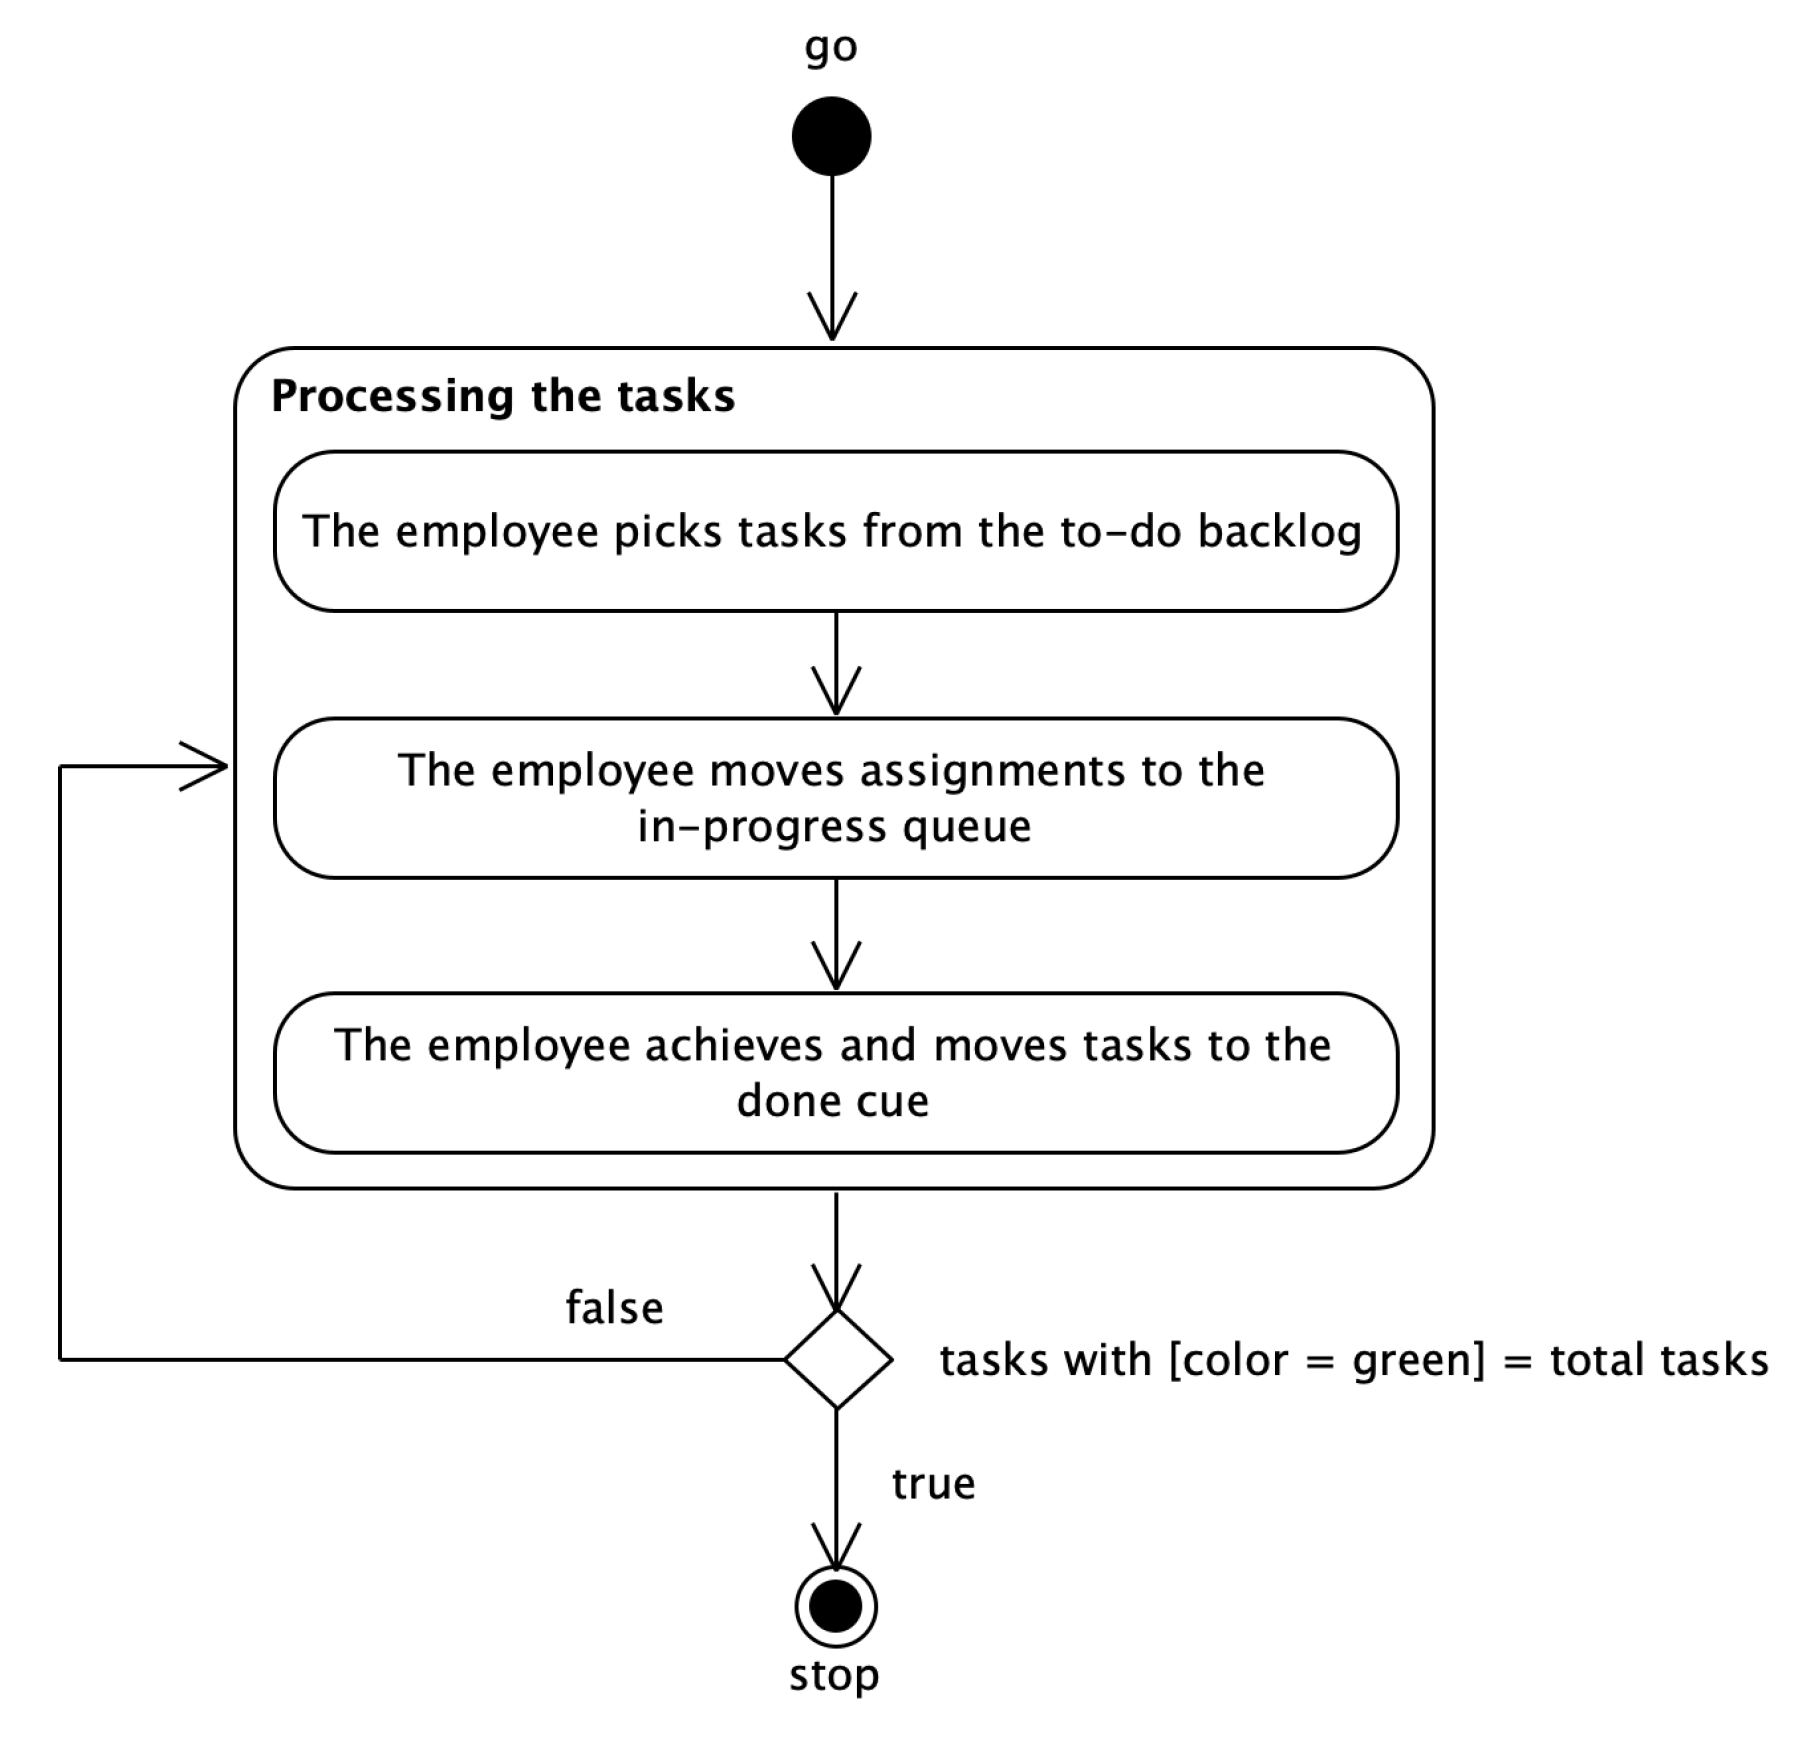
Appendix A.1.3. Process Overview and Scheduling
Appendix A.2. Design Concepts
Appendix A.2.1. Basic Principles
- A task backlog: a task backlog (to-do column) requires individuals to complete it.
- A task board: task states are portrayed on a task board to visualize the project’s advancement.
- Players: players must take as many tasks as permitted from the “to-do” queue and deliver them to the “done” cue in the panel. While a player is working on an assignment, he must keep the assignment tag in the “in-progress” column.
- A cost and schedule: the task has a planned cost in hours and start–finish time, but the worker could delay or advance in completing the job, or environmental situations could increase and decrease the final cost.
- Performance metrics: the earned value management metrics estimate the project performance.
Appendix A.2.2. Emergence
Appendix A.2.3. Adaptation
Appendix A.2.4. Objectives
Appendix A.2.5. Prediction
Appendix A.2.6. Stochasticity
Appendix A.2.7. Collectives
Appendix A.2.8. Observation
Appendix A.3. Details
Appendix A.3.1. Initialization
Appendix A.3.2. Input Data
| Input Variable | Data Type | Values |
|---|---|---|
| employees-number | Integer | 0–100 |
| number-of-tasks | Integer | 1–n |
| probability-of-delay | Integer | 0–1 |
| probability-of-advance | Integer | 0–1 |
| assigned-tasks-employee | Integer | 0–3 |
Appendix A.3.3. Submodels
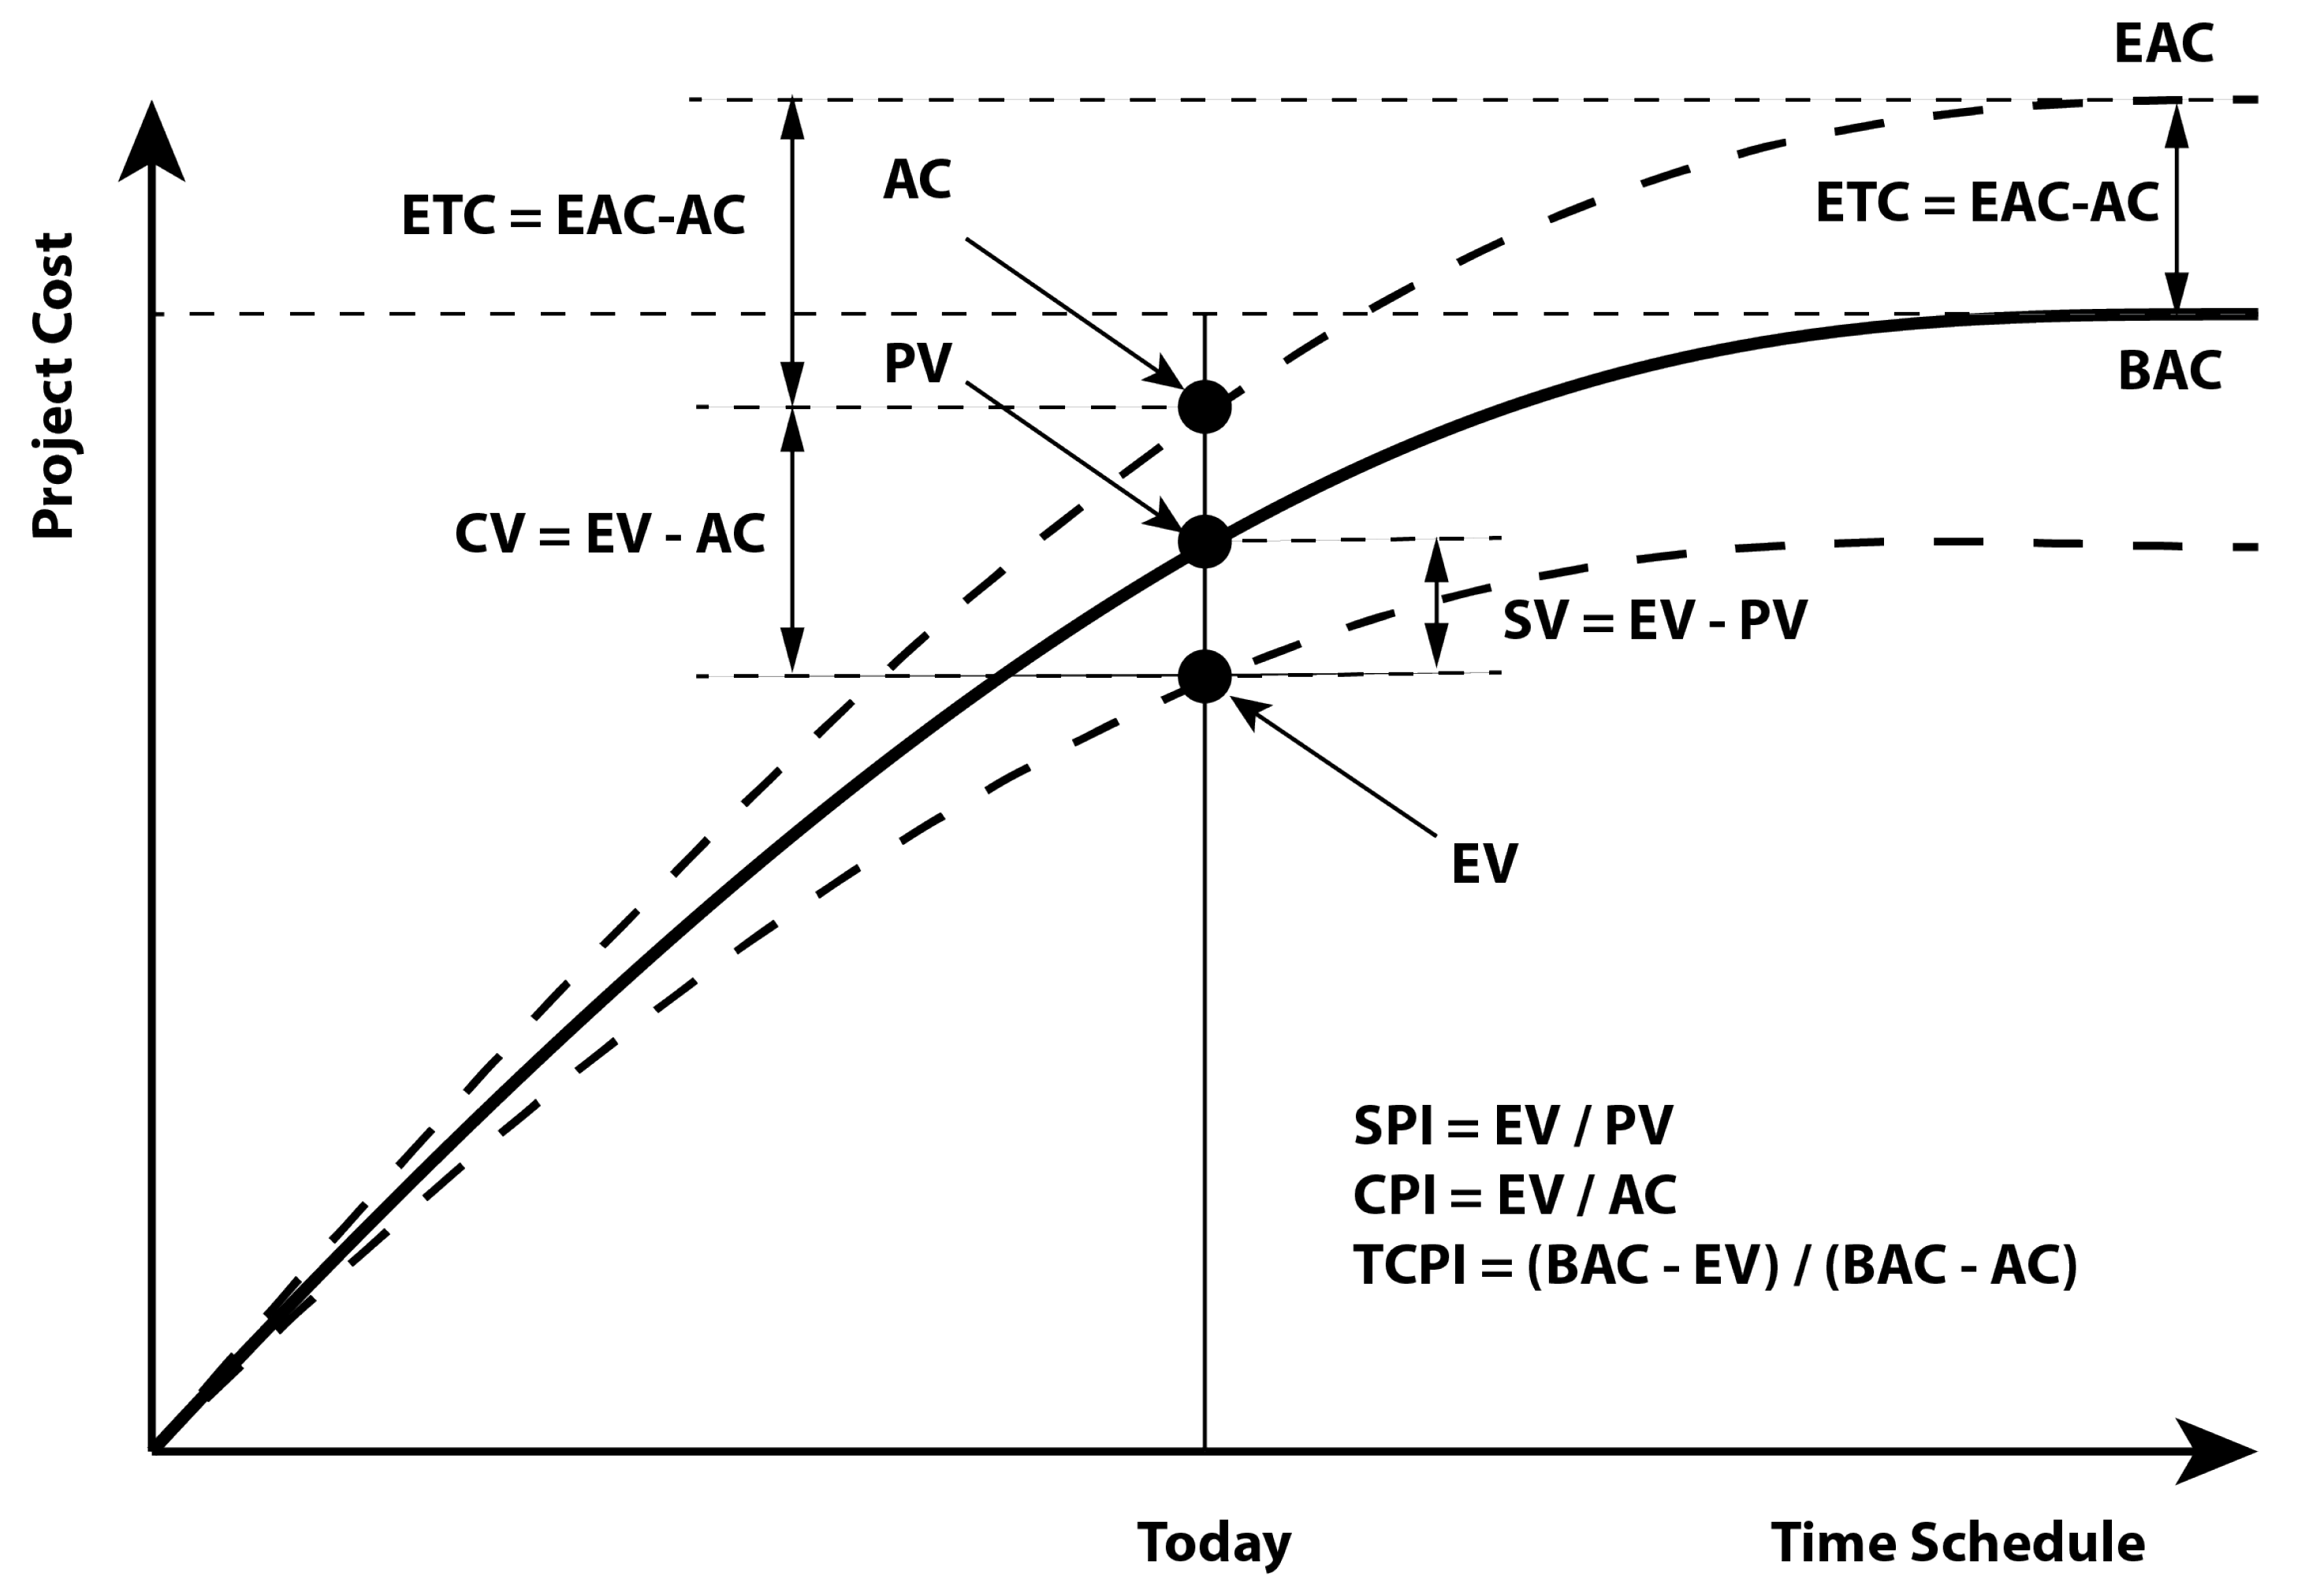
Earned Value Management

| EVM Metric | Calculation and Description |
|---|---|
| Planned Value, PV | The budget (or planned) value of work scheduled |
| Earned Value, EV | The “earned value” of the physical work completed |
| Actual Cost (AC) | The actual value of work completed |
| Budget at Completion, BAC | PV% = PV / BAC |
| EV% = EV / BAC | |
| AC% = AC / BAC | |
| Schedule Variance, SV | SV = EV – PV |
| SV% = SV / PV | |
| Cost Variance, CV | CV = EV – AC |
| CV% = CV / EV | |
| Schedule Performance Index, SPI | SPI = EV / PV |
| Cost Performance Index, CPI | CPI = EV /AC |
| To Complete Performance Index, TCPI | TCPI = (BAC – EV) / (BAC – AC) |
| Estimate at Completion, EAC | EAC = BAC – SV |
| EAC = BAC / CPI | |
| EAC = BAC / (CPI * SPI) | |
| EAC = AC + new estimate of remaining work | |
| Estimate to Complete, ETC | ETC = EAC – AC |
| Variance at Completion, VAC | VAC = BAC – EAC |
| VAC% = VAC / BAC | |
| Cost Performance Index at Conclusion, CPIAC | CPIAC = BAC / EAC |
| Time Estimate at | EACt = (BAC / SPI) / (BAC / PMB |
| Completion, EACt | Duration) = PMB duration / SPI |
| Time Variance at | VACt = PMB duration – EACt |
| Completion, VACt | VACt% = VACt / PMB duration |
| Time Schedule Performance | SPIACt = PMB duration / EACt |
| Index at Conclusion, SPIACt |
Appendix B. Sensitivity Assessment
| Variable | Mean | SD | Median | MAD | Min | Max | n |
|---|---|---|---|---|---|---|---|
| employees.number | 4 | 2.00047636061173 | 4 | 2.9652 | 1 | 7 | 2100 |
| assigned.tasks.employee | 2 | 0.81669105433311 | 2 | 1.4826 | 1 | 3 | 2100 |
| probability.of.delay | 0.45 | 0.287296544411313 | 0.45 | 0.37065 | 0 | 0.9 | 2100 |
| probability.of.advance | 0.45 | 0.287296544411313 | 0.45 | 0.37065 | 0 | 0.9 | 2100 |
| step | 1116.98571428571 | 1603.01591793252 | 581 | 471.4668 | 146 | 15,980 | 2100 |
| AC | 2469.54904761905 | 2817.20670248899 | 1532 | 1245.384 | 125 | 15,939 | 2100 |
| PV | 1532 | 0 | 1532 | 0 | 1532 | 1532 | 2100 |
| EV | 1532 | 0 | 1532 | 0 | 1532 | 1532 | 2100 |
| SV | 0 | 0 | 0 | 0 | 0 | 0 | 2100 |
| SPI | 1 | 0 | 1 | 0 | 1 | 1 | 2100 |
| CV | −937.549047619048 | 2817.20670248899 | 0 | 1245.384 | −14,407 | 1407 | 2100 |
| CPI | 1.61839999350462 | 1.86235517369687 | 1 | 0.814674377613205 | 0.0961164439425309 | 12.256 | 2100 |
| Requirement | Specification | Number of Traces Where Requirement Is True | Total Number of Traces | Percent of Cases Where the Requirement Is True out of Total Cases | Assessment |
|---|---|---|---|---|---|
| employees.number >= 1 | Always True | 2100 | 2100 | 1 | Requirement Is Met in ALL cases |
| employees.number <= 7 | Always True | 2100 | 2100 | 1 | Requirement is Met in ALL cases |
| assigned.tasks.employee >= 1 | Always True | 2100 | 2100 | 1 | Requirement is Met in ALL cases |
| assigned.tasks.employee <= 3 | Always True | 2100 | 2100 | 1 | Requirement is Met in ALL cases |
| probability.of.delay >= 0 | Always True | 2100 | 2100 | 1 | Requirement is Met in ALL cases |
| probability.of.delay <1 | Always True | 2100 | 2100 | 1 | Requirement is Met in ALL cases |
| probability.of.advance >= 0 | Always True | 2100 | 2100 | 1 | Requirement is Met in ALL cases |
| probability.of.advance <1 | Always True | 2100 | 2100 | 1 | Requirement is Met in ALL cases |
| Condition | Number of Traces Where Condition Is True | Total Number of Traces | Likelihood That Condition Appears Alongside “CPI” within Range 0.0961164439425309 to 3.5 | Likelihood That “CPI” within Range 0.0961164439425309 to 3.5 Contains the Condition | Sensitivity Assessment |
|---|---|---|---|---|---|
| employees.number >= 0 | 1880 | 2100 | 0.895238095238095 | 1 | 0.944723618090452 |
| assigned.tasks.employee >= 0 | 1880 | 2100 | 0.895238095238095 | 1 | 0.944723618090452 |
| probability.of.delay >= 0 | 1880 | 2100 | 0.895238095238095 | 1 | 0.944723618090452 |
| probability.of.advance >= 0 | 1880 | 2100 | 0.895238095238095 | 1 | 0.944723618090452 |
| employees.number >0 | 1880 | 2100 | 0.895238095238095 | 1 | 0.944723618090452 |
| assigned.tasks.employee >0 | 1880 | 2100 | 0.895238095238095 | 1 | 0.944723618090452 |
| probability.of.delay >0 | 1713 | 1890 | 0.906349206349206 | 0.911170212765957 | 0.908753315649867 |
| probability.of.advance >0 | 1670 | 1890 | 0.883597883597884 | 0.888297872340426 | 0.885941644562334 |
| employees.number == 0 | 0 | 0 | NA | 0 | NA |
| assigned.tasks.employee == 0 | 0 | 0 | NA | 0 | NA |
| probability.of.delay == 0 | 167 | 210 | 0.795238095238095 | 0.0888297872340426 | 0.159808612440191 |
| probability.of.advance == 0 | 210 | 210 | 1 | 0.111702127659574 | 0.200956937799043 |
| employees.number <0 | 0 | 0 | NA | 0 | NA |
| assigned.tasks.employee <0 | 0 | 0 | NA | 0 | NA |
| probability.of.delay <0 | 0 | 0 | NA | 0 | NA |
| probability.of.advance <0 | 0 | 0 | NA | 0 | NA |
| employees.number <= 0 | 0 | 0 | NA | 0 | NA |
| assigned.tasks.employee <= 0 | 0 | 0 | NA | 0 | NA |
| probability.of.delay <= 0 | 167 | 210 | 0.795238095238095 | 0.0888297872340426 | 0.159808612440191 |
| probability.of.advance <= 0 | 210 | 210 | 1 | 0.111702127659574 | 0.200956937799043 |
| Condition | Number of Traces Where Condition Is True | Total Number of Traces | Likelihood That Condition Appears Alongside “Step” within Range 146 to 2720 | Likelihood That “Step” within Range 146 to 2720 Contains the Condition | Sensitivity Assessment |
|---|---|---|---|---|---|
| employees.number >= 0 | 1933 | 2100 | 0.92047619047619 | 1 | 0.958591619142078 |
| assigned.tasks.employee >= 0 | 1933 | 2100 | 0.92047619047619 | 1 | 0.958591619142078 |
| probability.of.delay >= 0 | 1933 | 2100 | 0.92047619047619 | 1 | 0.958591619142078 |
| probability.of.advance >= 0 | 1933 | 2100 | 0.92047619047619 | 1 | 0.958591619142078 |
| employees.number >0 | 1933 | 2100 | 0.92047619047619 | 1 | 0.958591619142078 |
| assigned.tasks.employee >0 | 1933 | 2100 | 0.92047619047619 | 1 | 0.958591619142078 |
| probability.of.delay >0 | 1723 | 1890 | 0.911640211640212 | 0.891360579410243 | 0.901386345801726 |
| probability.of.advance >0 | 1741 | 1890 | 0.921164021164021 | 0.900672529746508 | 0.910803034266283 |
| employees.number == 0 | 0 | 0 | NA | 0 | NA |
| assigned.tasks.employee == 0 | 0 | 0 | NA | 0 | NA |
| probability.of.delay == 0 | 210 | 210 | 1 | 0.108639420589757 | 0.195986934204386 |
| probability.of.advance == 0 | 192 | 210 | 0.914285714285714 | 0.099327470253492 | 0.179188054129725 |
| employees.number <0 | 0 | 0 | NA | 0 | NA |
| assigned.tasks.employee <0 | 0 | 0 | NA | 0 | NA |
| probability.of.delay <0 | 0 | 0 | NA | 0 | NA |
| probability.of.advance <0 | 0 | 0 | NA | 0 | NA |
| employees.number <= 0 | 0 | 0 | NA | 0 | NA |
| assigned.tasks.employee <= 0 | 0 | 0 | NA | 0 | NA |
| probability.of.delay <= 0 | 210 | 210 | 1 | 0.108639420589757 | 0.195986934204386 |
| probability.of.advance <= 0 | 192 | 210 | 0.914285714285714 | 0.099327470253492 | 0.179188054129725 |
References
- Noteboom, C.; Ofori, M.; Sutrave, K.; El-Gayar, O. Agile Project Management: A Systematic Literature Review of Adoption Drivers and Critical Success Factors. In Proceedings of the Hawaii International Conference on System Sciences, Maui, HI, USA, 5–8 January 2021; pp. 6775–6783. [Google Scholar] [CrossRef]
- Institute, P.M. The Standard for Project Management and a Guide to the Project Management Body of Knowledge (PMBOK Guide), 17th ed.; Project Management Institute: Harrisburg, PA, USA, 2021. [Google Scholar]
- PMI. Agile Practice Guide PMBOK, 1st ed.; Project Management Institute, Inc.: Newtown Square, PA, USA, 2017; p. 130. [Google Scholar]
- Briggs, S. Agile Based Learning: What Is It and How Can It Change Education? 2014. InformED. 2019. Available online: http://www.opencolleges.edu.au/informed/features/agile-based-learning-what-is-it-and-how-can-it-change-education/ (accessed on 31 August 2019).
- Brandl, F.J.; Roider, N.; Hehl, M.; Reinhart, G. Selecting practices in complex technical planning projects: A pathway for tailoring agile project management into the manufacturing industry. CIRP J. Manuf. Sci. Technol. 2021, 33, 293–305. [Google Scholar] [CrossRef]
- Medini, K. A framework for agility improvement projects in the post mass customisation era. Int. J. Prod. Res. 2022, 2022, 1–17. [Google Scholar] [CrossRef]
- The Standard for Earned Value Management; Project Management Institute: Harrisburg, PA, USA, 2019.
- Fleming, Q.W.; Koppelman, J.M. Earned Value Project Management; Project Management Institute: Harrisburg, PA, USA, 2016; p. 231. [Google Scholar]
- Papatheocharous, E.; Andreou, A.S. Empirical evidence and state of practice of software agile teams. J. Softw. Evol. Process 2014, 26, 855–866. [Google Scholar] [CrossRef]
- U-tantada, S.; Yolles, M.; Shoosanuk, A.; Mujtaba, B.G. Strategic SMEs as Influential Drivers for the Market Economy: Modeling SMEs using Cultural Agency Theory. Int. Rev. Res. Emerg. Mark. Glob. Econ. 2019, 5, 1435–1452. [Google Scholar]
- Samset, K.; Volden, G.H. Front-end definition of projects: Ten paradoxes and some reflections regarding project management and project governance. Int. J. Proj. Manag. 2016, 34, 297–313. [Google Scholar] [CrossRef]
- Collyer, S.; Warren, C.M. Project management approaches for dynamic environments. Int. J. Proj. Manag. 2009, 27, 355–364. [Google Scholar] [CrossRef]
- Díez-Silva, H.M.; Pérez-Ezcurdia, M.A.; Gimena Ramos, F.N.; Montes-Guerra, M.I. Metodología de la Gestión Orientada a los Agentes del Proyecto. In Proceedings of the XVI Congreso Internacional de Ingeniería de Proyectos, Valencia, Spain, 11–13 July 2012. [Google Scholar]
- Hansen, E.G.; Schaltegger, S. Sustainability Balanced Scorecards and their Architectures: Irrelevant or Misunderstood? J. Bus. Ethics 2018, 150, 937–952. [Google Scholar] [CrossRef]
- Gilbert, N.; Troitzcsch, K.G. Simulation for the Social Scientist, 2nd ed.; Open University Press: Glasgow, UK, 2005; p. 295. [Google Scholar]
- Garro, A.; Russo, W. easyABMS: A domain-expert oriented methodology for agent-based modeling and simulation. Simul. Model. Pract. Theory 2010, 18, 1453–1467. [Google Scholar] [CrossRef]
- Grimm, V.; Railsback, S.F.; Vincenot, C.E.; Berger, U.; Gallagher, C.; DeAngelis, D.L.; Edmonds, B.; Ge, J.; Giske, J.; Groeneveld, J.; et al. The ODD Protocol for Describing Agent-Based and Other Simulation Models: A Second Update to Improve Clarity, Replication, and Structural Realism. J. Artif. Soc. Soc. Simul. 2020, 23, 7. [Google Scholar] [CrossRef]
- Grimm, V.; Berger, U.; Bastiansen, F.; Eliassen, S.; Ginot, V.; Giske, J.; Goss-Custard, J.; Grand, T.; Heinz, S.K.; Huse, G.; et al. A standard protocol for describing individual-based and agent-based models. Ecol. Model. 2006, 198, 115–126. [Google Scholar] [CrossRef]
- Grimm, V.; Berger, U.; DeAngelis, D.L.; Polhill, J.G.; Giske, J.; Railsback, S.F. The ODD protocol: A review and first update. Ecol. Model. 2010, 221, 2760–2768. [Google Scholar] [CrossRef]
- Jordan, A. The Earned Value Management Calculator. Available online: https://www.projectmanagement.com/deliverables/284670/Earned-Value-Management–EVM–Calculator (accessed on 27 December 2022).
- Palacios, S. EVM Worksheet Package. Available online: https://www.projectmanagement.com/deliverables/544342/evm-worksheet-package (accessed on 10 December 2022).
- Miller, J.H. Active Nonlinear Tests (ANTs) of Complex Simulation Models. Manag. Sci. 1998, 44, 820–830. [Google Scholar] [CrossRef]
- Tisue, S.; Wilensky, U. NetLogo: A Simple Environment for Modeling Complexity. In Proceedings of the International Conference on Complex Systems, Boston, MA, USA, 16–21 May 2004; Volume 21, pp. 16–21. [Google Scholar]
- Castañón-Puga, M.; Rosales-Cisneros, R.F.; Ahumada-Tello, E. NetLogo Task Board (1.0.0). Zenodo, 2022. Available online: https://zenodo.org/record/7474614#.Y-HSrK1ByUk (accessed on 27 December 2022).
- Castañón-Puga, M.; Rosales-Cisneros, R.F.; Acosta-Prado, J.C.; Tirado-Ramos, A.; Khatchikian, C.; Aburto-Camacllanqui, E. Netlogo Earned Value Management Model. Available online: https://www.comses.net/codebases/4effb542-f69f-464d-9f96-69f19d36ae8a/ (accessed on 27 December 2022).
- BehaviorSearch. Available online: http://www.behaviorsearch.org (accessed on 10 December 2022).
- Singh, H.; Singh, A. Principles of complexity and chaos theory in project execution: A new approach to management. Cost Eng. 2002, 44, 23–33. [Google Scholar]
- Stacey, R.D. The Science of Complexity: An Alternative Perspective for Strategic Change Processes. Strateg. Manag. J. 1995, 16, 477–495. [Google Scholar] [CrossRef]
- Bredillet, C.N. PMI Research and Education Conference 2010. Proj. Manag. J. 2010, 41, 2–3. [Google Scholar] [CrossRef]
- Ika, L.A. Project success as a topic in project management journals. Proj. Manag. J. 2009, 40, 6–19. [Google Scholar] [CrossRef]
- U-tantada, S.; Yolles, M.; Shoosanuk, A.; Mujtaba, B.G. Diagnosing Viable SME Cultural Agency and Capabilities. In Proceedings of the 1st Humanities and Social Sciences Research Promotion Network National and International Conference, Chanthaburi, Thailand, 28–29 June 2018. [Google Scholar]
- Suarez, E.D.; Castañón-Puga, M. Distributed Agency. Int. J. Agent Technol. Syst. 2013, 5, 32–52. [Google Scholar] [CrossRef]
- Yolles, M. Management Systems: A Viable Approach; Financial Times Pitman: London, UK, 1999. [Google Scholar]
- Yolles, M. Organizations as Complex Systems: An Introduction to Knowledge Cybernetics; Information Age Publishing: Creenwich, CO, USA, 2006; Volume 2. [Google Scholar]
- Yolles, M. Governance through political bureaucracy: An agency approach. Kybernetes 2019, 48, 7–34. [Google Scholar] [CrossRef]
- Tannenbaum, S.; Salas, E. Teams That Work: The Seven Drivers of Team Effectiveness; Oxford University Press: New York, NY, USA, 2021. [Google Scholar]


| Variable/Metric | Type | Values Range |
|---|---|---|
| number-of-tasks | input | 61 |
| employees-number | input | 1–7 |
| probability-of-delay | input | 0.0–0.9 |
| probability-of-advance | input | 0.0–0.9 |
| assigned-tasks-employee | input | 1–3 |
| step | output | 1–n |
| CPI | output | 0–n |
| CPI-Netlogo Sample | CPI-EVM Calculator Tool Sample | |
|---|---|---|
| Mean | 2.75497723 | 2.754977232 |
| Variance | 14.5634324 | 14.56343242 |
| Observations | 2100 | 2100 |
| Hypothesized mean difference | 0 | |
| df | 160 | |
| t stat | 0 | |
| P(T <= t) one-tail | 0.5 | |
| t critical one-tail | 1.6544329 | |
| P(T <= t) two-tail | 1 | |
| t critical two-tail | 1.97490156 |
| Assigned-Tasks-Employee | 1 | 2 | 3 |
|---|---|---|---|
| Employees-Number | |||
| 1 | 1.616634 | 1.633812 | 1.616834 |
| 2 | 1.633606 | 1.614470 | 1.628857 |
| 3 | 1.623663 | 1.637134 | 1.629288 |
| 4 | 1.625330 | 1.617751 | 1.602271 |
| 5 | 1.628319 | 1.573290 | 1.607234 |
| 6 | 1.616457 | 1.640380 | 1.613923 |
| 7 | 1.624135 | 1.612656 | 1.590358 |
| Probability-of-Advance | 0.000000 | 0.100000 | 0.200000 | 0.300000 | 0.400000 | 0.500000 | 0.600000 | 0.700000 | 0.800000 | 0.900000 |
|---|---|---|---|---|---|---|---|---|---|---|
| Employees-Number | ||||||||||
| 1 | 0.548008 | 0.609541 | 0.685730 | 0.783219 | 0.915103 | 1.106740 | 1.377564 | 1.846275 | 2.740608 | 5.611477 |
| 2 | 0.550267 | 0.607176 | 0.685457 | 0.787587 | 0.913403 | 1.104403 | 1.372748 | 1.817562 | 2.782771 | 5.635066 |
| 3 | 0.550096 | 0.612313 | 0.685667 | 0.787730 | 0.910915 | 1.101636 | 1.378627 | 1.841838 | 2.756855 | 5.674607 |
| 4 | 0.551275 | 0.609906 | 0.689134 | 0.788121 | 0.916298 | 1.103034 | 1.365377 | 1.839154 | 2.807393 | 5.481482 |
| 5 | 0.549912 | 0.610428 | 0.685860 | 0.779776 | 0.913223 | 1.111374 | 1.368596 | 1.828576 | 2.770266 | 5.411466 |
| 6 | 0.550164 | 0.610680 | 0.686776 | 0.785780 | 0.921015 | 1.104609 | 1.365208 | 1.859988 | 2.772758 | 5.578888 |
| 7 | 0.548133 | 0.611021 | 0.686966 | 0.785835 | 0.923714 | 1.109246 | 1.376516 | 1.819473 | 2.795025 | 5.434565 |
| Probability-of-Delay | 0.000000 | 0.100000 | 0.200000 | 0.300000 | 0.400000 | 0.500000 | 0.600000 | 0.700000 | 0.800000 | 0.900000 |
|---|---|---|---|---|---|---|---|---|---|---|
| Employees-Number | ||||||||||
| 1 | 2.923209 | 2.697309 | 2.356683 | 2.081919 | 1.788999 | 1.462714 | 1.165987 | 0.881181 | 0.575454 | 0.290812 |
| 2 | 2.986358 | 2.658718 | 2.394938 | 2.021872 | 1.749269 | 1.494834 | 1.172753 | 0.885583 | 0.597050 | 0.295065 |
| 3 | 2.993954 | 2.679616 | 2.397810 | 2.044512 | 1.760310 | 1.498649 | 1.168188 | 0.878099 | 0.584551 | 0.294594 |
| 4 | 2.953739 | 2.633249 | 2.347091 | 2.043536 | 1.743552 | 1.478904 | 1.176356 | 0.892230 | 0.587110 | 0.295405 |
| 5 | 2.950445 | 2.638388 | 2.290606 | 2.013881 | 1.761984 | 1.465932 | 1.158620 | 0.873110 | 0.583534 | 0.292974 |
| 6 | 3.003698 | 2.675100 | 2.340356 | 2.055888 | 1.762180 | 1.451223 | 1.187985 | 0.892449 | 0.576981 | 0.290005 |
| 7 | 2.896081 | 2.611585 | 2.321156 | 2.056459 | 1.793138 | 1.491311 | 1.171935 | 0.872740 | 0.581986 | 0.294104 |
| Probability-of-Advance | 0.000000 | 0.100000 | 0.200000 | 0.300000 | 0.400000 | 0.500000 | 0.600000 | 0.700000 | 0.800000 | 0.900000 |
|---|---|---|---|---|---|---|---|---|---|---|
| Assigned-Tasks-Employee | ||||||||||
| 1 | 0.550079 | 0.610386 | 0.686651 | 0.785175 | 0.915242 | 1.107459 | 1.374933 | 1.840992 | 2.750297 | 5.618992 |
| 2 | 0.549219 | 0.610502 | 0.688131 | 0.786606 | 0.916836 | 1.103004 | 1.370400 | 1.834234 | 2.794441 | 5.531616 |
| 3 | 0.549782 | 0.609569 | 0.684757 | 0.784525 | 0.916638 | 1.107127 | 1.370940 | 1.833146 | 2.780553 | 5.489771 |
| Probability-of-Delay | 0.000000 | 0.100000 | 0.200000 | 0.300000 | 0.400000 | 0.500000 | 0.600000 | 0.700000 | 0.800000 | 0.900000 |
|---|---|---|---|---|---|---|---|---|---|---|
| Assigned-Tasks-Employee | ||||||||||
| 1 | 2.978426 | 2.663062 | 2.362711 | 2.046665 | 1.772522 | 1.479867 | 1.173713 | 0.888923 | 0.580200 | 0.294114 |
| 2 | 2.988602 | 2.658812 | 2.314510 | 2.069138 | 1.740356 | 1.477683 | 1.173824 | 0.882516 | 0.585297 | 0.294250 |
| 3 | 2.907608 | 2.646968 | 2.372195 | 2.020511 | 1.784022 | 1.475407 | 1.167531 | 0.875158 | 0.585931 | 0.291476 |
| Probability-of-Advance | 0.000000 | 0.100000 | 0.200000 | 0.300000 | 0.400000 | 0.500000 | 0.600000 | 0.700000 | 0.800000 | 0.900000 |
|---|---|---|---|---|---|---|---|---|---|---|
| Probability-of-Delay | ||||||||||
| 0.000000 | 1.000000 | 1.108873 | 1.250670 | 1.424626 | 1.662969 | 2.030450 | 2.467776 | 3.331564 | 5.110659 | 10.194536 |
| 0.100000 | 0.901227 | 0.991782 | 1.126371 | 1.282113 | 1.493521 | 1.806010 | 2.257168 | 3.012464 | 4.621043 | 9.071108 |
| 0.200000 | 0.801303 | 0.891224 | 0.996478 | 1.148412 | 1.339701 | 1.606832 | 1.991850 | 2.699662 | 4.007647 | 8.014947 |
| 0.300000 | 0.697102 | 0.779057 | 0.873445 | 0.999431 | 1.166258 | 1.405789 | 1.750664 | 2.314024 | 3.465186 | 7.003424 |
| 0.400000 | 0.602836 | 0.666494 | 0.746477 | 0.857062 | 1.000851 | 1.202470 | 1.490557 | 1.995534 | 3.001171 | 6.092882 |
| 0.500000 | 0.497076 | 0.552568 | 0.622811 | 0.714094 | 0.830579 | 1.004919 | 1.256750 | 1.665710 | 2.559082 | 5.072936 |
| 0.600000 | 0.397853 | 0.445080 | 0.499436 | 0.571599 | 0.666491 | 0.806707 | 1.009625 | 1.332263 | 1.995027 | 3.992812 |
| 0.700000 | 0.301044 | 0.331156 | 0.373308 | 0.426633 | 0.499541 | 0.596892 | 0.754331 | 1.003200 | 1.497278 | 3.038604 |
| 0.800000 | 0.198708 | 0.224264 | 0.250335 | 0.287390 | 0.335720 | 0.399535 | 0.495143 | 0.672126 | 0.993766 | 1.981109 |
| 0.900000 | 0.099786 | 0.111024 | 0.125797 | 0.142994 | 0.166754 | 0.199028 | 0.247045 | 0.334692 | 0.500109 | 1.005570 |
| Search-Number | Evaluation | Employees-Number | Assigned-Tasks-Employee | Probability-of-Delay | Probability-of-Advance | Num-Replicates | Best-Fitness-so-Far |
|---|---|---|---|---|---|---|---|
| 1 | 500 | 6 | 2 | 0.2 | 0.9 | 10 | 8.125806944 |
| 2 | 500 | 5 | 1 | 0.2 | 0.9 | 10 | 7.92122959 |
| 3 | 500 | 3 | 1 | 0 | 0.6 | 10 | 2.571417207 |
| 4 | 500 | 3 | 2 | 0 | 0.9 | 10 | 10.18728451 |
| 5 | 500 | 4 | 1 | 0 | 0.9 | 10 | 10.35474418 |
| 6 | 500 | 1 | 3 | 0.4 | 0.9 | 10 | 5.902861442 |
| 7 | 500 | 1 | 2 | 0 | 0.8 | 10 | 5.015753468 |
| 8 | 500 | 7 | 3 | 0.3 | 0.9 | 10 | 6.719011184 |
| 9 | 500 | 5 | 3 | 0 | 0.9 | 10 | 10.22730573 |
| 10 | 500 | 3 | 1 | 0.3 | 0.9 | 10 | 6.764397903 |
| Search-Number | Evaluation | Employees-Number | Assigned-Tasks-Employee | Probability-of-Delay | Probability-of-Advance | Num-Replicates | Best-Fitness-so-Far |
|---|---|---|---|---|---|---|---|
| 1 | 500 | 7 | 2 | 0 | 0.7 | 10 | 163 |
| 2 | 500 | 6 | 2 | 0.2 | 0.1 | 10 | 223.6 |
| 3 | 500 | 4 | 3 | 0 | 0.9 | 10 | 180 |
| 4 | 500 | 5 | 2 | 0 | 0.6 | 10 | 198 |
| 5 | 500 | 7 | 3 | 0 | 0.1 | 10 | 146 |
| 6 | 500 | 6 | 3 | 0 | 0.2 | 10 | 155 |
| 7 | 500 | 6 | 3 | 0 | 0.3 | 10 | 155 |
| 8 | 500 | 5 | 3 | 0 | 0.1 | 10 | 163 |
| 9 | 500 | 6 | 2 | 0.1 | 0.7 | 10 | 197.5 |
| 10 | 490 | 6 | 3 | 0 | 0.5 | 10 | 155 |
Disclaimer/Publisher’s Note: The statements, opinions and data contained in all publications are solely those of the individual author(s) and contributor(s) and not of MDPI and/or the editor(s). MDPI and/or the editor(s) disclaim responsibility for any injury to people or property resulting from any ideas, methods, instructions or products referred to in the content. |
© 2023 by the authors. Licensee MDPI, Basel, Switzerland. This article is an open access article distributed under the terms and conditions of the Creative Commons Attribution (CC BY) license (https://creativecommons.org/licenses/by/4.0/).
Share and Cite
Castañón-Puga, M.; Rosales-Cisneros, R.F.; Acosta-Prado, J.C.; Tirado-Ramos, A.; Khatchikian, C.; Aburto-Camacllanqui, E. Earned Value Management Agent-Based Simulation Model. Systems 2023, 11, 86. https://doi.org/10.3390/systems11020086
Castañón-Puga M, Rosales-Cisneros RF, Acosta-Prado JC, Tirado-Ramos A, Khatchikian C, Aburto-Camacllanqui E. Earned Value Management Agent-Based Simulation Model. Systems. 2023; 11(2):86. https://doi.org/10.3390/systems11020086
Chicago/Turabian StyleCastañón-Puga, Manuel, Ricardo Fernando Rosales-Cisneros, Julio César Acosta-Prado, Alfredo Tirado-Ramos, Camilo Khatchikian, and Elías Aburto-Camacllanqui. 2023. "Earned Value Management Agent-Based Simulation Model" Systems 11, no. 2: 86. https://doi.org/10.3390/systems11020086