1. Introduction
Urban water systems (UWS) are a valuable part of public infrastructures, providing a vital service of supplying potable water for society in quantity and quality [
1]. These systems are composed of a large number of assets of different types (e.g., pipes, pumps, valves). Many UWS are currently facing high degradation levels of their assets due to normal deterioration processes (e.g., degradation of materials with time) and non-controlled processes (e.g., poor-quality production of pipes, external actions such as construction works), which results in high water losses levels, frequent pipe bursts and significant energy efficiency problems [
2].
Infrastructure asset management (IAM) is essential for water utilities to efficiently manage their large variety of physical assets. Several concepts and methodologies for IAM may be found in the bibliography [
2,
3,
4,
5,
6,
7,
8,
9,
10]. Nowadays, infrastructure managers adopt proactive and preventive maintenance to reduce disturbance to urban life and the environment and to minimize life cycle costs [
11,
12].
Data on UWS assets are of utmost importance, since many of them are buried, and their condition assessment must be based on accurate information [
13,
14,
15]. Condition assessment aims to identify the anomalies or signs of the existence of problems in a timely fashion [
16]. The identification of these problems can be carried out based on the analysis of the records of past events and on other relevant collected data. These data may be grouped into five main categories: (i) cadastral, (ii) functional and physical conditions, (iii) operation and maintenance, (iv) inflows and outflows and (v) billing and account information. These data are usually collected, stored, managed and analysed using information systems (IS) that are often dispersed in different divisions of the utility [
17,
18]. As a result, IAM is data-intensive and ends up using a plethora of dispersed and, sometimes, incoherent data [
19].
Efficient and effective IAM requires that data are gathered and stored in a single platform in order to help water utilities to address their operational and infrastructural problems related to asset ageing, non-revenue water, water stress and scarcity, variability of hydrologic events, etc. [
20,
21]. A method to combine data and information is by integration and/or interoperability. Data integration refers to the process of combining several originally disconnected sources of information. The traditional approach to data integration involves physically moving data from its source system to a staging area where cleansing, mapping and transformation take place before physically moving the data to its target system. A common technique is Extract, Transform and Load (ETL), where data is physically extracted from multiple source systems, transformed into a different format and loaded into a centralized data store. The transformation into a common structure and loading into a new data store when using ETL includes the elimination of inconsistencies that may result from the process [
22]. Data integration is important to enable cross-functional processes as well as to provide quality analysis of asset condition assessment. Interoperability refers to the ability of an IS to connect and communicate with another IS, even when created by different developers. When systems are interoperable, not only can they share information but also interpret the received data and present data in the original form. Interoperability brings together various systems and contributes to functional and organizational integration [
18]. Since data and information management is a challenging task in urban water systems and given the large amount of assets and data involved, new tools and processes are needed to collect, gather, manage, analyse and use asset data.
Integrating the multiple, and often conflicting, sources of information available on the infrastructure, including those related to asset condition, system performance and the various predictive analyses, is a major challenge to asset managers, particularly in water utilities with a lower technological maturity level. Several solutions [
23,
24,
25] have been developed to solve the data integration and analytics problem in water utilities. The development of the proposed solution may start within the utility itself, which has the necessary human, financial and technological resources to develop a system tailored to its needs, or through the acquisition of a commercial software solution. In many utilities, the lack of human resources and their vulnerability to commercial pressures are often the basis for reactively acquiring solutions (e.g., miraculous software packages that solve all the UWS problems), thus lacking long-term planning for the use of the acquired software. Therefore, the complete IS capabilities are usually not fully explored, since they are acquired due only to a set of functionalities. It is essential for an efficient IAM to integrate collected data in a single platform that is linked with several operational tools, rather than having a scattered set of tools to meet specific goals.
In recent years, several advances have been made regarding digitalisation in the water sector worldwide, increasing the use of real-time data, such as water and energy balance calculation, system performance assessment, hydraulic modelling, and complex Artificial Intelligence (AI) techniques to predict demand and to locate anomalous events. Nonetheless, according to the European Research Executive Agency, the main challenges currently remain in the standardisation, the interoperability and in the fragmentation of the key actors and regulatory policies [
26]. Okoro et al. [
19] reported that the main barriers preventing water utilities from adopting new data models are still data availability and interoperability between existing data models. In many European utilities, especially those of small to medium size, the IAM manager has a hard task every time he needs to assess the system performance, since data must be collected from different departments within the water utility in a coordinated procedure.
This paper shares with the scientific community the main difficulties encountered and learnings of the R&D project DECIdE, funded by the Portuguese National Funding Agency for Science and Technology (FCT). This project aimed at the development of a platform for infrastructure asset management tailored to small to medium-sized water utilities which integrate datasets from existing IS to support decision-making on UWS. The project had a duration of 18 months and included the participation of five Portuguese water utilities with different technological maturity levels. Although most datasets had few or unavailable data, the implemented solution was an inclusive platform in which both simple and complex analyses can be conducted depending on available data. The main functionalities are demonstrated using two case studies taken from participating water utilities with different technological maturity levels, allowing discussion of the limitations of the analysis in each case.
2. Platform Prototyping
2.1. Requirements Analysis
The analysis of the platform prototype requirements was performed with the deep involvement of end-users to identify their expectations and to define software functionalities (i.e., capabilities, usability, inputs and outputs). A workshop was held at the beginning of the project, with the participation of the research institutions and the five water utilities (i.e., end-users). The main requirement was that the platform should be able to integrate data that are already collected and allow the automatic calculation of a set of performance indicators relevant to IAM and, also, are required for the annual reporting to the water and wastewater authority (ERSAR). These performance indicators require specific input data, including metered water volumes, system characteristics and financial data, amongst others. A set of 16 performance indicators was implemented in the platform (see
Table 1). These indicators were grouped into four main categories (infrastructural, environmental, economic sustainability and quality of service) and can be used to assess the performance of the system as a whole, or at subsystems or district metering area (DMA) levels; the performance assessment can be compared at the subsystem or DMA level, in order to develop rehabilitation or intervention plans.
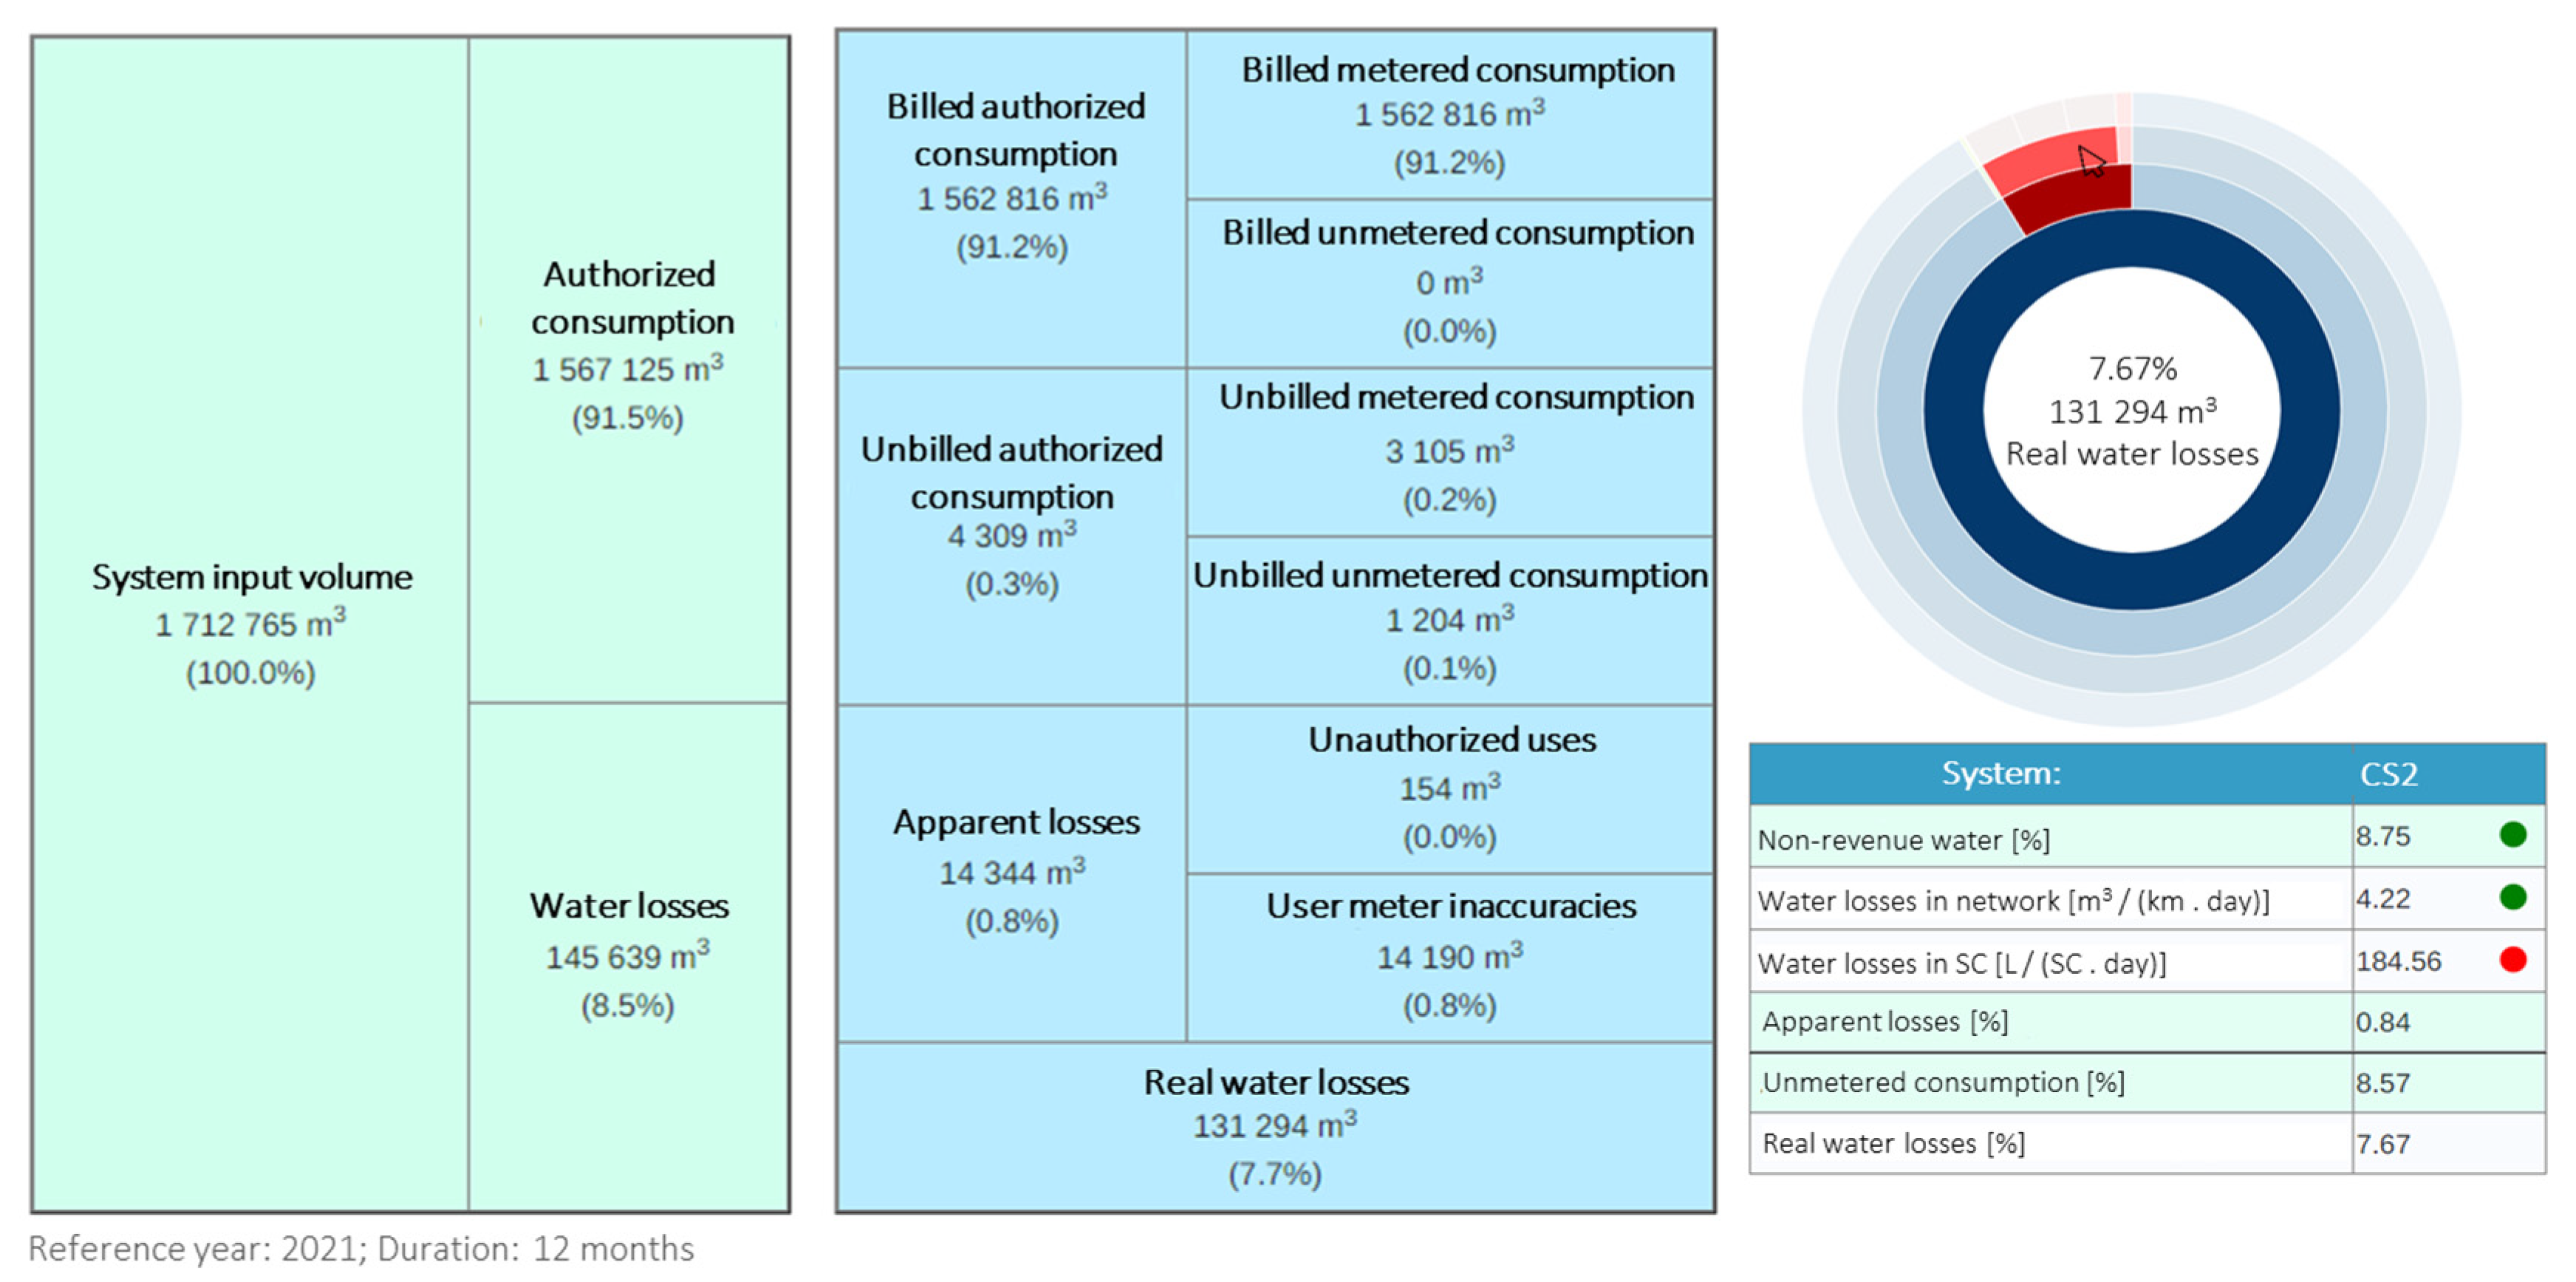
The calculation of performance indicators required also the implementation of additional tools. Two of these tools are the water and the energy balances. The implemented water balance follows the approach of Alegre et al. [
27] (
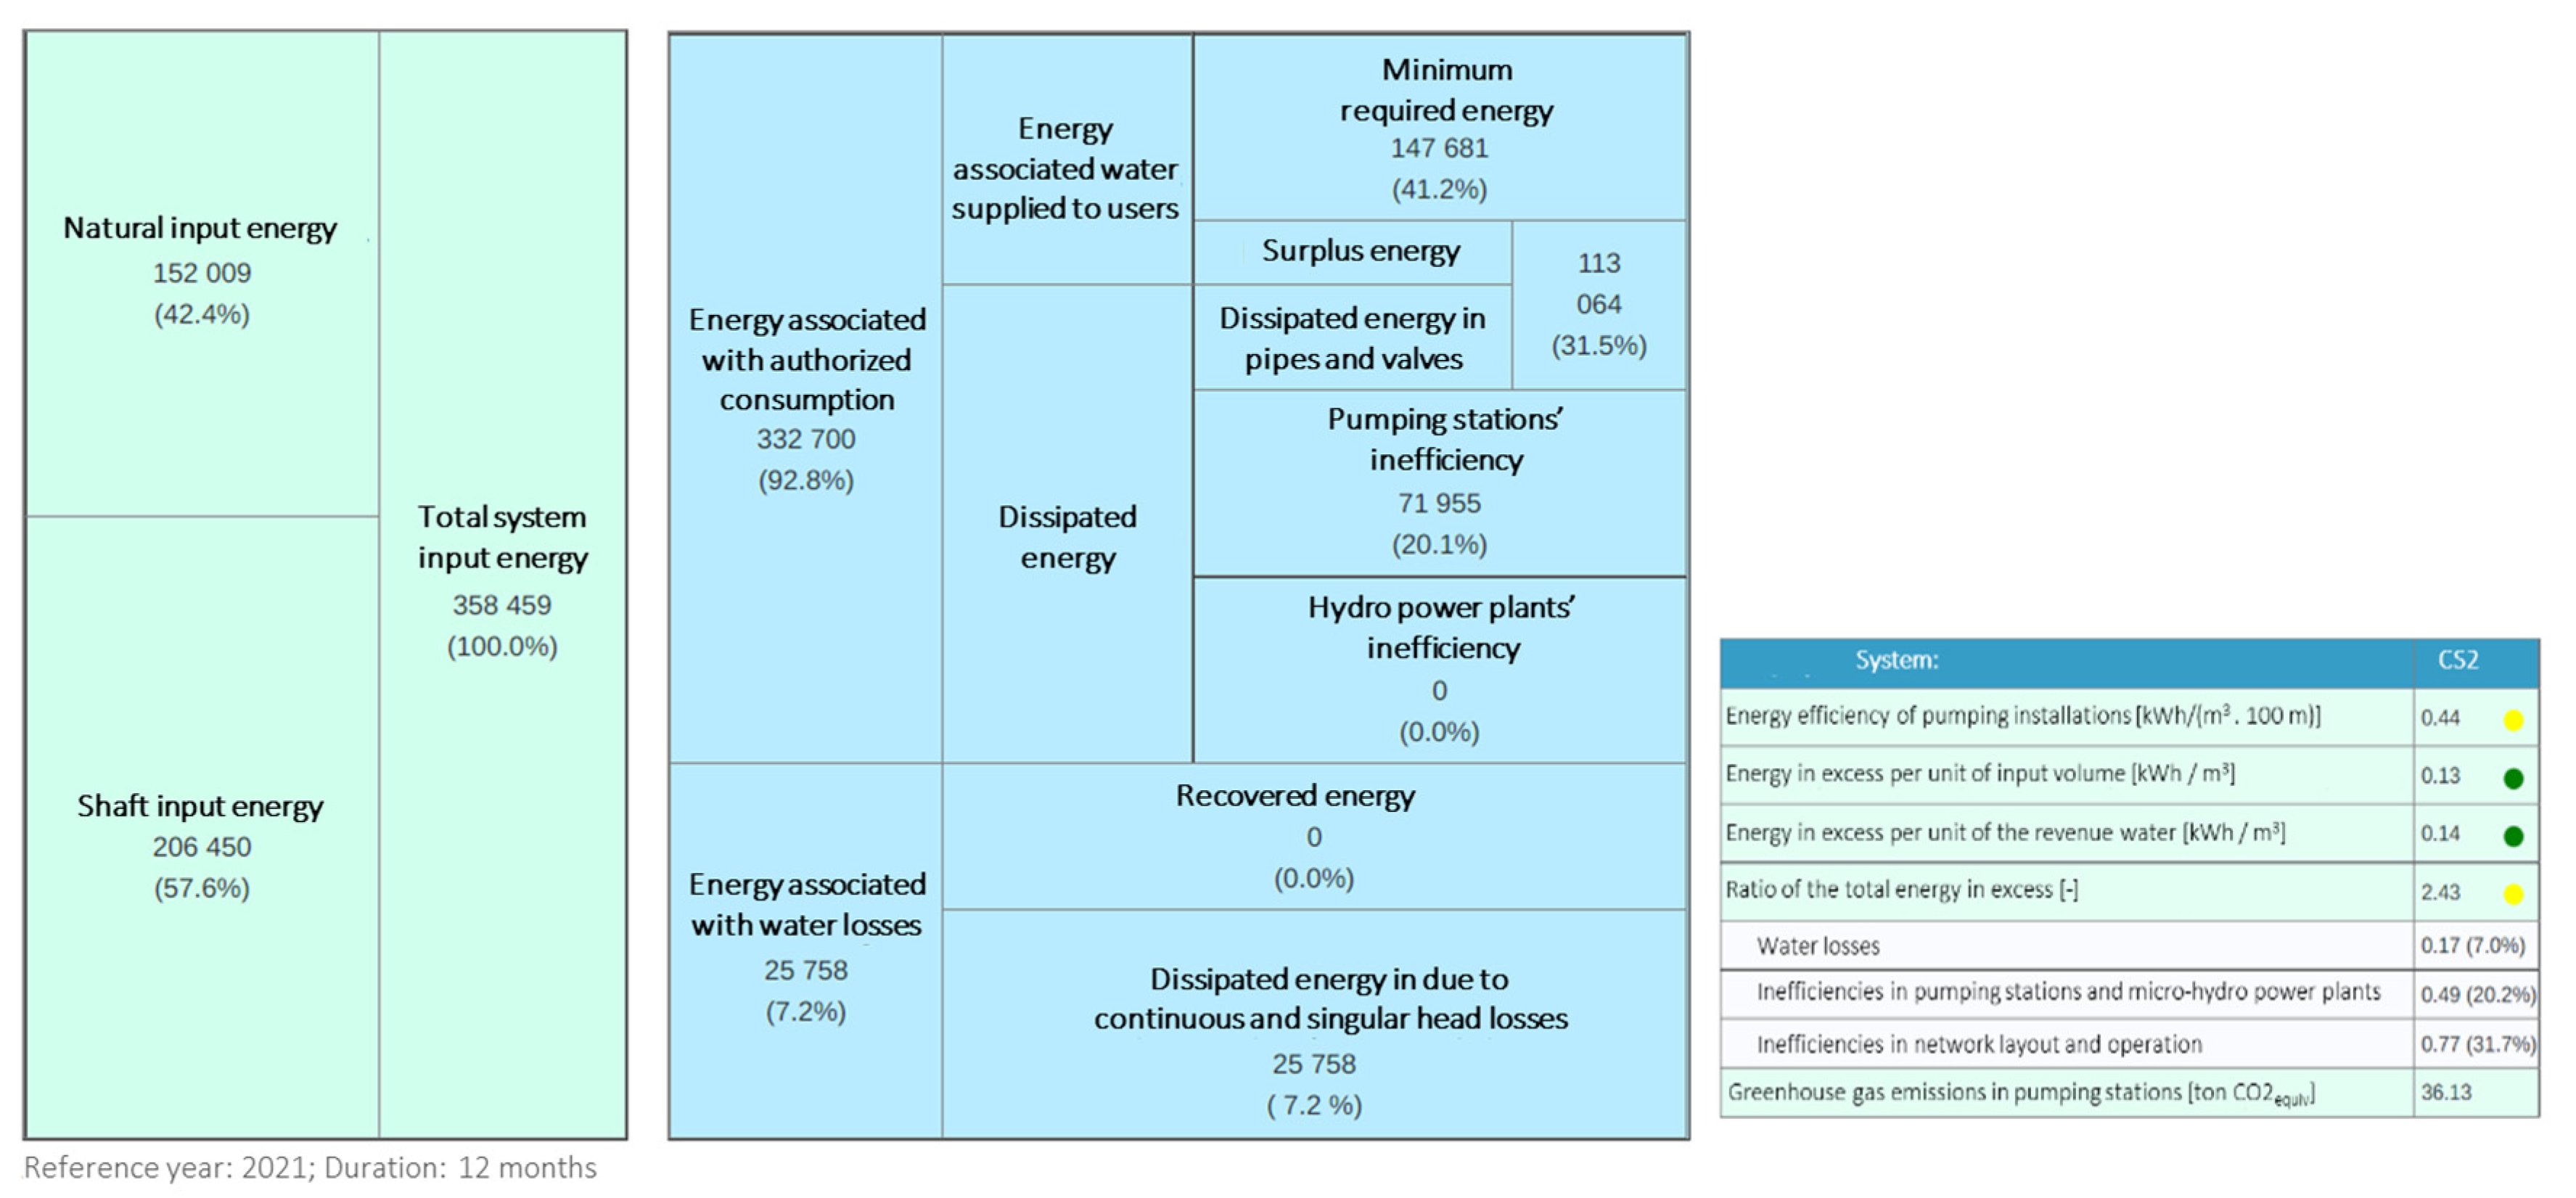
Table 2), whereas the implemented energy balance was proposed by Mamade et al. [
28] (
Table 3). The energy balance tool allows performance of two different approaches according to available data: (1) a simplified assessment that requires minimum data and no hydraulic simulations, providing a global overview of the main components of energy consumption in the system and which can be applied to the global system or at the subsystem or DMA level; and (2) a complete assessment that is more data-demanding and requires a calibrated hydraulic model of the network, providing a detailed assessment of energy consumption in each energy balance component.
Another important tool implemented in the platform is the capital cost calculation tool, necessary for the computation of the infrastructure value index (IVI). IVI is the ratio between the current (fair) value of infrastructure and the replacement cost on a modern equivalent asset basis. IVI can be calculated following an asset-oriented or a system-oriented approach [
29]. IVI calculation in the asset-oriented approach is based on the useful life of each asset, on depreciation curves and on replacement costs for each type of asset, whereas, in the service-oriented approach, IVI calculation is based on the performance of functional units of the infrastructure [
30].
Different data are needed to compute the performance indicators depicted in
Table 1, namely, geographical, and physical data (e.g., identification, type, location, dimensions, material), operational and maintenance data (e.g., dates, location) and billing and accounting data (e.g., revenue, replacement costs). Thus, a characterization of the information systems existing in the five water utilities was performed [
17]. This characterization allowed a better understanding of the technological maturity level of each utility, as well as of existing data standards and workflow processes. In summary, this characterization showed that:
The use of GIS is generalized, although with different implementation degrees.
The use of ERP and CRM systems to manage and store commercial and accounting data is generalized.
Only two water utilities use an IS to store Service Work Orders, whereas the other utilities still use paper records to register and store this type of data.
The use of SCADA systems is not generalized and is mostly used to monitor the input water volumes or flow rates.
2.2. Platform Conceptualization and Architecture
Integrating data and information from several utilities is a challenging task since utilities have distinct technological maturity levels and workflows. A data integration system’s goal is to provide uniform access to a set of data sources that may be distributed across different computer systems. To create such systems, some relevant factors must be considered [
31]:
▪ Heterogeneity: A typical data integration scenario involves data sources that were developed independently of one another.
▪ Autonomy: Data sources do not always belong to a single entity. Keeping this in mind, it should not be assumed that the data can be accessed whenever needed.
▪ Number of sources: Integrating data sources is a challenge that becomes more complex as the number of data sources to be integrated grows.
▪ Search: When a search is conducted in an integrated system, it is necessary to define appropriate queries.
To address the above-mentioned heterogeneity, autonomy and research issues, the data must be made available in a standardised manner by all parties, allowing uniform access to data across IS. For data integration, various architectures are available, the two most popular architectures being the Data Lake and Data Warehouse.
A Data Lake is defined as “a methodology enabled by a massive data repository based on low-cost technologies that improves the capture, refinement, archival, and exploration of raw data within an enterprise” [
32]. The basic concept of data lake is straightforward: all data generated by the organisation will be stored in a single data structure known as a data lake. Data will be stored in the lake in their original format, remaining in its sources but not necessarily in one location, and accessed as needed at query time. Once data is placed in the lake, it is accessible to everyone in the organisation for analysis.
Similarly, a Data Warehouse is also a repository for business data. However, unlike a data lake, only highly structured and unified data lives in a data warehouse to support specific business intelligence and analytics needs. In the warehouse, data from individual data sources are structured based on a single piece of physical data and it is possible to request these data using queries. Despite differences in their approaches, both architectures share challenges related to data integration [
32]. A cloud data warehouse is a database stored as a managed service in a public cloud and optimised for scalable business intelligence and analytics. Data warehouses offer three major advantages:
Little or no data pre-processing is needed, making it far easier for analysts and business users to access and analyse this data.
Accurate and complete data are more quickly available, in order that businesses can more quickly turn information into insight.
Unified, harmonized data offers a single source of truth, building trust in data insights and decision-making across business lines.
The selection of the integration method is of utmost importance as several features or analysis techniques depend on the data upload and update regularity. Considering the available technology and state-of-the-art techniques, the integration module could have been developed as a continuous connection between utility’s IS databases and the platform databases (i.e., remote database access), or through a raw data file submission and setup module (i.e., manual raw data file upload and semi-automatic mapping between database attributes). Although the first option could lead to a better platform usability, as data is constantly and automatically uploaded and updated, it requires initial setup and continuous assistance by a utility’s IT technician. It was concluded that remote database access could not be adopted in the short term due to the unavailability of IT technicians in most utilities. Thus, the prototype platform had to meet the technological limitations or advances of each participating water utility and overcome the challenges of how to integrate the required data from different IS, data model structures and ontologies into a common platform for all water utilities [
17].
Accordingly, the choice was to use a data warehouse, since it allows an easier access to water utilities data and its analysis. The task of unifying and harmonising data from various sources is one of the most difficult aspects of developing a data warehouse. Before loading and parsing data from sources, a mediated schema must be created. It is necessary to verify if data from different sources uses the same names to represent the same concepts representing objects in the water utility and build a data dictionary with this main vocabulary. Different approaches can be used to define this schema. One of the possibilities is building an ontology. An ontology is a formal language-defined set of concepts and relationships about a subject. Ontologies concentrate on meaning and use an inference engine to reason.
A web-based application on cloud services was chosen as the most adequate platform architecture, since it allows universal availability using web-connected devices (as no further requirement than a web browser is needed to use the platform) and it has easier maintenance and update by the platform development. The platform was implemented using Django, a free and open-source Python Web framework, to obtain a quickly-developed, scalable and secure platform. The client application on the front end of the framework uses the D3 JS library and Bokeh. These solutions offer a wide range of possibilities for defining the specific visualization that was needed to represent the water and energy balances as well as the dashboard components that represent the performance indicators. An application programming interface (API) was developed to provide access to the database by the front-end application. Additionally, the platform offers a set of directly accessible services as the API may be consulted by other applications if authenticated. Docker technology was used for developing, shipping and running several applications (i.e., API, frontend and database). Two Docker containers were created: the first container comprises the frontend and backend applications while the second container includes the Database Management System (DBMS) and the database. Thus, it is possible to independently update the frontend or backend application and database.
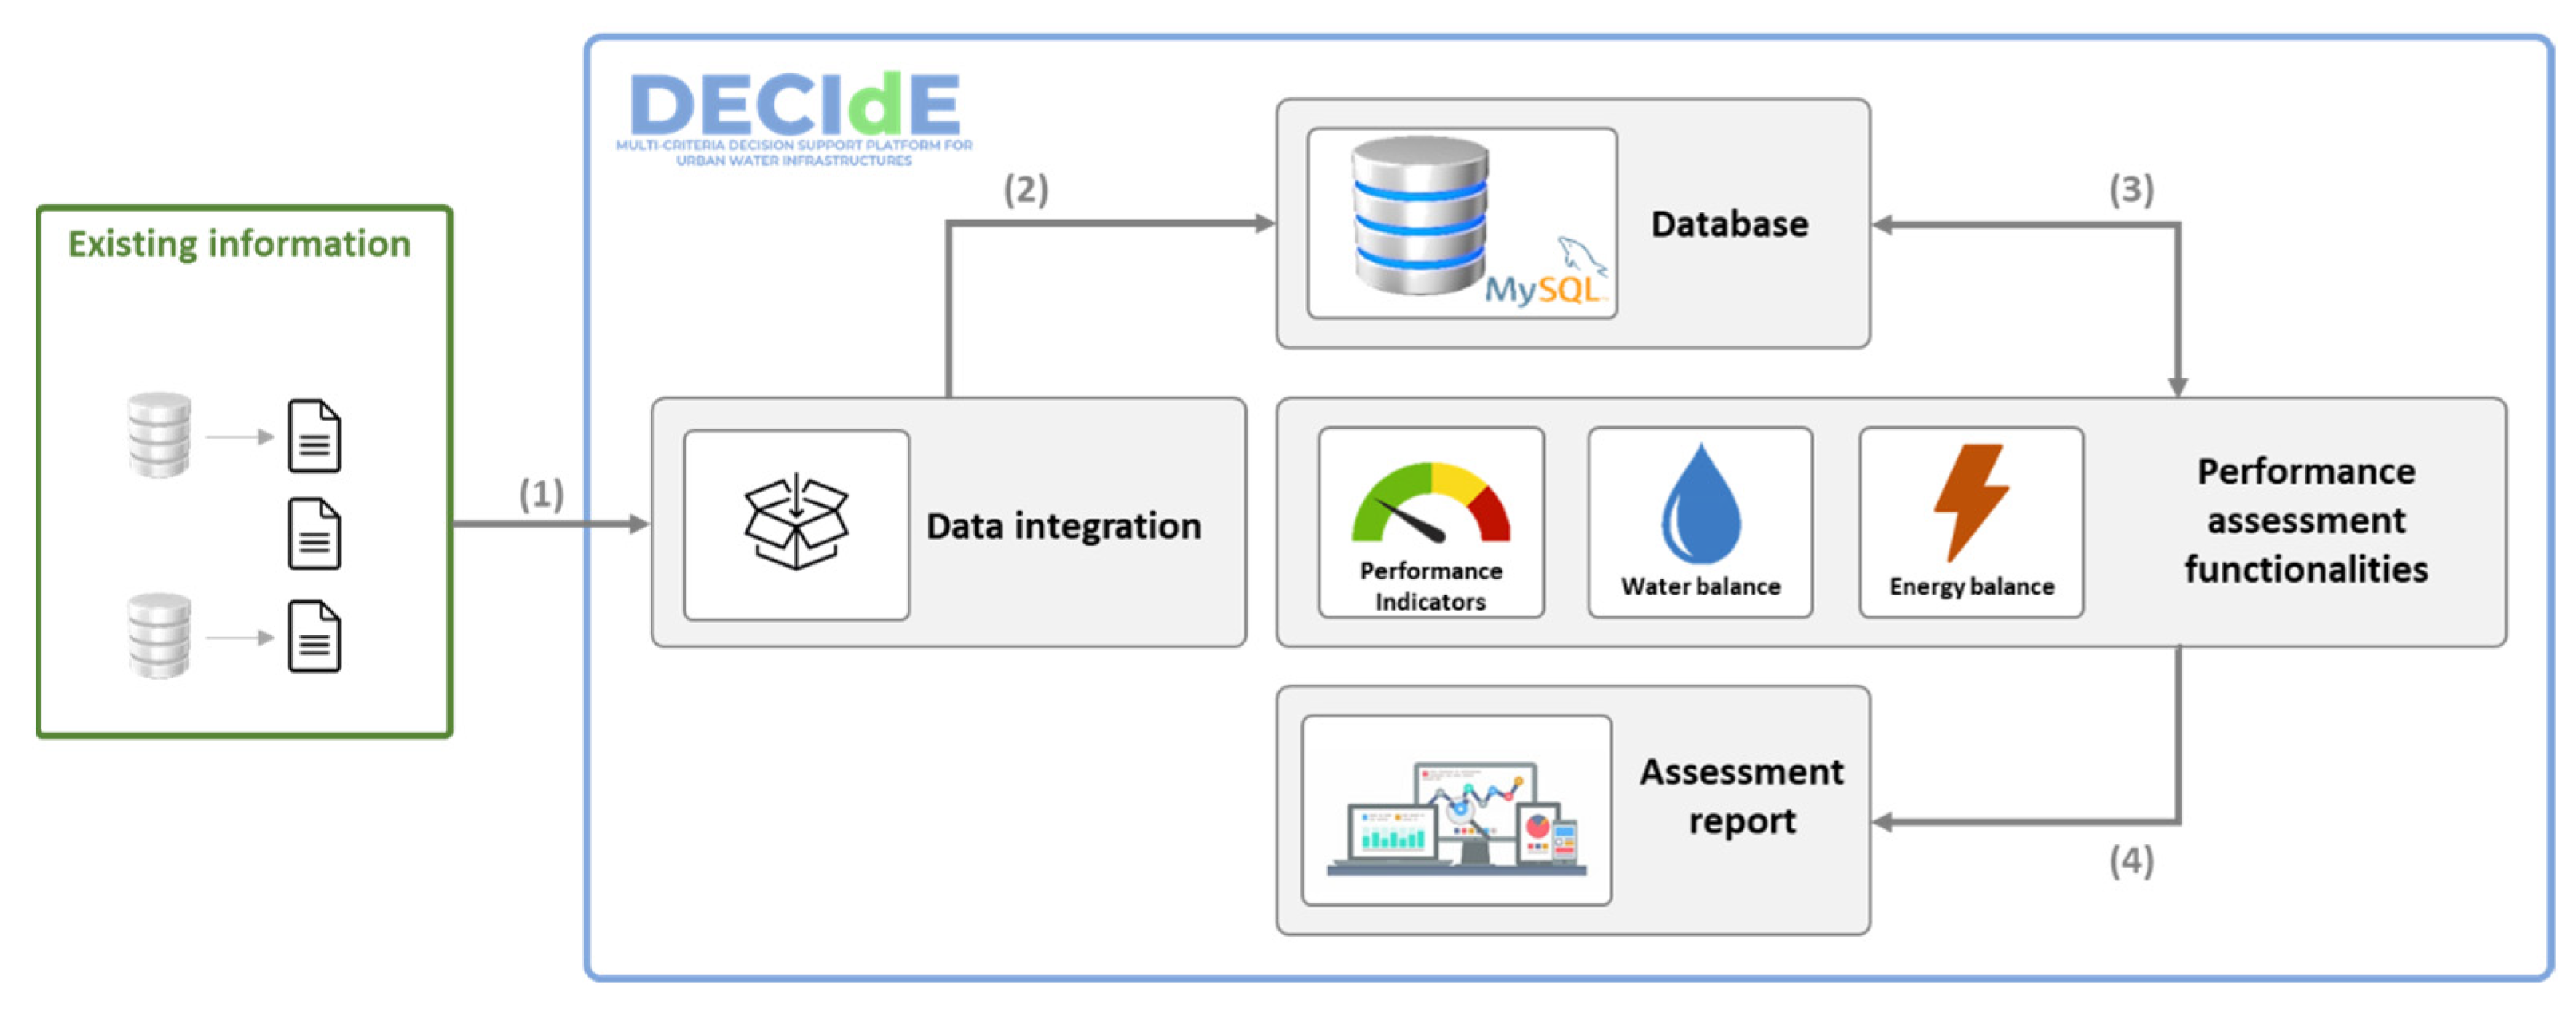
Figure 1 shows the flow of platform usage. Initially, the platform database has no data. The first step in the use of the platform is the import of raw data files from existing information sources. To this end, existing information is uploaded to the data integration module by the user (1). Data is inserted into the platform database (2), After file import and parsing, the performance assessment functionalities access the necessary data (in the database) through queries using the provided API which, in turn, returns the necessary data (3). Once the assessment is completed, a report is provided to the user with the obtained results (4).
The platform has also been developed allowing the future integration of real-time data from sensors installed in water distribution networks, such as pressure and flow rate, which need to be stored in adequate database solutions. Potential uses for these time series can be in the detection and location of anomalous events (e.g., pipe burst) using AI techniques: machine learning, deep learning, and optimization algorithms.
2.3. Data Modelling and Import
The different technological maturity levels of the participating water utilities are greatly reflected in the IS used and the available data. Therefore, the first challenge to overcome was to design a domain model that could represent all the necessary concepts for performance assessment based on the available data from different utilities. Due to the heterogeneity of IS and the data models used by these utilities, an ontology-based domain-driven design was followed.
Table 4 presents the designed domain model with the required attributes to import the different types of assets considered. MySQL was selected as a DBMS solution after its efficiency was studied at a later stage due to the short duration of the project and the lack of human resources. Although this solution may be adequate for the aim of the project, it may not be the best solution in the medium to long term due to the expected increase in the amount of data (in particular the real-time data from the sensors). In this case, other types of database technology may be more efficient, such as document-oriented databases, graph databases, or even hybrid solutions. However, the study on the efficiency of various DBMS solutions is beyond the scope of this paper.
The platform supports the upload of incomplete data (i.e., missing fields in files due to confidential data and fields with incorrect records), though limiting the platform outcomes. Furthermore, the data model is prepared to maintain a history of the infrastructure and other time-dependent data. When updating such data, the previous record is time-stamped and kept in the database, allowing for analysis of its evolution.
Two options were considered to import and update data into the platform: (1) automatic connection to the IS databases and (2) using a raw submission file import module. Ideally, the platform should directly connect through a web service to each IS to collect the data to be integrated. This option would improve platform usability because data would be uploaded and updated on a regular and automatic basis. Nonetheless, this requires an initial setup and regular maintenance to be conducted by a utility IT specialist. Additionally, the General Data Protection Regulation (GDPR) may impose some restrictions regarding the access of third-party software (such as the platform) to sensitive data. It was concluded that remote database access solutions could not be adopted in the short term due to the unavailability of utility IT specialists at most utilities. As such, a compromised solution based on a raw data file submission and a data integration module was considered and implemented, since it is comprehensive and allows the platform to be used by all utilities. A common interface was developed to parse the uploaded files, by identifying the related data model elements, tables and formats to target.
During the file submission for data integration, an initial mapping is needed between data model elements and file content attributes. Additionally, and for some data model elements, a second mapping is required between the options considered in the specific data model element and the file content attribute. For instance, the meter status is considered as “1” for active status in the database of the platform. However, the file content can have a different record such as “On”, “Active” or “In Service”.
Measurements can be assigned once the infrastructural elements have been imported. In most utilities, the billing system is the most common method to obtain water consumption measurements, which in the best-case scenario are recorded monthly. After metres associated with billing are imported, aggregated monthly measurements can be associated with some assets (e.g., storage tanks, abstractions, pumping stations and delivery points). It is assumed that aggregated volumes were validated by a validation process. A template spreadsheet can be downloaded from the platform by selecting the period and the type of infrastructure measurements to upload or update. After filling in the measurements in the template spreadsheet, they should be uploaded to the platform. In the second phase, the inclusion of a model is expected to automatically validate and generate aggregated volumes from SCADA records. Additionally, some additional data may be manually inserted for complementary information, such as the reference elevation in the simplified energy balance.
2.4. Implemented Tools
Three tools for the performance assessment analysis in a user-defined period of analysis (e.g., 12 months) were developed: the performance assessment; the water balance; and the energy balance. Sectoral analysis at the subsystem level is also possible, allowing the comparison of results between subsystems. The platform includes different types of information representation, namely, pie, bar and bullet charts and tabular forms. This information can be exported as an image in PNG file format to be included in reports.
The water balance was implemented according to the IWA standard methodology as described in
Section 2. Most Portuguese water utilities do not have hydraulic models, thus, at this stage, only the simplified version of the energy balance was implemented.
The water and energy balances modules allow the assessment of water and energy consumptions along the system, contributing to reducing water losses and energy costs. These balances rely on different data (e.g., input volumes and energy consumption, billed and unbilled consumptions, elevations), which are usually spread over several IS. After these balances are calculated for network sectors, the utility manager’s data collection and management responsibilities can become overwhelming. As such, and upon the selection of a given area of analysis in a defined period, the required data for the balances are prepared by querying the database. For the chosen period, the assets within the area of analysis are collected and the respective measurements are summed to provide the total volumes. The user should validate and may change the calculated/suggested input values.
From the 16 performance indicators presented in
Table 1, the infrastructure value index was not implemented. The main reason for this decision was the difficulty of collecting the financial data necessary to determine the current value of infrastructure and the replacement cost on a modern equivalent asset basis. Thus, the performance assessment module incorporates 15 of the 16 indicators. Associated with the water and energy balances, some additional performance indicators were included (e.g., CO
2 gas emissions due to pumping stations, measured as tonnes of CO
2 equivalent).
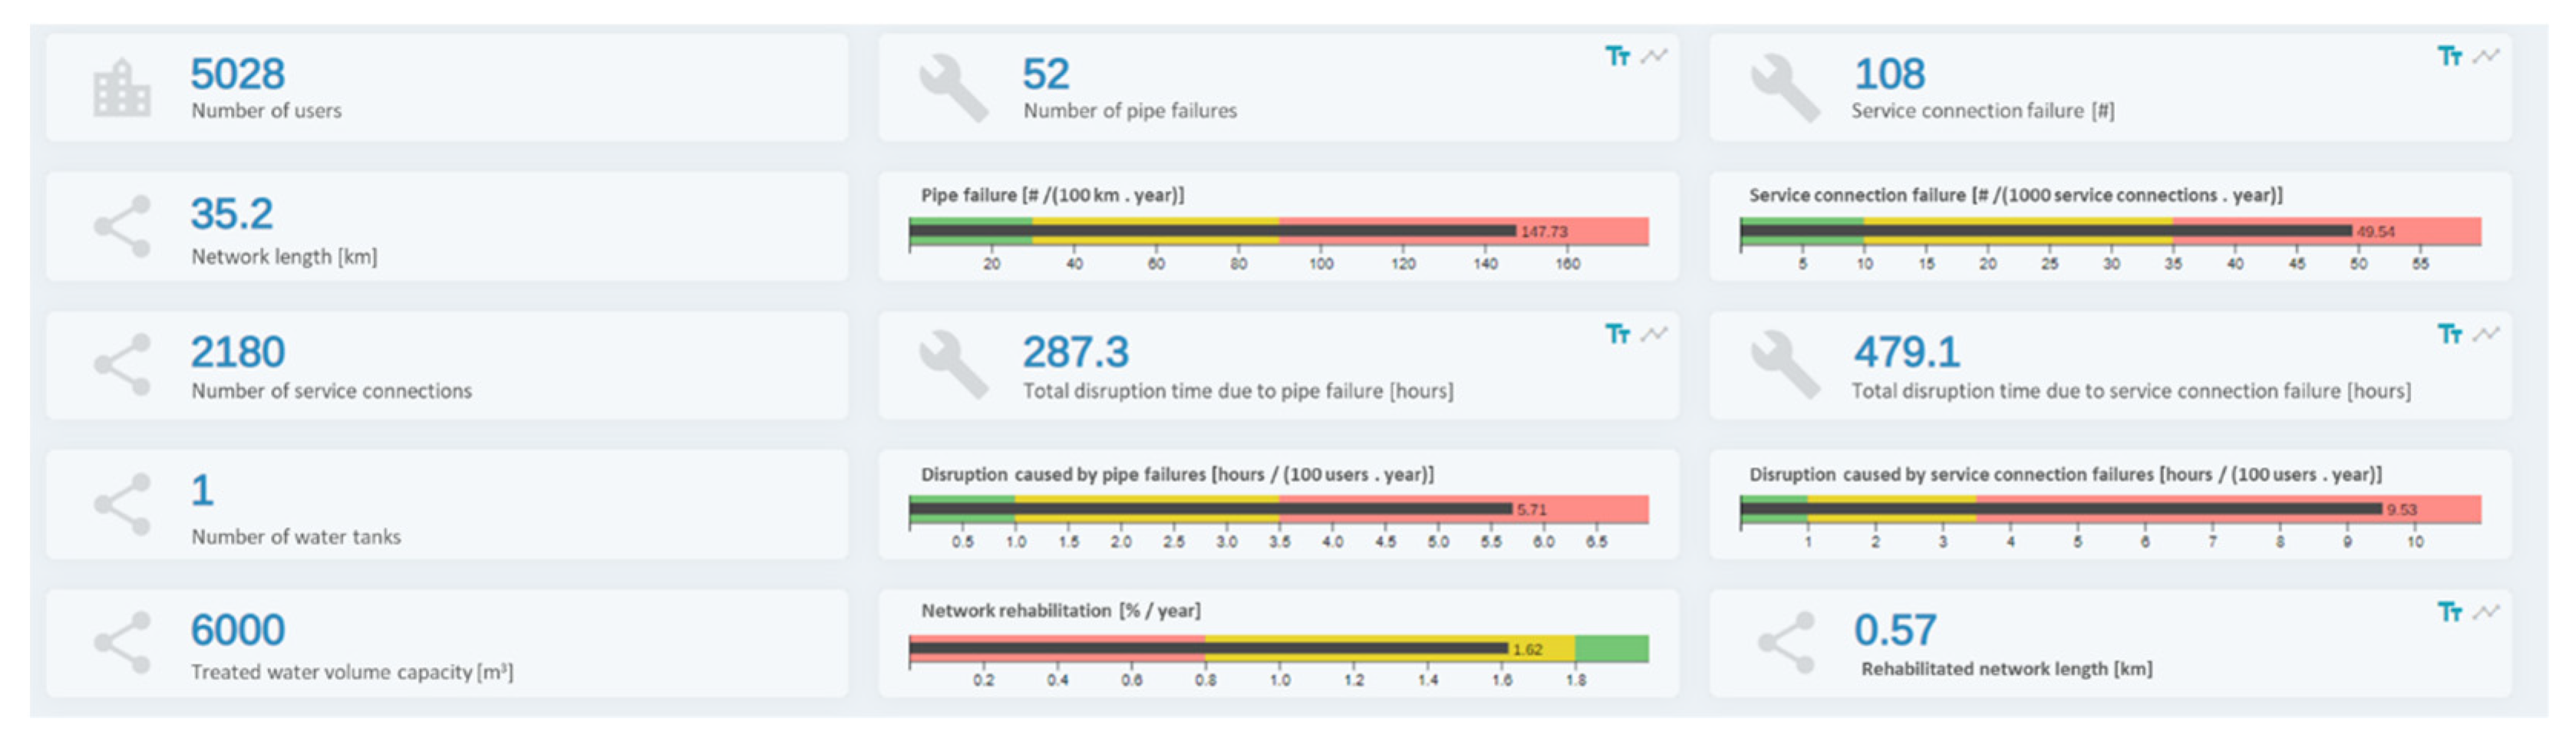
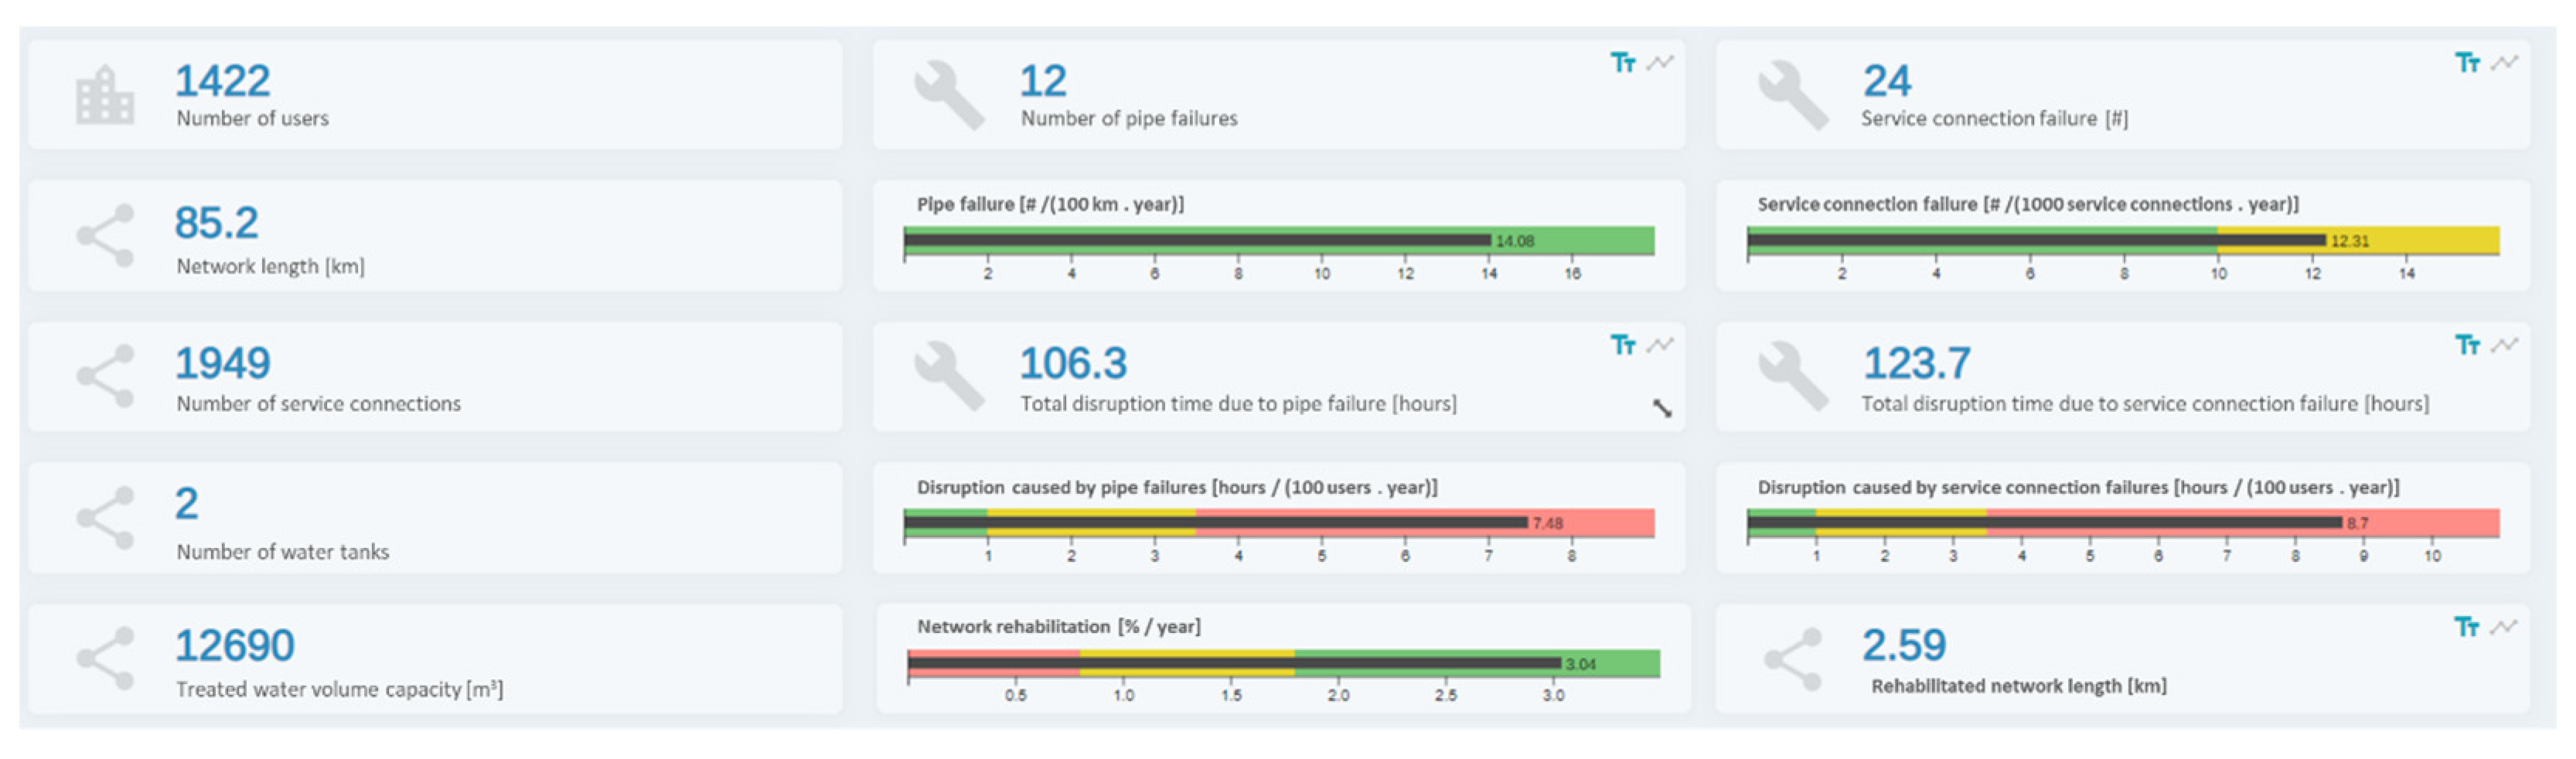
The graphical visualization of these performance indicators was challenging, especially for allowing comparisons between areas of analysis. As such, a dashboard was developed in which the user may select the single or multiple areas to analyse (e.g., subsystems or DMAs) as well as the period of analysis. The required data to calculate all the performance indicators is automatically fetched from the database and each indicator is presented in a customized chart, in which different filters and types of representation may be applied.
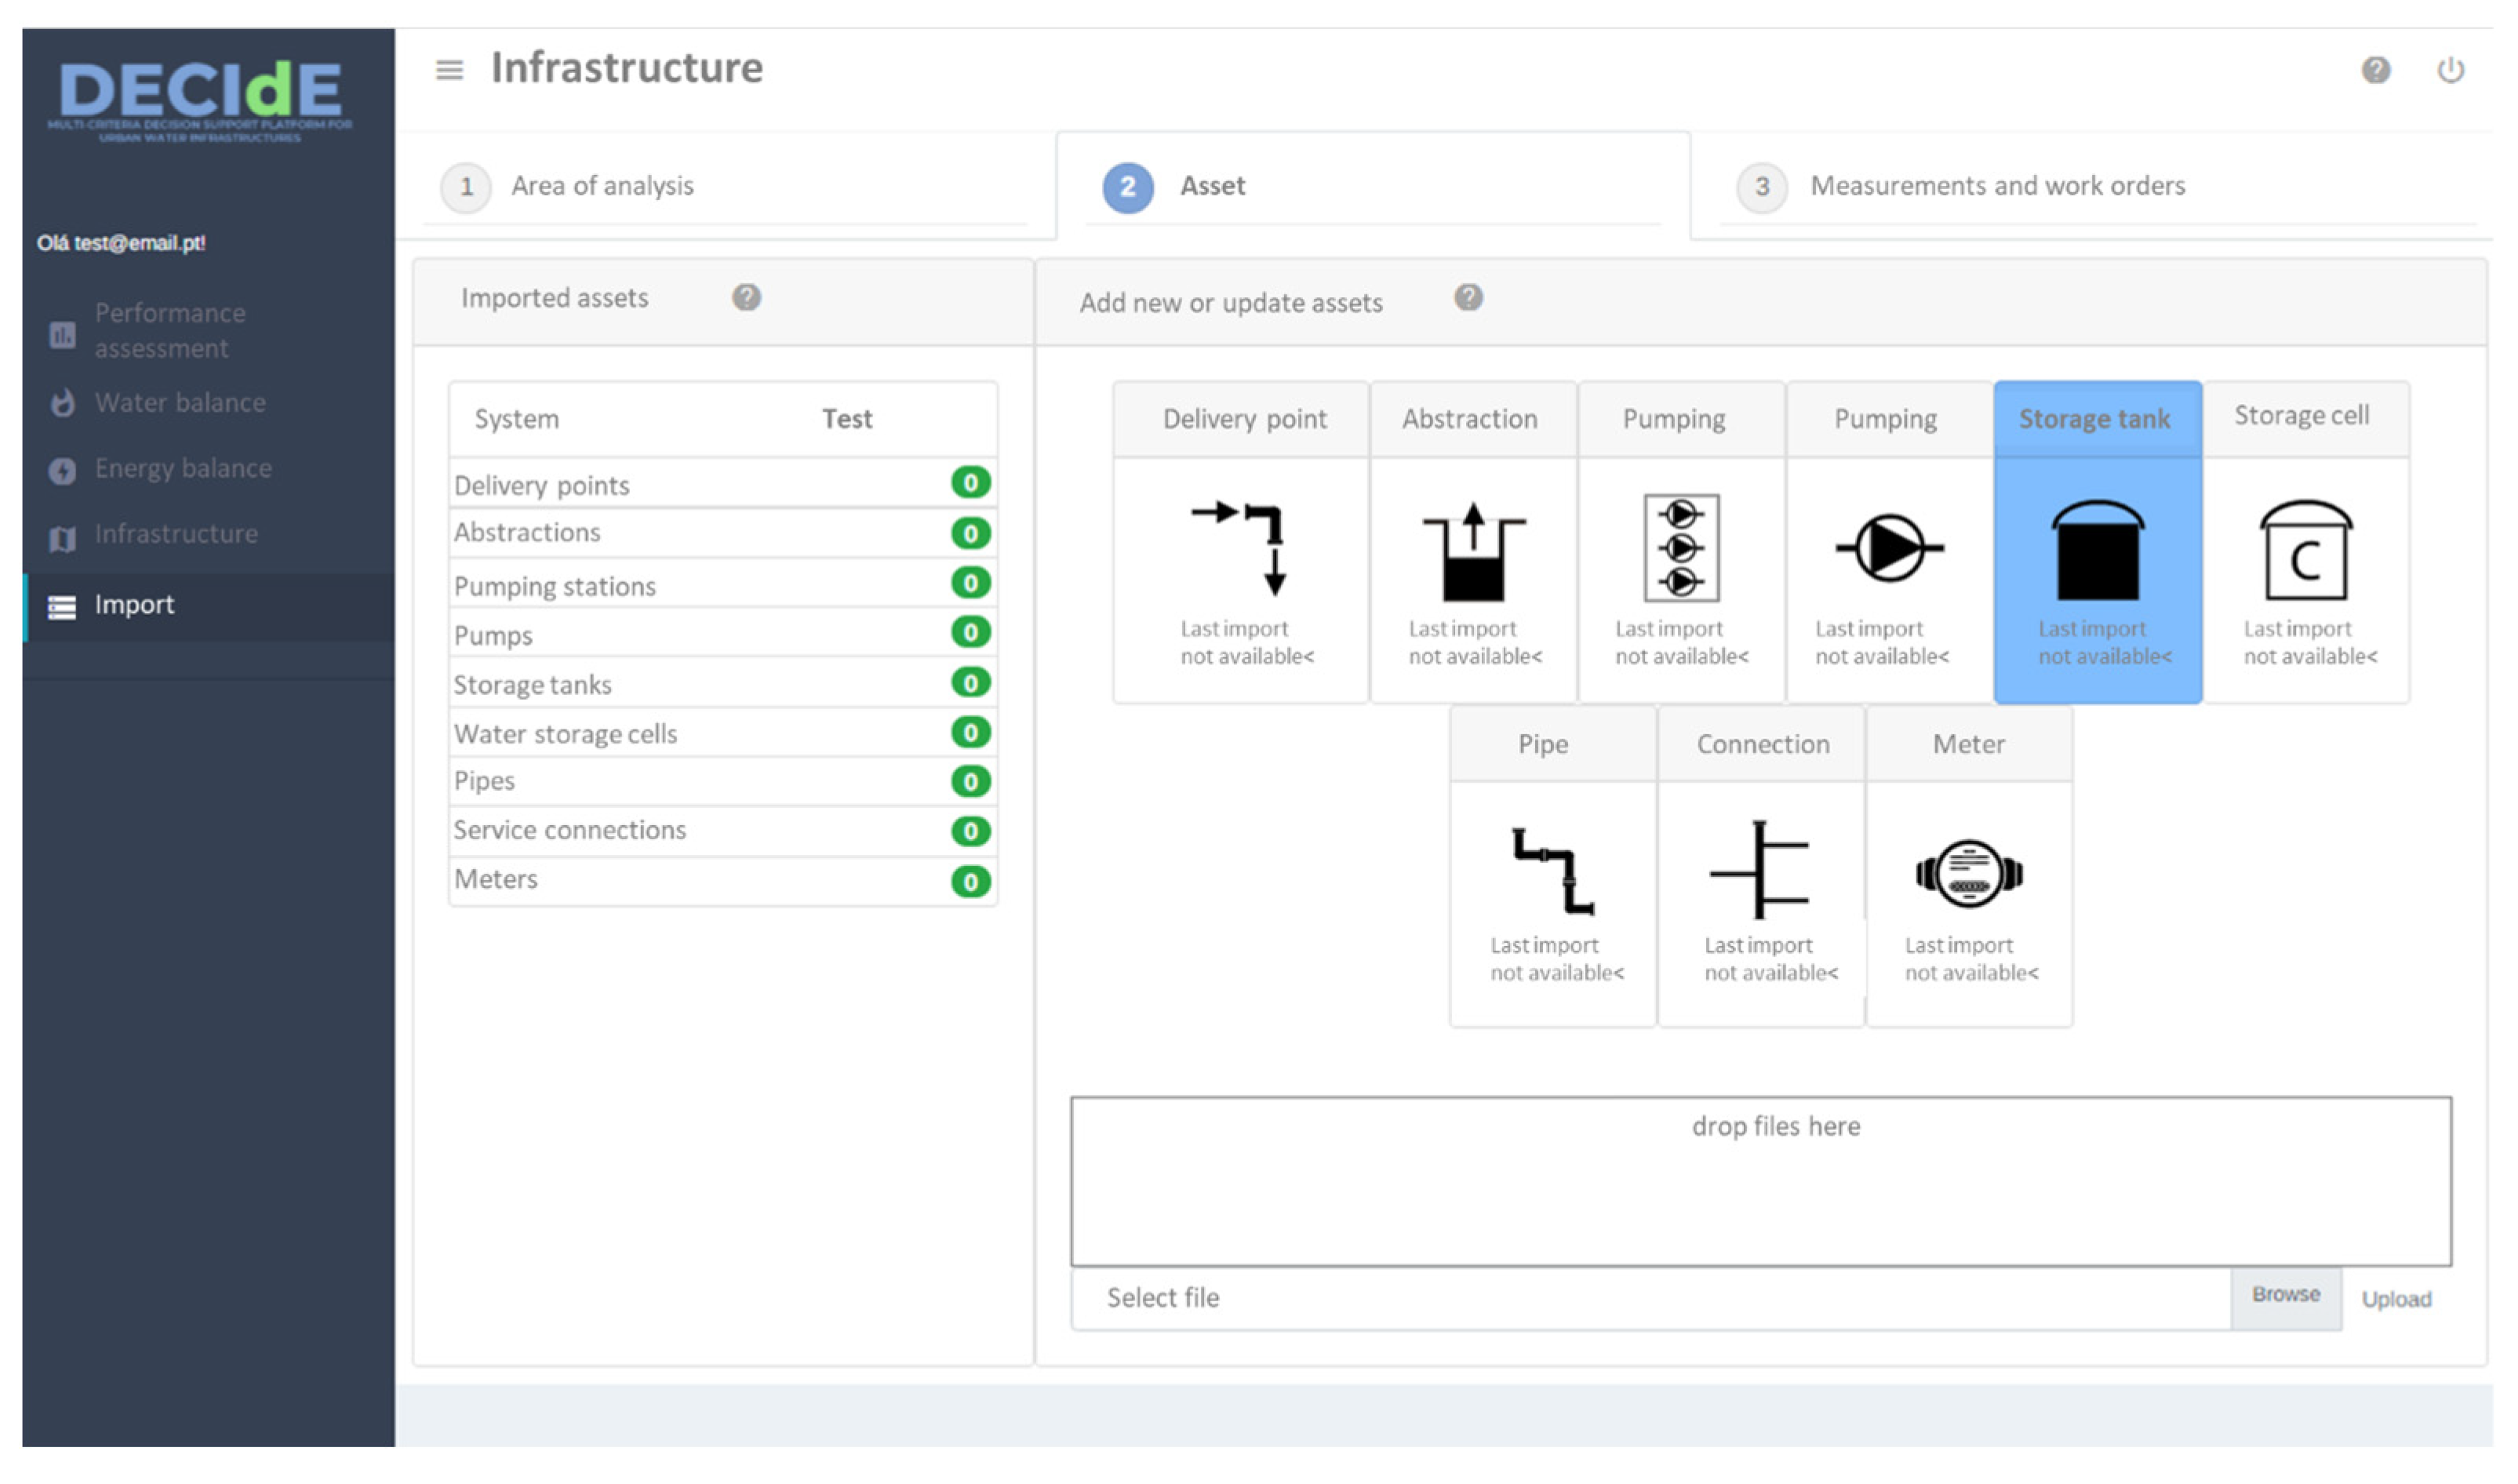
Figure 2 shows the graphical user interface (GUI) for the data import module.
The platform is freely available on the web (
https://decide.ips.pt/, accessed on 3 January 2023), though only a Portuguese version is currently implemented; in the near future, an English version will be developed. After a registration process, users need to upload their infrastructural data from their GIS and measurement files. The infrastructural data should be in the shapefile format since this is the most common format among GIS software.
4. Discussion
The DECIdE project aimed at the development of a prototype platform to assist water utilities in the IAM of their systems. A robust IAM is data-intensive and, for that reason, data integration or interoperability between existing IS is desirable. Nonetheless, data models are often unstructured in most utilities with a lower technological maturity level, containing inaccurate, incomplete, redundant and out-of-date data, which ultimately turns data integration into a great challenge. These data are stored in various, often incompatible, IS. However, the process of replacing an inadequate IS with a more suitable one is not always simple, as it may imply deep changes in the utility’s information management processes. This fact may be aggravated in utilities with a lack of human and financial resources; the acquisition of a new IS implies a given amount of time dedicated to training, which in most cases they do not have. The above circumstances do not help the interoperability between IS of small and medium-sized utilities.
Utilities with good financial capacity usually have the necessary resources to develop middleware applications for IAM, either internally or by subcontracting third parties. However, small to medium-sized utilities do not have the same financial capacity and often have difficulty in increasing their organizational and technological maturities. The national regulator can play an important role in data standardization by publishing recommendations in technical guides which can help utilities with lower maturity levels.
During the development of the platform, circumstantial choices about some technological aspects were made that now need further reflection. The use of MySQL technology for the database may not be the most adequate if in the future the platform is intended to be upgraded to receive real-time measurements from the sensors installed in the networks and to use them in AI algorithms to perform advanced assessments. In this case, other types of database technology may be more feasible, such as document-oriented databases, graph databases, or even hybrid solutions.
Although the results of the performance indicators system are relevant to the water utility, the major advantage is the possibility of assessing the evolution of each indicator on a timely basis. This is of utmost importance to assess if the defined targets in the IAM plan are being achieved over time.
The use of telemetry creates unprecedented opportunities for water management, water consumption efficiency, leak localization and the recognition of anomalous consumptions [
33]. The monitored parameters by the installed sensors—such as pressure and flow rate—give rise to abundant and informative multivariate time series [
34]. Therefore, in future developments, the platform should improve the performance metrics related to water losses [
35,
36,
37,
38] and energy efficiency use [
39,
40] by allowing real-time assessment and also include modules for (1) exploratory data analysis; (2) predictive analysis; (3) spatial leak location; (4) advanced recognition of anomalous behaviour. Such features pave the way towards the digital twin of the UWS.
Several factors, with special emphasis on climate change and environmental sustainability issues, are changing the paradigm of how UWS are managed. In other words, the focus is shifting from the concern of mere economic and financial sustainability point-of-view to a broader scope which includes societal challenges, environmental sustainability and increasing system resilience. Although the developed solution and used analysis are mainly concerned with financial and economic sustainability, it could easily be adapted to include other analyses (and the respective required data). The result of the two analyses could also be compared and would allow more grounded and robust decision-making. The world is rapidly evolving and, although environmental sustainability may be a major concern in the future, water utilities in most developed countries will face, in the next decades, huge problems related not only to infrastructure degradation and the need for urgent rehabilitation but also to water scarcity and lack of available freshwater sources.
It is recommended that water utilities, especially those struggling to manage ageing infrastructure with minimal staff, gradually evolve towards the digitalization of their systems. The water utilities may not need a massive digital renovation, but stepwise solutions tailored to their capacity and needs, since the best offer may not be affordable for everyone. The digital transformation will not happen immediately, thus, if the water utility is preparing broader system changes, it can align them with digitalized services. Technology advances quickly every year but the water utility should not pursue exciting solutions disregarding the ultimate goal of improving the provided service [
41].
In the future, water needs to be managed more sustainably and effectively. Nowadays, drinking water management is performed separately of the wastewater management. Nonetheless, water circulates in a loop through different uses and is scarce in several locations on the planet. Therefore, water management should be performed in an integrated mode. Integrated Water Resources Management is definitely the future of water-wise management. Additionally, water circularity should be intensified by using and reusing water in the best way possible. Most existing cities in the world have been concerned to build concrete infrastructures, usually called grey infrastructures, but they increase city floods. Thus, cities should include in their design green infrastructures, based on nature-based solutions. This bright future brings challenges that the digital transformation of water utilities may help to overcome.


 ,
, 


