
An Agent-Based Social Impact Theory Model to Study the Impact of In-Person School Closures on Nonmedical Prescription Opioid Use among Youth

Department of Computer Science, University of Saskatchewan, Saskatoon, SK S7N 5C9, Canada
*
Author to whom correspondence should be addressed.
Systems 2023, 11(2), 72; https://doi.org/10.3390/systems11020072
Submission received: 9 December 2022
/
Revised: 25 January 2023
/
Accepted: 28 January 2023
/
Published: 1 February 2023
(This article belongs to the Special Issue Systems Thinking and Models in Public Health)
Abstract
:Substance use behavior among youth is a complex peer-group phenomenon shaped by many factors. Peer influence, easily accessible prescription opioids, and a youth’s socio-cultural environment play recognized roles in the initiation and persistence of youth nonmedical prescription opioid use. By altering the physical surroundings and social environment of youth, in-person school closures may change risk factors for youth drug use. Acknowledging past research on the importance of the presence of peers in youth substance use risk behavior, this paper reports the findings from the use of an agent-based simulation grounded in social impact theory to investigate possible impacts of in-person school closures due to COVID-19 on the prevalence of nonmedical prescription opioid use among youth. The presented model integrates data from the Ontario Student Drug Use and Health Survey and characterizes the accessibility of within-home prescription opioids. Under the status quo, the lifting of in-person school closures reliably entails an increase in the prevalence of youth with nonmedical prescription opioid use, but this effect is ameliorated if the prescription opioids are securely stored during the in-person school closures period.
1. Introduction
Youth are among the high-risk population for substance use behaviors [1,2]. Substance use behavior among youth is a complex phenomenon and involves diverse influential factors including the socio-cultural environment [3,4], substance-using peers, and personal network characteristics [5,6,7]. Some youth initiate drug use because of friends and continue it to fit in with their social network and environment. Such initiation is of particular significance in that many adults have initiated substance use during their teen and young adult years [8,9]. With growing appreciation for the impact of peers, families, and communities on youth substance use, schools are also recognized as important social environments affecting student knowledge, attitudes, and behavior toward substance use [10].
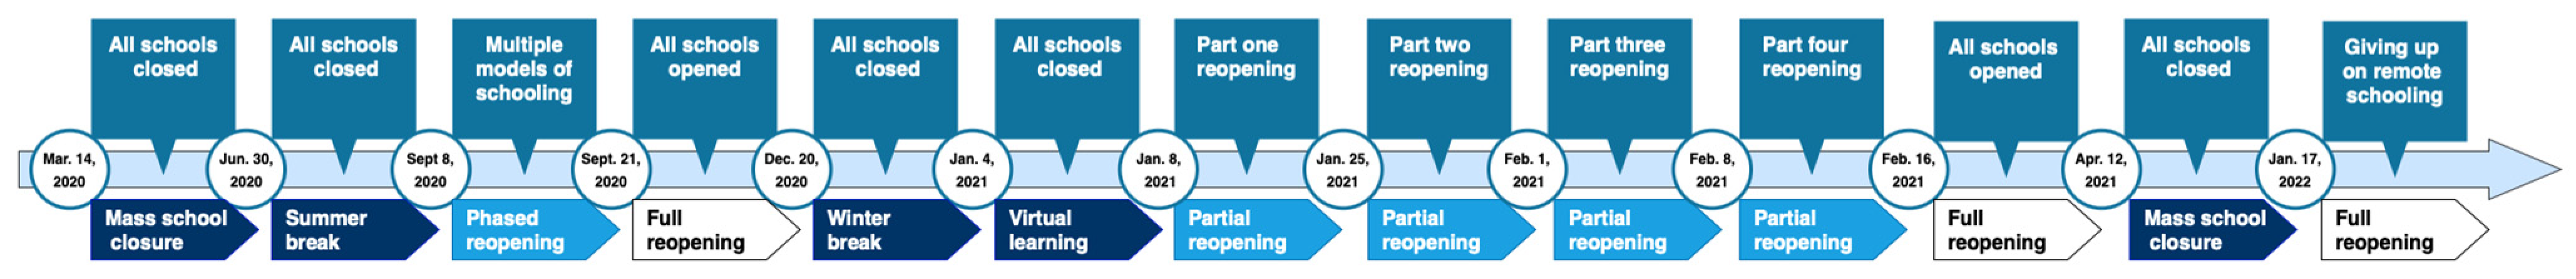
One of the initial actions taken during the COVID-19 pandemic to lower mortality and avoid unsustainable acute care service utilization was the implementation of public health orders that frequently included partial or full in-person school closures, and sometimes encouraged families to minimize socialization and remain at home where possible [11]. In Ontario, the first school closure was announced on 12 March 2020, in effect from 14 March 2020, and continued with several gradual and staggered reopening and closures throughout the course of the following two years, as shown in Figure 1 [12]. Finally, Ontario schools reopened for in-person learning on 17 January 2022 [13].
The presence of youth at home during in-person school closures may have positive and negative implications for their mental health and propensity to use substances. While a lack of in-person contact with classmates and instructors is likely to produce elevated anxiety, boredom, and discontent in some young people, others may have welcomed less stressful peer interaction and a temporary decline in bullying and other forms of unpleasant experiences associated with in-person learning [14]. Among youth, the adoption of unhealthy coping mechanisms, such as substance use, as a result of pandemic-related stress, are of particular concern, since they are less likely to consider the negative consequences of their action [15]. The increased risk of opioid use among youth could result from elevated accessibility of prescription opioids due to unsafe medication storage practices by family members at home [16,17,18], witnessing elevated parental nonmedical prescription opioid use [19], and increased alcohol and cannabis consumption among youth during the pandemic [20,21,22]. Such regularities and the prospects of requiring in-person school closures as part of future public health orders suggest the importance of understanding the impact of in-person school closures on substance use among young Canadians during and after the COVID-19 pandemic.
There is a body of research applying social network analysis to secure insights into substance use behavior among youth [23,24,25]. Although social network analysis can offer enormous insights into the social context of and influence on the use of drugs, reducing an individual to a node in a network limits the integration of personal characteristics [26]. While incorporating such representation of network structures, an agent-based modeling approach can more deeply analyze individual affiliative structures in the context of evolving and actively interacting agents with varying characteristics [27,28].
To explore fundamental elements of substance use among youth, different agent-based models have been built [29,30,31,32,33,34,35,36]. These models highlight the use of the computational modeling method as a possible way to explore the complex concept of substance use amongst youth. One little-explored approach to study the possible association between social influence and substance use amongst youth is through opinion dynamics computational models. Opinion dynamics computational models can highlight mechanisms underlying the convergence of behaviors and theoretical implications for imitator behaviors. There is a substantial body of literature on opinion dynamics models, with model formulations having been contributed from domains as varied as social psychology, statistical physics, mathematics, and computer science. These varying angles of contributions have led to a vast and diverse body of research [37,38,39]. Despite the breadth of past applications of opinion dynamics models, there are few computational modelling studies that employ the opinion dynamics model to study addictive behaviors [40,41], and none of them devote particular attention towards how in-person school closures may affect youth nonmedical prescription opioid use.
Broadly, opinion formation models can be categorized into discrete and continuous models. Discrete models permit an agent to hold one of a finite set of opinions, whereas continuous models allow for a real-valued opinion [38]. Below, we informally characterize eight prominent subgroups in the opinion dynamics models within the literature [37], recognizing that the taxonomy employed here is not a canonical one and that other forms of classification of opinion dynamics models can be seen within the literature [38].
One of the earliest dichotomous discrete opinion dynamics models to simulate how people’s attitudes evolve over time is the voter model. Each individual inside an arbitrary network is selected randomly and adopts the state of a randomly chosen neighbor. Arrival at a consensus is the main feature of the voter model [42]. Many variants of the voter model have been examined, including a nonlinear formulation [43], alternative starting network configurations [44], the impacts of “zealots” carrying invariant beliefs [45], and those reflecting various co-evolutionary principles [46]. A second discrete model of opinion dynamics —the majority rule model—considers a set of agents who have discrete opinions and selects alternatives that enjoy majority support [47,48]. Third, the Sznajd model provides a discrete model of opinion dynamics and implements a rule in which a pair of neighbors is randomly chosen to change their nearest neighbor’s opinion; if that pair of close neighbors agree, their nearest neighbors will eventually agree. By contrast, if the pair disagree, the opinion of the nearest neighbors remains unchanged, with no common opinion developing among their nearest neighbors [49,50,51]. Fourth, the bounded confidence model was developed by Deffaunt et al. and consists of a stochastic model for the evolution of continuous-valued opinions within a finite group of peers [52]. Fifth, the relative agreement model is a variant of the bounded confidence model that uses individual uncertainty as the criterion for deciding whether two agents can interact; uncertainty, as well as opinion, can be modified by interactions within this model [53]. Sixth, the continuous opinions and discrete actions model describes a situation in which agents hold real-valued opinions yet may only express themselves in discrete terms [54]. Seventh, the social judgment-based opinion model shares certain features with the continuous opinions and discrete actions model with two alternative structures: one in which agents can express their opinion as a real number and another in which they are restricted to one of a set of discrete possibilities [55,56]. A final class of opinion dynamics models are those employing the social impact theory model, which offers a discrete model of opinion dynamics based on social impact theory in psychology [57]. Social impact theory associates each agent with three variables—a level of persuasiveness, a level of supportiveness, and a binary opinion. The model further presents a set of formulae to characterize the total impact on each agent based on the number, strength, and immediacy of its neighbors [58]. This work employs this final class of opinion dynamics models as an established theory of clear relevance to study the impact on youth drug use of direct (in-person) peer influences at school and indirect perceived norms from the socio-cultural environment.
The COVID-19 pandemic has had a profound impact on the lives of people around the world, including youth. In particular, the closure of in-person schools has raised questions about the potential impact on nonmedical prescription opioid use among youth. The current study centers on the question of how in-person school closures during and after the COVID-19 pandemic affect nonmedical prescription opioid use among youth, and what measures can be taken to alleviate any potential risks or improve the situation. The findings of this research can be utilized to develop policies and interventions aimed at decreasing the risk of nonmedical prescription opioid use among youth during and after in-person school closures. This study is one of the first to investigate the impact of in-person school closures on nonmedical prescription opioid use among youth during and after the COVID-19 pandemic in Canada. To support this investigation, this work employed an agent-based model formulated based on the social impact model of opinion formation [59,60], and was calibrated to reflect data from the Ontario Student Drug Use and Health Survey (OSDUHS) [61,62].
The remainder of this paper is organized as follows: Section 2 describes the model, including the agent-based formulation and the social impact theory implementation, cellular automata spatial structure, and the experimental design. Section 3 elucidates the results. Section 4 includes the corresponding discussion and concludes the paper.
2. Materials and Methods
Within this work, the influences of peers, families, and socio-cultural environment on nonmedical prescription opioid use among youth are investigated using an agent-based model (ABM) operating within a spatial grid-based network structure in accordance with cellular automata (CA) principles. The data on the prevalence of nonmedical prescription opioid use among youth, as well as the frequency and sources of use reported in the Ontario Student Drug Use and Health Survey (OSDUHS) [61,62], were used to parameterize and calibrate the ABM. The selection of the most appropriate agent-based modeling toolkit for this project was based on a variety of factors, including the programming experience and abilities of the individuals involved, the activity of the toolkit’s community and the availability of specialized resources, the scalability and adaptability of the platform, and the built-in visualization options. Two separate reports [63,64] evaluated various agent-based modeling toolkits against different criteria and offered recommendations based on specific needs. For this study, the model was created using simulation software AnyLogic Version 8.8.1 [65] and the model was run for a time horizon from 2017 to 2025.
The design of the agent-based model drew on the social impact model of opinion formation [59,60]. The agent-based model was created, parameterized, calibrated, and used to investigate the prevalence of nonmedical prescription opioid use among youth, their prescription opioids resources, and the frequency of nonmedical prescription opioid use within the past year when varying peer influence, youth exposure to prescription opioids at home, and the influence of the socio-cultural environment. To support this investigation, the peer network context, families, and the socio-cultural environment shaping nonmedical prescription opioid use in youth were captured within a three-level CA context (corresponding to peers, families, and the socio-cultural environment), where each youth’s nonmedical prescription opioid use evolved according to the social impact theory of opinion formation.
2.1. Agent-Based Modeling
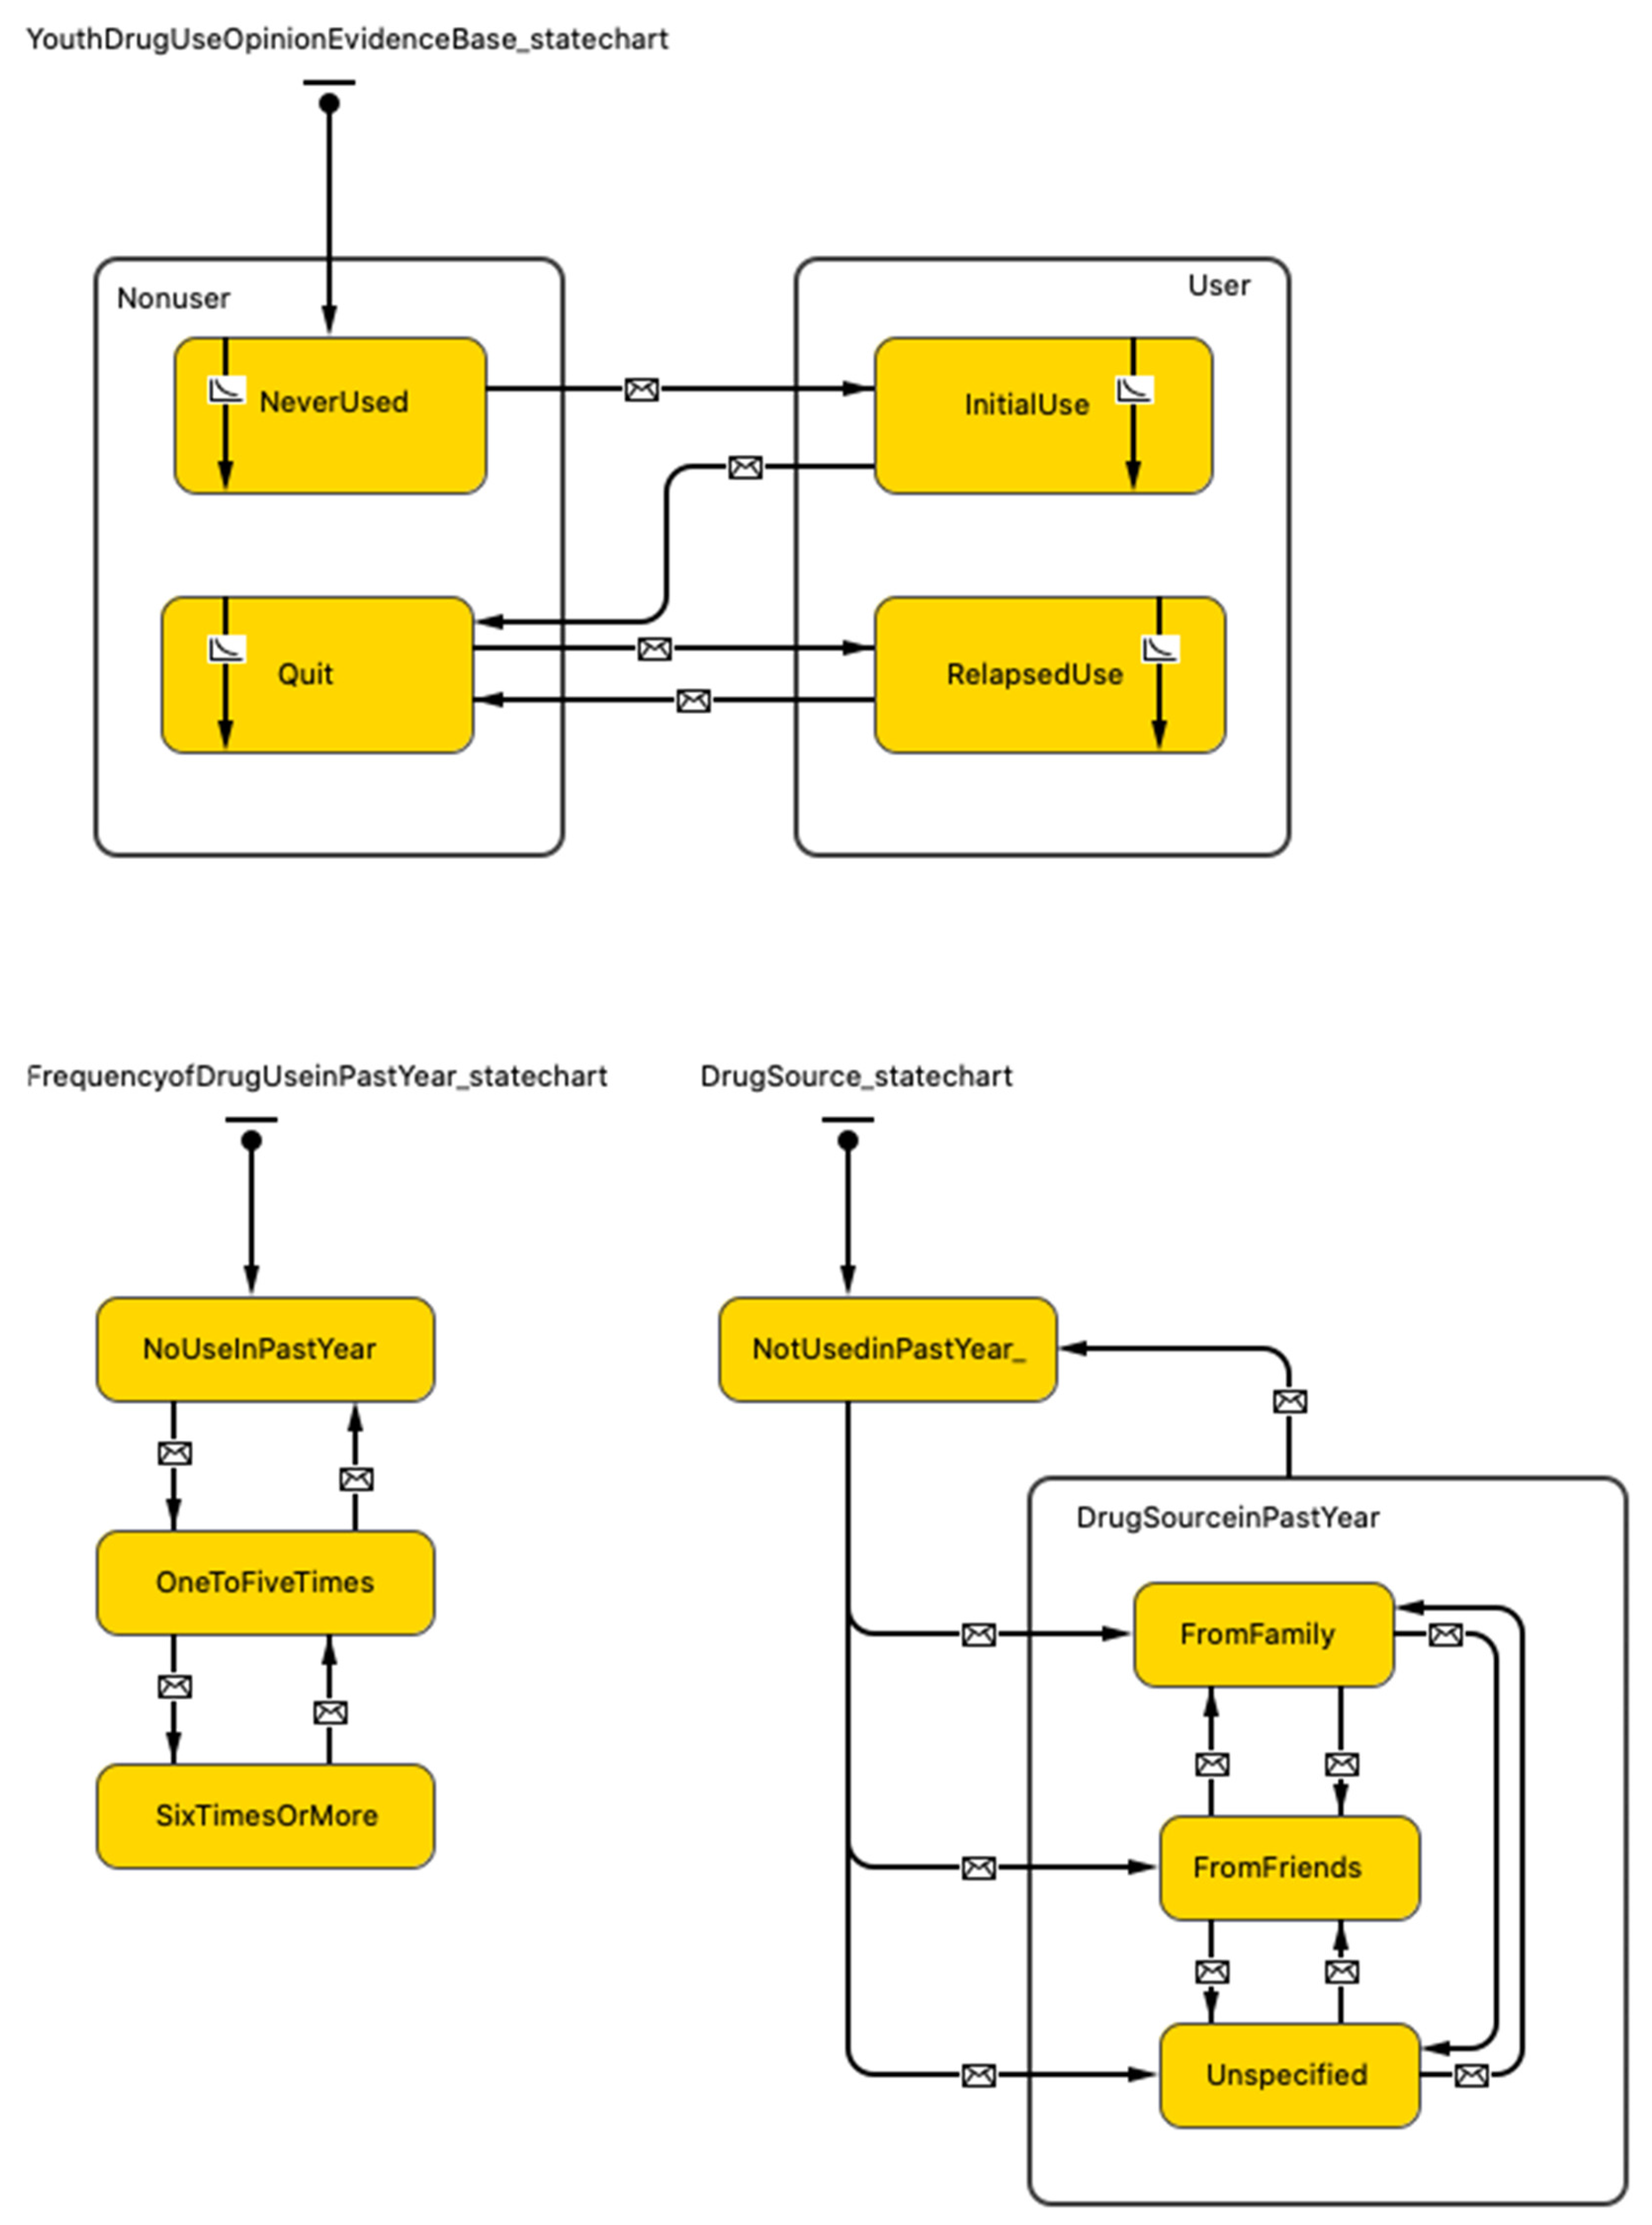
The use of agent-based modeling in this study supports the analysis of changes in the prevalence of nonmedical prescription opioid use among youth and the characterization of the effects of their peers, families, and socio-cultural environment. Hence, the model features three type of agents: youth, family, and socio-cultural environment. Youth behavior is governed by three different state charts depicted in Figure 2. These state charts collectively characterize the possible state-space for a single youth and the events that lead to transitions from one state to another.
The logic for transitions between states within the Youth Drug Use Opinion Evidence state chart was informed by social impact theory. At the topmost level, the Youth Drug Use state chart characterizes whether the individual currently uses nonmedical prescription opioids. Youth who are not currently using nonmedical prescription opioids are divided into two groups: youth who have never used nonmedical prescription opioids and youth who previously used but have since quit by electing not to use nonmedical prescription opioids when the opportunity arose. Youth who currently use nonmedical prescription opioids are also divided into two groups: youth who are within their initial period of nonmedical prescription opioids use and youth who relapsed after previously quitting.
The Frequency of Drug Use in the past year state chart represents the number of times that youth used nonmedical prescription opioids during the past year, and it is updated as time passes and as youth use nonmedical prescription opioids.
The Drug Sources state chart depicts two important sources for the most recent prescription opioids use for youth: family and friends. Youth are considered to have a possible opportunity to obtain opioids from family when their family includes at least one person with an opioid prescription. In the absence of a family source, youth can seek available prescription opioids amongst their close friends (considered to be those within their range 1 Moore neighborhood; see below); based on a probability, youth can obtain prescription opioids from friends who are themselves nonmedical prescription opioid users. The unspecified state reflects other sources of opioids.
Each youth is associated with a family, as represented by a family agent. Each such family agent has a family size parameter, which is drawn from a Poisson distribution to represent the empirical data that the average family size in Canada was 2.9 in 2019 [66]. The probability of filling an opioid prescription per week for each family member previously without an opioid prescription and the per week probability of ending opioid prescription treatment for each family member with prescription opioids are calibrated to represent the 12.7% of Canadians who reported having used opioids pain relief medications in 2018 [67]. If a member of any family has been prescribed an opioid, a child in the family might be exposed to prescription opioids, with the level of exposure differing between families. The child exposure to opioids parameter is calibrated to represent the 49.3% of Ontario youth who reported using nonmedical prescription opioids, obtaining them from a parent, sibling, or someone else with whom they live [61,62].
The socio-cultural environment for contemporary youth is made up of neighborhoods, recreation areas, social events, and other forces that affect a youth’s basic values, perceptions, and preferences. Within the model, a socio-cultural environment agent is implemented to reflect the idea that youth prescription opioid use is particularly high in some specific demographics [68]. Part of the socio-cultural environment within the model is therefore assumed to have some degree of bearing on the valence of a youth’s attitude towards drug use.
2.2. Cellular Automata for Spatially Localized Networks
This model uses a three-level spatial grid-based network structure to capture the social context of each youth. All youth are randomly and injectively placed into individual cells (patches) in the cellular automata located in the global environment. The three-level grid containing the youth, family, and socio-cultural environment is a square containing 100 columns and 100 rows. Each patch corresponds to the youth at CA level one (as depicted in Figure 3a), the youth’s family at CA level two (as depicted in Figure 3b), and the youth’s socio-cultural environment at CA level three (as depicted in Figure 3c).
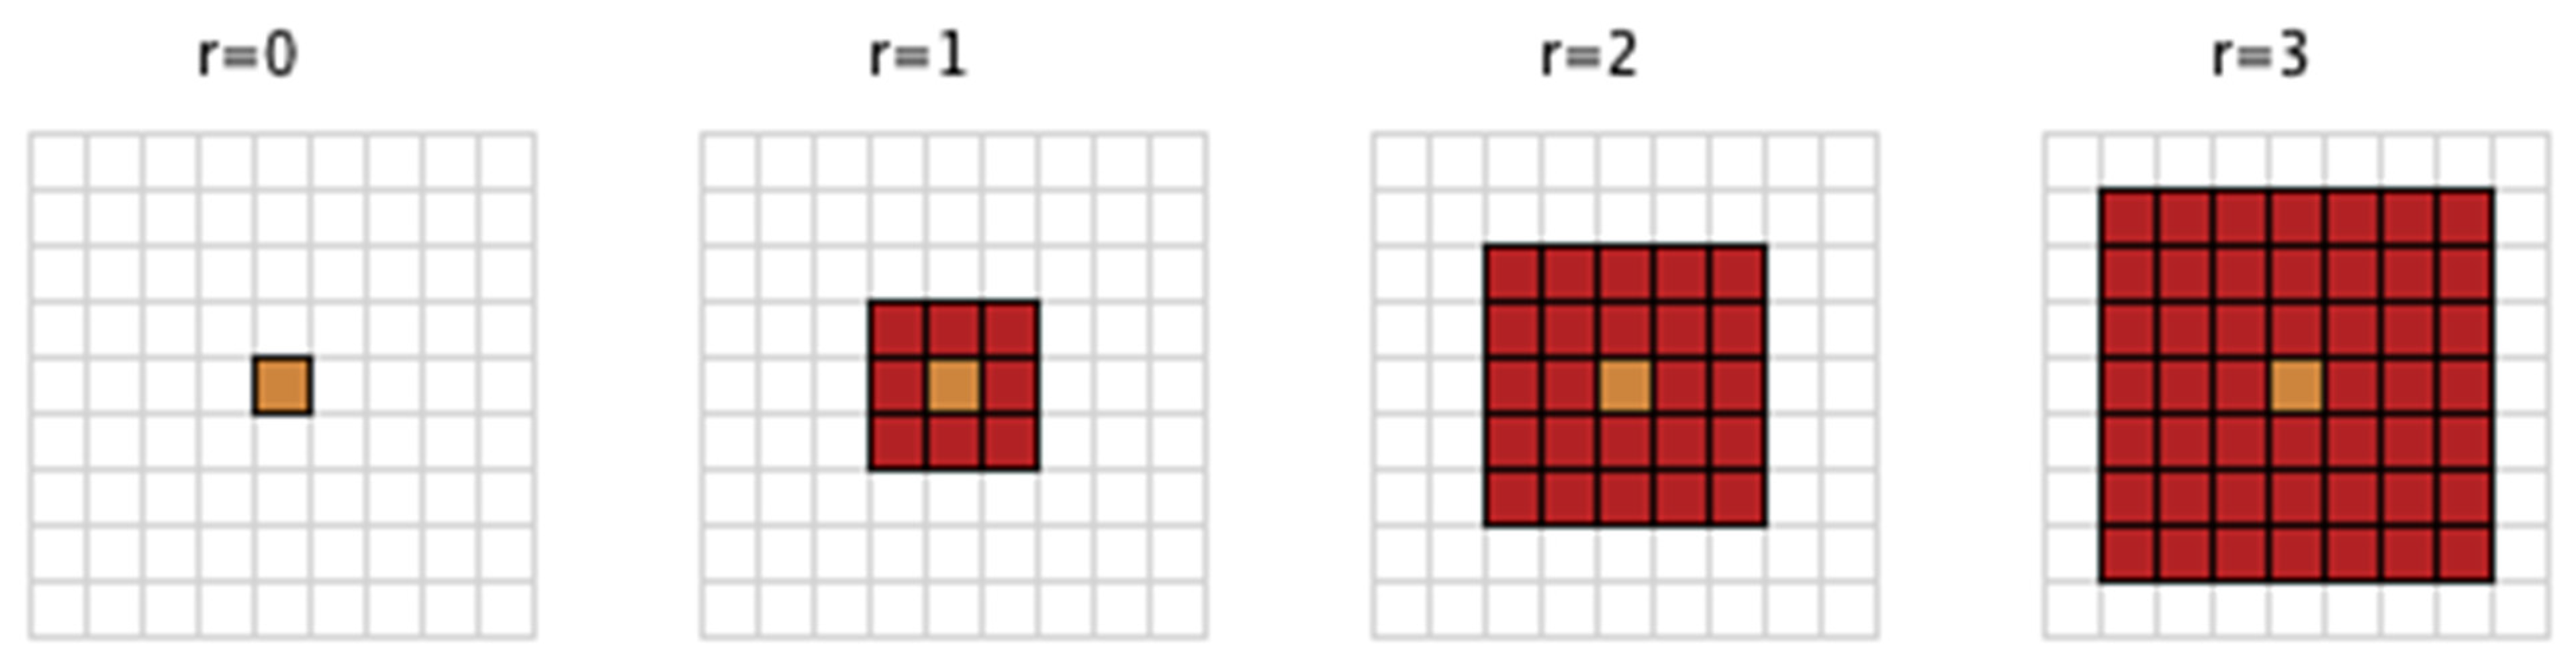
This implantation provides a spatially explicit, grid-based network structure for the youth, who remain immobile throughout the simulation. The lack of spatial mobility reflects the fact that many youths exhibited high conservation in their social networks and interaction patterns during and immediately after the pandemic, partly because of the fact that such networks reflect the composition of the family and socio-cultural environment in which the youth is nested [69]. Social network density for youth and their peers at CA level one is operationalized by considering Moore neighborhoods with different diameters (ranges) as shown in Figure 4.
2.3. Social Impact Model of Opinion Formation
The model characterizes how youths’ nonmedical use of prescription opioids might be governed by environmental influences, availability of prescription opioids at home, and the actions of their peers following a discrete opinion model based on social impact theory. The model consists of 10,000 youths and their corresponding family and socio-cultural environment. Each youth is considered to have one of two opposite opinions on nonmedical prescription opioid use, according to whether they currently nonmedically use prescription opioids. The presence or absence of nonmedical prescription drug use is assumed to be dictated entirely by the attitude (opinion) of the youth with respect to drug use.
In accordance with social impact theory, each youth is characterized by two independent parameters called persuasiveness and supportiveness. The strength of persuasiveness is the ability to persuade another youth with a discordant drug use attitude to change their current attitude. The strength of supportiveness characterizes the ability to support another youth with an identical drug use attitude to persist in their current attitude [58].
Following the literature [58,70], the values of the persuasiveness and supportiveness attributes are assigned as random real-number values uniformly drawn between 0 and 100; when youth flip to an alternative attitude and associated behavior, their parameters for persuasiveness and supportiveness are independently drawn from the same distribution.
Youth experience a net impact from interactions with the socio-cultural environment, family, and peers. Employing a formulation drawn from the opinion dynamics literature [58,70], the model characterizes the quantitative value of that impact for an agent at each drug use occasion with the equation shown in Equation (1).
where denotes another agent influencing agent and denote the dichotomous (±1) opinion values of agents and , respectively, towards opioid use, where −1 indicates an attitude disfavoring opioid use and +1 indicates an attitude in favor of opioid use.
and denote the persuasiveness and supportiveness of agent , respectively. In accordance with a gravity model formulation, represents the Euclidean distance between youth and , and defines the speed of drop-off of influence with distance. The current model considers peers at Moore neighborhoods with three different levels of influence on nonmedical opioids use for youth; therefore, is equal to the minimum Moore neighborhood radius with which agents and are connected (max = 3). For a given agent , an agent lying outside the distance of 3 Moore neighborhoods surrounding agent is assumed to exert zero influence on agent (that is, and are considered to be 0). Following the literature [58,70] and consistent with calibrated results of the model, is considered equal to 2.
The peer impact on youth is calculated as the difference between the collective impact of the interacting youth exerting influence on youth to change opinion (characterized by the first bracketed term of Equation (1)) and the collective impact of peers exerting influence to maintain youth ’s current opinion (the second bracketed term of Equation (1)).
is a so-called socio-cultural environment pro-drug influence parameter reflecting the level of promotion of drug use by youth ’s neighborhoods, recreation areas, social events, and other forces (a value greater than 0 when there is a pro-drug influence and equal to 0 for areas without pro-drug influence). is a child’s exposure to opioids at home parameter (family influence), reflecting the level of unsafe opioid storage practices by the youth’s family (a value greater than 0 when there is some opioid storage by the youth’s family and equal to 0 for youth in a family without prescription opioids).
If the overall impact from interacting with peers, families, and the socio-cultural environment for a youth who is absent any nonmedical prescription opioids experience as characterized by Equation (1) is greater than 0, then the current youth will immediately initiate nonmedical prescription opioids use. Equation (1) individually governs initiation behavior in youth who are absent nonmedical prescription opioid use experience, as they do not have any acute withdrawal symptoms for opioids prior to any experience.
After initial experience with nonmedical prescription opioid use, the behavior of youth continues to be influenced by peers, families, and the socio-cultural environment; however, another key factor also arises at this point: the severity of acute withdrawal. This factor can serve to either reinforce or discourage youth drug use [29].
Past research has suggested that the temporal evolution of the severity of acute withdrawal symptoms for opioid drugs can be characterized by a lognormal function of days from the last dose [71]. We employed a lognormal function where scale parameter μ ranged between 0 and 1 and shape parameter σ ranged between 1 × 10⁻³ to 1.5 × 10⁻³.
The attitude of youth with nonmedical prescription opioid use experience may change in each drug use situation according to Equation (2).
The parameter represents the severity of acute withdrawal at the current time, and may be interpreted as a personalized parameter to show randomness in the behavior of youth, who may reject peers, families, and the socio-cultural environment’s impact about nonmedical prescription opioid use and elect to quit or relapse. Although the impact () is a deterministic endogenous parameter that represents a propensity to change—that is, it causes youths who are absent nonmedical prescription opioid experience to initiate opioid use (when the total impact is greater than 0)—any youth with experience of nonmedical prescription opioid use may quit or relapse based on the probability calculated within Equation (2). A higher value of indicates a greater likelihood of changing behavior within Equation (2). Equation (2) is a particular case of the system considered in the literature [72,73].
2.4. In-Person School Closures Implementation Due to the COVID-19 Pandemic
The model characterizes in-person school closures associated with the COVID-19 pandemic as a change in the range of the Moore neighborhood mediating inter-youth interaction starting on 14 March 2020. Specifically, mass in-person school closures are implemented as a Moore neighborhood of range 0 (which has the effect of eliminating the spread of direct—in person—influence between youth) and in the case of the Ontario school closure timeline, the Moore neighborhood range differs for mass closure, partial opening, and phased opening.
2.5. Parametrization, Calibration, and Validation
While the ABM presented in this study is a stylized one, it drew heavily on the Ontario Student Drug Use and Health Survey (OSDUHS) [61,62] to provide data to characterize dynamics of nonmedical prescription opioid use among youth in Canada. The baseline empirically grounded model reflects nonmedical prescription opioids use among students in Grades 7–12 from 2017 to 2021 based on OSDUHS [61,62] and projected until the end of 2025.
Ontario mass in-person school closures were characterized by imposing a Moore neighborhood of range 0 in any phases of the lockdown. The first school closure period was from 14 March 2020 to 8 September 2020, then from 20 December 2020 to 8 January 2021, and finally from 12 April 2021 to 17 January 2022 [12,13]. The period of phased reopening was characterized as imposing a Moore neighborhood of range 2 from 8 September 2020 to 21 September 2020, with partial reopening characterized as a Moore neighborhood of range 1 from 8 January 2021 to 1 February 2021, and as a Moore neighborhood of range 2 from 2 February 2021 to 16 February 2021 to reflect the transition from the mass school closure to full reopening. Finally, the full reopening of Ontario schools was characterized as a Moore neighborhood of range 3.
The model was calibrated so as to match model output against the time-series of the prevalence of youth with nonmedical prescription opioid use, and the time-series of the prevalence of youth using nonmedical prescription opioids frequently (six times or more over the past year) targets from 2017 to 2019 at 2-year intervals and data points of the prevalence of youth using nonmedical prescription opioids obtained from different resources (including families, friends, and unspecified resources) in 2019. During the calibration process, we varied the following set of model parameters by hand until the model outputs approximated empirical data.
Several model parameters were calibrated against the prevalence of youth with nonmedical prescription opioid use and the prevalence of youth using nonmedical prescription opioids obtained from families. Youth exposure to prescription opioids at home was calibrated against the prevalence of youth with nonmedical prescription opioid use and the prevalence of youth using nonmedical prescription opioids obtained from families. The severity of acute withdrawal from nonmedical opioid use was calibrated against the prevalence of youth with nonmedical prescription opioid use. The percentage of the socio-cultural environment with a positive drug use view and the level of drug promotion inside the drug-positive socio-cultural environment were calibrated against the prevalence of youth with nonmedical prescription opioid use. The probability that peers share drugs with peers who request it was calibrated against the prevalence of youth using nonmedical prescription opioids obtained from families. The rate of encountering drug use situations for youth consisted of an initial amount and a coefficient to reflect the current socialization level, and both were calibrated against the prevalence of youth with nonmedical prescription opioid use. The rate of opioid prescription for each family member without prescription opioids and the probability that the duration of the opioid prescription ends for each family member was calibrated to accord with the prevalence of Canadians with an opioid prescription. See Table A1 for more details on parameter values and references.
Finally, to ensure the reliability, validity, and robustness of the current model, a comprehensive validation process was conducted in three phases [74,75]. The first phase, verification, evaluates the correctness of the model by comparing the model’s assumptions to the code logic. The second phase, validation, assesses the accuracy of the model’s emergent behavior by comparing it to external criteria such as real-world data or expert knowledge. The final phase, sensitivity analysis, examines how variations in model assumptions impact the model’s outcomes. The model demonstrates a visually good fit between the observed and model-predicted prevalence of youth with a nonmedical prescription opioid in 2021 during the COVID-19-related in-person school closures.
2.6. Scenarios
To investigate the impact of in-person school closures on nonmedical prescription opioid use among youth, two sets of scenarios were examined. The first set of scenarios examined outcomes from 6, 12, 18, and 24 months of mass in-person school closures followed by partial opening, phased opening, or full opening (i.e., characterizing using different Moore neighborhood ranges) after removing the mass in-person school closures order. For the first set of scenarios, an ensemble of 30 realizations was conducted to secure statistical confidence in results despite stochastic variability.
The second set of scenarios sought to examine the impact of the Ontario school closure timeline and further applied the intervention of reducing youth exposure to prescription opioids at home by 20%, 50%, and 80% at three different time points, considered singly. For the second set of scenarios, an ensemble of 100 realizations was conducted. Furthermore, to generate outcomes of interest that are compatible with the empirical data for the baseline, each simulation employed a 3-year burn-in period for the model. Following the burn-in period, the model was run for a time horizon from 2017 to 2025. Outcomes of interest are plotted daily to see the pattern of changes and recorded yearly to compare with the baseline.
3. Results
This section describes the results of model simulations. The Monte Carlo simulation of the model utilized different realizations to generate a sample of potential outcomes, given a set of inputs and assumptions. Each realization represented a single simulation of the system, utilizing a randomly generated set of inputs. By conducting multiple realizations and introducing randomness in the input parameters, the simulation aimed to gain a deeper understanding of the uncertainty of the results. The results are divided into three subsections, starting with the model-generated prevalence of youth with nonmedical prescription opioid use in the past year for different durations of in-person school closures, followed by a simulation of the model using the Ontario school closure timeline without any intervention. Finally, the impact of safe storage of prescription opioids at home on the prevalence of youth engaged in nonmedical prescription opioid use on the result of the model using the Ontario school closure timeline is explored.
3.1. Results of the Simulation for the Prevalence of Youth with Nonmedical Prescription Opioid Use in the Past Year for Different In-Person School Closure Durations
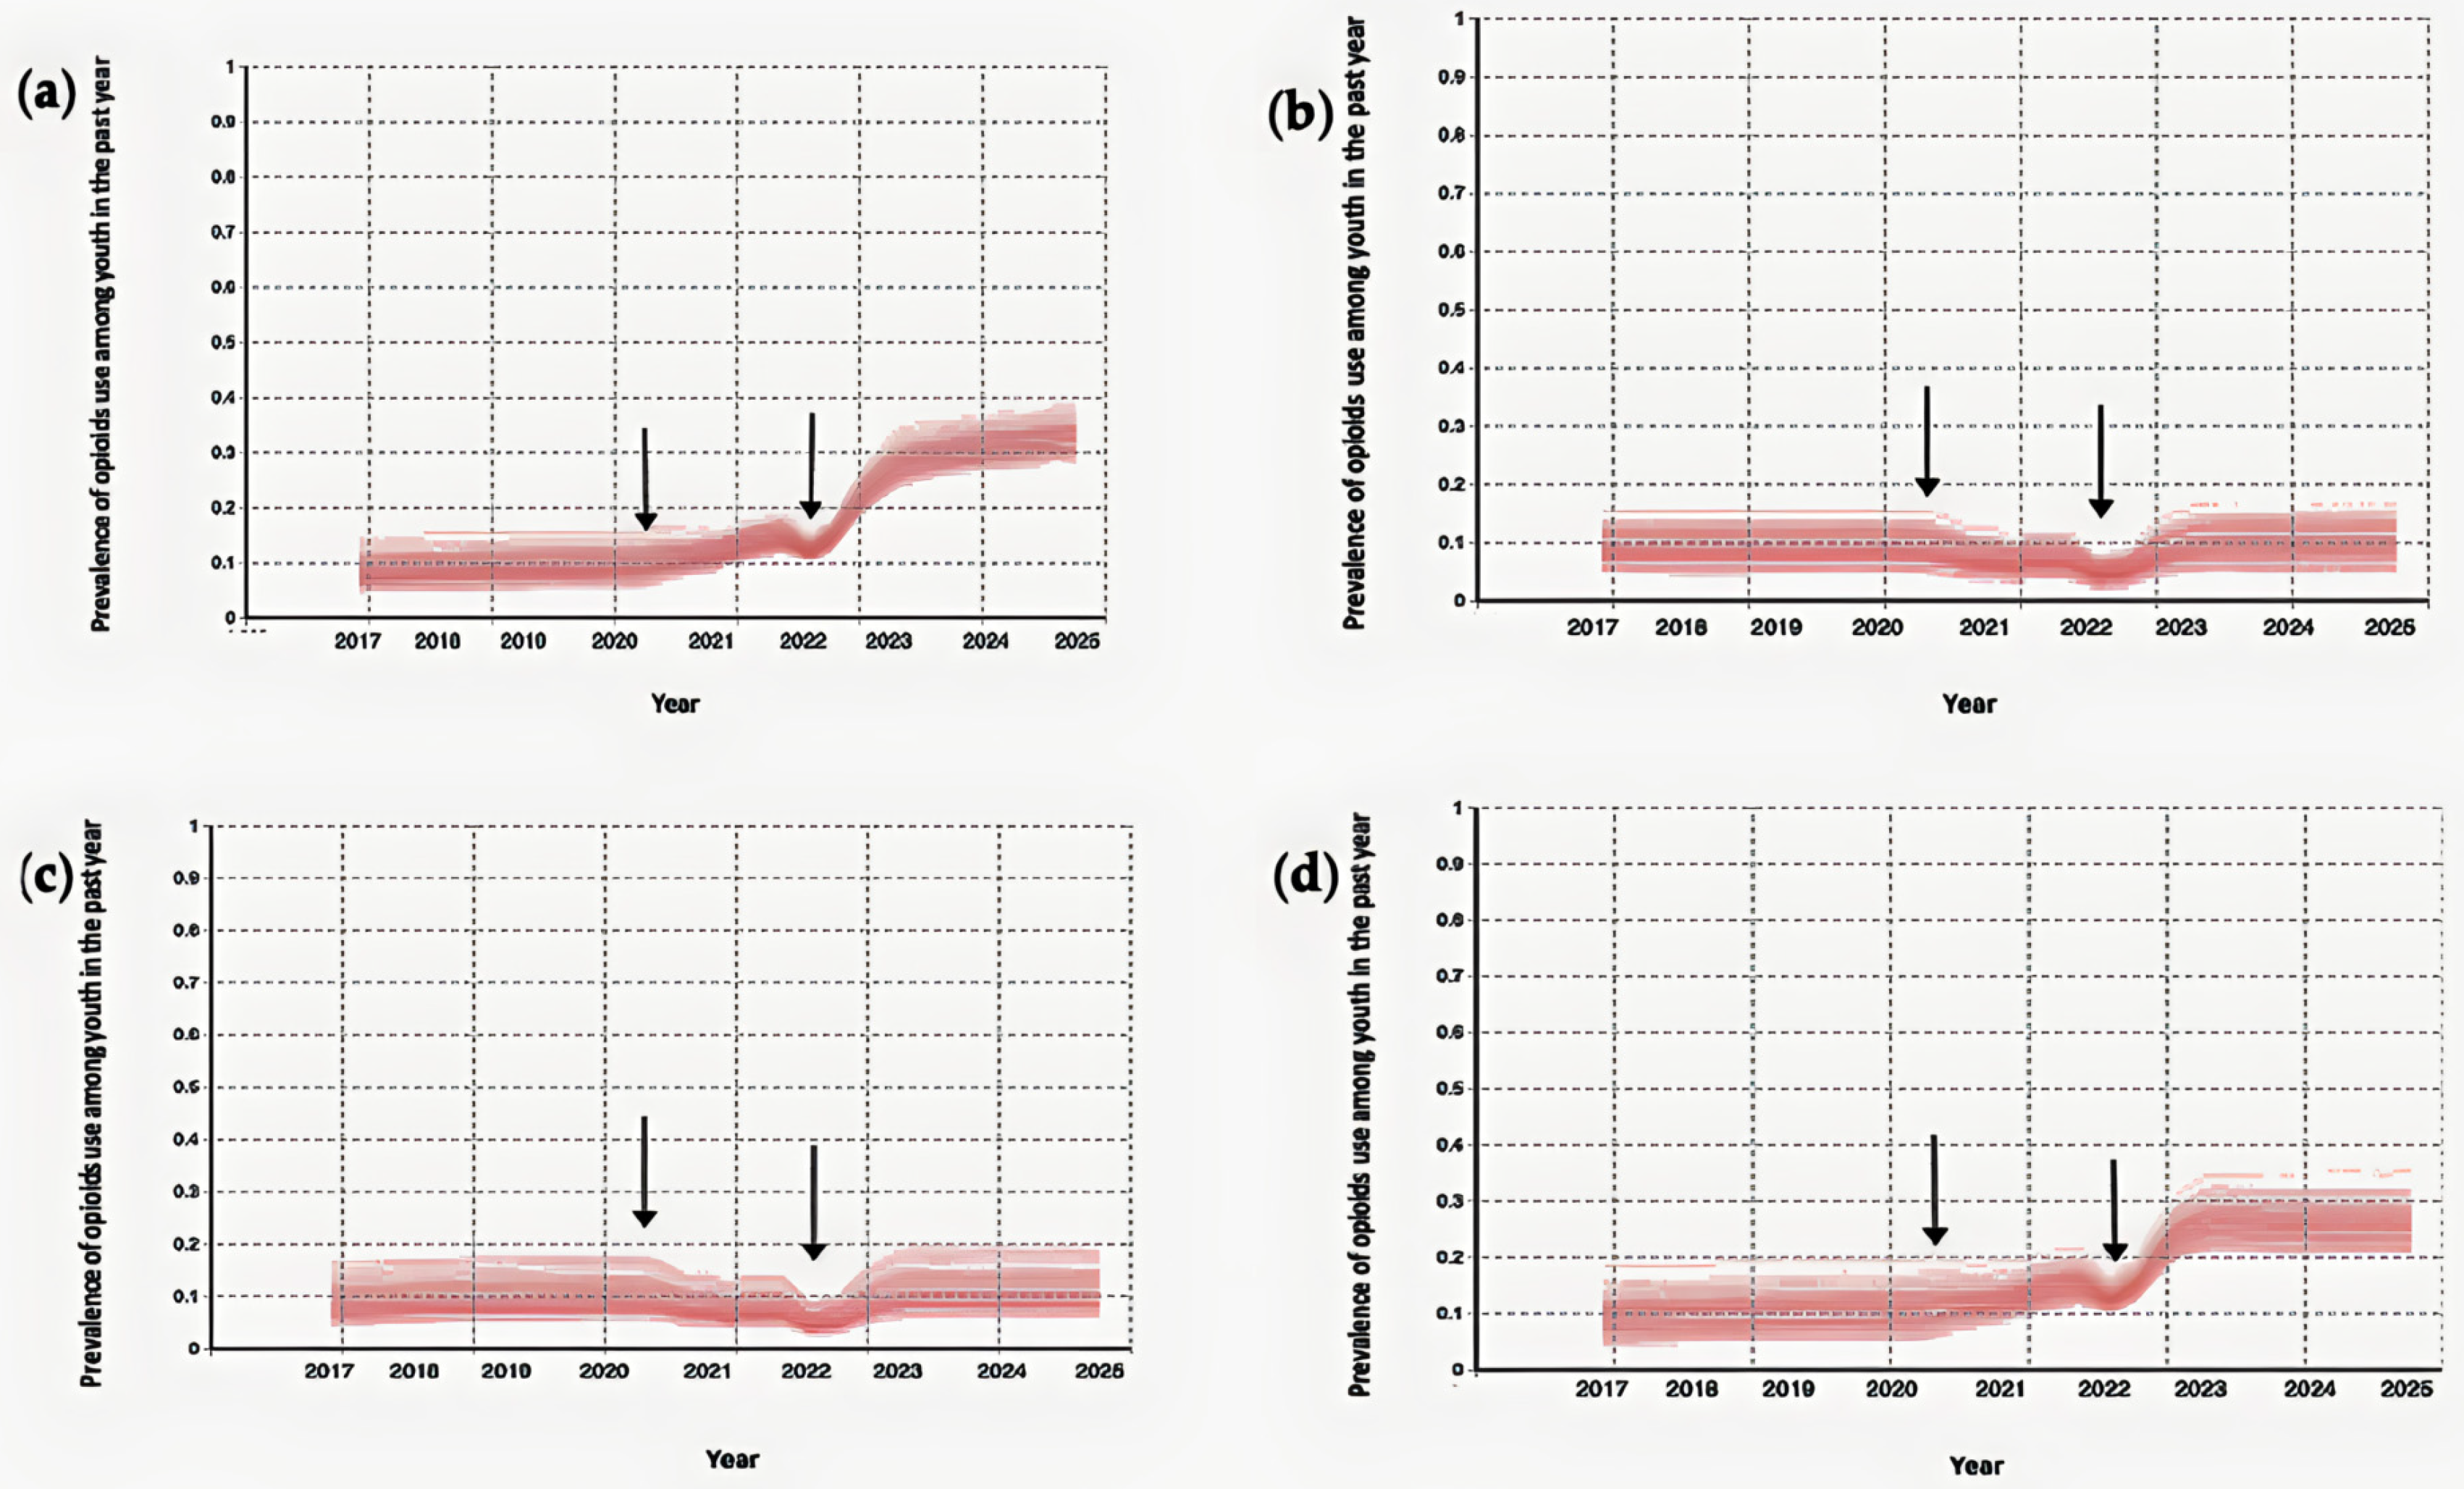
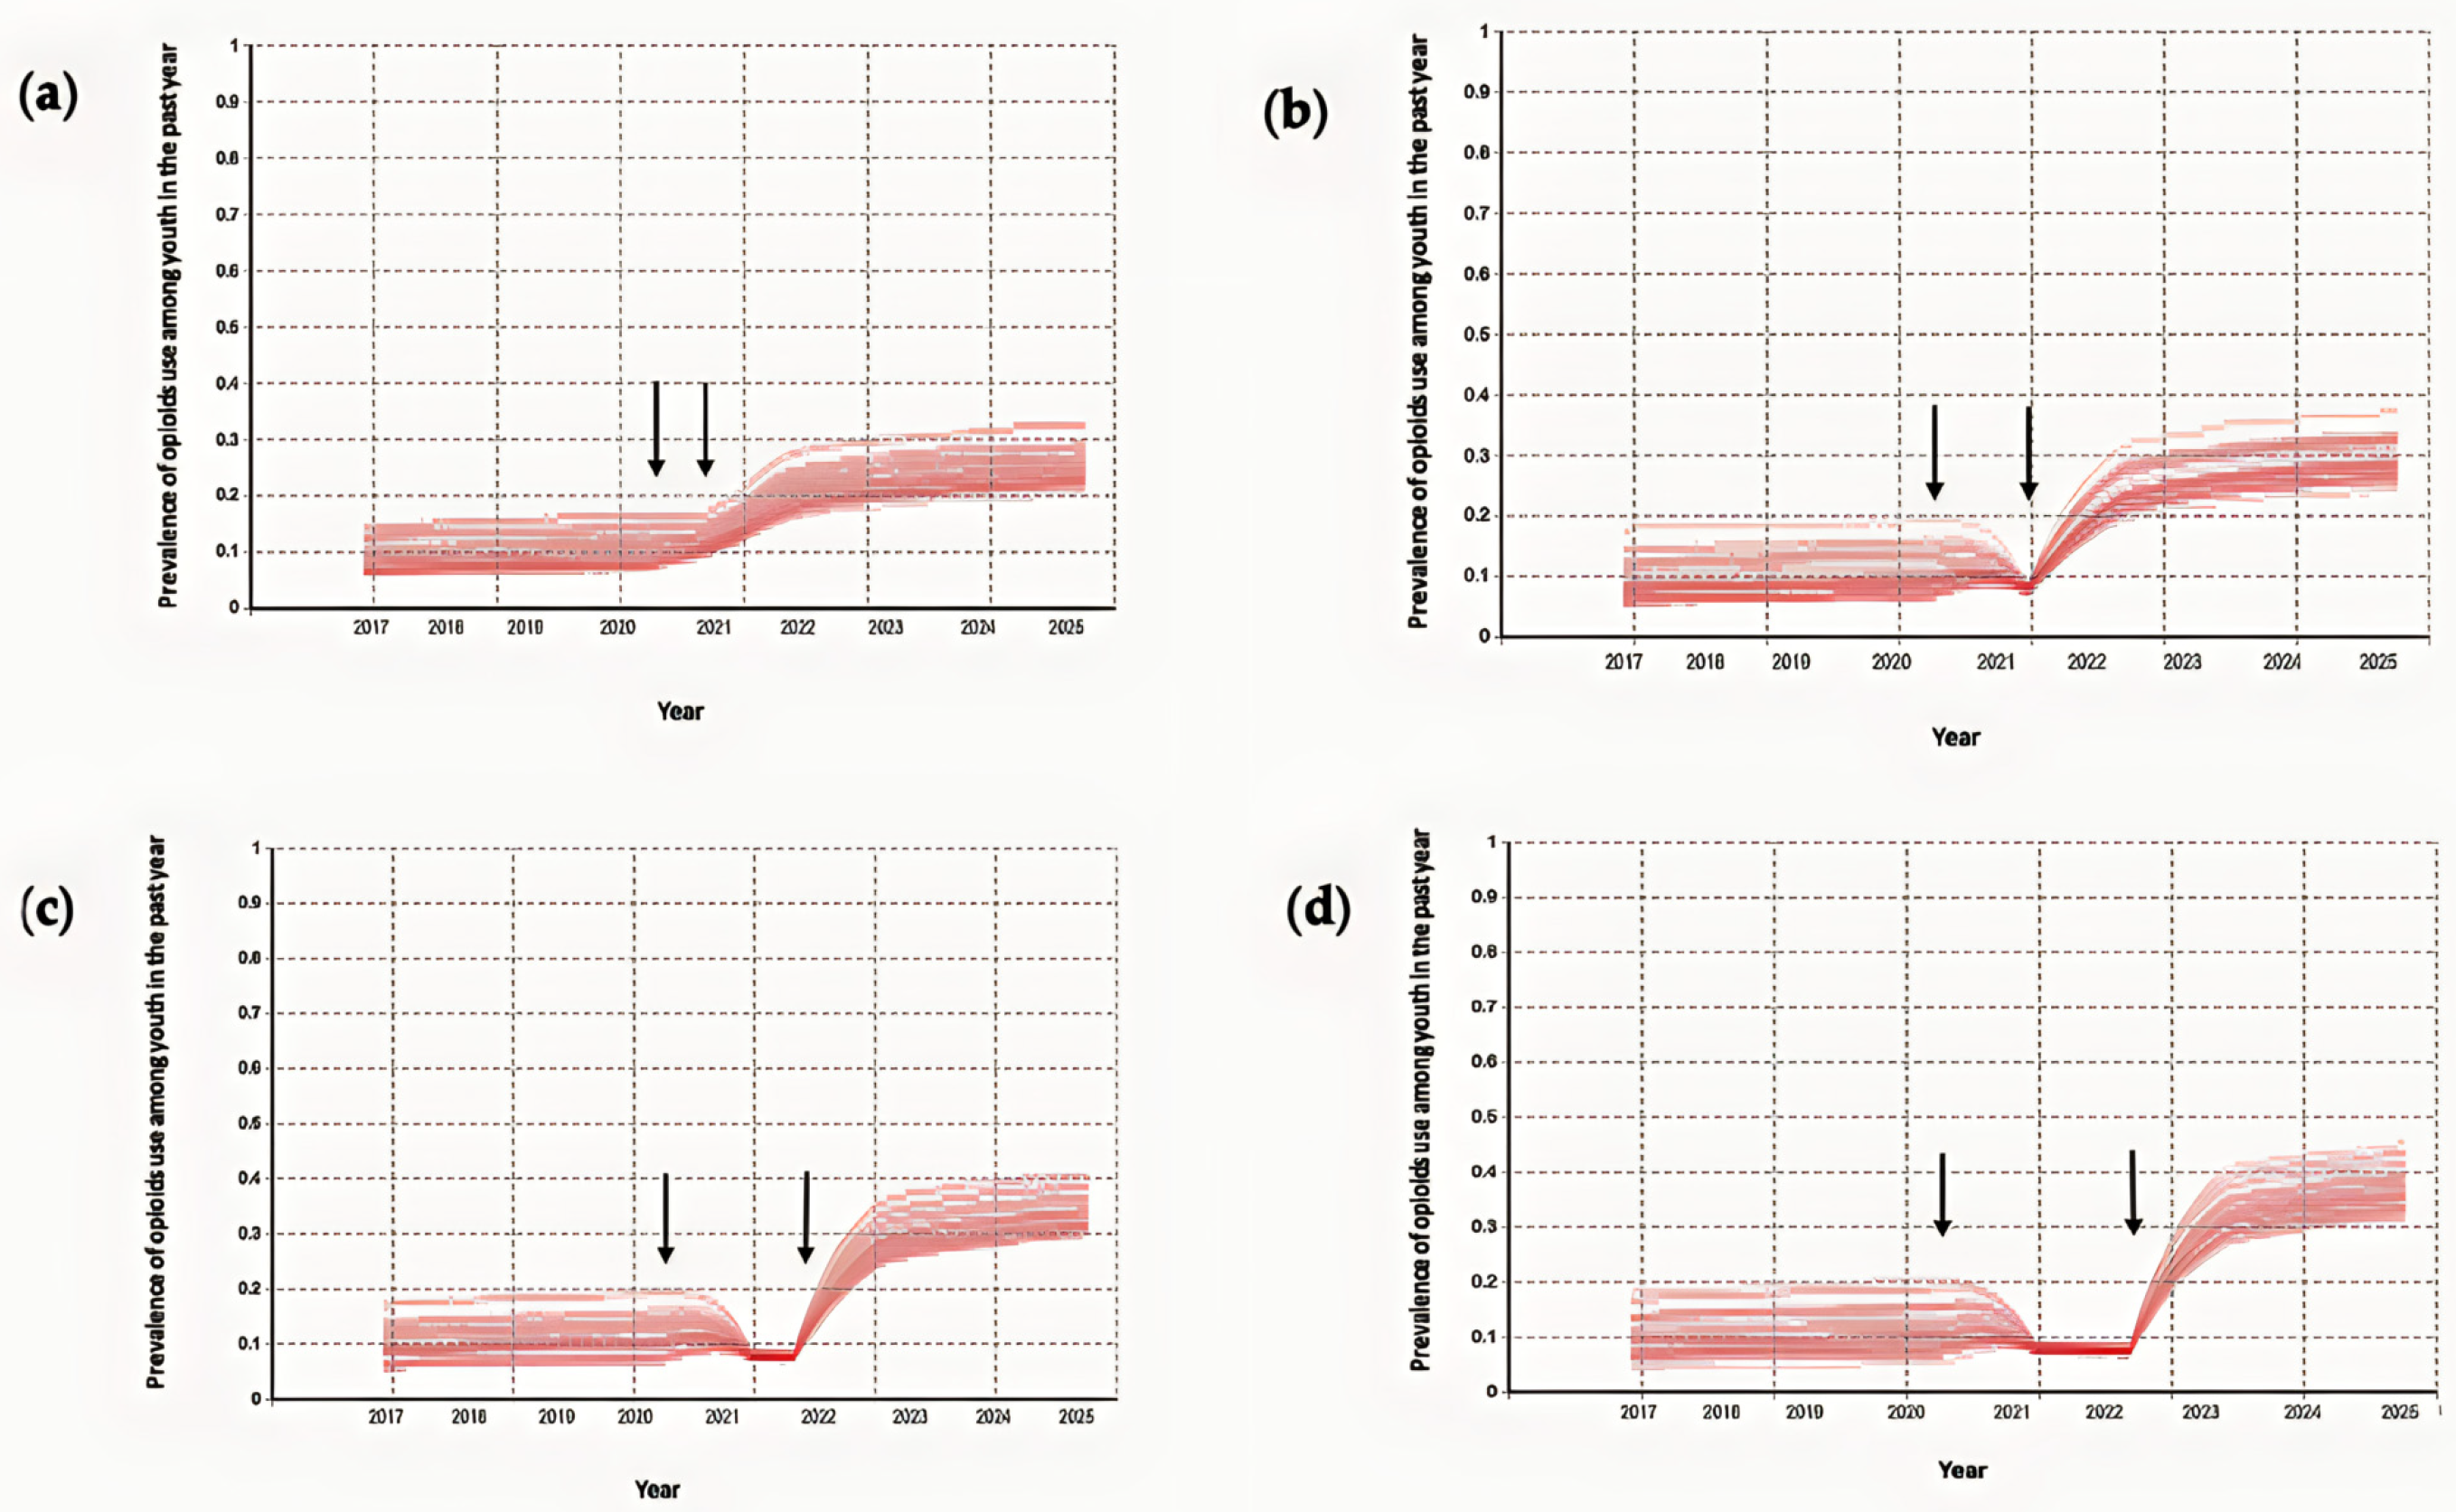
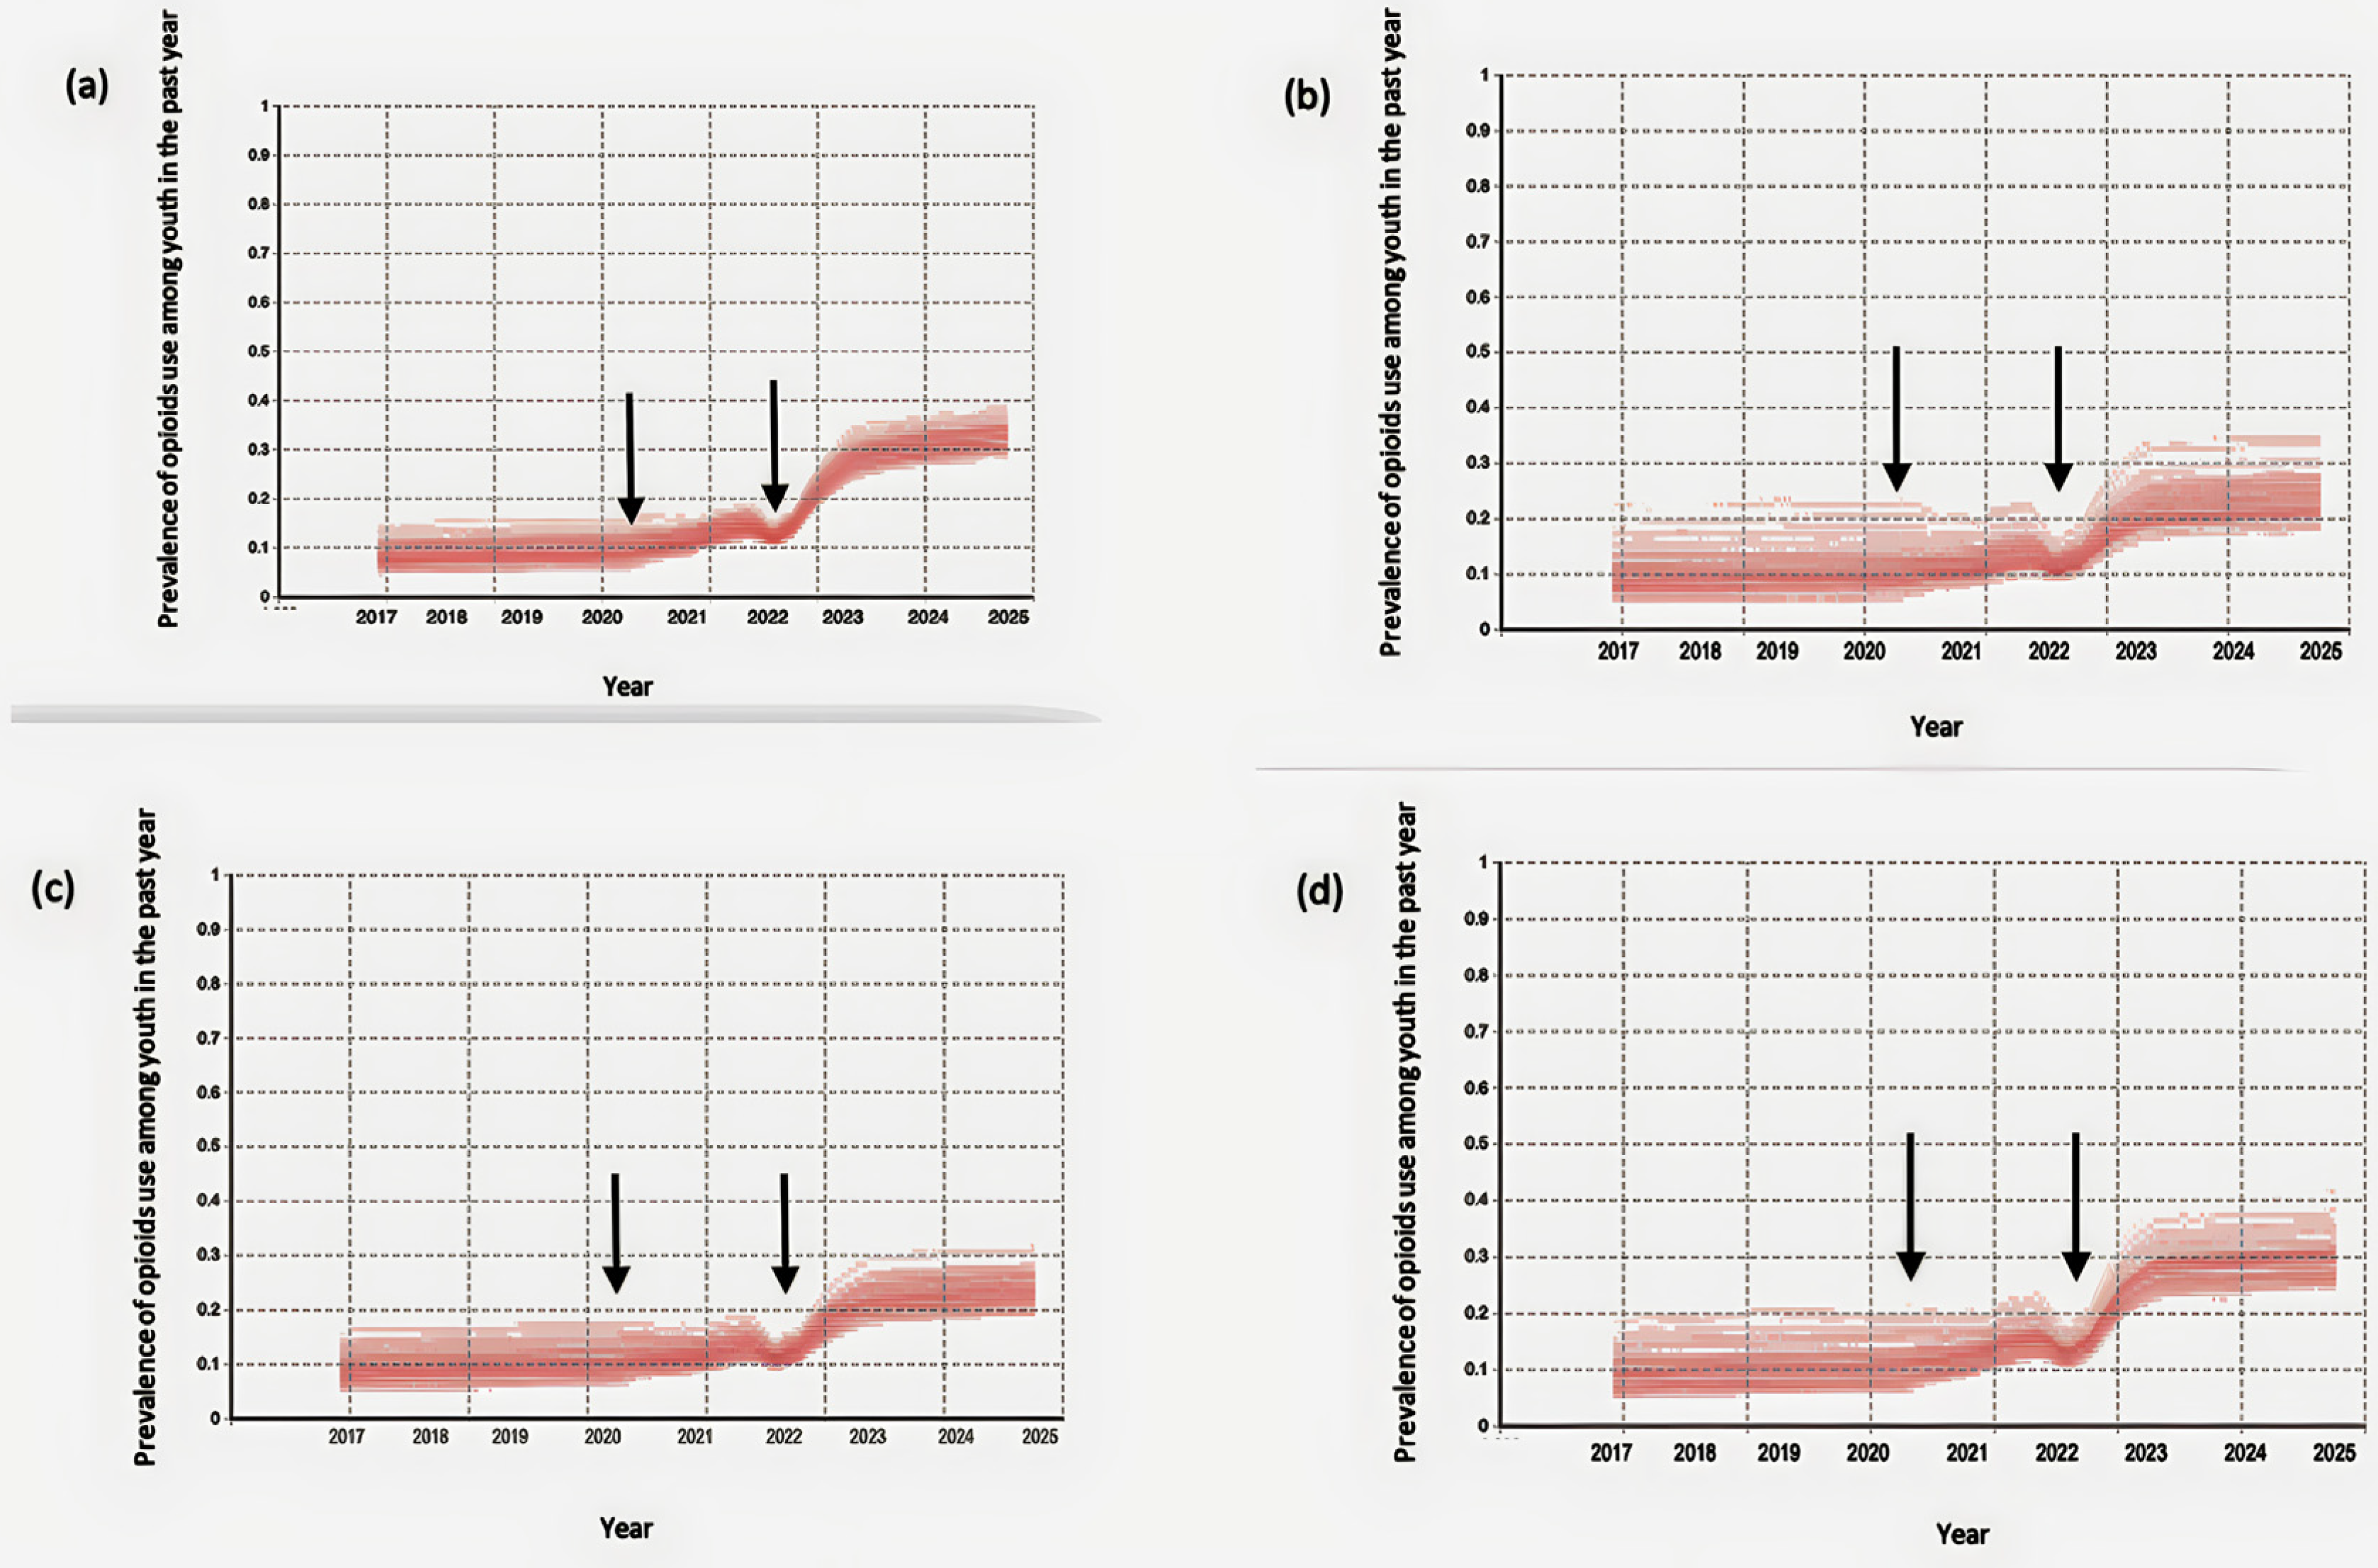
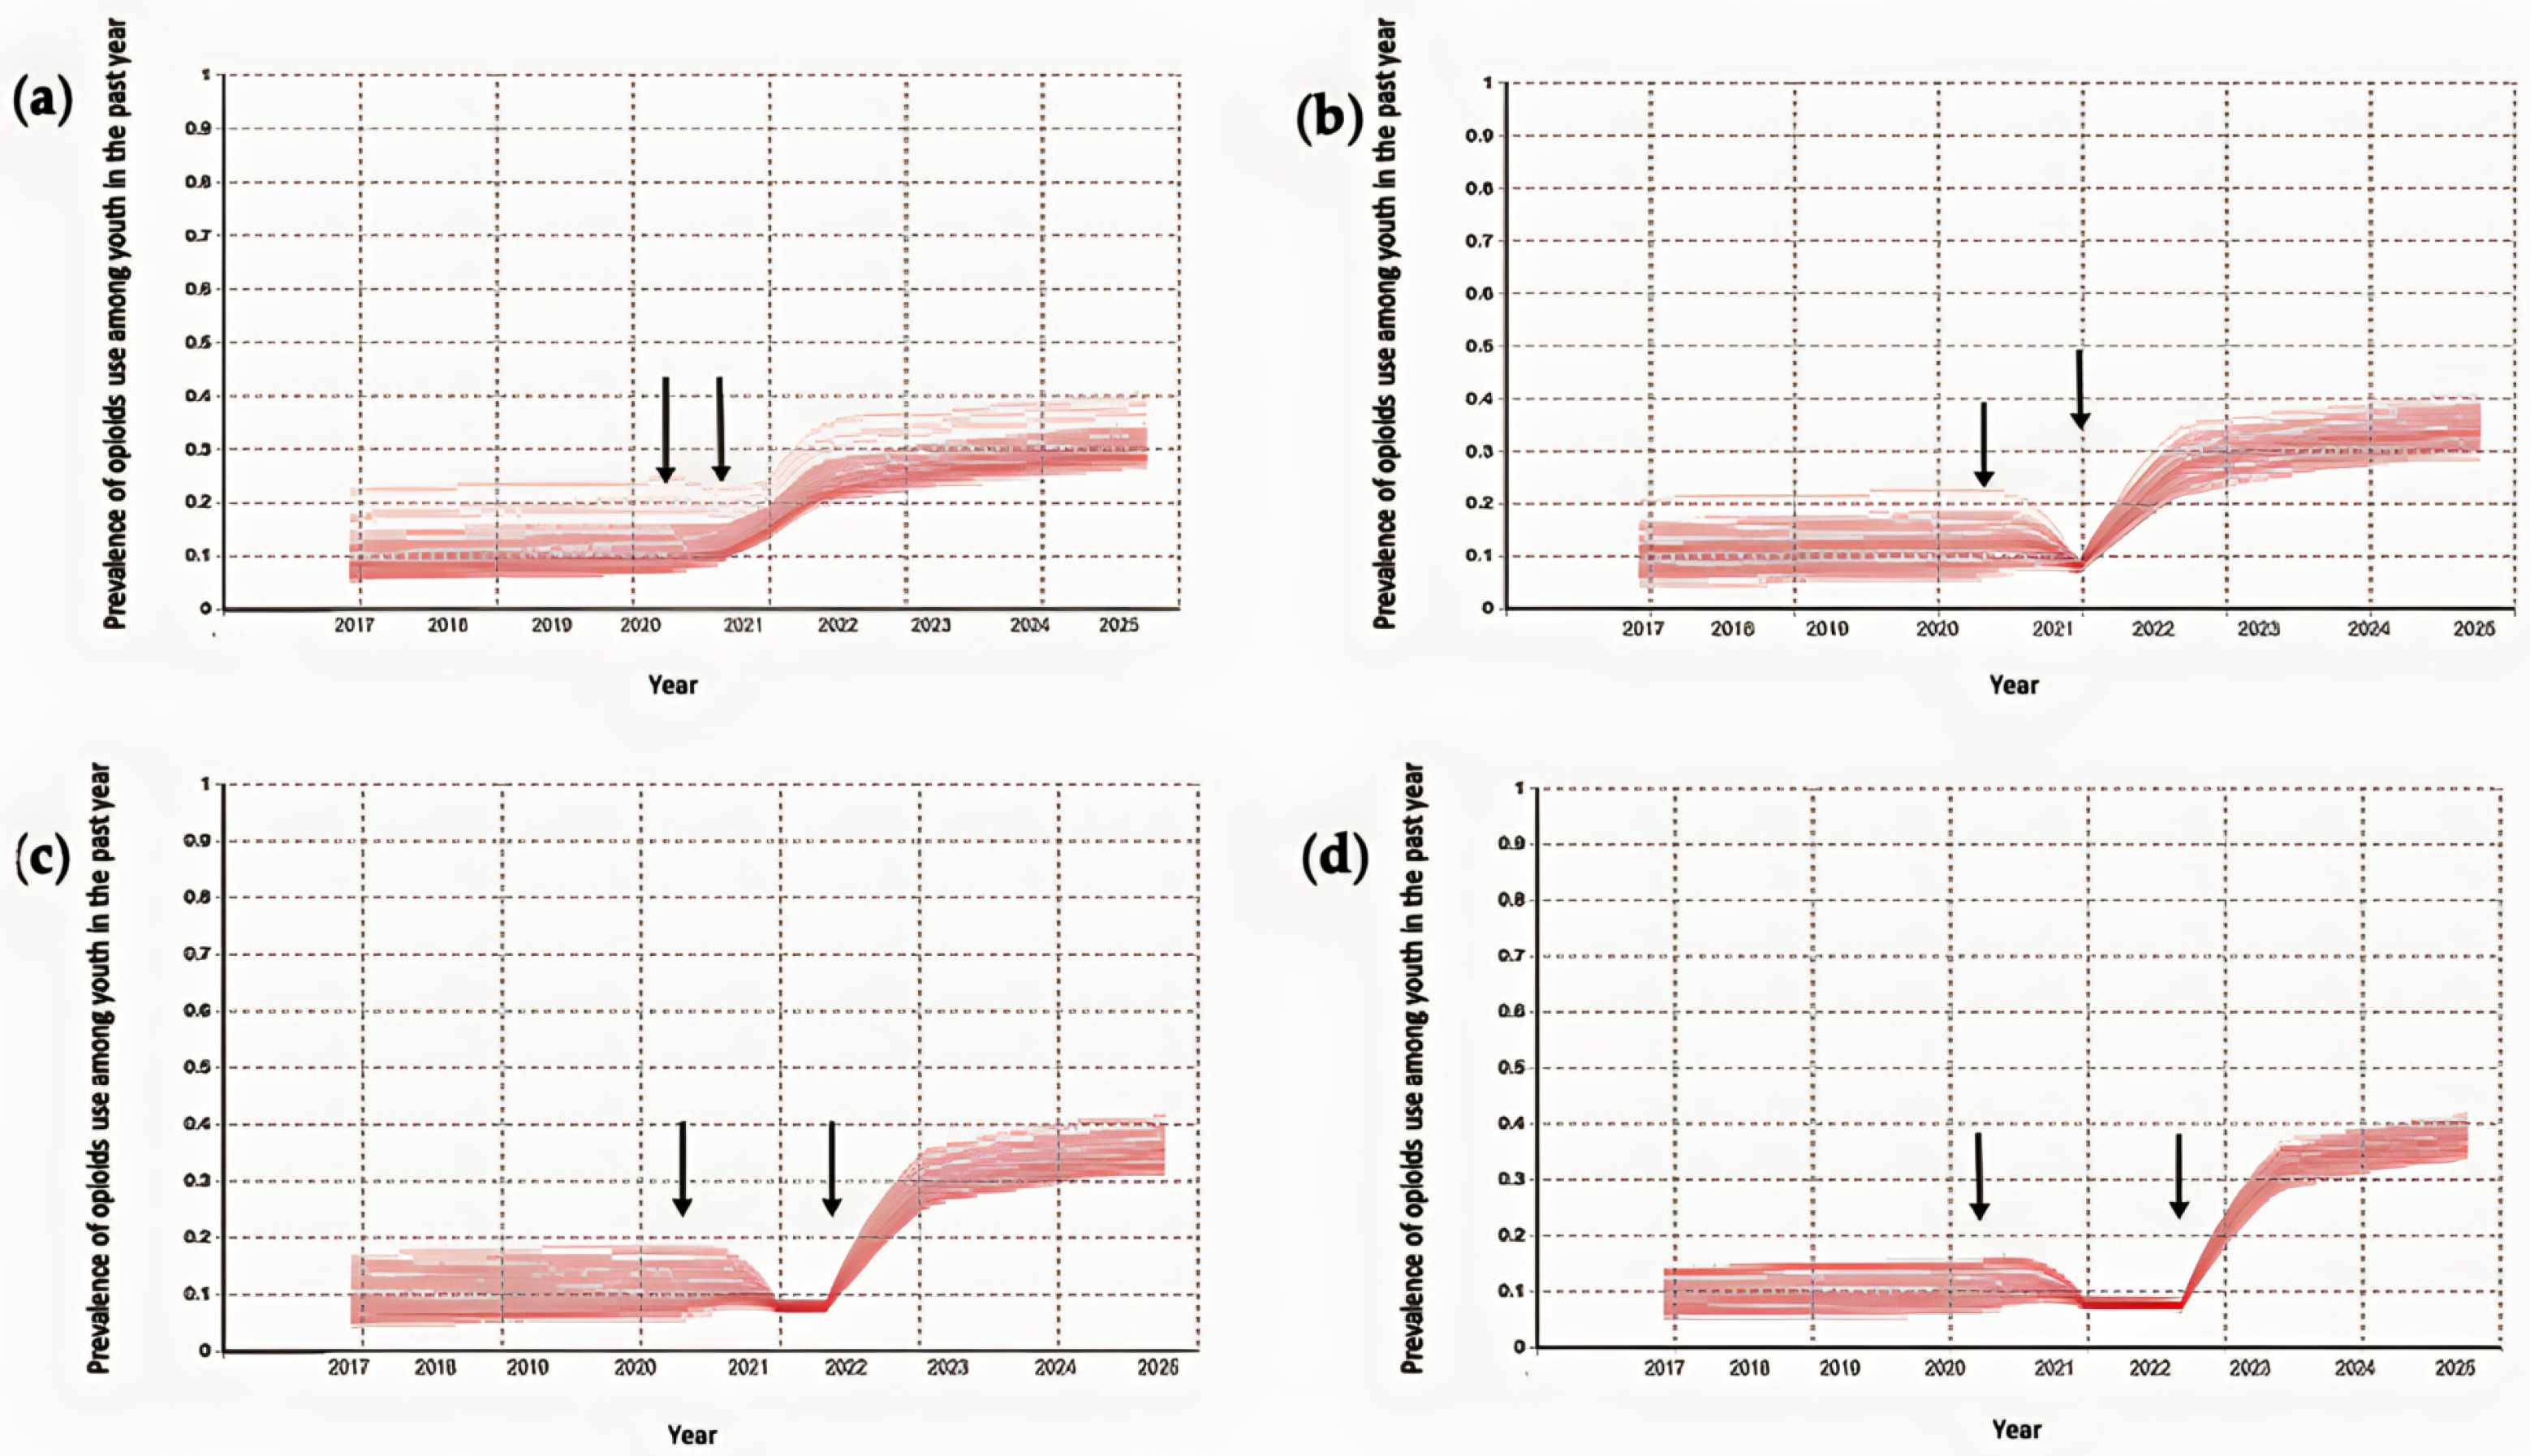
Figure 5 illustrates the model-generated prevalence of youth with nonmedical prescription opioid use in the past year for the different durations of in-person school closures. There is a small increase in the prevalence of drug use for the first six months of in-person school closures. Following this initial increase in prevalence, scenarios exhibit a decline to a steady level for the next six months of in-person school closures. Following that—for sufficiently long durations of in-person school closures—a plateau persists until the end of the in-person school closures. The prevalence of youth with nonmedical prescription opioid use significantly increases after the lifting of the in-person school closures, regardless of its duration. Nevertheless, the appearance of the increase remained consistent across different levels of in-person socialization following the lifting of in-person school closures, supporting the robustness of this conclusion (See Figure A1 and Figure A2).
3.2. Simulation of the Model Using Ontario School Closure Timeline
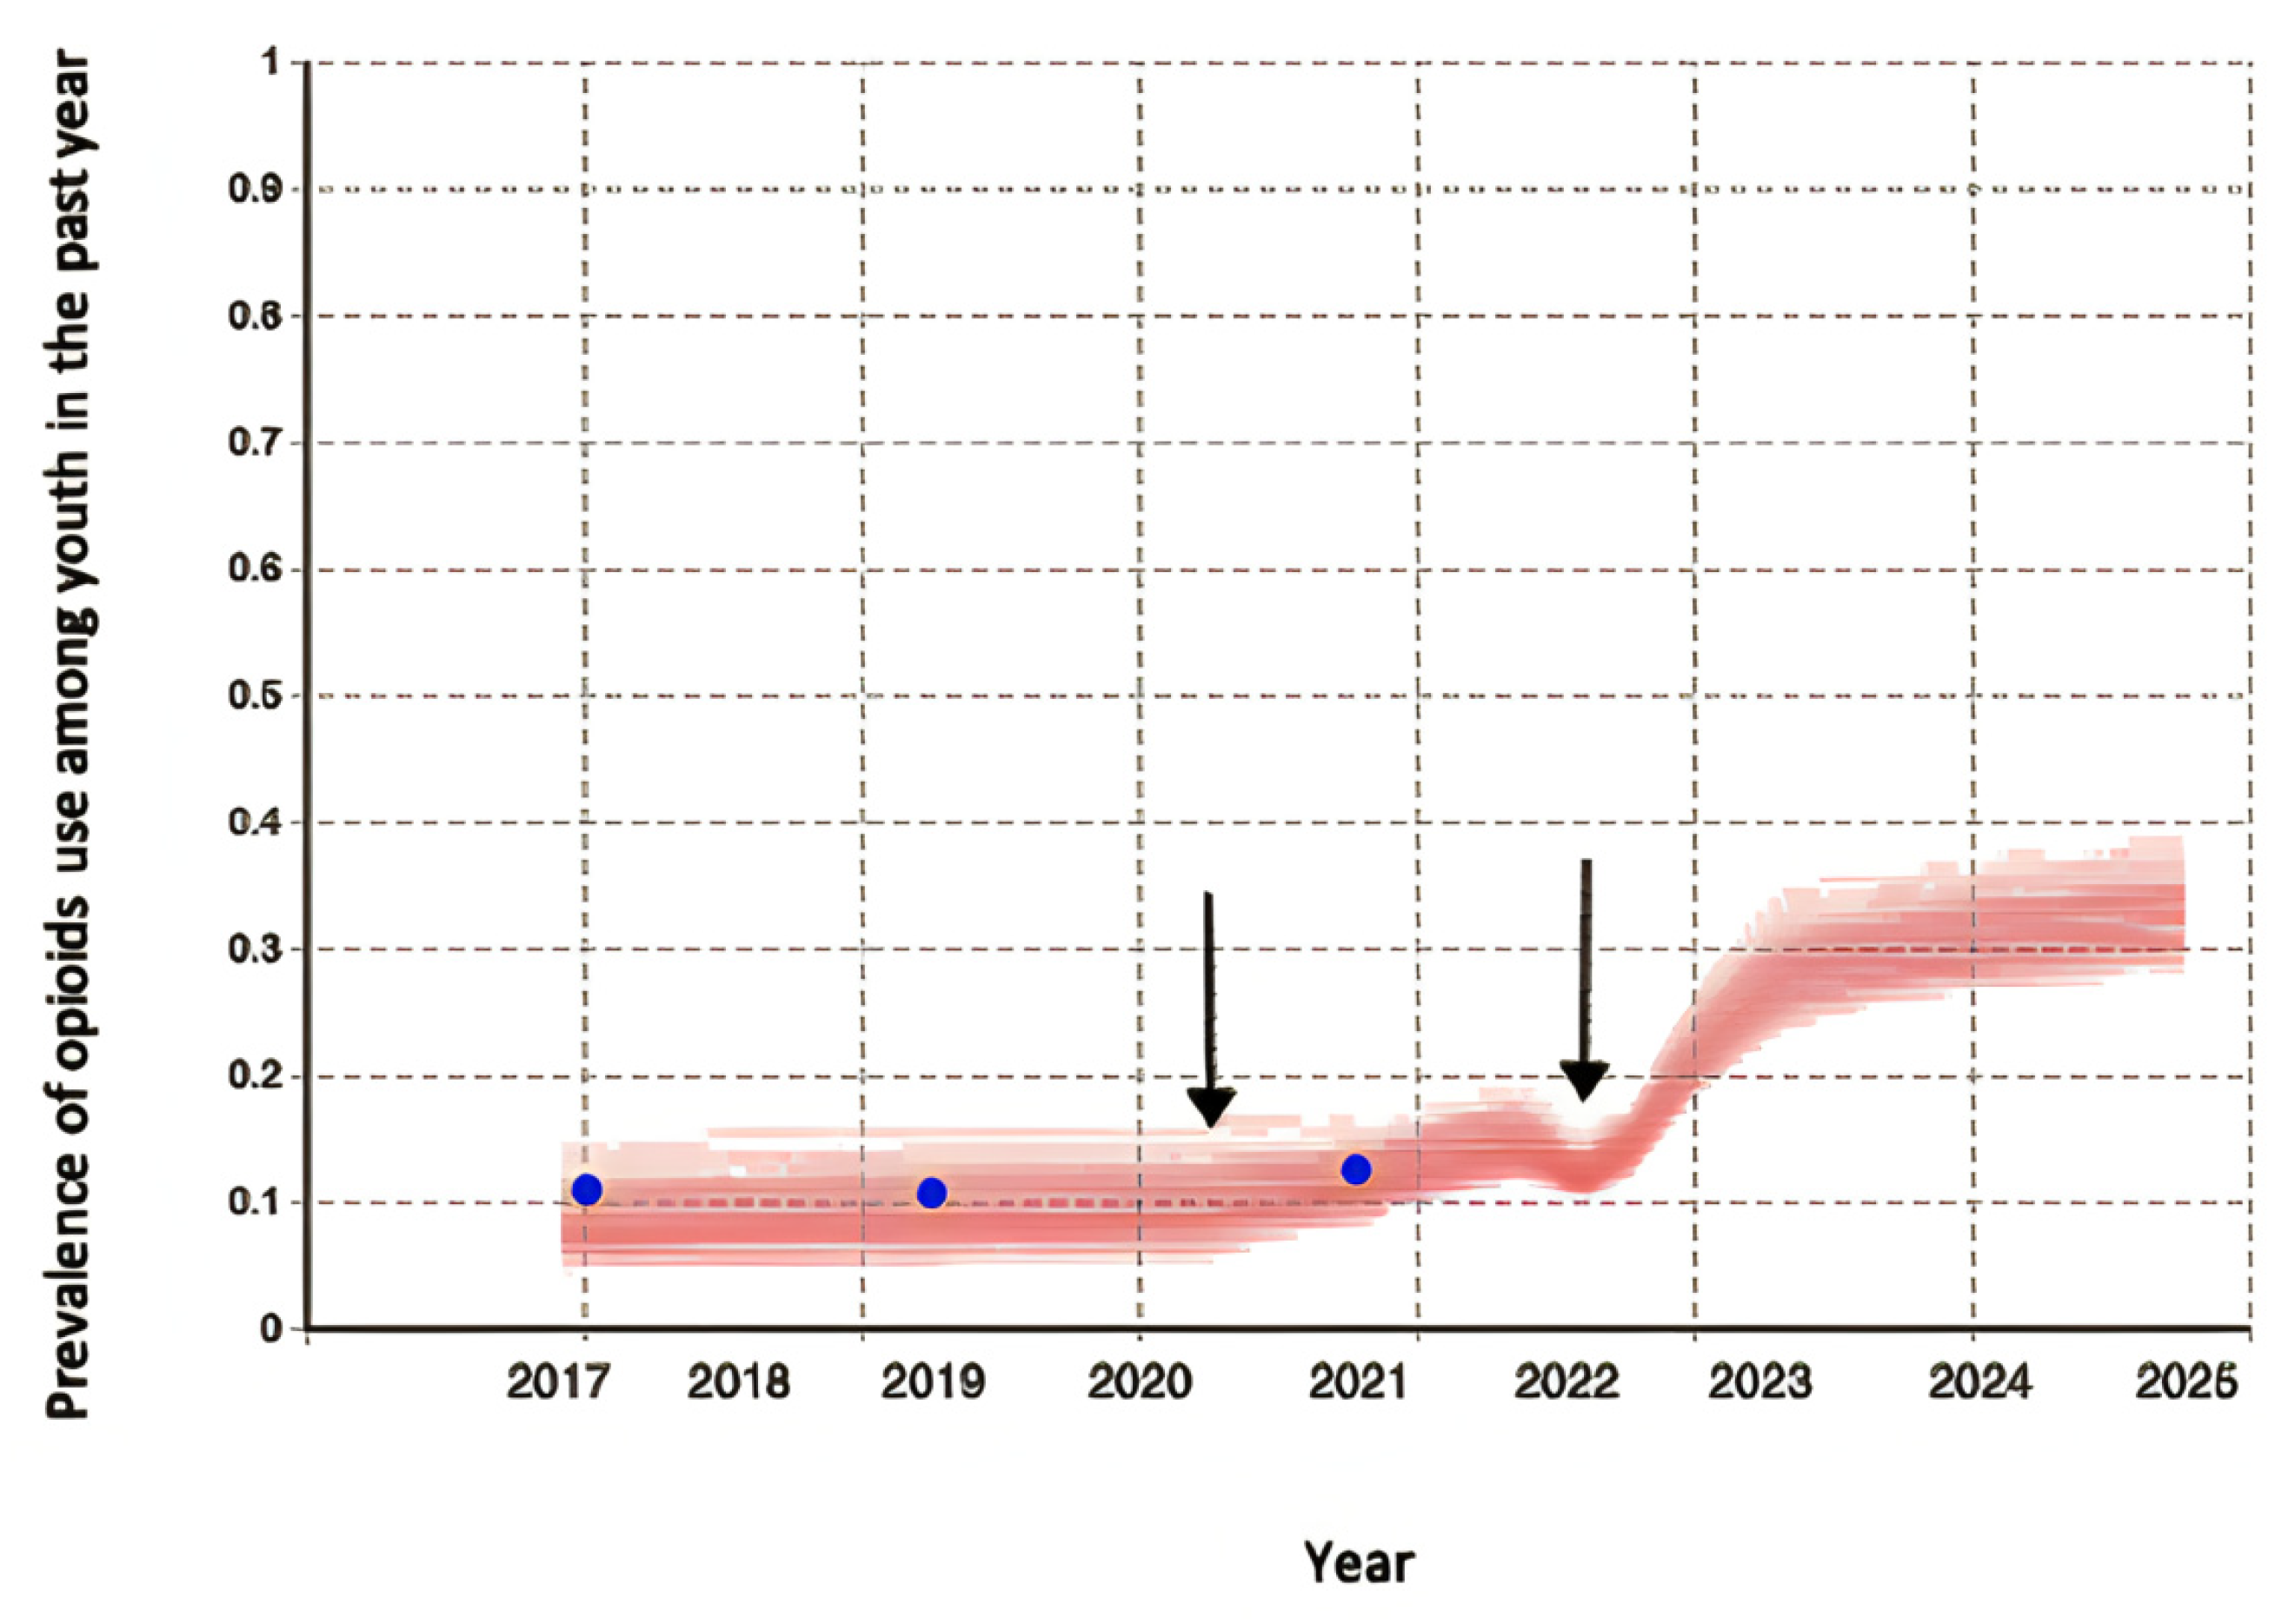
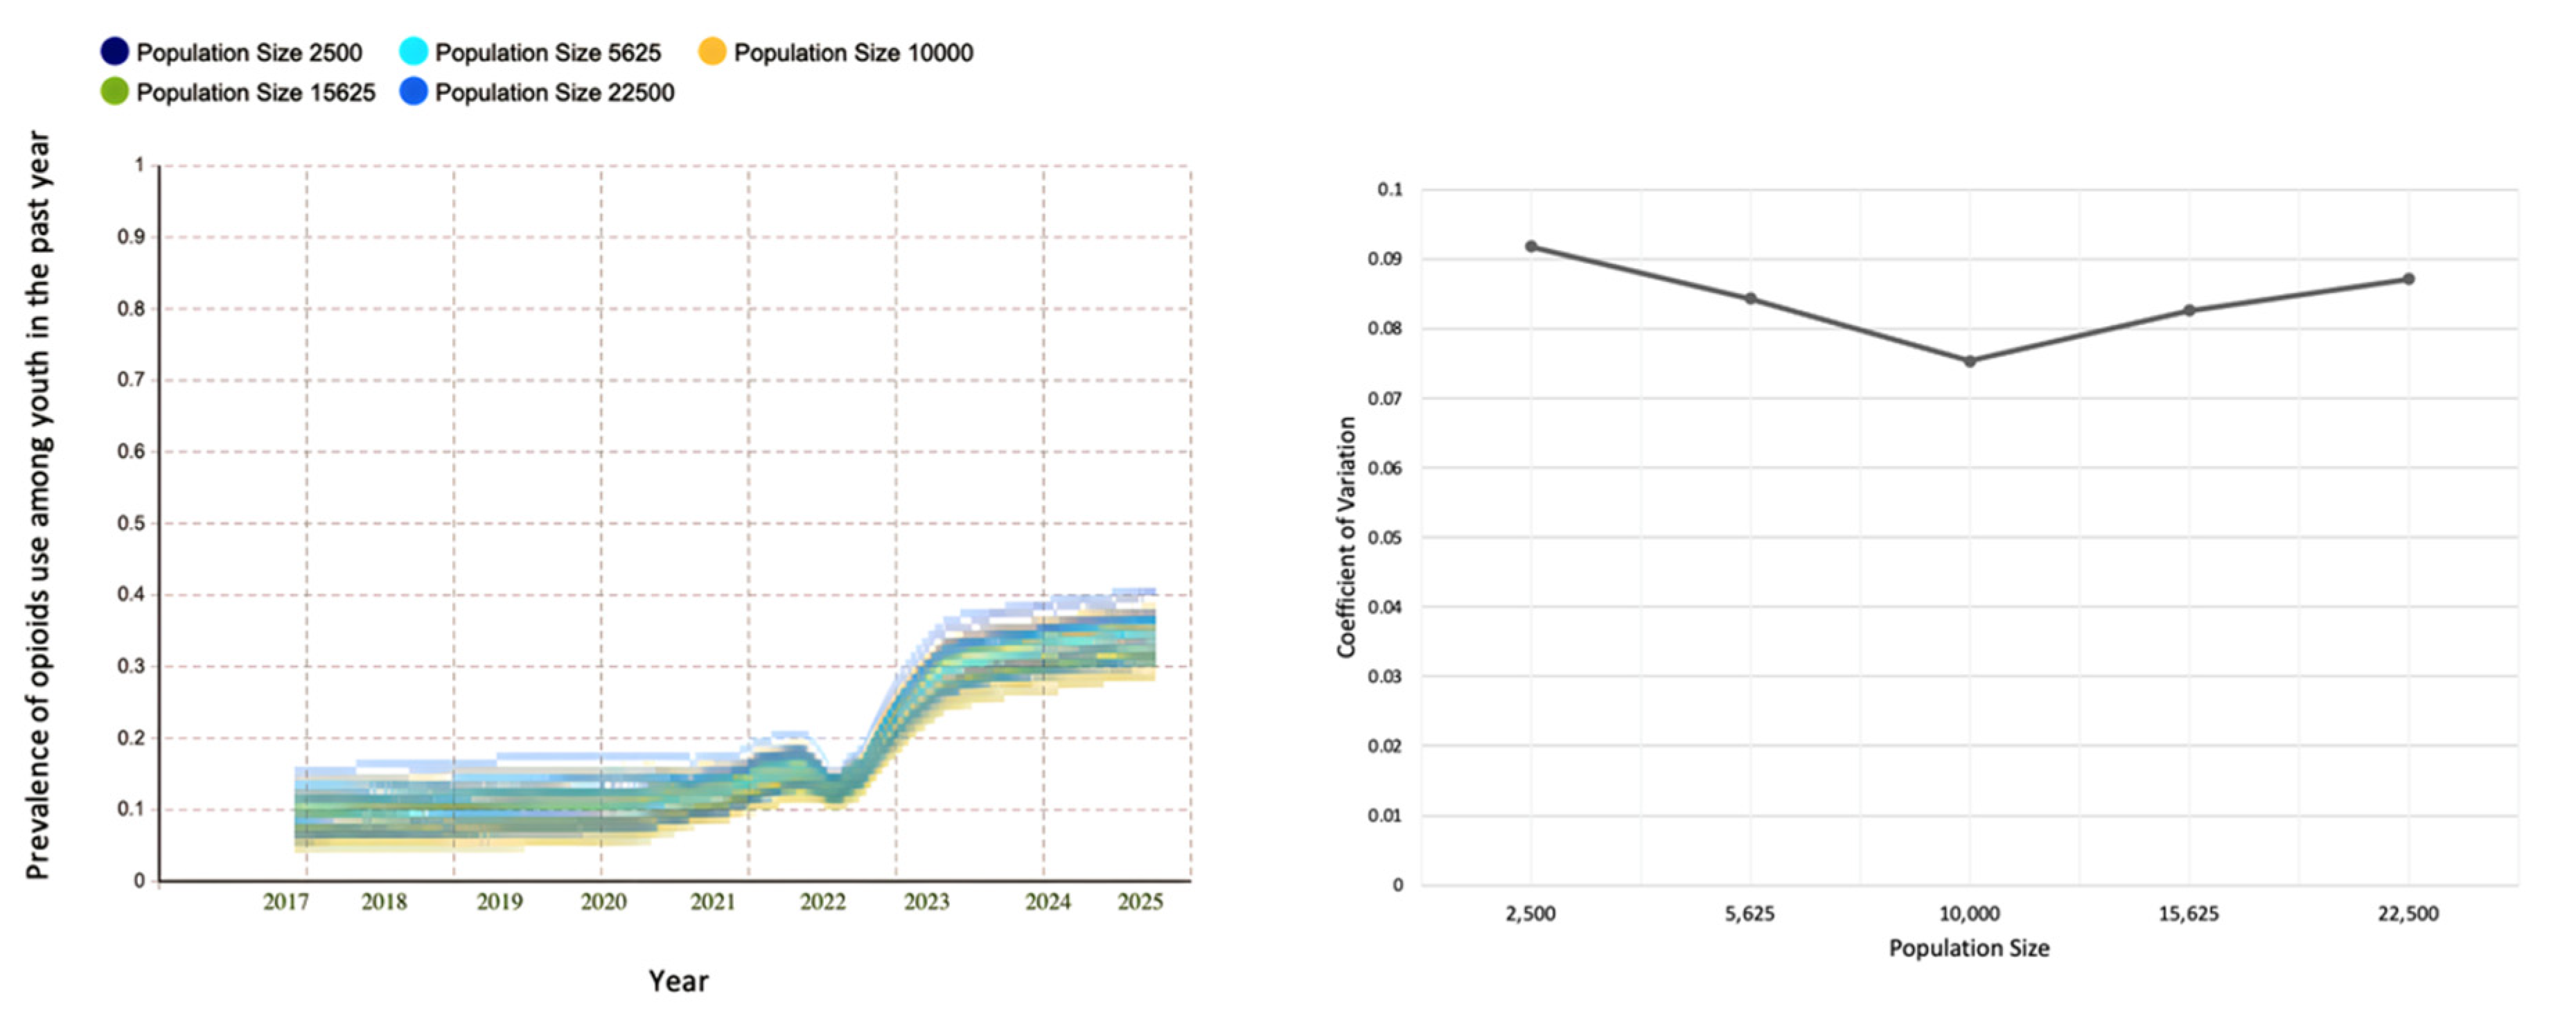
Figure 6 represents the model-generated prevalence of youth exhibiting nonmedical prescription opioid use in the past year based on the Ontario school closure timeline. Figure 6 also demonstrates a visually good fit between the observed and model-generated prevalence of youth with nonmedical prescription opioids, persisting even in the middle of in-person school closures in 2021. After the first school closure came into effect on 14 March 2020, the model-generated prevalence of youth exhibiting nonmedical prescription opioid use shows an increasing trend. The increase continues through the year as schooling experiences were more differentiated across Ontario with the different possible levels of socialization for youth. However, as the second mass in-person school closures due to the COVID-19 pandemic lasted for more than six months, the model-generated prevalence of drug use shows a downward shift. The model-generated prevalence of youth exhibiting nonmedical prescription opioid use increases after the lifting of the in-person school closures. Further, we used the model to estimate the overall impact of in-person school closures through the COVID-19 pandemic on youth opioid use by comparing the model-generated prevalence of drug use in 2025, with and without in-person school closures due to the COVID-19 pandemic. The model-generated prevalence of youth exhibiting nonmedical prescription opioid use could show a significant increase (of +195%) in 2025 as a consequence of in-person school closures. Furthermore, the distributions of simulation outputs and the coefficient of variation remain relatively stable under different population sizes (See Figure A3).
3.3. Impact of Safely Storing Prescription Opioids at Home on the Result of the Model Using the Ontario School Closure Timeline
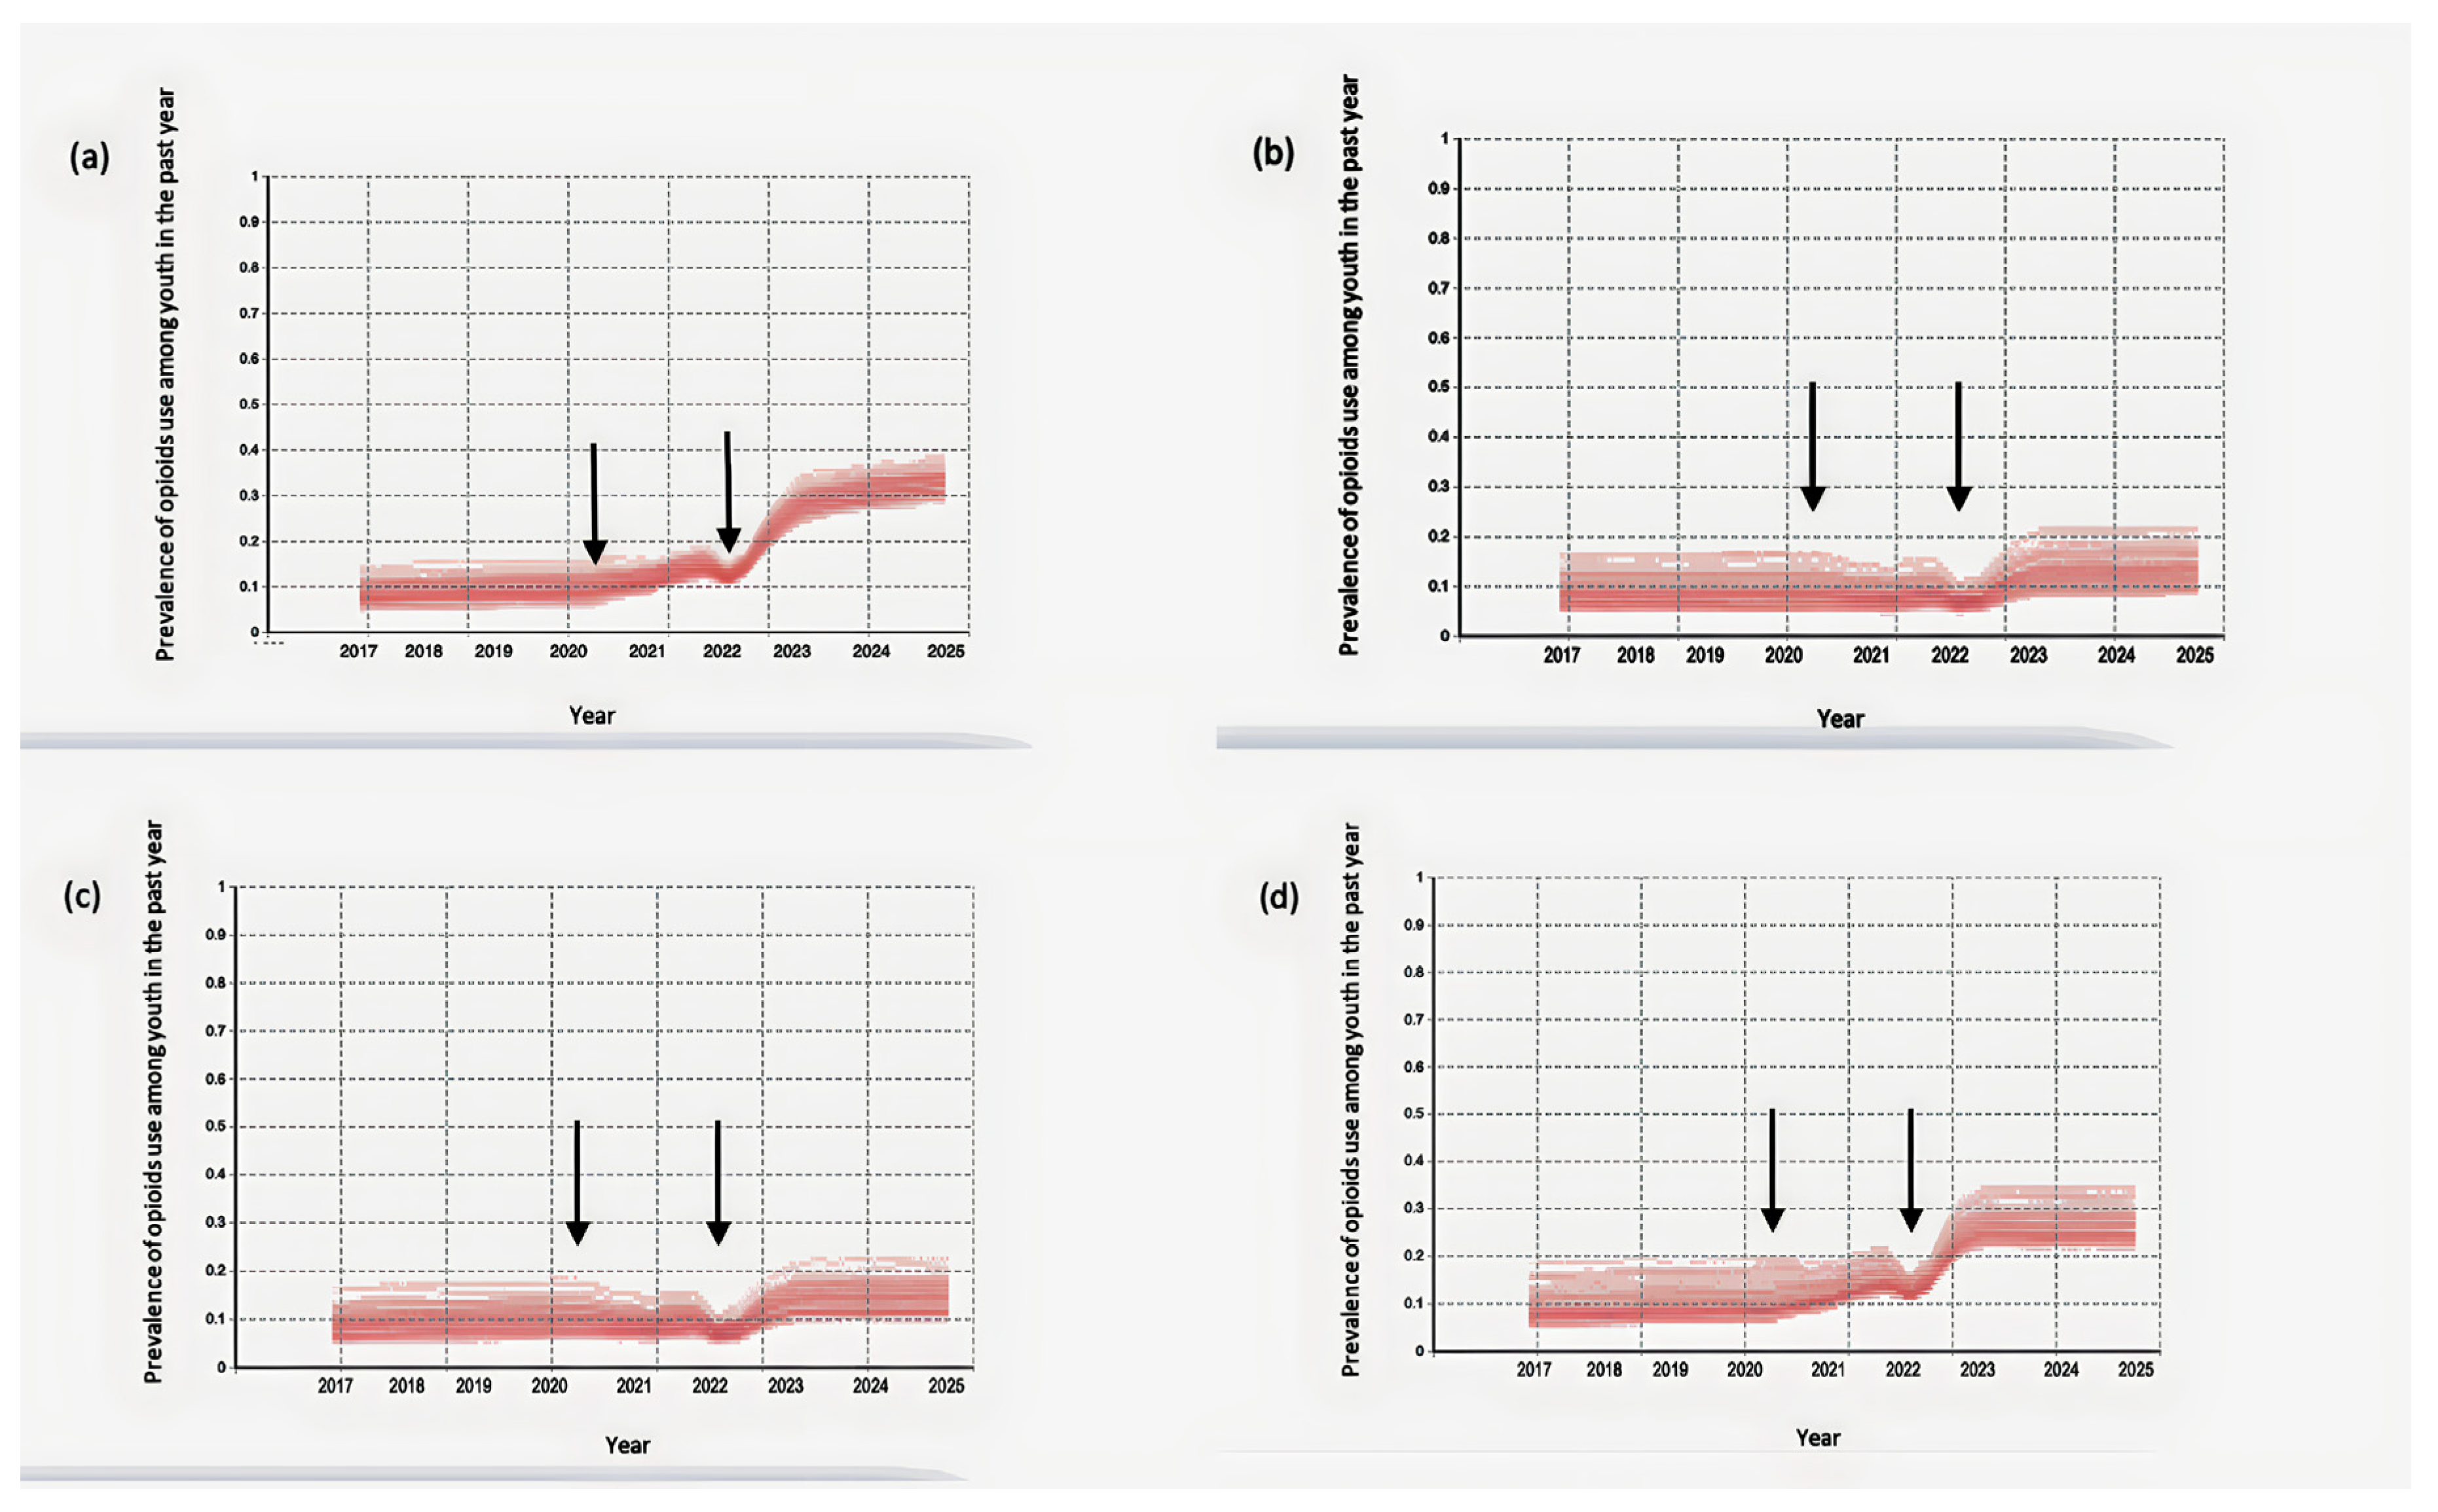
Figure 7 illustrates the impact of safely storing prescription opioids at home on the prevalence of youth with nonmedical prescription opioid use in the past year. Specifically, it shows the impacts when youth exposure to prescription opioids at home is reduced by 20%. Figure 7b illustrates a scenario in which the intervention of safely storing prescription opioids with a decrease of 20% in youth exposure to prescription opioids at home was implemented in 2017. Figure 7c depicts the effects of this intervention when it was implemented at the start of the COVID-19-related in-person school closures, while Figure 7d depicts the effects of the intervention of securely storing prescription opioids when it was implemented at the start of the 2022–2023 academic year. Cases in which this intervention was implemented before or early in the COVID-19-related in-person school closures slightly mitigate the extent of the increase in prevalence of drug use after the lifting of in-person school closures (Figure 7b,c). However, even a delayed implementation of safely storing prescription opioids—where such precautions are introduced after the lifting of the COVID-19-related in-person school closures—has also achieved a modest reduction in the peak in the prevalence of youth with nonmedical prescription opioid use (Figure 7d).
Decreasing youth exposure to prescription opioids by 20% would reduce the prevalence of youth with nonmedical prescription opioid use after the lifting of the COVID-19-related in-person school closures by 27% and 28% in 2025 relative to the baseline, depending on whether the intervention was implemented before or at the beginning of the COVID-19-related in-person school closures, respectively. However, late implementation of the intervention at the start of the 2022–2023 academic year would also reduce the prevalence of youth with nonmedical prescription opioid use in 2025 by 9%, relative to the result of the model using the Ontario school closure timeline without any intervention.
The results of the model also indicate that decreasing youth exposure to prescription opioids by 50% can lead to a significant reduction in the prevalence of nonmedical prescription opioid use among youth after the lifting of the COVID-19-related in-person school closures. Specifically, the prevalence of youth with nonmedical prescription opioid use in 2025 would be reduced by 58% and 56%, depending on whether the intervention was implemented before or at the beginning of the COVID-19-related in-person school closures, respectively. With a late implementation at the start of the 2022–2023 academic year, the prevalence of youth with nonmedical prescription opioid use in 2025 would still be reduced by 19% in comparison to the model using the Ontario school closure timeline without any intervention (See Figure A4).
Finally, a significant decrease in youth exposure to prescription opioids by 80% could greatly reduce the prevalence of nonmedical prescription opioid use among youth following the lifting of the COVID-19-related in-person school closures. The prevalence of youth with nonmedical prescription opioid use in 2025 could be lowered by 68% and 66% if the intervention was implemented prior to or at the beginning of the COVID-19-related in-person school closures, respectively. Even with a delayed implementation at the start of the 2022–2023 academic year, the prevalence of youth with nonmedical prescription opioid use in 2025 could still be reduced by 21% compared to the model using the Ontario school closure timeline without any intervention (See Figure A5).
4. Discussion
This simulation demonstrates that public health orders mandating in-person school closures may have had direct and indirect effects on youth opioid use during and after school closure. Limited in-person social interaction changes the circumstances surrounding youth, resulting in unintended consequences on risk factors for opioid use. The simulation illustrates that the pervasiveness of unsafely stored opioids in homes and limited in-person social interaction with anti-drug peers could facilitate the initiation of opioid use among youth. However, decreasing social events for recreational drug use, the absence of peers who might encourage taking certain risks [76], and the negative effect of withdrawal symptoms limit the increase of opioid use further during in-person school closures. The lifting of in-person school closures may lead to a high increase in the prevalence of youth engaged in nonmedical prescription opioid use. The “rebound” effect on the prevalence of nonmedical prescription opioid use after in-person school closures end could occur for several reasons. One possible explanation is that when in-person school closures end, youths may be more likely to come into contact with peers who use drugs. These social networks can play an important role in shaping youth drug use behaviors. The increased socialization that occurs when school is in person can expose young people to a higher risk of peer pressure and influence, which could lead to an increase in drug use. The literature also argues the plausibility that ongoing effects of the COVID-19 pandemic in North America will place youth at a greater risk for nonmedical prescription opioid use [15,77,78]. Factors outside the scope of the model may have influenced such effects in either direction. For example, while family members staying home from work may have restricted youth access to opioids in some households, in some settings, the consequences of concurrent parental unemployment and spending more time at home and witnessing possible elevated levels of family member substance use [19] may put youth at a higher risk for opioid use.
The simulation outcomes demonstrate that interventions that decrease youth exposure to prescription opioids in the home context could constitute an effective intervention pathway to mitigate what could be a significant increase in youth opioid use following the lifting of in-person school closures. Interventions targeting associated risk factors for youth exposure to prescription opioids at home can be beneficial whenever they come into effect, whether before or during in-person school closures; while the benefits secured by intervention at those times are particularly pronounced, later implementations will also help mitigate what could constitute a significant increase in youth opioid use.
The findings from this study should be interpreted within the context of the following limitations. First, the current approach focuses specifically on the in-person peer socialization component of the peer influence process; this work therefore does not consider either peer selection or online peer socialization, which may influence regular substance use among youth [79,80]. Instead, our goal was to identify the extent to which lack of in-person peer socialization as a result of in-person school closures could plausibly influence nonmedical opioid use among youth. Second, research indicates that youth consumption of prescription opioids may be mediated by anxiety and hopelessness [81], as contributed to by the adverse psychological impacts on youth from the pandemic compounded by in-person school closures and isolation from peers. Since this study focused on the sociological aspect of substance use in particular, future research could study psychological factors which may have a reinforcing effect on youth drug use. Third, the current modeling analysis does not explicitly track the effect of opioid tolerance and possible overdoses on later opioid use among youth. Fourth, the current level of model abstraction filtered out some less-essential details for youth within the model, such as youth siblings, youth year in school, and disconnection from peers after school. Finally, exploring alternative network structures and theories of opinion dynamics among youth in future agent-based modeling studies may be worthwhile. Of particular note, more extensive national data on youth opioid use would especially inform the model parameterization and assumptions, support testing the plausibility of model baseline scenario outcomes, and support critical evaluation of the current conclusions.
Despite these limitations, identifying a potential increase in the prevalence of youth with nonmedical prescription opioid use after the lifting of in-person school closures suggests the importance of effective opioid surveillance, and awareness and availability of naloxone and treatment options to prevent serious medical outcomes and death in this vulnerable population. Furthermore, efforts to encourage new opioid packaging, such as personalized pill dispensers, may lower the accessibility of incompletely dispensed prescription opioids. It should be noted that a disruption to the supply of opioids from home should be combined with supporting and promoting awareness of the risks of opioid abuse amongst youth.
Author Contributions
Conceptualization, N.S. and N.D.O.; methodology, N.S. and N.D.O.; software, N.S.; validation, N.S. and N.D.O.; formal analysis, N.S.; writing—original draft preparation, N.S.; writing—review and editing, N.S. and N.D.O.; visualization, N.S.; supervision, N.D.O. All authors have read and agreed to the published version of the manuscript.
Funding
This research received no external funding.
Data Availability Statement
The data presented in this study are openly available at www.camh.ca/osduhs (accessed on 22 January 2023). The implemented model can be found at https://doi.org/10.5281/zenodo.7559419.
Conflicts of Interest
The authors declare no conflict of interest.
Appendix A
Figure A1.
Model-generated prevalence of youth with nonmedical prescription opioid use in the past year for the different durations of in-person school closures (a–d). The model predicted the prevalence of youth with nonmedical prescription opioid use in the past year for (a) 6-month in-person school closures, (b) 12-month in-person school closures, (c) 18-month in-person school closures, and (d) 24-month in-person school closures. In-person socialization following the lifting of in-person school closures is characterized as a Moore neighborhood of range 1. The two vertical arrows represent the start and end of the in-person school closures for each panel, respectively.
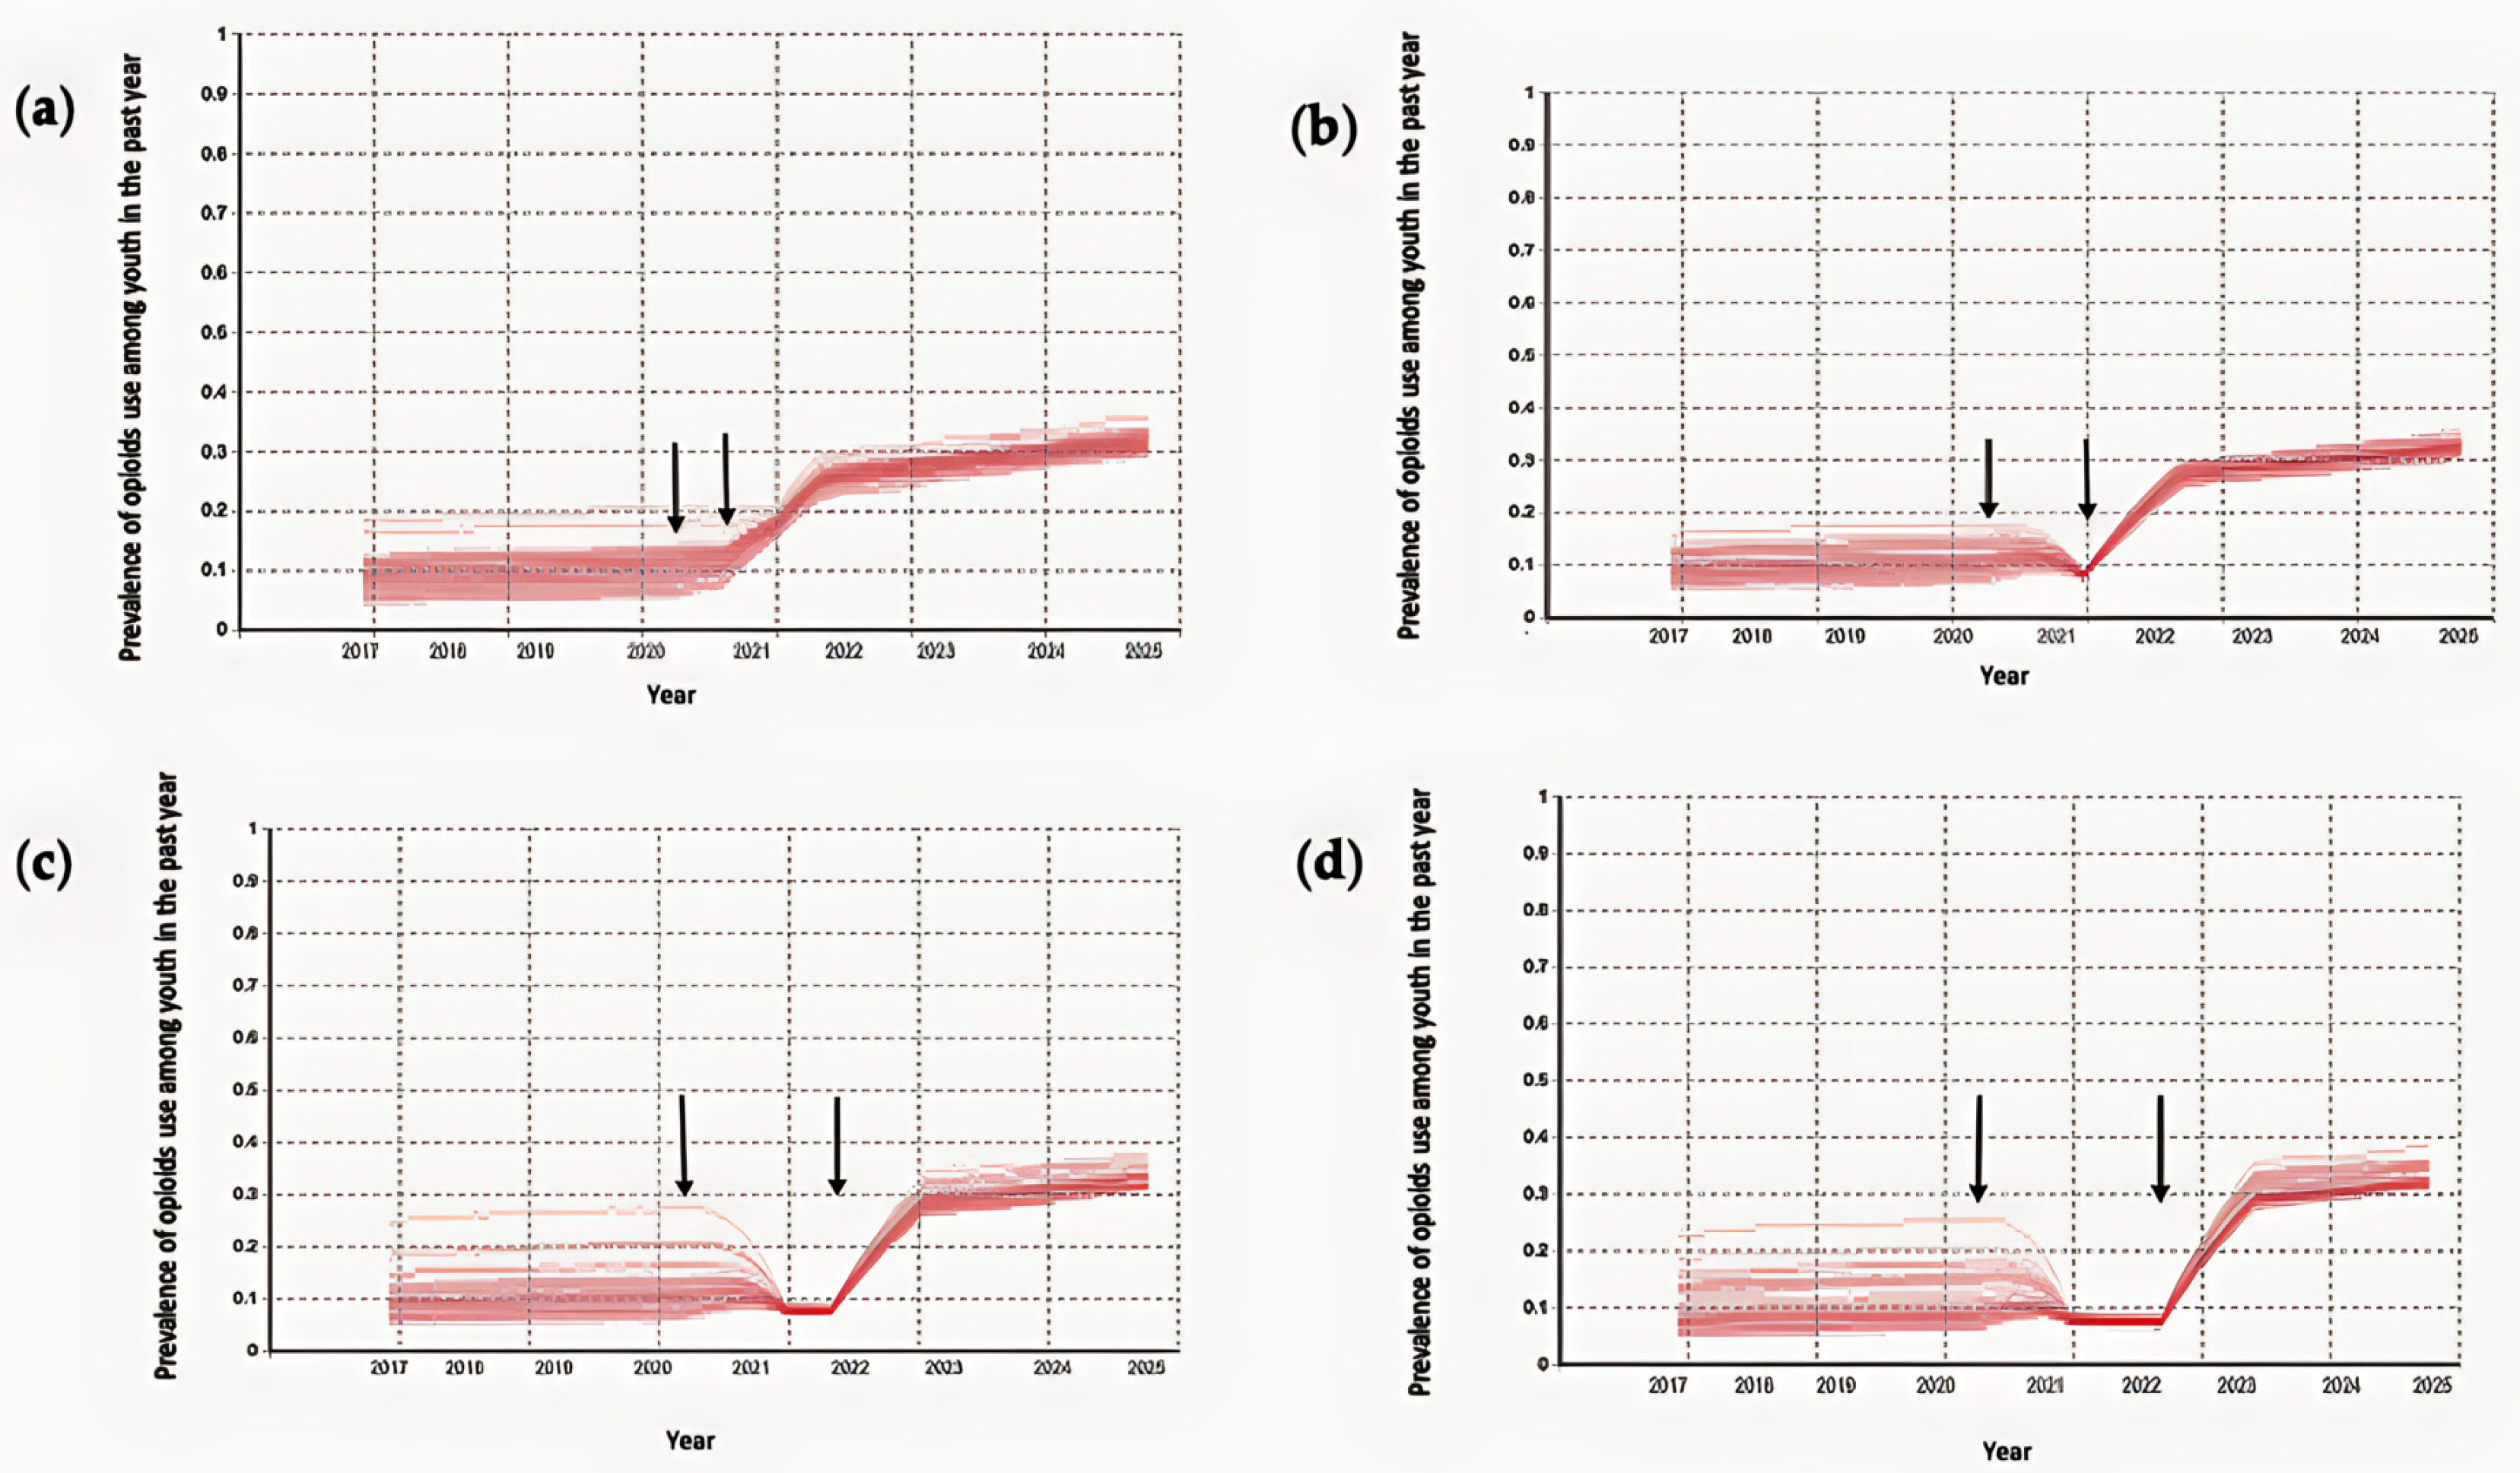
Figure A2.
Model-generated prevalence of youth with nonmedical prescription opioid use in the past year for the different durations of in-person school closures (a–d). The model predicted the prevalence of youth with nonmedical prescription opioid use in the past year for (a) 6-month in-person school closures, (b) 12-month in-person school closures, (c) 18-month in-person school closures, and (d) 24-month in-person school closures. In-person socialization following the lifting of in-person school closures is characterized as a Moore neighborhood of range 2. The two vertical arrows represent the start and end of the in-person school closures for each panel, respectively.

Figure A3.
Model-generated prevalence of youth with nonmedical prescription opioid use in the past year (left-hand side) and coefficient of variation for simulation means and standard deviation in 2025 (right-hand side) of the baseline scenario under different population sizes.
Figure A3.
Model-generated prevalence of youth with nonmedical prescription opioid use in the past year (left-hand side) and coefficient of variation for simulation means and standard deviation in 2025 (right-hand side) of the baseline scenario under different population sizes.

Figure A4.
Model-generated prevalence of youth exhibiting nonmedical prescription opioid use in the past year for the baseline scenario (a) and after applying safe storage intervention with a decrease of 50% in youth exposure to prescription opioids at home beginning at different time points (b–d). The two vertical black arrows represent the start and end of the Ontario school closure timeline. (a) Model-generated prevalence of youth exhibiting nonmedical prescription opioid use in the past year for the baseline scenario. (b) Model-generated prevalence of youth exhibiting nonmedical prescription opioid use in the past year after applying safe storage in 2017. (c) Model-generated prevalence of youth exhibiting nonmedical prescription opioid use in the past year after applying safe storage at the beginning of the general COVID-19-related in-person school closures on 14 March 2020. (d) Model-generated prevalence of youth exhibiting nonmedical prescription opioid use in the past year after applying safe storage at the start of the 2022–2023 academic year.

Figure A5.
Model-generated prevalence of youth exhibiting nonmedical prescription opioid use in the past year for the baseline scenario (a) and after applying safe storage intervention with a decrease of 80% in youth exposure to prescription opioids at home beginning at different time points (b–d). The two vertical black arrows represent the start and end of the Ontario school closure timeline. (a) Model-generated prevalence of youth exhibiting nonmedical prescription opioid use in the past year for the baseline scenario. (b) Model-generated prevalence of youth exhibiting nonmedical prescription opioid use in the past year after applying safe storage in 2017. (c) Model-generated prevalence of youth exhibiting nonmedical prescription opioid use in the past year after applying safe storage at the beginning of the general COVID-19-related in-person school closures on 14 March 2020. (d) Model-generated prevalence of youth exhibiting nonmedical prescription opioid use in the past year after applying safe storage at the start of the 2022–2023 academic year.

Table A1.
Parameters, values, and references.
| Parameter | Values | References |
|---|---|---|
| Youth population size | 10,000 | Assumed |
| Total number of family | 10,000 | Assumed |
| Family size | Poisson probability distribution | Assumed [66] |
| Moore neighborhood range | 0–3 | Assumed |
| Rate of opioid prescription for each family member without prescription opioids (1/week) | 0.003 | Calibrated [67] |
| Probability that the duration of the opioid prescription ends for each family member (1/week) | 0.02 | Calibrated [67] |
| Level of youth exposure to prescription opioids at home | Uniform distribution between 450 and 900 | Calibrated [61,62] |
| Percentage of the socio-cultural environment with a positive drug use view | 14% | Calibrated [61,62] |
| Level of drug promotion inside the drug-positive socio-cultural environment | Uniform distribution between 1 and 1500 | Calibrated [61,62] |
| Initial amount of encountering drug use situations for youth | Lognormal distribution | Calibrated [61,62] |
| Encountering drug use situations coefficient for different level of socialization among youth | Lognormal distribution | Calibrated [61,62] |
| Level of supportiveness for peers | Uniform distribution between 0 and 100 | Assumed [23,58] |
| Level of persuasiveness for peers | Uniform distribution between 0 and 100 | Assumed [23,58] |
| Severity of acute withdrawal from nonmedical opioid use | Lognormal distribution | Calibrated [71] |
| Probability that peers share drugs with peers who request it | 0.075 | Calibrated [61,62] |
References
- Dash, G.F.; Holt, L.; Kenyon, E.A.; Carter, E.K.; Ho, D.; Hudson, K.A.; Ewing, S.W.F. Detection of Vaping, Cannabis Use, and Hazardous Prescription Opioid Use among Adolescents. Lancet Child Adolesc. Health 2022, 6, 820–828. [Google Scholar] [CrossRef] [PubMed]
- Degenhardt, L.; Stockings, E.; Patton, G.; Hall, W.D.; Lynskey, M. The Increasing Global Health Priority of Substance Use in Young People. Lancet Psychiatry 2016, 3, 251–264. [Google Scholar] [CrossRef] [PubMed]
- Dembo, R.; Blount, W.R.; Schmeidler, J.; Burgos, W. Perceived Environmental Drug Use Risk and the Correlates of Early Drug Use or Nonuse among Inner-City Youths: The Motivated Actor. Int. J. Addict. 1986, 21, 977–1000. [Google Scholar] [CrossRef] [PubMed]
- Rhodes, T.; Lilly, R.; Fernández, C.; Giorgino, E.; Kemmesis, U.E.; Ossebaard, H.C.; Lalam, N.; Faasen, I.; Spannow, K.E. Risk Factors Associated with Drug Use: The Importance of ‘Risk Environment’. Drugs Educ. Prev. Policy 2003, 10, 303–329. [Google Scholar] [CrossRef]
- Bauman, K.E.; Ennett, S.T. On the Importance of Peer Influence for Adolescent Drug Use: Commonly Neglected Considerations. Addiction 1996, 91, 185–198. [Google Scholar] [CrossRef]
- Kobus, K. Peers and Adolescent Smoking. Addiction 2003, 98, 37–55. [Google Scholar] [CrossRef]
- Montgomery, S.C.; Donnelly, M.; Bhatnagar, P.; Carlin, A.; Kee, F.; Hunter, R.F. Peer Social Network Processes and Adolescent Health Behaviors: A Systematic Review. Prev. Med. 2020, 130, 105900. [Google Scholar] [CrossRef]
- Salmanzadeh, H.; Ahmadi-Soleimani, S.M.; Pachenari, N.; Azadi, M.; Halliwell, R.F.; Rubino, T.; Azizi, H. Adolescent Drug Exposure: A Review of Evidence for the Development of Persistent Changes in Brain Function. Brain Res. Bull. 2020, 156, 105–117. [Google Scholar] [CrossRef]
- Kandel, D.B.; Yamaguchi, K.; Chen, K. Stages of Progression in Drug Involvement from Adolescence to Adulthood: Further Evidence for the Gateway Theory. J. Stud. Alcohol 1992, 53, 447–457. [Google Scholar] [CrossRef]
- Probst, C.; Elton-Marshall, T.; Imtiaz, S.; Patte, K.A.; Rehm, J.; Sornpaisarn, B.; Leatherdale, S.T. A Supportive School Environment May Reduce the Risk of Non-Medical Prescription Opioid Use Due to Impaired Mental Health among Students. Eur. Child Adolesc. Psychiatry 2021, 30, 293–301. [Google Scholar] [CrossRef]
- Silverman, M.; Sibbald, R.; Stranges, S. Ethics of COVID-19-Related School Closures. Can. J. Public Health 2020, 111, 462–465. [Google Scholar] [CrossRef] [PubMed]
- Gallagher-Mackay, K.; Srivastava, P.; Underwood, K.; Dhuey, E.; McCready, L.; Born, K.; Maltsev, A.; Perkhun, A.; Steiner, R.; Barrett, K. COVID-19 and Education Disruption in Ontario: Emerging Evidence on Impacts. Available online: https://scholars.wlu.ca/laso_faculty/1 (accessed on 22 January 2023).
- Bialystok, L. Education after COVID. Philos. Inq. Educ. 2022, 29, 1–4. [Google Scholar] [CrossRef]
- Halsall, T.; Mahmoud, K.; Iyer, S.N.; Orpana, H.; Zeni, M.; Matheson, K. Implications of Time and Space Factors Related with Youth Substance Use Prevention: A Conceptual Review and Case Study of the Icelandic Prevention Model Being Implemented in the Context of the COVID-19 Pandemic. Int. J. Qual. Stud. Health Well-Being 2023, 18, 2149097. [Google Scholar] [CrossRef]
- Jayasinha, R.; Nairn, S.; Conrod, P. A Dangerous “Cocktail”: The COVID-19 Pandemic and the Youth Opioid Crisis in North America: A Response to Vigo et al.(2020). Can. J. Psychiatry 2020, 65, 692–694. [Google Scholar] [CrossRef] [PubMed]
- de Vaan, M.; Stuart, T. Does Intra-Household Contagion Cause an Increase in Prescription Opioid Use? Am. Sociol. Rev. 2019, 84, 577–608. [Google Scholar] [CrossRef]
- Nguyen, A.P.; Glanz, J.M.; Narwaney, K.J.; Binswanger, I.A. Association of Opioids Prescribed to Family Members with Opioid Overdose among Adolescents and Young Adults. JAMA Netw. Open 2020, 3, e201018. [Google Scholar] [CrossRef] [PubMed]
- Binswanger, I.A.; Glanz, J.M. Pharmaceutical Opioids in the Home and Youth: Implications for Adult Medical Practice. Subst. Abus. 2015, 36, 141–143. [Google Scholar] [CrossRef] [PubMed]
- Griesler, P.C.; Hu, M.-C.; Wall, M.M.; Kandel, D.B. Nonmedical Prescription Opioid Use by Parents and Adolescents in the US. Pediatrics 2019, 143, e20182354. [Google Scholar] [CrossRef]
- Calina, D.; Hartung, T.; Mardare, I.; Mitroi, M.; Poulas, K.; Tsatsakis, A.; Rogoveanu, I.; Docea, A.O. COVID-19 Pandemic and Alcohol Consumption: Impacts and Interconnections. Toxicol. Rep. 2021, 8, 529–535. [Google Scholar] [CrossRef]
- Gohari, M.R.; Varatharajan, T.; MacKillop, J.; Leatherdale, S.T. Examining the Impact of the COVID-19 Pandemic on Youth Alcohol Consumption: Longitudinal Changes from Pre-to Intra-Pandemic Drinking in the COMPASS Study. J. Adolesc. Health 2022, 71, 665–672. [Google Scholar] [CrossRef]
- Osborne, V.; Serdarevic, M.; Crooke, H.; Striley, C.; Cottler, L.B. Non-Medical Opioid Use in Youth: Gender Differences in Risk Factors and Prevalence. Addict. Behav. 2017, 72, 114–119. [Google Scholar] [CrossRef] [PubMed]
- Valente, T.W.; Hoffman, B.R.; Ritt-Olson, A.; Lichtman, K.; Johnson, C.A. Effects of a Social-Network Method for Group Assignment Strategies on Peer-Led Tobacco Prevention Programs in Schools. Am. J. Public Health 2003, 93, 1837–1843. [Google Scholar] [CrossRef] [PubMed]
- Valente, T.W.; Gallaher, P.; Mouttapa, M. Using Social Networks to Understand and Prevent Substance Use: A Transdisciplinary Perspective. Subst. Use Misuse 2004, 39, 1685–1712. [Google Scholar] [CrossRef] [PubMed]
- Ennett, S.T.; Bauman, K.E.; Hussong, A.; Faris, R.; Foshee, V.A.; Cai, L.; DuRant, R.H. The Peer Context of Adolescent Substance Use: Findings from Social Network Analysis. J. Res. Adolesc. 2006, 16, 159–186. [Google Scholar] [CrossRef]
- Michell, M.P. Smoke Rings: Social Network Analysis of Friendship Groups, Smoking and Drug-Taking. Drugs Educ. Prev. Policy 2000, 7, 21–37. [Google Scholar] [CrossRef]
- Jackson, J.C.; Rand, D.; Lewis, K.; Norton, M.I.; Gray, K. Agent-Based Modeling: A Guide for Social Psychologists. Soc. Psychol. Personal. Sci. 2017, 8, 387–395. [Google Scholar] [CrossRef]
- Macy, M.W.; Willer, R. From Factors to Actors: Computational Sociology and Agent-Based Modeling. Annu. Rev. Sociol. 2002, 28, 143–166. [Google Scholar] [CrossRef]
- Agar, M. My Kingdom for a Function: Modeling Misadventures of the Innumerate. J. Artif. Soc. Soc. Simul. 2003, 6, 1–8. [Google Scholar]
- Agar, M. Agents in Living Color: Towards Emic Agent-Based Models. J. Artif. Soc. Soc. Simul. 2005, 8, 4. [Google Scholar]
- Garrison, L.A.; Babcock, D.S. Alcohol Consumption among College Students: An Agent-based Computational Simulation. Complexity 2009, 14, 35–44. [Google Scholar] [CrossRef]
- Lamy, F.; Bossomaier, T.; Perez, P. An Ontologic Agent-Based Model of Recreational Polydrug Use: SimUse. Int. J. Simul. Process Model. 2015, 10, 207–222. [Google Scholar] [CrossRef]
- Agar, M.H.; Wilson, D. Drugmart: Heroin Epidemics as Complex Adaptive Systems. Complexity 2002, 7, 44–52. [Google Scholar] [CrossRef]
- Perez, P.; Dray, A.; Moore, D.; Dietze, P.; Bammer, G.; Jenkinson, R.; Siokou, C.; Green, R.; Hudson, S.L.; Maher, L. SimAmph: An Agent-Based Simulation Model for Exploring the Use of Psychostimulants and Related Harm amongst Young Australians. Int. J. Drug Policy 2012, 23, 62–71. [Google Scholar] [CrossRef]
- Agar, M.; Reisinger, H.S. Using Trend Theory to Explain Heroin Use Trends. J. Psychoact. Drugs 2001, 33, 203–211. [Google Scholar] [CrossRef]
- Di Clemente, R.; Pietronero, L. Statistical Agent Based Modelization of the Phenomenon of Drug Abuse. Sci. Rep. 2012, 2, 532. [Google Scholar] [CrossRef]
- Coates, A.; Han, L.; Kleerekoper, A. A Unified Framework for Opinion Dynamics. In Proceedings of the 17th International Conference on Autonomous Agents and Multiagent Systems, International Foundation for Autonomous Agents and Multiagent Systems, Stockholm, Sweden, 10–15 July 2018. [Google Scholar]
- Grabisch, M.; Rusinowska, A. A Survey on Nonstrategic Models of Opinion Dynamics. Games 2020, 11, 65. [Google Scholar] [CrossRef]
- Anderson, B.D.; Ye, M. Recent Advances in the Modelling and Analysis of Opinion Dynamics on Influence Networks. Int. J. Autom. Comput. 2019, 16, 129–149. [Google Scholar] [CrossRef]
- Sun, R.; Mendez, D. An Application of the Continuous Opinions and Discrete Actions (CODA) Model to Adolescent Smoking Initiation. PLoS ONE 2017, 12, e0186163. [Google Scholar] [CrossRef]
- Moore, T.W.; Finley, P.D.; Apelberg, B.J.; Ambrose, B.K.; Brodsky, N.S.; Brown, T.J.; Husten, C.; Glass, R.J. An Opinion-Driven Behavioral Dynamics Model for Addictive Behaviors. Eur. Phys. J. B 2015, 88, 1–28. [Google Scholar] [CrossRef]
- Clifford, P.; Sudbury, A. A Model for Spatial Conflict. Biometrika 1973, 60, 581. [Google Scholar] [CrossRef]
- Castellano, C.; Muñoz, M.A.; Pastor-Satorras, R. Nonlinear Q-Voter Model. Phys. Rev. E 2009, 80, 041129. [Google Scholar] [CrossRef] [PubMed]
- Castellano, C.; Loreto, V.; Barrat, A.; Cecconi, F.; Parisi, D. Comparison of Voter and Glauber Ordering Dynamics on Networks. Phys. Rev. E 2005, 71, 066107. [Google Scholar] [CrossRef] [PubMed] [Green Version]
- Mobilia, M. Does a Single Zealot Affect an Infinite Group of Voters? Phys. Rev. Lett. 2003, 91, 028701. [Google Scholar] [CrossRef]
- Malik, N.; Mucha, P.J. Role of Social Environment and Social Clustering in Spread of Opinions in Coevolving Networks. Chaos Interdiscip. J. Nonlinear Sci. 2013, 23, 043123. [Google Scholar] [CrossRef] [PubMed]
- Krapivsky, P.L.; Redner, S. Dynamics of Majority Rule in Two-State Interacting Spin Systems. Phys. Rev. Lett. 2003, 90, 238701. [Google Scholar] [CrossRef]
- Galam, S. Minority Opinion Spreading in Random Geometry. Eur. Phys. J. B-Condens. Matter Complex Syst. 2002, 25, 403–406. [Google Scholar] [CrossRef]
- Sznajd-Weron, K.; Sznajd, J. Opinion Evolution in Closed Community. Int. J. Mod. Phys. C 2000, 11, 1157–1165. [Google Scholar] [CrossRef]
- Sznajd-Weron, K.; Sznajd, J.; Weron, T. A Review on the Sznajd Model—20 Years After. Phys. A: Stat. Mech. Its Appl. 2021, 565, 125537. [Google Scholar] [CrossRef]
- Sznajd-Weron, K. Sznajd Model and Its Applications. arXiv 2005, arXiv:physics/0503239. [Google Scholar]
- Deffuant, G.; Amblard, F.; Weisbuch, G.; Faure, T. How Can Extremism Prevail? A Study Based on the Relative Agreement Interaction Model. J. Artif. Soc. Soc. Simul. 2002, 5, 4. [Google Scholar]
- Deffuant, G.; Neau, D.; Amblard, F.; Weisbuch, G. Mixing Beliefs among Interacting Agents. Adv. Complex Syst. 2001, 3, 87–98. [Google Scholar] [CrossRef]
- Martins, A.C. Continuous Opinions and Discrete Actions in Opinion Dynamics Problems. Int. J. Mod. Phys. C 2008, 19, 617–624. [Google Scholar] [CrossRef]
- Fan, K.; Pedrycz, W. Emergence and Spread of Extremist Opinions. Phys. A Stat. Mech. Its Appl. 2015, 436, 87–97. [Google Scholar] [CrossRef]
- Martins, A.C.; Kuba, C.D. The Importance of Disagreeing: Contrarians and Extremism in the Coda Model. Adv. Complex Syst. 2010, 13, 621–634. [Google Scholar] [CrossRef] [Green Version]
- Latané, B. The Psychology of Social Impact. Am. Psychol. 1981, 36, 343. [Google Scholar] [CrossRef]
- Nowak, A.; Szamrej, J.; Latané, B. From Private Attitude to Public Opinion: A Dynamic Theory of Social Impact. Psychol. Rev. 1990, 97, 362. [Google Scholar] [CrossRef]
- Castellano, C.; Fortunato, S.; Loreto, V. Statistical Physics of Social Dynamics. Rev. Mod. Phys. 2009, 81, 591. [Google Scholar] [CrossRef]
- Hołyst, J.A.; Kacperski, K.; Schweitzer, F. Social Impact Models of Opinion Dynamics. Annu. Rev. Comput. Phys. 2001, 253–273. [Google Scholar] [CrossRef]
- Boak, A.; Elton-Marshall, T.; Mann, R.E.; Hamilton, H.A. Drug Use among Ontario Students, 1977–2019: Detailed Findings from the Ontario Student Drug Use and Health Survey (OSDUHS); Centre for Addiction and Mental Health: Toronto, ON, Canada, 2020. [Google Scholar]
- Boak, A.; Elton-Marshall, T.; Hamilton, H.A. The Well-Being of Ontario Students: Findings from the 2021 Ontario Student Drug Use and Health Survey (OSDUHS); Centre for Addiction and Mental Health: Toronto, ON, Canada, 2022. [Google Scholar]
- Berryman, M. Review of Software Platforms for Agent Based Models. Available online: https://citeseerx.ist.psu.edu/document?repid=rep1&type=pdf&doi=f3acb55df14e3e83f60bb14f067f5fcb5afc97d1 (accessed on 22 January 2023).
- Nikolai, C.; Madey, G. Tools of the Trade: A Survey of Various Agent Based Modeling Platforms. J. Artif. Soc. Soc. Simul. 2009, 12, 2. [Google Scholar]
- Borshchev, A. The Big Book of Simulation Modeling: Multimethod Modeling with AnyLogic 6; AnyLogic: New York, NY, USA, 2013; ISBN 0-9895731-7-6. [Google Scholar]
- Average Number of People per Family in Canada in 2019, by Province. Available online: https://www.statista.com/statistics/478954/average-family-size-in-canada-by-province/ (accessed on 22 January 2023).
- Carrière, G.; Garner, R.; Sanmartin, C. Significant Factors Associated with Problematic Use of Opioid Pain Relief Medications among the Household Population, Canada, 2018. Health Rep. 2021, 32, 11–26. [Google Scholar]
- Sharma, B.; Bruner, A.; Barnett, G.; Fishman, M. Opioid Use Disorders. Child Adolesc. Psychiatr. Clin. 2016, 25, 473–487. [Google Scholar] [CrossRef] [PubMed]
- Branstetter, S.A.; Low, S.; Furman, W. The Influence of Parents and Friends on Adolescent Substance Use: A Multidimensional Approach. J. Subst. Use 2011, 16, 150–160. [Google Scholar] [CrossRef] [PubMed]
- Mansouri, A.; Taghiyareh, F. Effect of Segregation on the Dynamics of Noise-Free Social Impact Model of Opinion Formation through Agent-Based Modeling. Int. J. Web Res. 2019, 2, 36–44. [Google Scholar]
- Lerner, A.; Klein, M. Dependence, Withdrawal and Rebound of CNS Drugs: An Update and Regulatory Considerations for New Drugs Development. Brain Commun. 2019, 1, fcz025. [Google Scholar] [CrossRef] [PubMed]
- Bordogna, C.M.; Albano, E.V. Dynamic Behavior of a Social Model for Opinion Formation. Phys. Rev. E 2007, 76, 061125. [Google Scholar] [CrossRef]
- Hołyst, J.A.; Kacperski, K.; Schweitzer, F. Phase Transitions in Social Impact Models of Opinion Formation. Phys. A Stat. Mech. Its Appl. 2000, 285, 199–210. [Google Scholar] [CrossRef]
- Cooley, P.; Solano, E. Agent-Based Model (ABM) Validation Considerations. In Proceedings of the Third International Conference on Advances in System Simulation (SIMUL 2011), Barcelona, Spain, 23–29 October 2011; pp. 134–139. [Google Scholar]
- Sayama, H. Introduction to the Modeling and Analysis of Complex Systems; Open SUNY Textbooks: Albany, NY, USA, 2015. [Google Scholar]
- Andrews, J.L.; Foulkes, L.; Blakemore, S.-J. Peer Influence in Adolescence: Public-Health Implications for COVID-19. Trends Cogn. Sci. 2020, 24, 585–587. [Google Scholar] [CrossRef]
- Cho, J.; Bello, M.S.; Christie, N.C.; Monterosso, J.R.; Leventhal, A.M. Adolescent Emotional Disorder Symptoms and Transdiagnostic Vulnerabilities as Predictors of Young Adult Substance Use during the COVID-19 Pandemic: Mediation by Substance-Related Coping Behaviors. Cogn. Behav. Ther. 2021, 50, 276–294. [Google Scholar] [CrossRef]
- Pelham III, W.E.; Tapert, S.F.; Gonzalez, M.R.; McCabe, C.J.; Lisdahl, K.M.; Alzueta, E.; Baker, F.C.; Breslin, F.J.; Dick, A.S.; Dowling, G.J. Early Adolescent Substance Use before and during the COVID-19 Pandemic: A Longitudinal Survey in the ABCD Study Cohort. J. Adolesc. Health 2021, 69, 390–397. [Google Scholar] [CrossRef]
- Miller, B.L.; Lowe, C.C.; Kaakinen, M.; Savolainen, I.; Sirola, A.; Stogner, J.; Ellonen, N.; Oksanen, A. Online Peers and Offline Highs: An Examination of Online Peer Groups, Social Media Homophily, and Substance Use. J. Psychoact. Drugs 2021, 53, 345–354. [Google Scholar] [CrossRef]
- Huang, G.C.; Unger, J.B.; Soto, D.; Fujimoto, K.; Pentz, M.A.; Jordan-Marsh, M.; Valente, T.W. Peer Influences: The Impact of Online and Offline Friendship Networks on Adolescent Smoking and Alcohol Use. J. Adolesc. Health 2014, 54, 508–514. [Google Scholar] [CrossRef] [PubMed]
- Nairn, S.A.; Audet, M.; Stewart, S.H.; Hawke, L.D.; Isaacs, J.Y.; Henderson, J.; Saah, R.; Knight, R.; Fast, D.; Khan, F. Interventions to Reduce Opioid Use in Youth At-Risk and in Treatment for Substance Use Disorders: A Scoping Review. Can. J. Psychiatry 2022, 07067437221089810. [Google Scholar] [CrossRef] [PubMed]
Figure 1.
Ontario-level in-person school closures and reopening timeline. This figure is based on Gallagher et al. [12] licensed under CC BY 4.0 (https://creativecommons.org/licenses/by/4.0/).
Figure 1.
Ontario-level in-person school closures and reopening timeline. This figure is based on Gallagher et al. [12] licensed under CC BY 4.0 (https://creativecommons.org/licenses/by/4.0/).

Figure 2.
Youth state charts—Youth Drug Use Opinion Evidence state chart at the top middle, Frequency of Drug Use in the past year state chart at the bottom left, and Drug Sources state chart at the bottom right.
Figure 2.
Youth state charts—Youth Drug Use Opinion Evidence state chart at the top middle, Frequency of Drug Use in the past year state chart at the bottom left, and Drug Sources state chart at the bottom right.

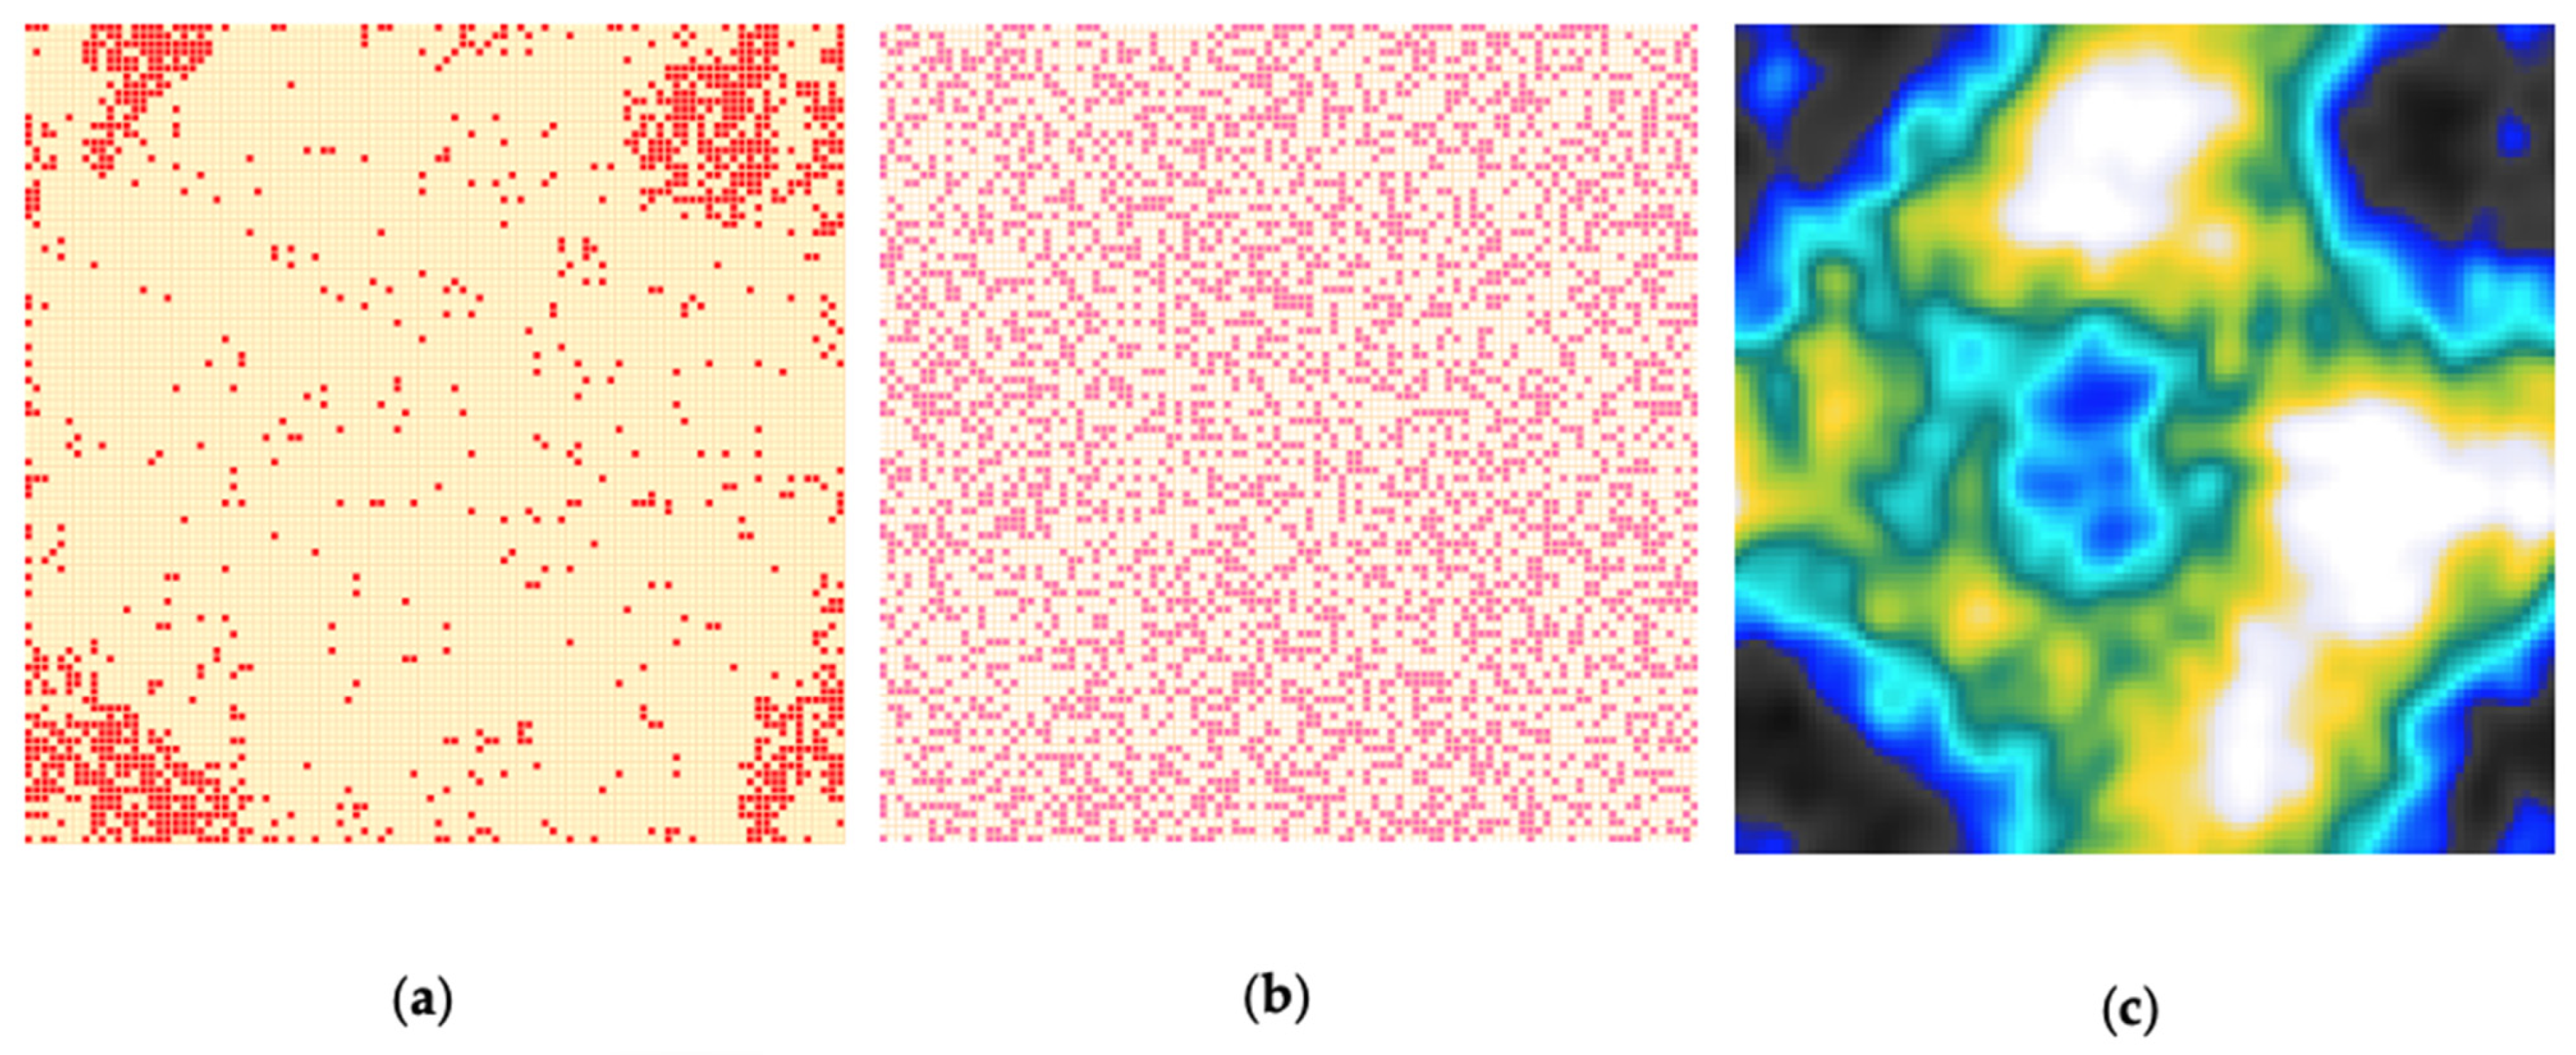
Figure 3.
Three-level cellular automata—(a) Each patch presents a youth. Colors distinguish youth who are absent nonmedical prescription opioid use experience in the past year (yellow) and with nonmedical prescription opioid use experience in that interval (red). (b) Each patch represents family. Corresponding colors for a family with at least one member with current prescribed opioids and family without any prescribed opioids are pink and ivory, respectively. (c) Socio-cultural environment, in which the black areas represent a positive perspective toward drug use and gradations towards white represent successively more negative attitudes towards drug use.

Figure 4.
Moore neighborhood with different ranges from left to right: r = 0, r = 1, r = 2, and r = 3.
Figure 4.
Moore neighborhood with different ranges from left to right: r = 0, r = 1, r = 2, and r = 3.

Figure 5.
Model-generated prevalence of youth with nonmedical prescription opioid use in the past year for the different durations of in-person school closures (a–d). The model predicted the prevalence of youth with nonmedical prescription opioid use in the past year for (a) 6-month in-person school closures, (b) 12-month in-person school closures, (c) 18-month in-person school closures, and (d) 24-month in-person school closures. In-person socialization following the lifting of in-person school closures is characterized as a Moore neighborhood of range 3. The two vertical arrows represent the start and end of the in-person school closures for each panel, respectively.

Figure 6.
Model-generated prevalence of youth exhibiting nonmedical prescription opioid use in the past year based on Ontario school closure timeline. The blue dots show the empirical data and the two vertical black arrows represent the start and end of the Ontario school closure timeline.
Figure 6.
Model-generated prevalence of youth exhibiting nonmedical prescription opioid use in the past year based on Ontario school closure timeline. The blue dots show the empirical data and the two vertical black arrows represent the start and end of the Ontario school closure timeline.

Figure 7.
Model-generated prevalence of youth exhibiting nonmedical prescription opioid use in the past year for the baseline scenario (a) and after applying safe storage intervention with a decrease of 20% in youth exposure to prescription opioids at home beginning at different time points (b–d). The two vertical black arrows represent the start and end of the Ontario school closure timeline. (a) Model-generated prevalence of youth exhibiting nonmedical prescription opioid use in the past year for the baseline scenario. (b) Model-generated prevalence of youth exhibiting nonmedical prescription opioid use in the past year after applying safe storage in 2017. (c) Model-generated prevalence of youth exhibiting nonmedical prescription opioid use in the past year after applying safe storage at the beginning of the general COVID-19-related in-person school closures on 14 March 2020. (d) Model-generated prevalence of youth exhibiting nonmedical prescription opioid use in the past year after applying safe storage at the start of the 2022–2023 academic year.

Disclaimer/Publisher’s Note: The statements, opinions and data contained in all publications are solely those of the individual author(s) and contributor(s) and not of MDPI and/or the editor(s). MDPI and/or the editor(s) disclaim responsibility for any injury to people or property resulting from any ideas, methods, instructions or products referred to in the content. |
© 2023 by the authors. Licensee MDPI, Basel, Switzerland. This article is an open access article distributed under the terms and conditions of the Creative Commons Attribution (CC BY) license (https://creativecommons.org/licenses/by/4.0/).
Share and Cite
MDPI and ACS Style
Shojaati, N.; Osgood, N.D. An Agent-Based Social Impact Theory Model to Study the Impact of In-Person School Closures on Nonmedical Prescription Opioid Use among Youth. Systems 2023, 11, 72. https://doi.org/10.3390/systems11020072
AMA Style
Shojaati N, Osgood ND. An Agent-Based Social Impact Theory Model to Study the Impact of In-Person School Closures on Nonmedical Prescription Opioid Use among Youth. Systems. 2023; 11(2):72. https://doi.org/10.3390/systems11020072
Chicago/Turabian StyleShojaati, Narjes, and Nathaniel D. Osgood. 2023. "An Agent-Based Social Impact Theory Model to Study the Impact of In-Person School Closures on Nonmedical Prescription Opioid Use among Youth" Systems 11, no. 2: 72. https://doi.org/10.3390/systems11020072
Note that from the first issue of 2016, this journal uses article numbers instead of page numbers. See further details here.