Abstract
Cholera kills between 21,000 and 143,000 people globally each year. It is often fatal, killing up to 50% of the severely symptomatic patients; but death by cholera is preventable with timely treatment, so that the fatality rate can drop to less than 1%. Due to cholera’s multi-pathway transmission, a multifaceted and multi-sectoral approach to combat this disease is needed. Such complexity gives rise to uncertainty about where it is best to intervene, as stakeholders have to balance prevention and treatment under highly constrained resources. Using Al-Hudaydah, Yemen as a case study, this paper demonstrates how a system dynamics model can be built using a classic infection structure with empirically grounded operational structures: health treatment, water, sanitation, and hygiene (WASH), vaccination, and a data surveillance system. The model explores the implications of the joint interventions with different start times. The model analysis revealed that the historical interventions likely prevented 55% more deaths in 2017 as compared to a counterfactual business-as-usual scenario with no interventions in the past. At the same time, some 40% of deaths could potentially have been prevented if interventions (with the same resources as historical data) had been initiated earlier in April 2017. Further research will explore each intervention impact for more detailed policy analysis and simulations into the future.
1. Introduction
Cholera is an acute diarrheal infection caused by consuming food or water contaminated with the bacterium Vibrio cholerae [1,2]. Vibrio cholerae causes profuse watery diarrhea and vomiting that can quickly progress to dehydration and hypovolemic shock, killing up to 50% of patients who do not receive adequate rehydration [1].Even healthy people can die within hours if they develop severe cholera symptoms. Conversely, if symptomatic individuals receive healthcare treatment in time, the case fatality rate can be less than 1%.
Cholera treatment, control, and prevention are the responsibility of national government health ministries and non-governmental organizations (NGOs) [3,4,5]. Once cases are identified, interventions to control and prevent cholera include surveillance and case management (treatment), water, sanitation, and hygiene (WASH) interventions, provision of oral cholera vaccinations, and strengthening education programs [1,6,7].
While universal access to clean water and sanitation is the long-term solution to cholera, this is typically linked with the country’s economic and political development; and is therefore vulnerable to environmental and humanitarian crises [5]. WHO [7] reported 2.5 million suspected cholera cases and nearly 4000 deaths in Yemen as of November 2020. Figure 1 illustrates the cholera epidemic prevalence from 2017 to 2018 and first oral cholera vaccination campaign in Al-Hudaydah, Yemen. The literature identifies two groups of problems that allowed an epidemic of this magnitude to occur: Yemen’s precarious conditions and the humanitarian response.
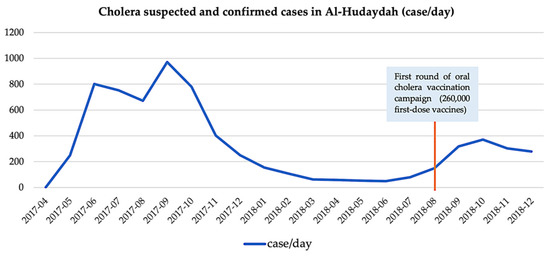
Figure 1.
Timeline of key events in Al-Hudaydah Yemen cholera epidemic from 2016 to 2018, daily number of cases [5,11,12].
Yemen has been devastated by a complex civil war [5,8]. It was classified as a level 3 emergency by the United Nations (UN) in 2015, triggering the highest level of resource mobilization across the humanitarian system [5]. By 2016, only 46% of all healthcare facilities remained operational. In addition to severely damaged water and sewage infrastructure, the dire situation has been exacerbated by a lack of energy—mainly electricity and fuel, spare parts, operating and maintenance funds, and three years of unpaid civil servants [3,5,8,9].
Furthermore, most civilians’ movements are confined by the ongoing conflicts; and food insecurity has put more than half of the population at risk of famine. Yemen has the highest number of people in need of humanitarian assistance of any country. On 28 September 2016, a large-scale cholera epidemic began and the number of people in need of humanitarian assistance and protection reached as high as 20 million in 2017 [10].
Lessons learned from Yemen’s cholera response are well documented, reporting that Yemen lacked an adequate cholera preparedness and response plan, despite previous outbreaks, regional endemicity, and active conflict [3,5,9,13,14]. The key questions revolve around: How can the recommendation be implemented? How does one actualize what ought to be done into how and when it can be done? Previous studies concluded that the delayed response was due to two factors.
First, multi-sector coordination structures were confused, with the roles of the clusters, cholera task force, and incident management system either overlapping or incompletely developed. Lack of coordination across these areas hampered management, technical output, and agency trust [3,4,5,8,14].
Second, a lack of a functioning surveillance system, hence, a lack of data. Despite that, policy decisions must be made, frequently under high uncertainty and pressure conditions, especially when the fatality rate is high. Where a lack of data makes precise predictions impossible, simulation models may still provide valuable insights to aid decision-making under unknown circumstances. Such scientifically informed exploration can add clarity to decisions, allowing for more effective policy choices.
From the simulation model literature review, Barciela et al. [15] developed a Cholera Risk Model (CRM) for cholera control in Yemen, specifically on WASH interventions. It is a predictive tool that integrates data on rainfall, temperature, and water security to determine the risk of cholera trigger and transmission. Harpring et al. [4] use a causal loop diagram to visualize the compounding factors influencing the cholera outbreak in Yemen. Along with the susceptible, infected, and recovered (SIR) dynamics, they discovered a strong connection between humanitarian response and the existing infrastructure development to the cholera epidemic. Pruyt [16] developed a cholera epidemic System Dynamics (SD) model for Zimbabwe that tested two policies: sanitary infrastructure and health services. The model uses percentage change on these two policy parameters instead of detailed operational policy structures.
On the other hand, ordinary differential equation (ODE) cholera models were reviewed and half of them contain only SIR model structure [17]. The other half of cholera transmission models included a maximum of three interventions focusing mainly on vaccination, antibiotics, and water provision. None of the reviewed models include structures of both asymptomatic and symptomatic individuals as well as sanitation intervention (sewage system) and health services.
With the dynamic complexity of cholera control and death reduction, a multifaceted approach is crucial. To address the identified research gaps above, this paper aims to demonstrate how operational policy structures are built upon a system dynamics classic infection model to explore the impact of the interventions. In other words, the present model bridges the endogenous feedback mechanisms that drive both symptomatic and asymptomatic cholera infectious dynamics, with the empirically grounded operational structures: oral rehydration corner, diarrhea treatment center, water, sanitation and hygiene (WASH), vaccination, and data surveillance system.
2. Materials and Methods
System Dynamics (SD) uses computer simulation for policy analysis and design. Its origins are in servomechanisms engineering and management, and the approach uses a perspective based on information feedback and circular causality to understand the dynamics of complex social systems. Mathematically, SD models can be described as a system of coupled, nonlinear, first-order differential equations [18] that are solved using numerical methods. SD is a useful modeling approach for piloting complex systems modeling in the humanitarian sector, because it enables humanitarian response simulation even in contexts with limited data [19].
The data collected during the model’s development and validation can be classified into three categories:
Structural data: variables and interrelationships in the model were extracted from literature review, see Supplementary Materials for further information.
Epidemiological data: information on the characteristics of Vibrio cholerae infections (e.g., duration of infection, severity proportions), as well as their prevalence in Al-Hudaydah governorate (e.g., number of suspected and confirmed cases, deaths).
Cholera response (interventions) data: information and data on the implemented interventions between 2017 to 2018 was collected from WASH sector [11] and health sector [12,20] (see Supplementary Materials for further detail).
Data quality issues have been regarded as a significant obstacle to an effective humanitarian response to the cholera epidemic. Inadequate access to health facilities may have resulted in underestimating the cholera burden, most notably mortality [5]. For example, infected individuals who choose traditional medicine or private clinics over these specialized treatment centers are not captured by the surveillance system. Even mortality statistics are subject to reporting errors when deaths occur beyond the treatment facilities. On the other hand, Camacho et al. [21] stated that overreporting of other acute watery diarrhea (AWD) cases was likely to contribute to underestimates of the epidemic’s case fatality rate.
2.1. Cholera Susceptible-Infected-Recovered/Susceptible
Building on the Yemen cholera response—causal loop diagram of Harpring et al. [4], and Pruyt’s model [22] that simulates the 2008 cholera outbreak in Zimbabwe, the cholera response model is an extended SIR model that integrates the epidemic response’s operational dynamics.
Al-Hudaydah governorate had a population of 3,238,199 in 2017 [11]. In an SIR model, the population is divided into several compartments called stocks, depending on their status of being susceptible to the infection (S), being infected and infectious (I), and having recovered from the infection (R) [22]. In the case of cholera, the recovered population becomes susceptible again after a delay, which makes the model an SIS model. Figure 2 is a high-level and simplified view of the main stocks and flows in the model. Table 1 summarizes the feedback loops in Figure 2.
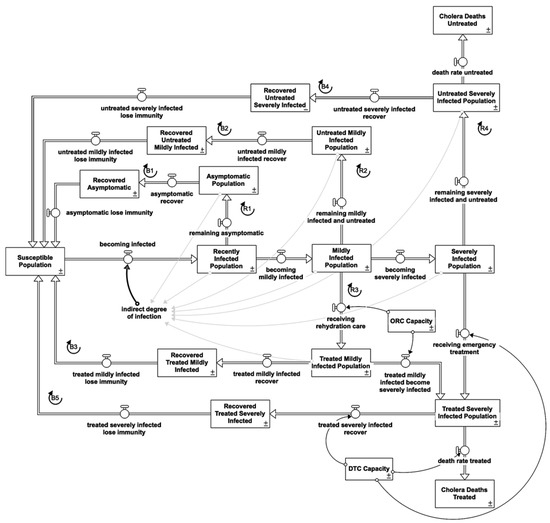
Figure 2.
Core cholera infection stock and flow diagram providing an overview of the key pop-ulation groups and the transitions among them.

Table 1.
Summary of feedback loops.
2.1.1. Indirect Infection
This model only incorporates indirect infection through contaminated water by infected individuals. When susceptible individuals become infected with cholera, they shift to the recently infected population after one day. The rate of cholera infection is a product of the indirect degree of infection and the size of the susceptible population (S). In turn, the indirect degree of infection depends on the connectedness of aquifers and smoothed fraction of contaminated water.
Although sporadic cholera cases may occur as a result from ingestion of insufficiently cooked seafood contaminated with Vibrio cholerae, humans are the primary reservoir for the pathogen during periods of active transmission (epidemic) via fecal contamination of drinking water or food [1,6,23,24]. A meta-analysis of the role of water, sanitation, and hygiene exposures in 51 case–control cholera studies found that cases were significantly more likely than controls to report the use of untreated drinking water, open defecation, unimproved sanitation, and poor hand hygiene [25]. Hence, the smoothed fraction of contaminated water is water contaminated by bacteria shedding from the infected individuals [23].
The smoothed fraction of contaminated water uses the water contamination from total bacteria shedding from the fraction of infected with a delay of two and a half days. Vibrio cholerae survival in the aquatic environment is highly dependent on the chemical, biological, and physical conditions of the aquatic environment: Vibrio cholerae survives in surface water for periods ranging from one hour to thirteen days [26].
Three days is used for the time period to affect water in aquifers in this model. A third-order delay is used to account for the fact that there are different stages in the process [23] between bacteria shedding by the infected individuals to contaminating the water.
Connectedness of aquifers is the “contact rate” between the susceptible population with contaminated water. More than 19 million Yemenis are believed to be without access to safe drinking water and sanitation [8,21,27]. According to WHO-UNICEF statistics, only 55% of the population had access to drinking water from improved water sources in 2014 [9]. Grad et al. [28] explained that the “contact rate” is largely unknown in most contexts, and there are no simple methods for converting experimental study results into a “contact rate” between susceptible individuals and bacteria in water. Since various factors determine the rate at which susceptible individuals become infected, the connectedness of aquifers is calibrated to the historical data. 0.02 is used in this model.
2.1.2. Asymptomatic Reinforcing Feedback Loop (R)
Individuals in the recently infected population leave the stock after an average incubation time of one day and flow in two directions: as asymptomatic infected to the asymptomatic population if they show no symptoms, or as mildly infected to the mildly infected population if they show mild symptoms. Pruyt’s model [23] makes no distinction between asymptomatic and symptomatic infections. Other works highlighted that these are essential elements and incorporated an asymptomatic feedback loop into their model [1,26,29,30,31].
First, most infected individuals (75% of infections) remain clinically unapparent, while the remaining 25% develop mild to severe symptoms (depending on the strain involved) [1]. Only symptomatic infections from treatment centers are captured in surveillance data [1,17]. When calibrating modeling outputs to historical data, Fung [17] concluded that underreporting of cases, including asymptomatic cases, should be considered. Chao et al. [29] found their model sensitive to the fraction of infected people who became symptomatic: The higher the symptomatic proportion, the higher the incidence of reported cases.
Second, the bacterial shedding rate is lower in asymptomatic individuals than in symptomatic individuals (60–90 percent of infected individuals are asymptomatic). Studies [1,26,30] have reported that some individuals can be infected with Vibrio cholerae and yet show no symptoms but then tend to shed the organism into the environment, even for only a few days. In a non-cholera epidemic area, Vibrio cholerae can be isolated from wastewater effluents [26].
Third, research emphasizes the distinction between immunity from asymptomatic infection and protection from disease (symptomatic) following recovery [30,31].
2.1.3. Bacteria Shedding
The model includes bacteria shedding as part of the indirect infection pathway. According to Kaper, Morris, and Levine [30], doses of 10^11 Colony Forming Units (CFU) of Vibrio cholerae were needed to trigger diarrhea in healthy North American volunteers. For example, ingestion of 10^6 Vibrio cholerae with fish and rice resulted in a high attack rate (100%). On the other hand, a symptomatic mildly infected individual can shed Vibrio cholerae in the stool in low but potentially infectious concentrations, up to 10^8 Vibrio cholerae organisms per g of stool [32]. An individual with acute cholera, severely diseased, excretes 10^7 to 10^8 Vibrio cholerae organisms per gram of stool. For patients who have 5 to 10 L of diarrheal stool, the total output of Vibrio cholerae can be in the range of 10^11 to 10^13 CFU [30].
This model uses 10^6 Vibrio cholerae as the amount to infect an individual.
The value of:
- bacteria shedding from symptomatic is 10^4, hence, normalized to 104/106 = 0.01
- bacteria shedding from a mildly infected individual is 108, hence, normalized to 108/106 = 100
- bacteria shedding from a severely infected individual is 10^12, hence, normalized to 1012/106 = 1,000,000
2.1.4. Symptomatic Reinforcing Feedback Loops (R)
The mildly infected population consists of mild cases of Vibrio cholerae infection that may be clinically indistinguishable from other causes of diarrheal illness [33]. Hence, not all seek healthcare services [1]. Depending on access to healthcare services, this model disaggregates mildly infected individuals into two different stocks: treated and untreated mildly infected individuals. Mildly infected individuals leave the stock after the time period to progress to the next stage (one day) and flow to three directions: treated mildly infected population, untreated mildly infected population, or intone of the severe disease population stocks.
The severely infected population consists of severe cases of Vibrio cholerae infection that are characterized by a sudden onset of acute voluminous watery diarrhea, described as ‘rice water stools’ and vomiting leading to rapid dehydration (fluid losses of up to one liter per hour), and death if left untreated [1,30]. Among individuals developing symptoms, 60 to 80% of episodes are of mild or moderate severity [1,23]. In other words, only 5 to 10% of the recently infected population in the base model becomes very ill. Mildly infected individuals move to the severely infected population after an average time to progress to the next stage. Severely infected individuals then move into two different stocks based on access to healthcare services: treated and untreated. The treated severely infected population stock does not contribute to the infectious reinforcing feedback loop as the excreted wastewater is disinfected at the healthcare sewage treatment facilities [1].
2.1.5. Recovered Balancing Feedback Loops (B)
All individuals belonging to the asymptomatic population, treated and untreated mildly infected population, recover after an average illness duration (asymptomatic for five days and symptomatic for nine days) [32,33]. On the other hand, individuals in the treated and untreated severely infected population either die (cholera deaths) or recover and become immune (recovered from severe infection) after the same average duration of the illness of nine days.
The proportion of the treated severely infected population that die or recover is determined by the capacity of healthcare services, as overloading in the health services results in lower care quality. Hence, an increase in fatality fraction. In 2017, the case fatality rate in Al-Hudaydah governorate was 0.0019 [11]. For severely infected individuals who are not accessing healthcare services, the untreated fatality fraction uses 0.004, assuming that the fatality fraction is double the case fatality rate with treated death fraction of 0.0021.
2.1.6. Immunity Waning
Studies have shown a difference between protection from asymptomatic infection and protection from disease (symptomatic) after recovery [30,31]. Pruyt’s model [22] aggregates both mildly and severely infected population into one stock of recovered temporarily immune population where they flow back to the susceptible population after an average immunity period of six years. Studies reported that clinical cholera (symptomatic) conferred protection against subsequent cholera for at least three years [30] while a study by Leung and Matrajt [31] identified that the asymptomatic protection period lasts between 3 to 12 months. The model uses six months for the average asymptomatic infection acquired immunity period and three years for the average symptomatic infection acquired immunity period [30,31].
2.2. Cholera Response-Intervention Structure
In the event of a cholera epidemic, the focus must be on limiting mortality and stopping the disease from spreading. It should be comprehensive and multi-sectoral, encompassing epidemiology (surveillance), case management, water, sanitation, hygiene, logistics, community engagement, and risk communication [34]. Figure 3 illustrates the stock and flow diagrams of each intervention. Further description is listed in the Supplementary Materials.
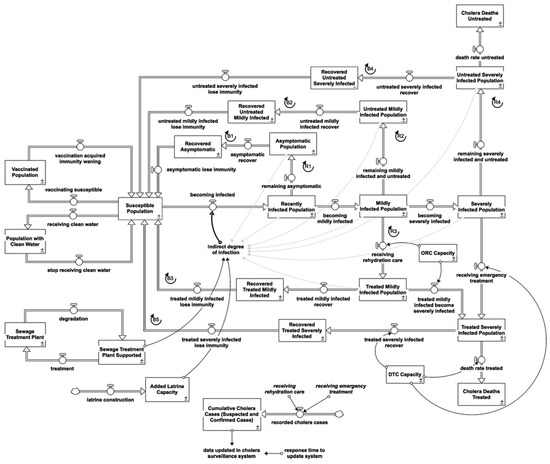
Figure 3.
Stock and flow diagram of the overall cholera response model.
2.2.1. Water, Sanitation and Hygiene Interventions (WASH)
Water, sanitation, and hygiene (WASH) interventions are commonly used to prevent and control cholera by reducing exposure to risk factors for disease transmission [25]. In Yemen, water trucking, latrine construction, chlorine tablet distribution, filter distribution, and hygiene kit distribution are the primary focuses of WASH [5].
Clean Water Provision
Water interventions improve the quantity of water (water trucking), the quality of water (chlorinating water), or the management of water (safe storage). Figure 4 shows that susceptible individuals who receive clean water shift to population with clean water stock after one day.
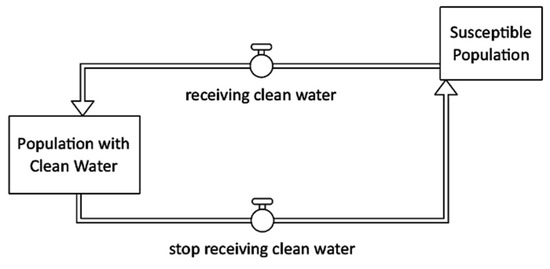
Figure 4.
Clean water provision intervention stock and flow diagram.
Sewage Treatment Plant
Figure 5 illustrates that the sewage treatment helps remove contaminants from sewage to produce effluent suitable for discharge to the surrounding environment or reuse and therefore prevent contamination of water sources [1,26,35].
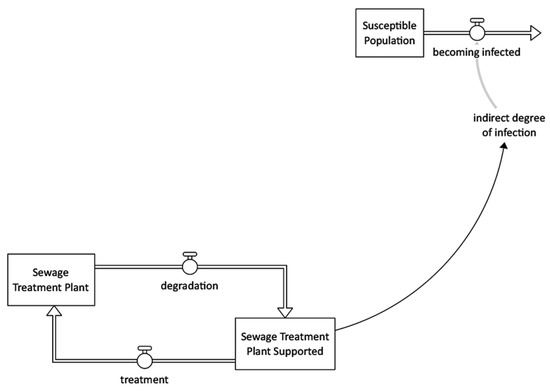
Figure 5.
Sewage treatment intervention stock and flow diagram.
Latrine Construction
This model latrine construction intervention is based on the need for latrine capacity: the 1% of the population openly defecating (Figure 6). While the Médecins Sans Frontières’ cholera response manual [1] recommends prioritizing public latrine placement in areas with a high risk of transmission (markets, train stations, and bus stations).
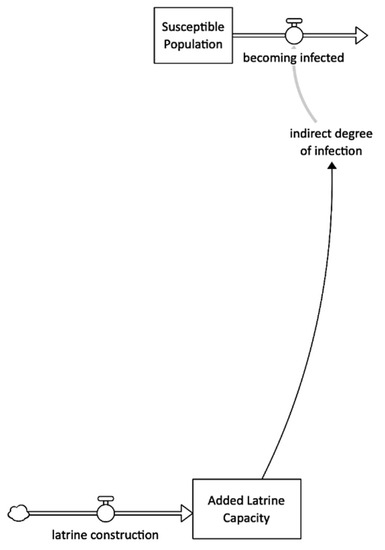
Figure 6.
Latrine construction intervention stock and flow diagram.
2.2.2. Healthcare Interventions
Diarrhea Treatment Centre (DTC)
A DTC is a specialized inpatient healthcare facility dedicated to managing severe cholera cases. A DTC is located outside the main hospital to prevent disease spread and is completely self-sufficient in general services (toilets, showers, kitchen, laundry, morgue, and waste area), stocks, and resources (medical and logistics, water, and electricity). Severity affects the intensity of shedding, and so the average contribution of an infectious person to transmission may change systematically with time as the distribution of infectious doses changes [30,32]. The “severely infected not in DTC” excludes treated severely infected population because at DTC, the sewage system is in place with disinfection. Hence, Figure 7 shows that all patients at DTC do not attribute their bacteria shedding back into the environment.
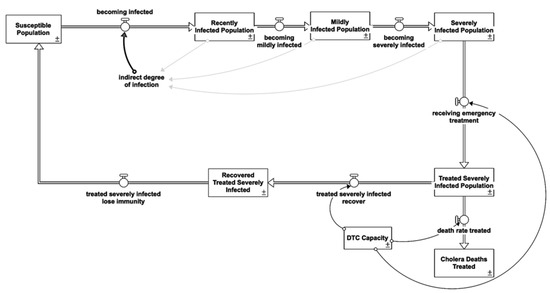
Figure 7.
Diarrhea treatment centre intervention stock and flow diagram.
Oral Rehydration Corner (ORC)
ORCs are small, decentralized outpatient care facilities that operate only during daylight hours (8 to 12 h per day). They are primarily used to administer oral rehydration therapy. Figure 8 illustrates that early oral therapy can help prevent the onset or aggravation of severe dehydration, which requires hospitalization [1,24,36].
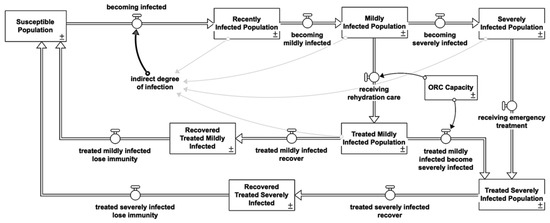
Figure 8.
Oral rehydration corner intervention stock and flow diagram.
Vaccination
Figure 9 shows that vaccination decreases the number of fully susceptible individuals, decreases infectiousness (the rate of water contamination), and decreases the likelihood of becoming symptomatic when infected [21,28]. Oral cholera vaccine (OCV) has been shown to be safe, logistically feasible, and acceptable by recipients. OCV is also inexpensive in a variety of settings, with total costs including procurement and delivery per fully vaccinated individual being less than USD 10 [3,37,38].
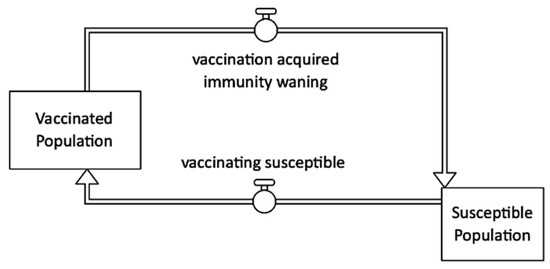
Figure 9.
Vaccination intervention stock and flow diagram.
2.2.3. Surveillance System
According to Camacho et al. [21], Yemen’s health authorities established a national cholera surveillance system to collect data on suspected cholera cases presenting to health facilities (no mass screening, the data depends on the availability of ORCs, DTCs, and health seeking ratio). Only symptomatic infections are likely to seek treatment and be reported. Figure 10 shows that simulated suspected and confirmed cases that replicate the historical data are a product of individuals seeking rehydration care and emergency treatment with suspected cholera infection.
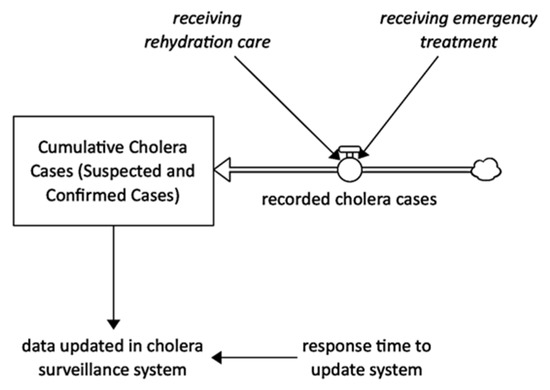
Figure 10.
Surveillance system intervention stock and flow diagram.
2.3. Other Model Settings
The model conceptual framework and structure has now been discussed and a detailed description of key assumptions, model equations, and numeric inputs are provided in the Supplementary Materials. The simulation of the model was conducted using Stella Architect version 3.0. This model has a relatively short time horizon, as its purpose is to explore the implications of cholera response interventions during the 2017 and 2018 epidemics. As such, the model commences on 1 January 2017 and continues for 730 days, ending on 31 December 2018. A retrospective analysis and policy testing were conducted rather than the more conventional future timeline projection for epidemic preparedness. A DT of 1/4 with Euler’s integration method is used to run this model.
Table 2 below outlines key parameters used in the model. For more information and a complete list of parameters, refer to the Supplementary Materials.
Table 2.
Literature sources for key parameters in the model.
2.4. Model Validation
A system dynamics model is generally validated in two ways. A structural validation of the model seeks to determine whether it accurately corresponds to the real world. Behavioral validation focuses on model behavior during simulation and evaluates the level of confidence that can be placed in the results [22,40,41]. Adhering to the guidelines, formal model analysis and validation procedures were conducted to support model development and testing throughout the research process. The procedures involved iterative cycles of data collection, model building, simulation, analysis, validation, and documentation. They are described in detail in the Supplementary Materials.
2.4.1. Comparison to Historical Data
Three uncertain parameter values: connectedness to aquifer, initial value of recently infected population, and time (of bacteria shed by infected individuals) to affect water in aquifer, were estimated through full-model calibration. Figure 11 compares simulated behavior with historical data (from 2017 to 2018) for fitted variables, using estimated parameter values from the full-model calibration. First, the model incorporates the dynamic of an asymptomatic feedback loop, as the collected data are the suspected and confirmed cases in Al-Hudaydah. In other words, infected individuals who are sick enough to seek healthcare services (symptomatic). Second, the model takes account of the data source; suspected and confirmed cases were collected from the DTC. Hence, the capacity structure of the DTC is built as part of the intervention structures.
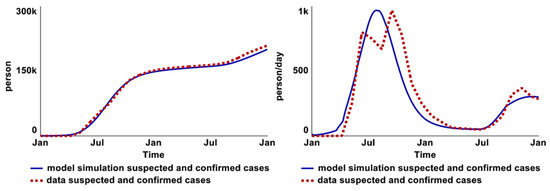
Figure 11.
Comparison between model behaviors and historical data in total suspected and confirmed cases graph (left) and in the infection rate of suspected and confirmed cases graph (right).
On the other hand, the infection rate of suspected and confirmed cases graph (right) illustrates the marginal difference in infection rates between suspected and confirmed cases (right). The plausible explanation is that DTCs and ORCs lacked capacity at the start of the epidemic due to a delay in capacity development (constructing new DTCs and ORCs).
Camacho et al. [21] explained that scarcity of adequate treatment is more common during the initial phase of unexpected outbreaks and in crisis settings. The absence of DTCs and ORCs indicates a data collection gap (according to Yemen’s surveillance system). When infected individuals have access to a DTC and ORC, there is an over-reporting problem because other patients with acute watery diarrhea (AWD) seek care at the ORC and DTC [3,5]. It is reasonable for the simulated infection rate to be slightly higher than the data at the start and slightly lower than the data following the establishment of DTCs and ORCs.
No explanation regarding the two peaks in the data is available from the literature. One plausible reason is that the healthcare system was over-stretched by the drastic increase in infected patients; healthcare and the data surveillance system could not perform as usual under such an overloaded condition. Once the system capacity increased (after a delay), the data collection function also increased, resulting in a second peak. Another reason could be that the rainfall intensified the infection rate [15].
2.4.2. Sensitivity Test
A multivariate Monte-Carlo sensitivity analysis was conducted on all exogenous parameters and initial values using a Sobol Sequence. A base case run was given initially, and each sensitivity run utilized these values and changed one of the values in uniform distribution within a preset range (see Supplementary Materials). The following Figure 12 and Figure 13 present the sensitive parameters that indicate the potential leverage points for policy tests.
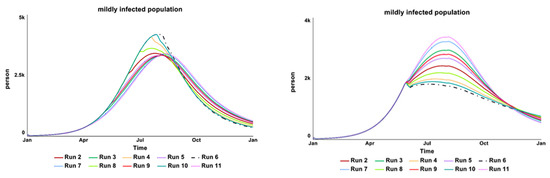
Figure 12.
The (left) behavior-over-time graphs show the result from the vaccination start time parameter test, while the (right) over-time graph shows the result of the desired number of vaccines pa-rameter test.
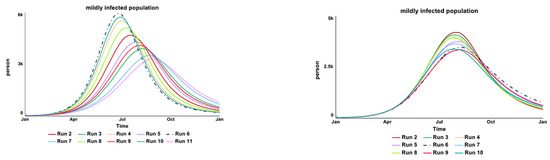
Figure 13.
The (left) over-time graph shows the results from the ‘bacteria shedding from asymptomatic cases’ parameter test while the (right) over-time graph shows the result of the desired sewage plant treatment parameter test.
Figure 12 shows the result from the parameter “vaccination start time” (left behavior-over-time graph). The model is numerically sensitive to changes in the tested value from day 90 to 365, with the same amount of vaccine provision in Al-Hudaydah (260,000 vaccines—intervention historical data), as expected. An earlier vaccine campaign shows a significant reduction in the infected population. With the model setting the vaccination start time as day 120 (April 2017), the sensitivity test continued with another parameter of “desired vaccine number”. The model shows a high numerical sensitivity to the tested range of vaccines number, between 200,000 to 1,000,000.
The left over-time graph in Figure 13 shows that the model is strongly (numerically) sensitive to changes in the value of “bacteria shedding from asymptomatic cases” as expected. Although the tested values are the lowest among the three infectious levels of bacteria shedding (asymptomatic, mildly, and severely symptomatic individuals), asymptomatic individuals have the highest ratio (75%) among the total infected population. Hence, contributing to the high sensitivity of this parameter value.
The right over-time graph in Figure 13 shows that the model is strongly (numerically) sensitive to changes in the values of “desired sewage plant treatment”, as expected. The tested range included start time and the capacity of the sewage plant treatment intervention. The infection reinforcing feedback loop is affected by the water source contamination by the infected individuals. If the current sewage plant treatment is well supported, there is less water contamination by the Vibrio cholera bacteria.
3. Scenario Analysis and Discussion
BAU-BASE-Early Response
The model was run under the following three different conditions to understand the interventions’ impact on the cholera epidemic dynamics. Figure 14 presents the results from each scenario simulation.
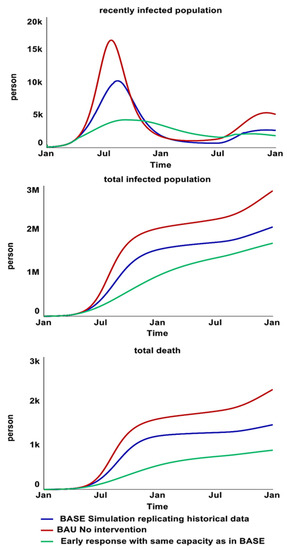
Figure 14.
Behavior over time graphs that present the results for recently infected populations (top), rec-orded suspected and confirmed cases (middle), and treated and untreated death rate (bottom) of BAU-BASE-Early response simulations.
BASE. BASE is the simulation scenario that replicates the historical data. This scenario included interventions implemented in 2017. A detailed intervention timeline simulated in “BASE” with the capacity of treatment centers over time and vaccine distribution can be found in Supplementary Materials (variables with “data” in their name).
Business as Usual (BAU). BAU is the scenario where all interventions are deconstructed from BASE to explore a counterfactual worst-case scenario for the cholera epidemic.
Early Response. An early response explores the impact of all interventions if the starting day were in April 2017, using the same capacity from the BASE. In addition, similar interventions were added in as responses to the second wave from June 2018. Using capacity of interventions similar to historical data aims to avoid overly unrealistic policy recommendations, particularly in a conflict-affected context where intervention implementation faces immense challenges. Further policy analysis of each intervention will be explored in future research.
Cholera epidemic control is highly complex in a conflict-affected context such as Yemen. While the epidemic lessons learned were widely discussed in the literature (mostly qualitatively), it is still not fully understood what the best strategies for cholera response are. Existing cholera related simulation models mainly study vaccination, antibiotics, and water provision. None of the reviewed models include structures of both asymptomatic and symptomatic individuals as well as sanitation intervention (sewage system) and health services. In this paper, the cholera response model explores the dynamic interplay between the classic infection SIR/SIS structure and the empirically grounded operational structures: oral rehydration corners, diarrhea treatment centers, water, sanitation and hygiene (WASH), vaccination, and the data surveillance system. The following insights emerge from the sensitivity and the three scenario policy tests.
First, deconstructing the interventions from BASE to BAU has shown significant impacts from the humanitarian cholera response in 2017. The results from Table 3 show that there would have been 55% more deaths if nothing had been done in Al-Hudaydah. In the BAU scenario, the cholera infection reinforcing feedback loops (R1, 2, 3, and 4) continue to dominate the SIR/SIS dynamics without attenuation from exogenous interventions; more infected individuals lead to more susceptible persons being infected, and the epidemic curve increases exponentially. In addition to the decline in the susceptible population (over time), more infected individuals recover or die; the balancing feedback loops (B1, 2, 3, 4, and 5) gain strength. The epidemic curve peaks and eventually falls.
Table 3.
Results of BASE, BAU, and Early Response simulations.
This endogenous SIR/SIS dynamic of reinforcing and balancing feedback loops shed lights on some of the questions asked in the reviewed literature. For instance, an epidemiologist who was interviewed in a study by Spiegel et al. [5] asked why the second wave was so massive. After the mild first wave, the susceptible population is still very large. Such a condition enables the infection reinforcing feedback loops to dominate in the second wave if there is no exogenous intervention to counter the strength of the reinforcing feedback loops (or to strengthen the balancing feedback loops).
Second, the simulation results also reveal that a potential 40% of deaths could have been prevented if interventions, especially vaccination, had been initiated earlier. Studies have reported that concern was raised by the Yemeni government and some humanitarian actors that mass immunization would be logistically difficult with ongoing security problems [3,9,13]. Another reason is that vaccination would have a minimal effect given the magnitude of the outbreak: it may be too late for vaccination, and the benefits would not outweigh the risks of initiating a campaign.
Yemen’s government, the United Nations, and the WHO stated that the decision was made on a technical basis to ensure that efforts would be concentrated on WASH intervention targeting approximately 16 million people [13]. Vaccines were finally distributed to 540,000 people by the WHO and UNICEF in August 2018, nearly 16 months after the outbreak began. Al-Hudaydah vaccinated 260,000 people with two-dose oral cholera vaccines (OCVs).
Indeed, the conflict situation posed significant logistical challenges for mass vaccination. Burki [8], on the other hand, reported that coverage of the pentavalent vaccine is estimated to be around 88% in 2015—the same as in 2014. The past pentavalent vaccine campaign indicates that a mass vaccination campaign is feasible if well-planned and supported. Moreover, Médecins Sans Frontières’ [1] cholera response manual stated that OCVs are administered orally (not via injection) and rarely cause serious adverse effects, and mass cholera vaccination campaigns do not require a large number of medical personnel. Hence, an earlier vaccination campaign would not have been impossible in Yemen.
Third, the sensitivity test findings show that the model is not sensitive to the water provision intervention. This is an unexpected result as one might anticipate a greater impact from water provision on cholera epidemic control, given that WASH intervention is considered to be one of the most critical components of such an emergency response [1].
In Al-Hudaydah, clean water provision activities comprise chlorination of wells, communal water tanks, distribution of chlorine tablets, and the daily chlorination of water trucks at water filling stations. In this cholera response model, susceptible individuals who receive clean water shift to the population with clean water stock after one day. Compared to the model of Tuite et al. [42] with 100% reduction of “contact” rate if covered by clean water provision, this model assumes only 70% of individuals who receive clean water shift into the population with clean water stock. Having clean water does not ensure a 100% reduction in susceptibility [25]. It is unrealistic to assume that those who receive clean water are 100% protected from cholera infection, as cholera is transmitted via multiple pathways (as illustrated in Figure 15). With other words, removing a single source of infection through water provision may not effectively prevent the disease.
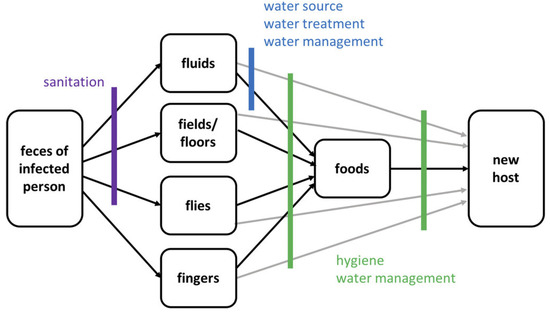
Figure 15.
Pathways of fecal–oral cholera transmission and opportunities to interrupt transmission from Water 1st International (cited in Wolfe et al. [25]).
Water can also still be viewed as a source of cholera outbreaks. Even when routine water treatments are carried out, cholera can still be transmitted when: dosing errors are made, treatment is forgotten, or the piped water supply is contaminated [25]. In fact, John Snow made history in public health by tracing and discovering that the source of the London cholera epidemic in 1854 was contaminated water from a water pump.
This discussion does not intend to discredit the crucial role of clean water provision. Having access to safe drinking water is central to living a life in dignity and upholding human rights [38]. However, it is problematic when resources are overly focused on WASH interventions. During the major wave of the epidemic, when stakeholders chose not to vaccinate the public but instead prioritized WASH [13]; and after the epidemic, when humanitarian actors utilized the water-fighting system, Cholera Risk Model predictive tool [15] without considering the endogenous feedback loops of cholera transmission. Such policy is likely to result in the “Shifting the Burden” system archetype; relying on reactive quick fixes that lead to unintended consequences of lower priorities and fewer resources for other interventions. For instance, vaccination provides three-year protection compared to one-day protection from water provision.
One might argue that the water provision should eventually transition from emergency water trucking or chlorine tablets to building water treatment plants. Nevertheless, such a long-term WASH development strategy is not part of the emergency cholera response model boundary. Additionally, such policy is not suitable in a conflict-affected context where the infrastructures are intentionally being obliterated.
Fourth, sewage plant treatment can potentially be the leverage point for the silent spreaders who make the cholera transmission harder to fight. The sensitivity test findings highlight that the model is strongly (numerically) sensitive to changes in the value of “bacteria shedding from asymptomatic cases” due to asymptomatic individuals having the highest ratio (75%) among the total infected population. It is rather challenging to intervene in this population at the individual level as they are asymptomatic. However, it is still crucial to have intervention(s) targeting or controlling the impact from the silent spreaders. One of the potential interventions is sanitation, such as sewage plant treatment.
The sensitivity test results also show that the model is strongly sensitive towards sewage system treatment. Sewage management and food safety are two critical areas for preparedness and response to the cholera outbreak. However, because these fields are not mandated by the health care system or the WASH cluster, they are frequently overlooked or dealt with ad hoc during the response [14,25]. This problem is also indicated by the lack of cholera modeling literature on sewage treatment.
The highest numbers of cholera cases have been reported in areas with non-functional sewage treatment plants [43]. Without functional sewage treatment plants, sewage effluents are frequently diverted to impoverished neighborhoods and agricultural lands, contaminating shallow aquifers and wells used by local civilians and private tankers [1,26]. The reuse of sewage effluents for irrigation is an essential alternative water source for Yemen.
Sewage treatment helps remove contaminants from sewage to produce effluent suitable for discharge to the surrounding environment or reuse [1,26,35]. For instance, farmers in Yemen collect sewage effluent directly from stabilization ponds to irrigate various crops [44]. A study by Al-Sharabee in 2009 (cited in Al-gheeti et al. [35]) reports that the zone area near the Sana’a wastewater treatment plant depends upon the sewage effluents for 95% of crop irrigation. However, Yemen’s current sewage effluent quality is generally poor, since none of the existing sewage treatment plants produce effluents that comply with the effluent quality regulations [44].
Although reports specifying project impact evaluation are uncommon in the published literature [17], a well-maintained sewage treatment plant is assumed to produce effluents that meet quality regulations, thereby improving sanitary conditions and reducing Vibrio cholerae contamination in drinking water sources [1,26].
While this cholera response model is useful for clarifying policy problems and reshaping mental models, it is just as important to be transparent regarding the model’s limitations, assumptions, and boundary conditions. The cholera response model has several limitations, many of which stem from data quality or availability problems when approximating or estimating more detailed quantified representations of important dynamics. For instance, a lack of information regarding the weight of various WASH intervention impacts on the overall sanitary conditions in Al-Hudaydah. Sensitivity analysis has been used to provide some insurance against such uncertainties. The model’s limitations nonetheless restrict the quantitative precision of the model’s projections, which should be borne in mind when interpreting its results. In other words, this cholera response model is not intended for high-precision quantitative forecasting or prediction.
Regardless of the outlined limitations, this cholera response model has shown both the compounding factors that exacerbate the epidemic and the operational dynamics in controlling the epidemics. The model stresses the importance of distinct asymptomatic and symptomatic reinforcing feedback loops, where interventions must target both. Most importantly, the intervention starting time plays the essential role in controlling the epidemic. Lastly, the model identifies the unknown unintended consequences, such as ‘shifting the burden’ from overly focused water provision intervention. To conclude, the model paves the way for a more robust cholera response policy analysis in the future. The next steps include further analysis of how each intervention impacts the epidemic control, building a use-friendly model interface, and adapting the model to reflect cholera outbreaks in other countries.
Supplementary Materials
The following supporting information can be downloaded at: https://www.mdpi.com/article/10.3390/systems11010003/s1, Table S1 (Documentation) and Table S2 (Sensitivity Analysis). References [45,46,47,48,49,50,51,52,53,54,55,56,57] list in Supplementary Materials file.
Author Contributions
Conceptualization, P.S.L.; methodology, P.S.L.; software, P.S.L.; validation, P.S.L., A.A. and B.K.; formal analysis, P.S.L.; investigation, P.S.L.; resources, P.S.L.; data curation, P.S.L.; writing—original draft preparation, P.S.L.; writing—review and editing, A.A. and B.K.; visualization, P.S.L.; supervision, A.A. and B.K.; project administration, A.A. and B.K. All authors have read and agreed to the published version of the manuscript.
Funding
This research received no external funding.
Institutional Review Board Statement
Not applicable.
Informed Consent Statement
Not applicable.
Data Availability Statement
Not applicable.
Acknowledgments
The model is built upon the findings from Rocca [19]. The authors are grateful for early guidance from humanitarian experts Leonardo Milano and data fellow Roberta Rocca. The authors would also like to thank Billy Schoenberg and Wang Zhao for their feedback on the model.
Conflicts of Interest
The authors declare no conflict of interest.
References
- Médecins Sans Frontières. Management of a Cholera Epidemic. 2018th ed. 2018. Available online: https://medicalguidelines.msf.org/viewport/CHOL/english/management-of-a-cholera-epidemic-23444438.html (accessed on 20 September 2022).
- World Health Organization. Guidelines for Cholera Control; World Health Organization: Geneva, Switzerland, 1993; Available online: https://apps.who.int/iris/handle/10665/36837 (accessed on 20 September 2022).
- Federspiel, F.; Ali, M. The Cholera Outbreak in Yemen: Lessons Learned and Way Forward. BMC Public Health 2018, 18, 1338. [Google Scholar] [CrossRef] [PubMed]
- Harpring, R.; Maghsoudi, A.; Fikar, C.; Piotrowicz, W.D.; Heaslip, G. An Analysis of Compounding Factors of Epidemics in Complex Emergencies: A System Dynamics Approach. J. Humanit. Logist. Supply Chain Manag. 2021, 11, 198–226. [Google Scholar]
- Spiegel, P.; Ratnayake, R.; Hellman, N.; Lantagne, D.S.; Ververs, M.; Ngwa, M.; Wise, P.H. Cholera in Yemen: A Case Study of Epidemic Preparedness and Response; Johns Hopkins Center for Humanitarian Health: Baltimore, MD, USA, 2018. [Google Scholar]
- Davis, W.; Narra, R.; Mintz, E.D. Cholera. Curr. Epidemiol. Rep. 2018, 5, 303–315. [Google Scholar] [CrossRef]
- World Health Organization. Cholera Situation in Yemen December 2020 [Infographic]. Available online: https://applications.emro.who.int/docs/WHOEMCSR314E-eng.pdf?ua=1 (accessed on 20 September 2022).
- Burki, T. Yemen’s Neglected Health and Humanitarian Crisis. Lancet 2016, 387, 734–735. [Google Scholar] [CrossRef]
- Qadri, F.; Islam, T.; Clemens, J.D. Cholera in Yemen—An Old Foe Rearing Its Ugly Head. N. Engl. J. Med. 2017, 377, 2005–2007. [Google Scholar] [CrossRef]
- Emergency Operation Center. Cholera Response Health Actors and Partner Activities. 2021. Available online: https://app.powerbi.com/view?r=eyJrIjoiNTY3YmU0NTItMmFjYy00OTUxLWI2NzEtOTU5N2Q0MDBjMjE5IiwidCI6ImI3ZTNlYmJjLTE2ZTctNGVmMi05NmE5LTVkODc4ZDg3MDM5ZCIsImMiOjl9 (accessed on 20 September 2022).
- United Nations Office for the Coordination of Humanitarian Affairs. Yemen: Cholera Outbreak Tracker Governorate Profiles. Available online: https://public.tableau.com/views/001CholeraYemenTracker/FacilityBaseline?%3Aembed=y&%3AshowVizHome=no&%3Adisplay_count=y&%3Adisplay_static_image=y#!%2Fpublish-confirm (accessed on 20 September 2022).
- UNICEF. UNICEF Yemen Humanitarian Situation Report. Available online: https://reliefweb.int/sites/reliefweb.int/files/resources/UNICEFYemenHumanitarianSituationReport-August2018.pdf (accessed on 20 September 2022).
- Al-Mekhlafi, H.M. Yemen in a Time of Cholera: Current Situation and Challenges. Am. J. Trop. Med. Hyg. 2018, 98, 1558–1562. [Google Scholar] [CrossRef] [PubMed]
- Bellizzi, S.; Pichierri, G.; Cegolon, L.; Panu Napodano, C.M.; Ali Maher, O. Coordination during Cholera Outbreak Response: Critical Insights from Yemen. Am. J. Trop. Med. Hyg. 2021, 105, 1155–1156. [Google Scholar] [CrossRef]
- Barciela, R.; Bilge, T.; Brown, K.; Champion Christophe, A.S.; Shields, M.; Ticehurst, H.; Jutla, A.; Usmani, M.; Colwell, R. Early Action for Cholera Project. Yemen Case Study; Met Office: Exeter, UK, 2021. [Google Scholar]
- Pruyt, E. Small System Dynamics Models for Big Issues: Triple Jump towards Real-World Complexity; TU Delft Library: Delft, The Netherlands, 2013. [Google Scholar]
- Fung, I.C.-H. Cholera Transmission Dynamic Models for Public Health Practitioners. Emerg. Themes Epidemiol. 2014, 11, 1. [Google Scholar] [CrossRef]
- Richardson, G.P. System Dynamics: Simulation for Policy Analysis from a Feedback Perspective. In Qualitative Simulation Modeling and Analysis; Springer: Berlin/Heidelberg, Germany, 1991; pp. 144–169. [Google Scholar]
- Rocca, R. Complex Systems Modeling for Humanitarian Action: Methods and Opportunities; United Nations Office for the Coordination of Humanitarian Affairs: Geneva, Switzerland, 2021. [Google Scholar]
- Diphtheria & Cholera Response. Available online: https://www.humanitarianresponse.info/sites/www.humanitarianresponse.info/files/documents/files/eoc_sitrep_25_yemen.pdf (accessed on 20 September 2022).
- Camacho, A.; Bouhenia, M.; Alyusfi, R.; Alkohlani, A.; Naji, M.A.M.; de Radiguès, X.; Abubakar, A.M.; Almoalmi, A.; Seguin, C.; Sagrado, M.J.; et al. Cholera Epidemic in Yemen, 2016–2018: An Analysis of Surveillance Data. Lancet Glob. Health 2018, 6, e680–e690. [Google Scholar] [CrossRef]
- Sterman, J. Business Dynamics. Systems Thinking and Modeling for a Complex World; McGraw Hill Higher Education: Boston, MA, USA, 2000. [Google Scholar]
- Pruyt, E. Making System Dynamics Cool? Using Hot Testing & Teaching Cases. In Proceedings of the 27th International Conference of the System Dynamics Society. System Dynamics Society, Albuquerque, New Mexico, 26 July 2009. [Google Scholar]
- Mwasa, A.; Tchuenche, J.M. Mathematical Analysis of a Cholera Model with Public Health Interventions. Biosystems 2011, 105, 190–200. [Google Scholar] [CrossRef]
- Wolfe, M.; Kaur, M.; Yates, T.; Woodin, M.; Lantagne, D. A Systematic Review and Meta-Analysis of the Association between Water, Sanitation, and Hygiene Exposures and Cholera in Case-Control Studies. Am. J. Trop. Med. Hyg. 2018, 99, 534–545. [Google Scholar] [CrossRef] [PubMed]
- Okoh, A.I.; Sibanda, T.; Nongogo, V.; Adefisoye, M.; Olayemi, O.O.; Nontongana, N. Prevalence and Characterisation of Non-Cholerae Vibrio Spp. in Final Effluents of Wastewater Treatment Facilities in Two Districts of the Eastern Cape Province of South Africa: Implications for Public Health. Environ. Sci. Pollut. Res. 2015, 22, 2008–2017. [Google Scholar] [CrossRef] [PubMed]
- Ng, Q.X.; De Deyn, M.L.Z.Q.; Loke, W.; Yeo, W.S. Yemen’s Cholera Epidemic Is a One Health Issue. J. Prev. Med. Public Health 2020, 53, 289. [Google Scholar] [CrossRef] [PubMed]
- Grad, Y.H.; Miller, J.C.; Lipsitch, M. Cholera Modeling: Challenges to Quantitative Analysis and Predicting the Impact of Interventions. Epidemiology 2012, 23, 523–530. [Google Scholar] [CrossRef]
- Chao, D.L.; Longini, I.M., Jr.; Morris, J.G., Jr. Modeling Cholera Outbreaks. Curr. Top. Microbiol. Immunol. 2014, 379, 195–209. [Google Scholar] [CrossRef]
- Kaper, J.B.; Morris, J.G., Jr.; Levine, M.M. Cholera. Clin. Microbiol. Rev. 1995, 8, 48–86. [Google Scholar] [CrossRef]
- Leung, T.; Matrajt, L. Protection Afforded by Previous Vibrio Cholerae Infection against Subsequent Disease and Infection: A Review. PLoS Negl. Trop. Dis. 2021, 15, e0009383. [Google Scholar] [CrossRef]
- Nelson, E.J.; Harris, J.B.; Morris, J.G., Jr.; Calderwood, S.B.; Camilli, A. Cholera Transmission: The Host, Pathogen and Bacteriophage Dynamic. Nat. Rev. Microbiol. 2009, 7, 693–702. [Google Scholar] [CrossRef]
- Chao, D.L.; Halloran, M.E.; Longini, I.M. Vaccination Strategies for Epidemic Cholera in Haiti with Implications for the Developing World. Proc. Natl. Acad. Sci. USA 2011, 108, 7081–7085. [Google Scholar] [CrossRef]
- Global Task Force on Cholera Control. Roadmap 2030. Available online: https://www.gtfcc.org/about-gtfcc/roadmap-2030/ (accessed on 20 September 2022).
- Al-Gheethi, A.A.S.; Abdul-Monem, M.O.; Al-Zubeiry, A.H.S.; Efaq, A.N.; Shamar, A.M.; Al-Amery, R.M.A. Effectiveness of Selected Wastewater Treatment Plants in Yemen for Reduction of Faecal Indicators and Pathogenic Bacteria in Secondary Effluents and Sludge. Water Pract. Technol. 2014, 9, 293–306. [Google Scholar] [CrossRef]
- Miller Neilan, R.L.; Schaefer, E.; Gaff, H.; Fister, K.R.; Lenhart, S. Modeling Optimal Intervention Strategies for Cholera. Bull. Math. Biol. 2010, 72, 2004–2018. [Google Scholar] [CrossRef] [PubMed]
- Parker, L.A.; Rumunu, J.; Jamet, C.; Kenyi, Y.; Lino, R.L.; Wamala, J.F.; Mpairwe, A.M.; Ciglenecki, I.; Luquero, F.J.; Azman, A.S.; et al. Adapting to the Global Shortage of Cholera Vaccines: Targeted Single Dose Cholera Vaccine in Response to an Outbreak in South Sudan. Lancet Infect. Dis. 2017, 17, e123–e127. [Google Scholar] [CrossRef] [PubMed]
- World Health Organization. Ending Cholera a Global Roadmap to 2030. In Ending Cholera a Global Roadmap to 2030; UNICEF: Yemen, Yemen, 2017; p. 32. [Google Scholar]
- LaRocque, R.; Harris, J.B. Cholera: Clinical Features, Diagnosis, Treatment, and Prevention. This Top. Available online: https://www.uptodate.com/contents/cholera-clinical-features-diagnosis-treatment-and-prevention (accessed on 20 September 2022).
- Barlas, Y. Formal Aspects of Model Validity and Validation in System Dynamics. Syst. Dyn. Rev. 1996, 12, 183–210. [Google Scholar] [CrossRef]
- Turner, B.L. Model Laboratories: A Quick-Start Guide for Design of Simulation Experiments for Dynamic Systems Models. Ecol. Modell. 2020, 434, 109246. [Google Scholar] [CrossRef]
- Tuite, A.R.; Tien, J.; Eisenberg, M.; Earn, D.J.; Ma, J.; Fisman, D.N. Cholera Epidemic in Haiti, 2010: Using a Transmission Model to Explain Spatial Spread of Disease and Identify Optimal Control Interventions. Ann. Intern. Med. 2011, 154, 593–601. [Google Scholar] [CrossRef]
- Abu-Lohom, N.; Muzenda, D.; Mumssen, Y.U. A WASH Response to Yemen’s Cholera Outbreak. World Bank Blogs 2018. Available online: https://blogs.worldbank.org/water/wash-response-yemen-s-cholera-outbreak (accessed on 20 September 2022).
- Al-Gheethi, A.; Noman, E.; Jeremiah David, B.; Mohamed, R.; Abdullah, A.; Nagapan, S.; Hashim Mohd, A. A Review of Potential Factors Contributing to Epidemic Cholera in Yemen. J. Water Health 2018, 16, 667–680. [Google Scholar] [CrossRef]
- Centers for Disease Control and Prevention. Antibiotic Treatment. Available online: https://www.cdc.gov/cholera/treatment/antibiotic-treatment.html (accessed on 20 September 2022).
- International Organization for Migration. Task Force for Population Movement Yemen August 2018. 2021. Available online: https://displacement.iom.int/yemen (accessed on 20 September 2022).
- Ali, A. IDPs in Hudaydah: Where Aid, Protection Don’t Always Reach; 2021. Available online: https://sanaacenter.org/ypf/idps-in-hudaydah/ (accessed on 20 September 2022).
- McCrickard, L.; Massay, A.E.; Narra, R.; Mghamba, J.; Mohamed, A.A.; Kishimba, R.S.; Urio, L.J.; Rusibayamila, N.; Magembe, G.; Bakari, M.; et al. Cholera Mortality during Urban Epidemic, Dar Es Salaam, Tanzania, August 16, 2015–January 16, 2016. Emerg. Infect. Dis. J. 2017, 23, 13. [Google Scholar] [CrossRef]
- UNICEF. UNCEF Cholera Tookit 2013. Available online: https://sites.unicef.org/cholera/Cholera-Toolkit-2013.pdf (accessed on 20 September 2022).
- Ochoa, B.; Surawicz, C.M. Diarrheal Diseases–Acute and Chronic. Available online: https://gi.org/topics/diarrhea-acute-and-chronic/ (accessed on 20 September 2022).
- Michas, F. Number of Patients That Physicians in the U.S. Saw per Day from 2012 to 2018. 2020. Available online: https://www.statista.com/statistics/613959/us-physicans-patients-seen-per-day/ (accessed on 20 September 2022).
- Günther, I.; Niwagaba, C.B.; Lüthi, C.; Horst, A.; Mosler, H.-J.; Tumwebaze, I.K. When Is Shared Sanitation Improved Sanitation?-The Correlation between Number of Users and Toilet Hygiene. 2012. Available online: https://www.ircwash.org/resources/when-shared-sanitation-improved-sanitation-correlation-between-number-users-and-toilet (accessed on 22 September 2022).
- Worldbank. People Practicing Open Defecation, Urban (% of urban population)-Yemen, Rep. Available online: https://data.worldbank.org/indicator/SH.STA.ODFC.UR.ZS?locations=YE (accessed on 20 September 2022).
- Ministry of Electricity and Water. Environmental Impact Assessment. Available online: Chrome-extension://efaidnbmnnnibpcajpcglclefindmkaj/https://documents1.worldbank.org/curated/en/279131468335060537/pdf/E4940V60P0576020Box353756B01PUBLIC1.pdf (accessed on 20 September 2022).
- Pezzoli, L. Global Oral Cholera Vaccine Use, 2013–2018. Vaccine 2020, 38, A132–A140. [Google Scholar] [CrossRef]
- Durham, L.K.; Longini, I.M., Jr.; Halloran, M.E.; Clemens, J.D.; Azhar, N.; Rao, M. Estimation of Vaccine Efficacy in the Presence of Waning: Application to Cholera Vaccines. Am. J. Epidemiol. 1998, 147, 948–959. [Google Scholar] [CrossRef]
- Shim, E.; Galvani, A.P. Distinguishing Vaccine Efficacy and Effectiveness. Vaccine 2012, 30, 6700–6705. [Google Scholar] [CrossRef]


Disclaimer/Publisher’s Note: The statements, opinions and data contained in all publications are solely those of the individual author(s) and contributor(s) and not of MDPI and/or the editor(s). MDPI and/or the editor(s) disclaim responsibility for any injury to people or property resulting from any ideas, methods, instructions or products referred to in the content. |
© 2022 by the authors. Licensee MDPI, Basel, Switzerland. This article is an open access article distributed under the terms and conditions of the Creative Commons Attribution (CC BY) license (https://creativecommons.org/licenses/by/4.0/).