
Impact of Nonstandard Default Risk of the Urban Investment and Development Companies on the Urban Investment Bond Market

1
School of Finance, Nanjing Audit University, Nanjing 210093, China
2
Faculty of Social Sciences and Law, University of Bristol, Bristol BS8 1QU, UK
3
School of Engineering Audit, Nanjing Audit University, Nanjing 211815, China
4
School of Design and the Built Environment, Curtin University, Perth, WA 6845, Australia
*
Author to whom correspondence should be addressed.
Systems 2023, 11(2), 68; https://doi.org/10.3390/systems11020068
Submission received: 18 December 2022
/
Revised: 20 January 2023
/
Accepted: 24 January 2023
/
Published: 28 January 2023
(This article belongs to the Topic SDGs 2030 in Buildings and Infrastructure)
Abstract
:Under the general trend of reducing leverage and strictly controlling new implicit debts of local governments, the risk of nonstandard defaults by urban investment and development companies (UIDCs) continues to be released, which will increase the credit risk of UIDCs. This paper examines the impact of nonstandard default events of municipal investment platform companies on the urban investment bond (UIB) market through event analysis using 252 nonstandard default events of 32 municipal investment companies from 2018 to 2021 as sample data. The findings show that the UIB market is ineffective and affected by nonstandard defaults and that bond returns show abnormal short-term significant negative fluctuations. This study has important implications regarding the early warning of UIB default risk and the improvement of the sustainable development of urban investment enterprise financing.
1. Introduction
In China, local governments actively participate in the market through urban investment and development companies (UIDC), known in Chinese as chengtou [1]. As a distinctively Chinese institution, the core function of the UIDC is to take charge of the investment and construction processes in urban and infrastructure projects [2]. The UIDC plays an essential part in the China’s urbanization strategy [3]. Accordingly, the Winder database shows the number of UIDCs exceeded 3000 in 2022.
UIDCs in China mainly obtain financing through the following three methods: bank loans, urban investment bonds (UIBs) [4,5], and nonstandard financing. In China, UIBs are closely related to the government, which is an arrangement sharing similarities with municipal bonds in the United States [6]. At present, there is a wealth of research on UIBs, which focuses on the risk [5], the flow and stock [7], the price [8], the issuing spread [9], and regulatory policy.
In contrast to UIBs, nonstandard financing consists of debt assets that are not traded in the banking and securities trading markets, which includes credit assets, trust loans, entrusted claims, promissory notes, and accounts receivable [10]. Nonstandard financing is not limited by quotas and is not strictly controlled by regulatory authorities. This makes it difficult for traditional regulatory frameworks to effectively identify risks in the funding chain [11]. Therefore, nonstandard financing defaults have occurred frequently in China [12]. By the end of 2021, urban investment nonstandard defaults occurred in 14 regions, including Guizhou Province, Sichuan Province, Jilin Province, and Anhui Province. Thirty-two prefecture-level cities (states) and eighty-eight financing platforms were involved, and the total frequency of default events was approximately 167.
Regarding nonstandard financing, a growing number of studies have highlighted the issues regarding the assessment of nonstandard financing [13]. Some studies focused narrowly on the impact of non-standard financing on interest rate spreads [4]. Some studies simply linked proxies for nonstandard financing directly to economic outcomes such as the volume of bank lending [14]. Other studies examined how non-standard measures affect banks’ risk exposure [15]. However, there are few studies examining nonstandard defaults and their possible impact on UIBs as well as the transmission of default risk.
In fact, the prices of UIBs issued by UIDCs also have significant abnormal fluctuations around their default dates. For example, according to information from Enterprise Alert, the nonstandard default date of Guizhou Xinpu Economic Development Investment Co., Ltd. was 1 March 2020, and the UIBs “19 Xinpu 02”, “19 Xinpu 03”, and “19 Xinpu 05” issued by the company in the same period showed significant abnormal fluctuations; Zunyi Honghuagang City Construction Investment Operation Co., Ltd. experienced nonstandard default on 1 February 2020, and its issued UIBs “17 Honghuagang Parking Lot Bond 01”, “PR Zunhong City”, and “16 Zunhong UIB” also experienced abnormal price fluctuations during the same period. Accordingly, this paper examines the relationship between the price of UIBs and nonstandard defaults based on an event study approach. Then, this paper argues for the effectiveness of the UIB market; namely, the UIB market will react to insider information regarding nonstandard defaults of UIDCs. This is important for the early warning of UIB default risk and the improvement of the sustainable development of urban investment enterprise financing.
This paper is organized as follows: Section 2 presents the theoretical foundation and research hypotheses. Section 3 provides a detailed description of the data source. Section 4 presents the proposed research methodology, and its related quantitative analyses and results are presented in Section 5. Section 6 presents the implications of this research. Finally, the last section consolidates the research performed in the form of conclusions.
2. Literature Review
2.1. UIBs
Scholars customarily refer to UIBs as “quasi municipal bonds”, and the volume of the literature discussing this issue is relatively large. In terms of issuing subjects and composition structure, it is the issuing subjects that are defined as local financing platform companies [16] with implicit support from the central government [17], while the specific content includes corporate bonds, medium-term notes, and short-term financing bonds issued to raise financing for local urban construction or public welfare projects. As a standardized financing instrument with uniform regulatory regulations and rating initiatives, the issuance process is highly transparent and subject to stringent issuance conditions, and researchers have conducted both qualitative and quantitative analyses employing relatively consistent standards and easily available data [18].
The development of UIBs as a refinancing tool has been very strong [19]. In response to the rapid growth of UIBs, experts and scholars have unanimously suggested that the main reason for this strength is that the issuance of UIBs is significantly influenced by the government and its financial situation. First, the scale of UIB issuance is positively correlated with the promotional degree of local officials [20]. In addition, if local government officials’ positions change more steadily, the cost of issuing debt will be relatively lower and, therefore, expand the size of UIBs [21]. In addition, concession revenue from land-use rights’ and fiscal pressure will change the impact of economic growth pressure on UIB issuance [22].
Regarding the trends in the development of UIBs, UIBs issued by local-government financing vehicles (LGFVs) carry implicit governmental guarantees and, therefore, enjoy lower return spreads. The recent policy change introduced by the Chinese central government to regulate local government debt-financing activities has significantly reduced the return spread between LGFVs and bond issues. This policy change introduced by the Chinese central government, which aims to regulate local government debt-financing activities, has significantly weakened the implicit governmental guarantee of UIBs, reduced the return spread between bonds issued by UIDCs and POEs, and made China’s UIB market more market-oriented [23].
The rapid growth of UIBs as a standardized financing instrument for UIDCs has been accompanied by the possibility of potential credit risk emergence or even spillover, while a large number of bonds are issued by financing platforms [24]. The risks of UIBs can be broadly classified as over-issuance-debt risk, uncertainty risk of repayment liability, liquidity risk, own low profitability risk, and credit-rating risk [25]. Thus, the discussion on the issue of UIBs’ risks is widening, and both land-hoarding size and land price have been found to exhibit positive effects on the size and risk of UIBs [26]. In addition, anticorruption significantly increases the credit risk that urban bond issuers face [27]. The credit risk of UIBs is not only related to the operation and financial status of the urban investment platform but also depends on the implicit guarantee of local governments [28].
However, in general, the compound interest approach of UIBs improves bond ratings [29]. In other words, the reputation mechanism of UIB underwriters can effectively reduce the price difference of bond issuance, reduce the information asymmetry between investors and issuers, and effectively solve the problem of informational asymmetry [8]. Additionally, the issuance of UIBs can give full play to the potential financial advantages of financing platforms and have positive promotional effects on other financing businesses of UIDCs under the role of credit scales [30].
2.2. Nonstandard Financing
The concept of nonstandard debt assets was first clearly introduced in 2013, when the China Banking Regulatory Commission issued the “Notice of the China Banking Regulatory Commission on Issues Relating to the Regulation of Investment Operations of Commercial Bank Wealth Management Business”, which defined it as “debt assets that are not traded in the interbank market and stock exchange market are called nonstandard debt assets”.
With respect to previous studies, fewer papers have been published that are directly related to the “nonstandard financing” of UIDCs. In recent years, the regulatory policies of different governments regarding nonstandard financing have been gradually tightened. In Europe, and especially in Poland, the formal mechanisms for reducing local governmental nonstandard financing debt have been significantly strengthened [31]. Meanwhile, in China, the ban on nonstandard financing by the Chinese government is also well documented [32,33]. Starting with the proposition of the China Banking Regulatory Commission regarding “nonstandard regulation” in Document No. 8 in 2013, regulators have gradually reduced the size of the stock of nonstandard assets and reduced the inflow of nonstandard funds to the point of breaking up the regulation in April 2018. From the “New Regulation on Asset Management” in April 2018, which ended rigid payments, to the “New Regulation on Wealth Management” in September of the same year, which restricted commercial banks, and on to the “New Regulation on Trust Plans” in May 2020, which also proposed the investment scale of trust plans to the “New Trust Regulations”, etc., the regulatory authorities have continued to issue policies to ban nonstandard asset pools, prohibit maturity mismatches, and strictly limit channel business.
Even though the control policies are binding, the risk of nonstandard financing remains high. Many nonstandard financing instruments have a common feature in that they are not subject to public finance principles that introduce mechanisms. The high financing risks of nonstandard financing pose a threat to the financial stability of local governments and the solvency of the units [34]. Additionally, the institutional environment and the start-up phase of institutional void development in the nonstandard financing market exacerbate risks by providing inadequate protection for investors and borrowers. In addition, the risk of nonstandard financing is well hidden [10,35]. Banks with higher growth in nonstandard debt investments or wealth management products will invest more money in nonstandard debt instruments. This suggests a mutually reinforcing effect between nonstandard debt investments and wealth management products and that banks with higher risk are more motivated to issue wealth management products to remove their positions from their balance sheets and hide their risks [36].
The frequent use of nonstandard financing instruments can also lead to more serious consequences. Firstly, nonstandard financing can cause an increase in local governmental debt. The use of nonstandard financial instruments by local government units not only leads to the incurrence of contractual costs that are much higher than the market costs but also creates the risk of invisible long-term debt [37]. Secondly, the consequences associated with the use of nonstandard financial instruments by local government units involve small penalties for violating public financial disciplines, which may force authorities to make decisions that result in the deterioration of their financial situation and overburdening. Thirdly, nonstandard financing has a negative impact on banks’ independence. Based on the Cukierman method, it was found that the implementation of nonstandard financing in 2017 had a negative impact on the legal and actual independence of UK banks [38]. Finally, nonstandard financing instruments can also have adverse effects for private users. Local firms tend to use nonstandard financing instruments [39]. However, the disadvantage of this model is the limited amount of capital, which will have an impact on the productivity and operations of the firm [40,41].
2.3. The Event Studies
The event study method is one of the most important methods used for testing market validity and is also widely used to study the impact of a particular event on the market. The event study method, also known as cumulative excess average return analysis, takes the impact of time-series price data as the object of study, calculates the abnormal excess return during the artificially set window around the event’s public date, and uses the paired T-test to determine the cumulative excess average return deviation from zero to obtain conclusions about the impact of the event information.
In the 1930s, the impacts of stock splits on the nominal price of stocks under different time data nodes were studied. This method of studying the impacts caused by specific events and their extent began to emerge in the field of finance [42]. Then, the theoretical system of the event study method was enriched, and the subject of study was further abstracted from the impact on the market value of a company to the impact of a specific type of event on a specific field, and more disciplines—such as accounting, sociology, and law—were involved [43,44]. At the beginning of the 21st century, the event study method was widely used in the field of securities market effectiveness testing, mergers, and the acquisitions of listed companies and accounting research [45]. Scholars have widely used the event study method to study the impact of a particular event on the macro market due to its deep mathematical and statistical foundation, clear logic, and simple calculations. For example, in the financial field, the event study method can also be used to study takeover markets and the impact of mergers on the shareholder returns of constituent firms [46]. There is an inextricable relationship between the properties of daily stock returns and the characteristics of these data and the event study method [47]. Further, the efficiency of several methods was tested and used to measure bond price performance from monthly and daily data pertaining to company stock prices, wherein the monthly data had some advantages over daily data [48]. In addition, the relationship between capital flight and political instability can be studied using the event study methodology widely used in the financial literature. The advantage of using this methodology is that the relationship can be examined more closely by isolating specific instances of political instability (defined as events) [49]. In the field of accounting, the event study methodology significantly contributes to strategic research and can be used to analyze the financial impact of single-country corporate announcements [50].
The event analysis method assumes that all investors remain rational, and in such a case, the securities market is perfectly efficient. Investors cannot obtain any excess returns from technical and fundamental analysis [51]. The purpose of this premise is to ensure that the effect of an event can be measured in terms of excess returns, and similarly, that the cumulative excess average return can be used as the discriminant variable for the effect of an event occurring within a window of time, thus quantifying the effect into data form, and hence the need for the assumption that the market is efficient.
In summary, the following conclusions can be drawn from the review of UIBs and nonstandard financing: Firstly, UIBs are developing rapidly and have a unique “credit anchor” role. Secondly, although nonstandard financing is bound, it is still essentially a “default risk bomb”. As mentioned in the previous paper, there has been little research on “nonstandard financing” and nonstandard defaults of UIDCs in recent years, so this paper will fill the gap in this area. Based on previous research, this paper focuses on the impact of UIDCs’ nonstandard default events on the UIB market and then demonstrates the effectiveness of the UIB market.
In addition, in the review of the empirical theory and its methods, it can be observed that the event study method and market validity test are the more matured methods. Although event studies in the financial field have not yet involved the UIBs market, the previous studies are still a direct guide for the impact analysis of nonstandard default events and the validity testing of the UIBs market. Therefore, this paper will use the event studies method to further investigate the intrinsic relationship between UIBs and nonstandard financing in greater detail.
2.4. Hypotheses
According to our literature analysis, nonstandard financing is a hidden debt of UIDCs, and it carries a high level of risk [41,42,43]. Agarwal and Zhang argued that when firms experience payment pressure, nonstandard assets with higher payment frequency are more likely to default [52]. Public information on nonstandard defaults can create difficulties with respect to UIDCs’ ability to refinance, which can cause a degree of liquidity crunch that will eventually transmit this risk to the UIB market. Accordingly, the first hypothesis of this study is as follows.
H1:
The nonstandard default events of UIDCs will have a significant impact on the UIB market.
Furthermore, the event study approach is the one of the most effective methods for testing the validity of the market [45]. Event studies assume that all investors remain absolutely rational, in which case the securities market is perfectly efficient [51]. That is, investors cannot obtain any excess returns from the information reflected in the market. To facilitate the quantification of the impact of nonstandard defaults on the UIB market, this paper proposes the second hypothesis, as follows.
H2:
The UIB market is a fully efficient market.
3. Data Source
In this paper, the object of the empirical analysis constitutes the nonstandard default events of UICs and the main focus is the impact of these nonstandard default events on the UIB market. The data samples required for the empirical study include the data concerning the nonstandard default events of UIDCs and the market data on UIBs, among which the data concerning the nonstandard default events of UIDCs were released on the “Local Debt Link” platform by China Chengxin International Credit Rating Company Limited (hereafter referred to as CCRI), which serves as the main source of information. As the first national credit rating agency approved by the People’s Bank of China, the data sourced from the CCRI is relatively reliable; thus, 50 nonstandard default events of 32 UIDCs from 2018 to 2021 were collected.
After determining the UIDCs that have experienced nonstandard default events and their corresponding default time points, the next step is to find the corresponding sample data issued by the UIBs. Based on the flush system, this paper collects a total of 125 UIBs for 32 UIDCs (see Appendix A). In addition, the daily data on the return to maturity of the UIB market issued by China Bond Credit Rating Co. are selected as the market sample information.
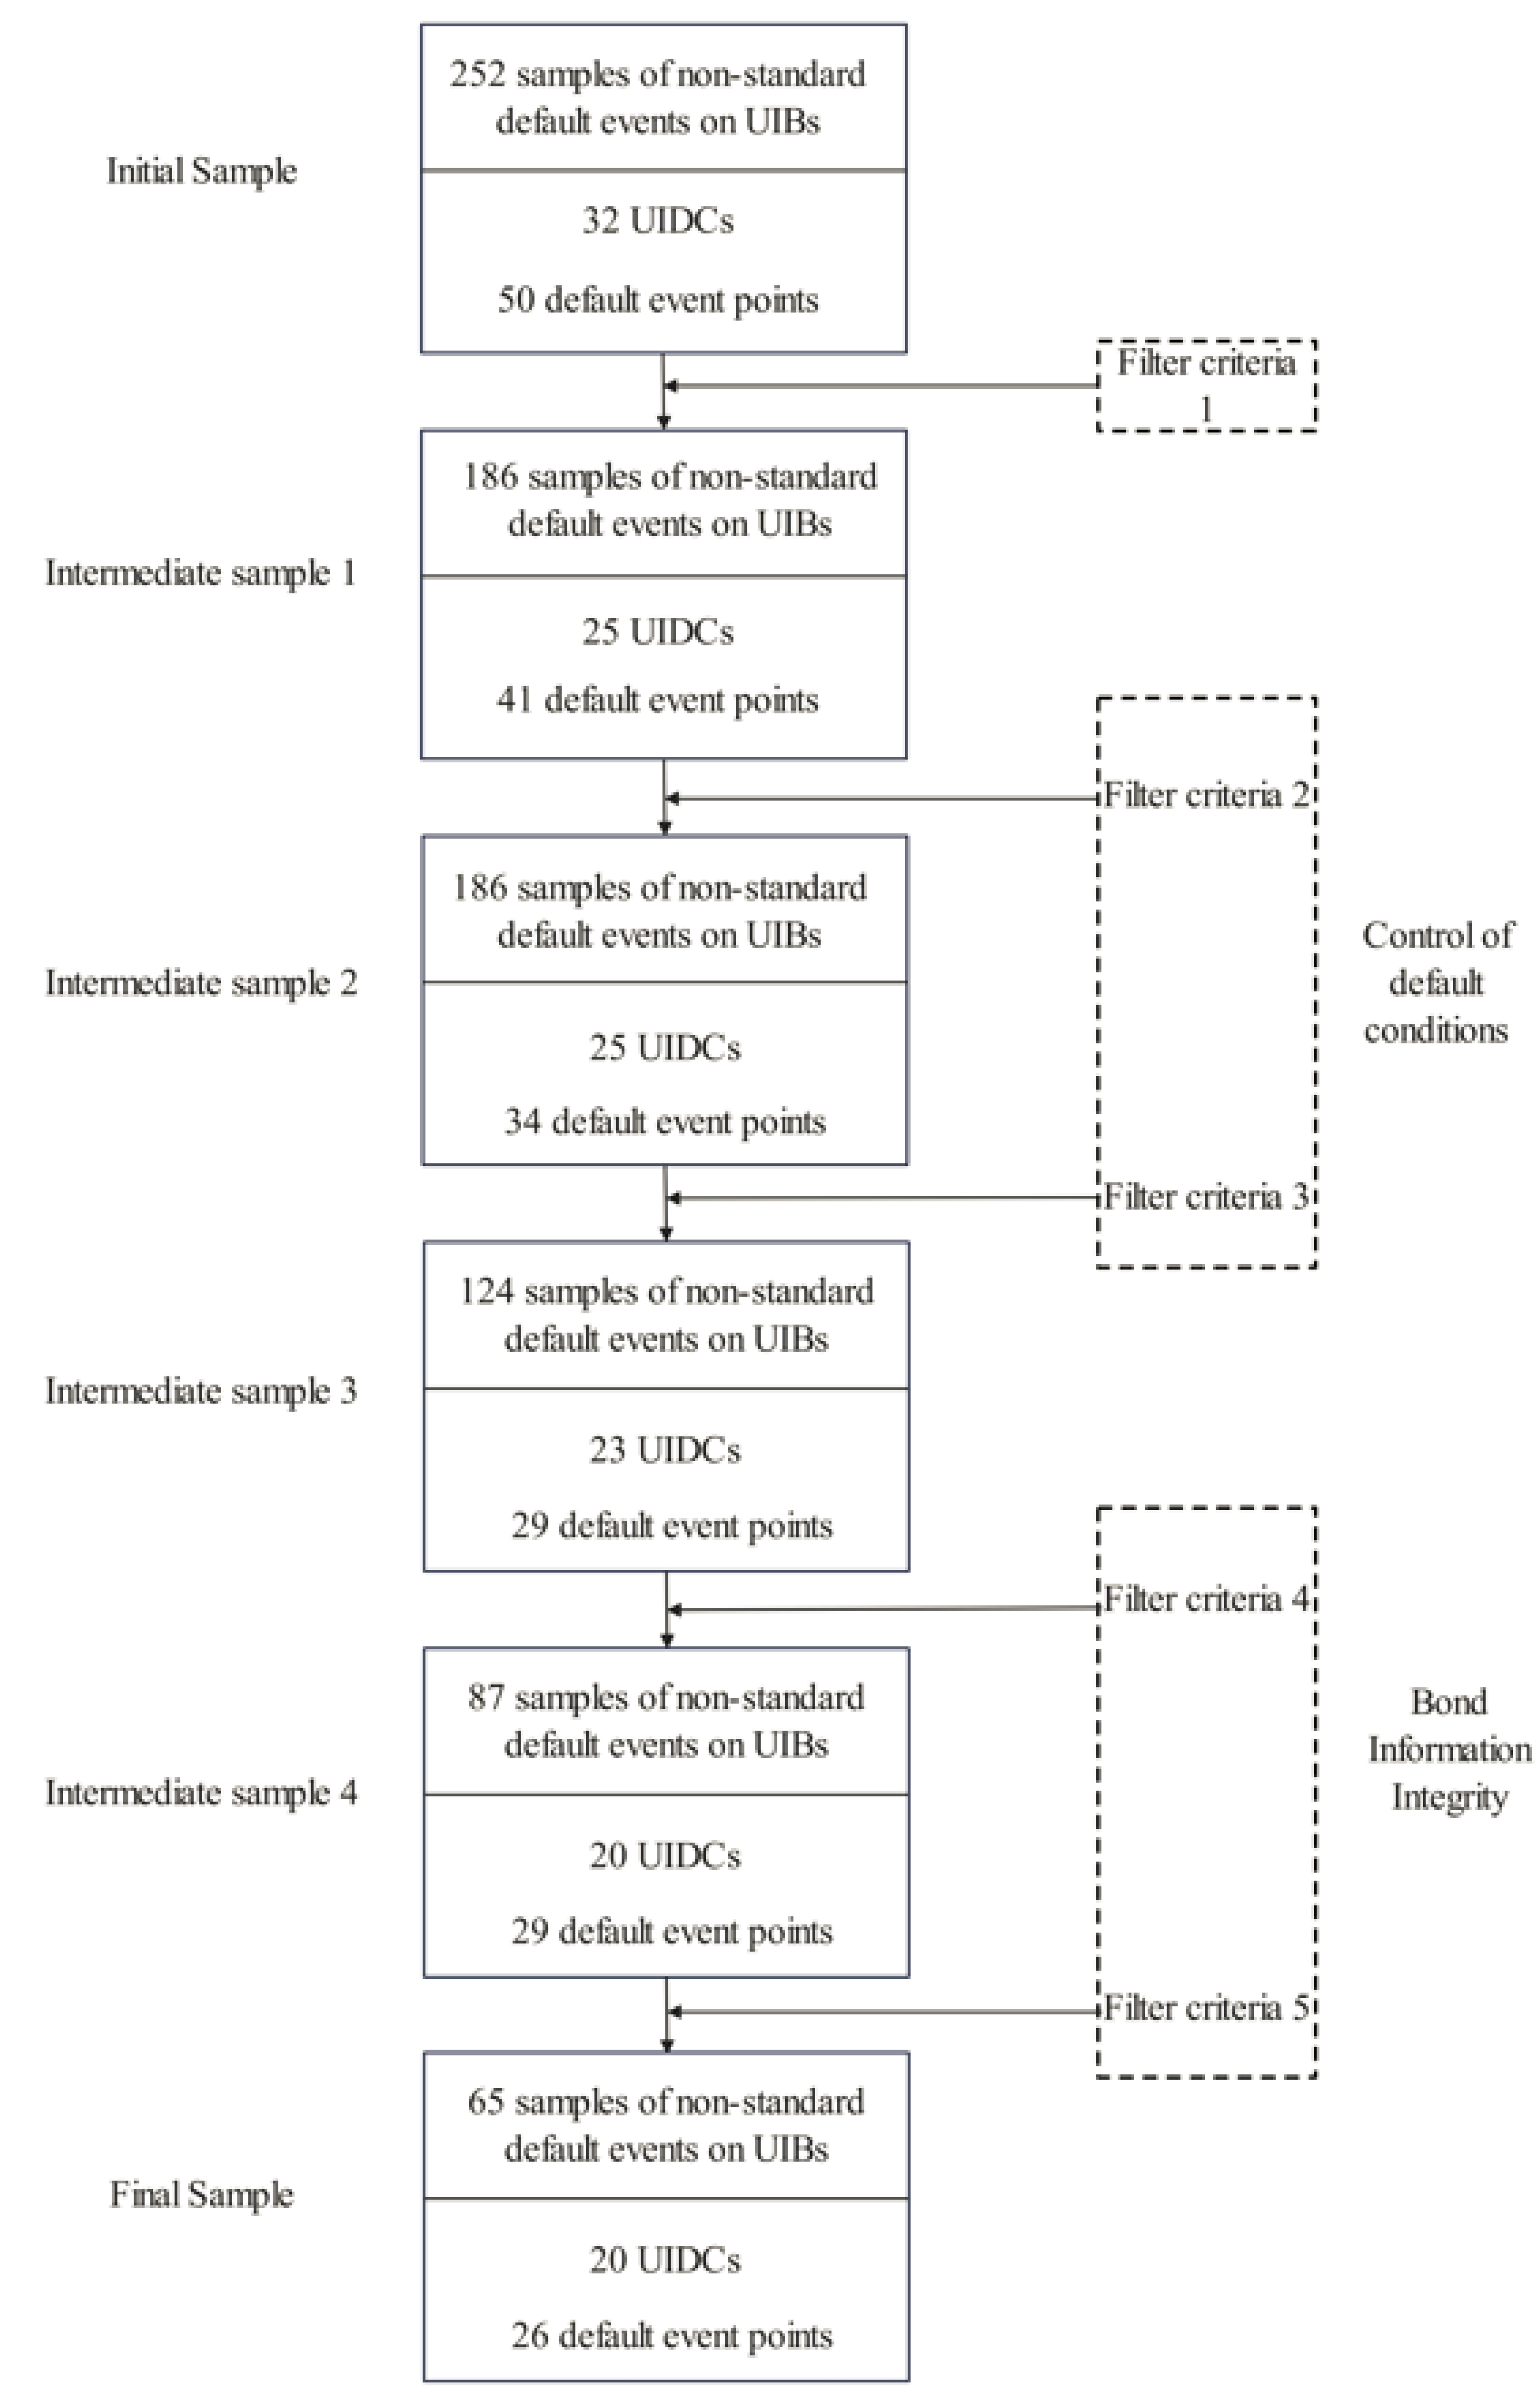
Since UIDCs with nonstandard default situations may have multiple default points that occur at the same time and issue multiple UIBs at the same time, each UIB is divided in the new UIB sample collection according to the default time point. The process of constructing the UIB sample is shown in Figure 1. By combining 125 UIBs with 50 default time points, a total of 252 nonstandard default samples of UIBs were obtained after disassembling bonds with multiple default points.
Based on this, the initial samples need to be further screened according to certain screening conditions, with the specific screening flow shown in Figure 2.
In Figure 2, filter criteria 1, 4, and 5 are control conditions regarding informational integrity, and criteria 2 and 3 are control conditions concerning default behavior. The specific sample-screening process is shown below.
Filter criterion 1 entails excluding the sample of UIDCs that have not issued UIBs. This results in the intermediate sample 1, specifically, a sample of 186 nonstandard default events of UIBs, 25 UIDCs, and 41 default time points.
Filter criterion 2 states that the distance between the public date of nonstandard default events of the same UIDC should not be less than 4 months, and if the two default events are closer together, the one with more complete relative data will be retained. This results in the intermediate sample 2, specifically, a sample of 186 nonstandard default events of UIBs, 25 UIDCs, and 34 default time points.
Filter criterion 3 entails excluding samples where large events such as executive changes, major acquisitions, and mergers occurred during the window period. This results in the intermediate sample 3, specifically, a sample of 124 nonstandard default events of UIBs, 23 UIDCs, and 29 default time points.
Filter criterion 4 entails excluding samples with incomplete return-to-maturity data within the window period. This results in the intermediate sample 4, specifically, a sample of 87 nonstandard default events of UIBs, 20 UIDCs, and 29 default time points.
The filter criterion 5 entails excluding samples with unclear ratings and issue year data for UIBs. In this way, the final sample is formed, including 65 nonstandard default events of UIBs, 20 UIDCs, and 26 default time points, as shown in Appendix B.
4. Research Methodology
In addition to being one of the important methods for performing market validity testing [45], the event study method is also widely used to study the impact of a particular event on the market [53]. In this paper, for 65 nonstandard default events of UIBs, the time point of each event of UIDCs is recorded as ; then, the trading day before and the trading day after each nonstandard default event are defined as and , respectively.
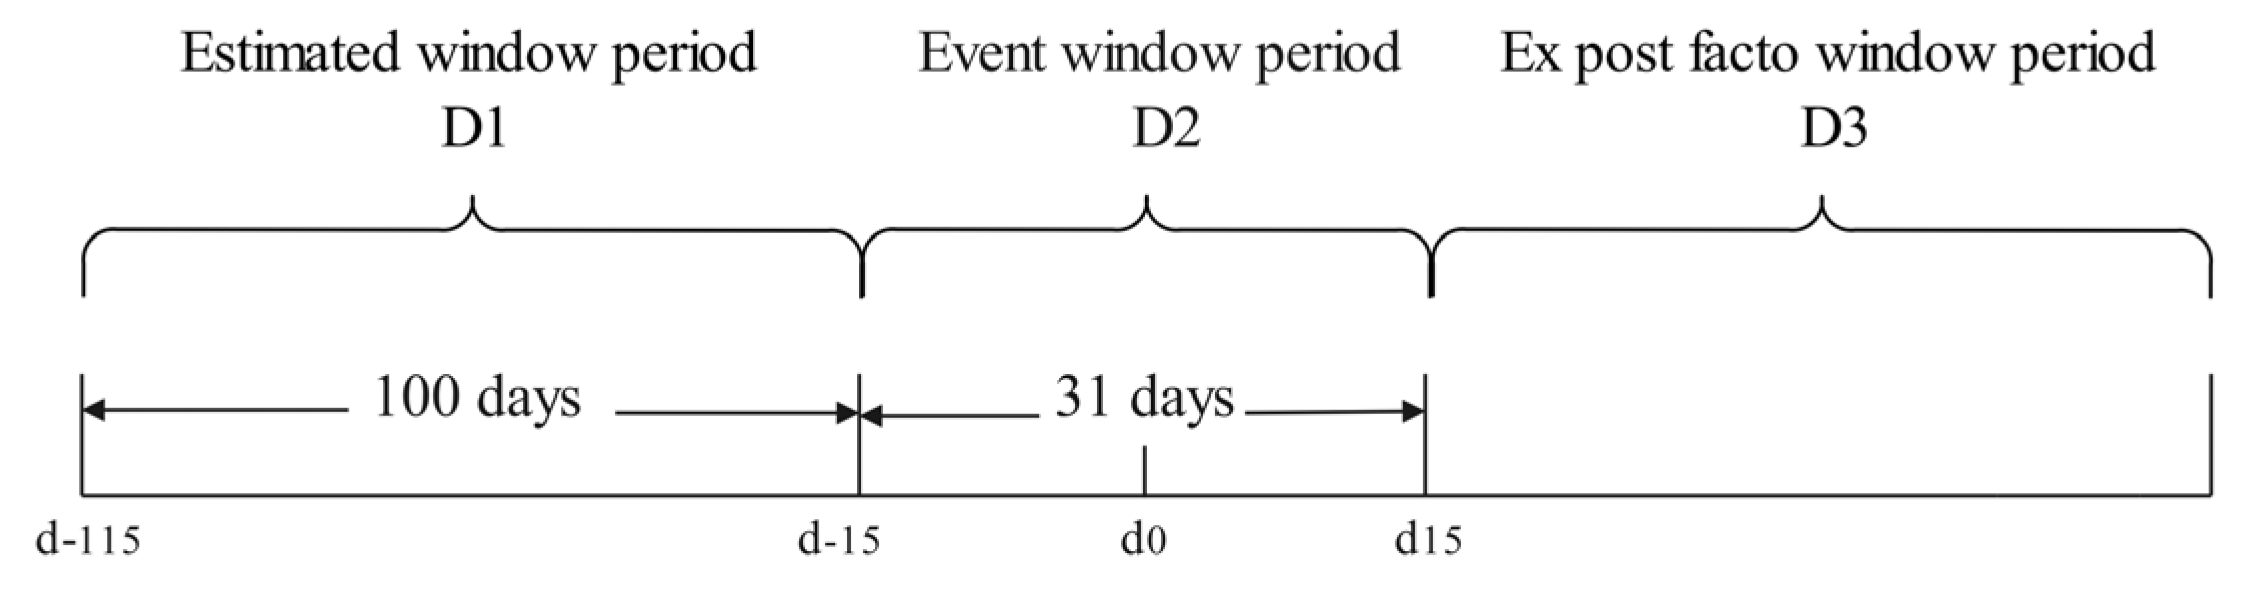
Academics state that the duration of the estimation window tends to be approximately 100 days, while the duration of the event window is about 20 days or more [54]. The choice of the duration depends on the purpose of the research and results of several attempts. After attempting to use 150 days and 200 days as the estimation windows, the results of the calculated regression function used to estimate the normal return during the time window were almost the same. Consequently, in accordance with Kotari and Warner [55], this article chose to shorten the period, since the event analysis with a short duration of its estimation window is relatively mature and credible. Since the length of the estimation window usually varies from 100 to 200 trading days, this paper chooses 100 days as the estimation window length and 31 days as the event window length after several attempts, i.e., setting (, ) as the estimation window period and (, ) as the event window period , and there is no overlap between the different window periods (Figure 3). Due to the empirical demand, no ex post window period is set, and the focus is on the immediate impact of nonstandard default events and the ex-ante UIB market reaction.
According to , the UIB market is a fully efficient market, and the returns during the estimated window of each nonstandard default event are not affected by the default event; therefore, the returns for that time period are normal returns. The calculation of normal returns can be obtained by two main methods: the econometric model and the statistical model [56,57]. The two main statistical models are the constant mean return model, which uses the average return as the normal return over the window, and the market model, which improves on this method and reduces the variance of abnormal returns to make it more practical [58]. The econometric models mainly include the capital-asset-pricing model and arbitrage-pricing theory, which were found to have the disadvantage of large model bias in subsequent empirical tests by scholars and, therefore, have not been used since the 1980s [59].
Therefore, this paper uses a market model from a statistical model, i.e., a risk-adjusted return model. The model is established by finding the relationship between the overall market return and the individual bond return, and the calculated regression function is used to estimate the normal return during the time window. According to the market model equation, there is a univariate linear relationship between individual bond returns of UIBs and market returns [60]; thus, the estimated window period for each nonstandard default event of a UIB can be based on , i.e., a one-dimensional regression function can be constructed based on the return to maturity and the market return to maturity from 115 trading days before the date of the default event () to 16 trading days before the default event’s date, and the fitted function equation is as follows:
where and represent the normal expected return and the market return, respectively, at point within event window for the nonstandard default event of ; denotes the covariance between market returns and UIB returns at time point ; and denotes the constant term.
During the window of each nonstandard default event of a UIB , the difference between the actual return and the normal expected return is the abnormal return (AR) [61]. Specifically, the of the nonstandard default event of a UIB at time point within event window can be expressed as follows:
where represents the actual return at the window time point for the nonstandard default event of .
In addition, the cumulative abnormal return (CAR) [61] represents the total AR of the nonstandard default event of in time . It is estimated by the following formula.
The average abnormal return (AAR) [62] is the average of the abnormal returns of the 65 UIBs nonstandard default events at the same point in time within the event window of , namely,
where , , and denotes the bond serial number.
The cumulative average abnormal return () [45] is the arithmetic mean of the AAR over the event window period . The arithmetic mean of the corresponds to 31 different time points within the event window. The reason for calculating the cumulative summed average returns is to examine the continuous abnormal returns over the window period; therefore, they should be summed separately from the whole, and then the mean should be used to represent the overall situation of the return fluctuation in event window .
5. Quantitative Analyses and Results
In this empirical analysis, we focus on whether the return volatility of 65 UIBs is abnormally affected by the nonstandard default event; specifically, this is performed by observing whether there is a significant difference between the actual daily return and the normal expected return fitted by the regression 100 days before the event window, using the 15 days before and after the event date as the study period.
The regression curves for the normal expected return of the 65 samples is shown in Appendix C.
5.1. Quantitative Analyses
Using Equation (2), the AR can be derived as the difference between the normal expected return and the actual return. Furthermore, the CAR, AAR, and CAAR for all samples at each point in the event window of can be calculated.
The results regarding the AR and CAR can be seen in Figure 4.
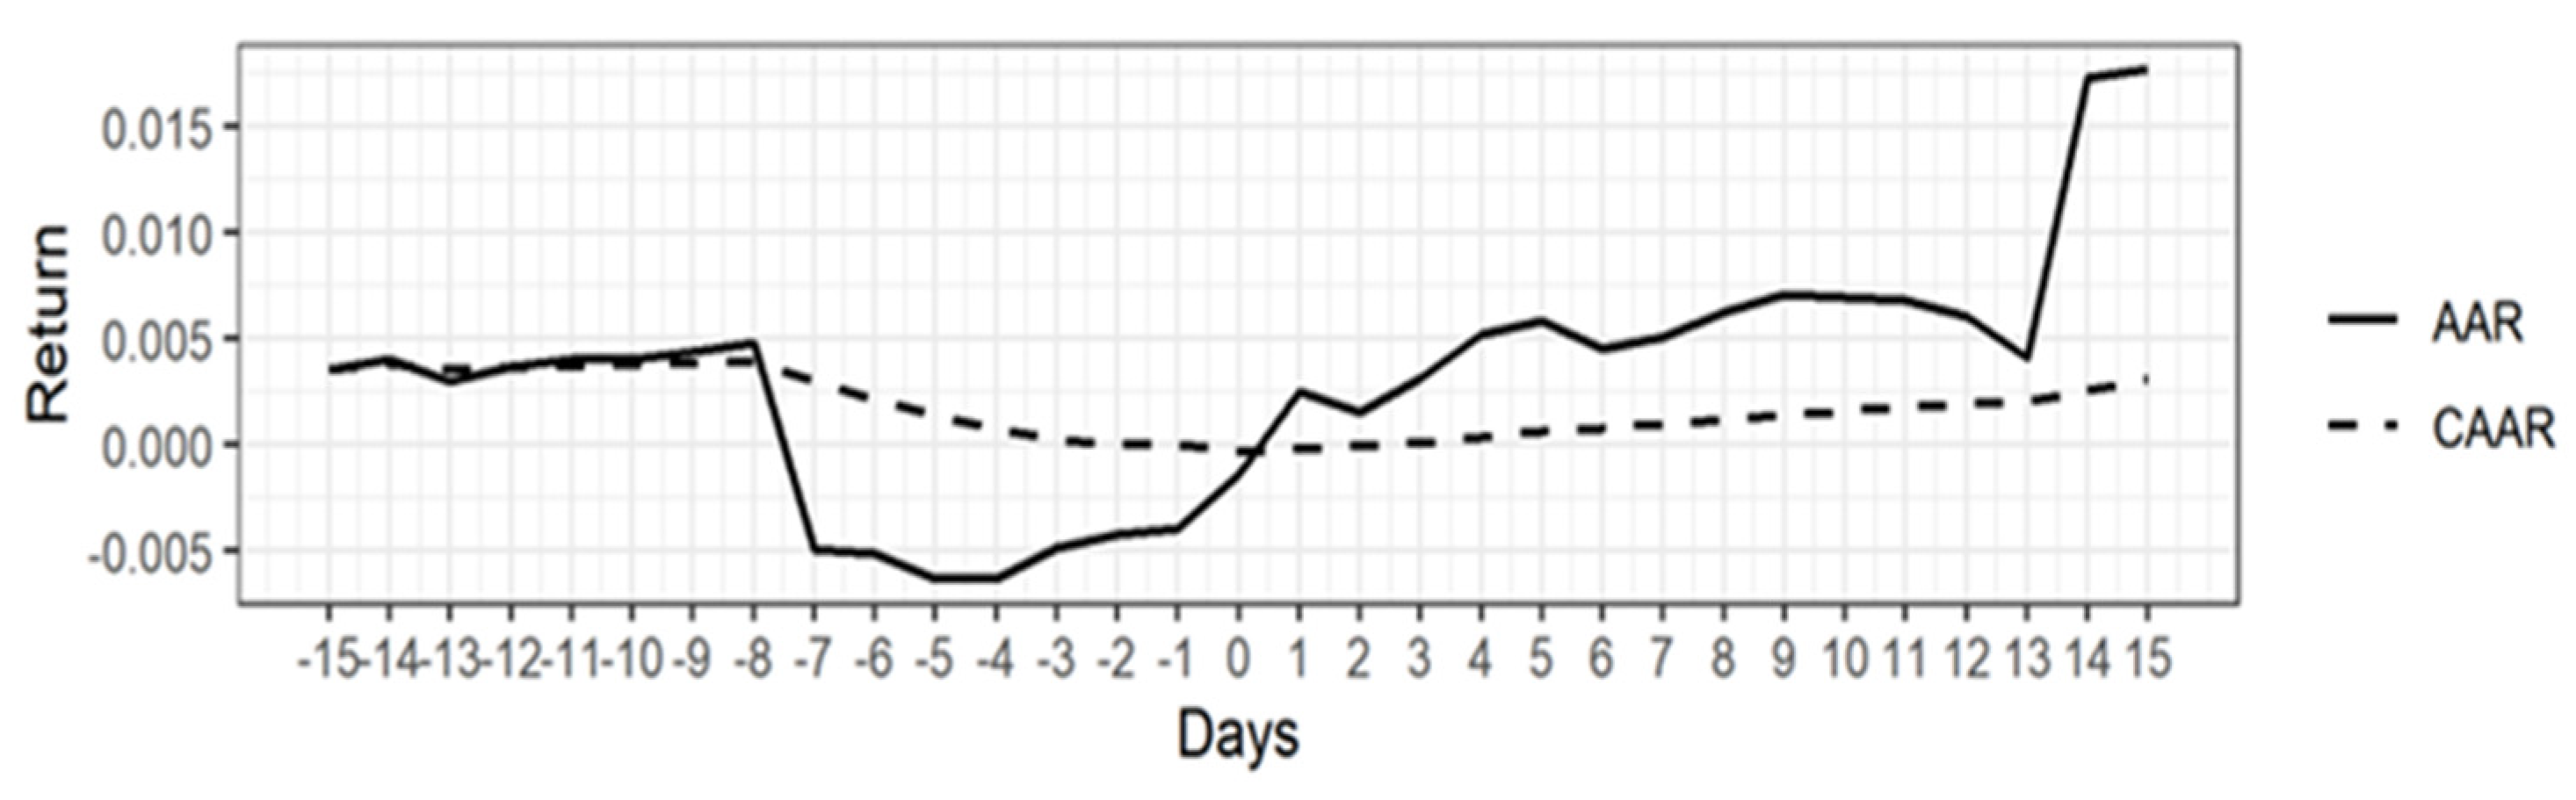
The results regarding the AAR and CAAR are shown in Figure 5.
5.2. Results Regarding the Risk Transmission of Nonstandard Default Events
In this section, this paper focuses on whether the return volatility of the 65 samples in window was affected by the non-standard default event. Specifically, this paper uses a T-test to observe whether the actual returns of the sample during window are significantly different from the normal expected returns [63].
The T-test for the difference between the mean of CAR and zero gives the significance of the effect of the occurrence of events at different times within window . The T-test results of CAR are shown in Table 1.
Then, the T-test step for calculating the difference between the mean of the CAAR and zero denotes the significance of the effect of the occurrence of events. The T-test results regarding the CAAR are shown in Table 2.
Since most of the p-values in Table 1 are less than 0.01, this suggests that the occurrence of a nonstandard default event causes abnormal volatility of UIB returns in window . In turn, this suggests that the nonstandard default events of UIDCs have an impact on the UIB market, i.e., Hypothesis 1 holds.
According to Figure 5 and Table 2, the AAR was negative from the first −7 days and continued to be negative until day 0, which was the first day that it began to appear positive; if a default event day occurred within a week before the UIB return in which abnormal fluctuations had begun to appear, the UIB prices for city nonstandard default events are more sensitive, and a significant negative correlational effect is observed. On the day after the event day, the market recovers quickly, and the AAR turns positive again. Similarly, the CAAR rate after considering the time accumulation factor also showed abnormal fluctuations, but the negative correlation fluctuated on the second day, which is slightly later than the significant abnormal fluctuation of the average daily return rate, and only lasts until the second day. The rebound range of the CAAR on the third day is larger, quickly recovering to a significant positive effect. This is another way of indicating that nonstandard default events have caused certain degrees of negative impacts on the UIB market.
In reference to previous research, China’s non-standardized dual-financing mechanism has led to banks or non-bank financial companies and the entire financial industry witnessing rapid growth in debt accumulation [33]. The rapid increase in the leverage ratio of state-owned enterprises and the decline in the leverage ratio of non-state-owned enterprises have exacerbated the credit risk problem in China [64]. This suggests that nonstandard defaults have had a negative impact on the UIB market, which is similar to the findings of this paper.
5.3. Results Regarding the Effectiveness of the UIB Market
This section focuses on whether the unusual price volatility in UIBs occurred prior to the non-standard default event. According to market validity theory, the prices of UIBs only adjust abruptly in time after a nonstandard default event, so the validity of the UIB market is tested by determining whether the price of the UIB shifted prior to a nonstandard default event.
The validity test of the UIB market is a T-test of the CAAR in the five days before the default event. The result has been shown in Table 3.
According to the data in Table 3, in the (−5, 0) event window, bond prices still changed abnormally. Thus, the UIB market is not fully efficient, and the price outlier fluctuations may advance or lag, i.e., the original hypothesis , which states that the UIB market is a fully efficient market, is not considered valid. In general, when an abnormal fluctuation occurs before the event and an adjustment to a normal fluctuation occurs after the event [43], this indicates that the information response of this market is ahead of time, the price has made an informative adjustment before the event, and the UIB market is not effective as a whole.
In previous studies, some scholars have concluded that the UIB market has implicit governmental guarantees, so the yield spread is small, and the degree of marketization is not high [23]. In addition, there is informational asymmetry in the quasi-municipal bond market, which affects market effectiveness [8]. This paper concludes that the UIB market is not a completely efficient market, which is similar to the conclusions of the previous studies.
In summary, the hypothesis of is accepted, and the hypothesis of is rejected. The result can be seen in Table 4.
6. Implications
This section discusses the theoretical and practical implications derived from the empirical results regarding nonstandard default risk. The theoretical implication of the research lies in its uncovered impact of the risk transmission mechanism of nonstandard default events on the UIB market, whose explication has filled the research gap in the field of nonstandard financing. For example, by collating the research on the credit risk of UIDCs, it can be found that most previous scholars have focused on the default risk of UIBs, and few have explored the default risk of nonstandard financing. Therefore, this paper extends the current literature by clarifying the impact of nonstandard default events of UIDCs on the UIB market through the event study method. This study not only complements the research on the credit risk of UIDCs but also enriches the theory of corporate finance.
Moreover, this research provides two practical implications of the impact of the nonstandard default events of UIDCs on the UIB market. First, the findings are useful for helping investors protect themselves against the risk of default by UIDCs. The related studies discovered that the risk of nonstandard financing can be transmitted to the UIB market, but it is more difficult to renew nonstandard assets at maturity due to China’s financial regulatory policies as per the refinancing risk of UIDCs [31,32]. Therefore, investors should focus on UIDCs with a high degree of nonstandard financing and be cautious in purchasing a company’s UIBs according to their risk appetite.
The second insight is the need for the governments to strengthen risk control with respect to nonstandard financing practices. With the dissolution of rigid payments for UIBs, a higher risk of non-standard defaults will increase the risk of defaulting on UIBs. Even worse, it will also further reduce government credit. This is because there is an implicit governmental guarantee in the UIB market [23]. Therefore, the government needs to classify the risk level of nonstandard assets with reference to the proprietary business of UIDCs in order to effectively monitor potential risk points of the UIDCs. In addition, a contingency plan management mechanism for nonstandard financing defaults should be established to ensure risk disposal measures can be taken in a timely manner when risks occur.
7. Conclusions
Compared with bond defaults, nonstandard default events have less of an impact on the reputations and refinancing of UIDCs. Consequently, UIDCs are less inclined to repay nonstandard financing products than they are to repay bond-financing products. However, under the general trend of reducing leverage and strictly controlling new hidden debts of local governments, the risk of nonstandard defaults of UIDCs continues to be released, which, in turn, will increase the credit risk of UIDCs. Therefore, it is necessary to explore the mechanism through which the nonstandard default events of UIDCs impact the price of UIBs, and then analyze the early warning effect of nonstandard default events on UIB defaults.
This paper has uncovered the impact of nonstandard default events of UIDCs on the UIB market, illustrating the response of UIB prices to nonstandard default events with advanced and lagging time differences through the event study method. It has revealed the UIB market is not a completely efficient market. At the same time, this research has revealed that the public disclosure of the default information of non-standard products may lead to the obstruction of the refinancing of debt-issuing enterprises, which may lead to liquidity problems and transmission to the bond market. Therefore, the risk of non-standard products can be used as early warning information for bond defaults. This study has addressed the gap regarding the risk of nonstandard asset management for UIDCs. It also further clarifies the transmission mechanism of nonstandard defaults on UIB defaults on a technical level, which is beneficial for preventing investors from facing default risk from UIDCs and allowing for sustainable UIDC financing development in other fields.
This paper still has some limitations. In exploring the correlation between the nonstandard financing market and the UIB market, this paper excludes some major event factors to ensure the uniqueness of its employed variables (e.g., executive changes, major acquisitions and mergers, etc.), and no consideration is given to other factors that affect the prices of UIBs; thus, there is a need for further in-depth research on the scope of the risk factors in the UIB market.
Author Contributions
Conceptualization, Y.L. and X.Y.; methodology, X.Y. and M.M.; software, Y.L.; validation, Y.L. and M.M.; formal analysis X.Y.; investigation, H.-Y.C.; resources, X.Y.; data curation, Y.L.; writing—original draft preparation, Y.L., X.Y. and M.M.; writing—review and editing, H.-Y.C.; visualization, H.-Y.C.; supervision, X.Y.; project administration, X.Y.; funding acquisition, X.Y. All authors have read and agreed to the published version of the manuscript.
Funding
This research is supported by the Young Foundation of Ministry of education, humanities and social science research project (Grant 20YJCZH203), the National Natural Science Foundation of China [Grant 72001112, 72201121, 72001113], and the National first-class professional (investment science) construction special projects [Grant 2021JG117].
Conflicts of Interest
The authors declare no conflict of interest.
Appendix A. Summary of 50 Nonstandard Default Events of 32 UIDCs
| No. | Name of UIDC | Name of UIB | Date of Default | |
| 1 | Xiangtan Jiuhua Economic Construction Investment Co. | 17 Xiangtan Jiuhua MTN002, 17 Jiuhua 01, 16 Jiuhua Shuangchuang Bond, 19 Xiangtan Jiuhua MTN001, 19 Xiang Jiuhua, 17 Xiangtan Jiuhua PPN002, PR Shuangchuang Bond, 17 Xiangtan Jiuhua MTN001 | 1 January 2021 1 September 2020 20 June 2019 | |
| 2 | Zunyi City, Xuzhou District, Urban Construction Investment Management (Group) Co. | 17 Zunyi Bo Investment Bond 02, 17 Bo Investment Bond 01, PR Bo Investment Bond 02, 17 Zunyi Bo Investment Bond 01 | 1 January 2021 1 October 2020 1 September 2020 | |
| 3 | Anshun City Urban Construction Investment Co. | 18 Anshun 01, PR Anduan Bond, 18 Anshun 02, 17 Anshun Special Bond, 21 Anshun 01, 19 Anshun 02 | 1 December 2020 | |
| 4 | Puding County Puxin Urban Construction Investment Co. | No information on UIB | 1 December 2020 | |
| 5 | Zunyi Peace Investment and Construction Co. | 20Zunhe02, 20Zunhe01 | 1 October 2020 1 January 2020 | |
| 6 | Jilin Province Transportation Investment Group Co. | No information on UIB | 28 September 2020 | |
| 7 | Anshun City Transportation Construction Investment Co. | PR Anjiaotou, 17 Anshun Jiaotou Bond | 3 September 2020 2 August 2019 | |
| 8 | Guizhou Liupanshui Climbing Development Investment Trading Co. | PR Pantou Bond, 17 Pantou Special Bon, 21 Pantou Bond | 1 August 2020 1 March 2020 1 November 2019 | |
| 9 | Ruzhou Xinyuan Investment Co. | 16 Ruzhou Xinyuan Bond, PR Ruzhou Investment | 1 July 2020 | |
| 10 | Anshun City State-owned Assets Management Co. | 16 Anshun State Capital Bond, PR Anshun Bond | 1 July 2020 | |
| 11 | Guizhou Zhongshan Development and Investment Co. | PR Zhong Shan Kai, 19 Zhong Stop 01, 17 Zhong Stop Bond 01, 19 Zhong Stop Bond 01 | 1 May 2020 | |
| 12 | Hunan Zhaoshan Economic Construction Investment Co. | 17 Zhaotou 02, 18 Zhaoshan Economy PPN001, 17 Zhaotou 01, 19 Zhaoshan Economy PPN001, 17 Zhaoshan Economy PPN001 | 1 April 2020 | |
| 13 | Qiannan State Capital Operation Co. | 17 Qiannan Bond 01, 17 Qiannan Bond 02, PR Qiannan 01, PR Qiannan 02 | 1 April 2020 | |
| 14 | Zunyi City Investment (Group) Co. | 19 Zun Investment Bond 01, 19 Zun Investment Bond 02, 21 Zun Investment Bond 03, 19 Zun Investment Bond 03, 20 Zun Investment Bond 04, 21 Zun Investment Bond 04, 20 Zun Investment Bond 02, 20 Zun Investment Bond 01, 2Zun Investment Bond 101 | 1 April 2020 | |
| 15 | Guizhou Donghu New City Construction Investment Co. | 18 Donghu Pipeline Corridor Bond, 15 Qian Donghu Construction and Investment Bond, 18 Donghu Bond, 15 Qian Donghu Construction and Investment Bond, 21 Donghu Bond | 1 March 2020 | |
| 16 | Guizhou Xinpu Economic Development Investment Co. | 19 Xinpu 01, 20 Xinpu 02, 19 Xinpu 03, 19 Xinpu 05, 19 Xinpu 02, 20 Xinpu 01 | 1 March 2020 1 February 2020 | |
| 17 | Zunyi Road and Bridge Construction (Group) Co. | 22 Zunqiao 02, 19 Zunqiao 01, 21 Zunqiao 08, 21 Zunqiao 05, 21 Zunyidaoqiao PPN001, 21 Zunqiao 02, 21 Zunqiao 04, 21 Zunqiao 13, 15 Zunyidaoqiao Investment, 20 Zunqiao 04, 21 Zunqiao 09, 21 Zunqiao 03, 21 Zunqiao 07, 21 Zunqiao 03, 19 Zunqiao 02, 20 Zunqiao 02, 19 Zunqiao 03, 21 Zunqiao 11, 20 Zunqiao 01, 21 Zunqiao 12, PR Zundaoqiao, 22 Zunqiao 01, 21 Zunqiao 01, 21 Zunqiao 10, 20 Zunqiao 03, 19 Zunqiao 01, 21 Zunqiao D4, 21 Zunqiao 06 | 16 January 2020 10 January 2020 1 January 2020 | |
| 18 | Zunyi Huichuan District Urban Construction Investment Management Co. | 19 Huichuan 02, 18 Huichuan 01 | 2 January 2020 1 January 2020 1 September 2019 | |
| 19 | Zunyi Honghuagang City Construction Investment Management Co. | 17 Honghuagang Parking Lot Bond 01, PR Zunhong City, 17 Honghuagang, 16 Zunhong Urban Investment Bond | 1 February 2020 29 July 2019 | |
| 20 | Zhongshan District, Liupanshui City, Industry and Information Technology Bureau | No information on UIB | 1 March 2020 1 November 2019 | |
| 21 | Zunyi Honghuagang state-owned assets investment and management limited liability company | 19 Zunhong 02, 17 Zunhong Bond, 19 Zunhong 01 | 1 February 2020 | |
| 22 | Hancheng City Investment (Group) Co. | 20 Hancheng 01, 16 Hancheng Urban Investment Bond, 20 Hancheng 04, 20 Hancheng 03, 19 Hancheng 01, PR Hancheng Investment, 19 Hancheng 02, 20 Hancheng 02 | 10 December 2019 30 November 2018 | |
| 23 | Zunyi Economic and Technological Development Zone Investment and Construction Co. | 20 Zunjing 01, 21 Zunjing 01, 17 Zunjing Development Project Bond, 19 Zunjing 02, 19 Zunjing 03, PR Zunjing Development, 20 Zunjing 02, 19 Zunjing 01, PR Zunjing Bond, 16 Zunjing Development Bond | 1 December 2019 1 September 2019 | |
| 24 | Guizhou Daxing High-tech Development and Investment Co. | No information on UIB | 1 November 2019 | |
| 25 | Liupanshui Zhongshan District Urban Construction Investment Co. | 21 Jongsan 01 | 1 March 2020 1 November 2019 | |
| 26 | Alashan League infrastructure construction investment and operation | No information on UIB | 12 February 2019 | |
| 27 | Guizhou Kaili Kaiyuan Urban Investment Development Co. | 17Kaiyuan Special Bond 02, 17Kaiyuan Special Bond 01, PRKaiyuan 02, PRKaiyuan 01 | 10 February 2019 | |
| 28 | Huhehaote Economic and Technological Development Zone Investment and Development | No information on UIB | 1 September 2018 | |
| 29 | Qian southeast development investment (group) limited liability company | No information on UIB | 10 July 2018 | |
| 30 | Inner Mongolia horqin city construction investment group | No information on UIB | 8 June 2018 | |
| 31 | Tongliao City Investment Group Co. | 17 Tongliao Urban Investment PPN001 | 8 June 2018 | |
| 32 | Tianjin Municipal Construction Group Co. | No information on UIB | 27 April 2018 | |
| Data source: Enterprise Alerting Link. | ||||
Appendix B. Summary of 26 Nonstandard Default Events of 20 UIDCs
| NO. | Name of UIDC | Name of UIB | Date of Default |
| 1 | Xiangtan Jiuhua Economic Construction Investment Co. | 17 Xiangtan Jiuhua MTN002, 16 Jiuhua Shuangchuang Bond, 19 Xiangtan Jiuhua MTN001, 17 Xiangtan Jiuhua MTN001 | 1 January 2021 20 June 2019 |
| 2 | Zunyi City, Xuzhou District, Urban Construction Investment Management (Group) Co. | 17Zunyi Bo Invsetment Bond 02, PR Bo Investment 02, 17 Zunyi Bo Investment 01 | 1 January 2021 |
| 3 | Anshun City Urban Construction Investment Co. | PR Antoine Investment Bond, 17 Anshun Special Bond | 1 December 2020 |
| 4 | Zunyi Peace Investment and Construction Co. | 20Zunhe01 | 1 October 2020 1 January 2020 |
| 5 | Anshun City Transportation Construction Investment Co. | PR Anjiaotou, 17 Anshun Jiaotou Bond | 3 September 2020 2 August 2019 |
| 6 | Guizhou Liupanshui Climbing Development Investment Trading Co. | PR Pantou Bond, 17 Pantou Special Bond | 1 August 2020 1 November 2019 |
| 7 | Ruzhou Xinyuan Investment Co. | 16 Ruzhou Xinyuan Bond, PR Ruzhou Investment | 1 July 2020 |
| 8 | Anshun City State-owned Assets Management Co. | 16 Anshun State Capital Bond, PR Anshun Bond | 1 July 2020 |
| 9 | Guizhou Zhongshan Development and Investment Co. | PR Zhong Shan Kai, 19 Zhong Stop 01, 17 Zhong Stop Debt 01, 19 Zhong Stop Debt 01 | 1 May 2020 |
| 10 | Hunan Zhaoshan Economic Construction Investment Co. | 17Zhao Investment 02, 17Zhao Investment 01 | 1 April 2020 |
| 11 | Qiannan State Capital Operation Co. | 17 Qiannan Bond 01, 17 Qiannan Bond 02, PR Qiannan 01, PR Qiannan 02 | 1 April 2020 |
| 12 | Zunyi City Investment (Group) Co. | 19 Zun Investment 01, 19 Zun Investment 02, 19 Zun Investment 03 | 1 April 2020 |
| 13 | Guizhou Donghu New City Construction Investment Co. | 18 Donghu Pipeline Corridor Bond, 15 Qian Donghu Construction Investment Bond | 1 March 2020 |
| 14 | Guizhou Xinpu Economic Development Investment Co. | 19 xinpu 01, 19 xinpu 03, 19 xinpu 05, 19 xinpu 02 | 1 March 2020 |
| 15 | Zunyi Road and Bridge Construction (Group) Co. | 15 Zunyidaoqiao Bond, PR Zundaoqiao, 19 Daoqiao 01 | 1 February 2020 |
| 16 | Zunyi Honghuagang City Construction Investment Management Co. | 17 Honghuagang Parking Lot Bond 01, 16 Zunhong Urban Investment Bond | 1 February 2020 29 July 2019 |
| 17 | Zunyi Honghuagang state-owned assets investment and management limited liability company | 17 Zunhong Bond | 1 February 2020 |
| 18 | Hancheng City Investment (Group) Co. | 16 Hancheng Urban Investment Bond, PR Hancheng Investment | 30 November 2018 10 December 2019 |
| 19 | Zunyi Economic and Technological Development Zone Investment and Construction Co. | 17ZunJingKai Project Bond, PRZunJingKai, 16ZunJingKai Bond | 1 September 2019 |
| 20 | Guizhou Kaili Kaiyuan Urban Investment Development Co. | 17Kaiyuan Special Bond 02 17 Kaiyuan Special Bond 01 PR Kaiyuan 02 PR Kaiyuan01 | 10 February 2019 |
Appendix C. Fitted Slope and Intercept for All Bonds
| No. | Slope | Intercept | p−Value | Fit a Regression Function |
| 1 | −0.55 | −4.31 | 2.01 × 10⁻¹⁰ ** | y = −4.31 − 0.55x |
| 2 | 1.96 | 3.92 | 1.97 × 10⁻¹⁰ ** | y = 3.92 + 1.96x |
| 3 | −0.03 | −2.65 | 1.44 × 10⁻¹² ** | y = −2.65 + 0.03x |
| 4 | −0.02 | −2.75 | 5.39 × 10⁻¹² ** | y = −2.75−0.02x |
| 5 | 12.21 | 33.86 | 1.64 × 10⁻¹⁵ ** | y = 33.86 + 12.21x |
| 6 | 0.01 | −2.60 | 1.33 × 10⁻²³ ** | y = −2.60 + 0.01x |
| 7 | −0.03 | −3.08 | 1.67 × 10−37 ** | y = −3.08 − 0.03x |
| 8 | 0.00 | − 2.99 | 4.39 × 10⁻⁷ ** | y = −2.99 + 0.00 |
| 9 | −0.01 | −3.02 | 1.76 × 10⁻¹⁰ ** | y = −3.02−0.01x |
| 10 | 1.25 | 1.13 | 1.73 × 10⁻¹ | y = 1.13 + 1.25x |
| 11 | −0.46 | −3.90 | 5.09 × 10⁻³ ** | y = −3.90 − 0.46x |
| 12 | 0.03 | −2.44 | 8.93 × 10⁻²⁵ ** | y = −2.44 + 0.03x |
| 13 | 0.18 | −1.99 | 7.66 × 10−07 ** | y = −1.99 + 0.18x |
| 14 | 3.01 | 6.71 | 8.52 × 10⁻⁴ ** | y = 6.71 + 3.01x |
| 15 | 2.30 | 4.49 | 7.55 × 10⁻¹⁵ ** | y = 4.49 + 2.30x |
| 16 | −0.01 | −2.64 | 1.81 × 10⁻³¹ ** | y = −2.64 − 0.01x |
| 17 | 0.00 | −2.60 | 2.64× 10⁻² ** | y = −2.60 + 0.00 |
| 18 | 0.00 | −2.61 | 1.69 × 10⁻⁵ ** | y = −2.61 + 0.00 |
| 19 | 0.22 | −1.61 | 1.50 × 10−41 ** | y = −1.61 + 0.22x |
| 20 | −0.16 | −3.01 | 1.78 × 10⁻¹ | y = −3.01 − 0.16x |
| 21 | 0.02 | −2.57 | 4.00 × 10⁻¹⁴ ** | y = −2.57 + 0.02x |
| 22 | −0.11 | −2.94 | 3.88 × 10⁻¹ ** | y = −2.94 − 0.11x |
| 23 | 0.01 | −2.60 | 3.89 × 10⁻² * | y = −2.60 + 0.01x |
| 24 | −0.07 | −2.77 | 2.66 × 10⁻¹ | y = −2.77 − 0.07x |
| 25 | 0.19 | −2.00 | 2.31 × 10⁻¹³ ** | y = −2.00 + 0.19x |
| 26 | 0.00 | −3.13 | 9.73 × 10⁻⁵ ** | y = −3.13 + 0.00 |
| 27 | −0.56 | −4.30 | 2.94 × 10⁻⁹ ** | y = −4.30−0.56x |
| 28 | −0.01 | −3.13 | 7.32 × 10⁻⁷ ** | y = −3.13 − 0.01x |
| 29 | 0.01 | −2.72 | 5.10 × 10⁻²⁵ ** | y = −2.72 + 0.01x |
| 30 | −0.01 | −2.56 | 3.40 × 10−50 ** | y = −2.56 − 0.01x |
| 31 | 0.01 | −2.71 | 1.13 × 10−47 ** | y = −2.71 + 0.01x |
| 32 | 0.33 | −1.66 | 3.90 × 10⁻⁷ ** | y = −1.66 + 0.33x |
| 33 | 0.01 | −2.59 | 5.50 × 10⁻¹⁶ ** | y = −2.59 + 0.01x |
| 34 | 0.01 | −2.58 | 3.14 × 10⁻⁹ ** | y = −2.58 + 0.01x |
| 35 | −0.28 | −3.22 | 1.99 × 10⁻⁶ ** | y = −3.22 − 0.28x |
| 36 | −0.03 | −2.72 | 1.77 × 10−47 ** | y = −2.72 − 0.03x |
| 37 | −0.01 | −2.70 | 7.73 × 10⁻³³ ** | y = −2.70 − 0.01x |
| 38 | 0.00 | −2.66 | 6.69 × 10⁻³ ** | y = −2.66 + 0.00 |
| 39 | −0.01 | −2.65 | 1.90 × 10−43 ** | y = −2.65 − 0.01x |
| 40 | 0.01 | −2.57 | 1.18 × 10⁻¹⁶ ** | y = −2.57 + 0.01x |
| 41 | 0.01 | −2.57 | 8.38 × 10⁻¹⁷ ** | y = −2.57 + 0.01x |
| 42 | 0.10 | −2.34 | 3.31 × 10⁻¹² ** | y = −2.34 + 0.10x |
| 43 | 1.46 | 1.99 | 7.28 × 10⁻⁹ ** | y = 1.99 + 1.46x |
| 44 | 0.00 | −2.59 | 4.45 × 10⁻¹ | y = −2.59 + 0.00 |
| 45 | 0.02 | −2.52 | 3.06 × 10⁻³¹ ** | y = −2.52 + 0.02x |
| 46 | 0.02 | −2.52 | 2.96 × 10⁻¹⁷ ** | y = −2.52 + 0.02x |
| 47 | 0.01 | −2.58 | 1.14 × 10⁻¹ | y = −2.58 + 0.01x |
| 48 | −0.01 | −2.64 | 1.51 × 10⁻¹ | y = −2.64 − 0.01x |
| 49 | 0.14 | −2.14 | 7.25 × 10⁻¹ | y = −2.14 + 0.14x |
| 50 | −0.44 | −3.96 | 2.78 × 10⁻⁶ ** | y = −3.96 − 0.44x |
| 51 | 0.01 | −2.96 | 3.74 × 10⁻¹ | y = −2.96 + 0.01x |
| 52 | −0.01 | −3.02 | 2.01 × 10⁻² * | y = −3.02 − 0.01x |
| 53 | 2.54 | 5.16 | 2.26 × 10⁻² * | y = 5.16 + 2.54x |
| 54 | 0.35 | −1.47 | 1.54 × 10⁻³ ** | y = −1.47 + 0.35x |
| 55 | −1.82 | −8.49 | 2.97 × 10⁻² * | y = −8.49 − 1.82x |
| 56 | 0.71 | −1.05 | 4.84 × 10⁻³ ** | y = −1.05 + 0.71x |
| 57 | 3.88 | 9.55 | 6.57 × 10⁻⁴ ** | y = 9.55 + 3.88x |
| 58 | −0.13 | −3.14 | 1.36 × 10⁻¹ | y = −3.14−0.13x |
| 59 | −0.79 | −4.93 | 3.78 × 10⁻¹⁰ ** | y = −4.93 − 0.79x |
| 60 | −0.01 | −3.09 | 5.46 × 10⁻⁴ ** | y = −3.09 − 0.01x |
| 61 | −0.01 | −3.09 | 3.11 × 10⁻¹³ ** | y = −3.09 − 0.01x |
| 62 | 0.07 | −2.39 | 7.23 × 10⁻⁴ ** | y = −2.39 + 0.07x |
| 63 | −0.02 | −2.67 | 5.04 × 10⁻³⁴ ** | y = −2.67 − 0.02x |
| 64 | 0.02 | −2.98 | 2.82 × 10⁻¹⁸ ** | y = −2.98 + 0.02x |
| 65 | −0.30 | −3.54 | 6.98 × 10⁻²⁴ ** | y = −3.54 − 0.30x |
| Note: * is significant at the 0.05 level, ** is significant at the 0.01 level. | ||||
References
- Wu, F. The state acts through the market: ‘State entrepreneurialism beyond’ varieties of urban entrepreneurialism. Dialogues Hum. Geogr. 2020, 10, 326–329. [Google Scholar] [CrossRef]
- Li, J.; Chiu, L.R. Urban-investment-and-development-corporations, new-town-development and China’s local state restructuring–the case of Songjiang new town, Shanghai. Urban Geogr. 2018, 39, 687–705. [Google Scholar] [CrossRef]
- Jiang, Y.; Waley, P. Shenhong: The anatomy of an urban investment and development company in the context of China’s state corporatist urbanism. J. Contemp. China 2018, 27, 596–610. [Google Scholar] [CrossRef]
- Wu, H.; Yang, J.; Yang, Q. The pressure of economic growth and the issuance of Urban Investment Bonds: Based on panel data from 2005 to 2011 in China. J. Asian Econ. 2021, 76, 101341. [Google Scholar] [CrossRef]
- Wu, Y.; Zhao, H. Risk Measurement of Local Government Debt Based on Complex Networks: Taking China’s Urban Investment Bonds as an Example. Wirel. Commun. Mob. Comput. 2022, 2022, 2–11. [Google Scholar] [CrossRef]
- Ambrose, B.W.; Deng, Y.; Wu, J. Understanding the Risk of China’s Local Government Debts and Its Linkage with Property Markets. In SSRN Working Paper; SSRN: New York, NY, USA, 2015; p. 2557031. [Google Scholar]
- Ansar, A.; Flyvbjerg, B.; Budzier, A.; Lunn, D. Does infrastructure investment lead to economic growth or economic fragility? Evidence from China. Oxf. Rev. Econ. Policy 2016, 32, 360–390. [Google Scholar] [CrossRef] [Green Version]
- Liu, C. The Analysis of China Quasi-Municipal Bonds’ Issuing Spread. Mod. Econ. 2018, 9, 1009–1022. [Google Scholar]
- Pan, J.; Yu, Y.; Wang, L.; Jing, X. Monetary policy, differences among issuing agencies, and the pricing of local government bonds. China J. Account. Stud. 2019, 7, 524–541. [Google Scholar] [CrossRef]
- Liao, P. Interaction between non-standard debt and wealth management products in China. J. Appl. Financ. Bank. 2020, 10, 149–166. [Google Scholar]
- Liu, L.B.; Li, B.T.; Wang, B. Non-standard assets, Credit conversion and Shadow banking risk. Econ. Res. J. 2022, 57, 70–86. (In Chinese) [Google Scholar]
- Li, X.; Feng, G.; Hao, S. Market-Oriented Transformation and Development of Local Government Financing Platforms in China: Exploratory Research Based on Multiple Cases. Systems 2022, 10, 65. [Google Scholar] [CrossRef]
- Carpenter, S.; Demiralp, S.; Eisenschmidt, J. The effectiveness of non-standard monetary policy in addressing liquidity risk during the financial crisis: The experiences of the Federal Reserve and the European Central Bank. J. Econ. Dyn. Control. 2014, 43, 107–129. [Google Scholar] [CrossRef]
- Huang, Z.; Du, X. Holding the market under the stimulus plan: Local government financing vehicles’ land purchasing behavior in China. China Econ. Rev. 2018, 50, 85–100. [Google Scholar] [CrossRef]
- Wu, F. Land financialisation and the financing of urban development in China. Land Use Policy 2022, 112, 104412. [Google Scholar] [CrossRef]
- Chen, S.; Wang, L. Will political connections be accounted for in the interest rates of Chinese urban development investment bonds? Emerg. Mark. Financ. Trade 2015, 51, 108–129. [Google Scholar] [CrossRef]
- Bai, C.-E.; Hsieh, C.-T.; Song, Z. (Michael) The Long Shadow of a Fiscal Expansion. SSRN Electron. J. 2016.
- Choi, J.; Lu, L.; Park, H. The financial value of the within-government political network: Evidence from Chinese municipal corporate bonds. Financ. Res. Lett. 2021, 47, 102552. [Google Scholar] [CrossRef]
- Chen, Z.; He, Z.; Liu, C. The financing of local government in China: Stimulus loan wanes and shadow banking waxes. J. Financ. Econ. 2020, 137, 42–71. [Google Scholar] [CrossRef]
- Yu, M.; Jia, J.; Wang, S. Local officials’ promotion incentives and issuance of urban investment bonds. Res. Int. Bus. Financ. 2022, 63, 101791. [Google Scholar] [CrossRef]
- Zedan, K.; Daas, G.; Awwad, Y. Municipal bonds as a tool for financing capital investment in local government units in Palestine. Invest. Manag. Financ. Innov. 2020, 17, 213–248. [Google Scholar] [CrossRef] [Green Version]
- Huang, D.; Chan, R.C.K. On ‘Land Finance’ in urban China: Theory and practice. Habitat Int. 2018, 75, 96–104. [Google Scholar] [CrossRef]
- Walker, T.; Zhang, X.; Zhang, A.; Wang, Y. Fact-or-fiction: Implicit-government-guarantees in China’s corporate bond market. J. Int. Money Financ. 2021, 116, 102414. [Google Scholar] [CrossRef]
- Bo, L.; Mear, F.C.J.; Huang, J. New development: China’s debt transparency and the case of urban construction investment bonds. Public Money Manag. 2017, 37, 225–230. [Google Scholar] [CrossRef]
- Tiron, T.; Ștefănescu, C.; Dan, A. The Determinants of the Municipal Bonds Market in Romania. Transylv. Rev. Adm. Sci. 2021, 17, 175–192. [Google Scholar]
- Zhang, J.; Li, L.; Yu, T.; Gu, J.; Wen, H. Land assets, urban investment bonds, and local governments’ debt risk, China. Int. J. Strateg. Prop. Manag. 2021, 25, 65–75. [Google Scholar] [CrossRef]
- Qian, N. Anti-corruption effects on the credit risk of local financing vehicles and the pricing of Chengtou bonds: Evidence from a quasi-natural experiment in China. Financ. Res. Lett. 2018, 26, 162–168. [Google Scholar] [CrossRef]
- Zhao, Y.; Li, Y.; Feng, C.; Gong, C.; Tan, H. Early Warning of Systemic Financial Risk of Local Government Implicit Debt Based on BP Neural Network Model. Systems 2022, 10, 207. [Google Scholar] [CrossRef]
- Hu, Y.; Yang, Y.; Han, P. Credit enhancement and bond rating: An empirical study of the bonds issued by local government financing platforms. China Financ. Rev. Int. 2017, 7, 114–130. [Google Scholar] [CrossRef]
- Xu, J.; Mao, J.; Guan, X. Local government hidden debt re-understanding-based on the precise definition of financing platform companies and the perspective of financial potentials. Manag. World 2020, 36, 37–59. [Google Scholar]
- Poniatowicz, M.; Wyszkowska, D.; Piekarska, E. Controversies-Over-Non Convention -al Instruments of Financing Budget Needs of Local Government Units. Optim. Stud. Ekon. 2017, 5, 99–116. [Google Scholar]
- Allen, F.; Qian, M.; Xie, J. Understanding informal financing. J. Financ. Intermed. 2019, 39, 19–33. [Google Scholar] [CrossRef]
- Li, J.; Tochen, R.; Dong, Y.; Ren, Z. Debt-Driven-Property-Boom, Land-Based-Financing and Trends of Housing Financialization: Evidence from China. Land 2022, 11, 1967. [Google Scholar] [CrossRef]
- Ahmed, K.; Bebenroth, R.; Hennart, J.F. Formal institutional uncertainty and equity sought on foreign market entry: Does industry matter? Rev. Int. Bus. Strategy 2020, 30, 421–440. [Google Scholar] [CrossRef]
- Harrison, R.; Scheela, W.; Lai, P.C.; Vivekarajah, S. Beyond institutional voids and the middle-income trap: The emerging business angel market in Malaysia. Asia Pac. J. Manag. 2018, 35, 965–991. [Google Scholar] [CrossRef] [Green Version]
- Hałaburda, D.A. Niestandardowe instrumenty finansowania jednostek samorządu terytoerialnego. Ekon. Probl. Usług 2017, 129, 131–142. [Google Scholar] [CrossRef]
- Mohamed, S. The Impact of Unconventional Financing on Bank of Algeria Independence. Econ. Manag. Res. J. 2021, 15, 107–124. [Google Scholar]
- Howell, A. Ethnic entrepreneurship, initial financing, and business performance in China. Small Bus. Econ. 2019, 52, 697–712. [Google Scholar] [CrossRef]
- Manzilati, A.; Prestianawati, S.A.A. Informal financing or debt traps: Are the UN sustainable development goals being met in emerging economies? Rev. Int. Bus. Strategy 2021, 32, 132–145. [Google Scholar] [CrossRef]
- Mpofu, O.; Sibindi, A.B. Informal Finance: A Boon or Bane for African SMEs? J. Risk Financ. Manag. 2022, 15, 270. [Google Scholar] [CrossRef]
- Dolley, J.C. Characteristics and procedure of common stock split-ups. Harv. Bus. Rev. 1933, 11, 316–326. [Google Scholar]
- Brown, B. An Empirical Evaluation of Accounting Income Numbers. J. Account. Res. 1968, 6, 159–178. [Google Scholar]
- Fama, E. The Behavior of Stock Market Prices. J. Bus. 1965, 38, 34–105. [Google Scholar] [CrossRef] [Green Version]
- Kamien, M.I.; Schwartz, N.L. Market structure, elasticity of demand and incentive to invent. J. Law Econ. 1970, 13, 241–252. [Google Scholar] [CrossRef]
- Albuquerque, J.M.; Filipe, J.A.; Jorge, N.P.M.; Silva, C. The study of events approach applied to the impact of mergers and acquisitions on the performance of consulting engineering companies. Mathematics 2021, 9, 130. [Google Scholar] [CrossRef]
- Mandelker, G. Risk and return: The case of merging firms. J. Financ. Econ. 1974, 1, 303–335. [Google Scholar] [CrossRef]
- Brown, S.J.; Warner, J.B. Measuring security price performance. J. Financ. Econ. 1980, 8, 205–258. [Google Scholar] [CrossRef]
- Brown, S.J.; Warner, J.B. Using daily stock returns. J. Financ. Econ. 1985, 14, 3–31. [Google Scholar] [CrossRef]
- Fatehi, K.; Gupta, M. Political instability and capital flight: An application of event study methodology. Int. Exec. 1992, 34, 441–461. [Google Scholar] [CrossRef]
- Park, N.K. A guide to using event study methods in multi-country settings. Strateg. Manag. J. 2004, 25, 655–668. [Google Scholar] [CrossRef]
- Barr, D.G.; Campbell, J.Y. Inflation, real interest rates, and the bond market: A study of UK nominal and index-linked government bond prices. J. Monet. Econ. 1997, 39, 361–383. [Google Scholar] [CrossRef]
- Agarwal, S.; Zhang, J. FinTech, lending and payment innovation: A review. Asia-Pac. J. Financ. Stud. 2020, 49, 353–367. [Google Scholar] [CrossRef]
- Hannan, T.H.; Wolken, J.D. Returns to bidders and targets in the acquisition process: Evidence from the banking industry. J. Financ. Serv. Res. 1989, 3, 5–16. [Google Scholar] [CrossRef]
- Xianping, Y.; Dagang, K. Event Study Method and Its Application to Financial Economic Study. Stat. Res. 2006, 10, 31–35. [Google Scholar]
- Kothari, S.P.; Jerold, B.W. Econometrics of event studies. In Handbook of Empirical Corporate Finance; Elsevier: Amsterdam, The Netherlands, 2007; pp. 3–36. [Google Scholar]
- Hu, H.; Li, Y.; Tian, M.; Cai, X. Evolutionary-game-of-small-and-edium-sized-enterpri-ses’ accounts-receivable pledge financing in the supply chain. Systems 2022, 10, 21. [Google Scholar] [CrossRef]
- MacKinlay, A.C. Event studies in economics and finance. J. Econ. Lit. 1997, 35, 13–39. [Google Scholar]
- Brenner, M. The sensitivity of the efficient market hypothesis to alternative specifications of the market model. J. Financ. 1979, 34, 915–929. [Google Scholar] [CrossRef]
- Klein, A.; Rosenfeld, J. The influence of market conditions on event-study residuals. J. Financ. Quant. Anal. 1987, 22, 345–351. [Google Scholar] [CrossRef]
- Kothari, S.P.; Warner, J.B. Handbook of Empirical Corporate Finance. Econometrics of Event Studies; North-Holland: Amsterdam, The Netherlands, 2007; pp. 3–36. [Google Scholar]
- Maruyama, H.; Tabata, T.; Hosoda, T. A Study on the Effect of Resizing Tick Size on Stock Prices Using the Event Study Method. Inf. Eng. Express 2021, 7, 37–48. [Google Scholar] [CrossRef]
- Hiranto, P. Event Study: How Disaster and Celebration Affect the Stock Market? In SSRN Working Paper; SSRN: New York, NY, USA, 2019; p. 3323999. [Google Scholar]
- Pallant, J. SPSS Survival Manual: A Step by Step Guide to Data Analysis Using IBM SPSS; Routledge: London, UK, 2020. [Google Scholar]
- Liang, Y.; Shi, K.; Wang, L.; Xu, J. Local government debt and firm leverage: Evidence from China. Asian Econ. Policy Rev. 2017, 12, 210–232. [Google Scholar] [CrossRef]
Figure 1.
Schematic diagram of the sample construction process of UIBs.
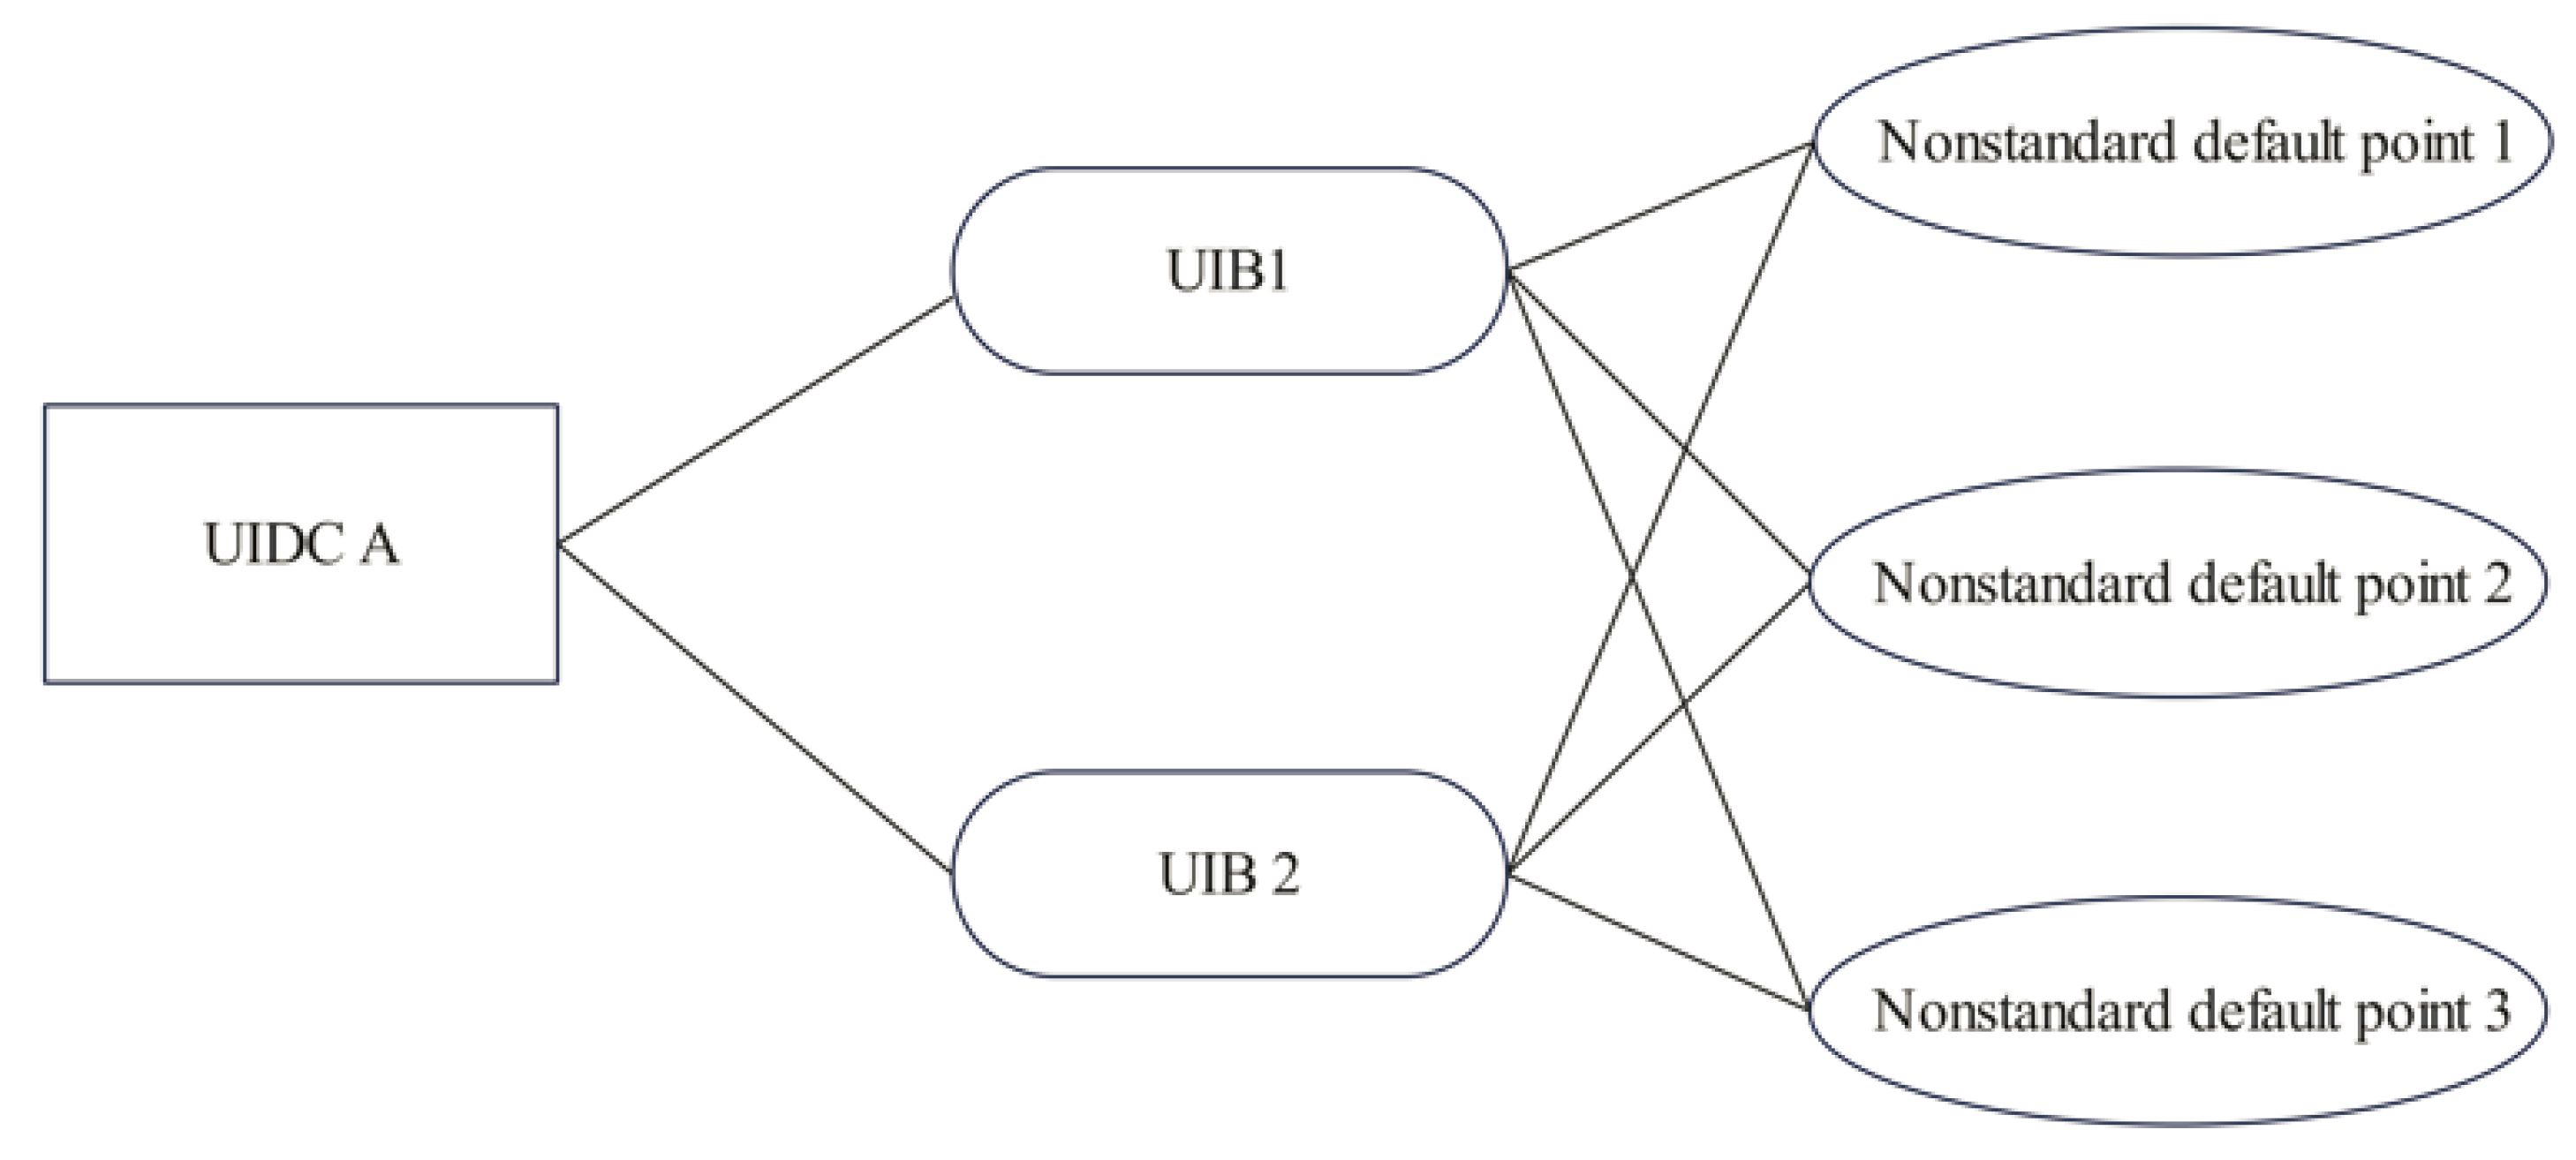
Figure 2.
Flow chart of sample screening.

Figure 3.
Schematic diagram of event occurrence points and event windows.

Figure 4.
Results regarding the AR and CAR in window .
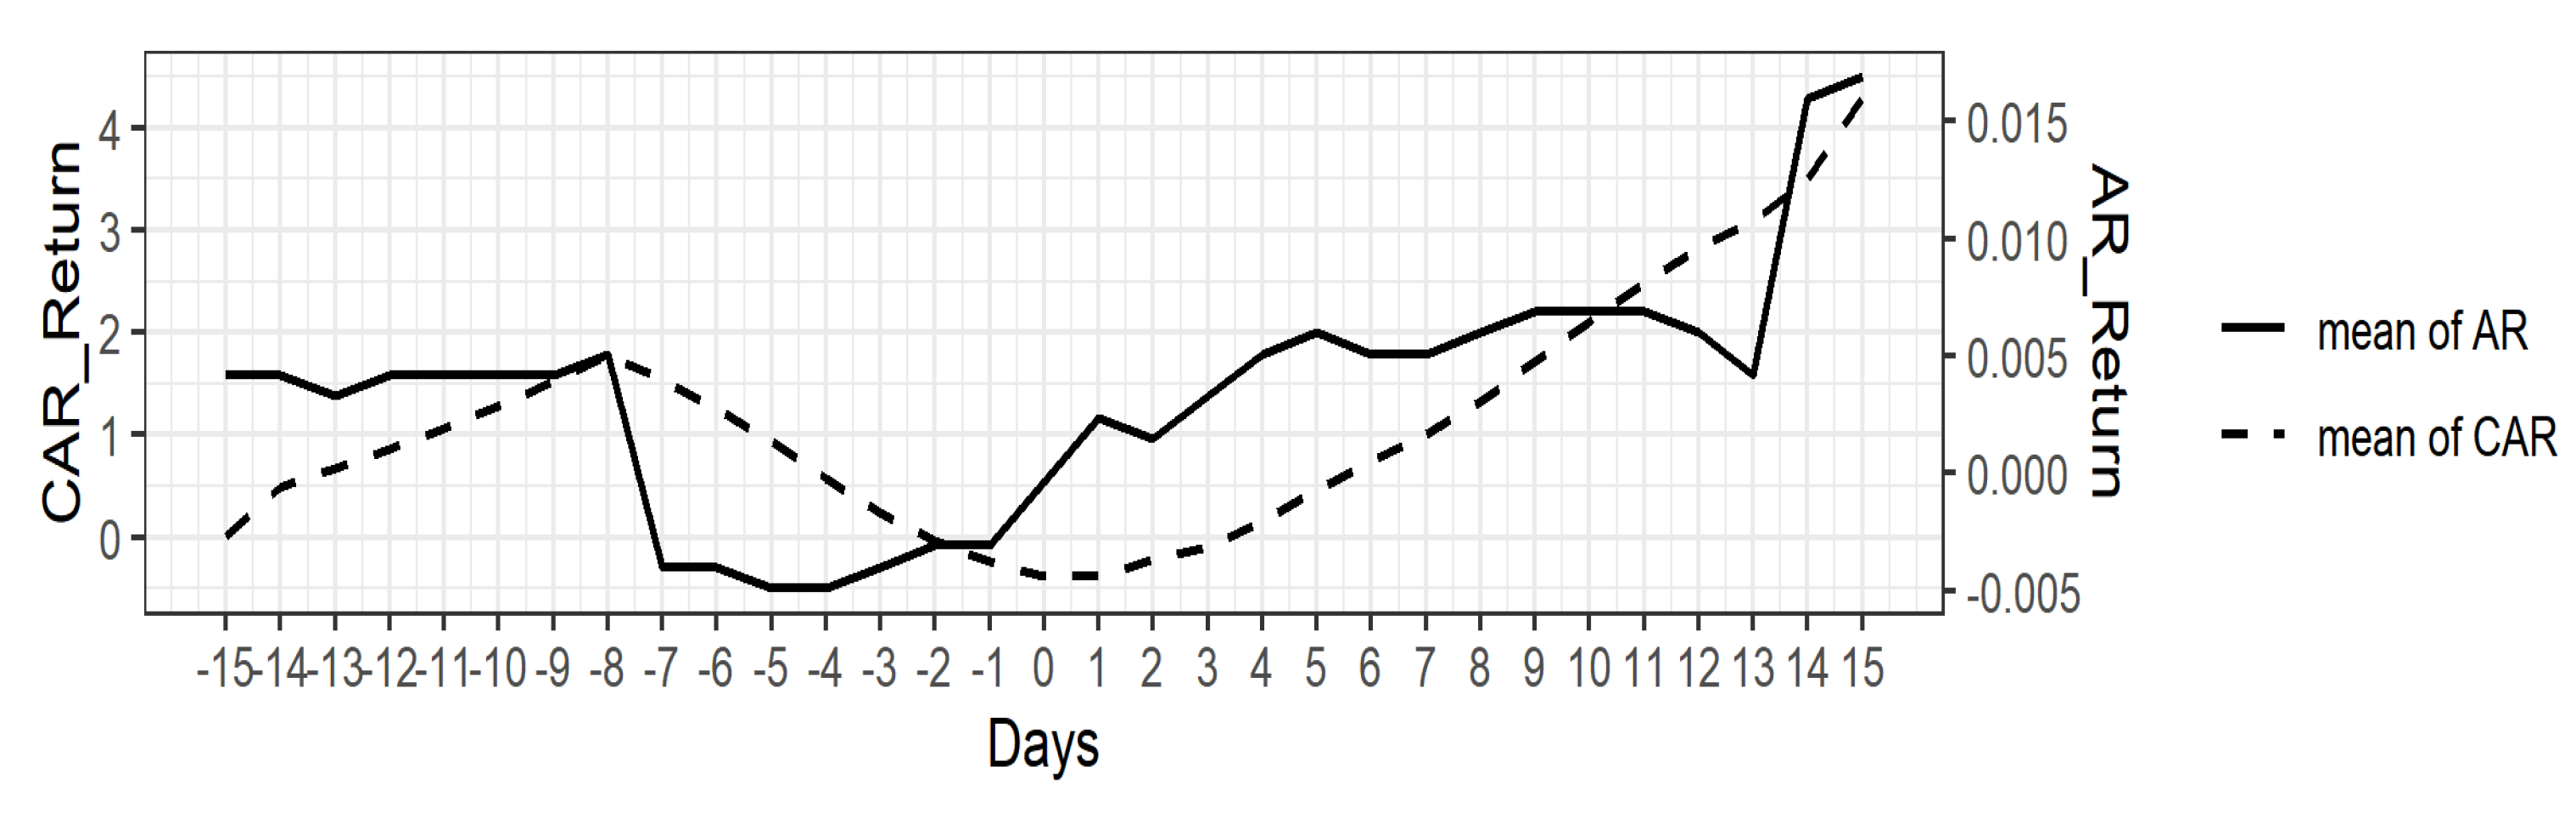
Figure 5.
Results regarding the AAR and CAAR in window .


Table 1.
T-test of CAR.
| Time Point | Mean | SD | t-Value | p-Value |
|---|---|---|---|---|
| −15 | 0.004 | 0.11 | 0.241 | 0.81 |
| −14 | 0.481 | 0.232 | 15.41 | 0.000 ** |
| −13 | 0.677 | 0.234 | 21.485 | 0.000 ** |
| −12 | 0.855 | 0.228 | 27.751 | 0.000 ** |
| −11 | 1.066 | 0.226 | 35 | 0.000 ** |
| −10 | 1.283 | 0.222 | 42.866 | 0.000 ** |
| −9 | 1.521 | 0.222 | 50.807 | 0.000 ** |
| −8 | 1.777 | 0.22 | 59.882 | 0.000 ** |
| −7 | 1.538 | 0.16 | 71.255 | 0.000 ** |
| −6 | 1.246 | 0.156 | 59.232 | 0.000 ** |
| −5 | 0.94 | 0.162 | 43.001 | 0.000 ** |
| −4 | 0.574 | 0.154 | 27.676 | 0.000 ** |
| −3 | 0.244 | 0.136 | 13.342 | 0.000 ** |
| −2 | −0.032 | 0.126 | −1.914 | 0.061 |
| −1 | −0.231 | 0.127 | −13.455 | 0.000 ** |
| 0 | −0.386 | 0.089 | −32.276 | 0.000 ** |
| 1 | −0.381 | 0.067 | −42.089 | 0.000 ** |
| 2 | −0.222 | 0.081 | −20.3 | 0.000 ** |
| 3 | −0.088 | 0.087 | −7.511 | 0.000 ** |
| 4 | 0.153 | 0.096 | 11.893 | 0.000 ** |
| 5 | 0.457 | 0.098 | 34.524 | 0.000 ** |
| 6 | 0.739 | 0.092 | 59.529 | 0.000 ** |
| 7 | 1 | 0.093 | 79.773 | 0.000 ** |
| 8 | 1.318 | 0.102 | 96.285 | 0.000 ** |
| 9 | 1.711 | 0.114 | 111.581 | 0.000 ** |
| 10 | 2.107 | 0.113 | 138.746 | 0.000 ** |
| 11 | 2.484 | 0.112 | 164.387 | 0.000 ** |
| 12 | 2.833 | 0.108 | 195.342 | 0.000 ** |
| 13 | 3.085 | 0.109 | 210.152 | 0.000 ** |
| 14 | 3.485 | 0.324 | 79.878 | 0.000 ** |
| 15 | 4.304 | 0.261 | 122.186 | 0.000 ** |
Note: ** is significant at the 0.01 level.
Table 2.
T-test of CAAR.
| Mean | SD | t | Cohen’s d | p-Value |
|---|---|---|---|---|
| 0.002 | 0.001 | 6.939 | 1.267 | 0.000 ** |
Note: ** is significant at the 0.01 level.
Table 3.
T-test of the effectiveness of the UIB market.
| Mean | SD | t | Cohen’s d | p-Value |
|---|---|---|---|---|
| 0.002 | 0.002 | 5.522 | 1.381 | 0.000 ** |
Note: ** is significant at the 0.01 level.
Table 4.
Summary of the hypotheses.
| NO. | Hypothesis | Result |
|---|---|---|
| The nonstandard default events of UIDCs will have a significant impact on the UIB market. | Accepted | |
| The UIB market is a fully efficient market. | Rejected |
Disclaimer/Publisher’s Note: The statements, opinions and data contained in all publications are solely those of the individual author(s) and contributor(s) and not of MDPI and/or the editor(s). MDPI and/or the editor(s) disclaim responsibility for any injury to people or property resulting from any ideas, methods, instructions or products referred to in the content. |
© 2023 by the authors. Licensee MDPI, Basel, Switzerland. This article is an open access article distributed under the terms and conditions of the Creative Commons Attribution (CC BY) license (https://creativecommons.org/licenses/by/4.0/).
Share and Cite
MDPI and ACS Style
Yan, X.; Li, Y.; Ming, M.; Chong, H.-Y. Impact of Nonstandard Default Risk of the Urban Investment and Development Companies on the Urban Investment Bond Market. Systems 2023, 11, 68. https://doi.org/10.3390/systems11020068
AMA Style
Yan X, Li Y, Ming M, Chong H-Y. Impact of Nonstandard Default Risk of the Urban Investment and Development Companies on the Urban Investment Bond Market. Systems. 2023; 11(2):68. https://doi.org/10.3390/systems11020068
Chicago/Turabian StyleYan, Xue, Yuke Li, Meng Ming, and Heap-Yih Chong. 2023. "Impact of Nonstandard Default Risk of the Urban Investment and Development Companies on the Urban Investment Bond Market" Systems 11, no. 2: 68. https://doi.org/10.3390/systems11020068
Note that from the first issue of 2016, this journal uses article numbers instead of page numbers. See further details here.