

A Study of the Strategic Interaction in Environmental Regulation Based on Spatial Effects
School of Foreign Languages and Literature, Changchun Humanities and Sciences Collage, Changchun 130117, China
*
Author to whom correspondence should be addressed.
Systems 2023, 11(2), 62; https://doi.org/10.3390/systems11020062
Submission received: 7 December 2022
/
Revised: 13 January 2023
/
Accepted: 20 January 2023
/
Published: 23 January 2023
(This article belongs to the Special Issue Data Driven Decision-Making for Complex Production Systems)
Abstract
:The incomplete enforcement of environmental regulations in China is a serious issue in environmental protection affairs, and this paper attempts to provide a new explanation for its prevalence from the perspective of strategic interaction. Under Chinese decentralization, environmental regulations are seen by local governments as a tool to compete for scarce resources, which leads to strategic interactions between regions. Therefore, under the theoretical framework of regional policy spillovers, this paper examines the strategic interaction behavior of local governments in environmental regulation with a spatial econometric approach research methodology based on panel data of 29 Chinese provinces (autonomous regions and municipalities directly under the central government) from 2015 to 2019, taking spatial interdependence and the strategic interaction relationship of local governments as the entry point. The study finds that the intensity of environmental regulation in a region is not only related to the characteristics of the region, but also related to the intensity of environmental regulation in competing provinces, and there is a significant strategic interaction of environmental regulation behavior between regions, which is manifested as complementary spatial strategies. If the neighboring provinces invest more in environmental regulation, the region will also strengthen its level of environmental regulation accordingly, showing the contagiousness of non-complete enforcement of environmental regulation. At the same time, the complementary strategic interaction behavior of environmental regulation between regions has weakened since 2017, which highlights the role of green environmental performance assessment. Based on this, this paper proposes to provide a policy reference to avoid the environmental regulation enforcement dilemma.
1. Introduction
Over the 30 years after China’s reform and opening up, the world’s economy has continuously developed, and environmental problems have drawn greater attention from all over the world. In such a context, governments have taken a raft of measures to tackle the intensifying environmental problems, trying to minimize the external diseconomy caused by environmental pollution. However, the increasing environmental pollution issues have not been solved. Central governments give great importance to environmental protection, but the reality is that environmental problems are difficult to solve. Why is environmental management not always as good as it should be? The incomplete implementation of the central governments’ environmental regulations is the key to solving this problem.
Theoretically, analyzing the prevalence of environmental regulatory strategy interactions requires a return to the origins of environmental regulatory competition. The first study of environmental regulation competition was conducted by Fredriksson and Milllimet (2002a), who examined the existence of interstate competition among environmental regulation strategies in the United States and confirmed the existence of a significant positive correlation between regional regulatory behavior [1]. In addition, Woods (2006) successfully verified the existence of bottom-up competition in environmental regulation using interstate data in the United States [2]. Domestic studies mainly focus on the competitive behavior of local governments’ environmental regulation strategies under fiscal decentralization. These studies also confirm that there is a clear strategic game and imitation behavior among local governments in China [3,4,5,6,7]. The current research is focused on the strategic interactions of environmental regulation. Konisky (2007) found that it is difficult to identify a single top-by-top or bottom-by-bottom competition among local governments in environmental regulation, and the competition among local governments has a dynamic adjustment process. [8]. Similarly, a study by Ye and Zhang (2011) showed that local governments not only have obvious strategic behaviors in the current period but also tend to compete on behaviors across periods [9,10]. Existing studies have noted the explanations of local governments’ behavior on the phenomenon of the incomplete implementation of environmental regulations and described some conceptual terms, such as selective implementation, symbolic implementation, negative implementation [11], and policy implementation bias [12].
In general, the behavior of competing local governments in environmental regulation has been studied in some depth, but the research perspective is limited to the dynamics of the local governments’ behavior and treats each local government as an independent individual, thus ignoring the influence and constraints of local governments’ behavior as competitors [13,14,15], which cannot satisfactorily explain the universality of the non-complete enforcement of environmental regulations. The contribution of this paper is that through the study of inter-regional environmental regulation strategy interactions, we attempt to provide a new explanation for the prevalence of the incomplete enforcement of environmental regulations in China. We highlight that under the Chinese yardstick competition, the profit-seeking local governments implement strategic interaction behaviors, which lead to the mutual imitation of environmental regulations between regions and the incomplete enforcement of environmental regulations in one region. The contagiousness explains the prevalence of the incomplete enforcement of environmental regulations. From this perspective, this paper answers questions surrounding environmental regulation strategy interactions and explores feasible paths to alleviate the incomplete implementation of environmental regulations, providing possible corresponding policies.
2. Research Design
2.1. Methodology
2.1.1. Exploratory Spatial Data Analysis Approach (ESDA)
According to the first law of geography, things that are spatially adjacent are more closely related. In this paper, we use exploratory data analysis (ESDA) to test the spatial characteristics of environmental regulations. Moran’s I is used to analyze whether there is clustering or outliers between things, while the local Moran’s I is used to explore spatial agglomeration and dispersion [16].
The global Moran’s I is calculated as
where I is the measure of the overall correlation of the strength of environmental regulation between regions.
Here, Ai is the weighted value of environmental regulatory enforcement in the jurisdictions, n is the number of regions, and W is the spatial weight matrix. I takes values from −1 to 1. When it approaches 1, it indicates that the intensity of environmental regulatory between the regions presents a spatially positive correlation. When it approaches −1, there is a negative spatial correlation. When it approaches 0, there is no spatial correlation.
When the spatial effects are introduced into the study of economic management processes and spatial econometric models are established for spatial statistical analyses, spatial weight matrices are needed to express the spatial interaction [17]. Accurately measuring the spatial relationships between the provinces and establishing reasonable spatial weight matrices are two key points of the empirical study in this paper. Based on the practices in the existing literature, this study established the spatial weight matrices according to geospatial standards. The details are as follows. According to geographic information, the simplest case is a binary geographic adjacency matrix, which takes the value of 1 if province i and province j share a boundary, and 0 otherwise. If two provinces share a boundary or intersect with each other, they are defined as adjacent. They can be either located along the same latitude, are the same along the same latitude, or are in a diagonal manner.
The global Moran’s I represents the overall spatial autocorrelation, and this overall evaluation may neglect the atypical characteristics of local areas [18]. In addition, local correlation indexes need to be used to examine the correlation and agglomerations in the local areas. The local Moran’s I is always used, and its equation is
where Ii is the measure of the degree of correlation between the strength of the environmental regulation in region i and that in its surrounding regions, Ai, Ā, n, W, and S2, are the same in the equation of the global Moran’s I. An Ii > 0 suggests a positive correlation between region i and its surrounding regions. In other words, regions with a similar strength of regulations gather together, showing high and high (H-H) or low and low (L-L) agglomerations. An Ii < 0 denotes a negative correlation, which means that regions with different environmental regulations in place gather together, showing high and low (H-L) or low and high (L-H) agglomerations [19].
2.1.2. Setting of the Econometric Model
The key to the empirical analysis in this study is how to identify the spatial correlation and dependence of the governments’ environmental regulation policies among regions, and spatial econometrics is a good tool for this. In this study, provincial balanced panel data in China were used to construct a spatial econometric model.
Due to spatial correlations and spatial differences, spatial constant coefficient regression models (including spatial lag models and spatial error models) are the most commonly used in spatial econometrics. Spatial lag models (SARs) are mainly used to examine whether the model variables show spillover effects in a region. The model is expressed as y = ρϖy + βx + ε, where y is the explained variable, x is an n × k exogenous explanatory variable matrix, ρ is the spatial autoregressive coefficient, ϖ is an n × n spatial weight matrix, ϖy is the explained variable of the spatial lag, and ε is the random error item. Spatial error models (SERs) are mainly used to examine the explained variables of the adjacent regions on the explained variable of the region in question in terms of the direction and degree. The model is expressed as y = βx + ε, ε = λϖε + μ, where ε is the random error item, λ is an n × 1 spatial error coefficient matrix, and μ is the random error vector of the normal distribution. β reflects the influence of the independent variable, x, on the dependent variable, y, and ε reflects the direction and degree of the adjacent regions’ explained variables on the explained variable of the region in question.
The classical econometric model was expanded based on the above theoretical basis to obtain the following spatial econometric models:
- 1.
- The spatial lag panel data model:
- 2.
- The spatial error panel data model:
2.2. Data Description and Variable Selection
2.2.1. Variables
- (1)
- Environmental regulation
It is well known that there is no direct measure of environmental regulation. In general, the established literature uses alternative proxy indicators to measure the intensity of environmental regulation, including pollution reduction rate cost, pollution control investment, the amount of supervision and inspection, and government environmental protection expenditure [20,21]. In this paper, the environmental regulation intensity is measured by the ratio of industrial pollution control investment per unit of the industrial value added to the industrial value added per unit of GDP.
- (2)
- Decentralized indicators (FD)
In this paper, we use fiscal decentralization to measure the unique macro environment for environmental regulation decisions. According to the approach from Guo [22], the indicator is measured as follows: FD = per capita provincial fiscal expenditure/(per capita provincial fiscal expenditure + per capita federal fiscal expenditure).
- (3)
- Public demand for environmental protection (LETTER)
Public demand for environmental protection is the subjective awareness of people and does not have direct quantifiable indicators, so the existing literature uses alternative indicators to measure it [23,24]. This paper constructed indicators of public demand for environmental protection in terms of letters and visits according to the approach of Yu [23].
- (4)
- Other variables
Other control variables are introduced with reference to the environmental STIRPAT model [25]. The GDP per capita and its square measure the environmental Kuznets curve. Population density is the ratio of the total population to the area of the city at the end of the year. The FDI is the ratio of foreign investment to the GDP, which is used as a variable to measure local government competition.
2.2.2. Data
China issued a new environmental law in 2013 and implemented the separation of environmental law enforcement and regulation, elevating the main body exercising regulatory functions to provincial environmental protection authorities, which strengthens the effectiveness of regulation while compacting the implementation of policies on the ground. Considering the time lag of laws and policies and the availability of data, this paper uses the data of local governments at the provincial level (excluding Hong Kong, Macao, and Taiwan) in China from 2015 to 2020 as the sample. In view of the lack of data on Tibet, Tibet is excluded from the study. All data were obtained from the China Statistical Yearbook (2015–2020), the China Environmental Yearbook (2015–2020), and the China Statistical Yearbook of Industrial Economy (2015–2020). Spatial correlation tests were performed using OpenGeoDa, and the processing of basic panel data and spatial panel data estimation were performed using MATLAB 8.0.
3. Empirical Results and Analysis of the Spatial Effects
3.1. Spatial Correlation
3.1.1. Global Spatial Correlation
Table 1 shows Moran’s I for the environmental regulatory stringency in 29 Chinese provinces from 2015 to 2019.
All the values of the global Moran’s I shown in Table 1 are positive, indicating a significant positive spatial correlation of China’s environmental policies. In other words, regions with strong environmental regulations tend to be adjacent to one or more regions with similar regulations (a high–high positive correlation). Meanwhile, the values in all these years (except for the low value in 2019) are around 0.3, indicating that this spatial correlation is relatively stable.
3.1.2. Local Spatial Correlation
Anselin (1995) [26] proposed that global autocorrelation reflects the particular situation of spatial correlation among regions. To analyze the correlation among provinces more clearly, this paper used local autocorrelation analysis, LISA, and scatterplots to visually analyze the local correlation.
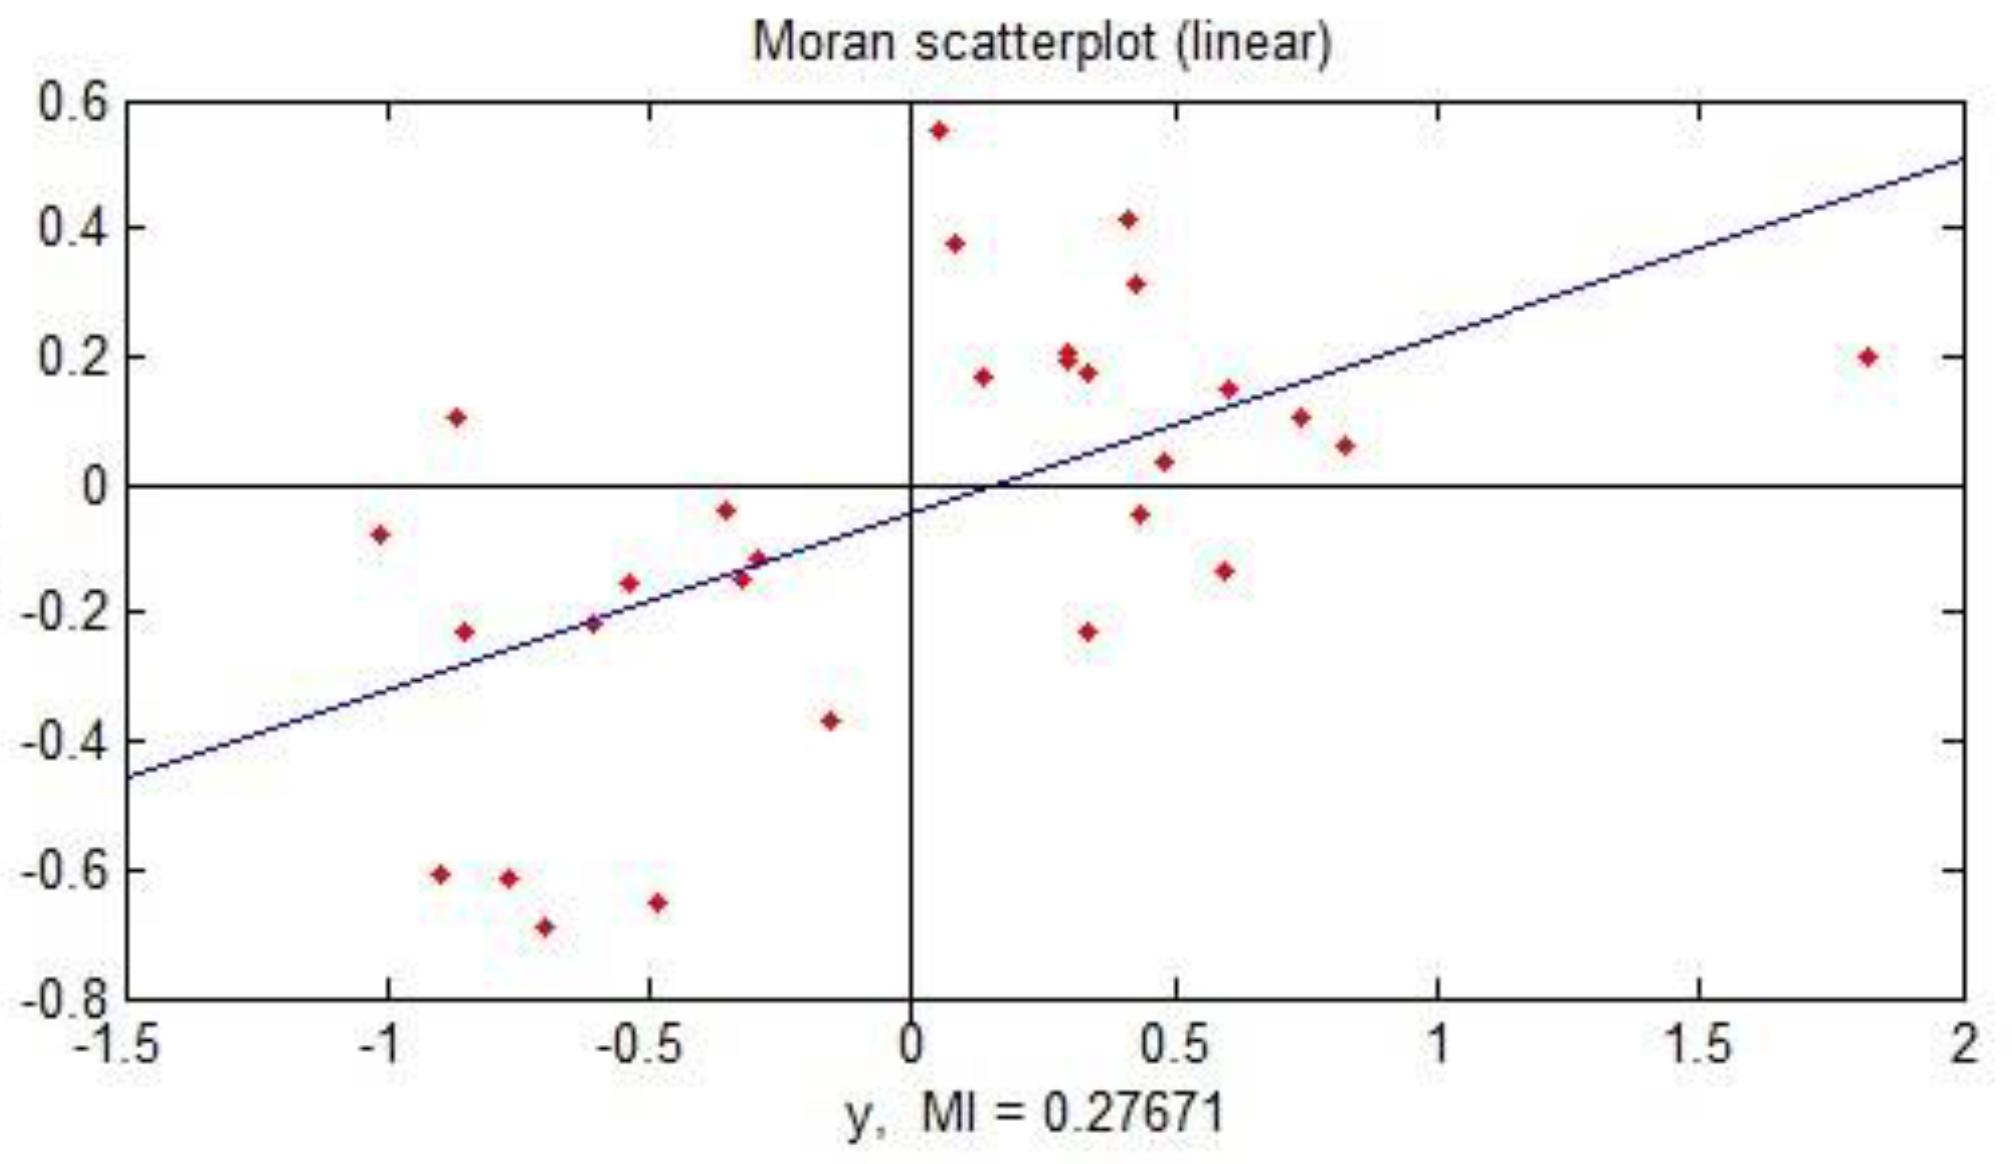
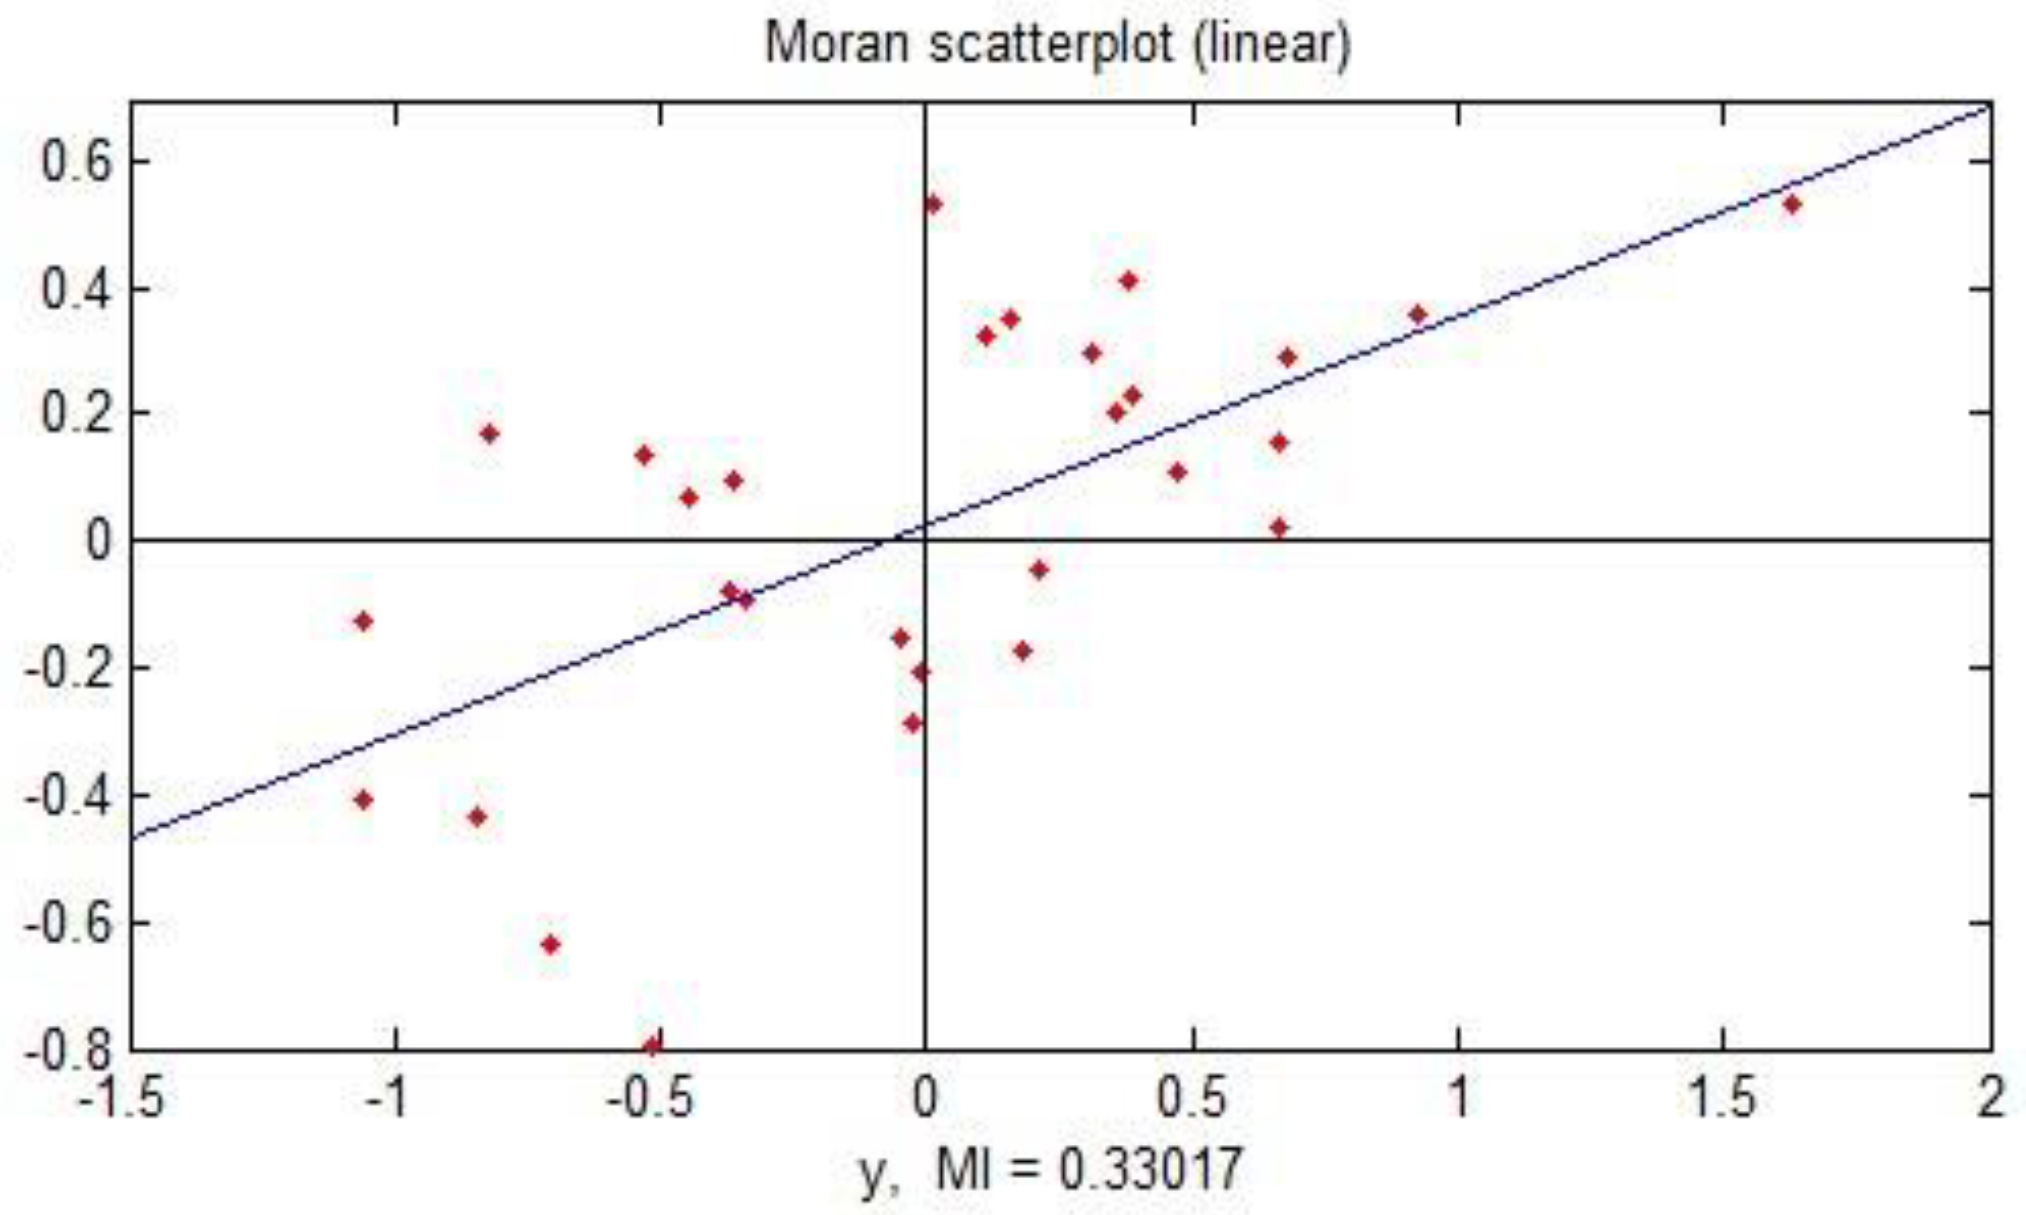
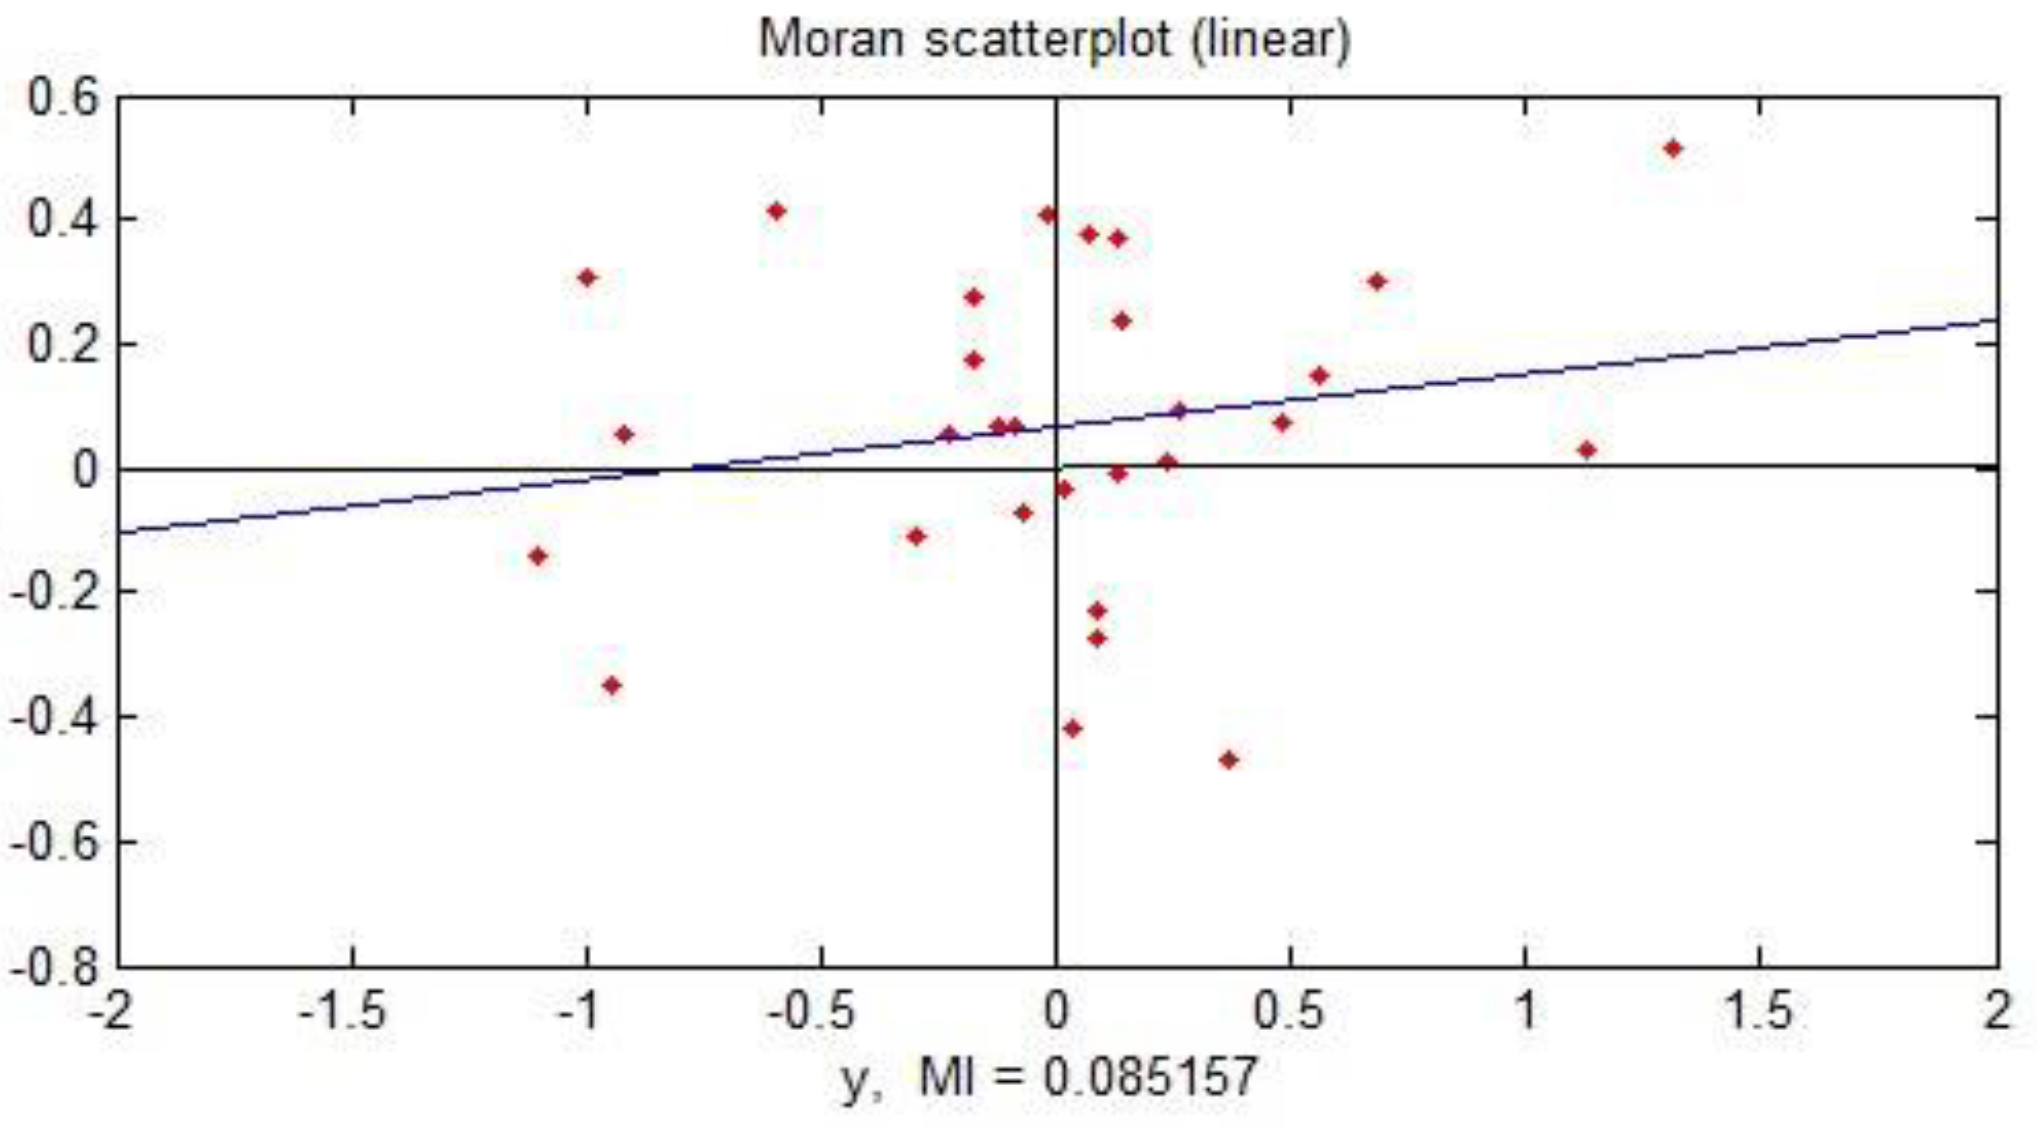
Figure 1, Figure 2, Figure 3, Figure 4 and Figure 5 show the scatterplots of the local Moran’s I of the strength of environmental regulation in various regions in China from 2015 to 2019. The horizontal axis represents the standardized value of the strength of environmental regulation, and the vertical axis represents the value of the spatial lag of the standardized strength of environmental regulation. The mean value is the center of the axis, which divides the plot into four quadrants. The first quadrant represents a high–high positive correlation, and the third quadrant represents a low–low positive correlation. Since the local Moran’s I shows a positive correlation, the second and fourth quadrants that represent the negative correlation are atypical observation areas. The figures show that from 2015 to 2019, the spatial evolution of relative environmental regulation fluctuated. The majority is clustered in the first and third quadrants in 2015 and 2016. The clustering of relative regulation is dispersed from 2017 to 2019, which indicates a certain diffusion effect. The strategic interaction behavior of the mutual imitation of the environmental regulations between the regions significantly weakened after 2017. The weakening and disappearance of imitation, and even the change to a differentiated form of strategic interaction, implies that the central government’s emphasis on environmental protection, and the inclusion of environmental indicators in the performance assessment system, have gradually corrected the GDP-only view of the performance of local government officials.
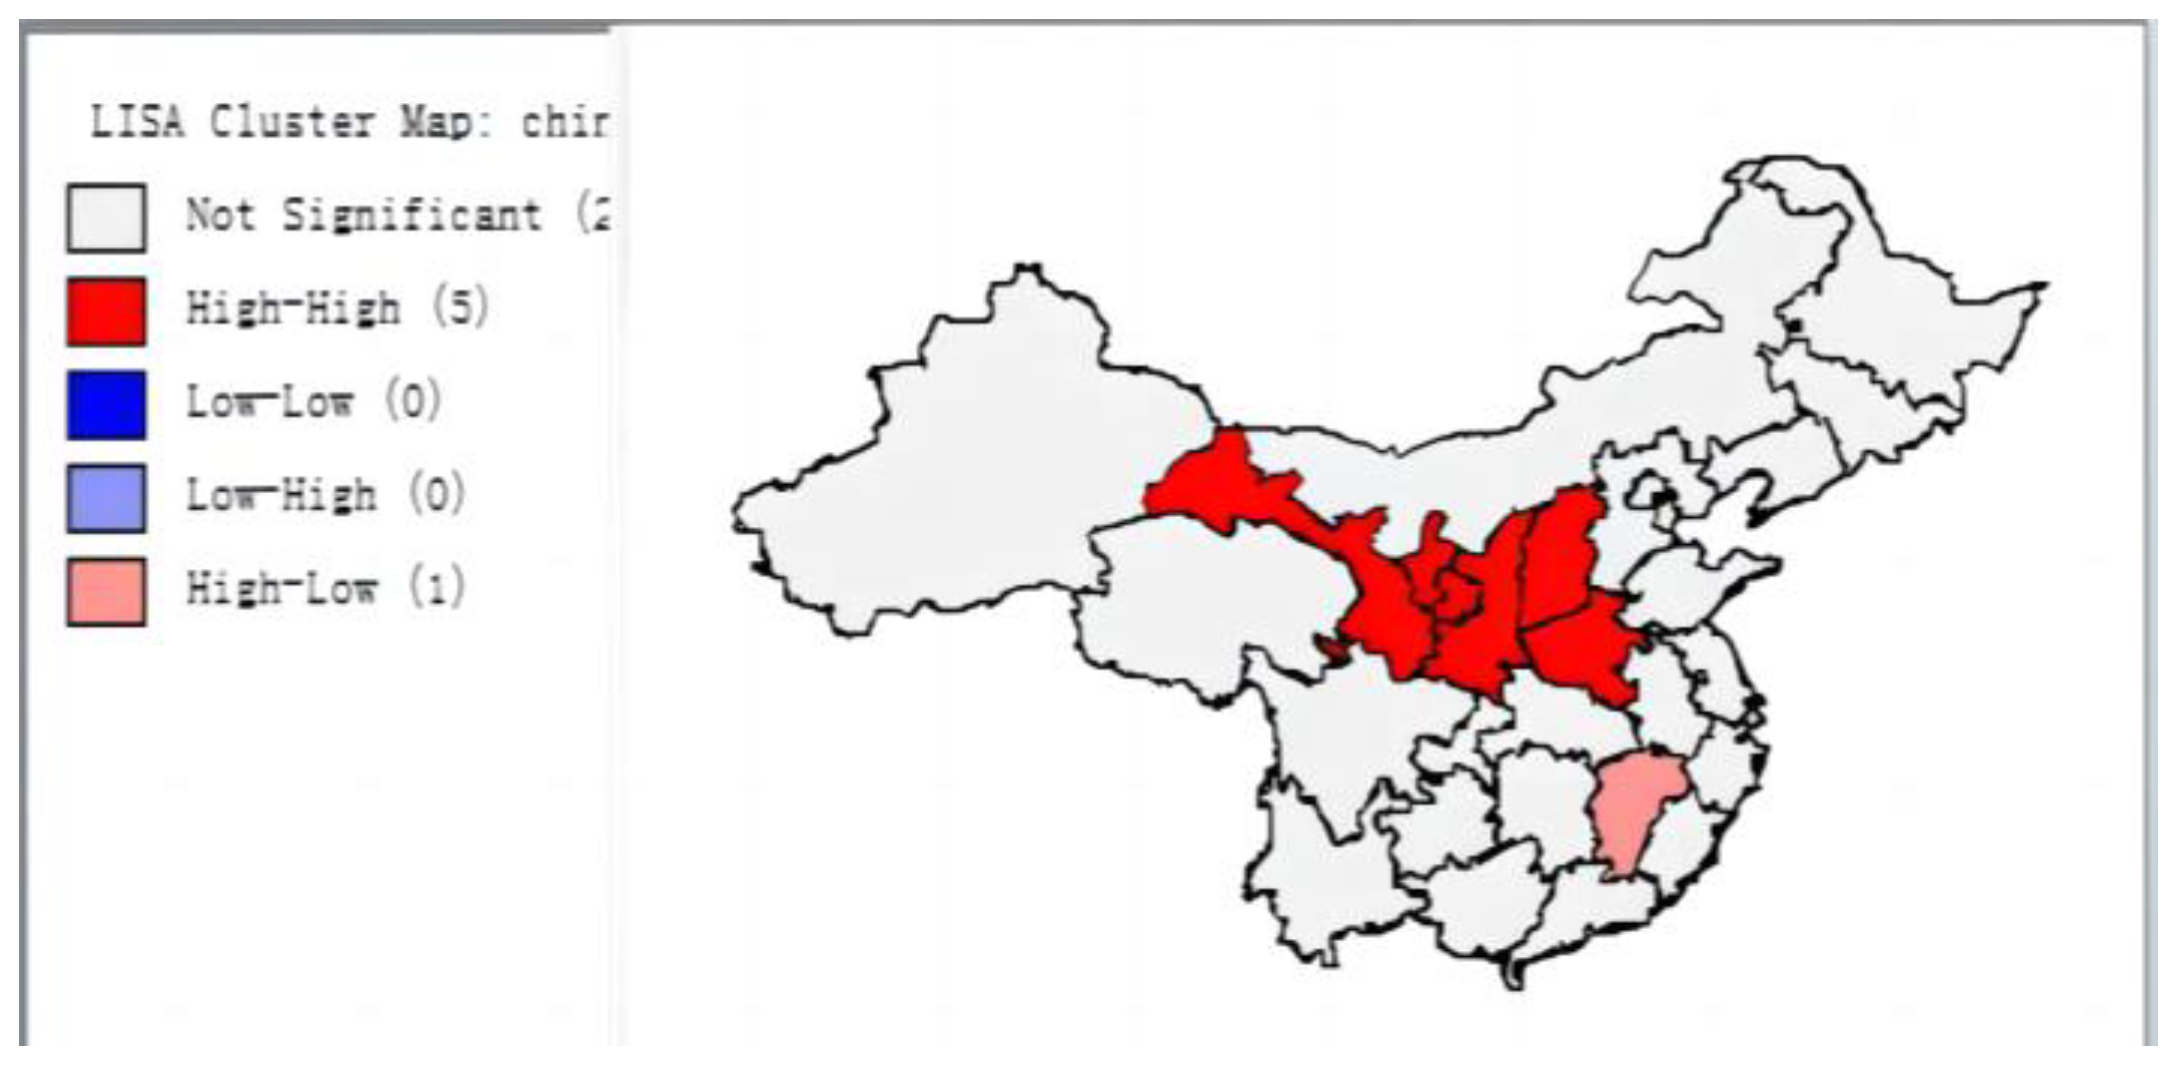
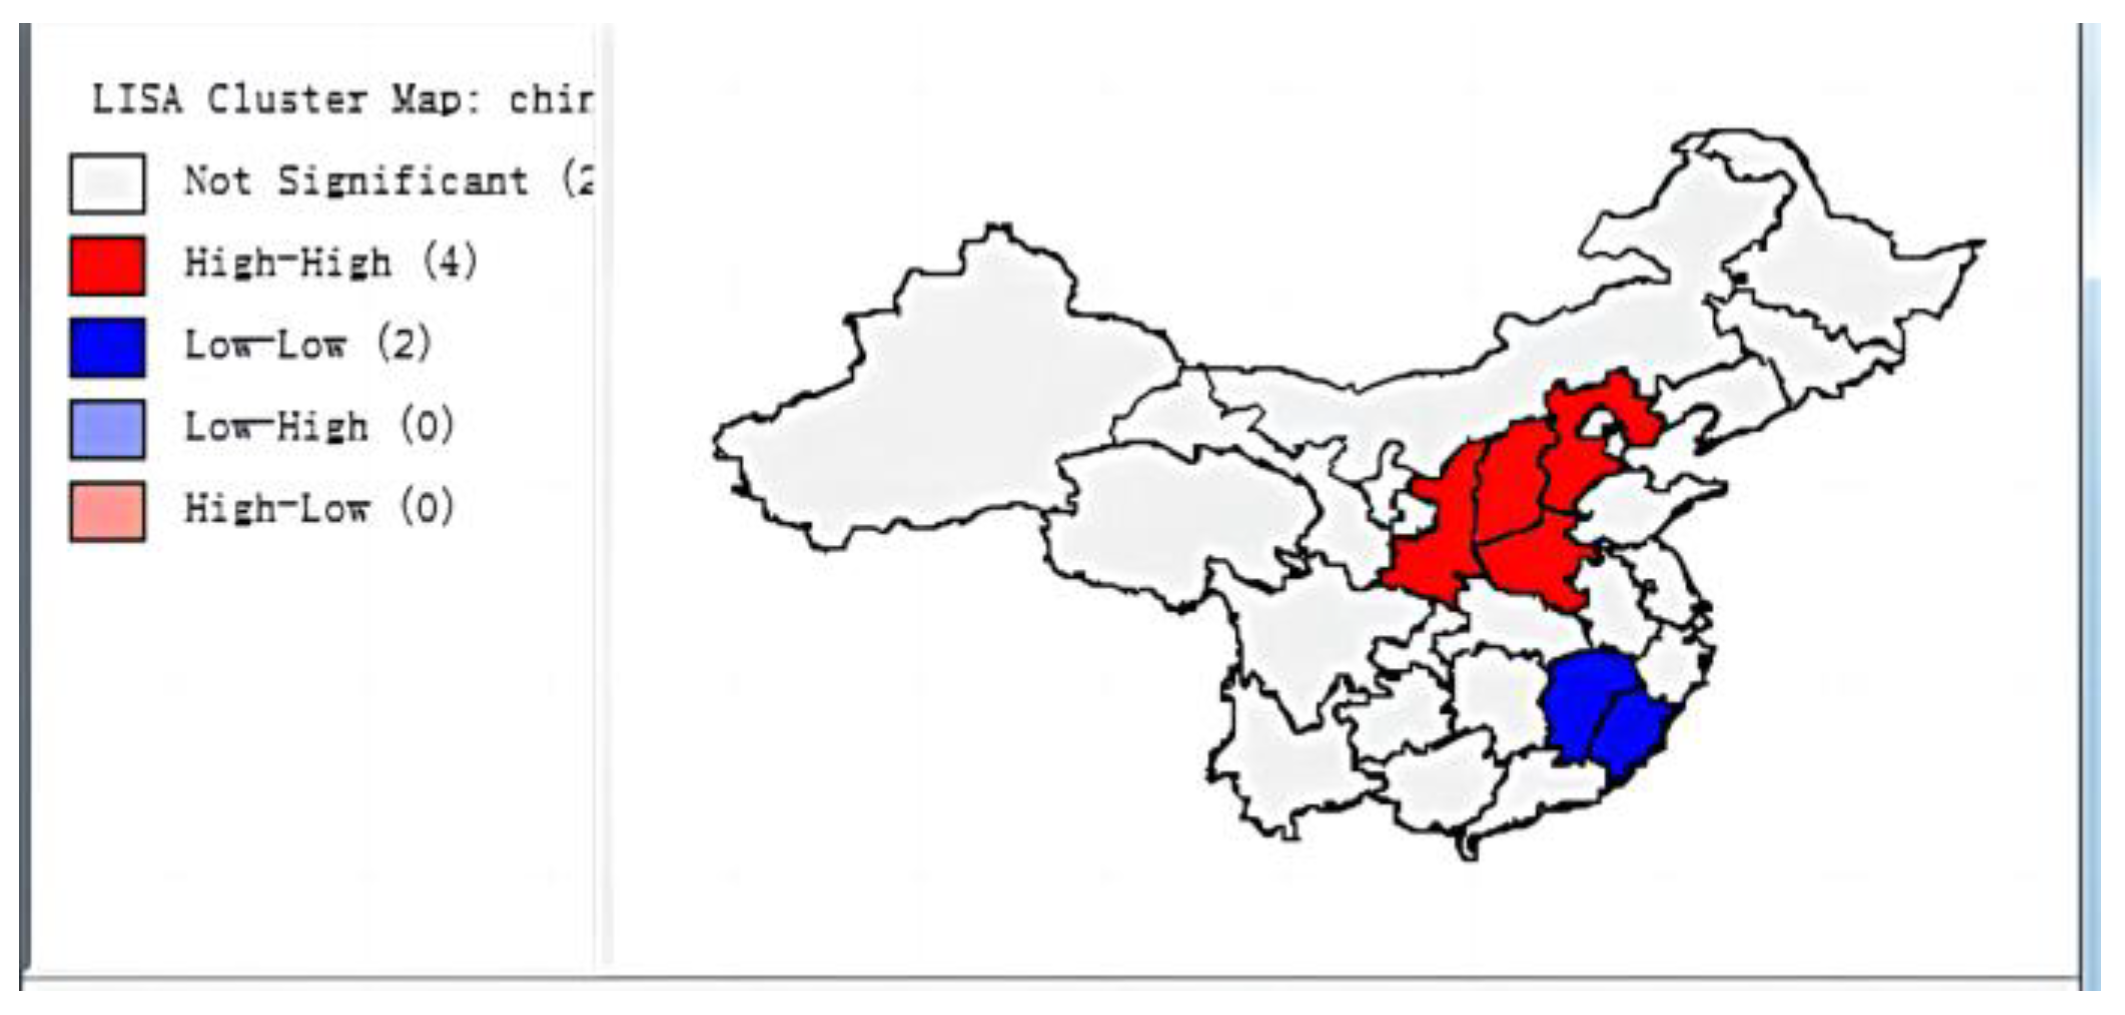
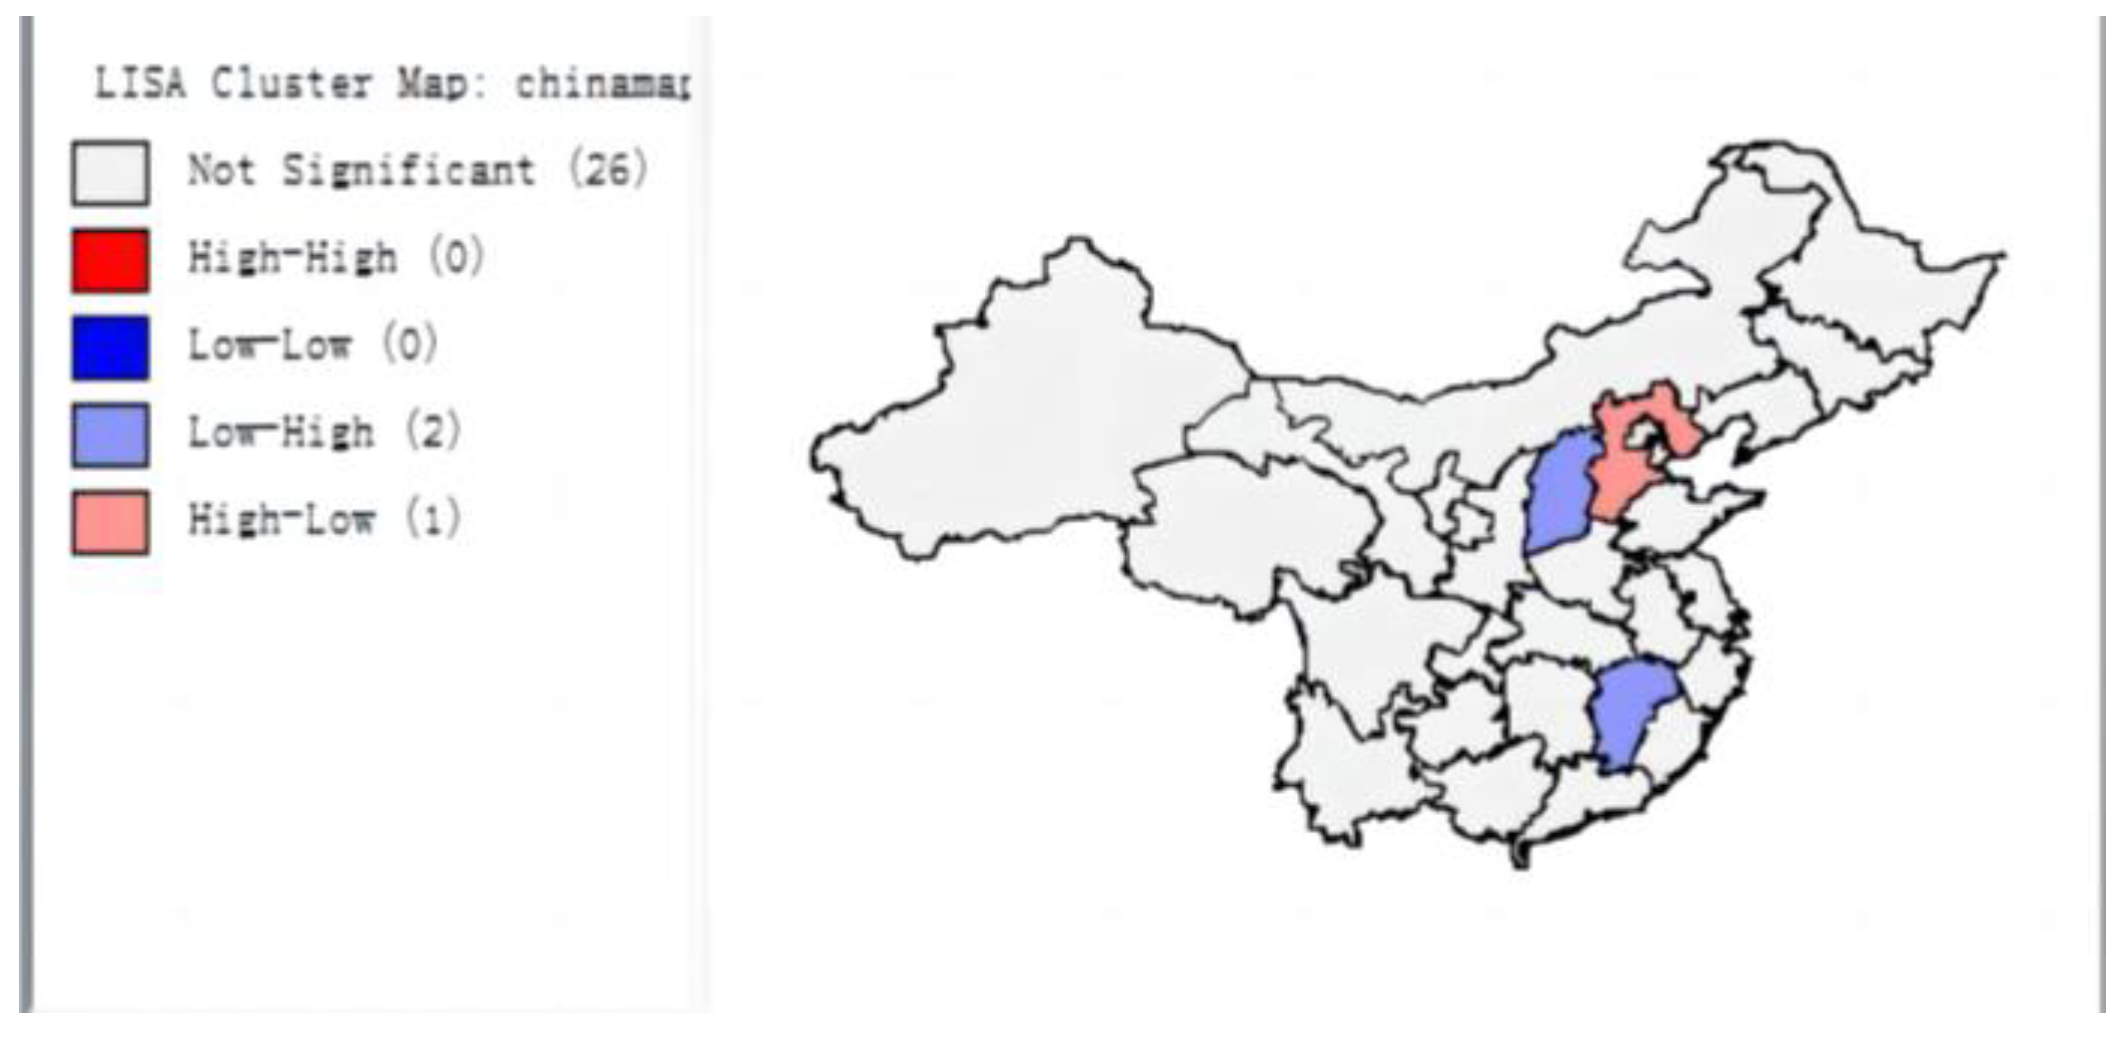
To reflect the spatial divergence characteristics of environmental regulation and local protection, we used the values of local Moran’s I to plot the cluster maps of the strength of environmental regulation in China’s various regions and compared the changes in spatial patterns from 2015 to 2019 (Figure 6, Figure 7, Figure 8, Figure 9 and Figure 10). The agglomeration areas all passed the test at a significance level of 5%.
As the LISA cluster maps in Figure 6, Figure 7, Figure 8, Figure 9 and Figure 10 show, the high–high correlations are mainly distributed in six provinces, namely Beijing, Tianjin, Hebei, Shanxi, Shaanxi, and Henan. This is mainly because in 2015, the National Development and Reform Commission issued the Beijing–Tianjin–Hebei Synergistic Development Ecological Environmental Protection Plan, and the promulgation of this policy has strongly promoted the synergistic process of ecological and environmental management in Beijing, Tianjin, and Hebei. Low–low correlations are mainly distributed in the western regions. This is mainly due to the lower level of economic development and relatively weaker environmental regulations there. In 2019, more areas showed a discrete status, which is mainly due to a document issued by the Ministry of Environmental Protection in 2018, which called for setting and strictly adhering to the red line for ecological protection. The document states the upper limit for total emissions and the bottom line for environmental access and a series of initiatives announcing the advent of the strictest environmental protection system. In this case, the environmental performance appraisal imposed a hard constraint on local government officials in terms of environmental protection tasks, which prompted local governments to differentiate their environmental regulatory behavior and optimize their strategic interactions. This highlights the important role of the continuously strengthened environmental performance appraisal and reflects that the diversification and greening of performance appraisals help shape the scientific behavioral choices of local government officials and weaken the strategic interaction behaviors of environmental regulation, thus alleviating the prevalence of the incomplete enforcement of environmental regulation.
In conclusion, there is a significant positive spatial correlation between environmental regulations in China’s various regions. It is a long-term and stable correlation. The local spatial correlation shows that H-H agglomerations are concentrated in a stable state in regions with rapid local economic development. To properly protect the environment, it is necessary to thoroughly consider how significant the impact of these spatial effects on environmental regulation is. To answer this question, it is necessary to introduce a spatial econometric model to further analyze the spatial spillover effect.
3.2. Spatial Spillover Effects
Table 2 shows the coefficient results of the spatially lagged static panel regressions, which analyze the strategies of local governments’ environmental regulation decisions in the absence of intertemporality. The Hausman test in MATLAB used in this study selects random effects when p > 0.05 (Table 3). According to the judgment of the Hausman test, the SAR was selected.
In the model, δ is greater than 0, indicating a significant spatial spillover effect of regulatory enforcement. The results of the regressions show that local governments have a significant imitative behavior in environmental regulation and will respond accordingly to the different decision-making environments. The regression results lead to the following conclusions.
- (1)
- Environmental regulation
As can be seen from Table 2, the estimated coefficients are significantly different from zero, at least at the 5% level, which indicates that there is a strategic interaction behavior of environmental regulation expenditure between the regions, and the coefficients are significantly larger than zero. In addition, the strength of environmental regulation of a province increased by 0.264% when that of a neighboring province rose by 1%, indicating significant spatial spillover effects. Further, this indicates that the strategic interactions are complementary. This implies that, for government officials in a region, if the rival in the same position in the yardstick competition chooses to reduce the investment in pollution control, then the optimal strategy for the government officials in that region is also to reduce the investment in pollution control to a low-level equilibrium. At the same time, the estimated coefficients of the spatial lags of environmental regulations are all significantly larger than zero, indicating that there is a strategic interaction between the regions to imitate each other’s environmental regulations, and this imitation makes the behavior of the incomplete enforcement of environmental regulations in one region contagious to neighboring regions, which breeds the incomplete enforcement of environmental regulations.
- (2)
- Fiscal decentralization (FD)
The estimated coefficients of fiscal decentralization and the spatial lag factor of environmental regulation are significantly positive at the 1% level, implying that fiscal decentralization strengthens the strategic interaction behavior of environmental regulation between regions and creates incentives for the incomplete enforcement of environmental regulation.
- (3)
- Public environmental demands (LETTER)
The estimated coefficients of the spatial lag between public demand and environmental regulation are positive, and most of them are significant, at least at the 10% level, suggesting that public demand strengthens regulation intensity and weakens the strategic interaction behavior of inter-regional environmental regulation and forms a constraint to the incomplete implementation of environmental regulation, which supports the pivotal role of the public in environmental protection matters. At the same time, this estimation implies the need to promote the transition from unitary governmental governance to a modern environmental governance system with multi-level governance, which is also in line with the spirit of the newly revised Environmental Protection Law to establish a separate chapter on information disclosure and public participation, and ultimately to form a bottom-up external accountability and monitoring mechanism.
- (4)
- Other variables
There is a positive effect of the GDP per capita on the regulation and benefits of environmental regulations. This may be explained by the fact that the higher the level of economic development, the better the factor endowment, and the higher the probability that local government officials will win in the competition for a promotion, which leads to a stronger incentive for growth and a more serious spending bias for government officials in the region, and thus a greater lack of incentive for environmental spending. Population density reduces the intensity of environmental regulation. This may be due to the fact that the higher the population density, the higher the employment pressure on the public, and the tendency of local governments to loosen environmental regulations in order to alleviate this pressure. FDI has weakened environmental regulations as a whole, probably because local governments compete viciously to attract FDI and use lax environmental regulations as bait, leading to the effect of bottom-up competition for environmental regulations.
4. Conclusions
This study empirically analyzed the inter-regional strategic interaction in environmental regulatory enforcement in China. Based on the political tournament theory and the condition of capital flow, a model of the strategic interaction between the environmental regulation behaviors in two regions was built.
This paper finds that there are significant complementary strategic interactions between the regions in environmental regulation, implying that rival regions imitate each other’s environmental regulations. The spillover of the incomplete enforcement of environmental regulations is explained by the fact that rival regions mimic each other’s environmental regulations, which better explains the prevalence of incomplete enforcement of environmental regulations. This explains the prevalence of the non-complete enforcement of environmental regulations. After 2017, the interregional environmental regulation imitation behavior diminished, which means that the greening of performance assessment helps to weaken the strategic interaction behavior and mitigate the prevalence of non-complete implementation of environmental regulation. Based on this, in order to effectively break the prevalence of incomplete enforcement of environmental regulations and to improve the policy confidence of the central government, the following policy recommendations are made: Firstly, the greening of the performance appraisal system is conducive to alleviating the strategic interaction of environmental regulations between regions, so it should continue to reduce the weight of growth in the performance appraisal, increase the weight of environmental protection, build an effective balance mechanism between economic development and environmental regulations, and implement the same responsibility of the party and government for environmental protection and the one-vote veto system.
Secondly, China needs to further centralize its environmental management, improve the vertical management system for environmental policy enforcement below the provincial level, reduce the scope for local governments’ discretion in enforcement, and expand the scope of central governments’ spending on environmental protection matters. This will lead to a pattern of better matching of financial and administrative powers for environmental management. Finally, the role of the public in environmental protection matters is particularly important. The public should be given the right to make decisions on environmental management by establishing and facilitating channels for the public to express their environmental demands, thus improving the situation of insufficient government supervision. At the same time, we should incorporate social organizations into environmental protection activities to form a modern environmental governance pattern with multiple avenues of governance and social participation.
Author Contributions
H.G. Conceptualization, Methodology, Software, Validation, Visualization, and Writing—original draft. F.L. Project administration, Resources, Writing—review and editing, and Conceptualization. J.Z. Conceptualization, Validation, and Writing—review and editing. Y.S. Conceptualization, Validation, and Writing—review and editing. All authors have read and agreed to the published version of the manuscript.
Funding
This work was supported by the Jilin Province Higher Education Scientific Research Subject (JGJX2020D583).
Institutional Review Board Statement
Not applicable.
Informed Consent Statement
Not applicable.
Data Availability Statement
Not applicable.
Conflicts of Interest
The authors declare no conflict of interest.
References
- Fredriksson, P.G.; Millimet, D.L. Strategic Interaction and the Determination of Environmental Policy Across US States. J. Urban Econ. 2002, 51, 101–122. [Google Scholar] [CrossRef]
- Woods, N.D. Interstate Competition and Environmental Regulation: A Test of the Race-to-the-bottom Thesis. Soc. Sci. Q. 2006, 87, 174–189. [Google Scholar] [CrossRef]
- Fan, Y.; Wang, W. Analysis of local fiscal expenditure preferences under Chinese style fiscal decentralization. Econ. Manag. Res. 2010, 7, 40–47. [Google Scholar]
- Yang, H.S.; Chen, S.L. Local government competition and environmental policy: Evidence from Chinese provincial data. Financ. Econ. Res. 2019, 4, 46–55. [Google Scholar]
- Yi, Z. The game behavior of local government competition and river basin water environmental protection. Econ. Issues 2014, 1, 35–43. [Google Scholar]
- Deng, M. A study on the strategic interaction of market segmentation among regions in China. China Ind. Econ. 2014, 2, 18–29. [Google Scholar]
- Zhang, Z.; Zhu, P. An empirical study of local environmental expenditures. Econ. Res. 2010, 5, 82–94. [Google Scholar]
- Konisky, D.M. Regulatory Competition and Environmental Enforcement: Is There a Race to the Bottom. Am. J. Political Sci. 2007, 51, 853–872. [Google Scholar] [CrossRef]
- Ye, Q. Research on environmental governance under the fiscal decentralization system. Financ. Econ. Politics Law 2011, 3, 37–41. [Google Scholar]
- Zhang, K.C.; Wang, J.; Cui, S.Y. Fiscal decentralization and environmental pollution: A carbon emission perspective. China Ind. Econ. 2011, 10, 65–75. [Google Scholar]
- Xue, L.; Wei, X.; Liu, J. Environmental regulation and its assessment in China. China Popul. Resour. Environ. 2010, 9, 70–77. [Google Scholar]
- Brueckner, J. Strategic interaction among governments: An overview of empirical studies. Int. Reg. Sci. Rev. 2003, 26, 175–188. [Google Scholar] [CrossRef] [Green Version]
- Cole, M.; Elliott, R. Determining the trade environment composition effect: The role of capital, labor and environmental regulations. J. Environ. Econ. Manag. 2003, 46, 363–383. [Google Scholar] [CrossRef]
- Dijkstra, B. Direct regulation of a mobile polluting firm. J. Environ. Econ. Manag. 2003, 45, 265–277. [Google Scholar] [CrossRef]
- Elhorst, J. Spatial panel data models. In Handbook of Applied Spatial Analysis; Fischer, M.M., Getis, A., Eds.; Springer: Berlin/Heidelberg, Germany, 2010; pp. 377–407. [Google Scholar]
- Horrace, W.C.; Schnier, K.E. Estimation a Production Function for Highly-Mobile Technologies; Department of Economics, Syracuse University: Syracuse, NY, USA, 2008. [Google Scholar]
- McFadden, D.; Train, K.E. Mixed MNL models of discrete response. J. Appl. Econom. 2000, 15, 447–470. [Google Scholar] [CrossRef]
- Parsons, G.R.; Hauber, A.B. Spatial boundaries and choice set definition on a random utility model of recreation demand. Land Econ. 1998, 74, 32–48. [Google Scholar] [CrossRef]
- Colmer, J.; Hardman, I.; Shimshack, J.; Voorheis, J. Disparities in PM2.5 air pollution in the United States. Science 2020, 369, 575–578. [Google Scholar] [CrossRef] [PubMed]
- Crowder, K.; Downey, L. Inter-Neighborhood Migration, Race, and Environmental Hazards: Modeling Micro-Level Processes of Environmental Inequality. Am. J. Sociol. 2010, 115, 1110–1149. [Google Scholar] [CrossRef]
- Glatter-Götz, H.; Mohai, P.; Haas, W.; Plutzar, C. Environmental Inequality in Austria: Do Inhabitants’ Socioeconomic Characteristics Differ Depending on Their Proximity to Industrial Polluters? Environ. Res. Lett. 2019, 14, 074007. [Google Scholar] [CrossRef]
- Guo, Q.; Jia, J. Strategic Interaction Behavior, Fiscal Spending Competition and Regional Economic Growth among Local Governments. Manag. World 2009, 10, 17–27. [Google Scholar]
- Yu, W.; Gong, Q. Public demands, officials’ incentives and regional environmental governance. Zhejiang Soc. Sci. 2014, 5, 23–35. [Google Scholar]
- Aldeco, L.; Barrage, L.; Turner, M.A. Equilibrium Particulate Exposure; Technical Report; Brown University: Providence, RI, USA, 2019. [Google Scholar]
- Allen, T.; Arkolakis, C. Trade and the Topography of the Spatial Economy. Q. J. Econ. 2014, 129, 1085–1140. [Google Scholar] [CrossRef] [Green Version]
- Anselin, L. Local Indicators of Spatial Association-LISA. Geogr. Anal. 1995, 27, 93–115. [Google Scholar] [CrossRef]
Figure 1.
Scatterplot of the local Moran’s I in 2015.

Figure 2.
Scatterplot of the local Moran’s I in 2016.

Figure 3.
Scatterplot of the local Moran’s I in 2017.
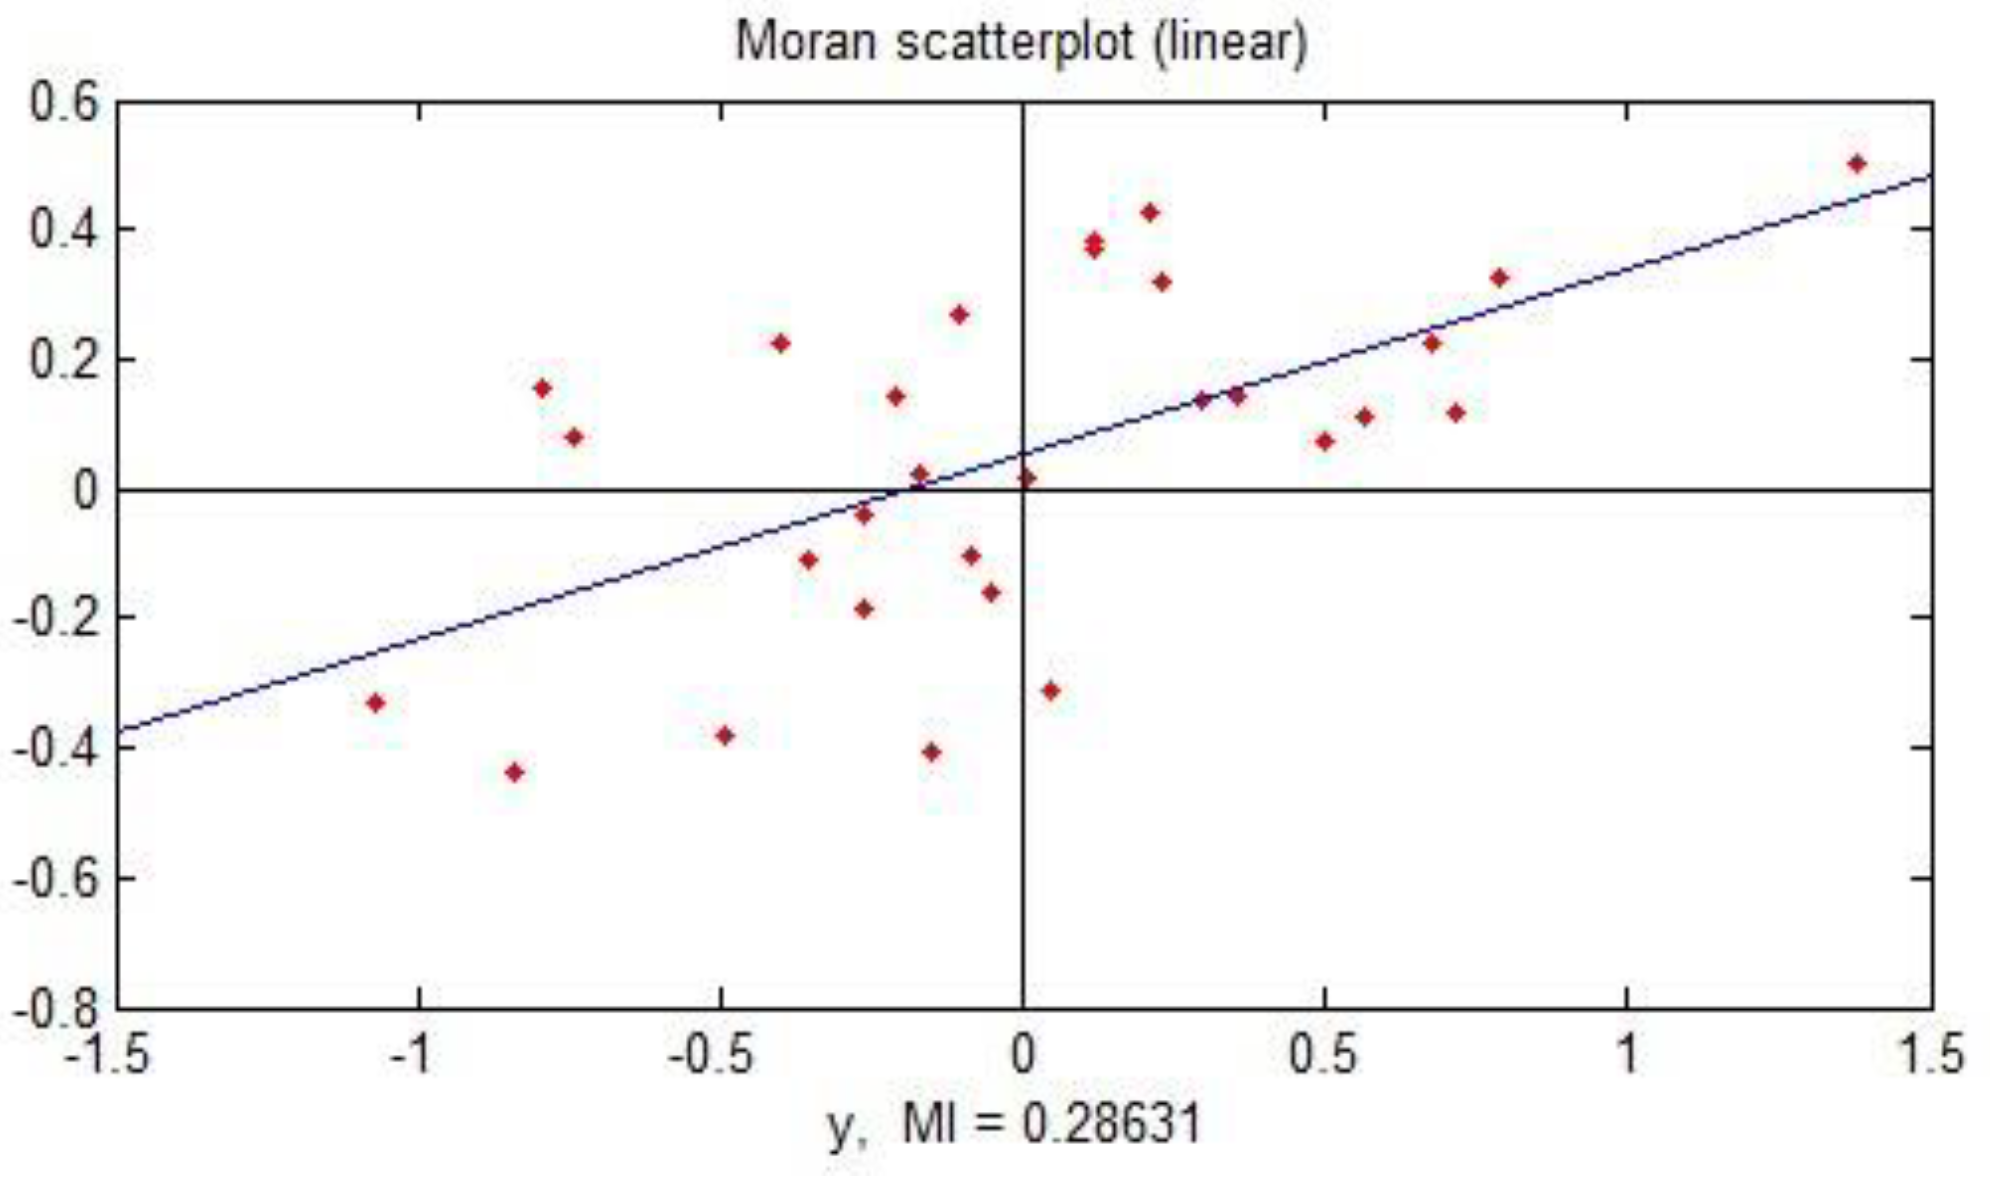
Figure 4.
Scatterplot of the local Moran’s I in 2018.
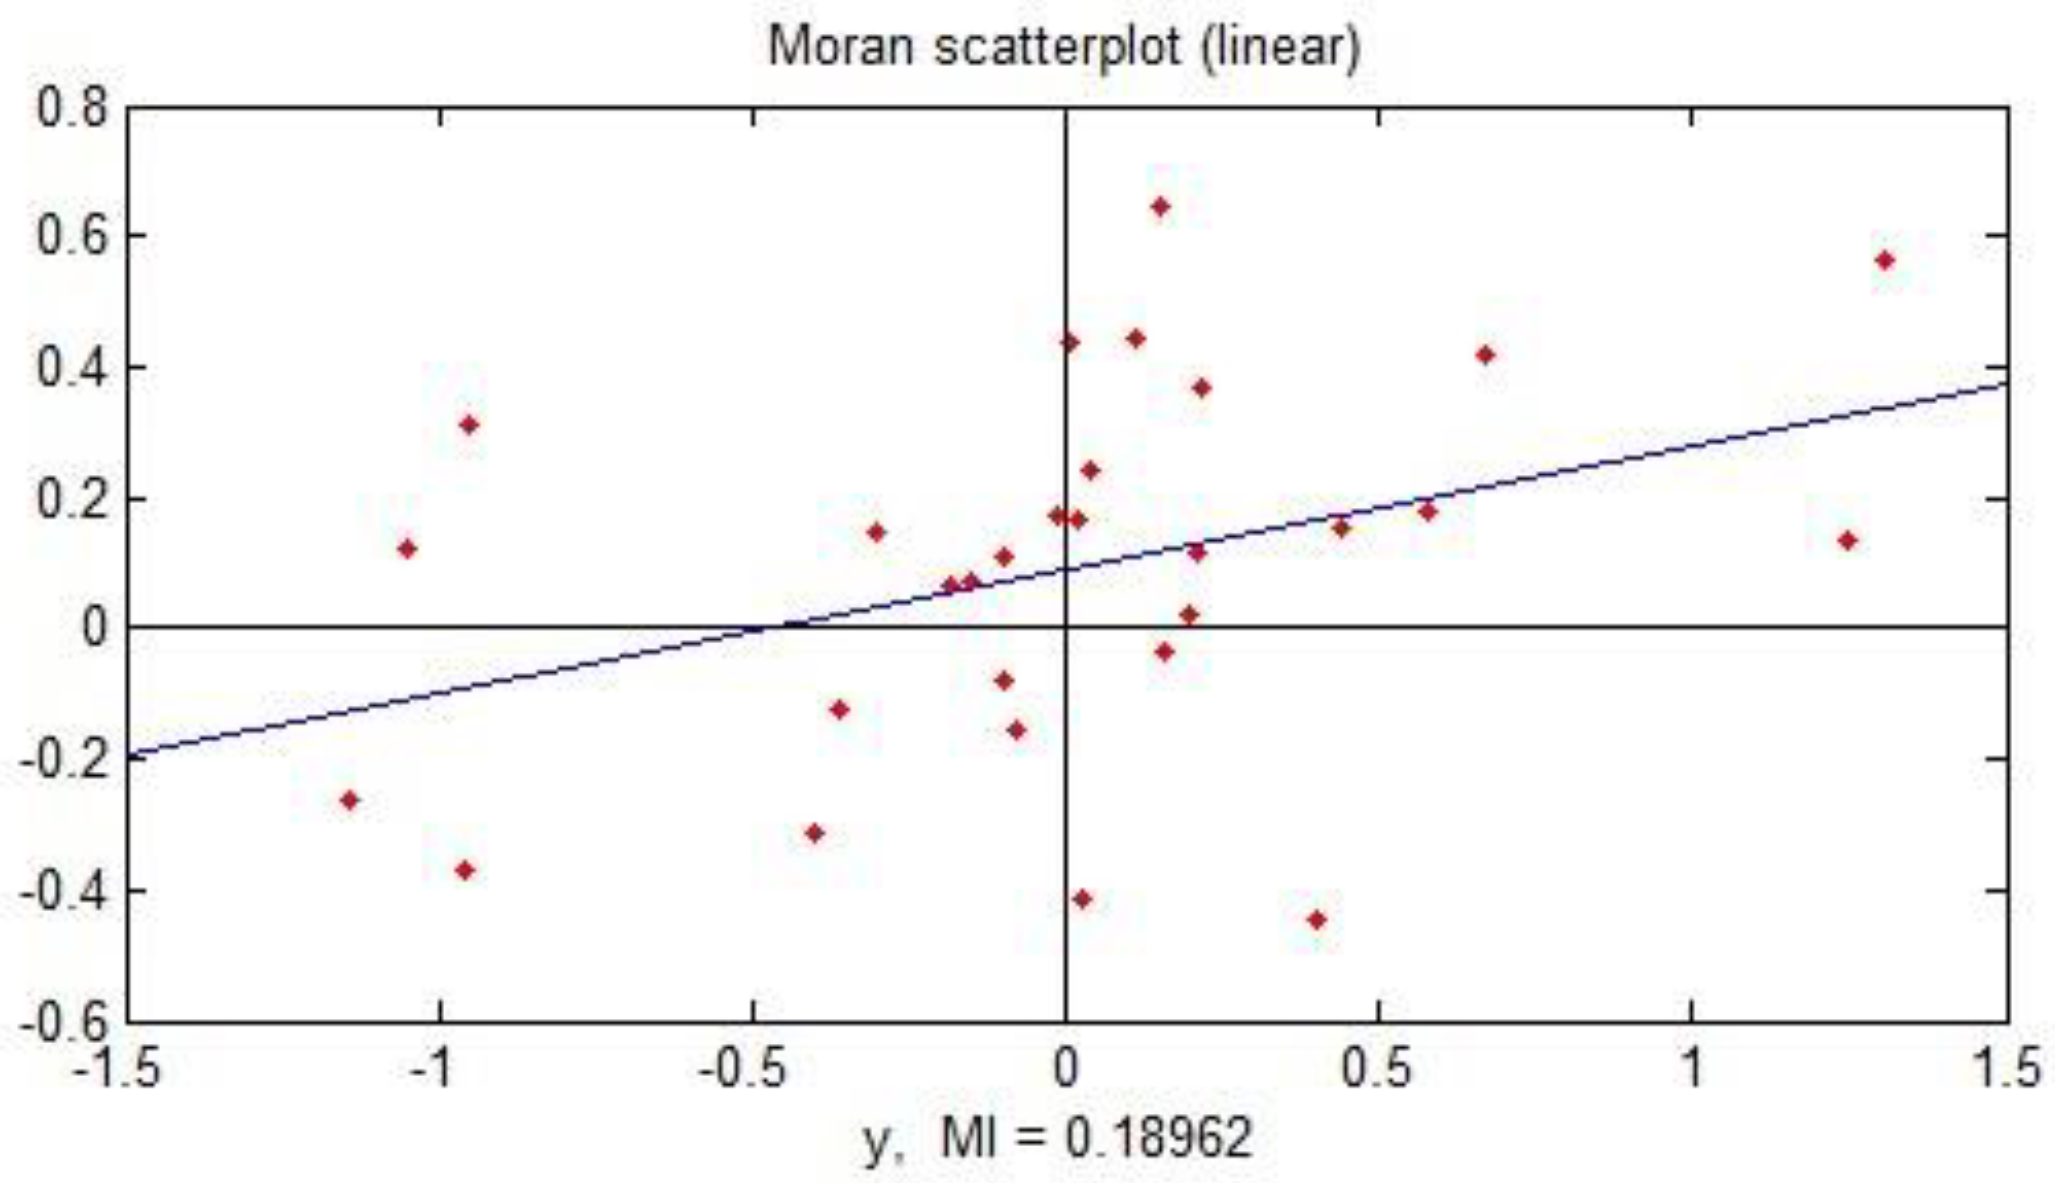
Figure 5.
Scatterplot of the local Moran’s I in 2019.

Figure 6.
Cluster map of the strength of environmental regulation in 2015.

Figure 7.
Cluster map of the strength of environmental regulation in 2016.
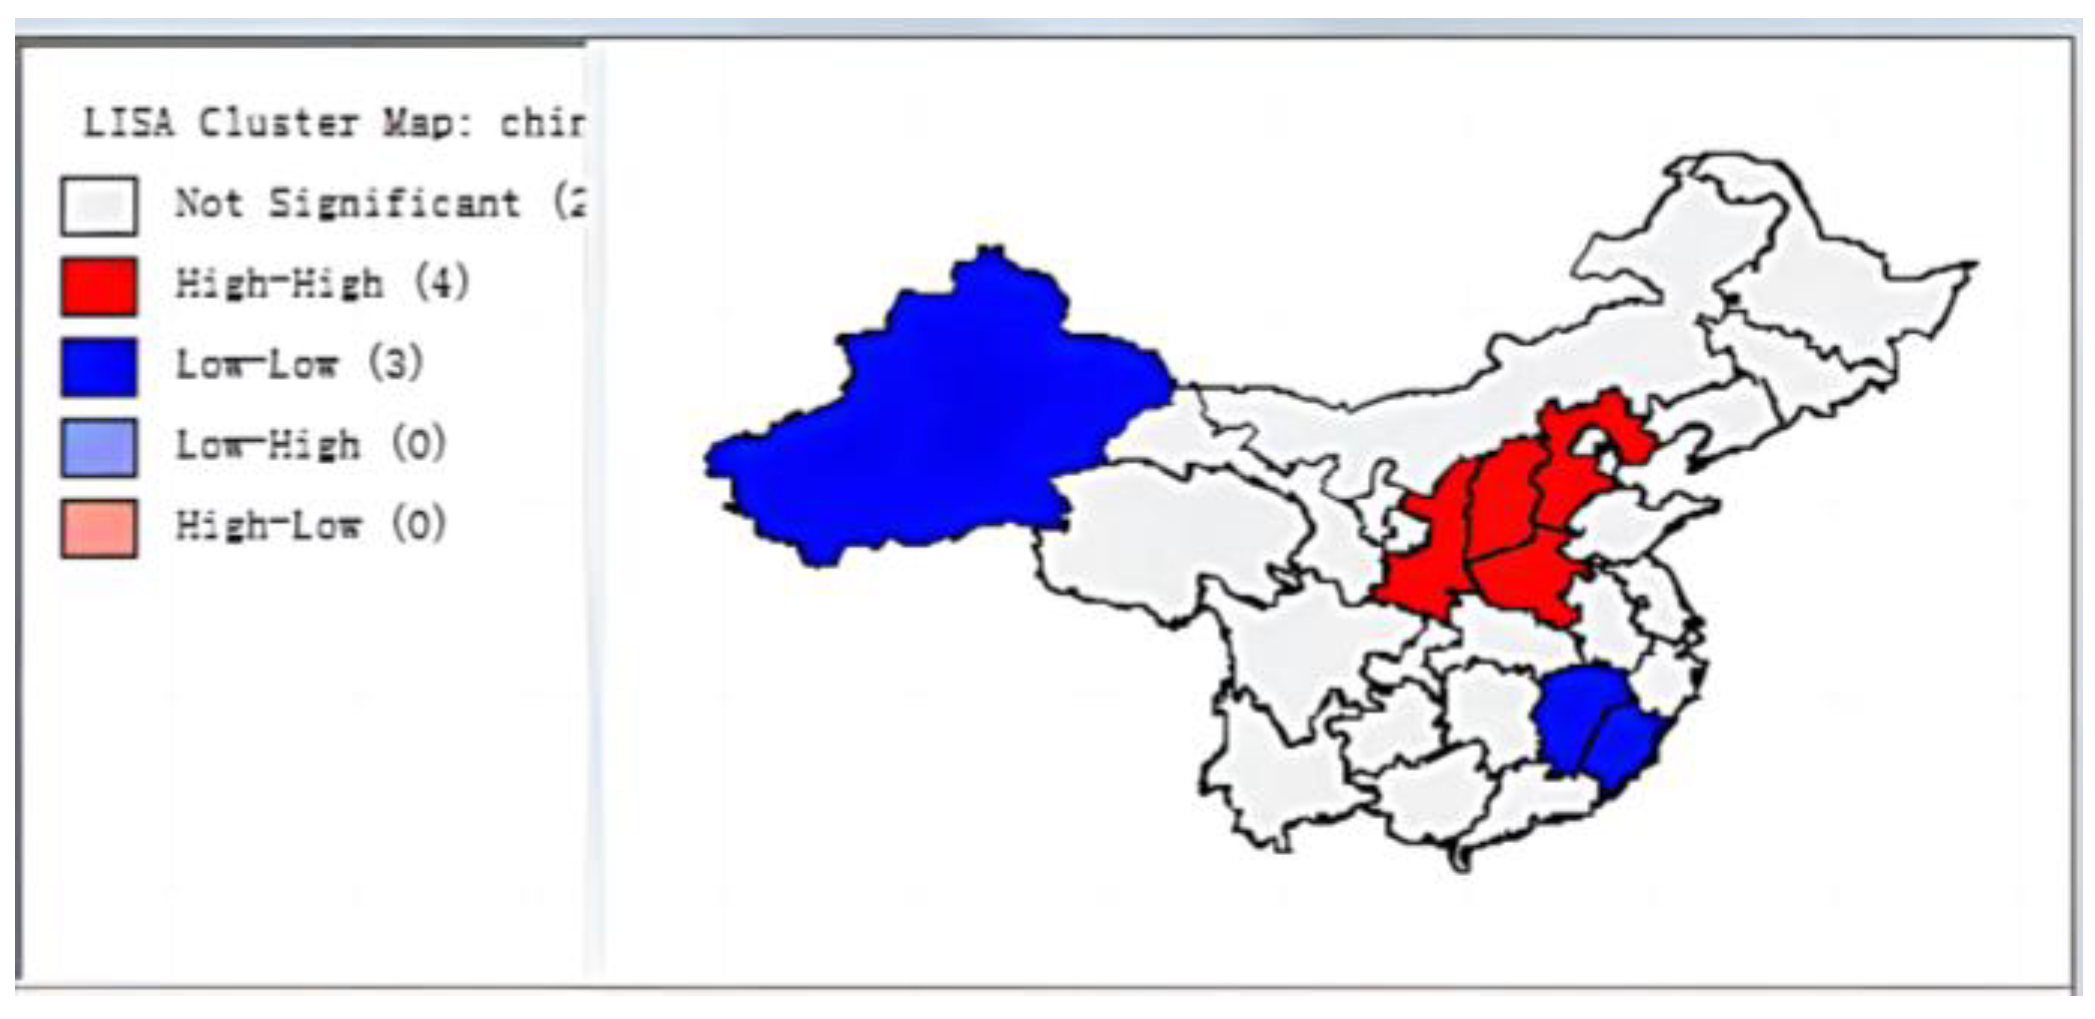
Figure 8.
Cluster map of the strength of environmental regulation in 2017.

Figure 9.
Cluster map of the strength of environmental regulation in 2018.
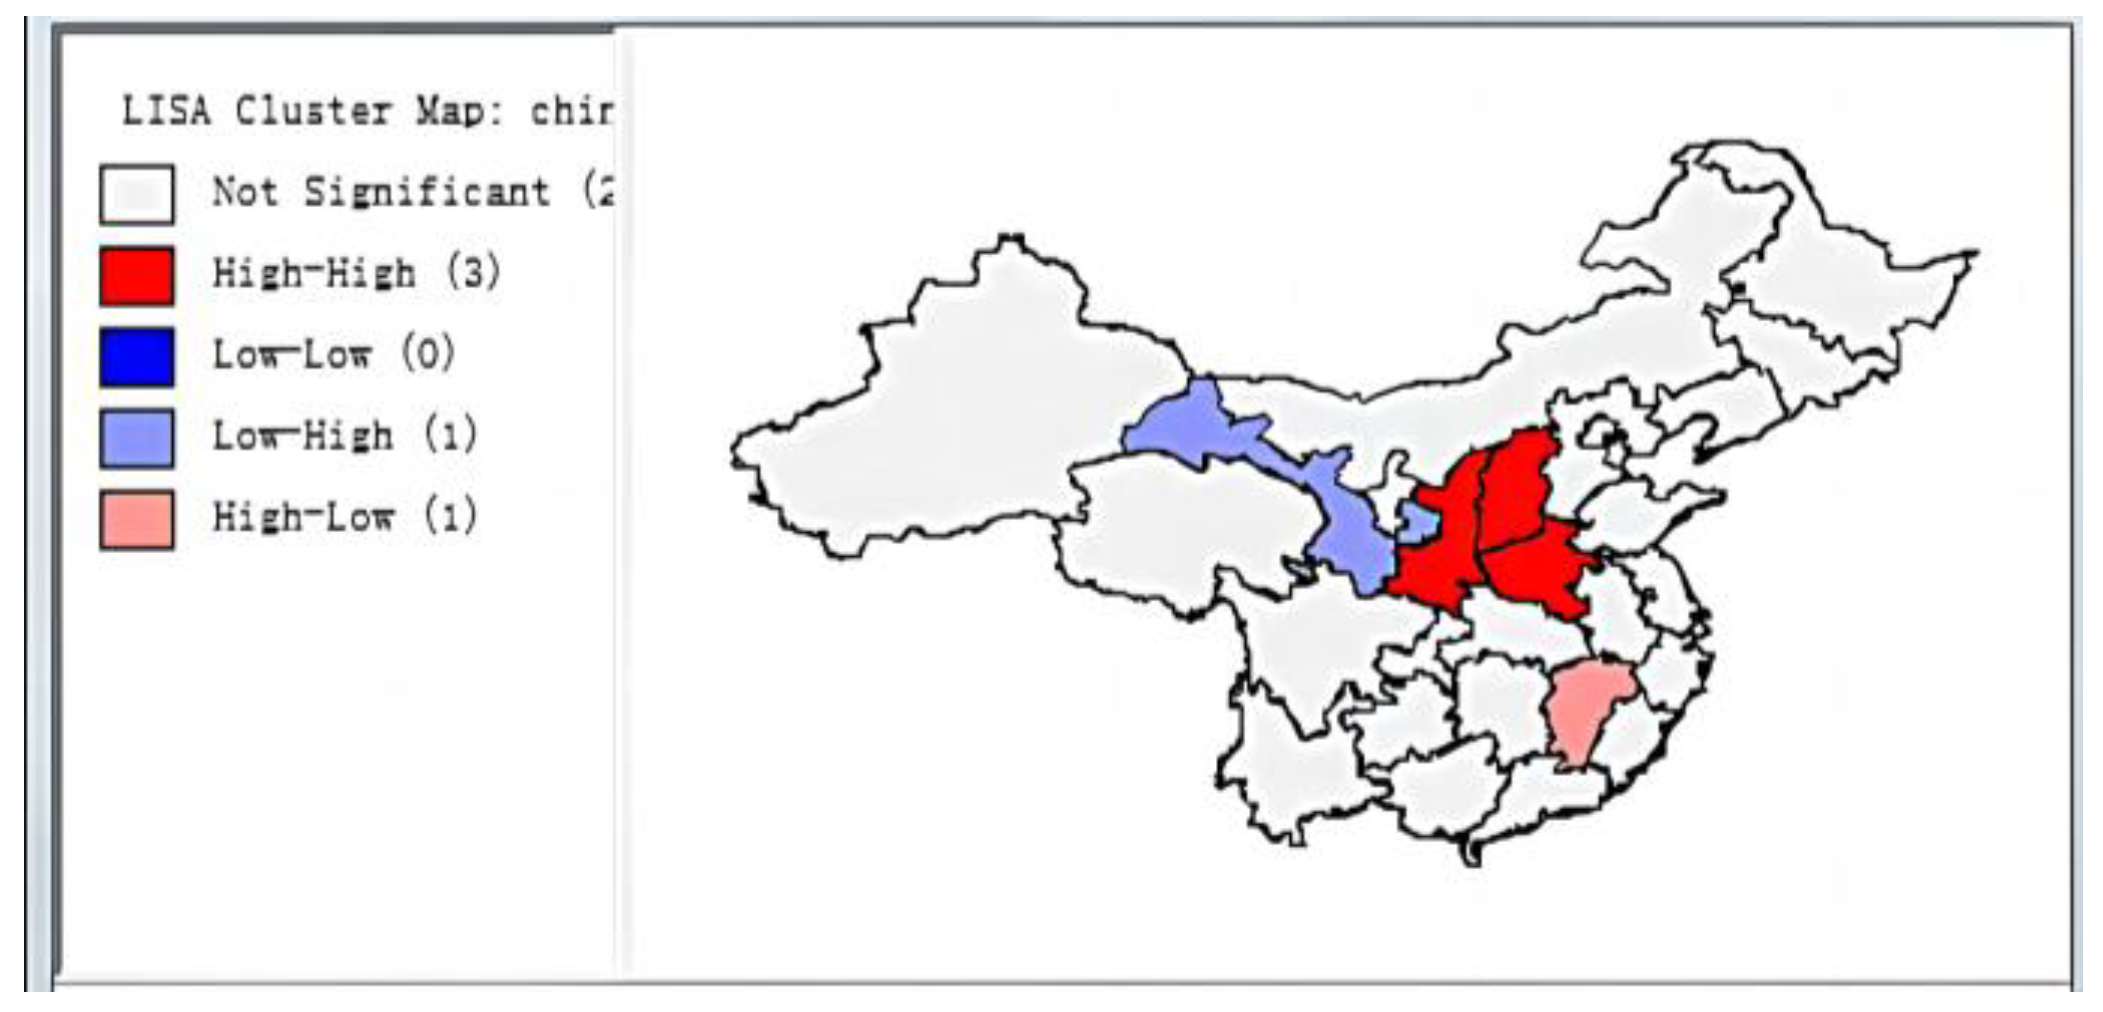
Figure 10.
Cluster map of the strength of environmental regulation in 2019.


Table 1.
The global Moran’s I of the strength of environmental regulation in 29 provinces in China from 2015 to 2019.
Table 1.
The global Moran’s I of the strength of environmental regulation in 29 provinces in China from 2015 to 2019.
| Year | 2015 | 2016 | 2017 | 2018 | 2019 |
|---|---|---|---|---|---|
| Moran’s I | 0.28 | 0.33 | 0.28 | 0.20 | 0.085 |
Table 2.
Comparison of the three estimation results of the regression models.
| Basic Panel Data Model | Spatial Lag Panel Data Model | Spatial Error Panel Data Model | ||||
| Model 1 | Model 2 | Model 3 | Model 4 | Model 5 | Model 6 | |
| Pooled OLS | Fixed effects ML estimation | Fixed effects ML estimation | Random effects ML estimation | Fixed effects ML estimation | Random effects ML estimation | |
| C | 0.260 | 3.749 | ||||
| 0.000 | 0.000 | |||||
| FD | −0.345 | −0.511 *** | −0.415 *** | 0.081 * | −0.529 *** | 0.108 |
| (0.823) | (0.000) | (0.002) | (0.216) | (0.000) | (0.160) | |
| LNGDP | 0.556 *** | 0.246 | 0.156 | 0.442 *** | 0.158 | 0.826 *** |
| (0.000) | (0.119) | (0.359) | (0.000) | (0.353) | (0.000) | |
| LETTER | 0.019 | 0.037 ** | 0.029 * | 0.709 *** | 0.039 ** | 0.029 |
| (0.000) | (0.021) | (0.100) | (0.269) | (0.052) | (0.156) | |
| LN PEOPLE | 0.087 *** | −2.300 ** | −2.363 ** | −0.096 | −2.455 ** | −0.157 ** |
| (0.006) | (0.015) | (0.019) | (0.212) | (0.025) | (0.044) | |
| LNFDI | 0.0275 | −0.2271 *** | −0.0545 | −0.257 | 0.00527 | −0.0880 |
| (0.267) | (0.082) | (0.6632) | (0.264) | (0.277) | (0.400) | |
| δ | 0.227 ** | 0.264 *** | ||||
| (0.023) | (0.000) | |||||
| λ | 0.213 ** | 0.171 | ||||
| (0.045) | (0.161) | |||||
| Rsquare | 0.209 | 0.471 | 0.853 | 0.798 | 0.846 | 0.772 |
***, **, and * denote 1%, 5%, and 10% significance levels, respectively.
Table 3.
Diagnostic test for spatial correlation.
| LM-Lag | Robust LM-Lag | LM-Error | Robust LM-Error |
|---|---|---|---|
| 4.442 | 2.56 | 2.565 | 0.683 |
| 0.035 | 0.01 | 0.109 | 0.409 |
Disclaimer/Publisher’s Note: The statements, opinions and data contained in all publications are solely those of the individual author(s) and contributor(s) and not of MDPI and/or the editor(s). MDPI and/or the editor(s) disclaim responsibility for any injury to people or property resulting from any ideas, methods, instructions or products referred to in the content. |
© 2023 by the authors. Licensee MDPI, Basel, Switzerland. This article is an open access article distributed under the terms and conditions of the Creative Commons Attribution (CC BY) license (https://creativecommons.org/licenses/by/4.0/).
Share and Cite
MDPI and ACS Style
Gao, H.; Li, F.; Zhang, J.; Sun, Y. A Study of the Strategic Interaction in Environmental Regulation Based on Spatial Effects. Systems 2023, 11, 62. https://doi.org/10.3390/systems11020062
AMA Style
Gao H, Li F, Zhang J, Sun Y. A Study of the Strategic Interaction in Environmental Regulation Based on Spatial Effects. Systems. 2023; 11(2):62. https://doi.org/10.3390/systems11020062
Chicago/Turabian StyleGao, Hewen, Fei Li, Jinhua Zhang, and Yu Sun. 2023. "A Study of the Strategic Interaction in Environmental Regulation Based on Spatial Effects" Systems 11, no. 2: 62. https://doi.org/10.3390/systems11020062
Note that from the first issue of 2016, this journal uses article numbers instead of page numbers. See further details here.