1. Introduction
This research focuses on how to combine scenario factors with previous technological innovation theories to solve manufacturing firms’ development problems. It has been widely accepted that technological innovation is a decisive factor in the development of a country, a region, or an organization to win strategic advantages, competitive advantages, or profit sources [
1]. Environmental sound technological innovation has become one of the hottest topics in recent years in manufacturing industries [
2]. Leading and driving development through green technological innovation has become an urgent requirement for manufacturing firms’ development [
3].
Meanwhile, the development of any firms, industries, and different countries is not isolated but is connected by a variety of complex related networks [
4]. Under the scenario of global climate change, green technological innovation is the objective of each manufacturing firm for future development on the base of the development of complex related networks [
5]. Previous research has conducted much research on the relationship between inter-firm social networks and innovation capabilities from both theoretical and empirical aspects [
6]. Related theories include structural hole theory [
7], weak correlation theory [
8], network centrality theory [
9], network effect theory [
10], open innovation theory [
11], and complex network theory [
12].
The cross-over studies of the inter-firm social network theory and green technological innovation, which consider the influence of scenario factors, can not only provide a deep understanding of the mechanism of internal and external factors affecting technological innovation, but also can shed light on the impact of inter-firm social networks on manufacturing firms’ performance. In addition, from the perspective of practice, the inter-firm social network structure and the coordination of internal and external resources could be optimized. However, there is still a lack of analysis for the linking of the scenario factors and the relationship between inter-firm social networks and different types of green technological innovation.
The main objectives of this study are as follows. First, this study aims to grasp the key impact factors of the scenario that affect the manufacturing firms’ technological innovation and to sort out the existing research on the summarizing of the concept of manufacturing scenario as an example. Second, this study aims to analyze the relationship between the key scenario factors faced by manufacturing industries, inter-firm social networks, and firms’ ambidexterity of technological innovation. Third, based on the results of previous studies and data we collected, a numerical simulation analysis is conducted to find out the optimal solution of the relationship between inter-firm social networks and innovation capability in the Chinese auto manufacturing industry.
The possible contribution of this research is as follows. First, through a comprehensive refinement of key scenario factors, this study summarized three aspects of scenario factors faced by manufacturing industries: institutional scenario, economic scenario, and cultural and environmental scenario. Second, a multi-objective programming simulation model, which considers profit maximizing, inter-firm social network benefits, equilibrium of the ambidexterity innovation, and green technological innovation, is established. Third, the results of this study provide a theoretical basis for manufacturing firms to make their social network strategies to achieve green technological innovation and for the government to achieve policy goals by affecting inter-firm social networks.
The content of the remainder of this study is arranged as follows:
Section 2 analyzes the meaning of scenario factors faced by manufacturing industries, inter-firm social networks, and ambidexterity green technological innovation through literature reviews.
Section 3 describes the research design.
Section 4 gives the mathematical and technical route of the simulation model.
Section 5 describes the results of the numerical simulation.
Section 6 discusses the results and
Section 7 summarizes the conclusion of this study.
2. Literature Review
2.1. Manufacturing Scenario Factors
Previous studies have analyzed the connotation of scenario factors from different perspectives. We summarized all the related literature about scenarios faced by manufacturing industries in studies of technological innovation which we can get. From the view of the content of the scenario, it can be divided into the institutional scenario, economic scenario, and cultural environmental scenario.
First, researchers from the perspective of institutional scenario believe that the manufacturing scenario has the following characteristics: (1) There is an environmental protection system that emphasizes energy conservation, emission reduction, energy tax, and carbon tax in terms of the environmental system [
13]; (2) From the perspective of the institutional environment, manufacturing industries have characteristics of the incompleteness of policies, inter-regional institutional heterogeneous, and institutional uncertainty [
14]; (3) The role of government is a dilemma for the development of manufacturing industries [
15].
Second, from the perspective of the economic scenario, the research shows that the main characteristics of the global economic scenario faced by manufacturing industries are as follows: (1) The manufacturing industries is in a transition period from traditional production systems to a new system with more high-technologies and more environmentally sound [
16]. In this process, there is a relatively large gap between developing and developed countries in firms’ technological innovation capabilities [
17]; (2) The organizational network in the manufacturing scenario is unbounded in the supply chain cooperation [
18]. With the deep integration of global competition, the green technological transition is the main challenge for the continued development of economic development [
19].
Third, from the perspective of cultural and environmental scenarios, the main characteristic of the current cultural and environmental scenario faced by manufacturing industries are (1) Information technology is fully infiltrated, and informatization is the core of the technological system changes [
20]; (2) Cultural integration and exchange are conducive to the innovation and development of the manufacturing industry [
21].
The direction of future expected scenarios faced by manufacturing industries mainly includes: The requirements for (1) ambidexterity development of organizations in the manufacturing scenario [
22]; (2) improving network capabilities [
23]; (3) global integration [
24]; (4) business model innovation [
25]; (5) innovative entrepreneurship and the social responsibility of manufacturing firms [
26]; (6) the energy efficiency improvement and low carbonization [
27]; and (7) open innovation [
28].
2.2. Inter-Firm Social Networks
The concept of the social network was first created in the study of sociology [
8]. Researchers treat various subjects (such as a single person, firm, or other organization) as players [
7]. Due to the relationship of contracts or cooperation between firms, they can exchange information and resources so that there is a wide network of relationships between firms. Each firm’s network constitutes the firm’s third type of capital, which is social capital [
29]. A whole firm’s social network with structural characteristics, cognitive characteristics, and relationship characteristics is also formed by all firm’s networks [
7]. From the broadest perspective, since a single firm is both a node in the social network and a set of multiple natural individuals, which also can be nodes in the social network, hence, the broad meaning of the firm social network includes the relationship of intra-firm and inter-firm. Both social networks have made certain progress in current research [
6]. To reduce the complexity of the study, this study uses a narrow concept of the social network, that is, the inter-firm social network. The network between firms and firms, the network between firms and universities or scientific research institutions, the network between firms and intermediaries, and the network between firms and customers are the main constituent units and structures of this narrowly defined inter-firm social network [
30].
Although the same emphasis is placed on interrelationships between organizations, there are differences in the concepts of clusters and inter-firm social networks. The concept of clusters mainly comes from economic literature [
31] especially related to spatial geography. The concept of social networks mainly comes from sociological literature [
32]. The clusters emphasized the returns to scale within a region [
33]. The social network emphasized the type of linkage and its benefits. The nature of the cluster is the agglomeration and “open membership”, which means substituting the formal structures or strong long-term relations with the local resource pool [
34]. However, there is nothing inherently spatial about the social network because of its “path dependence” for one actor [
6]. In this study, the relationship that brings benefits to the firm is not limited to the association caused by geographical location, but also the structure of its connection, so we use social networks instead of clusters.
2.3. Ambidexterity Green Technological Innovation
After the ‘Earth Summit’, which was held in Rio de Janeiro, Brazil in 1992, a series of notions related to a green and sustainable economy attracted attention from both scholars and practitioners [
35], such as bio-economy [
36], industrial ecology [
37], circular economy [
38], and cleaner production [
39]. In this study, we define green technological innovation as technological innovation, which is environmentally sound and can be used to support the transition toward sustainability [
2]. The factors that drive the firm’s green technological innovation include both internal and external factors [
40]. The scene outside the firm provides a firm with a platform and environment for cooperation, competition, or supply and demand relationships with customers, suppliers, distributors, manufacturers, universities, or intermediaries [
41]. When embedding in social networks, on the one hand, firms can collect market intelligence information, which provides the basis for the direction of innovation of the products or services [
42]. On the other hand, the firm can make use of not-here inventions or the extroverted marketization of idle technology through open innovation. Through the influence of these two aspects, firms can absorb and integrate external knowledge and resources, which is conducive to the improvement of green technological innovation [
43].
Specifically, the scenario of institutional, economic, and cultural environmental faced by manufacturing firms have a certain impact on the results of social network characteristics and green technological innovation, e.g., Zhou, et al. [
44] found that the government social capital of TMT is positively related to firms’ innovation performance and firms’ network prestige plays a mediating role in this relationship. Mansell [
45] found that research concerning changes in the techno-economic paradigm cautioned that assessments of these changes needed to go beyond market dynamics to examine social, cultural, and political issues.
It can be found that previous research on the firm’s green technological innovation in the manicuring scenario has analyzed the use of internal and external knowledge and resources, as well as the openness and exploratory nature of innovation from their respective perspectives. Therefore, the ambidexterity green technological innovation of firms is a critical perspective that studied the key factors to innovation in the manufacturing scenario [
46]. Therefore, the ambidexterity-balanced and green innovation capability is the future pursuit of the manufacturing scenario in the field of technological innovation. The research on the law of a firm’s social network and its impact on the ambidexterity green innovation capability has significance in both theoretical and practical aspects.
3. Research Design
Due to the lack of consideration of scenario factors, previous research on the relationship between manufacturing inter-firm social networks and green technological innovation capabilities is usually aimed at various factors inner firm. The typical research paradigm is to regard the firm’s social network as the cause variable and the firm’s technological innovation as the result variable. Then, the other properties are used as intermediate variables in these research models [
9]. Related research methods of previous research usually include parametric methods and non-parametric methods. Parametric methods mainly include econometric models [
47], stochastic frontier analysis [
48], and multiple regression analysis [
49]. Non-parametric methods mainly include game-theory-based analysis [
50], DEA analysis [
51], and qualitative research [
52].
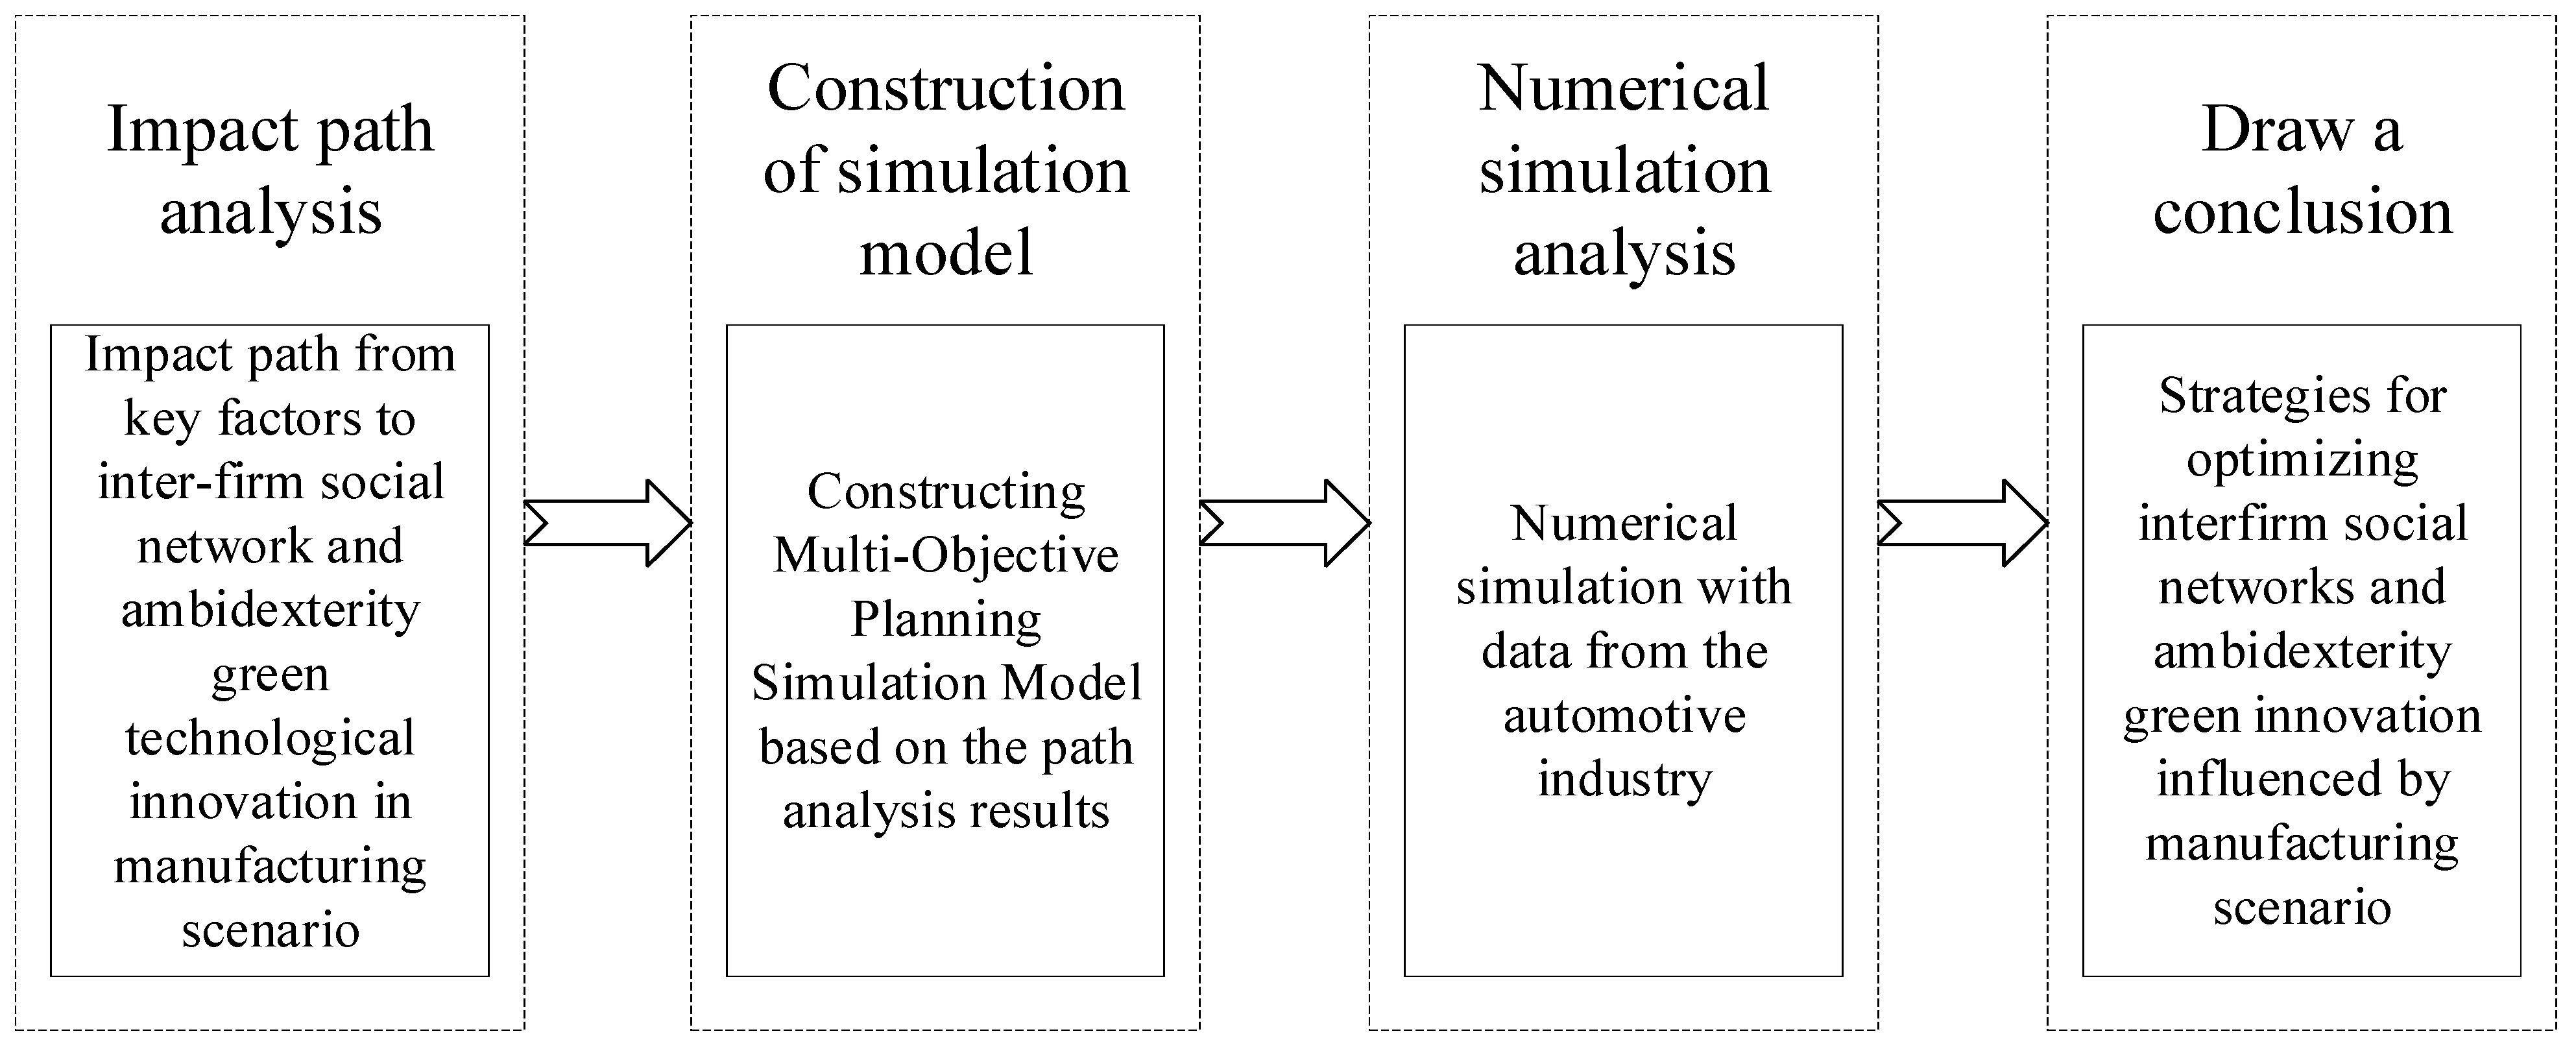
One of the contributions of this study is that the manufacturing scenario factors’ consideration in the relationship between inter-firm social networks and ambidexterity green technological innovation. The research object goes beyond the boundaries of the firm. Hence that the inter-firm social network is not only the main independent variable but also an intermediate variable between scenario factors and ambidexterity green technological innovation. In addition, in the relationship system of related variables, not only the ambidexterity green technological innovation of the firm is the object of optimization, but also the firm’s social network. Moreover, scenario factors put forward directional requirements for the optimization of the two factors. These characteristics require that the research design of this study must satisfy not only the logical relationship between the variables in the model but also the synergy of optimization of the variables. Therefore, this study adopts a multi-objective planning simulation method combined with qualitative analysis methods. The specific research framework and implementation route are shown in
Figure 1.
To address the question of the optimization strategy of the relationship between inter-firm social networks and the firm’s ambidexterity green technological innovation in the manufacturing scenario, this research designed the following research framework and technical route (as shown in
Figure 1).
First, based on a review of past research, the key factors that affect ambidexterity green technological innovation in the manufacturing scenario were clarified, and a diagram of the path of influence was drawn. This stage mainly adopts the method of subjective qualitative data analysis, that is, sorting and coding the related research in the past, and deriving the influence path relationship mechanism between various variables [
53].
Second, based on the results of path analysis, this study built a simulation model. Since there are many requirements for the development of the firm’s innovation capabilities, this study built a multi-objective planning simulation model. The establishment of the goal system is based on the economic output of ambidexterity green technological innovation. Referring to past technological innovation models, we regard maximizing benefits as the basic objective. Then, combining the relationship between the scenario factors, the inter-firm social network, and the firm’s innovation capability, we established the ambidexterity innovation objective, the objective of minimizing environmental pollution, and the social network benefit objective.
Third, based on the measurement results of the relationship between the influencing factors in the past research and the real data of the auto industry companies in China, specific numerical simulations are carried out. We collected and used the results of previous research on the relationship between variables in the Chinese auto industry as simulation data so that the experiment fits the manufacturing scenario.
Fourth, this study concludes and puts forward strategic recommendations to optimize inter-firm social networks and the firm’s ambidexterity green technological innovation under the influence of key factors in the manufacturing scenario.
4. Path Analysis and Simulation Model Setting
4.1. Inter-Firm Social Network Benefit Objective
4.1.1. Path Analysis
Manufacturing scenario factors of the cultural environment require firms to pursue more favorable social network positions. First, the production system of modern manufacturing has always emphasized cooperation and exchange domestically and overseas through collaboration between industry, universities, and research institutes and supply chain collaboration [
54]. This system has achieved significant performance. Therefore, the knowledge environment, knowledge sharing level, and relationship network construction are important situational factors that influence the technological innovation of manufacturing firms [
55]. Second, the increasing attention to absorptive capacity, social network theory, and open innovation theory shows the importance of organizational cross-border cooperation behavior for technological innovation [
52]. The formation of innovation in the manufacturing scenario is highly dependent on the relationship between the organization and other organizations, such as governments, suppliers, customers, and universities [
47]. Therefore, the construction of the national innovation system will affect the level of innovation capabilities of manufacturing enterprises.
4.1.2. Objective Function
In a manufacturing scenario, the knowledge-sharing environment, relational network, and national innovation system make the social network benefits generated able to be divided into direct social network benefits and indirect social network benefits. Further, the level of social network benefits is affected by the absorptive capacity. Therefore, there are the following objective functions:
where the variables in capital letters all represent
n-th order column vectors,
t represents the period in which the variable in. At the
t-th period,
represents the social network efficiency of firms;
represents the scale of the direct link of the firm at the
i-th time-lag order;
represents the coefficient of the influence of the direct social network scale on the total social network benefit at the
i-th time-lag order.
refers to the scale of the indirect link of the firm at the
i-th time-lag order;
represents the coefficients of the influence of the indirect social network scale on the total social network benefit at the
i-th time-lag order. The objective of limiting conditions include:
where
and
represent the influence level of the input for the social network on the scale of the direct social network and indirect social network, respectively.
represents the available resources of the firm for the development of social networks during
t-th period.
4.2. Balance of the Ambidexterity Technological Innovation Objective
4.2.1. Path Analysis
Manufacturing scenario factors of economics require firms to pursue a balance of ambidexterity and technological innovation. The development of manufacturing firms’ technological innovation has certain characteristics. On the one hand, technological innovation development in manufacturing industries relies on learning from the experience of other players, which means there is a norm of imitating innovation [
56]. On the other hand, the development of high-tech industries and emerging industries emphasizes the disruptive innovation strategy [
57]. These scenario factors have formed the current situation of the co-existence of incremental innovation and breakthrough innovation [
41]. Therefore, manufacturing technological innovation has the objective of the balance of ambidexterity innovation. The resources must be balanced between the levels of two types of innovation [
22].
4.2.2. Objective Function
This study sets the ambidexterity innovation as product innovation and production technology innovation. At the same time, according to past research, indirect social network effects mainly affect breakthrough innovation, and direct social network effects mainly affect progressive innovation. The objective of the balanced ambidexterity innovation could be expressed by the following:
where
and
represent the benefit of production technological innovation and product innovation at time
t, respectively.
and
represent the input of production technological innovation and product innovation at the
i-th lag order of time
t, respectively.
and
represent the patents increasing because of the production technological innovation and its price effect, respectively.
and
represent the patents increasing because of product innovation and its yield effect, respectively.
4.3. Objective of Minimizing Environmental Pollution
4.3.1. Path Analysis
Manufacturing scenario factors of the institution require firms to pursue the objective of minimizing environmental pollution. First, the world is currently facing various severe environmental problems. An environmentally sustainable system that pulls and pushes the green technological innovation of firms in manufacturing is necessary [
5]. Second, as many countries’ governments increasingly emphasize ecological and environmental civilization, society and the market are increasingly encouraging the firm’s behavior of green innovation and social responsibility innovation [
16]. Therefore, the cultural environment of the firms’ ethical environment will also affect the manufacturing industries’ innovative behavior.
4.3.2. Objective Function
Therefore, in the ambidexterity context of policy pressure and social ethical incentives, manufacturing enterprises have an environmental pollution minimization objective:
where
represents the actual emission cost of the firm during the
t-th period.
represents the pollution cost per unit product at the 1 order lag of time
t.
represents the output of the firm.
and
represent the number of patents increased per unit of emission reduction input and the emission cost reduction per patent can save, respectively.
4.4. The Objective Function of Profit Maximization
4.4.1. Path Analysis
In the research on technological innovation, product orientation is accepted by most researchers [
58]. In the socialist market economic system, innovation emphasizes market-oriented competition. Hence that product orientation and market orientation are also important guiding factors for the development of innovation capabilities of manufacturing firms [
59].
4.4.2. Objective Function
In this situation, manufacturing firms have the objective of maximizing profits. This study sets the income of a firm as the product of output and product price. The above analysis reflects that the firm’s input includes product R&D investment, production technology innovation investment, and emission reduction technology investment. In addition, the firm’s cost should also include the production cost per unit of product taxes payable, so the objective function of profit maximization is:
where
represents the firm’s income.
means the revenue of the firm. At the same time, since the input in period
t often depends on the income of the previous period, hence that this study set the following equation:
where
,
,
, and
represent the ratio of the cost of production, the input of product technology innovation, the input of product innovation, and input of pollution control technologies in total income in the
t − 1 period.
5. Numerical Simulation Based on the Chinese Automobile Industry
5.1. Data Description and Initial Values
This study selects the firms’ data of the automobile industry among Chinese listed companies for the simulation. In the automobile manufacturing category (by the WIND industry classification) listed on the Chinese A-share market, we found that there are 16 firms whose main products in the past three years are completed vehicle businesses. These firms including Jiangling Motors Co., Changan Automobile Co., FAW Car Co., FAW Xiali Automobile Co., BYD Co., Dongfeng Motor Co., SAIC Motor Co., FOTON Co., Jianghuai Automobile Co., King Long Motor Co., Sokon Industry Group Stock Co., Guangzhou Automobile Group Co., Great Wall Motor Co., and Lifan Industry Co. The data of these firms are used as the basis for numerical simulation to set the initial values. At the same time, three companies, FAW Xiali Automobile Co., Dongfeng Motor Co., and Lifan Industry Co., whose output and sales have been declining in 2016–2018 were selected as the key analysis objects. The measurement methods and collected data of each variable are shown in
Table 1.
5.2. Numerical Simulation Results
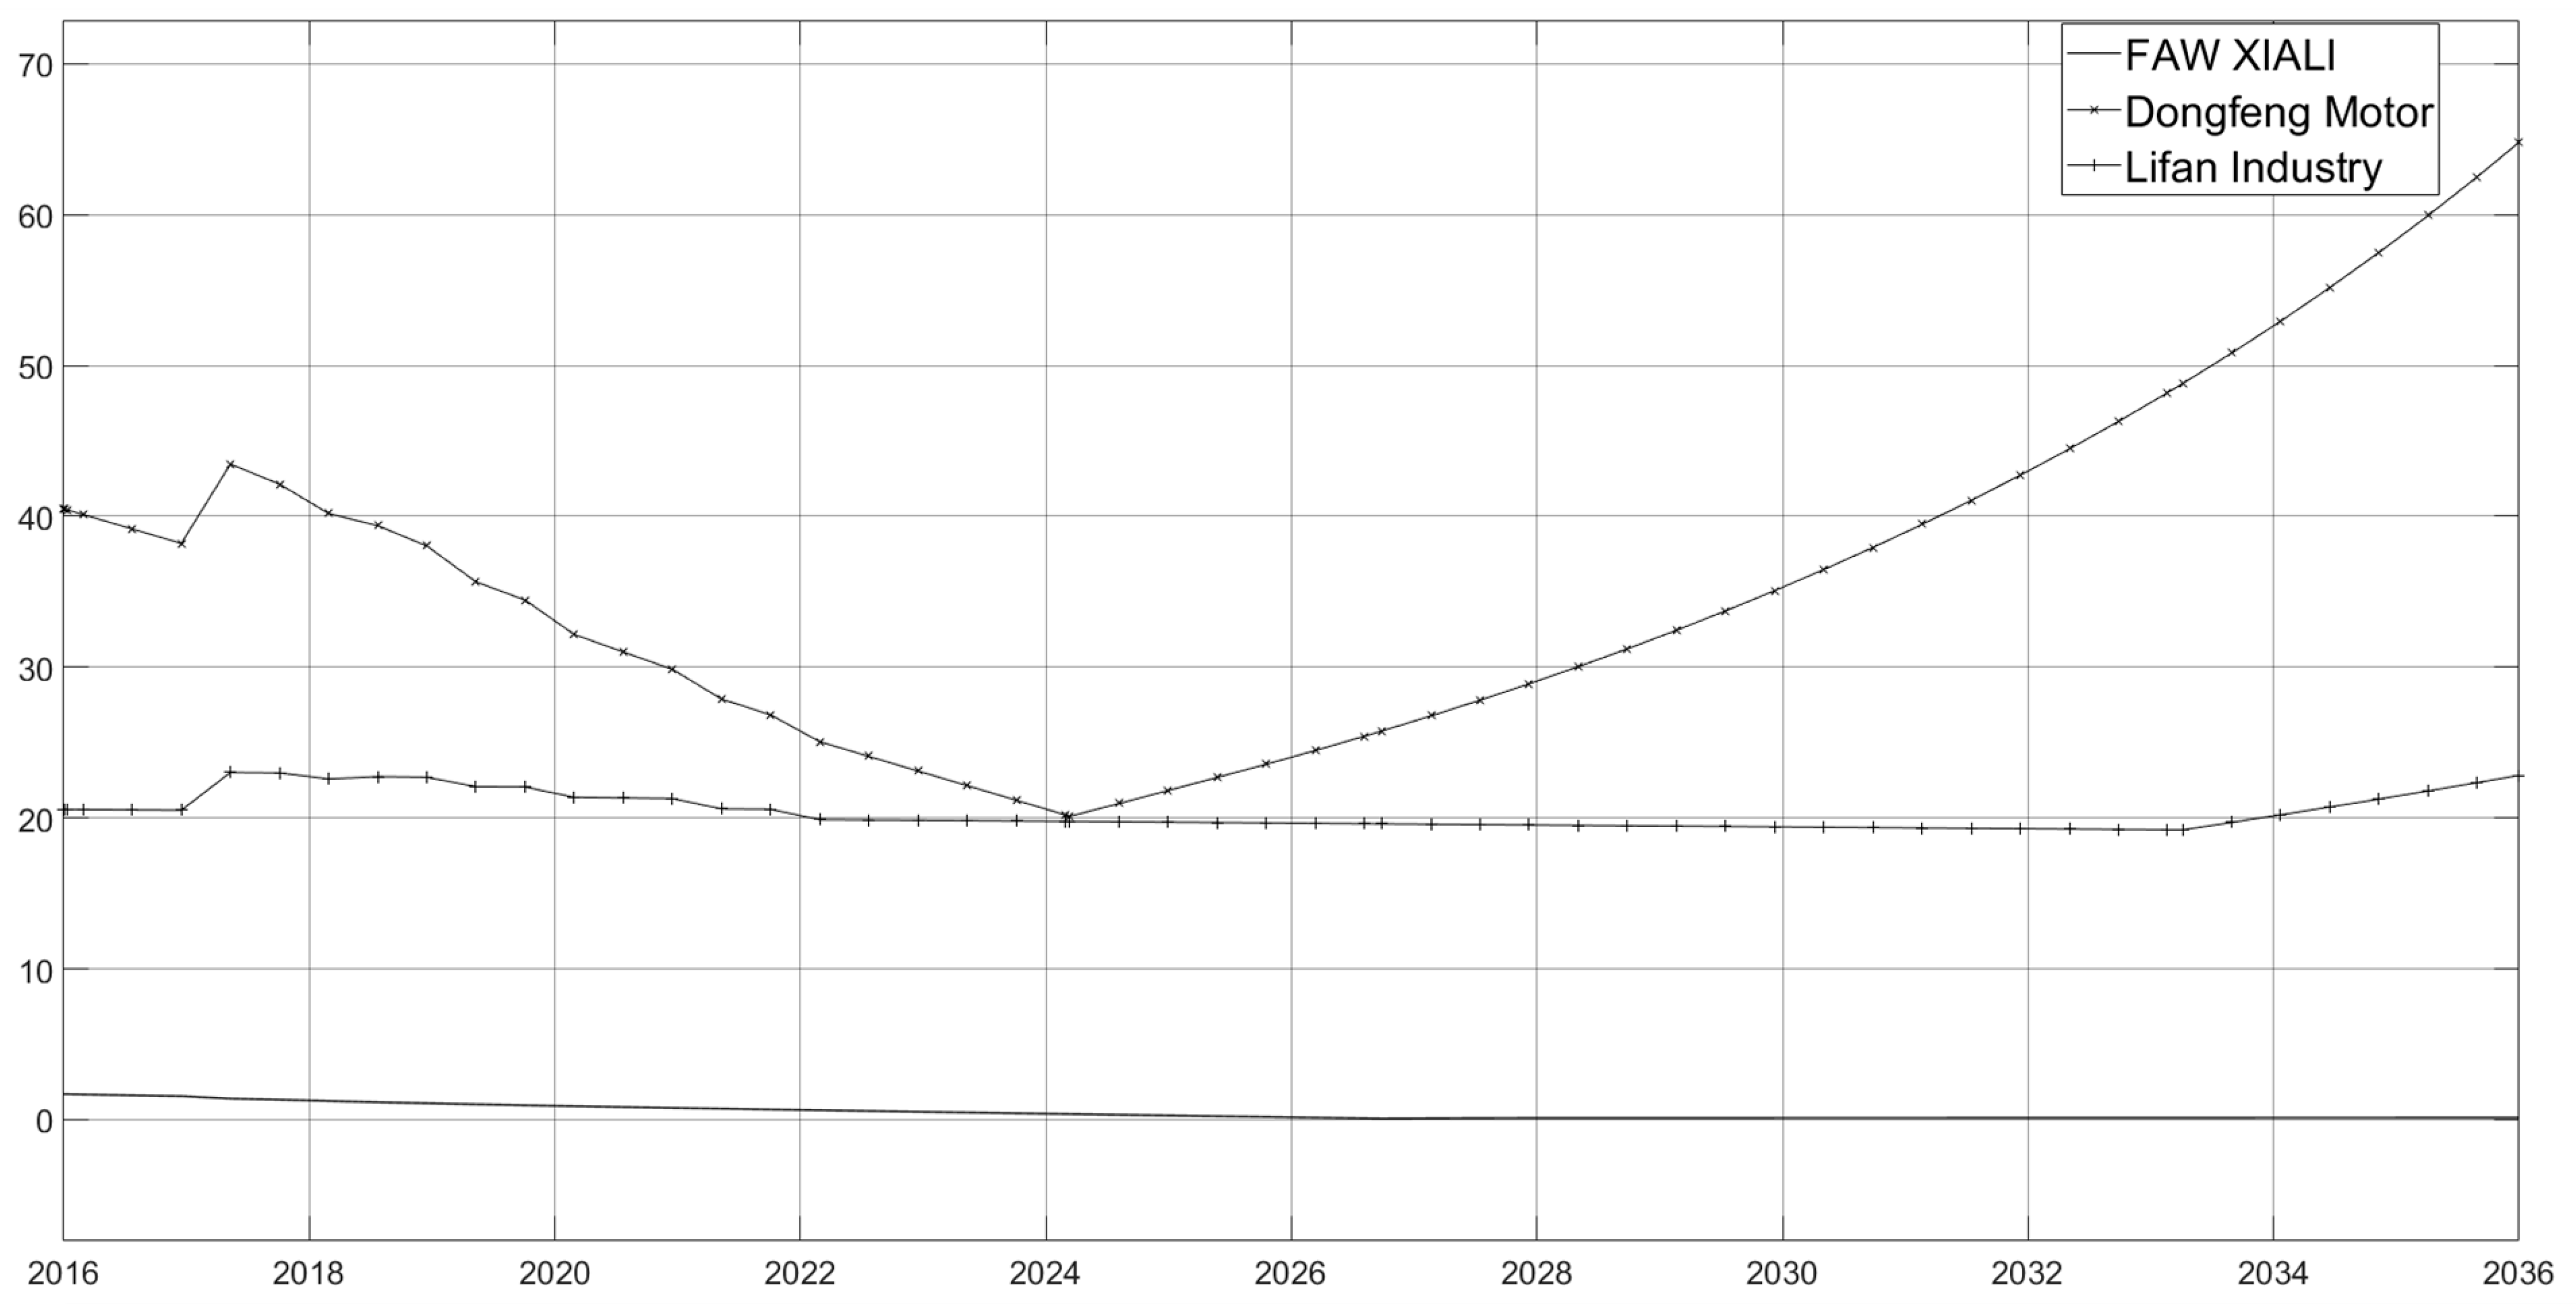
5.2.1. Firms’ Profit Evolution without R&D
Some Chinese auto companies are currently facing both sales and price decline pressure. In the case of the price and sales volume decreasing with the average decline rate of 2015–2016 and operating costs remaining unchanged without innovation input changing, the simulation flowchart is shown in
Figure A1. The simulation results are shown in
Figure 2.
Figure 2 shows that the declining trend of FAW Xiali, Dongfeng Motor, and Lifan in 10 years is more obvious, and the companies face huge problems in sustainable development.
5.2.2. Incremental Innovation Capability Enhanced
To reverse the decline, based on the analysis in the above chapters, consider the firm using a certain proportion of R&D investment to improve its product technology innovation capability. First, based on the industry’s average R&D investment level (2.4118 percent of income), the number of patents increased per 100 million yuan of investment (100, past research results), and the average sales growth per patent (500, according to the motor industry data calculation), and the sales increase value that each patent may bring is used as the sensitivity analysis variable. The simulation flowchart is shown in
Figure A2. As shown in
Figure 3, when the sales increase of each patent is 100, the profits of the three companies have improved in the short term, but they still cannot recover the decline in the long term.
5.2.3. Product Innovation Capability Enhanced
To solve the problem of long-term decline, consider that the enterprise will invest a certain amount of R&D expenses to develop new products. Similarly, set the initial value of the industry’s average R&D investment level, the increasing number of patents per 100-million-yuan investment, and the average price increase brought by each patent as 2.4118 percentage of income, 100 and 22.099 million CNY (calculated based on data from the automotive industry). The simulation flowchart is shown in
Figure A3. The simulation results are shown in
Figure 4. It can be seen that when companies are pursuing product innovation capabilities, for Dongfeng Motor and Lifan Industry co., firms’ profits will decline in the short term, but will rise after reaching the lowest point. However, for FAW Xiali, due to its obvious downward trend in recent years, it is difficult to turn the crisis into a safe situation within the predictable range under the current industry’s average product innovation capability input.
5.2.4. Considering Social Networks Effect and Ambidexterity Innovation
Based on previous research, the increase in business reputation and intangible assets can be used as a driving force for the increase of inter-firm social networks, the degree of centrality influences production technology innovation capability, and the betweenness centrality influences product innovation capability. According to the calculation of the automobile industry data, the average increase rate of business reputation and intangible assets is 0.172279, the degree centrality increase from a 100-million-yuan business reputation is 1.697282, and the betweenness centrality increase per 100 million yuan is −0.00055. The lag effect of the degree and betweenness centrality is derived from the calculation results in past studies. The simulation flowchart is shown in
Figure A4. The results are shown in
Figure 5 and
Figure 6. As can be seen from
Figure 6, under the current average level of social network structure in the industry, automotive industry companies are more affected by indirect networks, corresponding to the current overall downward trend in the automotive industry, companies are looking for breakthrough technological changes and innovations. According to the simulation analysis of this study, if reasonable R&D investment can be made according to the industry average, as shown in
Figure 5, with the increase in the proportion of breakthrough innovation investment, Dongfeng Motor and Lifan will have a manager’s performance under the current technical framework. The process of rising first and then descending, and then undergoing a new period of rapid growth due to product upgrades. However, FAW Xiali’s investment in R&D at the current industry average level still cannot restore the decline.
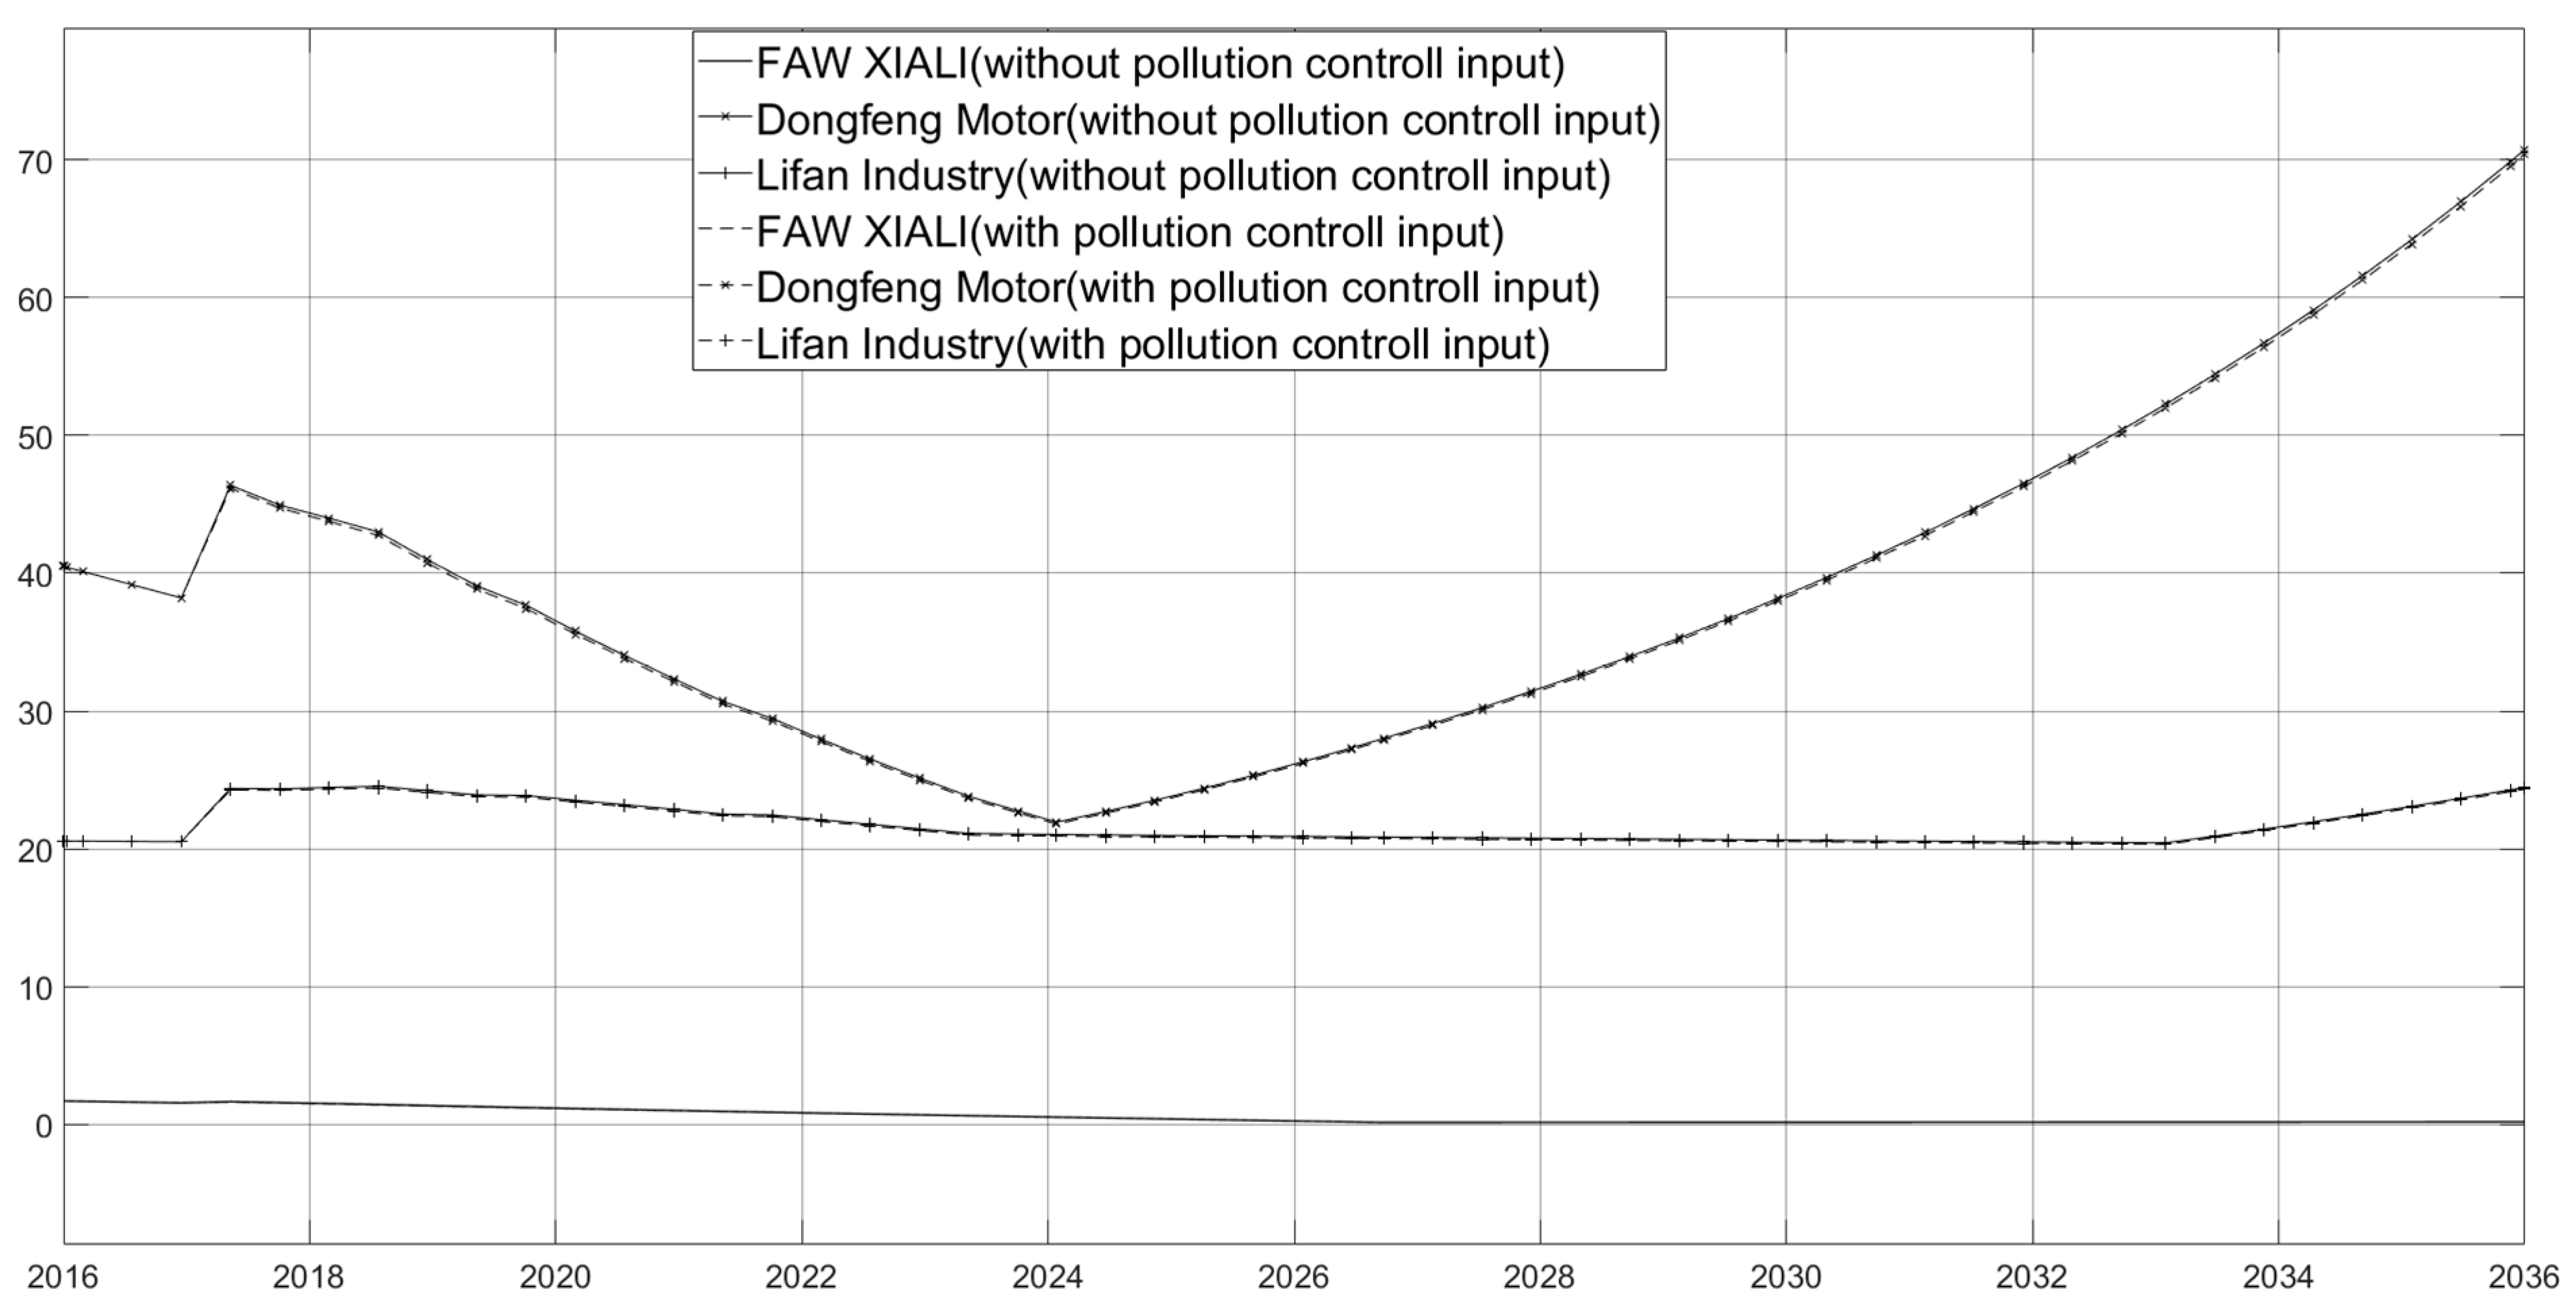
5.2.5. Consider the Environmental Regulation’s Effect
According to “People’s Republic of China Environmental Protection Tax Law implementation regulations” annexed “Environmental protection tax item tax table” calculates the average pollution tax per car is 114 CNY. According to the calculated results by Shi et al. [
60], the sewage cost (185 CNY) can be saved for each additional patent. Wang and Qian [
61] showed that in addition to environmental efficiency and economic efficiency of environmental tax deductions, corporate environmental investment also has social benefits for stakeholders, such as consumers, residents, investors, and creditors. Ye Tong’s (2018) research showed that investment in emission-reduction technology has a significant impact on corporate goodwill. The simulation flowchart is shown in
Figure A5. The results are shown in
Figure 7 and
Figure 8. As can be seen from the comparison between
Figure 7 and
Figure 8, when a company makes a certain amount of emission reduction investment, on the one hand, the innovation brought by the emission reduction investment can reduce emissions, thereby reducing the corresponding emission costs, on the other hand, because with the increase of goodwill and intangible assets, emission reduction investment can affect performance through the enterprise’s social network effect. Eventually, the company’s emission costs have dropped significantly (
Figure 7), while the company’s profits will not decline significantly (
Figure 8).
6. Discussion
Based on the combination of scenario analysis theory, social network theory, and technological innovation theory, this research establishes a mechanism model of scenario factors and inter-firm social networks affecting ambidexterity green technological innovation. Real data are used to carry out a simulation based on a multi-objective programming model. By comparing with previous literature, the results of this study can draw the following theoretical and practical implications.
6.1. Relationship with the Existing Literature
Previous studies have summarized a variety of theoretical factors that have a direct impact on firms’ green technology innovation. Such as firms’ internal R&D funds and personnel, and external search and absorptive capacity [
62]. However, the impact of scenario factors, such as environmental changes, is usually regarded as an uncontrollable exogenous variable [
63]. This study argues that these scenario factors can be systematically classified and internalized as the specific goals of firms’ technological innovation. The inter-firm social network plays an important mediating role in this theoretical system. An important premise behind this is that previous research has found that firms can actively adjust their social network resources in order to achieve the goal of technological innovation [
6].
6.2. Contributions and Suggestions
This study presents a theoretical mechanism with multi factors including scenario factors, inter-firm social networks, and ambidexterity green technological innovation. Simulation modeling and numerical case analysis help this research to discover the firms’ multi-objective operation system under this theoretical framework. In this system, the economic transformation, institutional change, and cultural environment requirements make firms produce the strategic goal of maximizing income through balanced ambidexterity green technology innovation and the investment of firms in their social networks conducive to the accomplishment of this strategic goal. The implications of these results can be classified into the following perspectives.
First, for firms and innovators, the simulation model and results of this study show that the strategic goals of firms are influenced by scenario factors. The impact of different scenario factors means that firms should establish different goals. There is a systematic relationship between these goals. The lack of goals based on the judgment of the scenario factors may lead to the failure of the firm’s innovation. A reasonable investment in inter-firms’ social networks is an important guarantee for establishing correct goals, discovering innovation opportunities, and obtaining innovation resources. Therefore, firms should fully consider the influencing factors and transmission mechanisms in different scenarios, to realize the construction of the social network and the development of innovation abilities that are beneficial to themselves. For example, in the global manufacturing network, China and Chinese firms have a special position. There are many different forms of innovation in China, such as imitation innovation, improved innovation, and independent innovation. Additionally, the whole world is facing a huge problem of environmentally sustainable development. These scenario factors put forward higher requirements on the dynamic management capabilities and network dynamic capabilities of firms in China. Specifically, the simulation analysis of this study shows that the investment of firms in emission reduction is not only conducive to saving their emission costs, but also conducive to firms’ reputation.
Second, for the government and policymakers, the suggestion is to promote the construction of a social network platform that is widely participated by all subjects in society. So, the national innovation system is developing towards green, product-oriented, and multi-sectoral cooperation. The simulation paths and results of this study support the view that the inter-firm social network is a type of resource that can be rewarded in varying proportions through active management. Further, the cost reduction and income increase of this resource are not enough only through the operation of the firm itself. The establishment of a more effective social network also requires the government to build a more complete digital technology facility and supply chain development platform, and make the knowledge provided by public R&D more closely integrated with industrial development.
7. Conclusions
The simulation results of this study show that the interaction of the three scenario factors of institutional, economic, and cultural environment in the manufacturing industries results in the need for multi-objective development of the firm.
First, the market-oriented driven force and the social-network-based technological innovation strategies provide a fierce market competition environment and opportunities for innovation for manufacturing firms. In the fierce market competition, the firm’s R&D investment determines the firm’s profit, and different directions of R&D investment have different impacts on firms’ short-term and long-term operations. These orientations include ambidexterity reforms of technology, incremental innovation aimed at reducing costs and improving production efficiency, and breakthrough innovation aimed at changing the current production structure. Incremental innovation is conducive to the short-term growth of firms, while breakthrough innovation is conducive to the long-term growth of firms. Firms must review the situation and determine whether they should pursue short-term growth or long-term breakthrough in the current market scenario.
Second, the cultivation of knowledge-sharing is emphasized by manufacturing industries. The inter-firm social network is important to the development of firms. Therefore, the construction of the national innovation system makes it necessary for firms to pursue their social network benefits. The simulation results of this study show that inter-firm social network is an effective tool for firms to make decisions when reviewing the situation and the situation. The local network’s growth is conducive to the improvement of the firm’s incremental innovation, while the indirect global network centrality is conducive to the improvement of the firm’s breakthrough innovation. However, firms are also limited by the local centrality and global centrality of their social networks to a certain extent, so they should pay attention to their social network development planning to maintain the balance of ambidexterity innovation.
Third, there is currently a need for manufacturing firms to reduce environmental pollution by promoting both government environmental policies and social advocacy for corporate responsibility. The simulation results of this study show that the joint efforts of government, society, and firms can achieve a win-win situation for both enterprise and environmental benefits. Firms’ R&D investment in reducing emissions can effectively reduce pollutant emissions and discharge costs [
64]. However, firms may face the problem of input costs exceeding cost savings. Therefore, the encouragement and promotion of government and society are necessary for emission reduction activities by firms. The increase in the goodwill of firms and the social network effect could alleviate this problem and even benefit the firms.
However, this study also has the following limitations and corresponding future research plans. First, in the simulation model of this research, only one specific social network among enterprises is set. There are many types of inter-firm social network links, such as links with the customer, links with suppliers, and links with competitors. Different types and strengths of social network links may have different effects on the realization of innovation goals. Therefore, future research needs to extend the model to different types of social network links. Second, the investment benefits of green innovation and social network effects are idealized in the simulation model of this study. In practice, there is a relatively large risk in innovation activities [
65]. Previous studies have shown that proper social network embedding is beneficial to reduce this risk, but it cannot eliminate this risk. How to better play the role of inter-firm social networks depends on further research.
Author Contributions
Conceptualization, X.W. and Z.Y.; Methodology, X.W.; Software, H.W. and C.H.; Validation, X.W., H.W., Z.Y., C.H. and B.X.; Formal analysis, X.W.; Investigation, X.W. and B.X.; Resources, Z.Y.; Data curation, H.W., C.H. and B.X.; Writing–original draft, X.W.; Writing–review and editing, X.W. and Z.Y.; Visualization, H.W.; Supervision, Z.Y.; Project administration, Z.Y.; Funding acquisition, X.W. All authors have read and agreed to the published version of the manuscript.
Funding
This research was funded by National Natural Science Foundation of China, grant number 72102121.
Data Availability Statement
The data presented in this study are available on request from the corresponding author.
Conflicts of Interest
The authors declare no conflict of interest.
Appendix A
Figure A1.
Simulation flowchart of basic situation.
Figure A1.
Simulation flowchart of basic situation.
Figure A2.
Simulation flowchart of incremental innovation capability enhanced.
Figure A2.
Simulation flowchart of incremental innovation capability enhanced.
Figure A3.
Simulation flow chart of product innovation enhanced.
Figure A3.
Simulation flow chart of product innovation enhanced.
Figure A4.
Simulation flow chart of social network effect and ambidexterity innovation.
Figure A4.
Simulation flow chart of social network effect and ambidexterity innovation.
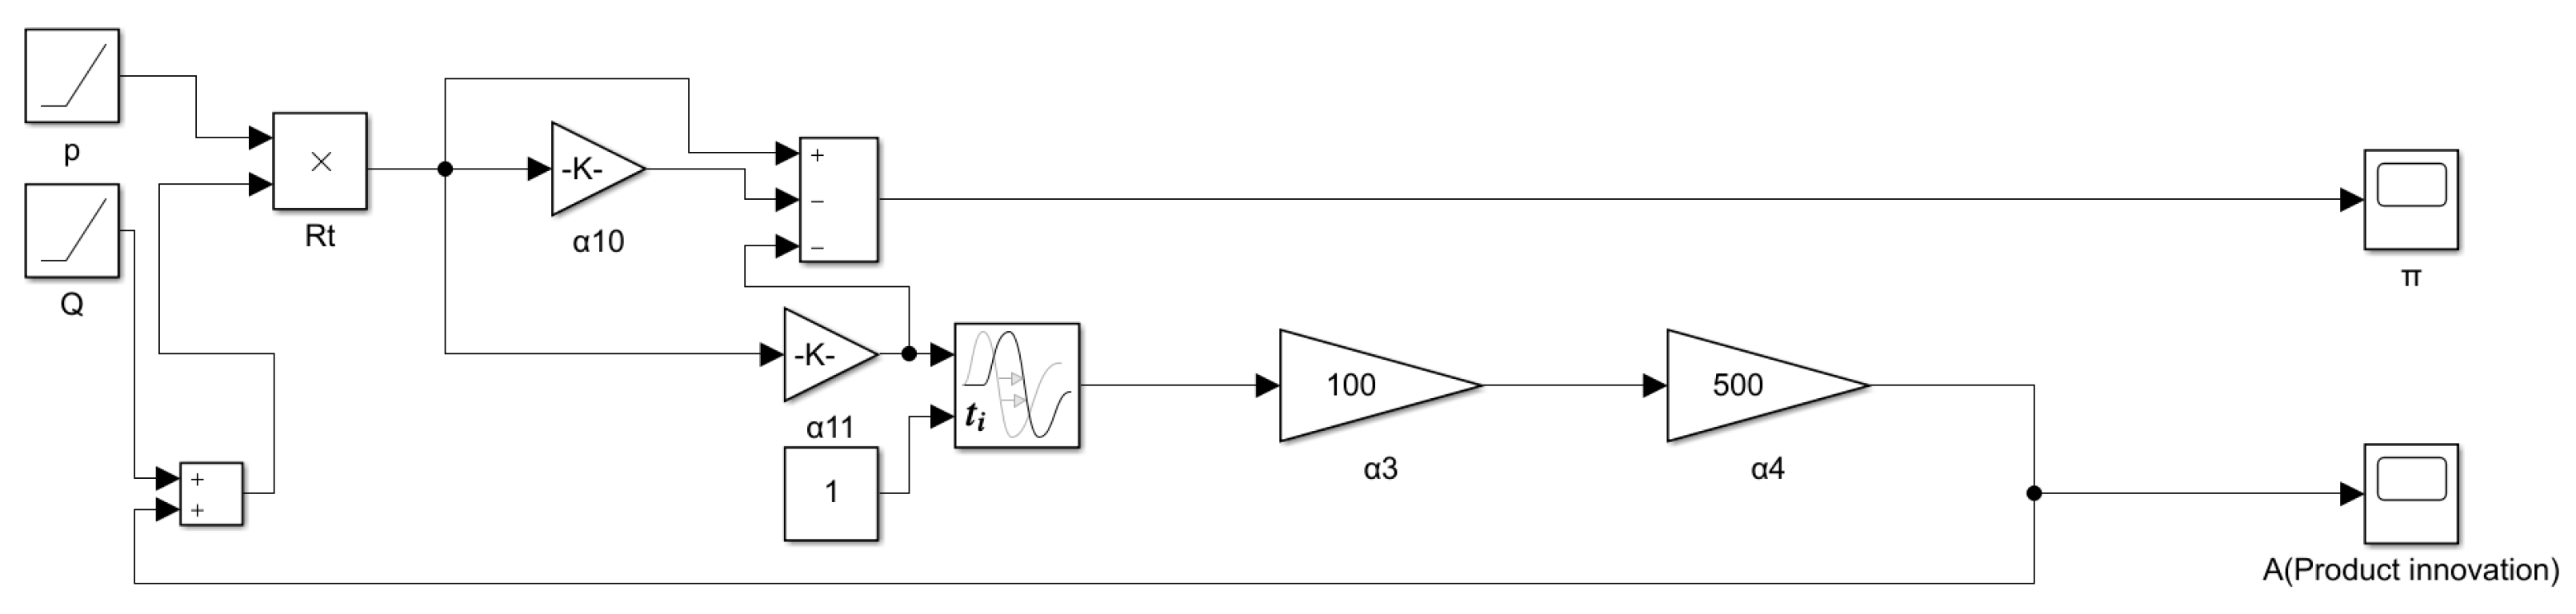
Figure A5.
Simulation flowchart of environmental regulation effect.
Figure A5.
Simulation flowchart of environmental regulation effect.
References
- Malacina, I.; Teplov, R. Supply chain innovation research: A bibliometric network analysis and literature review. Int. J. Prod. Econ. 2022, 251, 108540. [Google Scholar] [CrossRef]
- Wei, X.; Liu, R.; Chen, W. How the COVID-19 Pandemic Impacts Green Inventions: Evidence from a Quasi-Natural Experiment in China. Sustainability 2022, 14, 10385. [Google Scholar] [CrossRef]
- Yang, Z.; Shang, W.-L.; Zhang, H.; Garg, H.; Han, C. Assessing the green distribution transformer manufacturing process using a cloud-based q-rung orthopair fuzzy multi-criteria framework. Appl. Energy 2022, 311, 118687. [Google Scholar] [CrossRef]
- Binz, C.; Truffer, B.; Li, L.; Shi, Y.; Lu, Y. Conceptualizing leapfrogging with spatially coupled innovation systems: The case of onsite wastewater treatment in China. Technol. Forecast. Soc. Chang. 2012, 79, 155–171. [Google Scholar] [CrossRef]
- Dosi, G.; Soete, L. On the syndemic nature of crises: A Freeman perspective. Res. Policy 2022, 51, 104393. [Google Scholar] [CrossRef] [PubMed]
- Chen, W.; Wei, X.; Liu, R. Influence of Interfirm Social Networks on Technological Innovation and its Time Lag Effect: A Meta-Analysis. IEEE Access 2019, 7, 167019–167031. [Google Scholar] [CrossRef]
- Burt, R.S. Structural Holes: The Social Structure of Competition; Harvard University Press: Cambridge, MA, USA, 1992. [Google Scholar]
- Granovetter, M.S. The strength of weak ties. Am. J. Sociol. 1973, 78, 1360–1380. [Google Scholar] [CrossRef]
- Ahuja, G. Collaboration networks, structural holes, and innovation: A longitudinal study. Adm. Sci. Q. 2000, 45, 425–455. [Google Scholar] [CrossRef]
- Uzzi, B. The Sources and Consequences of Embeddedness for the Economic Performance of Organizations: The Network Effect. Am. Sociol. Rev. 1996, 61, 674. [Google Scholar] [CrossRef]
- Singh, S.K.; Gupta, S.; Busso, D.; Kamboj, S. Top management knowledge value, knowledge sharing practices, open innovation and organizational performance. J. Bus. Res. 2021, 128, 788–798. [Google Scholar] [CrossRef]
- Wang, C.; Hu, Q. Knowledge sharing in supply chain networks: Effects of collaborative innovation activities and capability on innovation performance. Technovation 2020, 94–95, 102010. [Google Scholar] [CrossRef]
- Zhang, Y.; Hu, H.; Zhu, G.; You, D. The impact of environmental regulation on enterprises’ green innovation under the constraint of external financing: Evidence from China’s industrial firms. Environ. Sci. Pollut. Res. 2022, 29, 1–22. [Google Scholar] [CrossRef]
- Tarraco, E.L.; Borini, F.M.; Bernardes, R.C.; Navarrete, S.D.S. The Differentiated Impact of the Institutional Environment on Eco-Innovation and Green Manufacturing Strategies: A Comparative Analysis Between Emerging and Developed Countries. IEEE Trans. Eng. Manag. 2021, 68, 1–12. [Google Scholar] [CrossRef]
- Javeed, S.A.; Latief, R.; Jiang, T.; Ong, T.S.; Tang, Y. How environmental regulations and corporate social responsibility affect the firm innovation with the moderating role of Chief executive officer (CEO) power and ownership concentration? J. Clean. Prod. 2021, 308, 127212. [Google Scholar] [CrossRef]
- Stern, N.; Valero, A. Innovation, growth and the transition to net-zero emissions. Res. Policy 2021, 50, 104293. [Google Scholar] [CrossRef]
- Hu, D.; Jiao, J.; Tang, Y.; Xu, Y.; Zha, J. How global value chain participation affects green technology innovation processes: A moderated mediation model. Technol. Soc. 2022, 68, 101916. [Google Scholar] [CrossRef]
- Honorato, C.; de Melo, F.C.L. Industry 4.0: The Case-Study of a Global Supply Chain Company. J. Ind. Integr. Manag. 2022, 7, 1–18. [Google Scholar] [CrossRef]
- Lv, X.; Lu, X. Green Growth or Gray Growth: Measuring Green Growth Efficiency of the Manufacturing Industry in China. Systems 2022, 10, 255. [Google Scholar] [CrossRef]
- Lei, Y.; Guo, Y.; Zhang, Y.; Cheung, W. Information technology and service diversification: A cross-level study in different innovation environments. Inf. Manag. 2021, 58, 103432. [Google Scholar] [CrossRef]
- Gu, Y.; Hu, L.; Hou, C. Leveraging diverse ecosystem partners for innovation: The roles of regional innovation environment and partnership heterogeneity. Econ. Res. -Ekon. Istraz. 2022, 35, 1–20. [Google Scholar] [CrossRef]
- Jacob, J.; Mei, M.-Q.; Gunawan, T.; Duysters, G. Ambidexterity and innovation in cluster SMEs: Evidence from Indonesian manufacturing. Ind. Innov. 2022, 29, 948–968. [Google Scholar] [CrossRef]
- Bhatti, S.H.; Ahmed, A.; Ferraris, A.; Hussain, W.; Wamba, S.F. Big data analytics capabilities and MSME innovation and performance: A double mediation model of digital platform and network capabilities. Ann. Oper. Res. 2022, 318, 1–24. [Google Scholar] [CrossRef]
- Wei, J.; Wu, A.; Peng, X. A Study on China’s Strategic Management: The Problem of Circumstances and the Theoretical Front-line. Manag. World 2014, 20, 167–171. [Google Scholar]
- Jin, Y.; Ji, S.; Liu, L.; Wang, W. Business model innovation canvas: A visual business model innovation model. Eur. J. Innov. Manag. 2021, 25, 1469–1493. [Google Scholar] [CrossRef]
- Luo, W.; Zhang, C.; Li, M. The influence of corporate social responsibilities on sustainable financial performance: Mediating role of shared vision capabilities and moderating role of entrepreneurship. Corp. Soc. Responsib. Environ. Manag. 2022, 29, 1266–1282. [Google Scholar] [CrossRef]
- Zhai, D.; Zhao, X.; Bai, Y.; Wu, D. Effective Evaluation of Green and High-Quality Development Capabilities of Enterprises Using Machine Learning Combined with Genetic Algorithm Optimization. Systems 2022, 10, 128. [Google Scholar] [CrossRef]
- Gao, L.; Ma, W. Open innovation: Connotation, framework and Chinese context. Manag. World 2014, 6, 157–169. [Google Scholar]
- Dahiyat, S.E.; Khasawneh, S.M.; Bontis, N.; Al-Dahiyat, M. Intellectual capital stocks and flows: Examining the mediating roles of social capital and knowledge transfer. VINE J. Inf. Knowl. Manag. Syst. 2021, 53, 11–42. [Google Scholar] [CrossRef]
- Martin-Rios, C.; Erhardt, N.L.; Manev, I.M. Interfirm collaboration for knowledge resources interaction among small innovative firms. J. Bus. Res. 2022, 153, 206–215. [Google Scholar] [CrossRef]
- Lis, A.M. Development of proximity in cluster organizations. Entrep. Sustain. Issues 2020, 8, 116–132. [Google Scholar] [CrossRef]
- Hu, C.; Yang, H.; Yin, S. Insight into the Balancing Effect of a Digital Green Innovation (DGI) Network to Improve the Performance of DGI for Industry 5.0: Roles of Digital Empowerment and Green Organization Flexibility. Systems 2022, 10, 97. [Google Scholar] [CrossRef]
- Petrenko, Y.; Vechkinzova, E.; Antonov, V. Transition from the industrial clusters to the smart specialization: A case study. Insights Reg. Dev. 2019, 1, 118–128. [Google Scholar] [CrossRef] [PubMed]
- Gordon, I.R.; McCann, P. Industrial clusters: Complexes, agglomeration and/or social networks? Urban Stud. 2000, 37, 513–532. [Google Scholar] [CrossRef]
- Loiseau, E.; Saikku, L.; Antikainen, R.; Droste, N.; Hansjürgens, B.; Pitkänen, K.; Leskinen, P.; Kuikman, P.; Thomsen, M. Green economy and related concepts: An overview. J. Clean. Prod. 2016, 139, 361–371. [Google Scholar] [CrossRef]
- Donner, M.; de Vries, H. How to innovate business models for a circular bio-economy? Bus. Strateg. Environ. 2021, 30, 1932–1947. [Google Scholar] [CrossRef]
- Awan, U. Industrial Ecology in Support of Sustainable Development Goals. In Responsible Consumption and Production; Springer: Cham, Switzerland, 2020; pp. 370–380. [Google Scholar]
- Mazzoni, F. Circular economy and eco-innovation in Italian industrial clusters. Best practices from Prato textile cluster. Insights Reg. Dev. 2020, 2, 661–676. [Google Scholar] [CrossRef]
- Amjad, M.S.; Rafique, M.Z.; Khan, M.A. Leveraging Optimized and Cleaner Production through Industry 4.0. Sustain. Prod. Consum. 2021, 26, 859–871. [Google Scholar] [CrossRef]
- Wang, M.; Wang, H. Knowledge search and innovation performance: The mediating role of absorptive capacity. Oper. Manag. Res. 2022, 15, 1060–1070. [Google Scholar] [CrossRef]
- Wei, X.; Chen, W.; Lin, C. Evolution, Classification, and Relationships of the Theories of Innovation Capabilities. Q. J. Manag. 2019, 13, 112–157. [Google Scholar]
- Randhawa, K.; Wilden, R.; Gudergan, S. How to innovate toward an ambidextrous business model? The role of dynamic capabilities and market orientation. J. Bus. Res. 2021, 130, 618–634. [Google Scholar] [CrossRef]
- Qin, X. The Impact of Interregional Collaboration on Multistage R&D Productivity and Their Interregional Gaps in Chinese Provinces. Mathematics 2022, 10, 1310. [Google Scholar] [CrossRef]
- Zhou, Y.; Zhu, H.; Zhu, L.; Liu, G.; Zou, Y. Be close to government and academy: TMT social capital, network prestige and firm’s innovation performance. Chin. Manag. Stud. 2022; ahead-of-print. [Google Scholar] [CrossRef]
- Mansell, R. Adjusting to the digital: Societal outcomes and consequences. Res. Policy 2021, 50, 104296. [Google Scholar] [CrossRef]
- Cancela, B.L.; Coelho, A.; Neves, M.E.D. Greening the business: How ambidextrous companies succeed in green innovation through to sustainable development. Bus. Strat. Environ. 2022, 31, 1–15. [Google Scholar] [CrossRef]
- Vega-Jurado, J.; Gutiérrez-Gracia, A.; Fernández-De-Lucio, I. Does external knowledge sourcing matter for innovation? Evidence from the Spanish manufacturing industry. Ind. Corp. Chang. 2009, 18, 637–670. [Google Scholar] [CrossRef]
- Wang, D.; Wan, K.; Yang, J. Measurement and evolution of eco-efficiency of coal industry ecosystem in China. J. Clean. Prod. 2019, 209, 803–818. [Google Scholar] [CrossRef]
- Ahuja, G. The duality of collaboration: Inducements and opportunities in the formation of interfirm linkages. Strateg. Manag. J. 2000, 21, 317–343. [Google Scholar] [CrossRef]
- Liu, W.; Yang, J. The Evolutionary Game Theoretic Analysis for Sustainable Cooperation Relationship of Collaborative Innovation Network in Strategic Emerging Industries. Sustainability 2018, 10, 4585. [Google Scholar] [CrossRef]
- Sueyoshi, T.; Goto, M. Weak and strong disposability vs. natural and managerial disposability in DEA environmental assessment: Comparison between Japanese electric power industry and manufacturing industries. Energy Econ. 2012, 34, 686–699. [Google Scholar] [CrossRef]
- West, J.; Bogers, M. Leveraging External Sources of Innovation: A Review of Research on Open Innovation. J. Prod. Innov. Manag. 2014, 31, 814–831. [Google Scholar] [CrossRef]
- Miles, M.B.; Huberman, A.M. Qualitative Data Analysis: An Expanded Sourcebook; Sage Publications, Inc.: Thousand Oaks, CA, USA, 1994. [Google Scholar]
- Lundvall, B.-A. National Systems of Innovation: Towards a Theory of Innovation and Interactive Learning; Pinter Publishers: London, UK, 1992; pp. 318–330. [Google Scholar]
- Xie, X.; Fang, L.; Zeng, S.; Huo, J. How does knowledge inertia affect firms product innovation? J. Bus. Res. 2016, 69, 1615–1620. [Google Scholar] [CrossRef]
- Li, X.; Zhou, Y.; Xue, L.; Huang, L. Roadmapping for industrial emergence and innovation gaps to catch-up: A patent-based analysis of OLED industry in China. Int. J. Technol. Manag. 2016, 72, 105–143. [Google Scholar] [CrossRef]
- Si, S.; Chen, H. A literature review of disruptive innovation: What it is, how it works and where it goes. J. Eng. Technol. Manag. 2020, 56, 101568. [Google Scholar] [CrossRef]
- Schmookler, J. Invention and economic growth. In Invention and Economic Growth; Harvard University Press: Cambridge, MA, USA, 2013. [Google Scholar]
- Parrilli, M.D.; Balavac, M.; Radicic, D. Business innovation modes and their impact on innovation outputs: Regional variations and the nature of innovation across EU regions. Res. Policy 2020, 49, 104047. [Google Scholar] [CrossRef] [PubMed]
- Shi, D.; Ding, H.; Wei, P.; Liu, J. Can smart city construction reduce environmental pollution. China Ind. Econ. 2018, 6, 117–135. [Google Scholar]
- Wang, F.; Qian, R. Study on Enterprise Efficiency of Environmental Protection Investment in China—Based on the Data of 704 A-Share Listed Companies from 2010 to 2014. Collect. Essays Financ. Econ. 2017, 32, 43–52. [Google Scholar]
- He, X.; Xia, M.; Li, X.; Lin, H.; Xie, Z. How Innovation Ecosystem Synergy Degree Influences Technology Innovation Performance—Evidence from China’s High-Tech Industry. Systems 2022, 10, 124. [Google Scholar] [CrossRef]
- Epicoco, M. Technological Revolutions and Economic Development: Endogenous and Exogenous Fluctuations. J. Knowl. Econ. 2021, 12, 1437–1461. [Google Scholar] [CrossRef]
- Chen, X.; Liu, Y.; Mcelroy, M. Transition towards carbon-neutral electrical systems for China: Challenges and perspectives. Front. Eeg. Manag. 2022, 9, 504–508. [Google Scholar] [CrossRef]
- Bai, S.; Bi, X.; Han, C.; Zhou, Q.; Shang, W.-L.; Yang, M.; Wang, L.; Ieromonachou, P.; He, H. Evaluating R&D efficiency of China’s listed lithium battery enterprises. Front. Eeg. Manag. 2022, 9, 473–485. [Google Scholar]
| Disclaimer/Publisher’s Note: The statements, opinions and data contained in all publications are solely those of the individual author(s) and contributor(s) and not of MDPI and/or the editor(s). MDPI and/or the editor(s) disclaim responsibility for any injury to people or property resulting from any ideas, methods, instructions or products referred to in the content. |
© 2023 by the authors. Licensee MDPI, Basel, Switzerland. This article is an open access article distributed under the terms and conditions of the Creative Commons Attribution (CC BY) license (https://creativecommons.org/licenses/by/4.0/).


