Article

Fresh Product Supply Chain Analysis in Cauca, Colombia — A Hass Avocado System Dynamics Approach

by
Yesid Ediver Anacona Mopan
1,2,
Oscar Rubiano-Ovalle
2,
Helmer Paz
1,
Andrés Felipe Solis Pino
1,
Mario Chong
3,* and
Ana Luna
3
1
Facultad de Ingeniería, Corporación Universitaria Comfacauca-Unicomfacauca, Cl. 4 N. 8-30, Popayán 190001, Colombia
2
Facultad de Ingeniería, Universidad del Valle, Cl. 13 #100-00, Cali 760042, Colombia
3
Facultad de Ingeniería, Universidad del Pacifico, Lima 15072, Peru
*
Author to whom correspondence should be addressed.
Systems 2023, 11(1), 29; https://doi.org/10.3390/systems11010029
Submission received: 10 October 2022 / Revised: 12 December 2022 / Accepted: 15 December 2022 / Published: 5 January 2023
(This article belongs to the Special Issue Business Model–the Perspective of Systems Thinking and Innovation)

Abstract

:
In recent years, agriculture has become an essential activity in Colombia, despite the challenges faced by farmers due to low yields and insufficient resources to improve their main activities, such as irrigation systems, agricultural practices, and industrial machinery. This Hass avocado approach has been addressed in previous research considering system dynamics simulation to evaluate farmers’ behavior strategies and improve their competitiveness. However, these studies typically examine a single strategy effect and avoid multiple integrated strategies. Other studies focused on the complex interactions between different factors in the production chain and their feedback effects on farmers’ productivity and cash flow. For these reasons, this research provides a comprehensively dynamic model and evaluates long-term strategies and their effects on supporting and improving small farmers’ productivity and profitability. A system dynamics methodology was used to model complex systems processing Hass avocado farmer association data and explore their effects on competitiveness for long-term sustainable and profitable agriculture. This research proposes optimal scenarios for small farmers, including strategies such as low-interest credit access, logistics practices, and government technical support. The scenarios provide a proactive tool for decision makers and promote rural farmers’ development, aligning high-quality fresh product supply and demand.

1. Introduction

According to the United Nations, the demand for food will increase by 70% between now and 2050 for the predicted world population growth from 7.7 million to 9.7 million [1]. For this reason, researchers focus on improving crop productivity and competitiveness in the space available [2]. One solution is intensive agriculture development, but this method has negative implications for soil degradation, deforestation, and climate change. Experts are seeking new and better ways to produce food for the human species [3]. One of the most widely accepted proposals is “smart agriculture”, which entails balancing new agriculture and livestock to increase productivity while maximizing resources and minimizing environmental impact [4,5,6]. Among smart agriculture’s fundamental principles is to produce more food with fewer resources through Good Agricultural Practices (GAP) that limit forest depredation, reduce carbon footprint, and create income opportunities for small-scale producers in rural areas [7]. Likewise, sustainable development is essential to address food production scarcity, allowing organizational and technological changes and focusing on actual and future necessities [8]. However, the challenge in developing countries is identifying fresh product demands (such as root and tubers (potatoes, sweet potatoes, yams, cassava), fruit and vegetables (banana, orange, apple, avocado, tomato, grape), and others [9,10,11]) with significant resource constraints to achieve sustainable agricultural development, poverty reduction, and economic growth.
Avocado production is a prime example of intensive agriculture, with global production projected to reach 12 million metric tons by 2030, more than triple its 2010 level [12]. In response to the rapid growth in international demand, avocados are expected to become the most-traded primary tropical fruit by 2030 [13]. Colombia is a major player in this market, with its 54,000 hectares accounting for 6% of the global planted area and making it the third-largest producer. It also ranks fourth in production, comprising 11% of the total produced worldwide, with an output of over 540,000 tons [14]. However, the increase in avocado production has compounded challenges related to consolidating the supply chain, achieving added value and market diversification, ensuring adequate technical support, and gaining certification in traceability, quality, and safety of production [14,15]. These challenges have led to precarious production systems lacking in technical, economic, and social sustainability [16], as well as future environmental problems such as deforestation, loss of biodiversity, and significant water scarcity [17].
Currently, System Dynamics (SD) models applied to agriculture allow for the comparison of social, economical, productive, and environmental elements, as they adopt a global perspective rather than focusing on minor details [18,19]. These engineering techniques are ideal for application in the specific scenario of Hass avocado production in the study region, where not only environmental conditions play a fundamental role but also soil and climatic elements, good agricultural practices, and the producer’s economic potential, among other factors [20].
Given that the Hass avocado production chain plays a fundamental role in the improvement and economic development of the study region, it is important to identify the most determining factors to consolidate the production chain in the long term with crops with better yields in productivity and fruit quality. To do this, small producers should not only consider the factors that affect the crop, but also identify the factors that affect the other links in the production chain. The SD approach allows for this and helps predict the organization’s future based on variables. Additionally, since SD helps to investigate which variables need to be changed to improve the system’s behavior, it can be helpful in understanding complex problems [21].
Most research that has addressed strategies to increase productivity and profitability has evaluated them separately, such as [22], which proposes to increase avocado productivity through high-density planting [23], which evaluates the impact of access to credit on the profitability of smallholder maize farmers, and [24], which analyzes the effect of cooperative organization of smallholder banana farmers in Kenya. Some of these researches have used the SD approach, but these studies only examined the effect of a single strategy and did not study the effect of multiple integrated strategies. Therefore, this research aims to provide a dynamic model to comprehensively assess the long-term effect of different strategies aimed at supporting and improving the productivity and profitability of Hass avocado cultivation by smallholder farmers, such as access to credit, implementation of good agricultural practices, farmer association, government support with technical assistance, and fertilizer supply.
This study seeks to answer the following research questions: (1) What financial shortfall do small producers face due to low production yields? (2) If producers can access credit to invest in improvement programs, what effect will it have on the average yield in tons per hectare, cash flow, and cumulative net profit? (3) How much does it cost small producers to implement good agricultural practices and become certified in their use, and what effect does this have on their cash flow? (4) If small producers decide to join an association, what effect will this have on crop productivity and profitability? (5) Should the State invest in the Hass avocado production chain? How and how much should it invest to ensure the long-term sustainability of the supply chain?
The study aimed to investigate the impact of various policies and actions on Hass avocado productivity. To do this, it developed a management model that adopted a systemic approach to capturing the complex interactions within the system. It constructed the model using a system dynamics methodology, which uses official data from regional producer associations. This approach allowed the researchers to systematically analyze the effects of multiple factors on avocado productivity and identify potential areas for improvement.

2. Related Work

Agricultural production chains are complex systems influenced by various factors [25]. The system dynamics approach can be used to study the behavior and consequences of these complex interactions. This approach allows for the analysis of nonlinear behavior over time using flows, feedback loops, table functions, and time delays with differential equations [26]. The system dynamics approach was initially applied in fields such as industrial management [27], urban dynamics [28], and population growth under resource constraints [29]. However, it has since been applied in other fields, including psychology, climate change, nature, and agriculture [30].
In the context of agriculture, the system dynamics approach has been used to evaluate the environmental and economic effects of eco-agriculture in the Kongtong district of China [31]. The results of this study indicated that the current agricultural system has various disadvantages, including slow development of organic agriculture, methane emissions, and high energy consumption. The study recommended specific government policy actions, such as promoting new energy sources and subsidizing power generation, to address these problems. Additionally, Waters et al. [32] applied an SD model to study the interaction between economic drivers and different production systems in the United States. Their results showed that a production system based solely on crops has the greatest potential for sustainability. Birthal and Hazrana [33] used a dynamic approach to rainfall data to assess the impact of climatic disturbances on Indian agricultural productivity. Their results indicated that these phenomena impair productivity, highlighting crop diversification’s importance to pre-adapt climatic shocks.
Prior research on agricultural production in South America has predominantly focused on improving competitiveness in the sector [34,35]. Hakim et al. [25] utilized an SD method to build a partnership model in a complex and dynamic red chili supply chain in Indonesia’s Bener Meriah Regency to improve the bargaining position of farmers. Another Indonesian study [26] demonstrated the problem of inconsistency in the quality and availability of cocoa beans within an integrative supply chain model. This lack of infrastructure, poor post-harvest management, and low-quality human resources all contributed to the weak competitiveness of the cocoa industry. A study on the fruit sector in Colombia utilized traceability technologies to investigate dynamic behavior [36]. The results indicated the importance of traceability technology and its relationship with investment capacity and quality. A potato supply chain analytical hierarchy approach in Peru and the grant contribution number 068-2021-PROCIENCIA (Opportunities for Small Potato-producing Units in the Challenges of COVID-19 Economic Reactivation—A Multidimensional Approach) evaluated packaging impact using a mixed methodology approach. These potato researches generated improvements, such as overall cost reduction, optimal fill rate operations, and organizations’ strategic and functional decision articulation based on a cost-competitive strategy [37]. Finally, a study on the coffee sector in Colombia [38] evaluated the impact of investment policies and economic support on Colombian coffee growers and their cash flow. The results showed that the resources provided to small producers must be sustainable for long-term investment policies.
However, minimal empirical evidence is available in avocado production with SD methodology. Aroca’s relevant study in [39] concludes agrifood supply chain entails complex relationships. Therefore, understanding actors’ interactions and variables are essential. Aroca’s study presented a dynamic model to simulate structures and interaction links taking into account economic, social, and environmental variables. For these reasons, the lack of production empirical evidence, and the gap with SD simulation, this research applies SD methodology with different avocado production scenarios such as association membership, good agricultural practices, access to credit, and government support. The production yield of each scenario is obtained over 15 years.

3. Materials and Methods

This paper presents the concept of SD and applies it to agriculture—specifically, to the Hass avocado, a high-demand product worldwide. Different scenarios were simulated, such as good agricultural practices, access to credit, producer associativity, and government support. These contribute to understanding which elements may be crucial to improving avocado production at the environmental and socioeconomic levels.
The primary references were some elements of the system dynamics framework [40]. As background, several studies presented by Suryani supported the current research on how system dynamics could apply to sustainable agriculture [41,42]. The choice of scenarios for the model simulation was informed by the literature review, since different studies have found that certain elements are fundamental to improving productive capacity. The primary materials used in the research were VosViewer [43] for the literature review, and Vensim [44], which allows scenario-based simulation, for the model simulation process. In addition, R studio [45] was employed for graphing and inferential analysis, and PAST [46] for the remaining data analysis. First, the development of the model involved the structuring of a causal diagram to indicate the main internal and external variables that make up the production chain and the cause–effect relationship between each of them. Second, the Forrester diagram was structured, which takes the variables of the causal diagram and compares them by means of equations that recreate real behavior. Finally, the policies to be evaluated are formulated by means of simulation scenarios [47]. The software used for the simulation was the Vensim PLE software package, a visual modeling tool that allows SD models to be conceptualized, documented, simulated, analyzed, and optimized. The simulation model was supported with the data, variables, and equations, and the methodological structure is better detailed in Figure 1. The following subsections detail the simulation execution process.

3.1. Problem Map

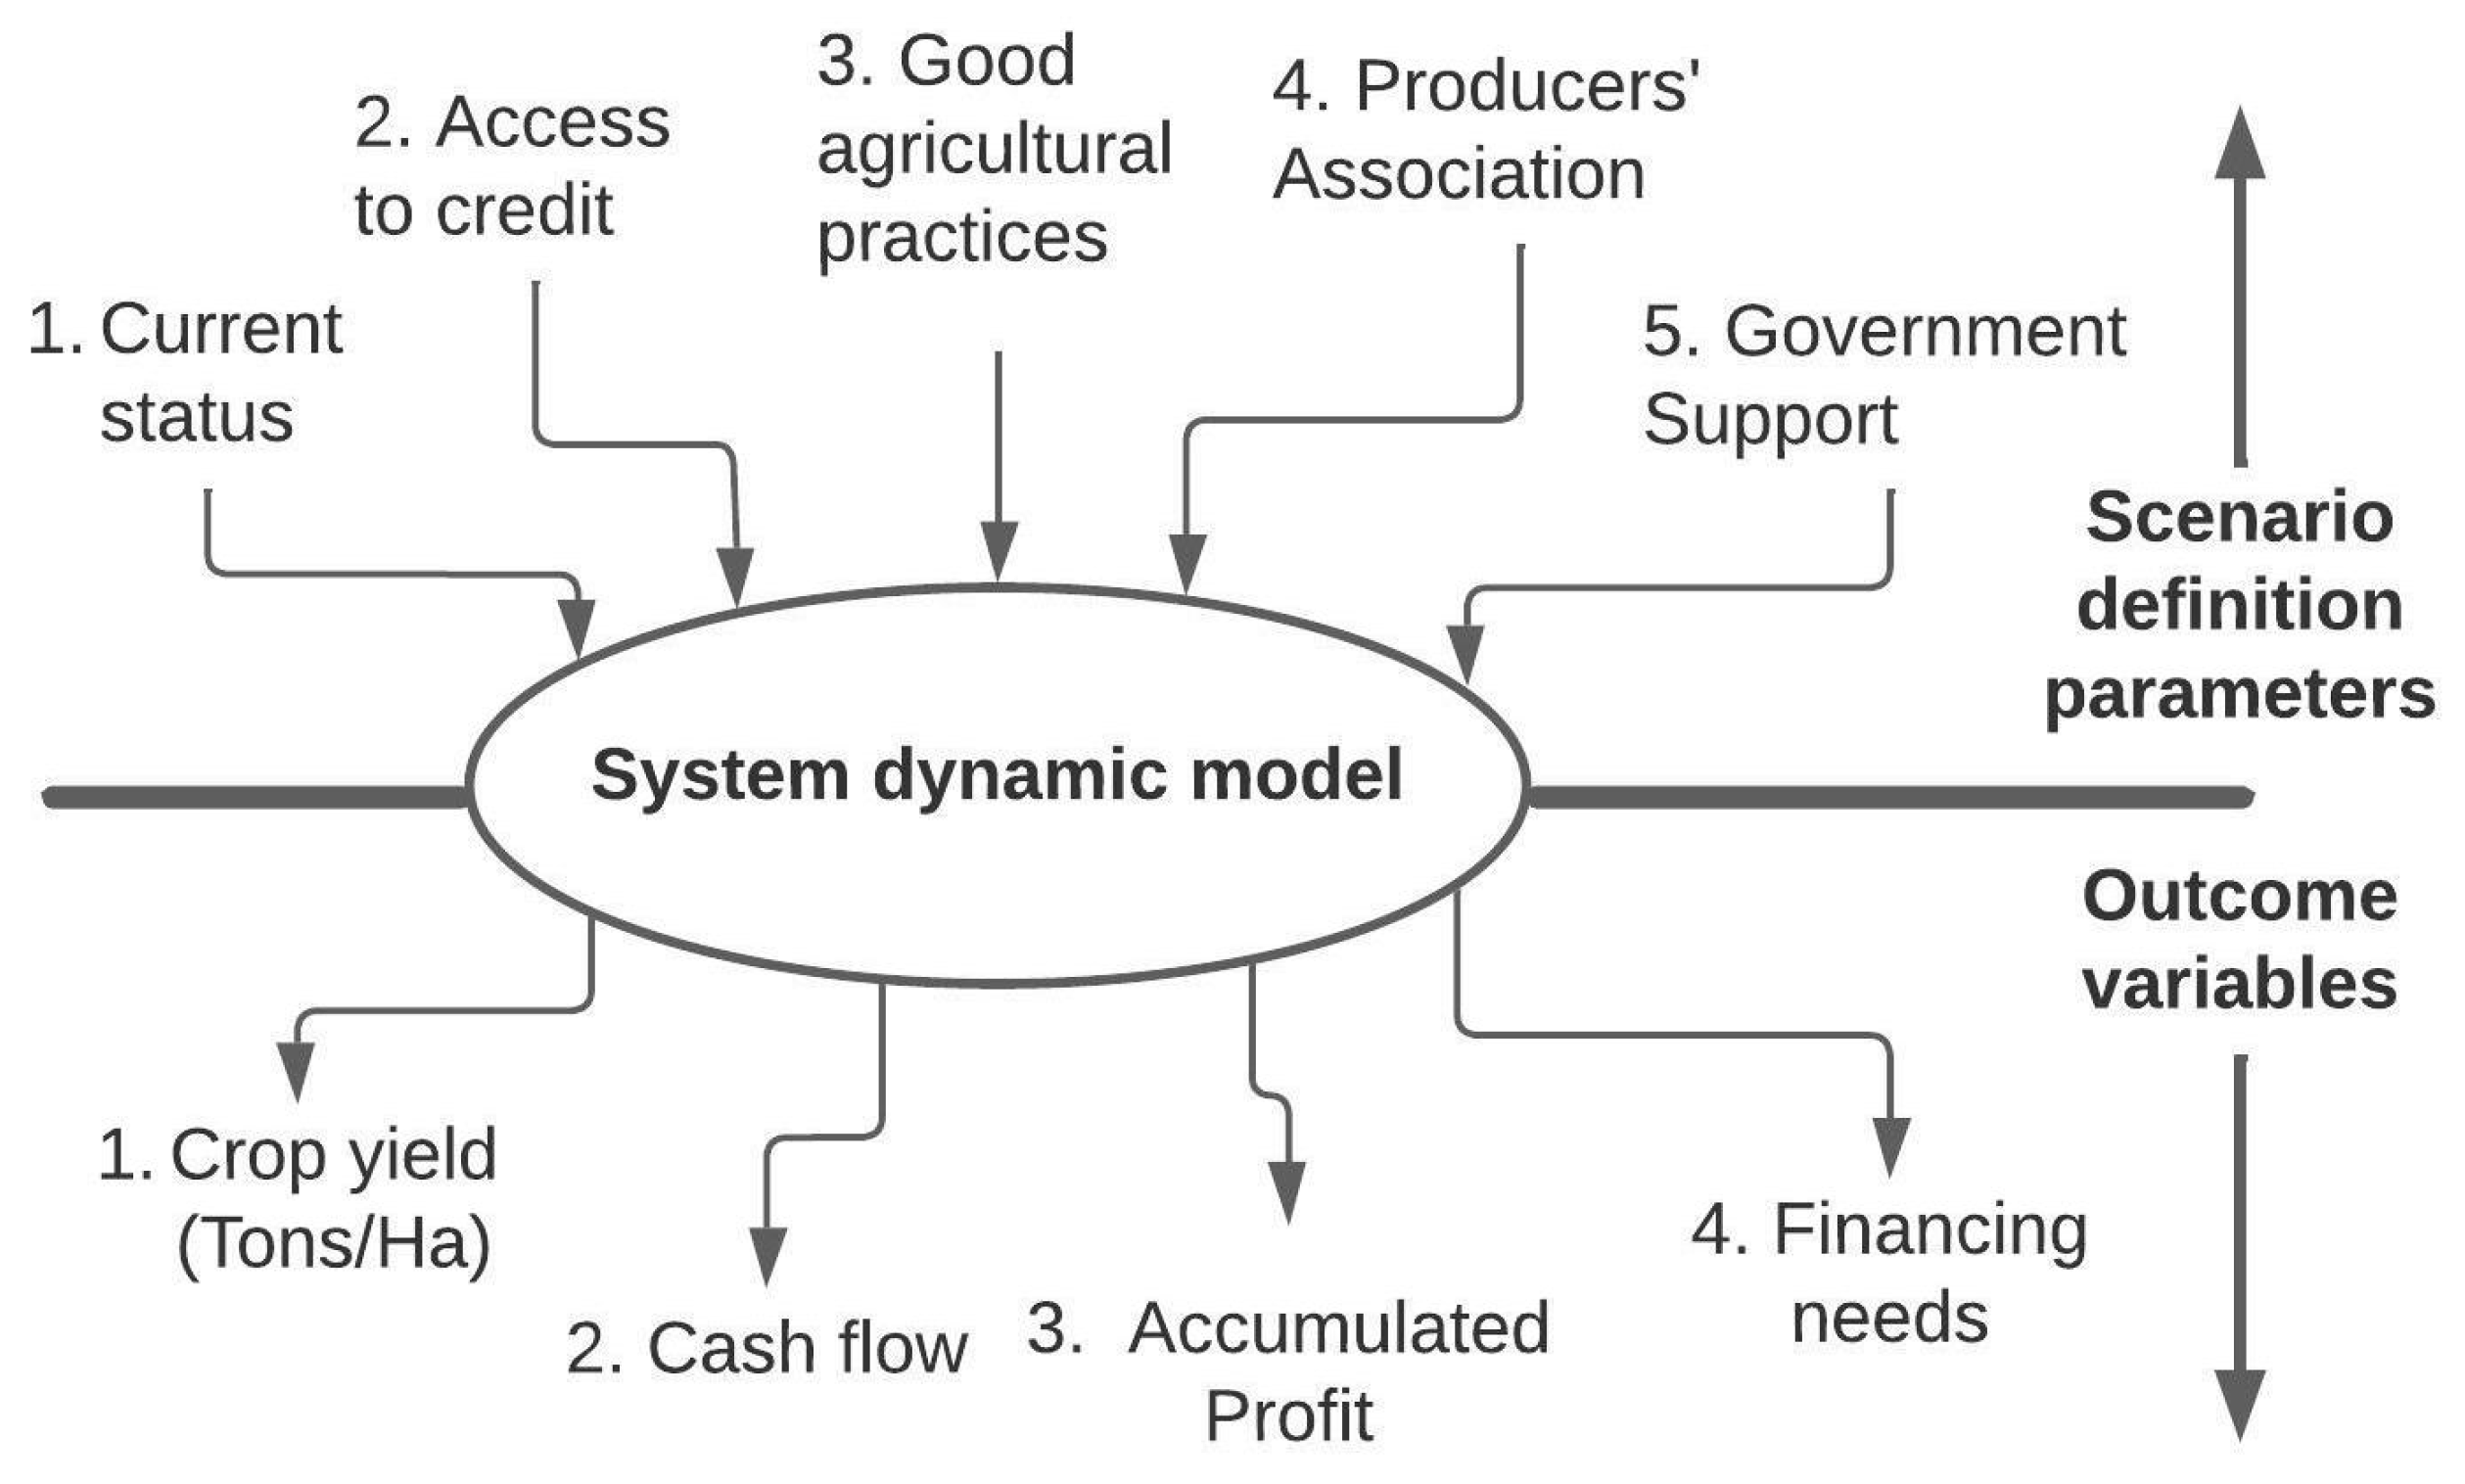
Figure 2 presents a map that demonstrates the identification of problems and solutions, as well as the underlying structure of these problems, according to the cited journal article [48]. This work aims to evaluate the input parameters in the upper part of the graph, which include the current status, access to credit, adherence to good agricultural practices, producers’ association membership, and government support. The lower part of the graph showcases the variables that can be analyzed through simulation, including crop yield, cash flow, accumulated profit, and financing needs.

3.2. Study Region

The Cauca Department, with an area of 469,628 hectares suitable for Hass avocado cultivation, is Colombia’s second most suitable department for producing this variety. However, to date, only about 1000 hectares of Hass avocado have been planted—less than 1% of the department’s potential area. In addition, a yield of 5.4 tons per hectare has been identified, which is low compared to other Colombian departments such as Antioquia and Valle del Cauca, whose outputs range between 10 and 14 tons per hectare [49]. This deficit in production has been identified because of various studies conducted by entities that support the agricultural sector, such as education and research centers, the Government of Cauca, the Colombian Agricultural Institute (ICA), the Colombian Association of Fruits and Vegetables (ASOFRUCOL), and the Colombian Agricultural Research Corporation (AGROSAVIA). These studies have identified key factors contributing to the deficit, including the cost of fertilizers, limited financial access, scarce technology and technical assistance, and low levels of association membership and access to export certificates such as good agricultural practices [50,51].
In response to these findings, the national government has implemented support and investment policies for the avocado sector in Cauca to improve competitiveness. This study aims to identify and evaluate simulation strategies that enable small Hass avocado producers to improve their competitiveness through factors such as access to credit, good agricultural practices, association membership, and government support.

3.3. Description of the Model’s Variables

In this section, the decision variables in the model and the reason for their choice are detailed. The model seeks to understand how farmer support strategies influence their productivity performance and cash flow.

3.3.1. Crop Performance

This variable refers to the productive capacity in tons per hectare in a year. Figure 3 shows that the production yield depends on the number of trees per hectare, fruits per tree, and the increase in productivity, which in turn depend on multiple factors. The present research found that the factors that most influence agricultural productivity are the association membership producers, access to credit, implementation of good agricultural practices, technical help, and reinvestment strategies in crop improvement programs [52,53].

3.3.2. Farmer’s Cash Flow

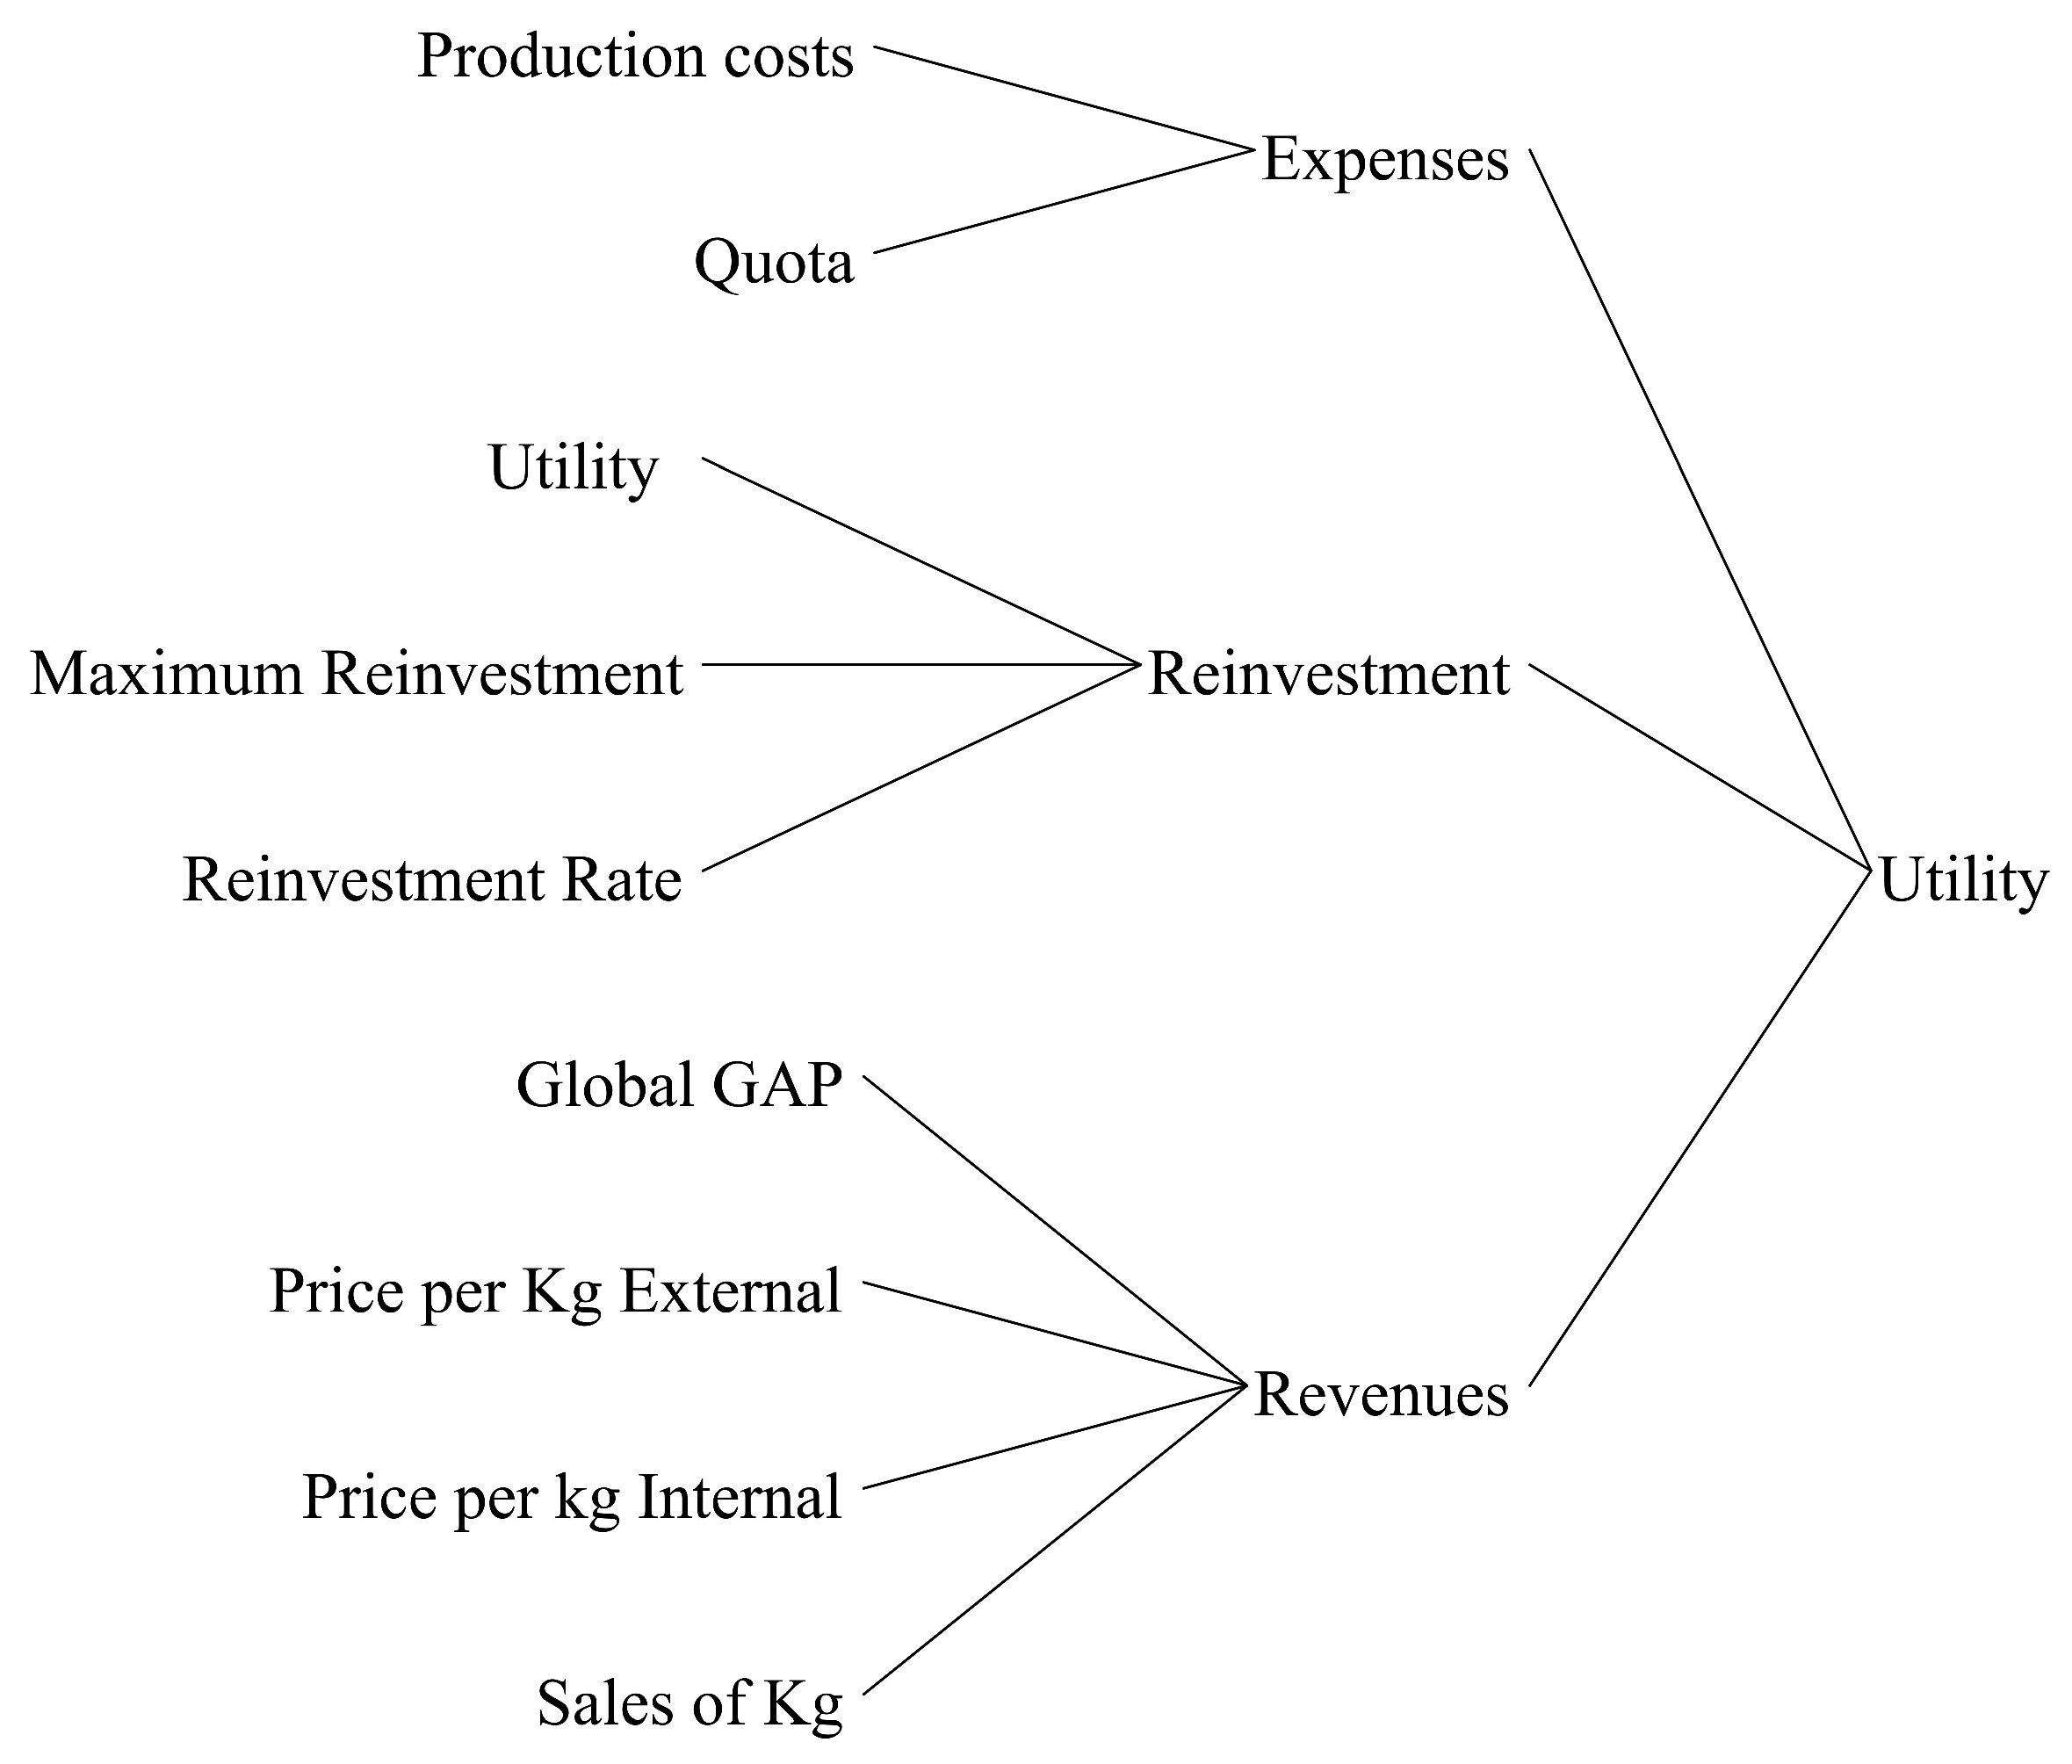
This variable, denoted as “difference between producer’s annual income and expenditure”, is a measure of the profitability of an avocado producer. The sales volume, or quantity of avocados sold, has a direct impact on the producer’s income. Additionally, the price per kilogram of avocados can vary depending on the location of the sale, with domestic sales typically commanding a lower price than international sales. In order to sell avocados abroad, producers must obtain certification from the Colombian Agricultural Institute (ICA) for good agricultural practices. This certification guarantees the quality and safety of the avocados, and is necessary for entry into foreign markets. The price per kilogram of avocados in domestic trade is typically 0.75, while international prices are approximately 1.75 per kilogram. Production costs and the size of payment installments for credit can also affect the producer’s expenditure, and may influence the producer’s decision to reinvest in improvement programs. Figure 4 depicts the variables that impact profit for avocado producers.

3.3.3. Description of the Model’s Variables

Table 1 presents the variables used in the simulation model, along with the corresponding equation and variable type. The production variable is a flow variable representing the number of avocados produced in a period. Factors influence it such as the number of fruits per tree, the number of hectares planted, and the accumulated productivity over time. The average yield is calculated by summing the production of each period and dividing it by the number of years simulated (15 years in this case). Demand is modeled as a function of production, with an annual increase of 3%. Sales are only considered adequate when sufficient inventory is available. The price of avocados in the domestic market is modeled as a random variable, following a uniform distribution between 0.68 and 0.90 per kilogram. The price is between 1.58 and 2.04 per kilogram for the international market.
The decision to reinvest profits is based on the profit level: if the profit exceeds the maximum reinvestment amount, the producer will reinvest the maximum amount. Otherwise, the producer will only invest 20% of the profit, provided that the profit is positive. Government support is represented by a fixed amount of 2262.54, representing the maximum amount of support provided by the state to cover production costs. Financing needs are calculated as the cumulative negative cash flows in the current scenario. Access to credit, implementation of GAPs, producer association membership, and government support are auxiliary variables closely related to the scenarios considered in the simulation. These variables are discussed in more detail in the Results section. The values in the equation represent the percentage increase when these strategies are implemented. The simulation evaluates them based on the assumption that the producer has implemented these strategies.

3.3.4. Description of the Model Level Equations

The level equations and their mathematical notation are known as state variables because they only change with time; they ultimately determine the system’s dynamic behavior. Equations (1) to (6) represent the behavior of the level variables. Equations (1) to (6) describe the behavior of the level variables. Equation (1) is used to calculate the accumulated production. Equation (2) models the behavior of the accumulated inventory, accounting for production and sales. Equation (3) measures the accumulated increase in productivity. Equation (4) describes the behavior of the accumulated flow of profits. Equation (5) allows the identification of the maximum debt level. Equation (6) calculates the decrease in debt over time, accounting for periodic payments made by the producer.
d A d t = p t ;
d I d t = h s ;
d P d t = P ;
d U d t = R e v E x R e i ; IF ( R e v E x R e i ) > 0 0 ; IF ( R e v E x R e i ) 0 ;
d U d t = F N ; IF ( F N ) > 0 0 ; IF ( F N ) 0 ;
d B d t = q ;

3.4. Structure of the Causal Diagram

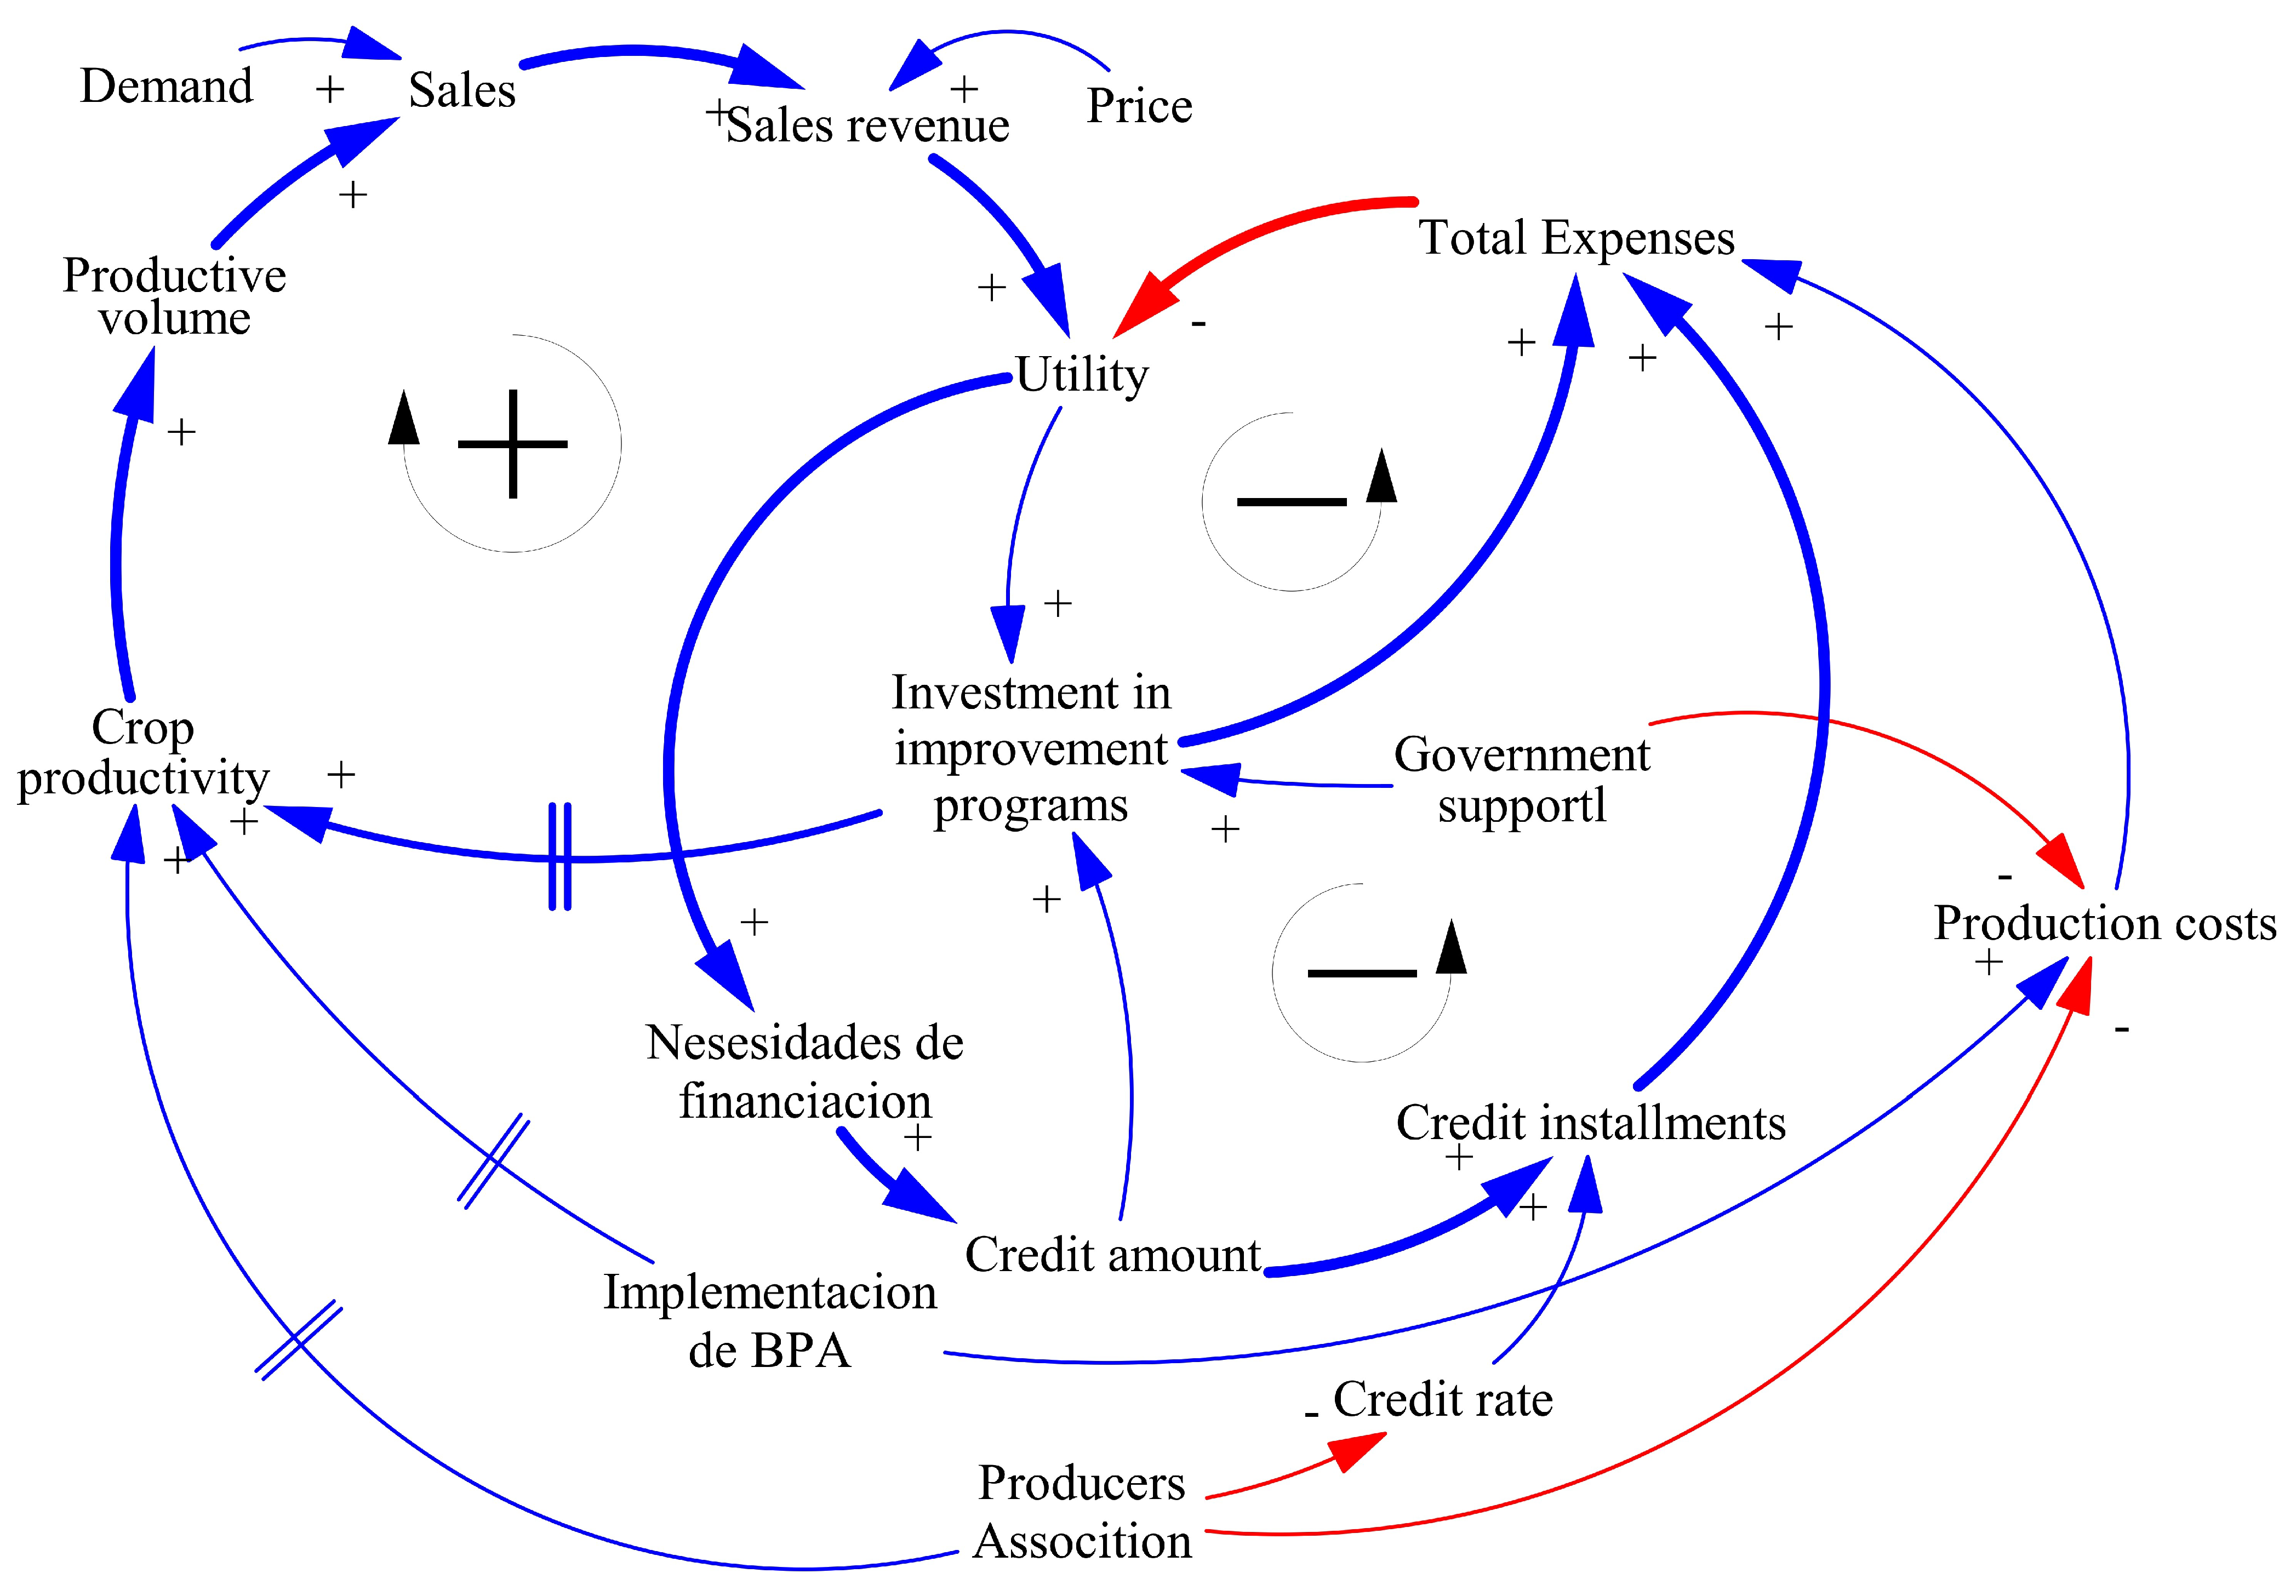
Causal diagrams are graphical representations of variables connected by arrows, indicating causal relationships between the variables [54]. They allow us to understand the possible routes of association between causes and effects and other alternative routes that may produce biases in the association [55]. In the context of this research, the low productivity of the agricultural sector has a significant impact on the farmer’s cash flow, as typical scenarios tend to involve more cash outflows than inflows. Thus, the cash flow is affected by the farmer’s income and expenses: demand, sales, and product price per kilogram influence revenues. The product’s price is lower if sold in the domestic market. By applying good agricultural practices, farmers can produce high-quality avocados, which adds value to the product and allows the producer to sell on the international market at a higher price. The farm’s production volume is influenced by the productivity index, which increases as a function of investment in improvement programs, such as implementing irrigation techniques, phytosanitary control, or applying good agricultural practices. Producer association membership also positively impacts productivity and is related to production costs, as association members can achieve cost reductions. In addition, member producers may have easier access to credit with lower interest rates than independent producers. Figure 5 shows the causal relationships between these variables and the positive and negative feedback loops. In this study, a positive feedback loop was identified, represented by the symbol (+) surrounded by a circle with an arrow pointing in the direction of the loop. Two negative feedback loops were also identified, represented by the symbol (-) surrounded by a circle with an arrow pointing to the left to indicate the direction of the loops.

3.5. Construction of the Forrester Diagram

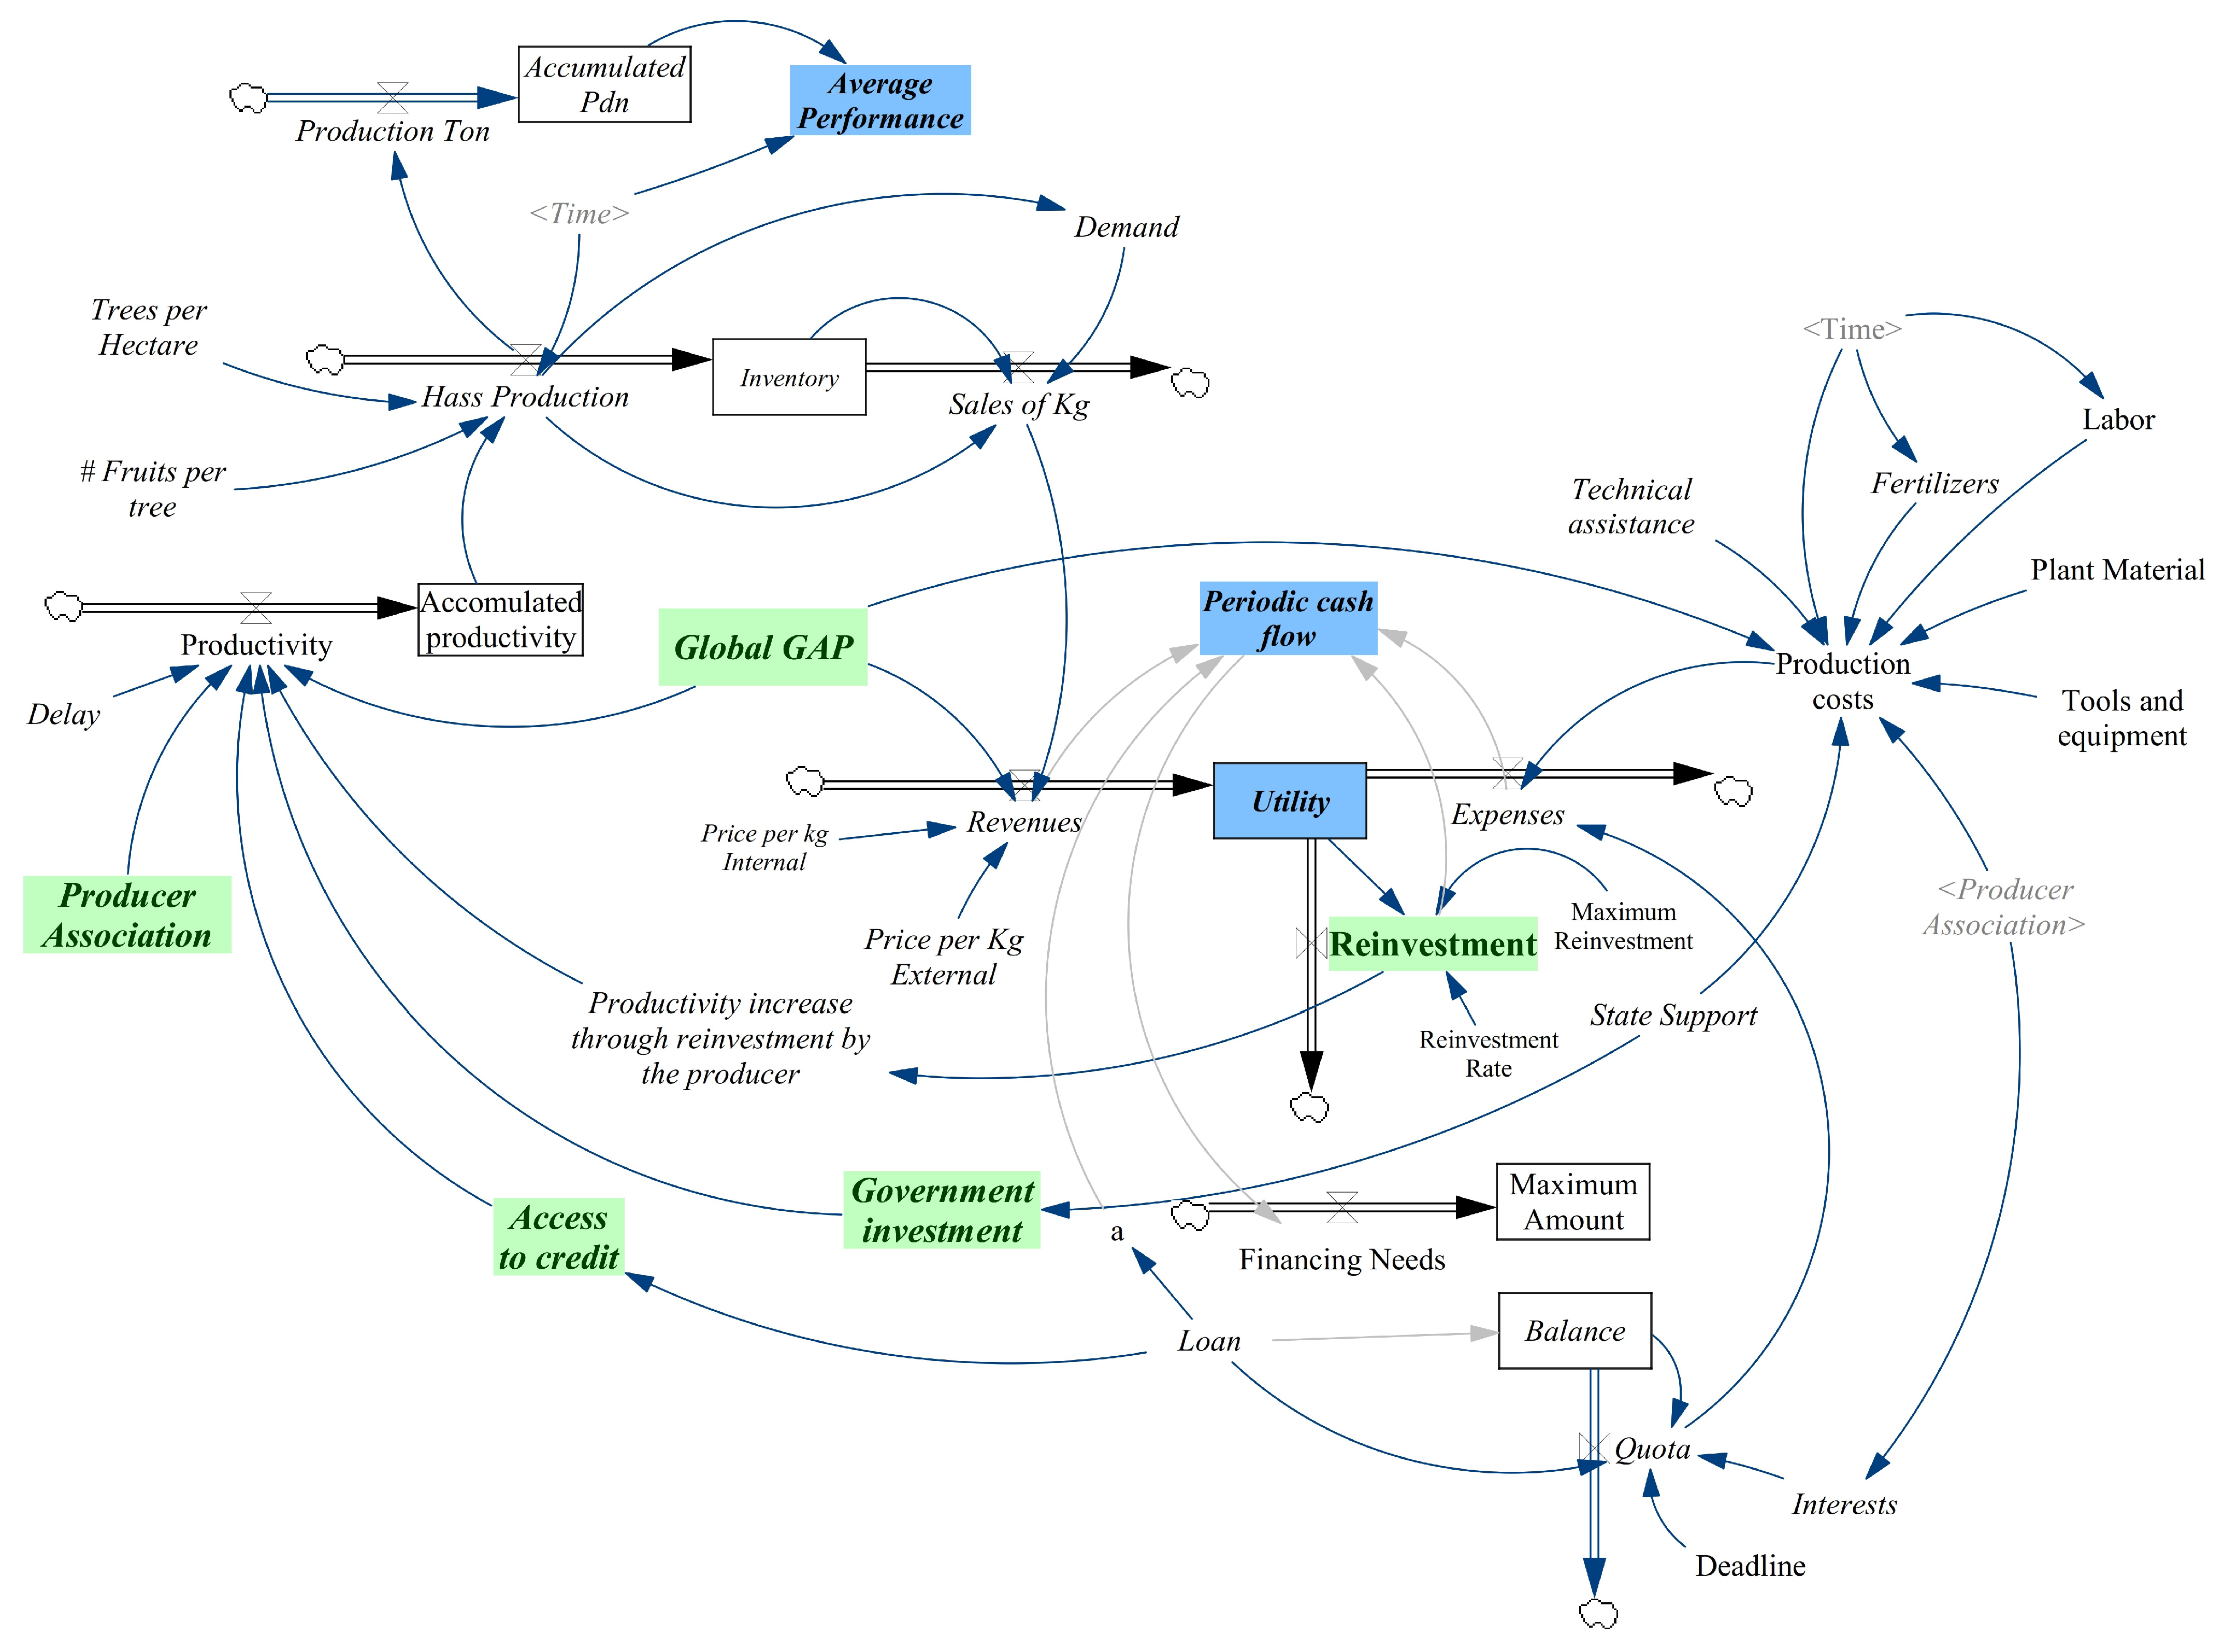
The Forrester diagram, illustrated in Figure 6, represents the interdependent variables and parameters involved in the production chain of Hass avocados, from production to marketing per kilogram of fruit. This model employs a cause-and-effect analysis to evaluate the relationships between policies and investment strategies in crop improvement programs and the benefits of these initiatives. The Forrester diagram is a precursor to developing a system of first-order differential equations, as described in [56].

4. Results and Discussion

In system dynamics, a simulation is defined as the experiments conducted in a model—rather than a real system—through simulation scenarios, making it possible to observe the effects that the adoption of a new strategy or a new form of organization will have on the real system [57]. In this study, five scenarios were modeled to evaluate various strategies aimed at improving the productivity and profitability of the Hass avocado production chain, with a simulation time of 15 years and a time interval of one year. These scenarios can be used to evaluate the behavior of the proposed strategies within each scenario and can be replicated for other production chains and permanent crops managed by small producers.
The first scenario simulates the current situation of small Hass avocado growers. The second scenario introduces the option of access to credit for investment in crop improvement or new planting projects, allowing for the identification of benefits gained by producers through such access. The third scenario incorporates the implementation of GAPs to evaluate the associated costs and impacts. The fourth scenario examines the effects on the system’s behavior when independent producers decide to join an association. Finally, the fifth scenario considers government investment in small producers to identify government support’s economic and performance impacts on crop development.
The financial results obtained from the simulation were validated with the findings of other research, such as those of [58], who conducted a pre-feasibility study for the production of Hass avocados in another region of Colombia. These results show that the investment is recovered within six years, which differs by one year from the results of the present study. This difference can be attributed to the present study focusing on small producers who still need machinery and cultivation technology, leading to a longer recovery. The results of the present study were also compared to those of producers in leading avocado-producing countries such as Mexico, who can recover their investment within four years, as reported in [59]. However, the profits obtained are subject to debate, as the area studied in the Colombian reference study is 4 hectares. In comparison, the area studied in Mexico is 25 hectares and the present study only considers the production of 1 hectare, leading to variations in profits and investment recovery time.

4.1. Scenario 1—Current Situation

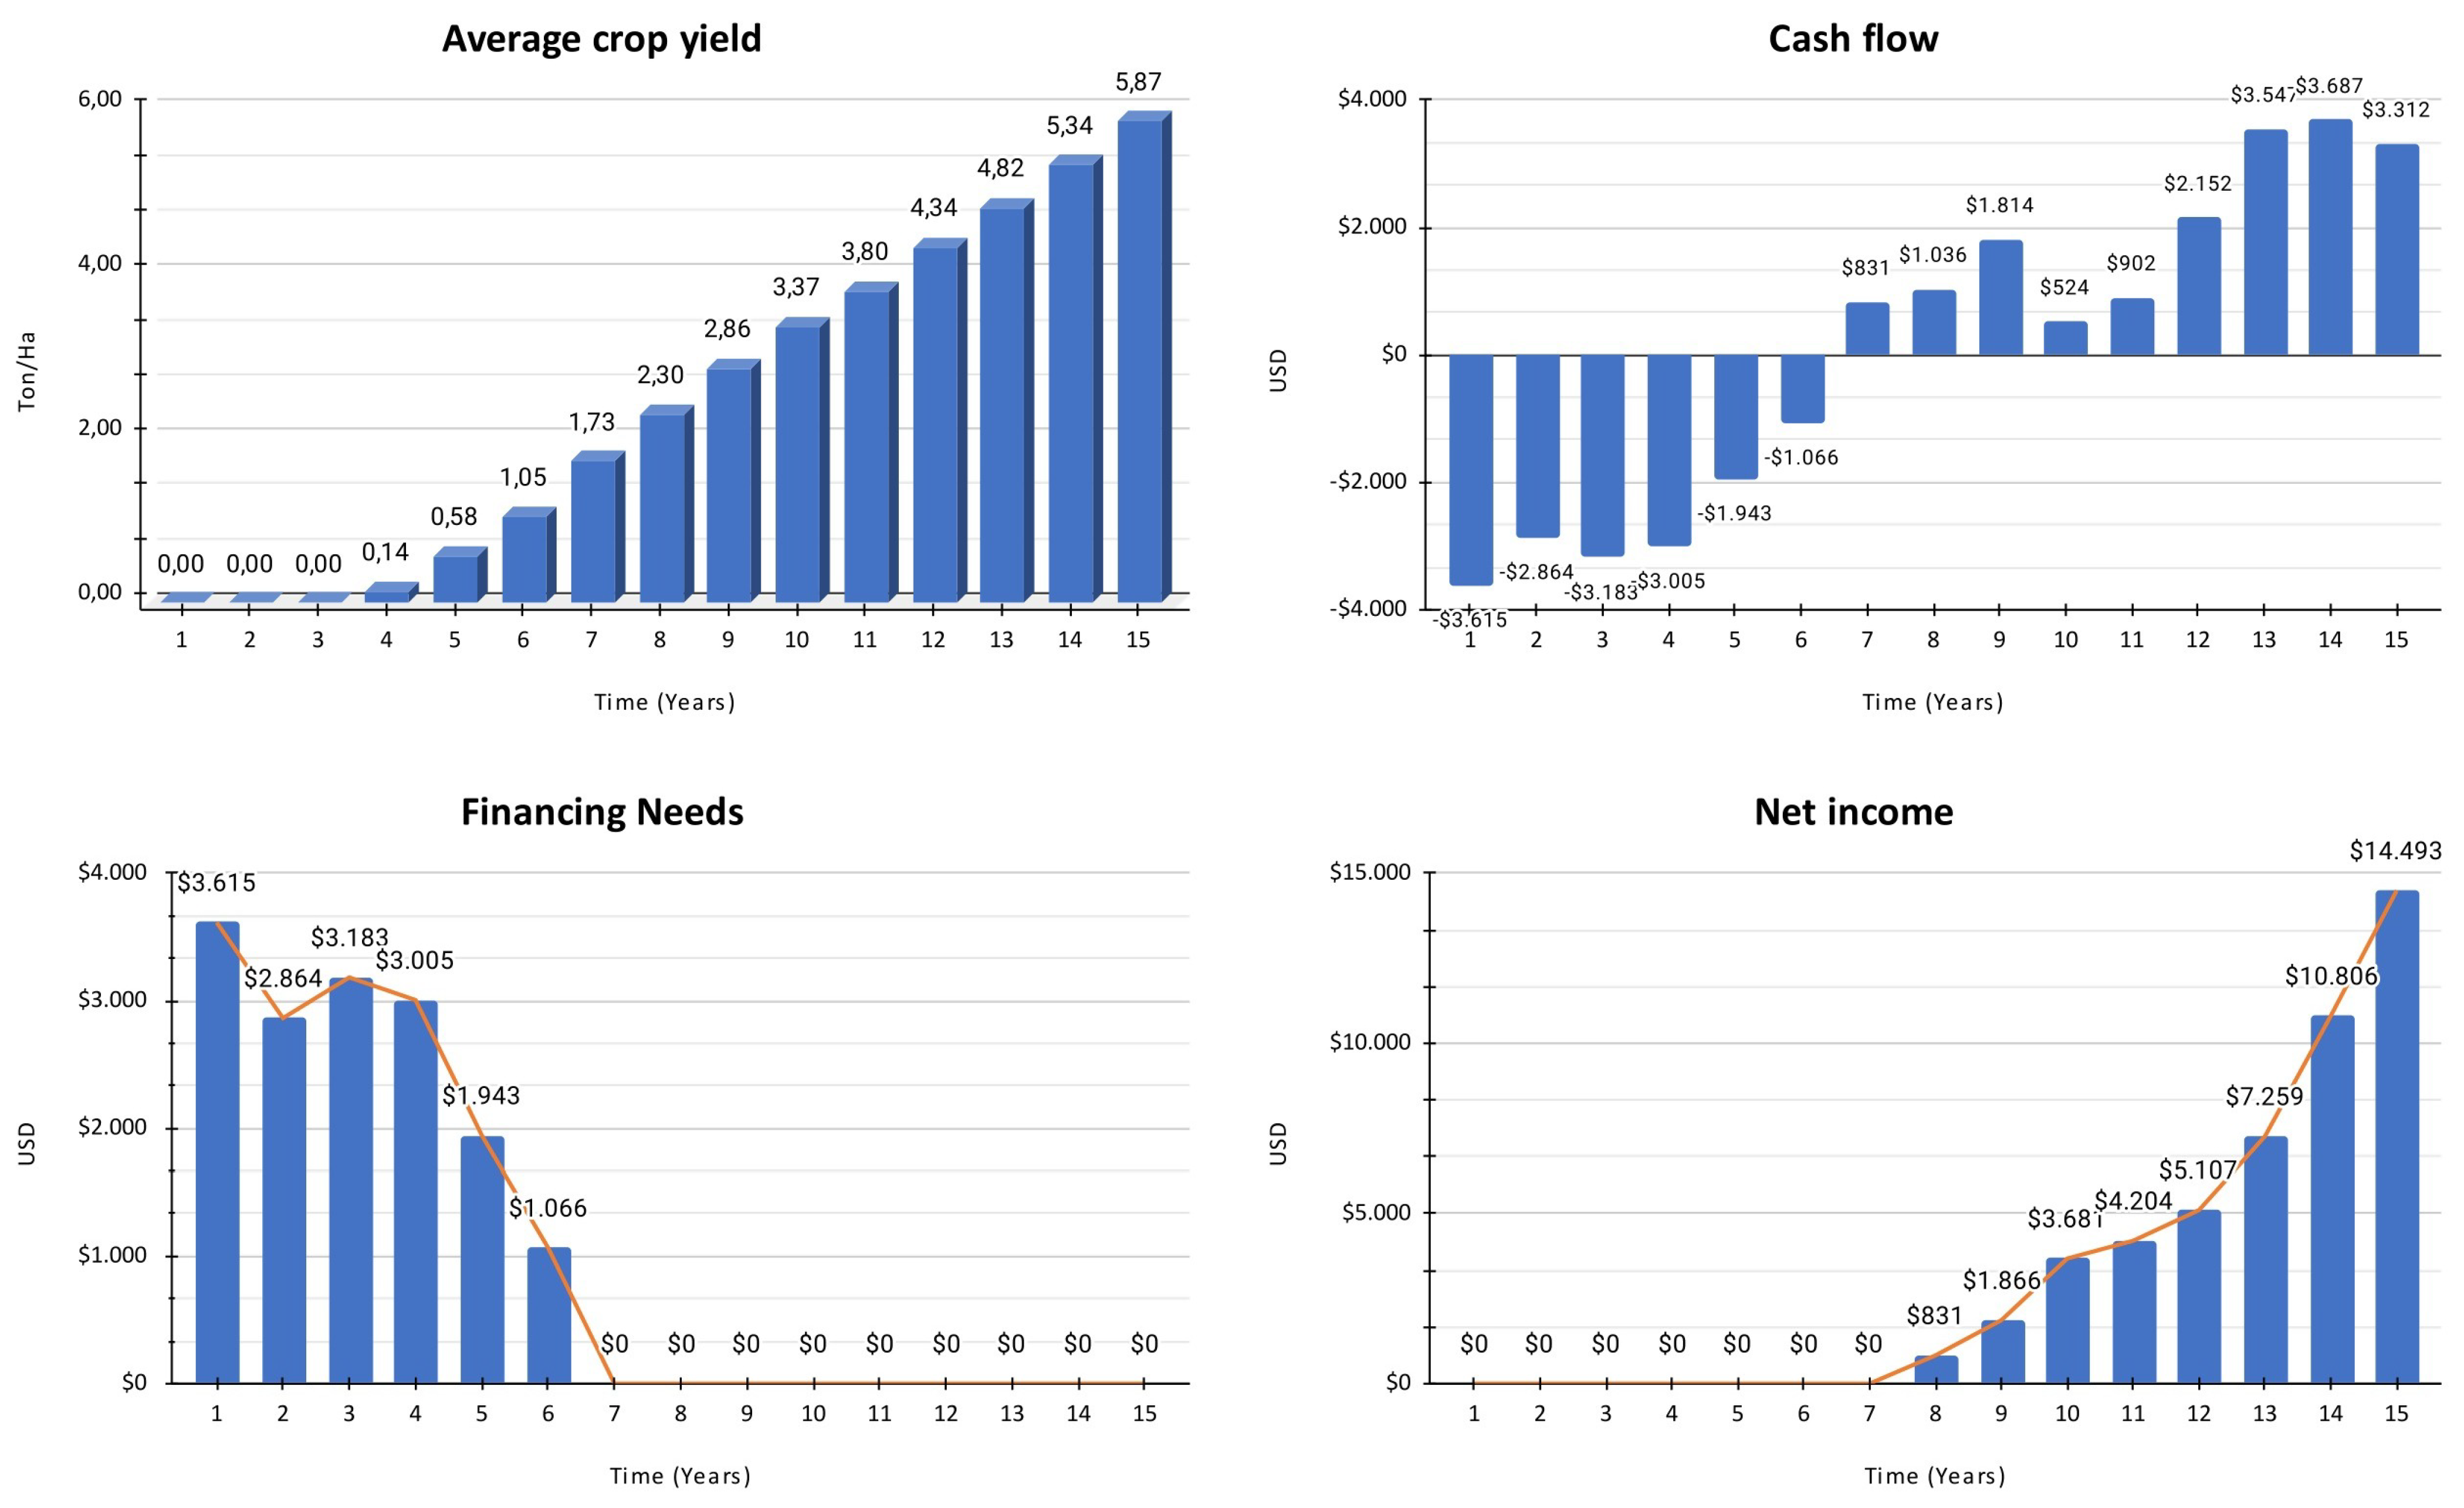
Scenario 1 represents the current performance of the production chain, and Figure 7 shows the indicators used to measure its performance: Average crop yield per year, annual cash flow, annual financing needs, and cumulative net income.
In this scenario, the average yield for the previous year’s harvest was 5.87 tons per hectare, which is low compared to other countries, such as Mexico, where yields reached 18 tons for the same year. This production deficit negatively impacts the cash flow indicator, as the first few years exhibit more cash outflows than inflows. Despite this, the small producer becomes profitable in the seventh year, achieving a total profit of USD 831. The cumulative net cash flow indicator shows that the cumulative net income between the seventh and fifteenth years amounts to USD 14,493. Finally, the financing needs indicator reveals a cash deficit in the first year of USD 3615, which decreases to USD 1066 by the sixth year. If these financing needs were covered through access to credit, an improvement in production yield could be expected. This option of access to credit is evaluated in Scenario 2.
These results indicate that small Hass avocado producers in the southwestern region of Colombia face economic challenges. One potential solution to these difficulties would be for producers to acquire a significant initial working capital to invest in technical and technological improvements, enabling them to achieve profitability in a shorter time frame. Another option for adding value to Hass avocados would be to implement technology in the production process and obtain certifications such as an appellation of origin. In the case of other products, such as dairy, obtaining an appellation of origin has been shown to improve the profitability of small producers, as reported in [60]. An appellation of origin serves as a unique marker of a specific geographic location where high-quality products are produced, directly linking the quality of these products with that location. Obtaining this status would add value to Hass avocados produced in the region, making them more competitive in the market and increasing their sales value.

4.2. Scenario 2—Access to Credit

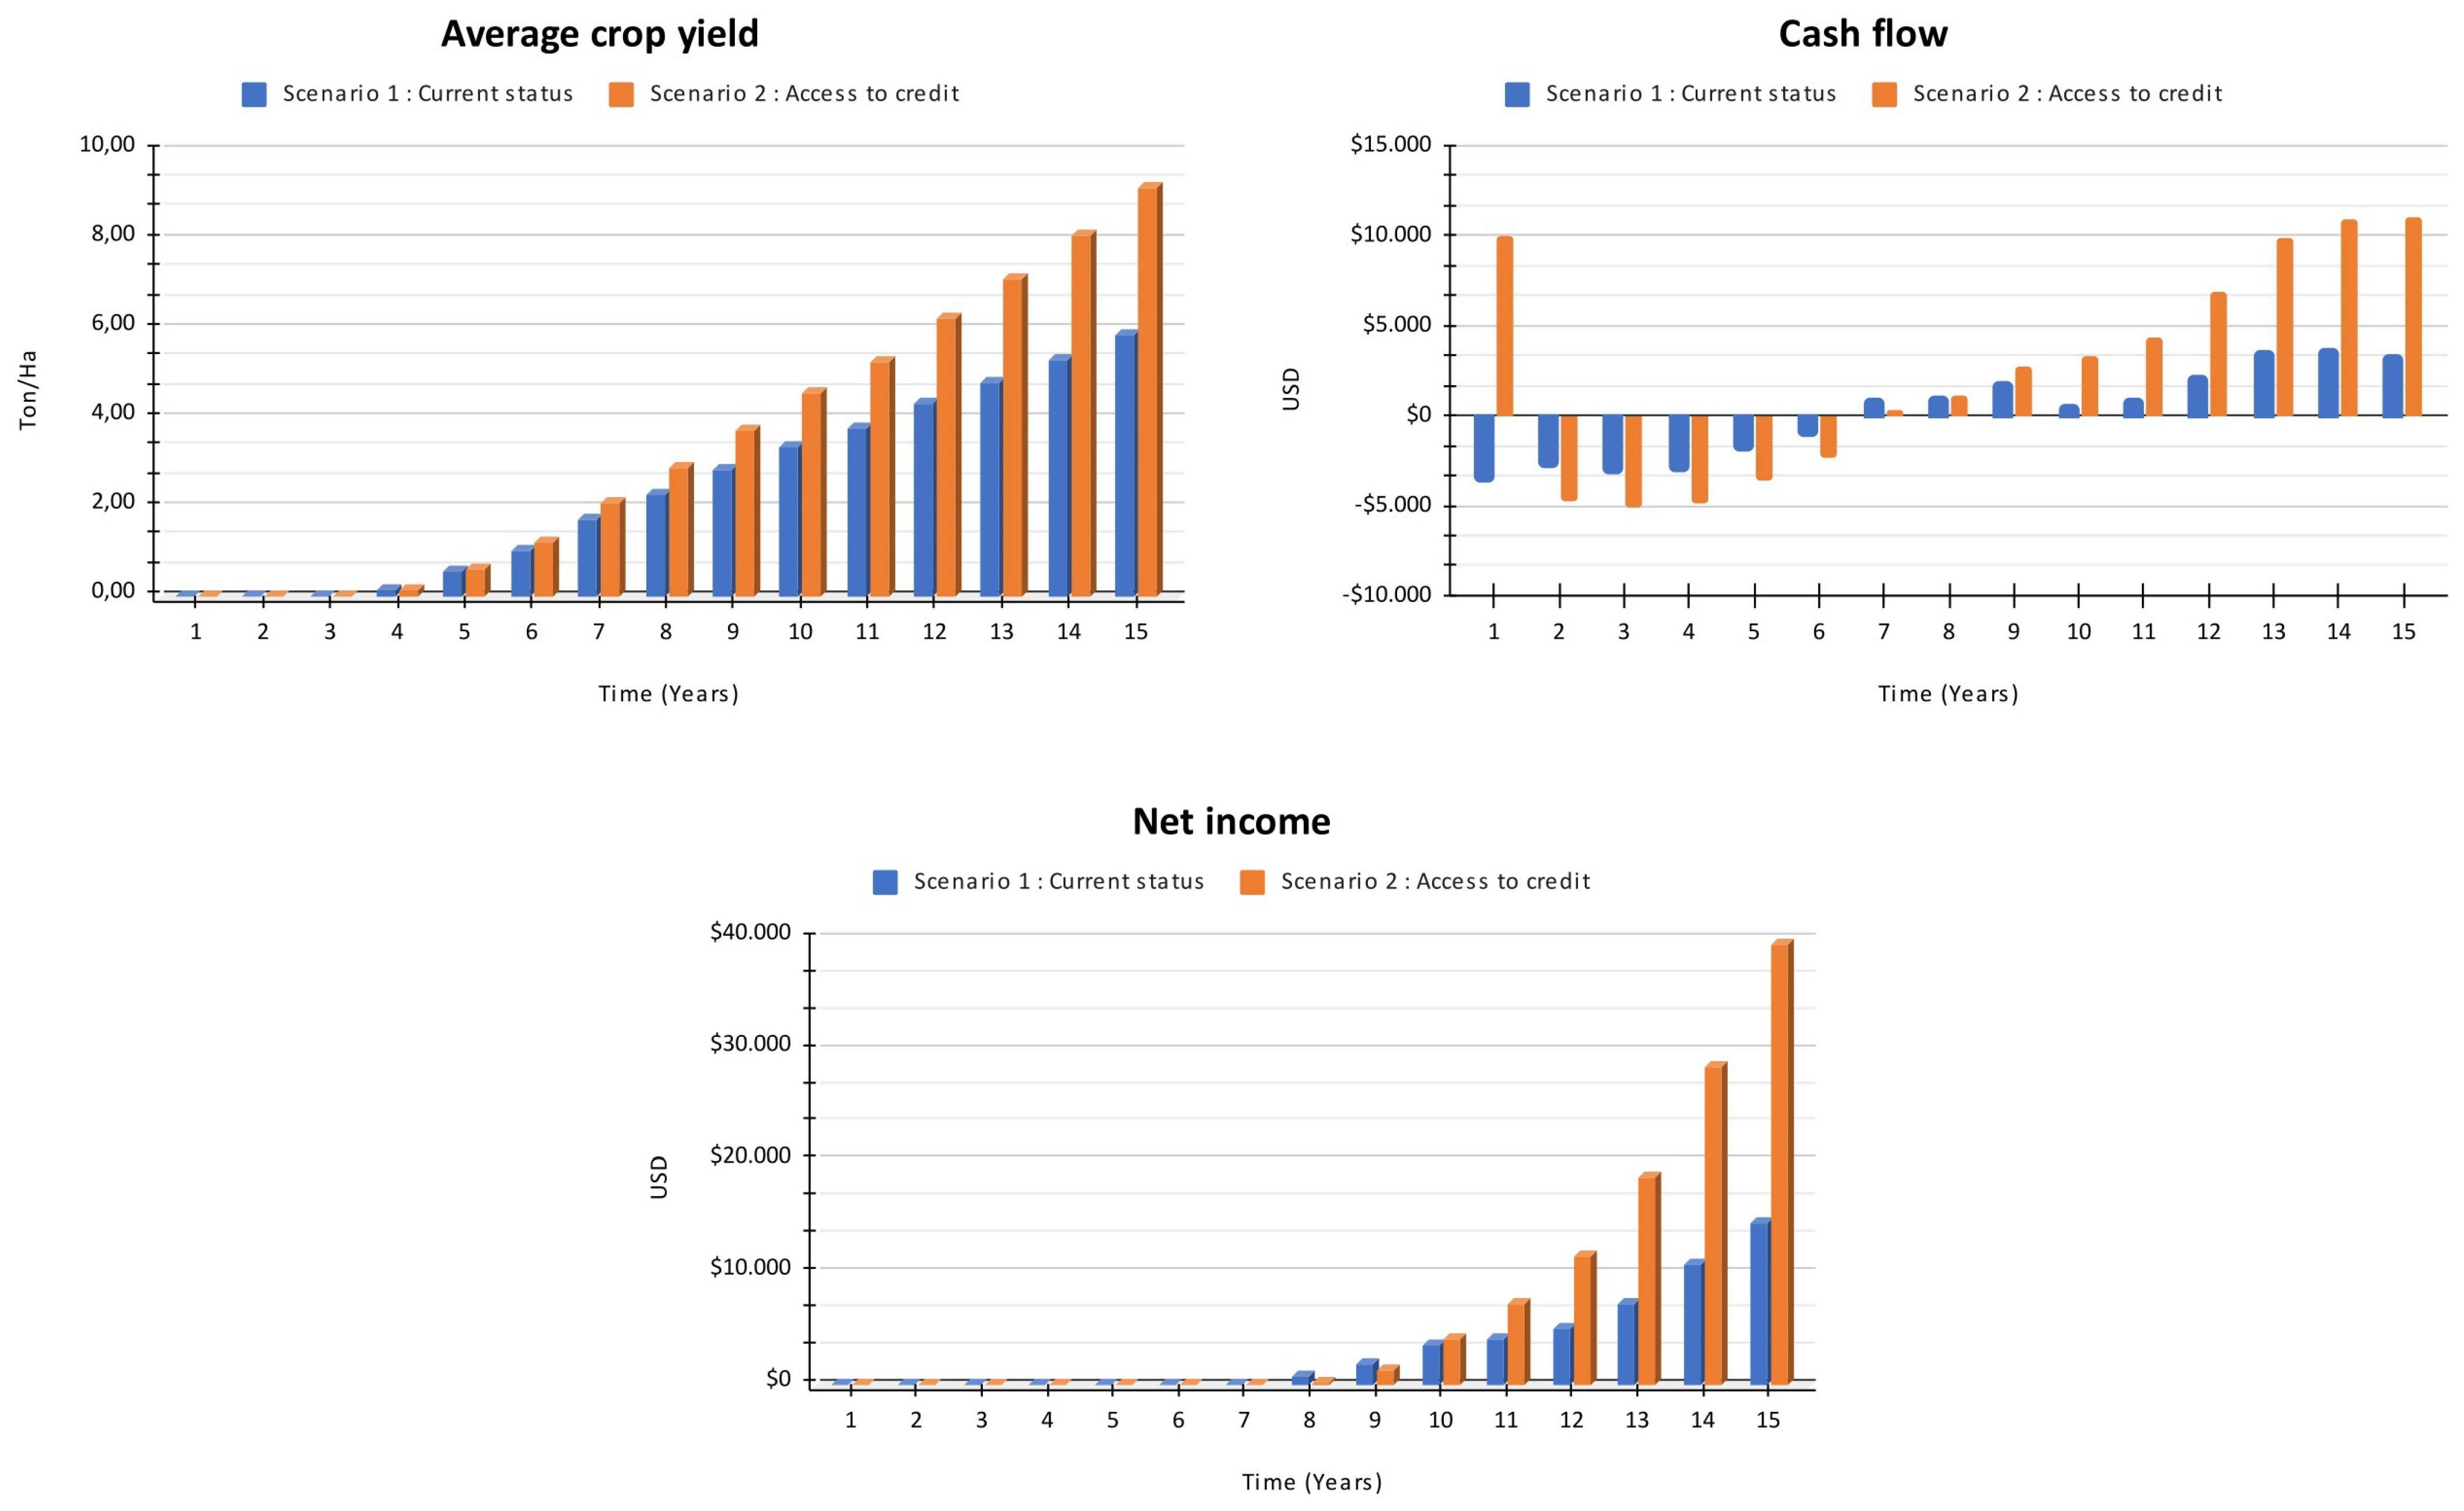
The second scenario evaluates the performance of the production chain when small producers have access to credit. With access to credit, small producers can cover the financing needs observed in Scenario 1 and invest in machinery and other means of upgrading crop production. The results indicate that access to credit increases yields by 0.838 tons per hectare, representing a productivity increase of 7%. Figure 8 illustrates the behavior of the average annual yield, cash flow, and cumulative net profit indicators under this scenario.
The average annual yield graph reveals that the increase in yield between the current scenario and the scenario with access to credit, with year 15 as a reference, is approximately 50%, going from 5.8 to 8.1 tons per hectare. The cash flow indicates that the outflows in the first few years are higher due to the need to pay credit installments during this period. However, the cumulative net income indicator over the 15-year simulation period shows an increase of 176%, from USD 14,493 to 40,000 per producer. This suggests that producers with access to credit can pay their debt plus interest and achieve higher profits than those without such access. It is also noteworthy that Scenarios 1 and 2 are similar during the first four years of cultivation, indicating that credit support strategies must be durable and flexible to prevent economic bottlenecks in the early years. In addition, the performance improvement is significant from the tenth year onwards, providing significant benefits to producers in these later years.
The results of the second hypothesis are supported by other cases in which small producers have easy access to credit. For instance, the federal government has improved public financing and specialized services in Brazil to help small producers increase their productive capacity. It has also implemented a strategic plan to strengthen technological and product differentiation capabilities, resulting in producers with more significant economic capacity and contributing to the consolidation of the sector in the country, as reported in [61]. Similarly, Onakoya et al. in [62] have studied the impact of small-scale enterprise financing on Kenya’s economic growth, concluding that this developing country has achieved favorable economic results. These studies suggest that the simulation for Scenario 2 in the present research may be accurate, indicating that providing loans to small producers and improving the socioeconomic context would benefit the avocado sector.

4.3. Scenario 3—Implementation of Good Agricultural Practices

Obtaining certification for GAPs, which focus on producing safe and high-quality food, enables avocado producers to be more competitive in the market. Certified producers typically find that the primary advantage of adopting GAPs is access to more and better markets. Additionally, GAPs improve the safety of farm workers and end-consumers through the implementation of good management practices for inputs and agrochemicals, as well as traceability systems. The main disadvantage of GAP certification is the increased production costs associated with implementing and maintaining these practices, as discussed in [53].
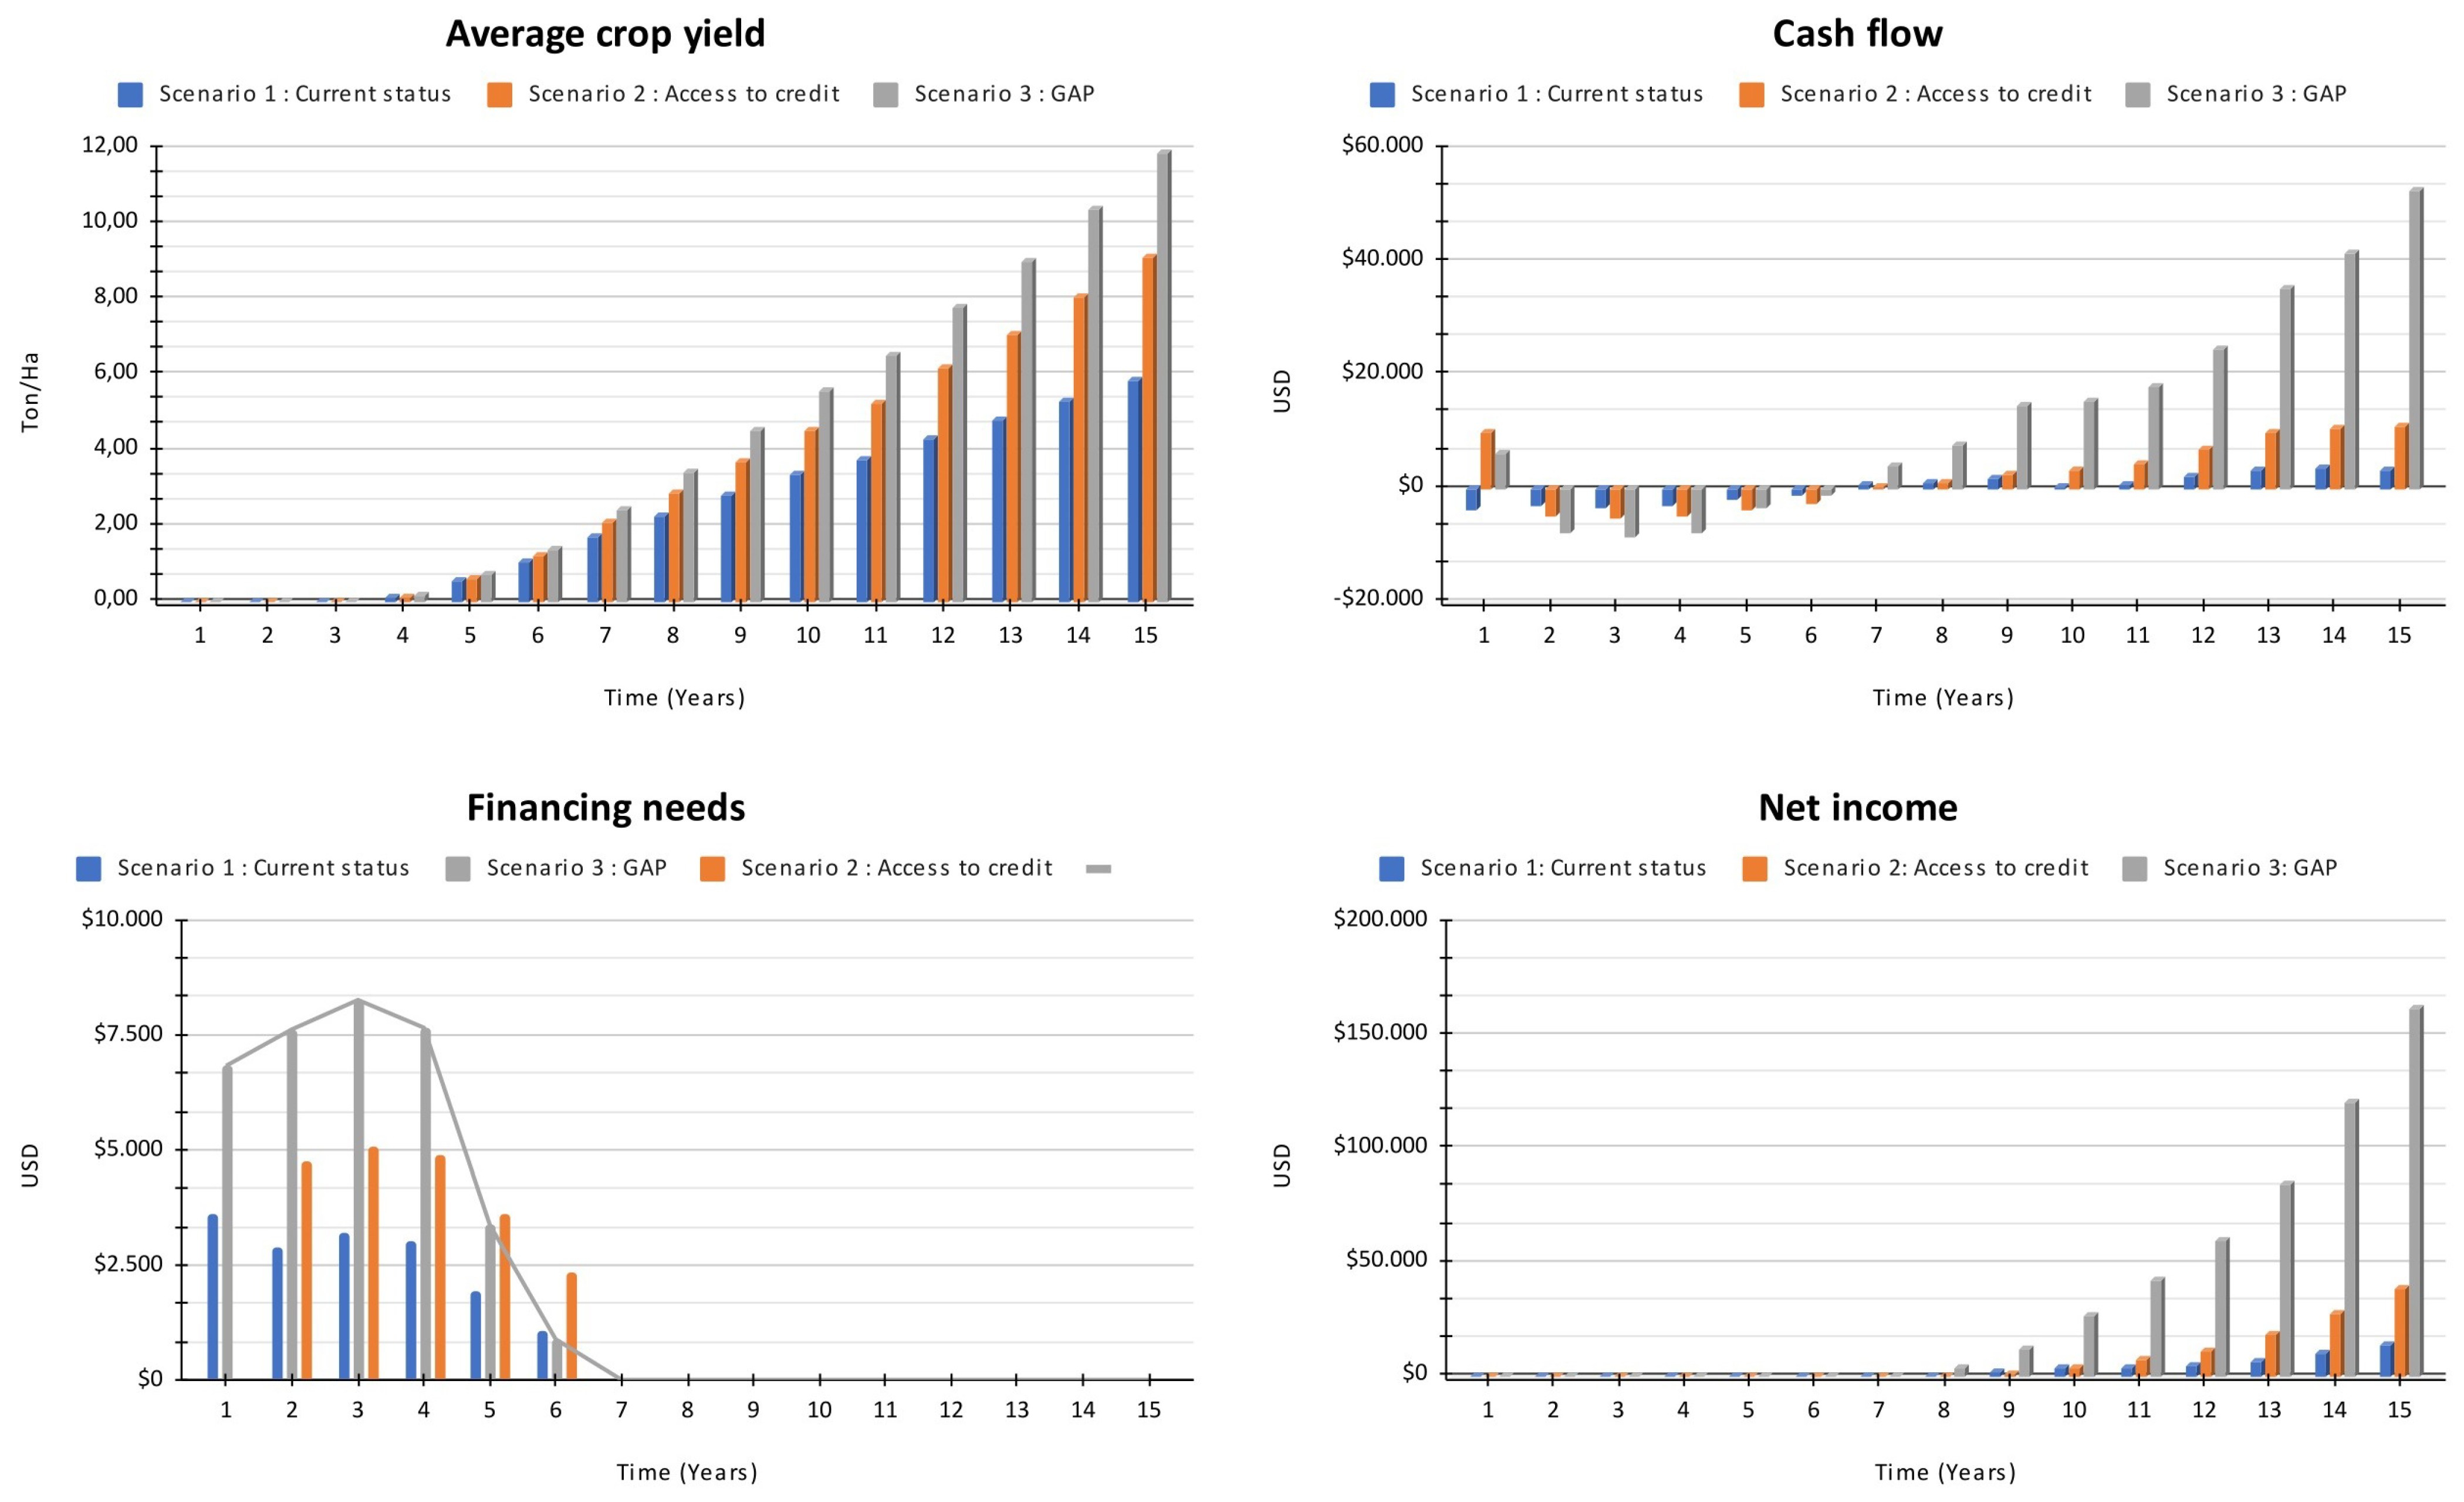
Figure 9 shows the impact of implementing good agricultural practices compared to the previous scenarios.
After GAPs, the average yield of avocado production increases to nearly 11.5 tons per hectare, allowing for a larger quantity of higher-quality fruit that can be sold at higher prices in international markets. This results in an accumulated benefit of approximately USD 160,000 for the producer.
Initial cash flow may be lower compared to current scenarios but recovers more quickly than in previous scenarios, with a significant increase in income. This suggests that GAPs play a crucial role in improving avocado productivity and have the potential to enhance sector profitability in the future.
The final graph illustrates the relationship between financing needs and production costs. When GAPs are implemented, production costs increase, and the green line representing financing needs also increases in the initial years because of the implementation and maintenance of GAPs and sustainability measures. These actions during production ensure the quality and safety of the product, as well as labor, social, and animal welfare, and protect human health and the environment in the Hass avocado sector. Implementing these practices would bring benefits not only to the sector but also to the surrounding social context of production.
Scenario 3 supports the hypothesis that implementing good agricultural practices yields medium- and long-term benefits for the production of food for human consumption, confirming that making an initial investment in technical upgrades or implementing contract farming allows farmers to reap more significant benefits from production and also helps the country remain competitive in the global market (a requirement for Global GAP certification), as reported in [63].

4.4. Scenario 4—Producer Association Membership

Scenario 4 analyzes the benefits of producers joining an agricultural association or forming one among themselves. Besides cost advantages, association membership enables producers to obtain credit at lower interest rates. According to FINAGRO’s services portfolio, the interest rate for independent producers in 2021 was 8.7% per annum, while the rate for association members was 6.7%, with increased flexibility and accessibility of credit.
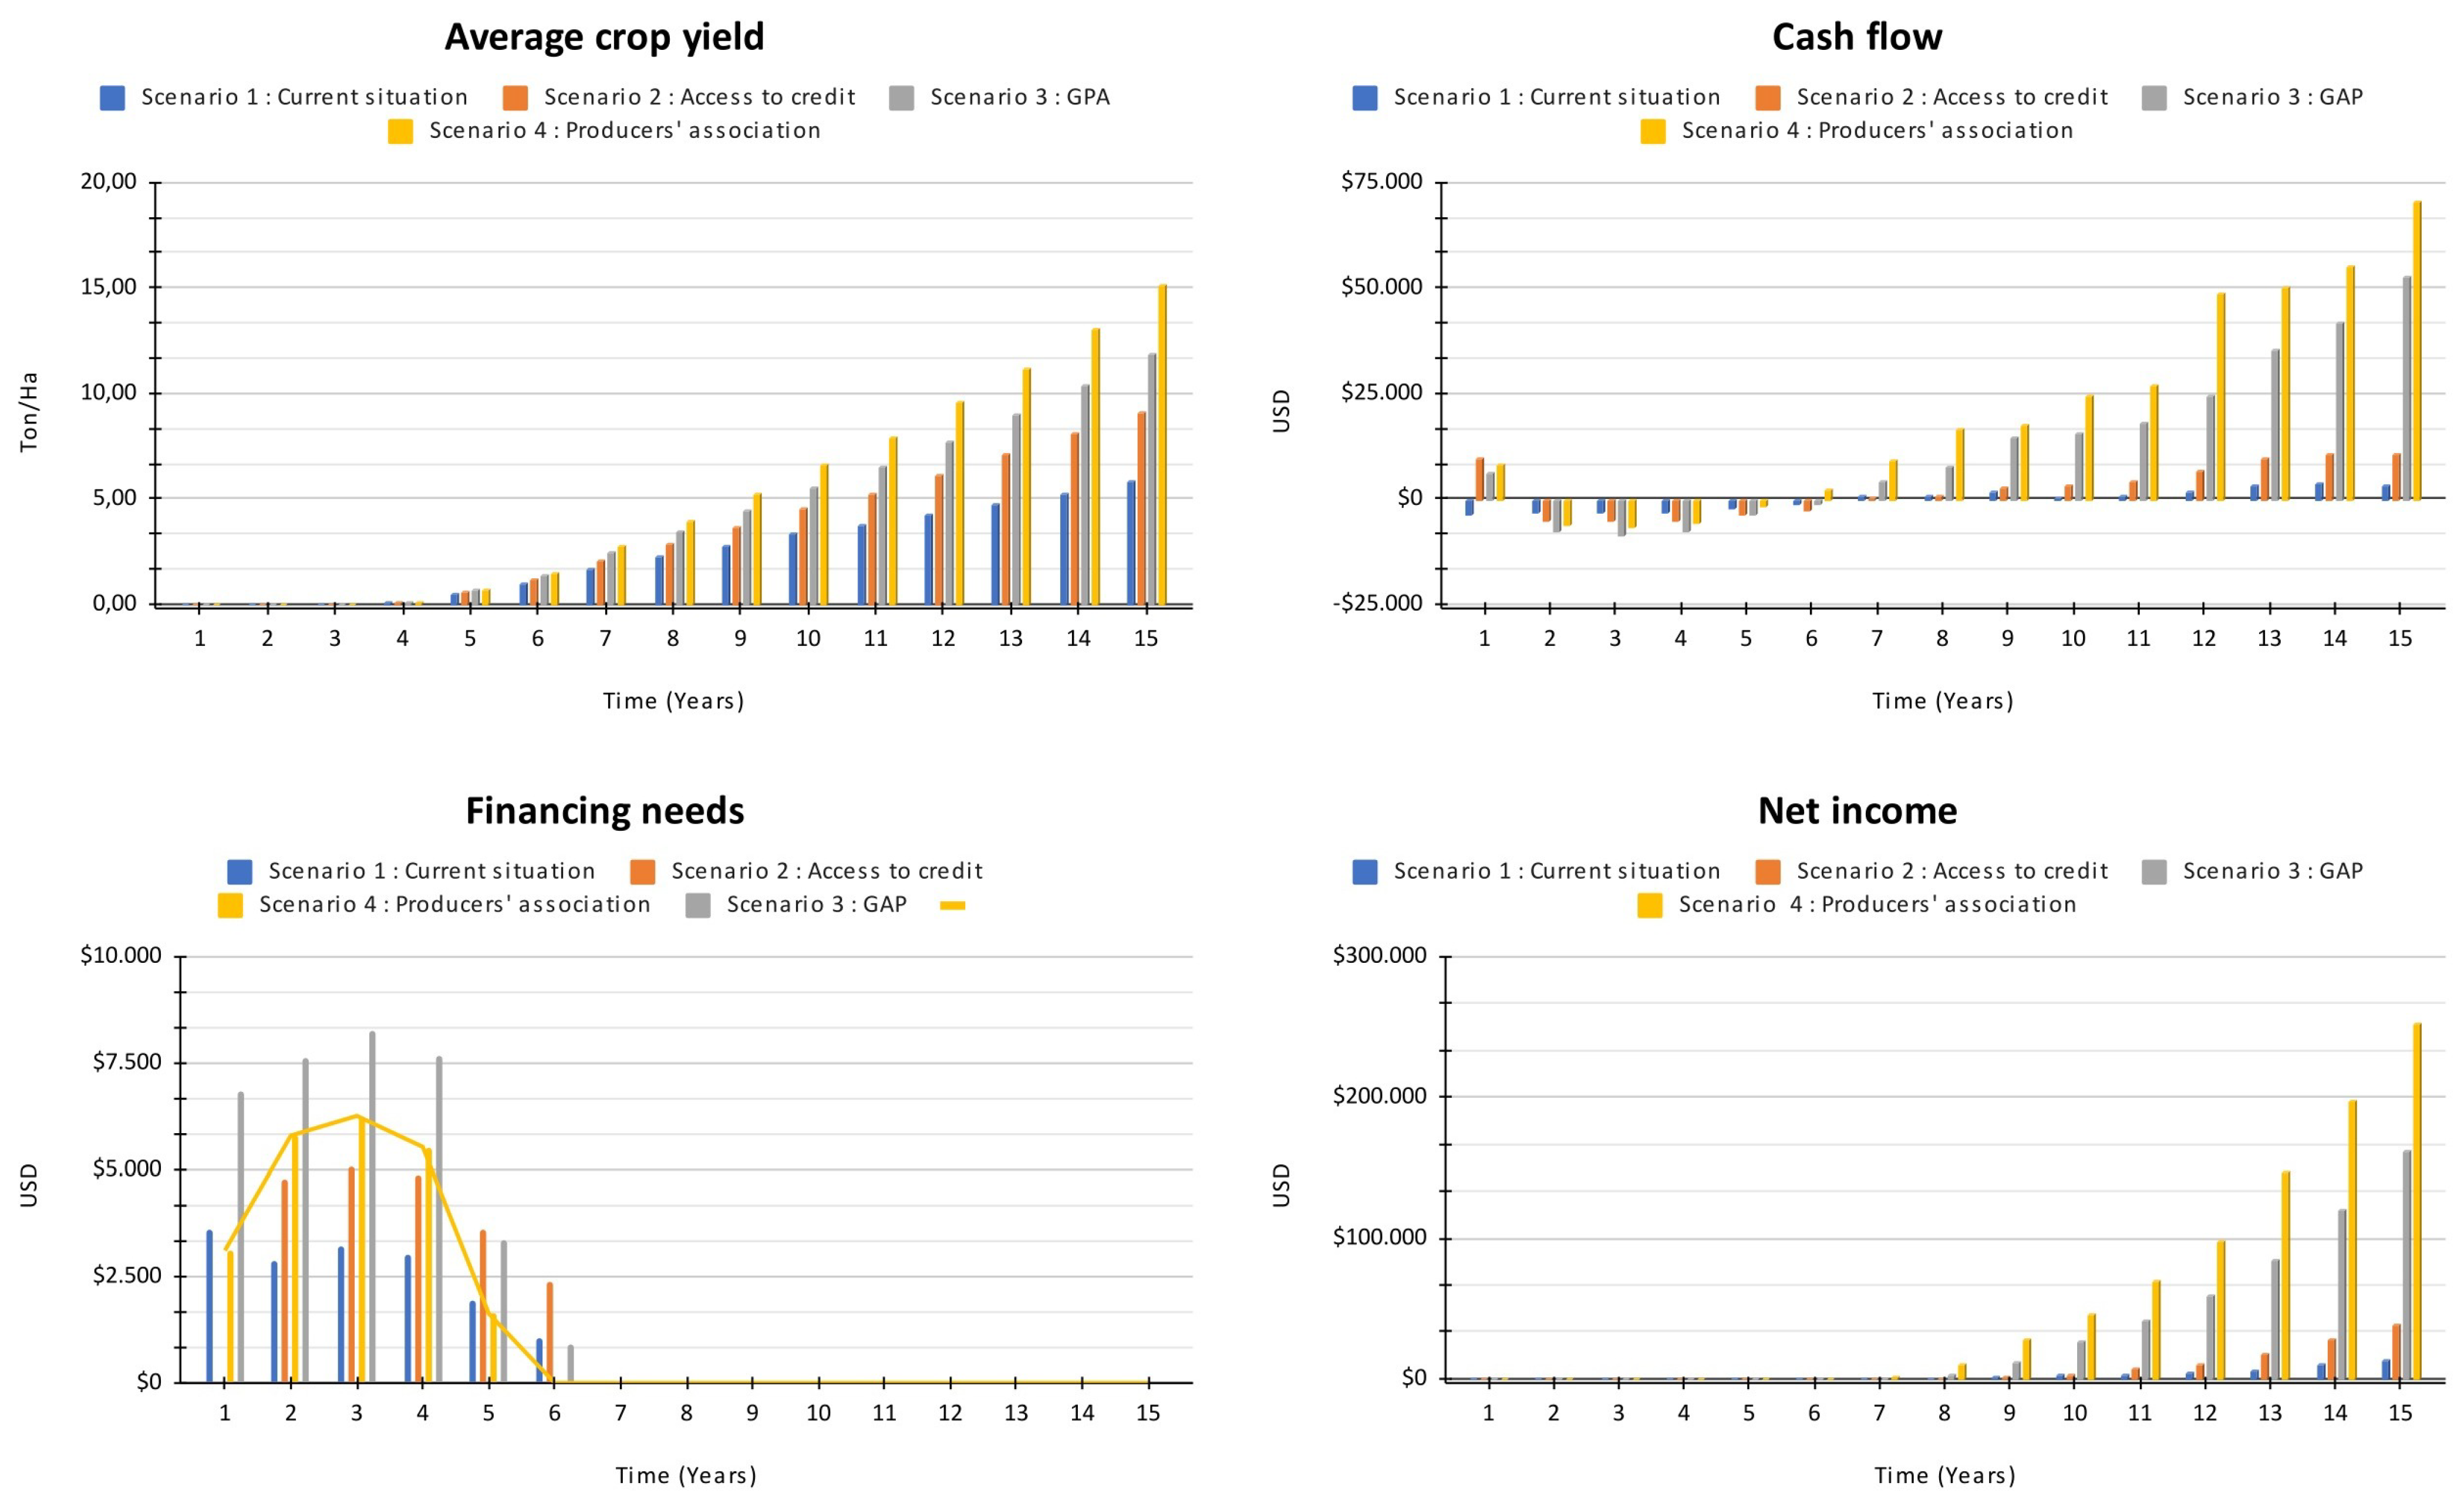
Figure 10 compares the performance of an agricultural association with other scenarios. The yield graph indicates an increase to 15 tons per hectare. In terms of cash flow, expenses are lower than in the previous scenario. By belonging to an association, associated costs are lower compared to the current scenario, along with the inherent advantages of membership, such as increased access to markets and the ability to participate in policy dialogue aligned with their interests. As it reduce costs through the association, financing needs are also reduced, allowing for investment in improvement programs with lower debt and interest rates.

4.5. Scenario 5—Government Support and Investment

Figure 11 shows a scenario in which the government invests in improvement projects for small-scale Hass avocado growers. The current government support provided to farmers, including planting materials, certified seeds, technical advice, and some inputs and fertilizers, was considered.
This scenario exhibits a much greater competitiveness, reflecting the situation in other leading avocado-producing countries, with an average yield reaching 16 tons per hectare and an accumulated profit exceeding USD 300,000 over 15 years. This would directly address rural poverty and significantly improve the quality of life for producers.
The graph representing financing needs shows that, with government support, these needs are practically non-existent; producers would not have to go into debt because the state would assume those costs, resulting in no outflows in the cash flow and profits being generated as soon as it yield the first harvest. The high-income levels would reinvest in the crop and harvest.
The results align with other findings in the literature [64], indicating that government support policies for agriculture contribute to increasing the price of agricultural land and, subsequently, to improving the competitiveness and sustainability of agricultural production and reducing associated risks. This shows that the government should be a key player in the Hass avocado production chain, and its participation as a guarantor in assisting less profitable productive sectors with inputs such as technical upgrades or improving their cash flow is vital for the industry’s consolidation in Colombia.

5. Conclusions and Further Work

This research presents the simulation of different scenarios using system dynamics for the Hass avocado production chain in the southwestern region of Colombia, considering factors such as cash flow, good agricultural practices, and association membership. The study’s main result is that strategies such as access to low-interest credit, collaborative logistics, and government support in providing technical advice and agricultural inputs are essential measures for promoting developed agriculture that can respond to demand with high-quality products. The study also shows that low yields result from small producers’ lack of financial support for investing in crop improvement and modernization programs.
The research identifies the need for financial institutions to provide better credit instruments for avocado production. Since this crop generates income only after the third year, producers may need more resources to cover loan payments during the first two years. Good agricultural practices play a crucial role in determining a farmer’s productivity and cash flow. Although implementation and maintenance of these practices incur high costs, the results show that this improvement strategy is profitable and creates a sustainable production chain model over time. Finally, association membership is also a crucial strategy in reducing the costs of acquiring technology and inputs and adding value and efficiency to marketing, which translates into better economic and capital benefits for the members. It could also scale these actions up to other crops currently being consolidated in the market.
As a follow-up study, it could conduct an analysis to forecast the behavior of Hass avocado prices over the years, considering exchange rates, consumption, and production rates worldwide and modeling this data to obtain more reliable results for decision making. Extending the model to other production chains with their respective characteristics and contexts would provide government agencies and associations with further information to take action for the benefit of the production chain.

Author Contributions

Conceptualization, Y.E.A.M. and A.F.S.P.; methodology, Y.E.A.M., O.R.-O., and H.P.; software, Y.E.A.M. and A.F.S.P.; validation, M.C. and O.R.-O.; formal analysis, Y.E.A.M., O.R.-O. and H.P.; drafting, revising and editing, Y.E.A.M., A.F.S.P., M.C. and A.L. All authors have read and agreed to the published version of the manuscript.

Funding

Yesid Ediver Anacona Mopan, Helmer Paz, and Andrés Felipe Solis Pino gratefully acknowledge the support by the Corporación Universitaria Comfacauca-Unicomfacauca. Yesid Ediver Anacona Mopan and Oscar Rubiano Ovalle are additionally grateful to Universidad del Valle. Mario Chong and Ana Luna would like to acknowledge CONCYTEC’s and PROCIENCIA’s contribution to the development of this paper by providing crucial financial support under grant number N°068-2021-PROCIENCIA.

Institutional Review Board Statement

Not applicable.

Informed Consent Statement

Informed consent was obtained from all subjects involved in the study.

Data Availability Statement

A video of the proof of concept and materials used in this research can be accessed in the following link (https://bit.ly/3xyTK9e, accessed on 20 Septmber 2022).

Acknowledgments

Thanks to the Hass avocado leaders and producers in the department of Cauca for providing us with the data and sharing their experiences.

Conflicts of Interest

The authors declare no conflict of interest.

Abbreviations

The following abbreviations are used in this manuscript:
SDSystem Dynamics
ICAColombian Agricultural Institute
GAPGood Agricultural Practices

References

  1. da Cunha Dias, T.A.; Lora, E.E.S.; Maya, D.M.Y.; del Olmo, O.A. Global Potential Assessment of Available Land for Bioenergy Projects in 2050 within Food Security Limits. Land Use Policy 2021, 105, 105346. [Google Scholar] [CrossRef]
  2. Ortiz-Bobea, A.; Ault, T.R.; Carrillo, C.M.; Chambers, R.G.; Lobell, D.B. Anthropogenic Climate Change Has Slowed Global Agricultural Productivity Growth. Nat. Clim. Chang. 2021, 11, 306–312. [Google Scholar] [CrossRef]
  3. Nazareth, D.L.; Rothenberger, M.A. Assessing the Cost-Effectiveness of Software Reuse: A Model for Planned Reuse. J. Syst. Softw. 2004, 73, 245–255. [Google Scholar] [CrossRef]
  4. Sinha, B.B.; Dhanalakshmi, R. Recent Advancements and Challenges of Internet of Things in Smart Agriculture: A Survey. Future Gener. Comput. Syst. 2022, 126, 169–184. [Google Scholar] [CrossRef]
  5. Novikova, A.; Startiene, G. The Advantages and Disadvantages of Intensive and Extensive Farming Activities. Res. Rural Dev. 2018, 2, 139. [Google Scholar]
  6. Ibba, P.; Crepaldi, M.; Cantarella, G.; Zini, G.; Barcellona, A.; Rivola, M.; Petrelli, M.; Petti, L.; Lugli, P. Design and Validation of a Portable AD5933–Based Impedance Analyzer for Smart Agriculture. IEEE Access 2021, 9, 63656–63675. [Google Scholar] [CrossRef]
  7. Nkumulwa, H.O.; Pauline, N.M. Role of Climate-Smart Agriculture in Enhancing Farmers’ Livelihoods and Sustainable Forest Management: A Case of Villages Around Songe-Bokwa Forest, Kilindi District, Tanzania. Front. Sustain. Food Syst. 2021, 5, 671419. [Google Scholar] [CrossRef]
  8. Bastan, M.; Khorshid-Doust, R.R.; Sisi, S.D.; Ahmadvand, A. Sustainable Development of Agriculture: A System Dynamics Model. Kybernetes 2018, 47, 142–162. [Google Scholar] [CrossRef]
  9. Meemken, E.-M.; Bellemare, M.F. Smallholder Farmers and Contract Farming in Developing Countries. Proc. Natl. Acad. Sci. USA 2020, 117, 259–264. [Google Scholar] [CrossRef]
  10. Pawlak, K.; Kołodziejczak, M. The Role of Agriculture in Ensuring Food Security in Developing Countries: Considerations in the Context of the Problem of Sustainable Food Production. Sustainability 2020, 12, 5488. [Google Scholar] [CrossRef]
  11. Buse Thorne, E.; Chong, M.; Obregón, C. La papa, sus aportes en el pasado, presente y futuro del Perú. In Búsqueda de un Desarrollo Integral: 20 Ensayos en Torno al Perú del Bicentenario; Beltrán, A., Sanborn, C.A., Yamada, G., Eds.; Universidad del Pacífico: Lima, Peru, 2021; pp. 395–413. [Google Scholar]
  12. Parra-Bracamonte, G.M.; Lopez-Villalobos, N.; Morris, S.T.; Vázquez-Armijo, J.F. An Overview on Production, Consumer Perspectives and Quality Assurance Schemes of Beef in Mexico. Meat Sci. 2020, 170, 108239. [Google Scholar] [CrossRef] [PubMed]
  13. Md Nor, S.; Ding, P. Trends and Advances in Edible Biopolymer Coating for Tropical Fruit: A Review. Food Res. Int. 2020, 134, 109208. [Google Scholar] [CrossRef] [PubMed]
  14. García, J.S.A.; Hurtado-Salazar, A.; Ceballos-Aguirre, N. Current Overview of Hass Avocado in Colombia. Challenges and Opportunities: A Review. Ciênc. Rural 2021, 51, e20200903. [Google Scholar] [CrossRef]
  15. Correa, M.C.G.; del Mar Chacón Molina, M.; Jaramillo, S.J. El Mercado Del Aguacate Hass En Japón: Retos Para Los Exportadores Colombianos. Rev. Digit. Mundo Asia Pac. 2021, 10, 86–99. [Google Scholar]
  16. Paz-Orozco, H.; Meléndez-Bermúdez, O.; Gonzalez-Feliu, J.; Morillo, D.; Rey, C.; Gatica, G. The Organization of Fruit Collection Transport in Conditions of Extreme Rurality: A Rural CVRP Case. In Workshop on Engineering Applications; Springer: Cham, Switzerland, 2022; pp. 234–242. [Google Scholar]
  17. Cho, K.; Goldstein, B.; Gounaridis, D.; Newell, J.P. Where Does Your Guacamole Come from? Detecting Deforestation Associated with the Export of Avocados from Mexico to the United States. J. Environ. Manag. 2021, 278, 111482. [Google Scholar] [CrossRef]
  18. Turner, B.L.; Menendez, H.M.; Gates, R.; Tedeschi, L.O.; Atzori, A.S. System Dynamics Modeling for Agricultural and Natural Resource Management Issues: Review of Some Past Cases and Forecasting Future Roles. Resources 2016, 5, 40. [Google Scholar] [CrossRef] [Green Version]
  19. Penagos, Á.J.T.; Osorio, J.C.; Vidal-Holguín, C.J. Sustainability Improvement of Coffee Farms in Valle Del Cauca (Colombia) Through System Dynamics. In Advances in Production Management Systems. Artificial Intelligence for Sustainable and Resilient Production Systems; Dolgui, A., Bernard, A., Lemoine, D., von Cieminski, G., Romero, D., Eds.; Springer International Publishing: Cham, Switzerland, 2021; pp. 607–617. [Google Scholar]
  20. Pallete, F.; Rivera, L.; Tacza, L.; Luna, A.; Chong, M. Distribution Network Optimization in the Peruvian Agro-Industrial Sector. In Algorithms and Computational Techniques Applied to Industry; Studies in Systems, Decision and Control; García Alcaraz, J.L., Realyvásquez Vargas, A., Eds.; Springer: Cham, Switzerland, 2022; Volume 435. [Google Scholar]
  21. Attarmoghaddam, N.; Khorakian, A.; Fakoor Saghih, A.M. Employing system dynamic and DEMATEL for improving the new product development time in knowledge-based companies. J. Ind. Prod. Eng. 2022, 39, 521–534. [Google Scholar] [CrossRef]
  22. Menzel, C.M.; Le Lagadec, M.D. Increasing the productivity of avocado orchards using high-density plantings: A review. Sci. Hortic. 2014, 177, 21–36. [Google Scholar] [CrossRef]
  23. Ramírez Contreras, P.D.R. Fuentes de Financiamiento y su Impacto en la Rentabilidad de los Pequeños Productores de maíz del Cantón Mocache, año 2014. Bachelor’s Thesis, Universidad Técnica Estatal de Quevedo, Quevedo, Ecuador, 2015. [Google Scholar]
  24. Fischer, E.; Qaim, M. Linking Smallholders to Markets: Determinants and Impacts of Farmer Collective Action in Kenya. World Dev. 2012, 40, 1255–1268. [Google Scholar] [CrossRef] [Green Version]
  25. Zulkarnain, L.H.; Wardhana, M.Y. Alternative Based Farmer Model for Increasing Red Chili Production in Bener Meriah, Aceh. IOP Conf. Ser. Earth Environ. Sci. 2021, 644, 012050. [Google Scholar] [CrossRef]
  26. Turnip, D.M.S.; Arkeman, Y.; Muslich. A Design of Competitive Cocoa Agro-Industry Supply Chain System in Putat Village, Gunung Kidul District. IOP Conf. Ser. Earth Environ. Sci. 2019, 335, 012014. [Google Scholar] [CrossRef]
  27. Forrester, J.W. Industrial dynamics. J. Oper. Res. Soc. 1997, 48, 1037–1041. [Google Scholar] [CrossRef]
  28. Forrester, J.W. Urban Dynamic; M.I.T.Press: Cambridge, MA, USA, 1969. [Google Scholar]
  29. Robinson, W.C. The Limits to Growth: A Report for the Club of Rome’s Project on the Predicament of Mankind Donella H. Meadows, Dennis L. Meadows, Jergen Randers, and William W. Behrens, III. Demography 1973, 10, 289–299. [Google Scholar] [CrossRef]
  30. García, J.M. Aplicaciones Prácticas de La Dinámica de Sistemas En Un Mundo Complejo; Universidad de Puerto Rico: Mayagüez, PR, USA, 2006; pp. 1–13. [Google Scholar]
  31. Li, F.J.; Dong, S.C.; Li, F. A System Dynamics Model for Analyzing the Eco-Agriculture System with Policy Recommendations. Ecol. Model. 2012, 227, 34–45. [Google Scholar] [CrossRef]
  32. Walters, J.P.; Archer, D.W.; Sassenrath, G.F.; Hendrickson, J.R.; Hanson, J.D.; Halloran, J.M.; Vadas, P.; Alarcon, V.J. Exploring Agricultural Production Systems and Their Fundamental Components with System Dynamics Modelling. Ecol. Model. 2016, 333, 51–65. [Google Scholar] [CrossRef] [Green Version]
  33. Birthal, P.S.; Hazrana, J. Crop Diversification and Resilience of Agriculture to Climatic Shocks: Evidence from India. Agric. Syst. 2019, 173, 345–354. [Google Scholar] [CrossRef]
  34. Barrientos-Fuentes, J.C.; Torrico-Albino, J.C. Socio-Economic Perspectives of Family Farming in South America: Cases of Bolivia, Colombia and Peru. Agron. Colomb. 2014, 32, 266–275. [Google Scholar] [CrossRef]
  35. Vergara, W.; Rios, A.R.; Trapido, P.; Malarín, H. Agriculture and Future Climate in Latin America and the Caribbean: Systemic Impacts and Potential Responses; Inter-American Development Bank Report; Inter-American Development Bank: Washington, DC, USA, 2014. [Google Scholar]
  36. Castro, O.; Arturo, J.; Ramírez, M.M.H. Perspectiva de Trazabilidad En La Cadena de Suministros de Frutas: Un Enfoque Desde La Dinámica de Sistemas. Ingeniería 2014, 19, 63–84. [Google Scholar]
  37. Pérez, A.; Villena, J.; Matuk, D.; Luna, A.; Chong, M. An Analytical Hierarchy Approach Applied in the Packaging Supply Chain. In Supply Chain Management and Logistics in Emerging Markets; Yoshizaki, H.T.Y., Mejía Argueta, C., Mattos, M.G., Eds.; Emerald Publishing Limited: Bingley, UK, 2020; pp. 89–104. [Google Scholar] [CrossRef]
  38. Ovalle, O.R.; Orozco, H.P.; Sinisterra, H.A. Analysis of Financial Flow for Small Producers of Colombian Coffee. In Handbook of Research on Urban and Humanitarian Logistics; IGI Global: Hershey, PA, USA, 2019; pp. 158–178. [Google Scholar] [CrossRef]
  39. Aroca, Y.M.; Tovar Perilla, N. Evaluación de La Sostenibilidad de Una Agrocadena de Suministro de Producto Fresco Orientada al Mercado Internacional. Caso Aplicado a La Cadena Del Aguacate Hass En El Norte Del Tolima. Indagare 2019, 7. [Google Scholar] [CrossRef]
  40. Hasan, N.; Suryani, E.; Hendrawan, R. Analysis of Soybean Production and Demand to Develop Strategic Policy of Food Self Sufficiency: A System Dynamics Framework. Procedia Comput. Sci. 2015, 72, 605–612. [Google Scholar] [CrossRef] [Green Version]
  41. Aprillya, M.R.; Suryani, E.; Dzulkarnain, A. System Dynamics Simulation Model to Increase Paddy Production for Food Security. J. Inf. Syst. Eng. Bus. Intell. 2019, 5, 67–75. [Google Scholar] [CrossRef]
  42. Wicaksono, M.G.S.; Suryani, E.; Hendrawan, R.A. Increasing Productivity of Rice Plants Based on IoT (Internet of Things) to Realize Smart Agriculture Using System Thinking Approach. Procedia Comput. Sci. 2022, 197, 607–616. [Google Scholar] [CrossRef]
  43. Ding, X.; Yang, Z. Knowledge Mapping of Platform Research: A Visual Analysis Using VOSviewer and CiteSpace. Electron. Commer. Res. 2022, 22, 787–809. [Google Scholar] [CrossRef]
  44. Shobeiri, E.; Shen, H.; Genco, F.; Tokuhiro, A. Investigating Long-Term Commitments to Replace Electricity Generation with SMRs and Estimates of Climate Change Impact Costs Using a Modified VENSIM Dynamic Integrated Climate Economy (DICE) Model. Energies 2022, 15, 3613. [Google Scholar] [CrossRef]
  45. Anacona, C.A.; Bonilla, B.P.M.; Cabrera, E.V.R.; Pino, A.F.S. Evaluation of Cup Profile for Post-Harvest in Coffee Variety Castillo from Cauca Department. Trends Sci. 2022, 19, 4526. [Google Scholar] [CrossRef]
  46. Solis, A.F.; Revelo luna, D.A.; Campo Ceballos, D.A.; Gaviria López, C.A. Correlación del contenido de clorofila foliar de la especie Coffea arabica con índices espectrales en imágenes. Biotecnol. Sect. Agropecu. Agroind. 2021, 19, 51–68. [Google Scholar] [CrossRef]
  47. Anacona-Mopan, Y.; Segura-Dorado, J.; Paz-Orozco, H. Optimización de la distribución en planta con formulación QAP y simulación de eventos discretos. Informador Técnico 2023, 87, 13–28. [Google Scholar] [CrossRef]
  48. Zanker, M.; Bureš, V. Knowledge Management as a Domain, System Dynamics as a Methodology. Systems 2022, 10, 82. [Google Scholar] [CrossRef]
  49. AGRONET. Comparativo de Área, Producción, Rendimiento y Participación Departamental por Cultivo. Available online: https://www.agronet.gov.co/estadistica/ (accessed on 20 September 2022).
  50. Muñoz, C.; Tenganan, S.Y.P.; Rodríguez, I.M.L.; Mojica, J.F.P.; Banguero, D.J.C. Insectos Polinizadores del Aguacate (Persea Americana Mill.) cv. Hass en Colombia; Corpoica Editorial: Bogota, Colombia, 2017. [Google Scholar]
  51. AGROSAVIA. Aguacate Hass en Cauca Mejorará su Productividad y Calidad de Exportación. Available online: https://www.agronet.gov.co/Noticias/Paginas/Aguacate-Hass-en-Cauca-mejorar (accessed on 18 July 2022).
  52. Amare, M.; Mariara, J.; Oostendorp, R.; Pradhan, M. The Impact of Smallholder Farmers’ Participation in Avocado Export Markets on the Labor Market, Farm Yields, Sales Prices, and Incomes in Kenya. Land Use Policy 2019, 88, 104168. [Google Scholar] [CrossRef]
  53. Cofre, G.; Riquelme, I.; Engler, A.; Jara-Rojas, R. Adopción de Buenas Prácticas Agrícolas (BPA: Costo de Cumplimiento y Beneficios Percibidos Entre Productores de Fruta Fresca. Idesia (Arica) 2012, 30, 37–45. [Google Scholar] [CrossRef] [Green Version]
  54. Accame Mantero, S.; Blanco Quiroga, A.J.; Sancho Moreno, M.F.; Vásquez Arias Schreiber, L.M. Análisis de Los Pequeños Productores de Palto En El Perú: Propuestas Para La Mejora de Su Rendimiento Productivo; ESAN: Lima, Peru, 2018. [Google Scholar]
  55. Taylor, I.W.; Ullah, M.A.; Koul, S.; Ulloa, M.S. Evaluating the Impact of Institutional Improvement on Control of Corruption—A System Dynamics Approach. Systems 2022, 10, 64. [Google Scholar] [CrossRef]
  56. Huo, H.; Liu, H.; Bao, X.; Cui, W. Eco-Efficiency Assessment of Beijing-Tianjin-Hebei Urban Agglomeration Based on Emergy Analysis and Two-Layer System Dynamics. Systems 2022, 10, 61. [Google Scholar] [CrossRef]
  57. Al-Elq, A.H. Simulation-Based Medical Teaching and Learning. J. Fam. Community Med. 2010, 17, 35. [Google Scholar] [CrossRef]
  58. Arango, E.S.; Cortes, L.M.S. Producción y comercialización de aguacate tipo Hass en el municipio de Sonsón (Colombia). EstefaníA Soto Arango Liliana MaríA SepúLveda Cortes Univ. Antioq. Fac. Ing. Dep. Ing. Ind. MedellíN Colomb. 2020, 1, 97. [Google Scholar]
  59. Urquiza, L.S.P.; Rebollar, S.R.; Juárez, N.C.; Martínez, J.H.; Tenorio, G.G. Análisis De Viabilidad Económica Para La Producción Comercial De Aguacate Hass. Rev. Mex. Agronegocios 2015, 19, 1325–1338. [Google Scholar]
  60. Pulina, G.; Milán, M.J.; Lavín, M.P.; Theodoridis, A.; Morin, E.; Capote, J.; Thomas, D.L.; Francesconi, A.H.D.; Caja, G. Invited Review: Current Production Trends, Farm Structures, and Economics of the Dairy Sheep and Goat Sectors. J. Dairy Sci. 2018, 101, 6715–6729. [Google Scholar] [CrossRef] [PubMed] [Green Version]
  61. Perez-Aleman, P. Global Standards and Local Knowledge Building: Upgrading Small Producers in Developing Countries. Proc. Natl. Acad. Sci. USA 2012, 109, 12344–12349. [Google Scholar] [CrossRef] [Green Version]
  62. Jibir, A.; Ahmed, I.; Bello, A. Impact of Small and Medium Scale Enterprises on Economic Growth: Evidence from Nigeria. Glob. J. Econ. Bus. 2018, 427, 1–9. [Google Scholar]
  63. Johnny, E.G.; Mariara, J.K.; Mulwa, R.; M Ruigu, G. Smallholder Avocado Contract Farming in Kenya: Determinants and Differentials in Outcomes. Afr. J. Econ. Rev. 2019, 7, 91–112. [Google Scholar]
  64. Kumar, S.; Raut, R.D.; Nayal, K.; Kraus, S.; Yadav, V.S.; Narkhede, B.E. To Identify Industry 4.0 and Circular Economy Adoption Barriers in the Agriculture Supply Chain by Using ISM-ANP. J. Clean. Prod. 2021, 293, 126023. [Google Scholar] [CrossRef]
Figure 1. Methodological structure of the study development.
Systems 11 00029 g001
Figure 2. Problem map linking the research input variables to the simulation scenarios.
Systems 11 00029 g002
Figure 3. Production influence diagram.
Systems 11 00029 g003
Figure 4. Utility influence diagram.
Systems 11 00029 g004
Figure 5. Causal diagram describing the relationship between the different research variables.
Systems 11 00029 g005
Figure 6. Forrester diagram for the Hass avocado production chain in the Cauca department.
Systems 11 00029 g006
Figure 7. Results were obtained for the current scenario for the different variables studied, representing the current state of the Hass avocado supply chain in the Cauca department.
Systems 11 00029 g007
Figure 8. Results obtained for the scenario where small producers obtain credit for the cultivation and production of Hass avocado in the Cauca department.
Systems 11 00029 g008
Figure 9. Results were obtained for the scenario where GAP investment is made, improving production methodology and technology implementation.
Systems 11 00029 g009
Figure 10. Results obtained for the scenario where producers have a civil association supporting them technically and technologically.
Systems 11 00029 g010
Figure 11. In this scenario, the producers enjoy the technical and economic support of central government, and achieve excellent Hass avocado production results at a similar level to other leading countries.
Systems 11 00029 g011
Table 1. Simulation model variables.
VariablesEquationType
Accumulated Pdn (A)Production Ton (pt)Level
Inventory (I)Hass Production-Sales in KgLevel
Accumulated productivity (AP)Productivity (P)Level
Utility (U)If then else (Revenues-Expenses (EX)-Reinvestment) > 0, (Revenues-Expenses-Reinvestment), 0)Level
Maximum Amount (M)If then else( Financing Needs (FN) > 0, Financing Needs, 0)Level
Balance (B)- Quota (q)Level
Production Hass (h)(Fruits per tree (Time)*Trees per hectare*0.18) * (Accumulated production)Flow
Average yieldIf then else (Accumulated production > 0, Accumulated production/Time, 0)Auxiliary
DemandHass production*15*(1 + 0.003)Auxiliary
Sales (S)If then else (Demand > Inventory, Inventory, Hass Production)Flow
Revenues (Re)If then else (Global GAP > 0, External kg price*kg sales*kg sales, Internal kg price*kg sales)Flow
Internal priceUniform random (0.68, 0.9)Auxiliary
International priceUniform random (1.58, 2.04)Auxiliary
ProfitIf then else ((Income-Expense-Reinvestment) > 0, (Income-Expense-Reinvestment), 0)Level
Production costsIf then else (Producer Association > 0, (((Fertilizers + Labor + Plant Material + Equipment (Time) + Technical Assistance) * (1 − 0.28)) − Supporting State)Auxiliary
Reinvestment (Rei)If then else (Profit > 0, if then if (Profit ≥ Maximum investment, Maximum investment, (Profit) * Reinvestment rate), 0)Flow
State Support2252.54Auxiliary
Financing needsIf then else (Periodic cash flow < 0, -Periodic cash flow, 0)Auxiliary
Interest rateIf then else (Producers’ Association > 0, (0.0175 + 0.05), 0.0175 + 0.07))Auxiliary
State investmentIf then else (State Support > 0, 0.01, 0)Auxiliary
Access to creditIf yes (Loan > 0, 0.07, 0)Auxiliary
Application of GAPUniform Random (0.03, 0.08, 0)Auxiliary
Producer AssociationRandom Uniform (0.06, 0.077, 0)Auxiliary
Government supportIf then else(Reinvestment > 0, Reinvestment*2 × 10 8 , 0)Auxiliary
Productivity (P)Fixed lag (Access to profits + Producer Association + Global GAP + Investment status + Productivity increase through reinvestment, Lag, 0)Flow
Utility (U)Sales revenue - Production costsLevel
Disclaimer/Publisher’s Note: The statements, opinions and data contained in all publications are solely those of the individual author(s) and contributor(s) and not of MDPI and/or the editor(s). MDPI and/or the editor(s) disclaim responsibility for any injury to people or property resulting from any ideas, methods, instructions or products referred to in the content.