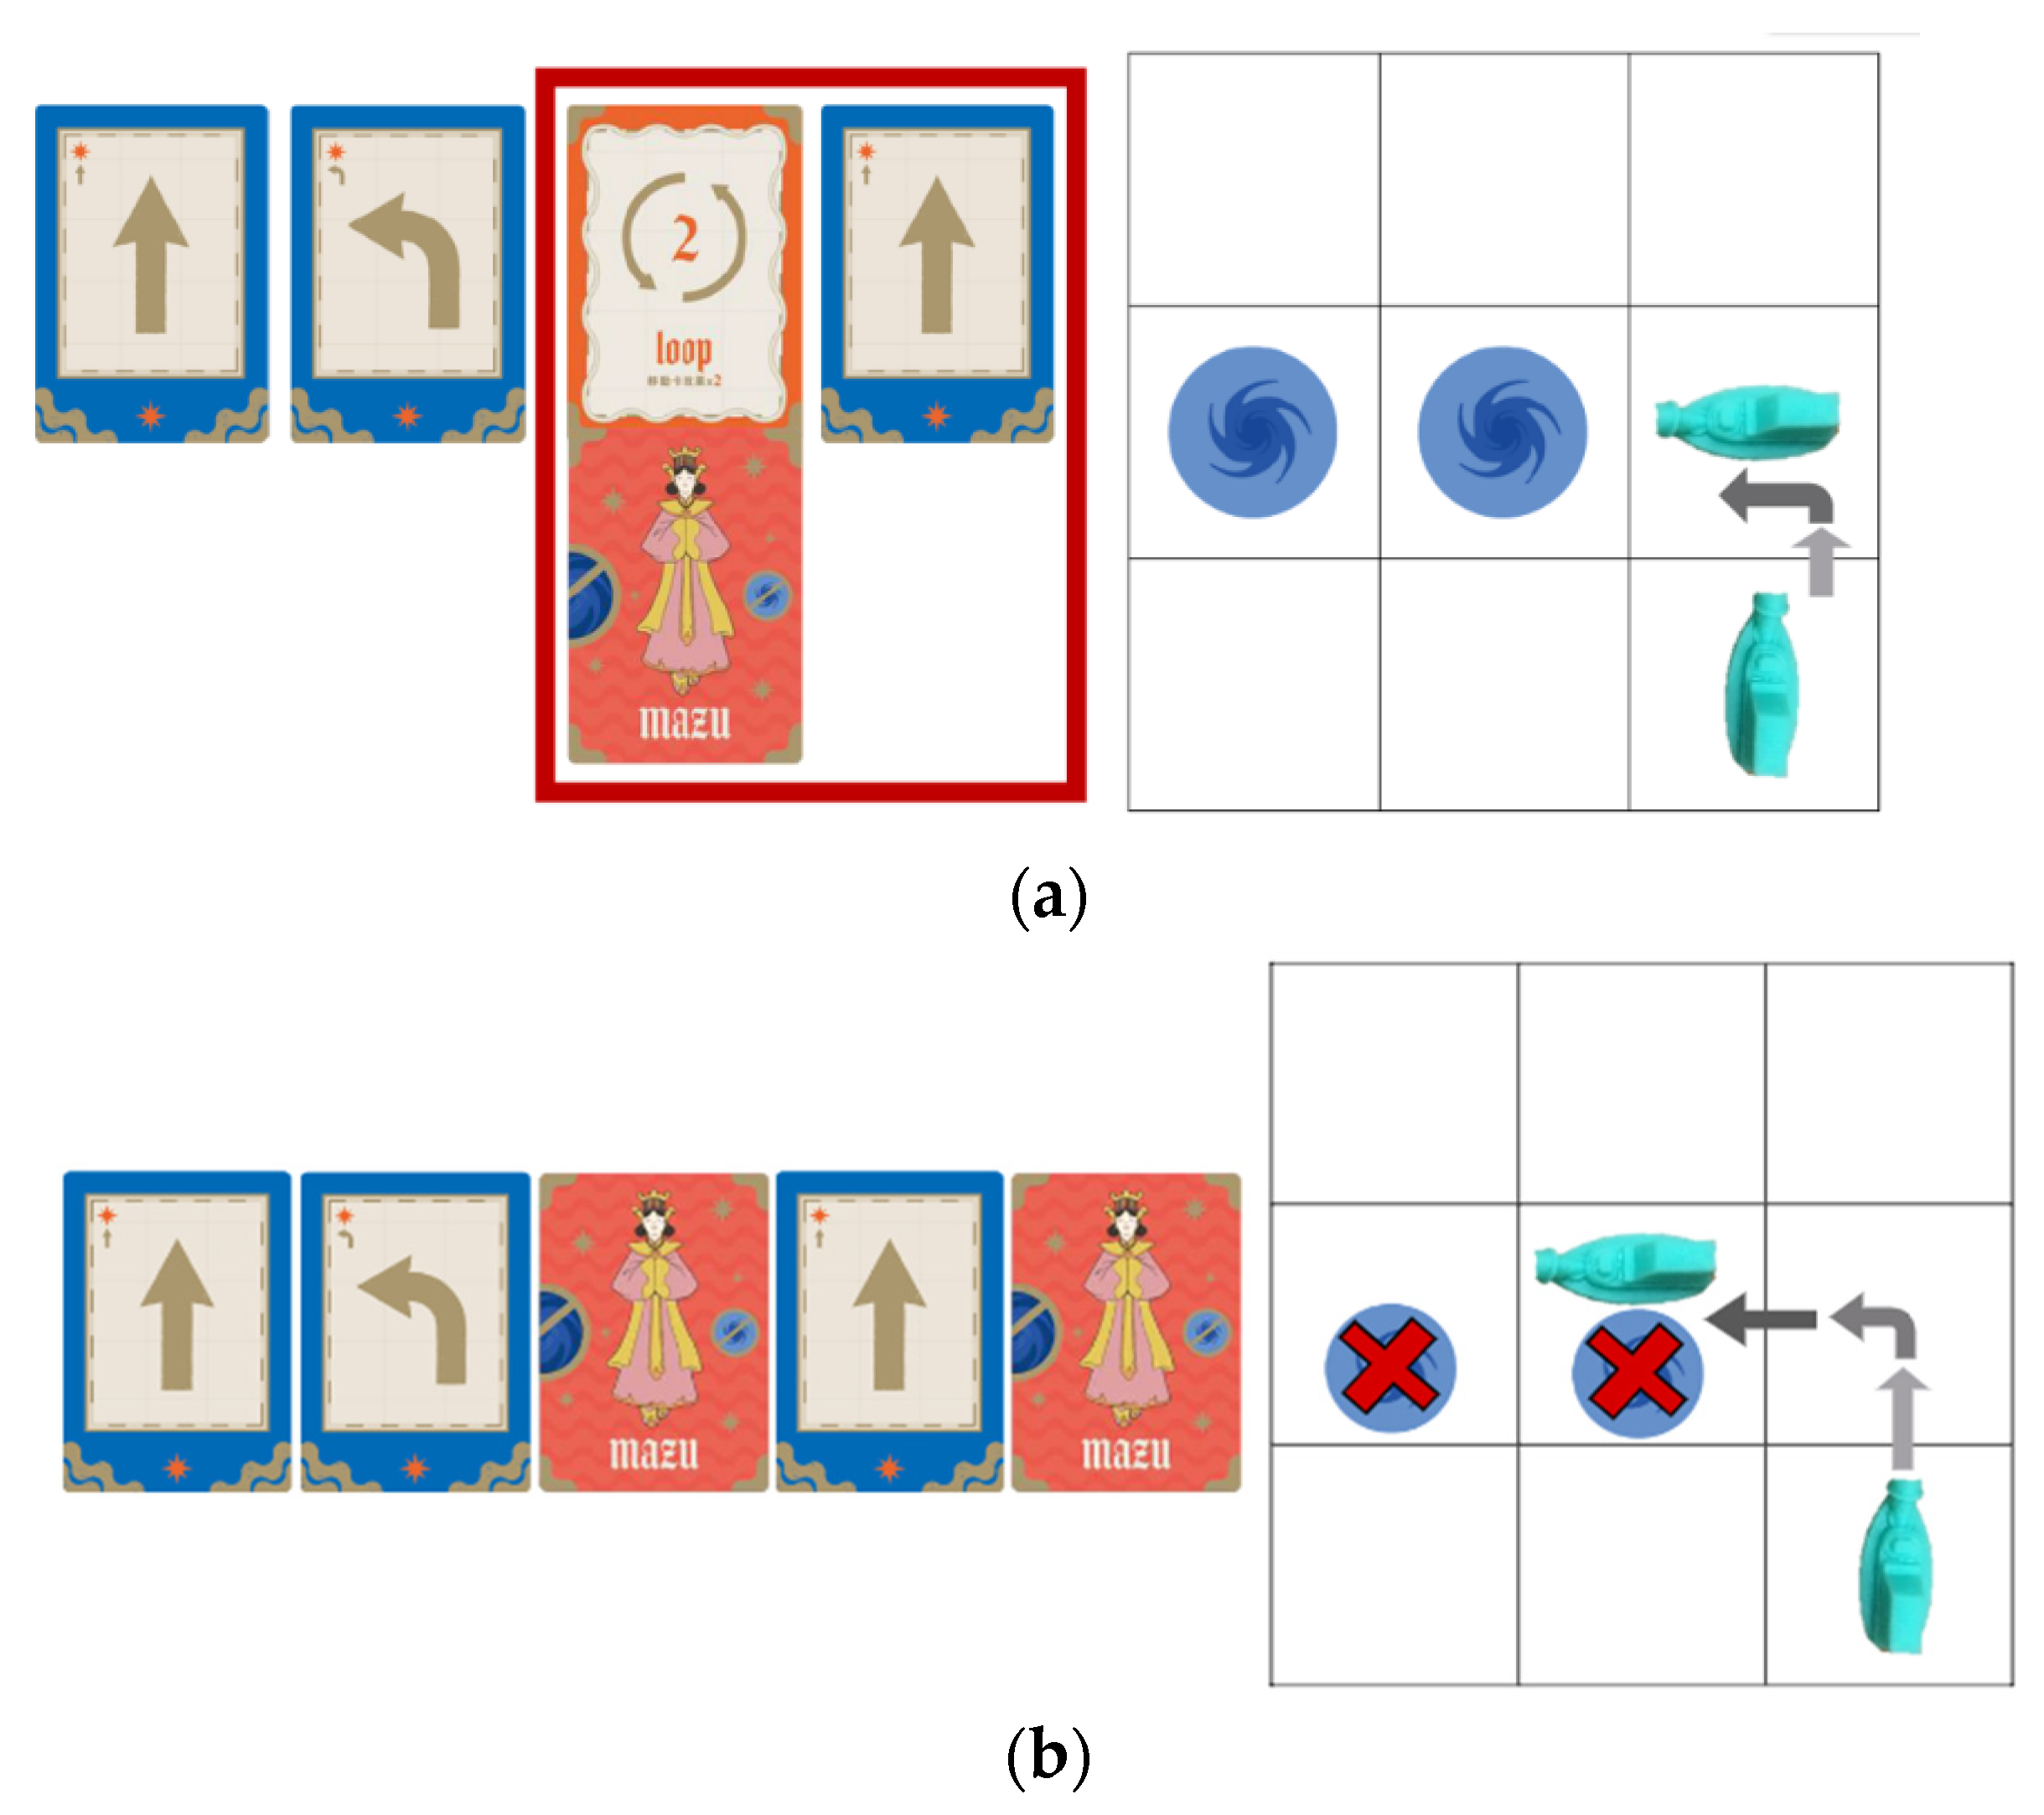
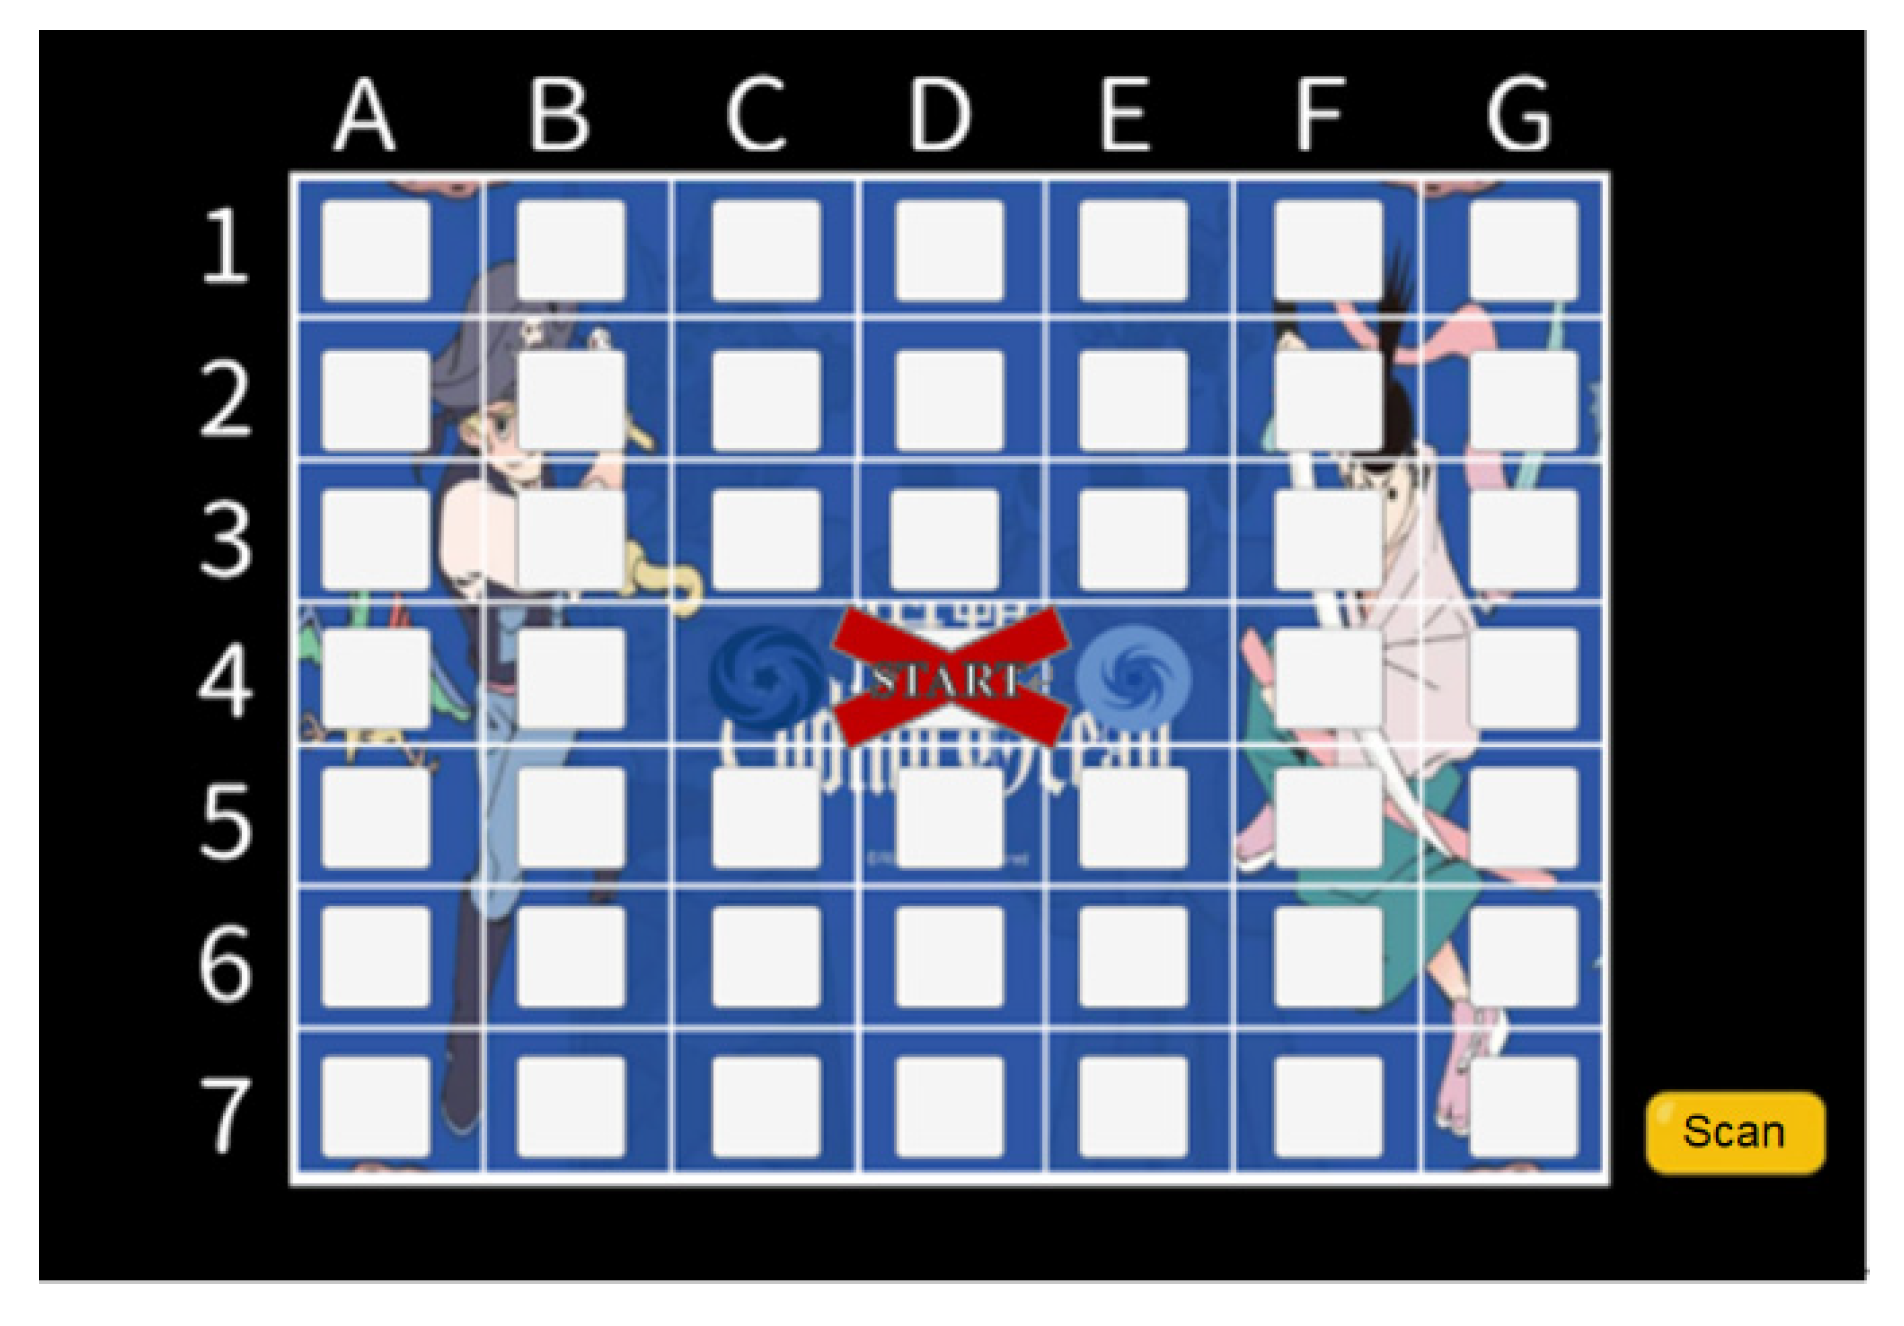
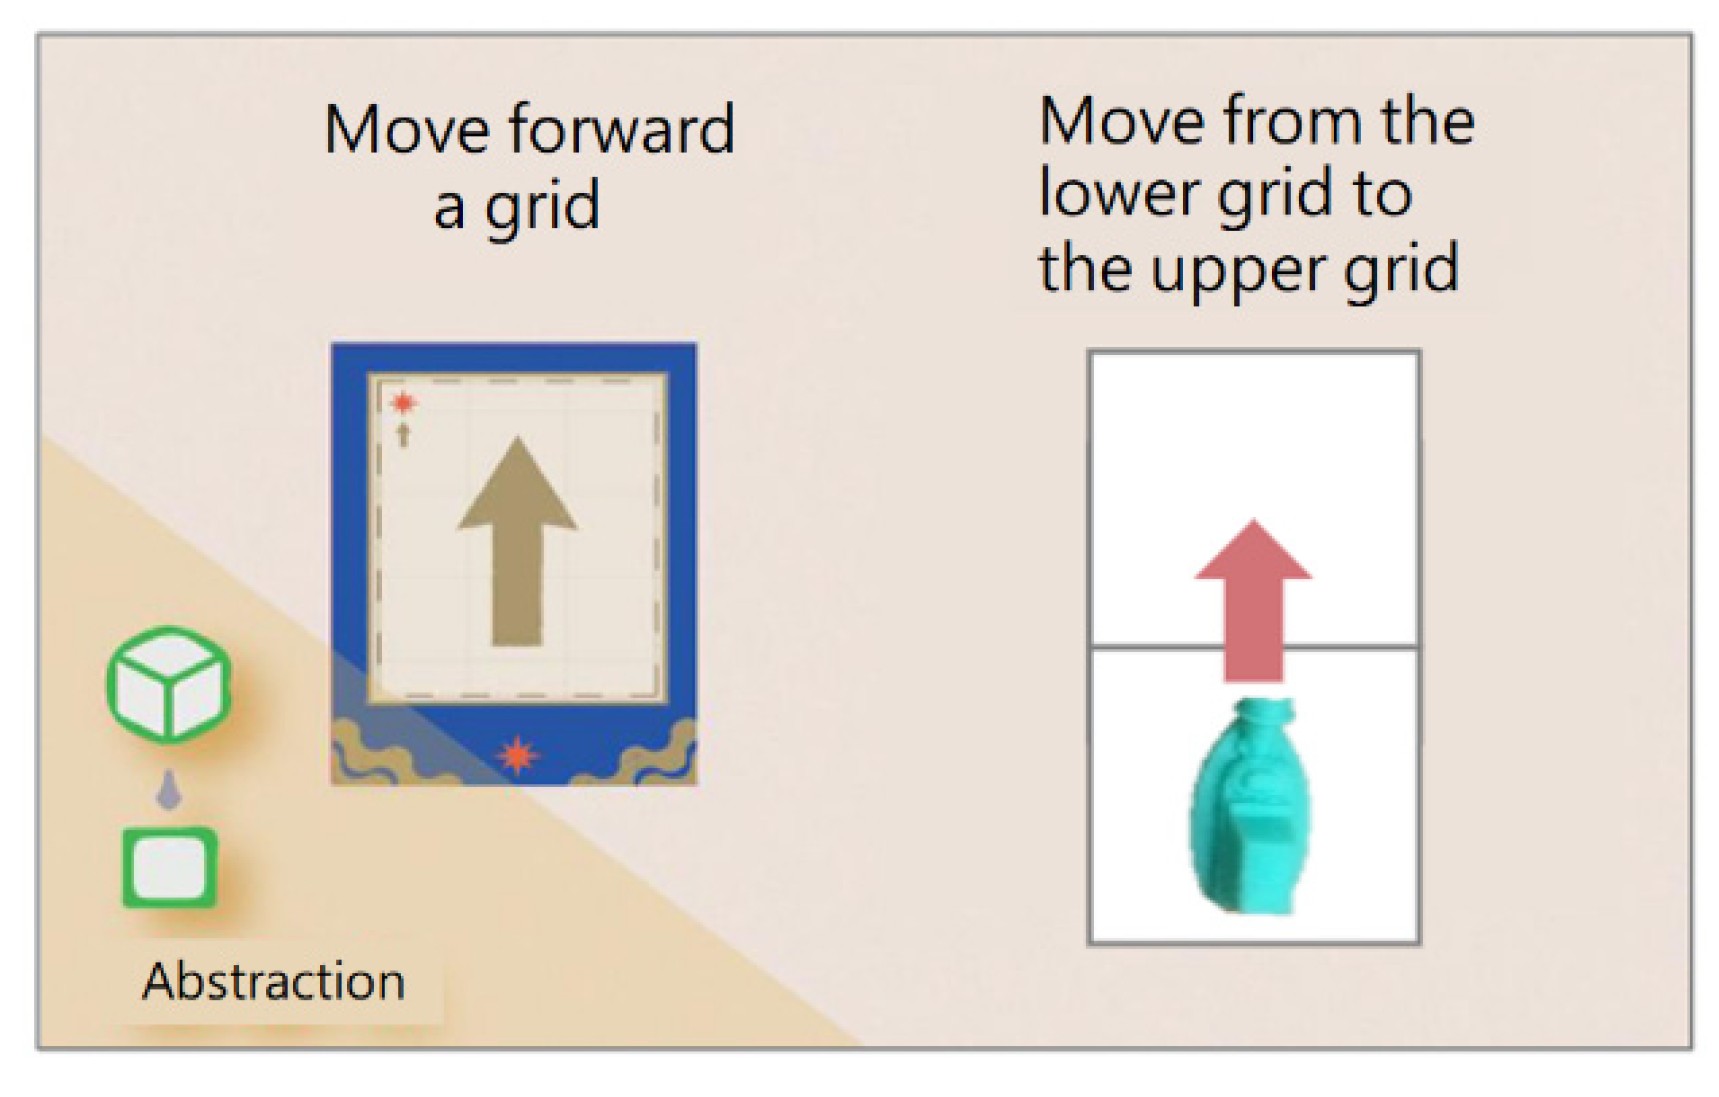
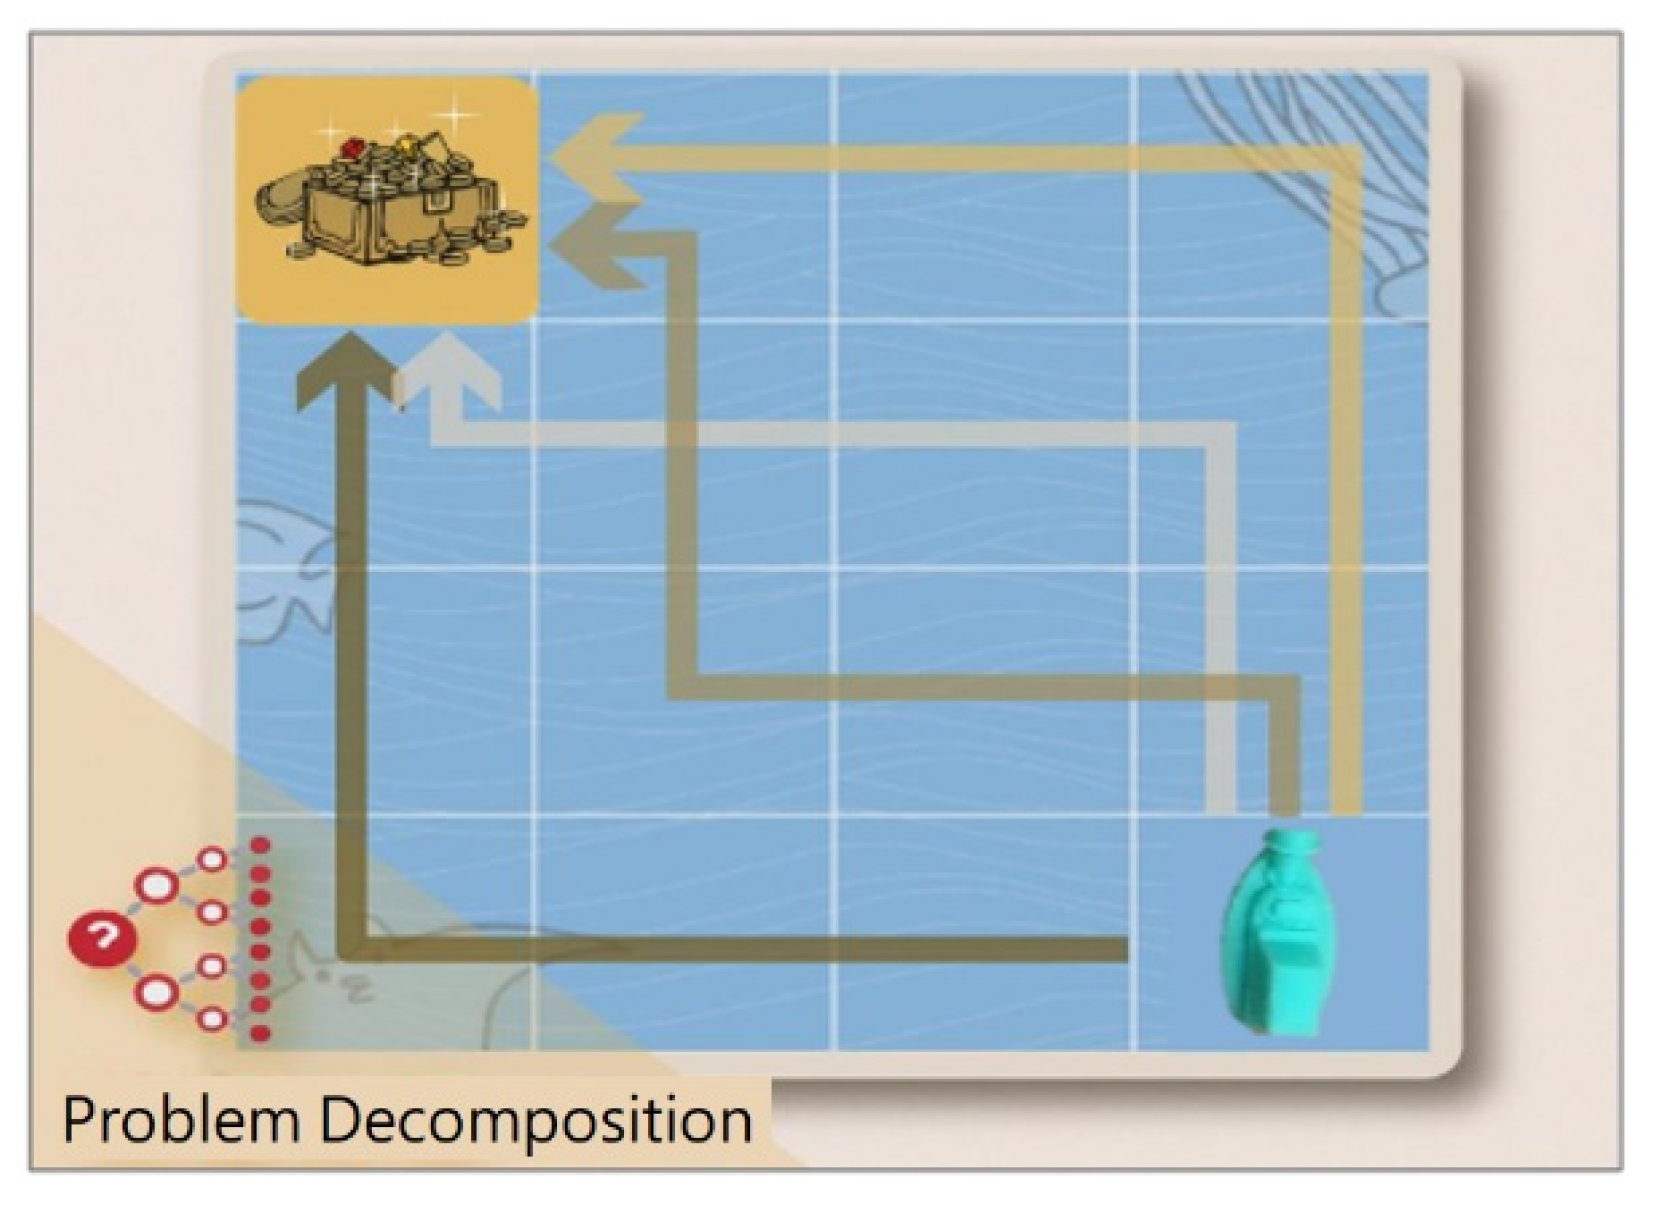
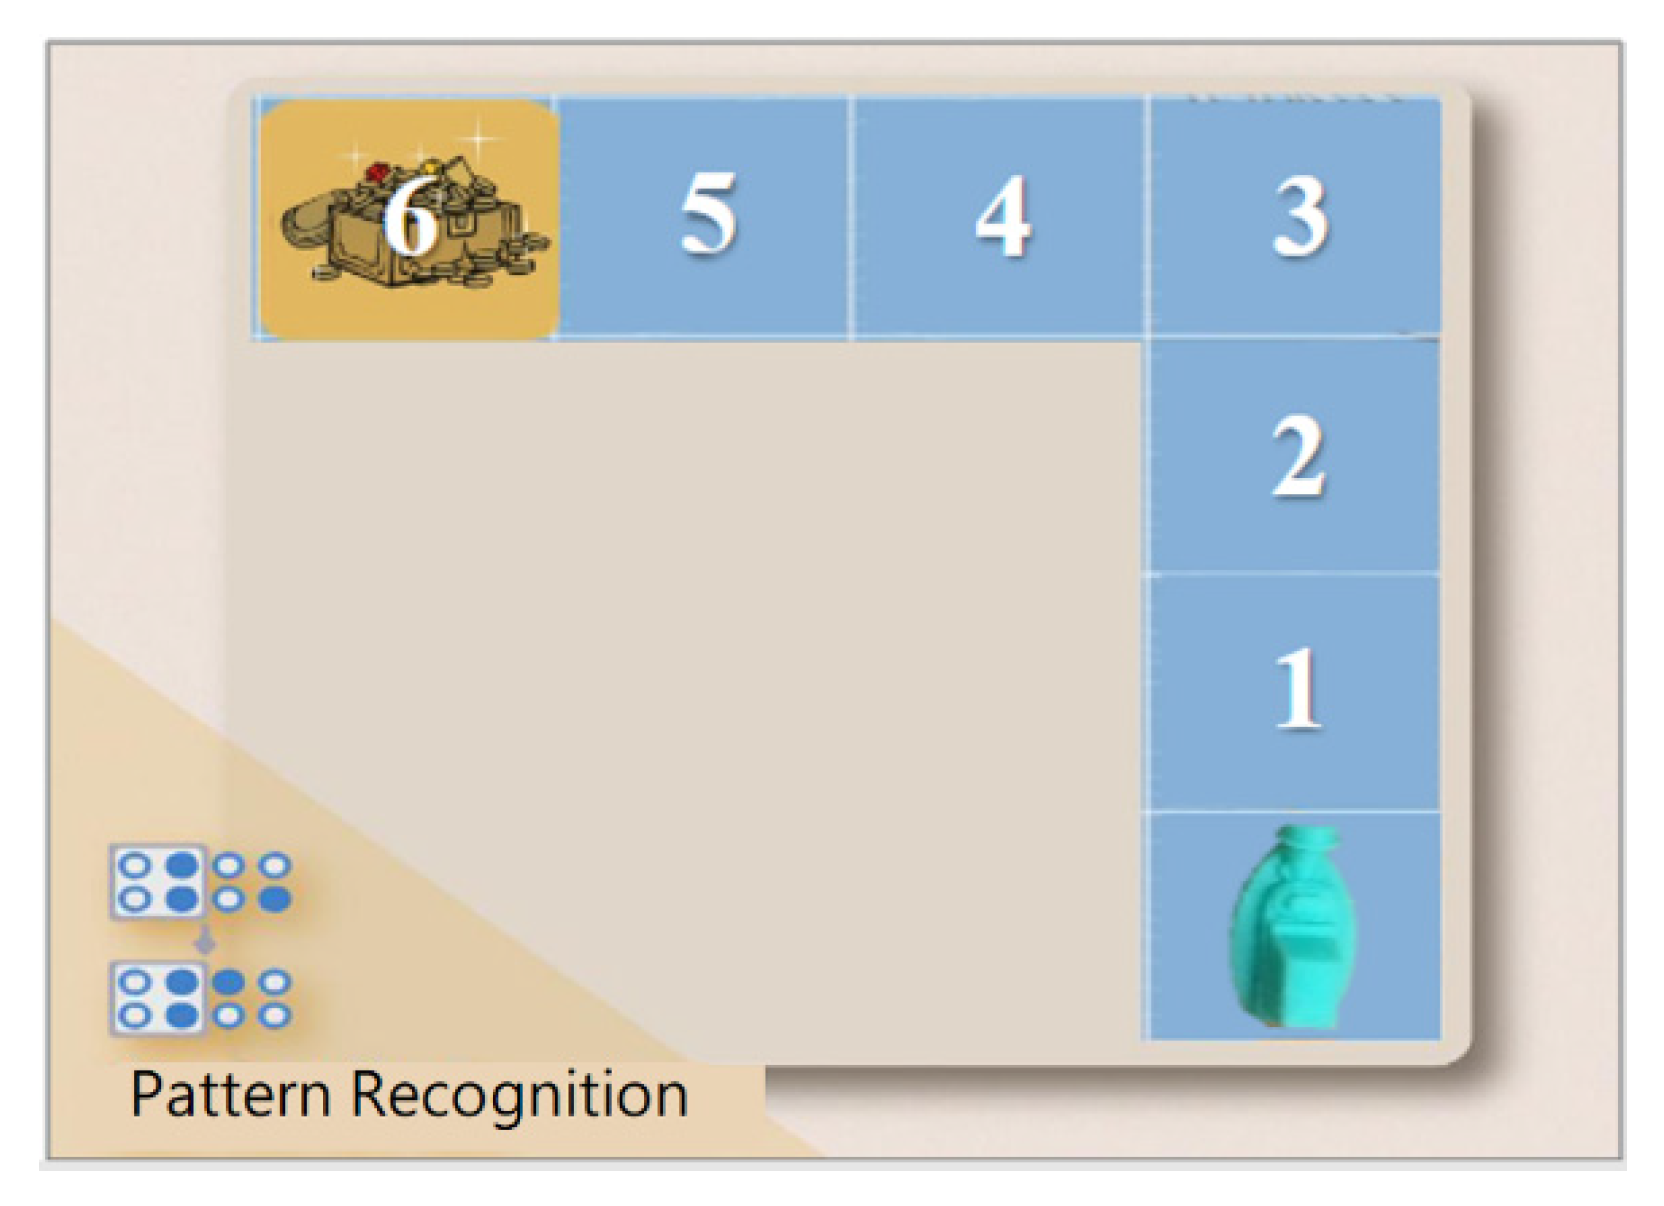
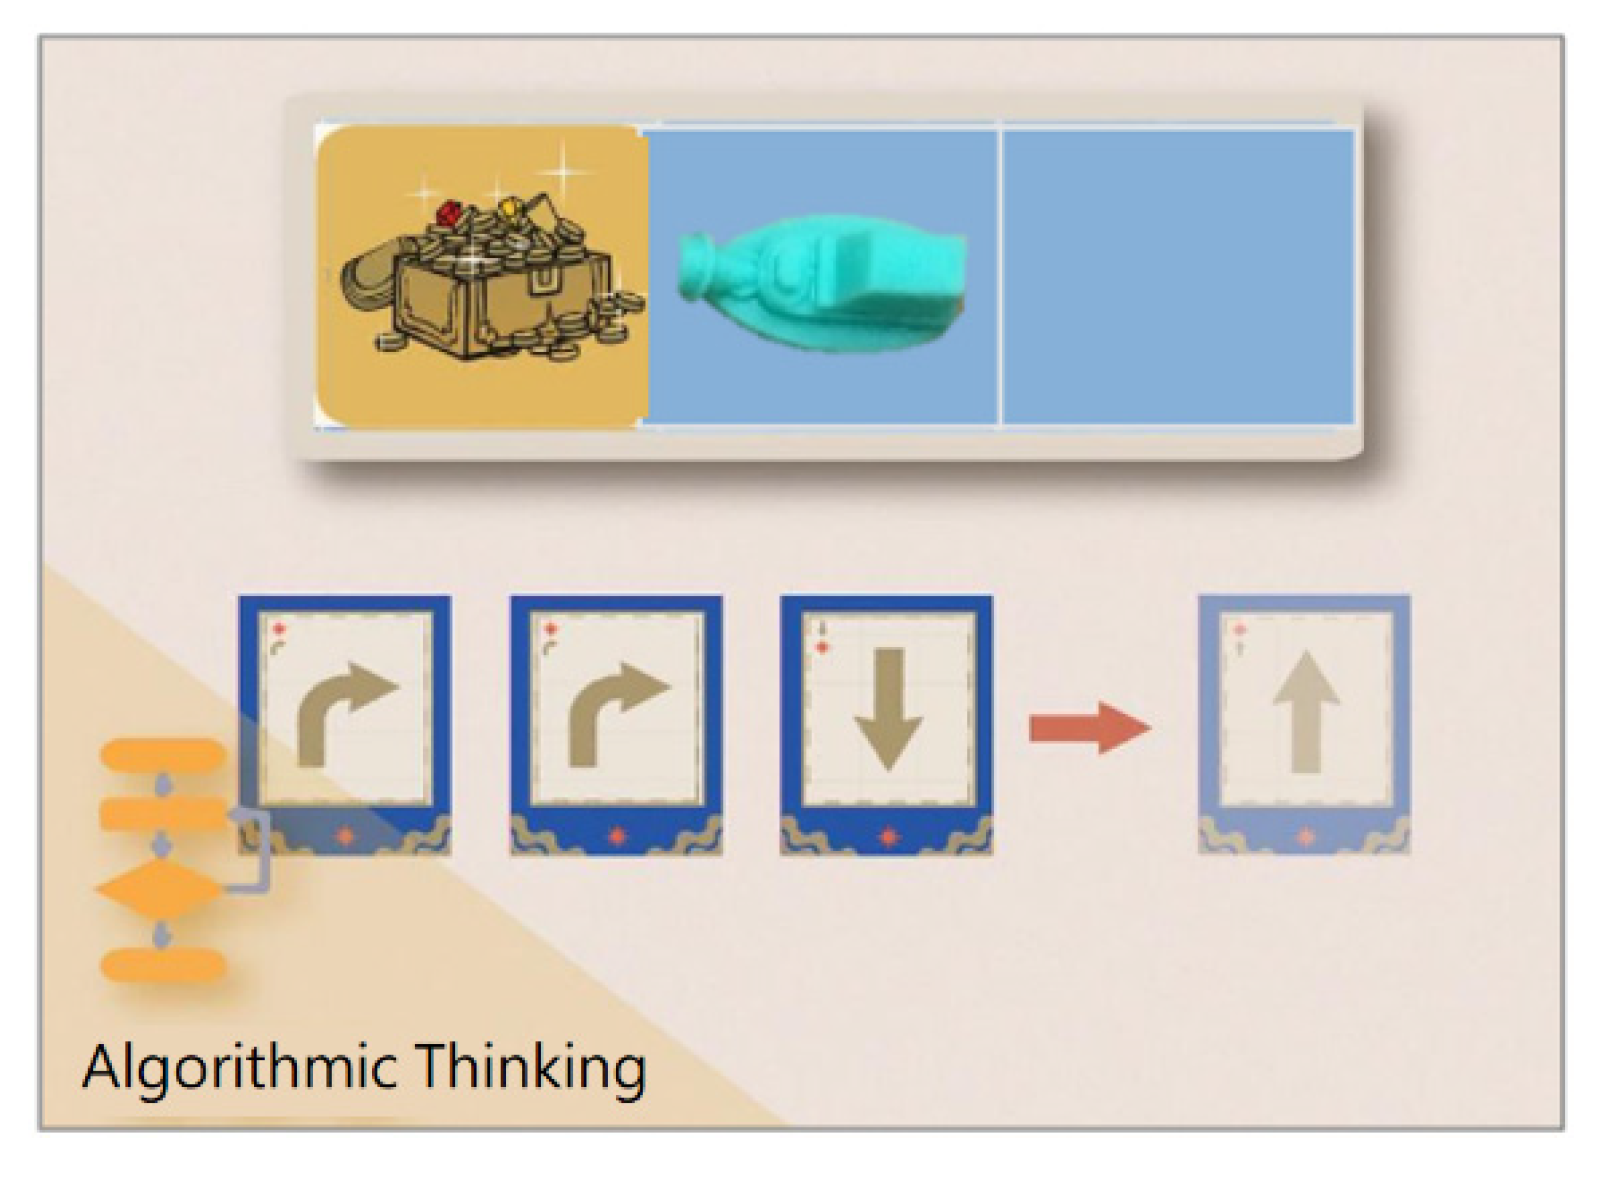
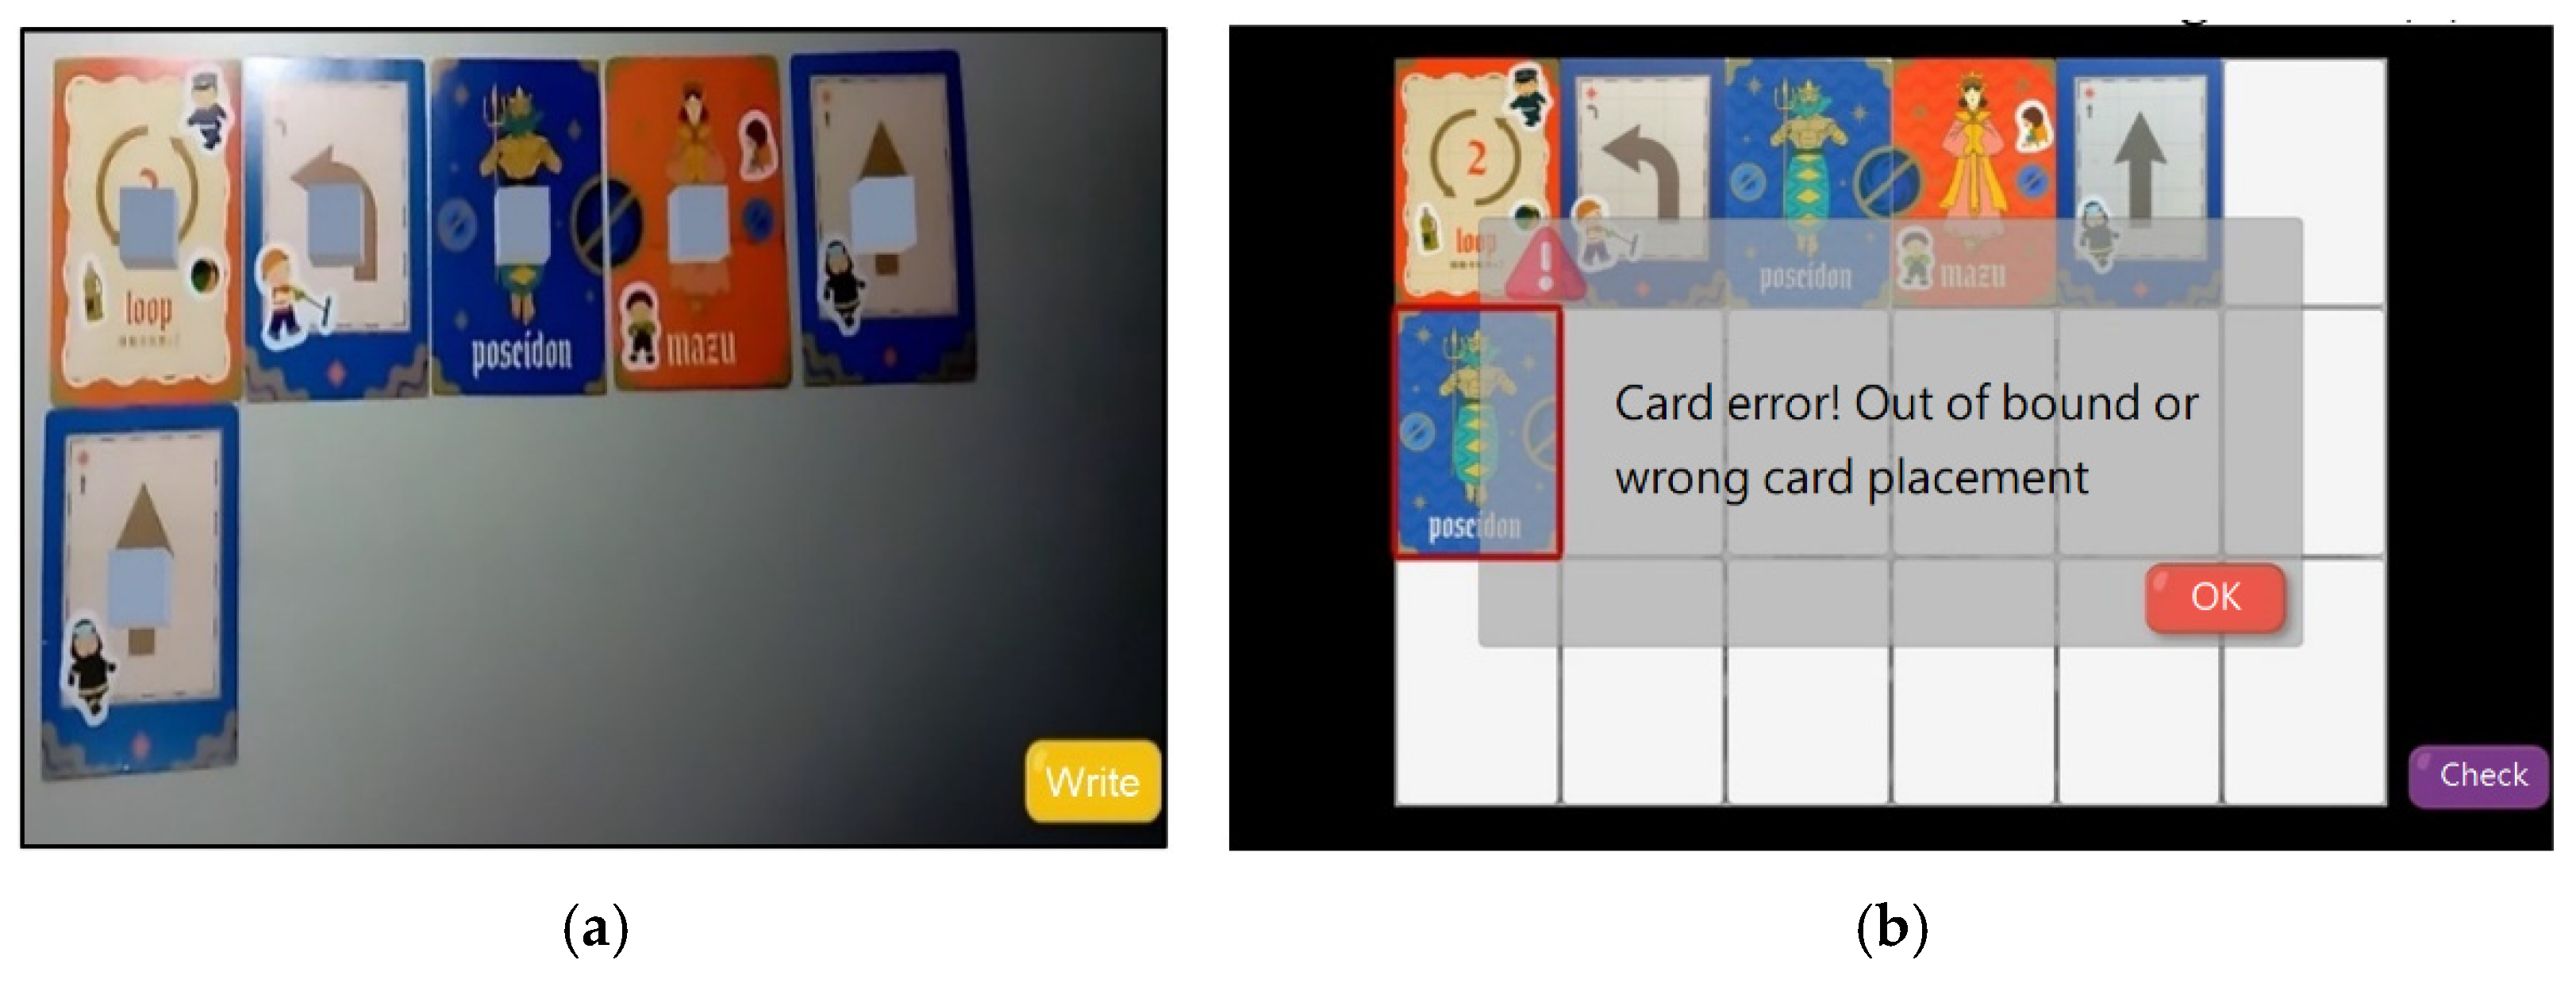
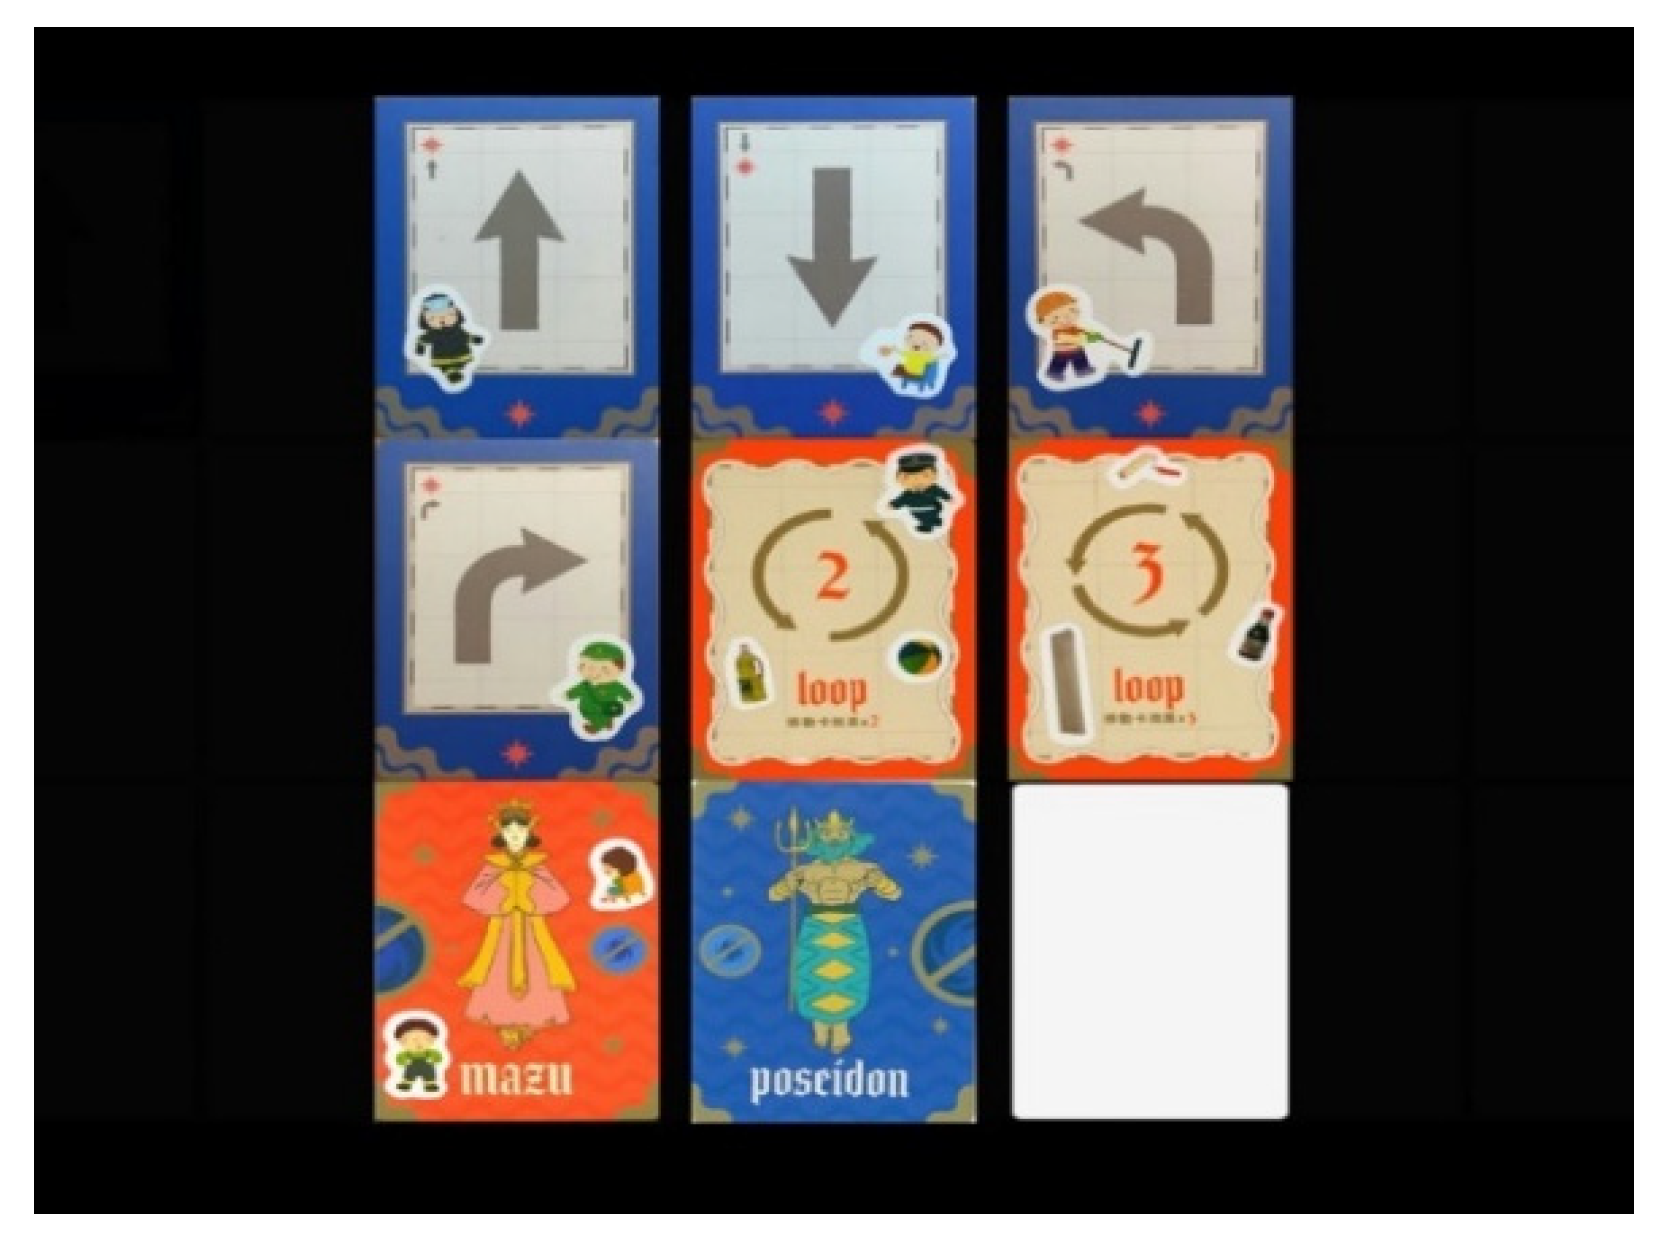
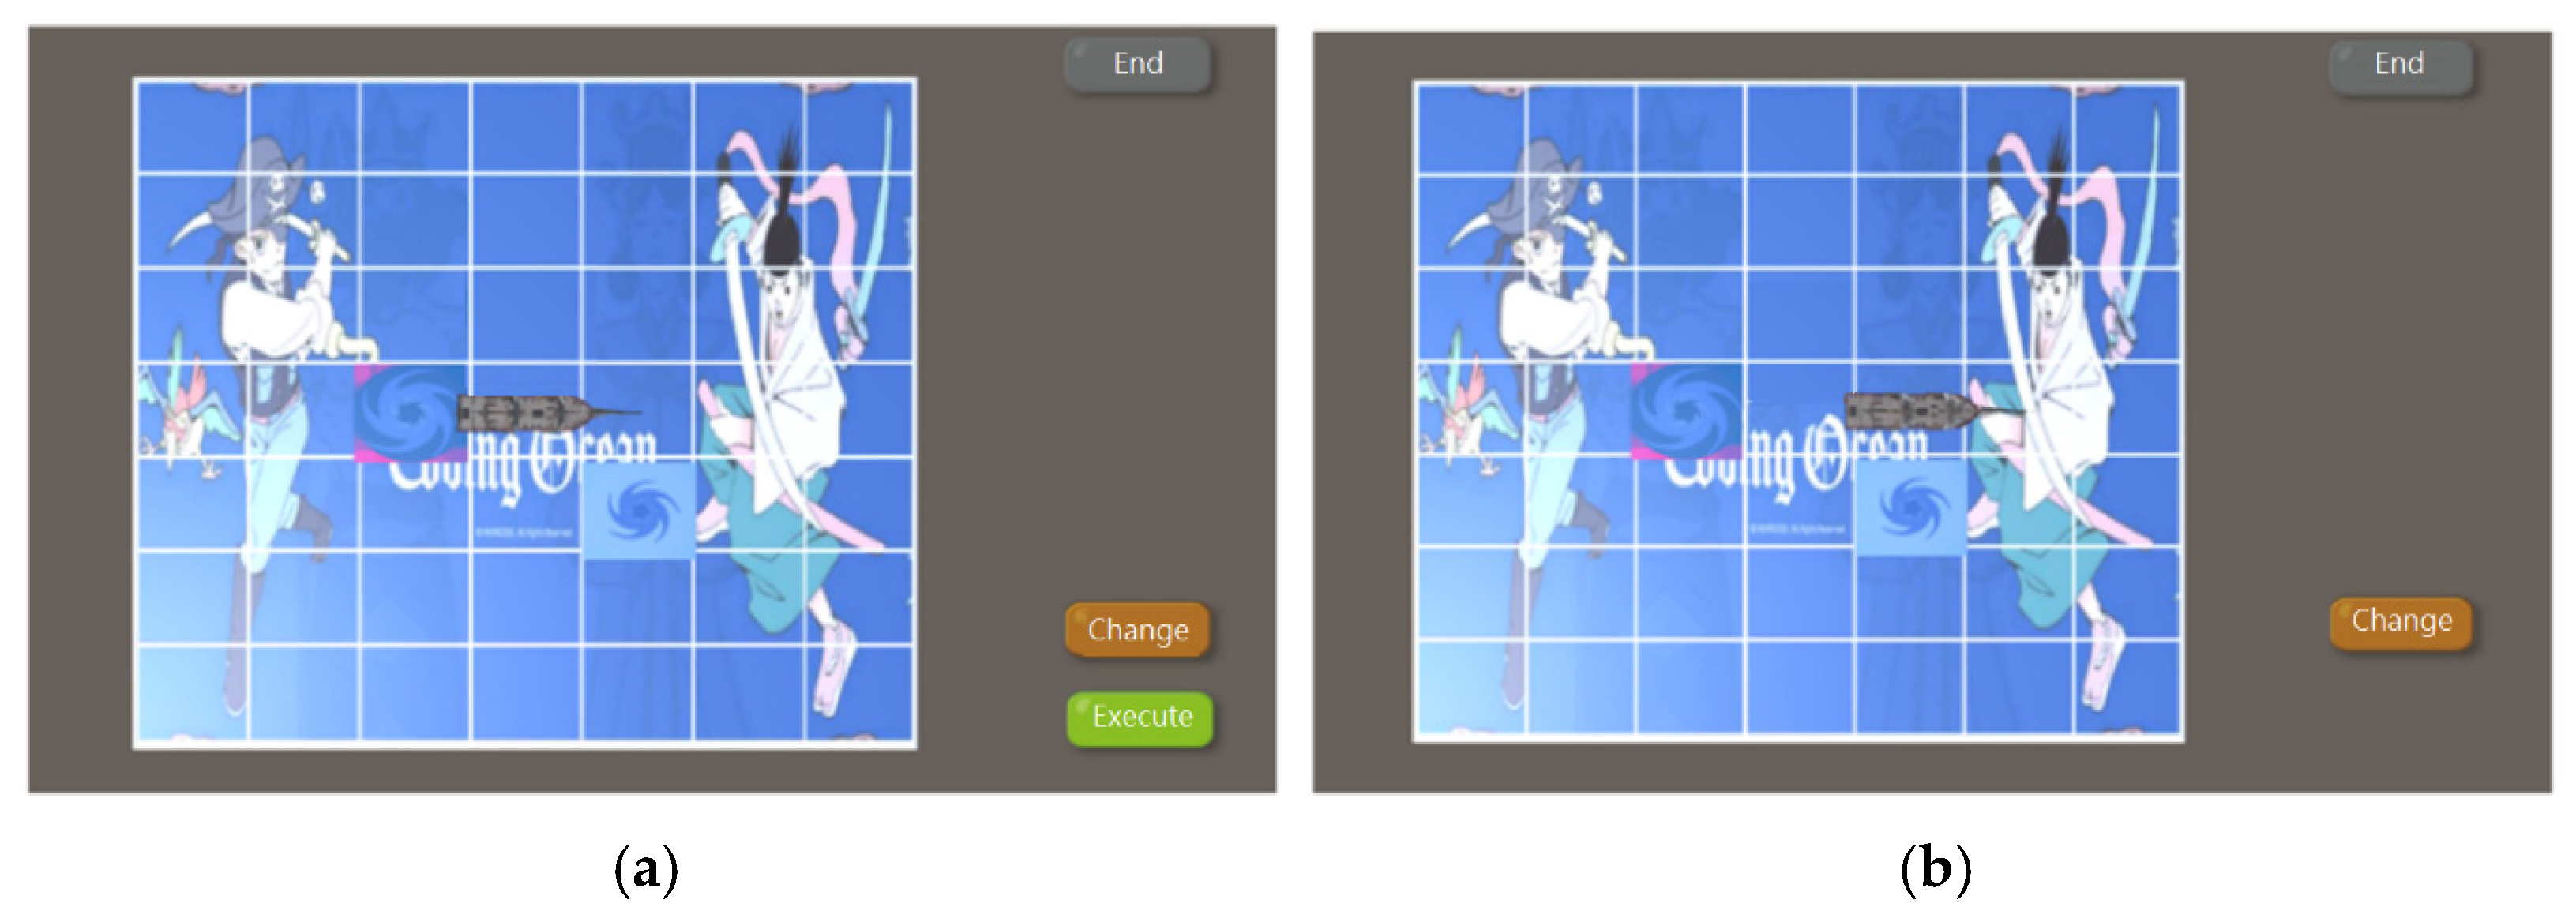
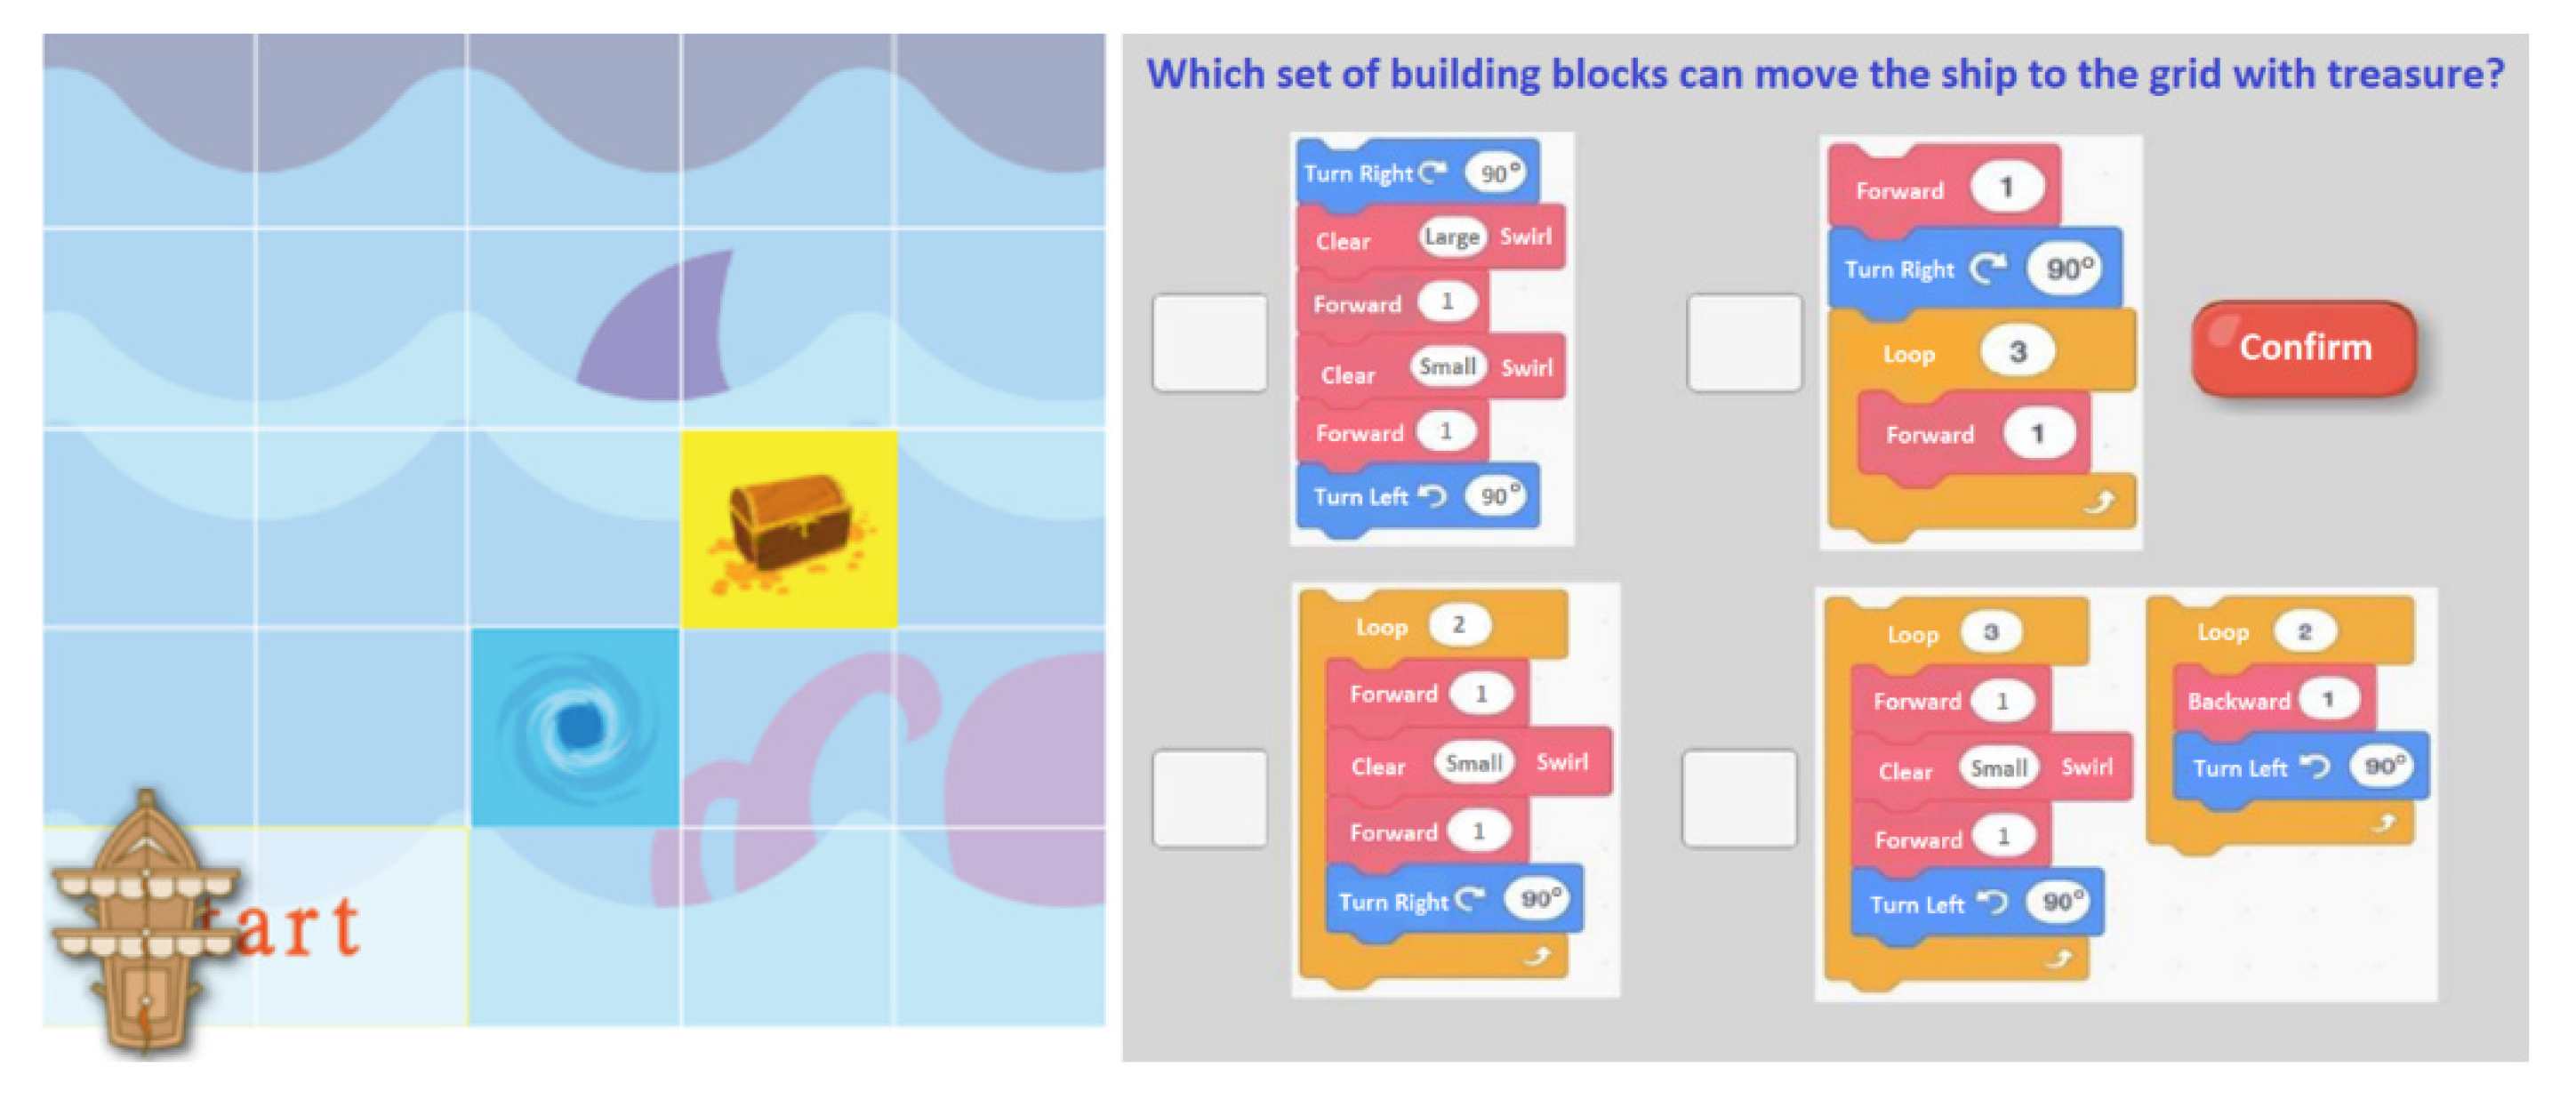
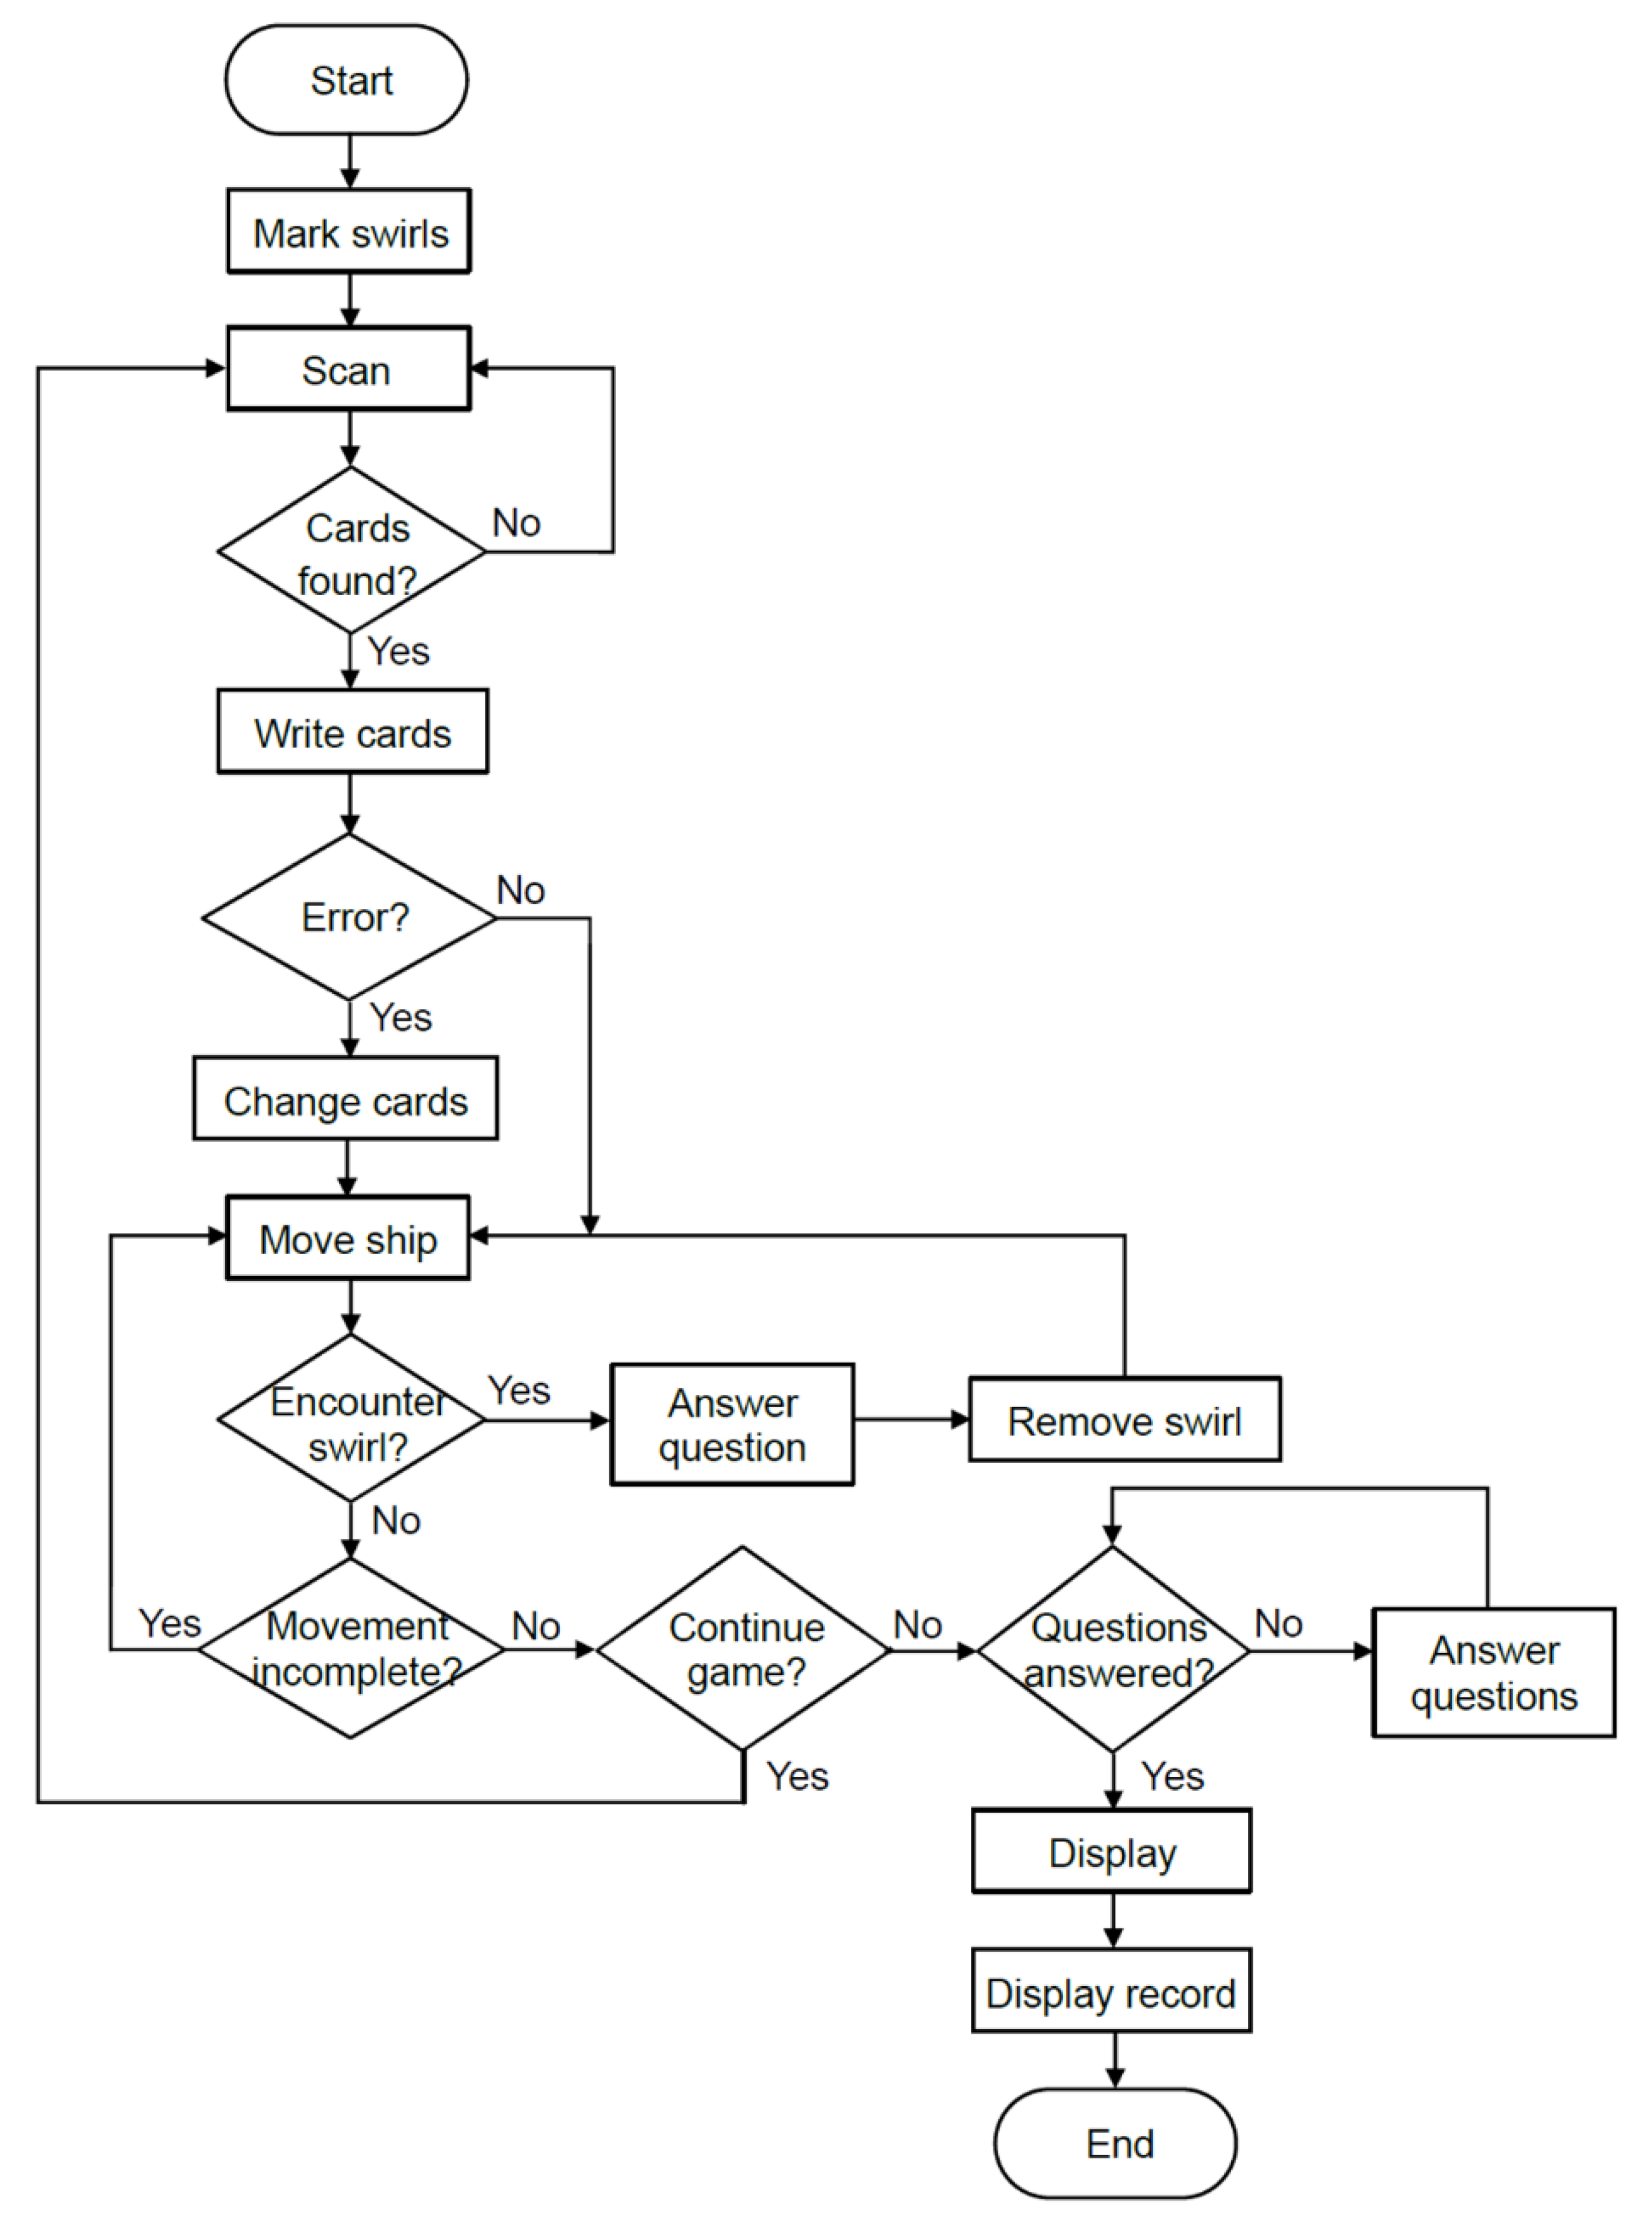
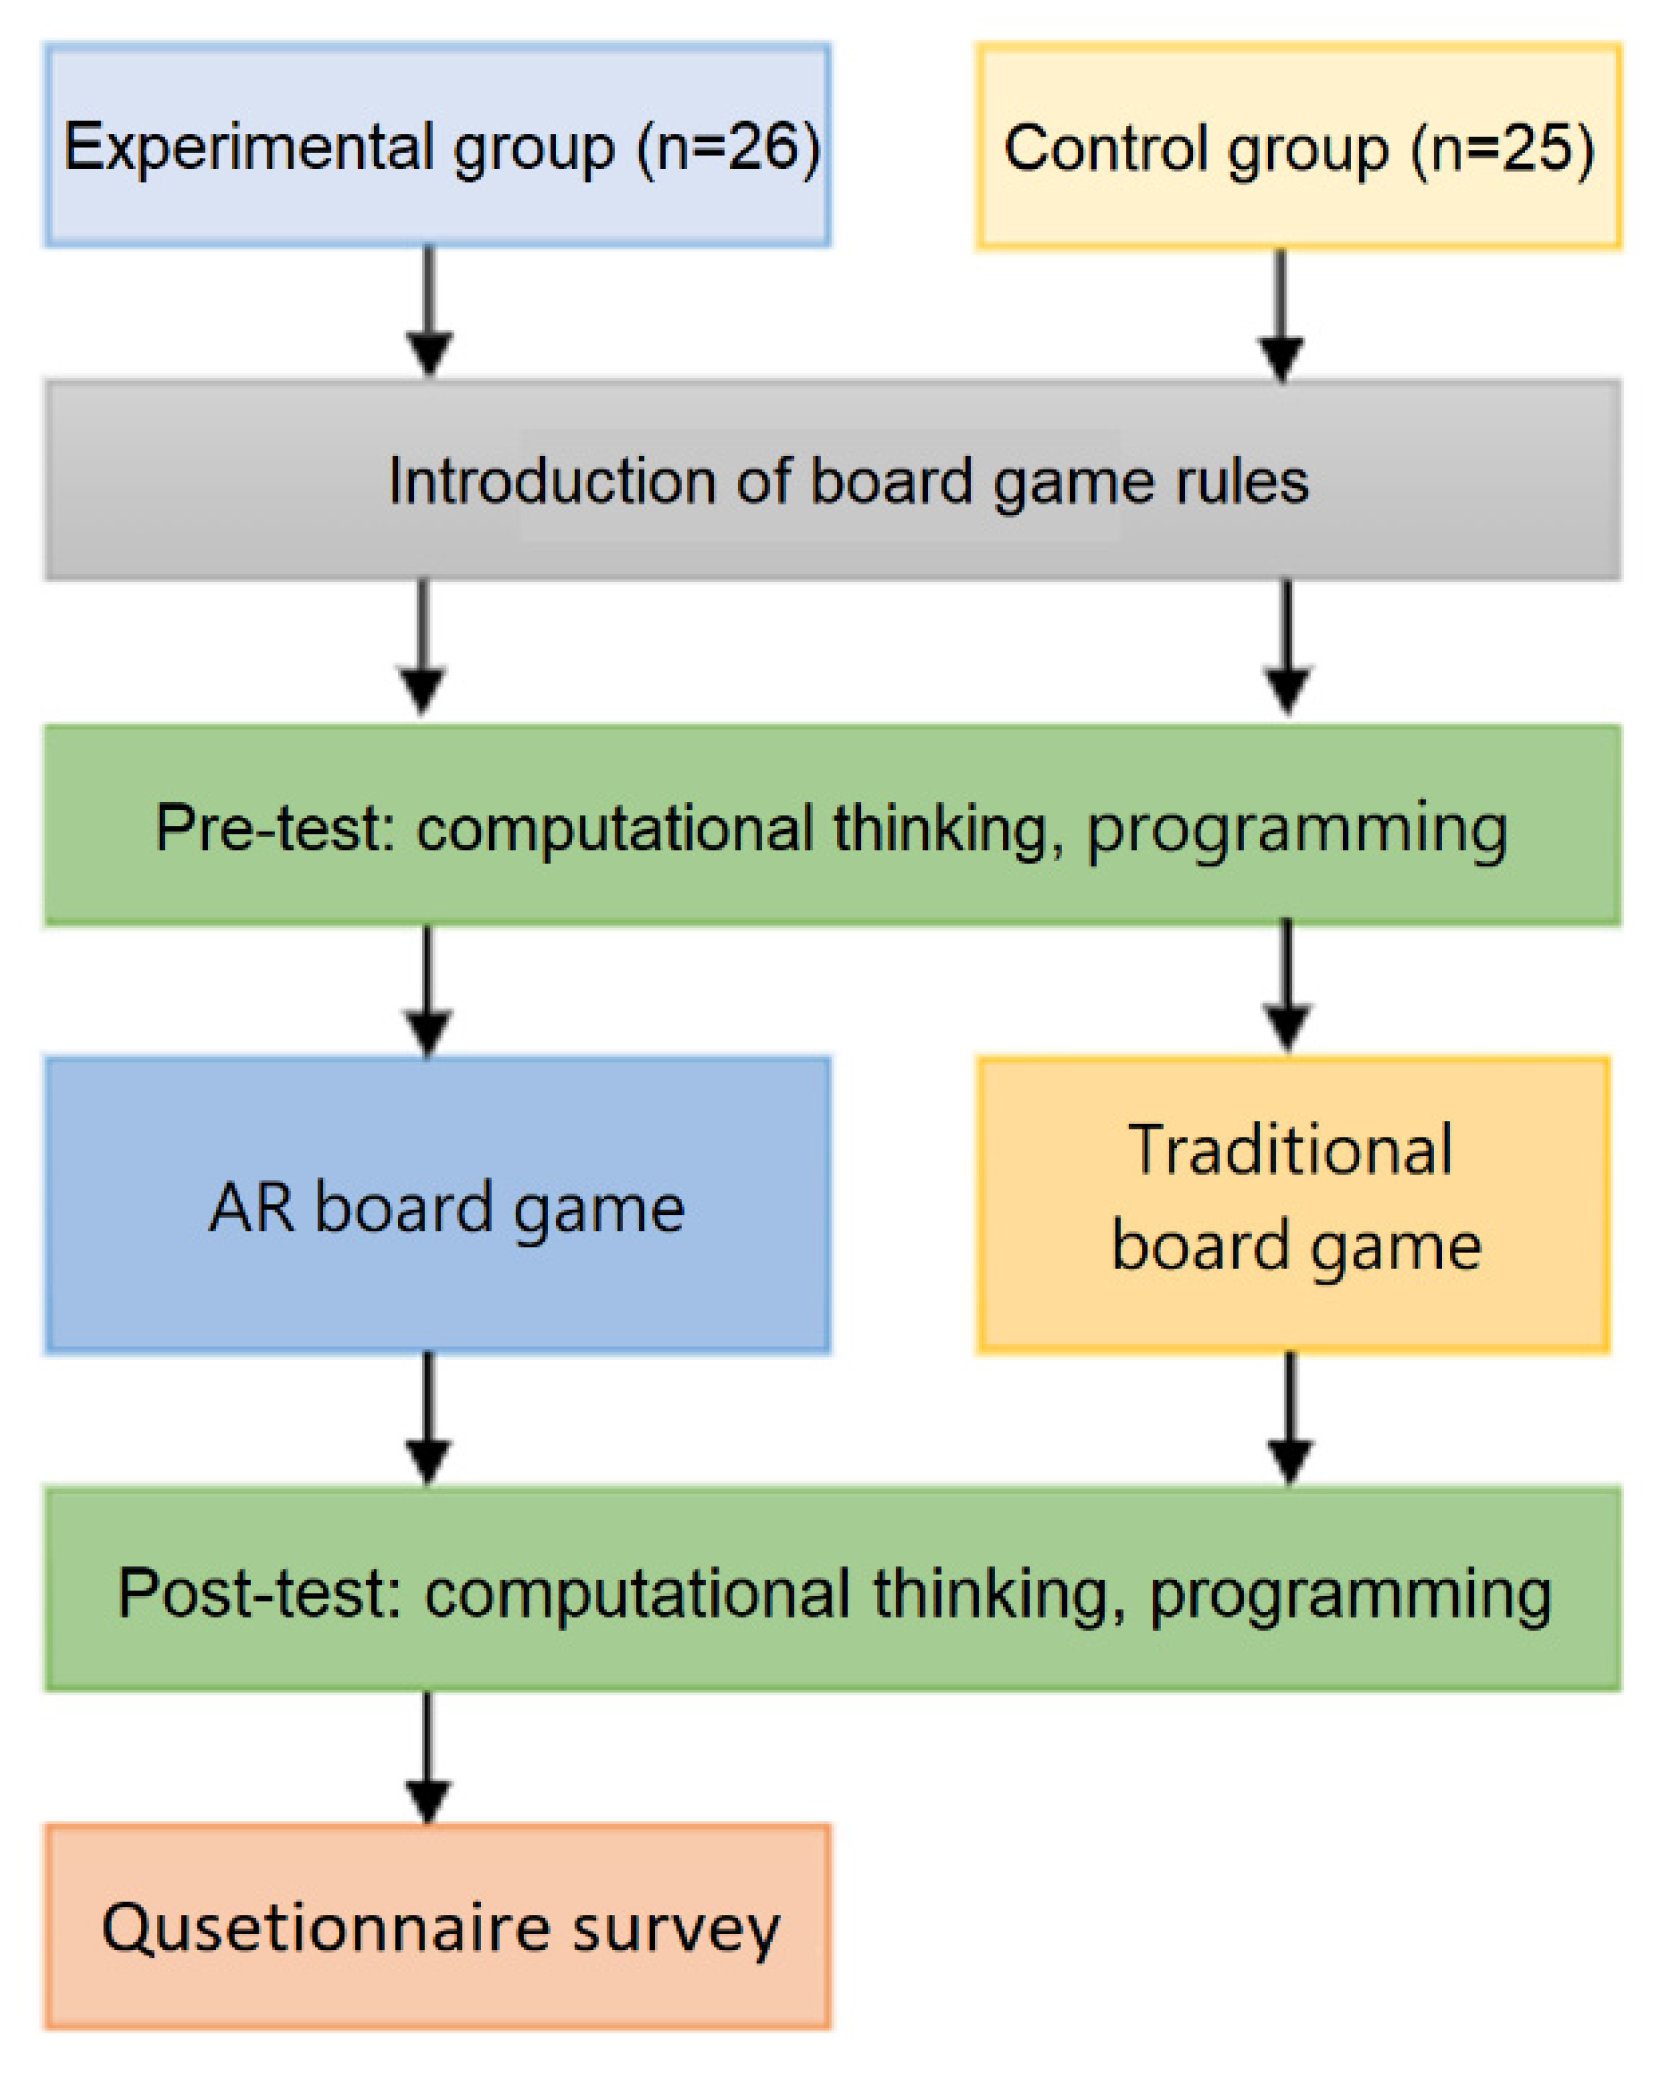
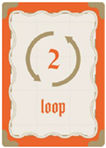
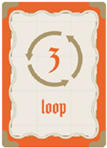
A teaching experiment was performed to evaluate students’ computational thinking concepts, Scratch programming skills, cognitive load, and system satisfaction after learning with coding board games. This study randomly selected two classes of third graders from an elementary school in Taipei as research samples. A quasi-experiment was conducted using the two-group pretest-posttest design. One class used the AR board game as the experimental group (
n = 26, 14 males and 12 females) and the other used the traditional coding board game as the control group (
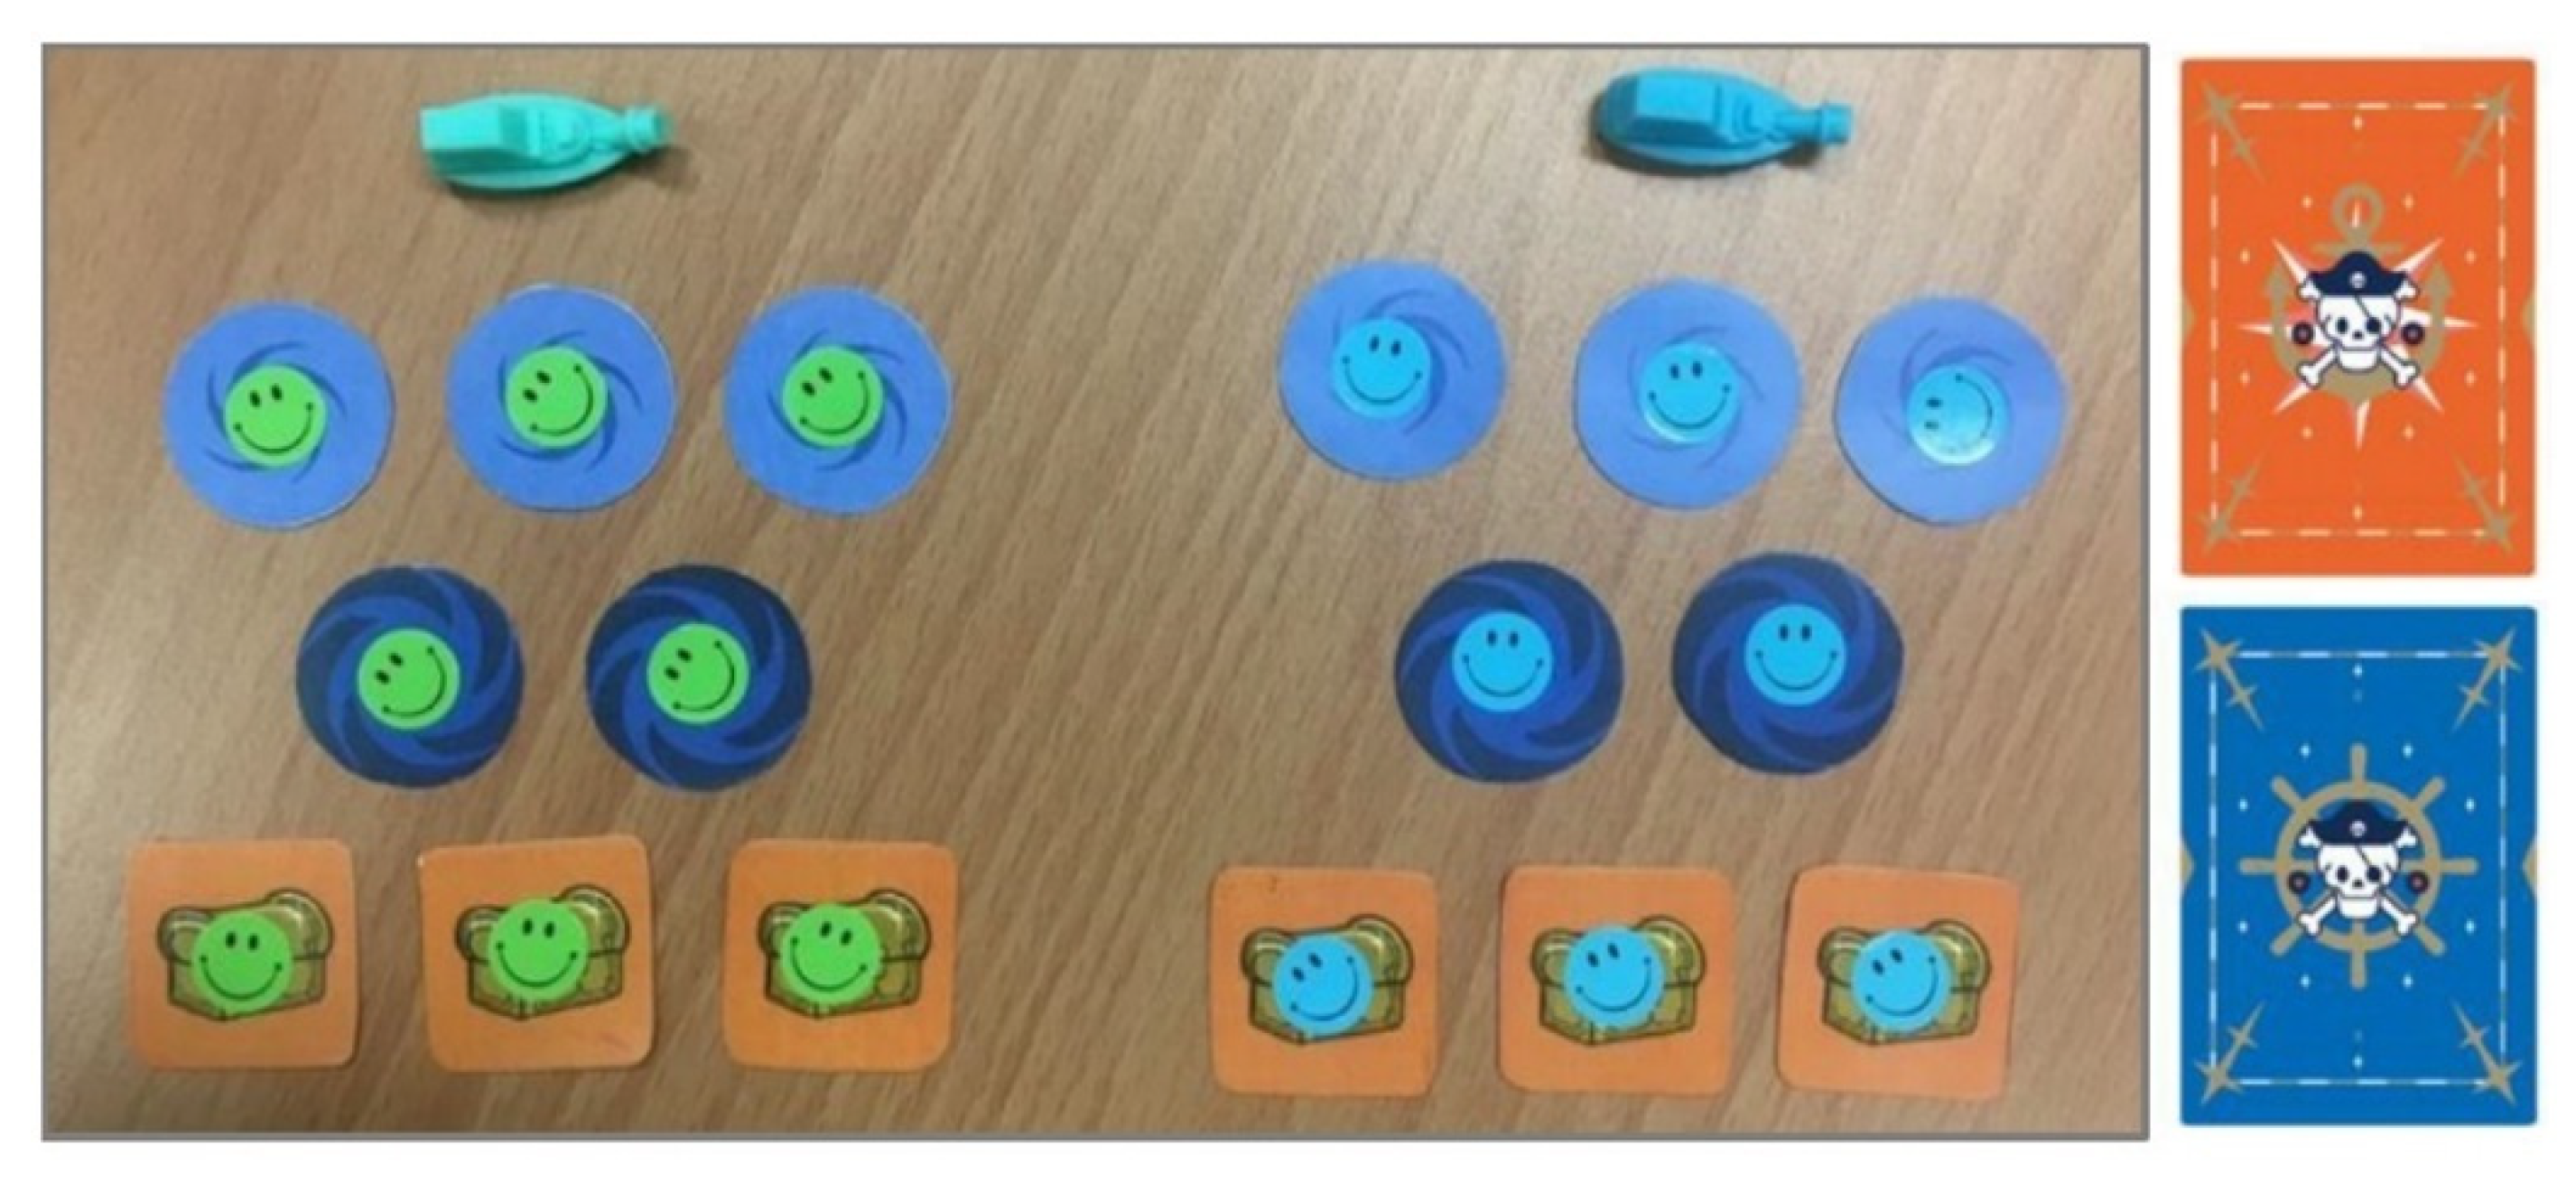
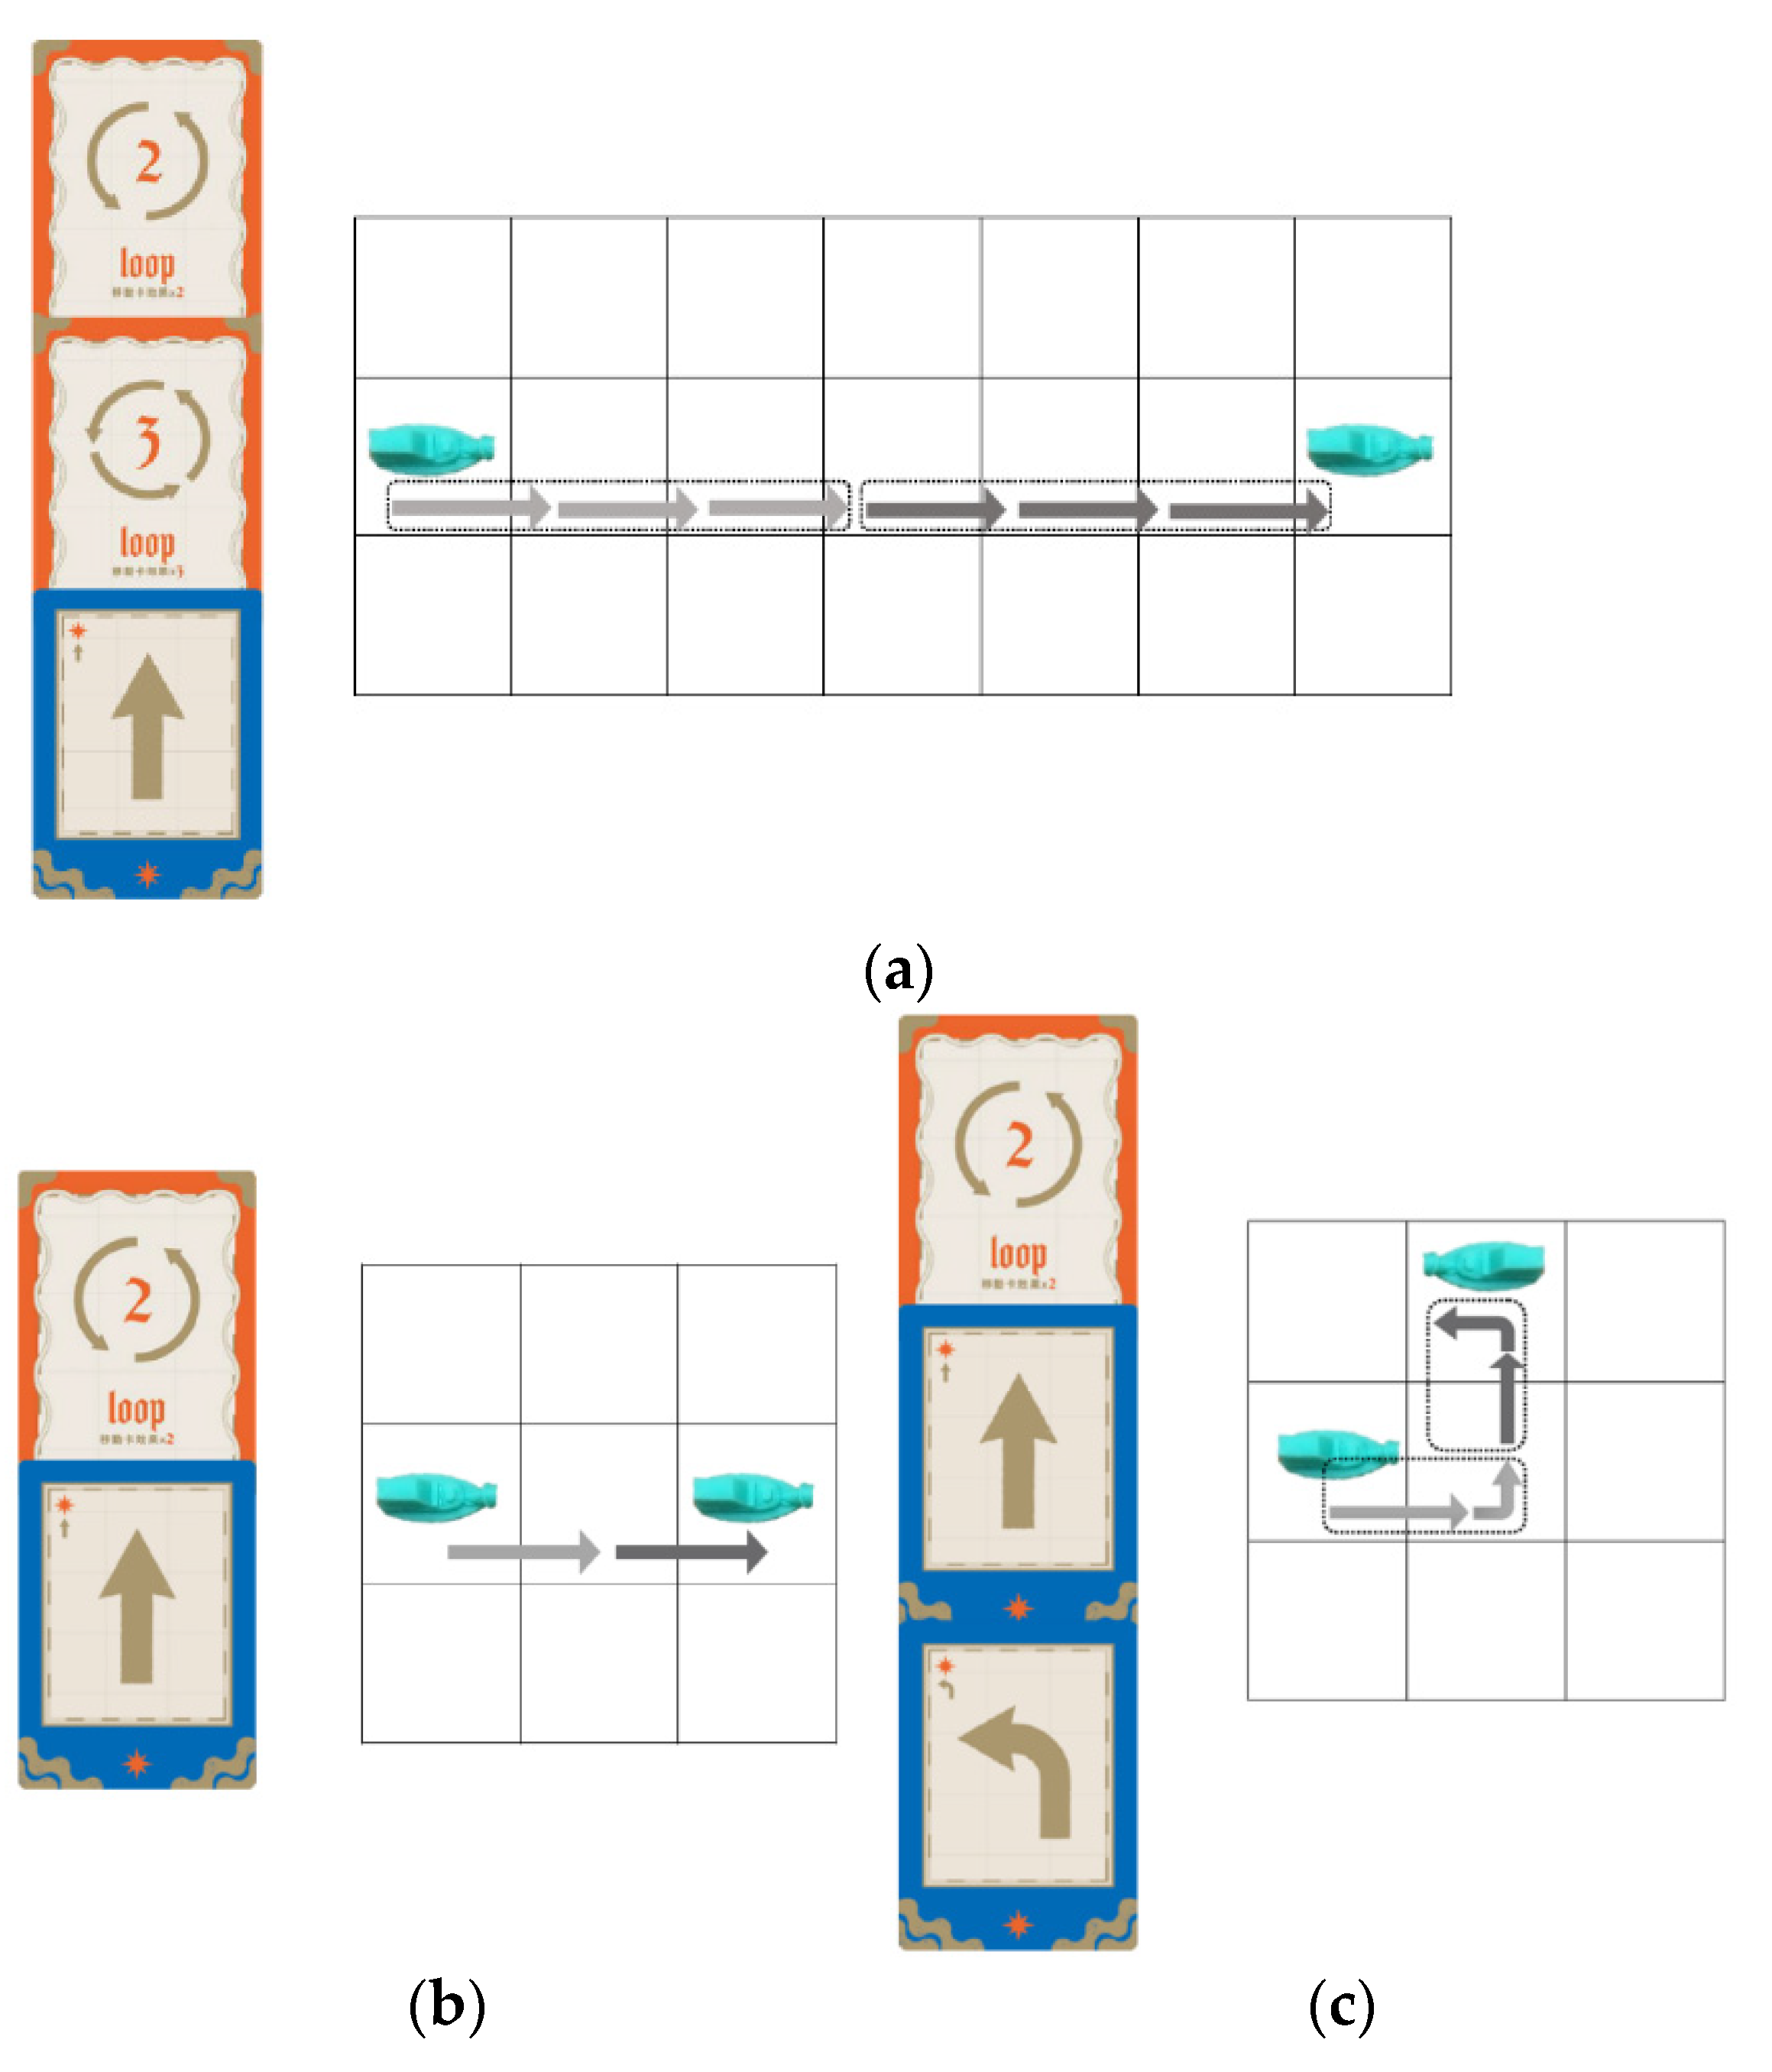
n = 25, 14 males and 11 females). The former scanned cards to obtain the ship path, and the latter played cards and moved the ship by themselves, both under the supervision of teachers (
Figure 24).
Before playing the board game, an introduction to the game rules was provided for both groups, and the achievement tests (pre-tests) of computational thinking concepts and Scratch programming skills were conducted. After the treatment, the post-tests of computational thinking concepts and Scratch programming skills as well as the questionnaires for measuring cognitive load and user satisfaction (experimental group only) were performed. A flowchart representing the teaching experiment is shown in
Figure 25. The test questions were designed based on the International Contest on Informatics and Computers by Bebras [
48], an international initiative aiming to promote informatics (computer science, or computing) and computational thinking among school students at all ages.
3.1. Computational Thinking
In the teaching experiment, the experimental group used the AR board game while the control group used the traditional board game for learning computational thinking concepts and Scratch programing skills. In the following, a one-way analysis of covariance (ANCOVA) was conducted to investigate whether there were significant differences in the learning effectiveness between the two groups. The test results were analyzed using IBM SPSS 24.0 software and the descriptive statistics of computational thinking scores and the results of paired-sample
t-test for both groups are shown in
Table 3.
The post-test score of the experimental group (78.46) is higher than that of the control group (60.00), and the standard deviation of the experimental group (12.55) is lower than that of the control group (18.26), indicating that the distribution of post-test scores in the experimental group is relatively concentrated. From the results of the paired-sample t-test, both the experimental group (t = −7.14, p < 0.001) and the control group (t = −3.40, p = 0.002 < 0.01) made significant progress. The results suggest that the computational thinking abilities of both groups improved significantly after using the AR board game and the traditional coding board game.
To further compare the learning effectiveness between the two groups, the ANCOVA was conducted using the type of board games as the independent variable, the post-test score as the dependent variable, and the pre-test score as the covariate. Before that, the assumptions for the homogeneity of within-group regression coefficients and variance had to be satisfied. The test result for the homogeneity of within-group regression coefficients shows that there is no significant difference (
F = 2.295,
p = 0.137 > 0.05), conforming to the hypothesis of homogeneity. Levene’s test was used to verify if there was homogeneity of variance between the two groups. The test result shows that the variance did not reach the significance level (
F = 2.405,
p = 0.127 > 0.05), satisfying the assumption of the homogeneity of variance and confirming that the ANCOVA could be performed. The ANCOVA results in
Table 4 indicate a significant difference between the two groups (
F = 16.952,
p < 0.001).
In
Table 5, the average score of the experimental group is adjusted from 78.46 to 76.32, and the average score of the control group is adjusted from 60.00 to 62.23. After excluding the influence of the pre-test score, the adjusted mean of the post-test score for the experimental group is higher than that of the control group, indicating that the learning effectiveness of the AR board games is higher than that of the traditional coding board game.
The above results show that using the AR board game was more effective for students in learning computational thinking concepts than using the traditional board game. It can be inferred from this that the research subjects were third graders without formal exposure to computing education. Playing the coding board game could improve their computational thinking abilities. The AR board game provided immediate assistance in clarifying students’ doubts, such as “whether the imagined path matches the actual movement” and “what is the best way to reach the grid with treasure”.
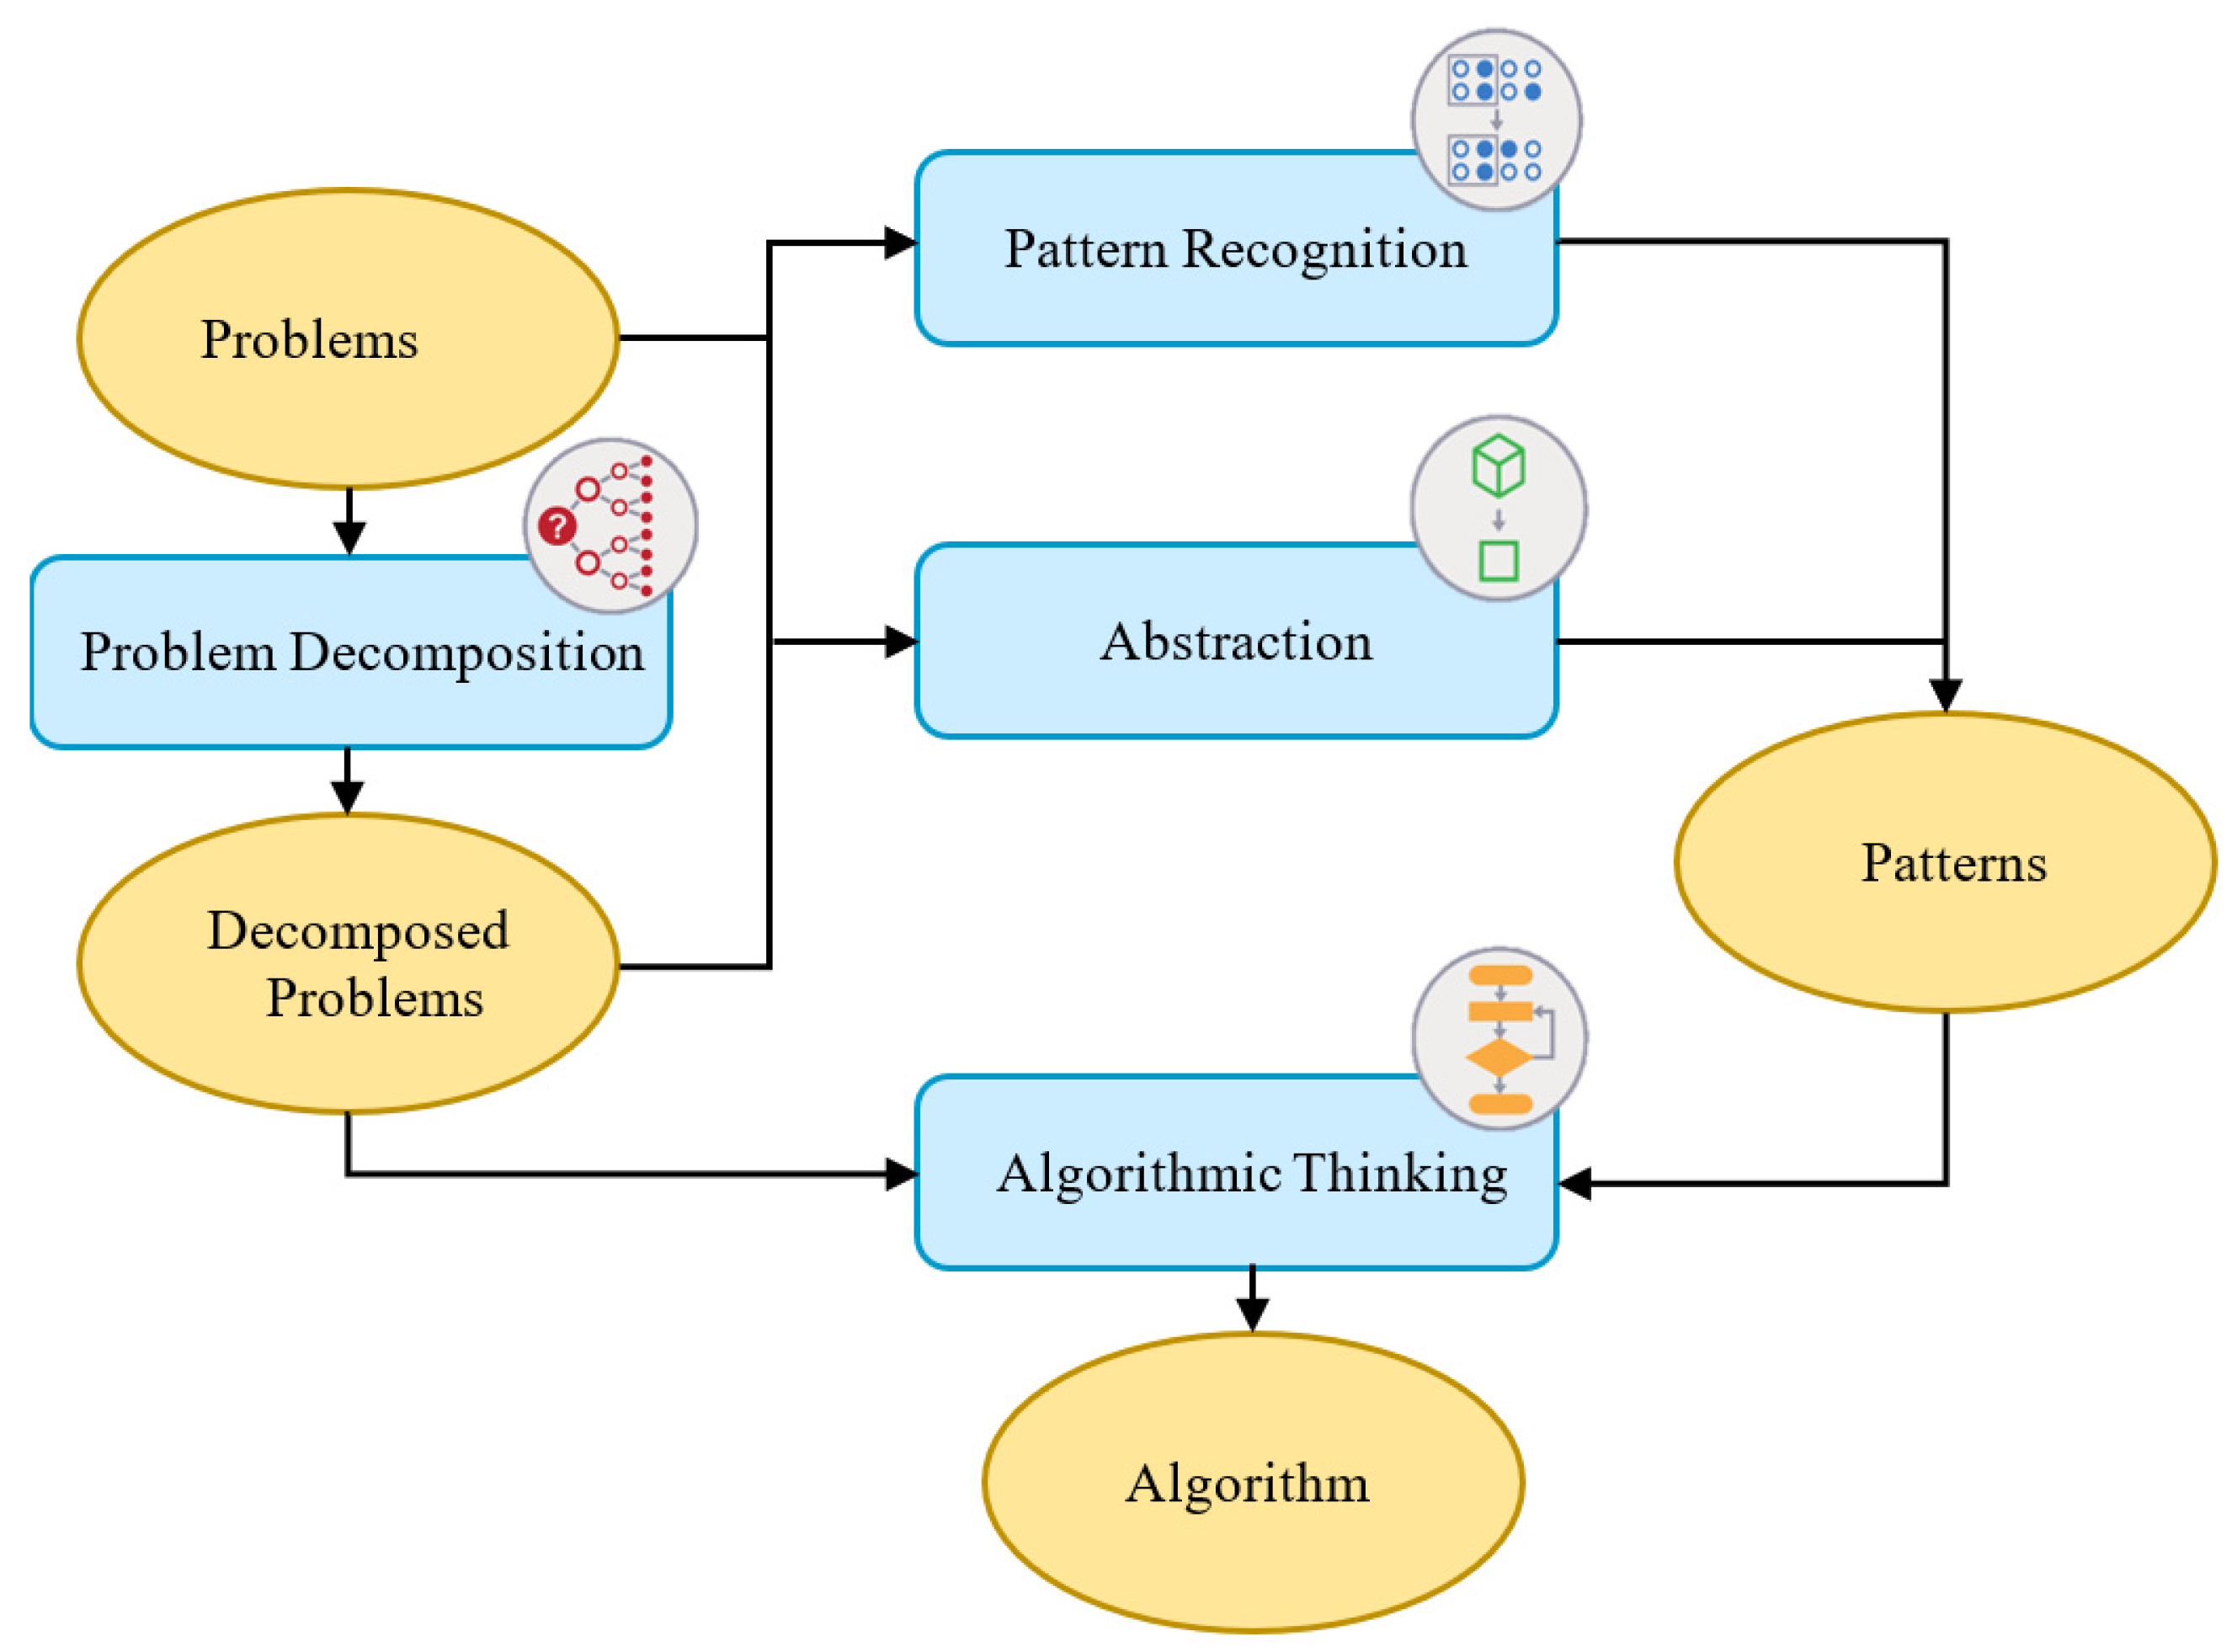
In order to further understand if there are significant differences in the performance of four computational thinking abilities between the two groups, the ANCOVA was conducted by using the type of board games as the independent variable, the post-test score for each computational thinking ability as the dependent variable, and the pre-test score for each computational thinking ability as the covariate.
Before performing the one-way ANCOVA, the homogeneity of the within-group regression coefficients had to be tested.
Table 6 shows the results of the homogeneity of regression coefficients for the four computational thinking abilities between the two groups. Among the four computational thinking abilities, abstraction (
F = 0.885,
p = 0.352 > 0.05), pattern recognition (
F = 0.182,
p = 0.672 > 0.05) and algorithmic thinking (
F = 2.755,
p = 0.104 > 0.05) did not reach a significant level, confirming that that the ANCOVA could be conducted. However, problem decomposition (
F = 8.004,
p = 0.007 < 0.05) reached a significant level, indicating that the slopes of regression lines are not the same. That is, the relationship between the pre-test and post-test for problem decomposition varies due to the use of different types of board games. As a result, the assumption was not satisfied and the ANCOVA could not be conducted.
Before conducting the ANCOVA, the Levene’s test was used to verify the homogeneity of variance for the three abilities. According to the test results, the variance did not reach a significant level for abstraction (
F = 0.164,
p = 0.688 > 0.05), pattern recognition (
F = 0.015,
p = 0.902 > 0.05) or algorithmic thinking (
F = 1.868,
p = 0.178 > 0.05). Therefore, the assumption for the homogeneity of variance was satisfied and the ANCOVA could be conducted. According to the ANCOVA results in
Table 7, only the difference in algorithmic thinking between the two groups was significant (
F = 21.949,
p < 0.001), indicating that using different types of board games had a significant impact on the algorithmic thinking ability.
In the three computational thinking abilities, the adjusted means of post-test scores for the experimental group are higher than those of the control group (
Table 8), abstraction (27.082 > 24.635), pattern recognition (12.690 > 10.802), and algorithmic thinking (63.962 > 51.080). Additionally, algorithmic thinking has the most significant difference and the AR board game performed better than the traditional board game.
Based on the above results, the computational thinking abilities of students could be improved by both types of coding board games, but only the algorithmic thinking ability has a significant difference, with the AR board game performing better than the traditional coding board game. The possible reasons are as follows.
The improvement of algorithmic thinking ability is related to the question of whether the learning process can be applied for the effective assistance of students in solving problems. Using the AR board game, students could correct wrong cards immediately through real-time simulation. In each round, learning experiences from designing effective commands are continuously accumulated and applied in similar situations to find the best ship path. Therefore, it is helpful in terms of improving algorithmic thinking ability.
Problem decomposition involves the thought process of each possible ship path. Students needed more time to decompose the problem into different situations in order to determine the best path to reach the grid with treasure. Therefore, its learning effectiveness is not as significant as that of algorithmic thinking, which is why the assumption of the homogeneity of regression coefficients was not satisfied.
3.2. Scratch Programming Skills
In this study, descriptive statistics were used to compare the differences between the pre-test and post-test scores for the two groups. The effectiveness of the AR board game in learning Scratch programming skills was evaluated and compared with that of a traditional board game. According to the descriptive statistics in
Table 9, the average post-test score of the experimental group is higher than that of the control group, and the standard deviation of the former is smaller than that of the latter, showing that the distribution of post-test scores in the experimental group is more concentrated. The results of a paired-sample
t-test show a significant difference between the pre-test and post-test scores of the experimental group (
t = −6.92,
p < 0.001) and the control group (
t = −2.09,
p = 0.048 < 0.05), indicating students’ Scratch programming skills improved significantly through both the AR board game and the traditional coding board game.
To further consider if there is a significant difference in Scratch programming skills between the two groups, an ANCOVA was conducted using the type of board games as the independent variable, the post-test score of Scratch programming skills as the dependent variable, and the pre-test score of Scratch programming skills as the covariate. As shown in
Table 10, there is a significant difference between the two groups (
F = 13.358,
p = 0.001 < 0.05), indicating that there is a significant difference in the post-test scores of Scratch programming skills between the two groups due to the use of different types of board games.
The above results show that the students using the AR board game had a more significant learning effectiveness than those using the traditional board game. It can be inferred that the third graders had not learned the block-based programming at school, so playing the coding board game was a little difficult for them. The real-time simulation of ship path in the AR board game can serve as a referee and provide learning scaffolds, enabling students to clearly understand the timing associated with using a certain card and the correct way to organize cards for correct execution. After considering the feasibility of each path, students gradually became familiar with the game rules and became more focused in the process of converting cards into commands to quickly reach the grid with the treasure, which is helpful for improving Scratch programming skills.
3.3. Cognitive Load
A questionnaire survey was conducted to measure the cognitive load of students after using different types of board games for learning computational thinking concepts and Scratch programming skills. The questionnaire was designed using a 5-point Likert scale, and the score from “strongly disagree” to “strongly agree” ranged, respectively, from 1 to 5 points. The value of internal consistency for the questionnaire was Cronbach’s alpha = 0.762, which is within the acceptable range. The mean score and standard deviation for each question were analyzed by the independent samples t-test to investigate whether the difference of cognitive load between the two groups was significant due to the use of different types of coding board games.
According to the results of the independent sample
t-test (
Table 11), the scores of most questions are higher than 4 for the experimental group, and only Question 4 (3.73) and Question 7 (3.73) are lower than 4. For the control group, only the score of Question 1 (4.16) is higher than 4, and the remaining questions have scores less than 4. Furthermore, the average score of each question in the experimental group is higher than that in the control group except for Question 7 (3.73), which is slightly less than that of the control group (3.73 < 3.80). Question 7 belongs to the attitude towards germane cognitive load. The possible reasons why the two groups had scores less than 4 can be explained as follows. Firstly, it might be related to the age of the students, as third graders are in the stage of establishing and cultivating concentration. When the two groups used the coding board games for learning, they may have focused more on how to win the game by moving the ship according to intuition. Following the learning scaffolds of the AR board game, the experimental group was less distracted than the control group. Secondly, according to the analytical results, the two types of coding board games had a positive impact on the two groups. Therefore, students may have not realized they were concentrated on learning computational thinking concepts and programming skills while playing the board game, but in fact gained the related skills while finding the correct ship path in each game round.
According to the above results, there are significant differences in cognitive load between the two groups in Question 3 (
p = 0.003 < 0.01), Question 6 (
p = 0.007 < 0.01), Q8 (
p < 0.001), and Question 10 (
p = 0.005 < 0.01). These four questions belong to the type of germane cognitive load, indicating that students who used the AR board game had a lower germane cognitive load. Conversely, it could arouse their motivation to learn computational thinking concepts and programming skills. The results are the same as those reported in [
22,
23,
24,
25], showing that the experimental group had a higher motivation to learn computational thinking and programming skills and that they would like to expend more effort when playing the AR board game.
The results of independent samples
t-test in
Table 12 show that the overall cognitive load of the experimental group (mean = 40.23; SD = 5.18) is lower than that of the control group (mean = 36.44; SD = 5.67), a higher score meaning a lower cognitive load. The
t-test results (
t = 2.494,
p = 0.016 < 0.05) show that use of the AR board game incurred a cognitive load that was significantly lower than that associated with using the traditional coding board game.
3.4. System Satisfaction
The system satisfaction of the AR board game was measured through a questionnaire survey by the experimental group. The questionnaire contained 10 questions, including three questions in learning contents, three questions in interface design, and four questions in operating experience (
Table 13). This study adopted a 5-point Likert scale (scoring: 5 = strongly agree; 4 = agree; 3 = neutral; 2 = disagree; 1 = strongly disagree). The value of Cronbach’s alpha was 0.853, indicating that the questionnaire had a high reliability. The mean scores of most questions are higher than 4, and the average score of overall satisfaction is 4.01, showing that the attitudes of the students in terms of their operating experience with the AR board game were mainly between “satisfied” and “highly satisfied”. The questionnaire results can be used as a reference for system design and improvement in the future.
According to the results of the user satisfaction survey, the dimensional average score is 3.81 for interface design, 4.13 for learning contents, and 4.10 for operating experience, with the overall average score higher than 4. Among all dimensions, Question 4 (“This system is easy to operate”) and Question 5 (“The icons and text descriptions were of appropriate size”) have lower average scores. The observation from the teaching experiment revealed that students used tablets as a tool for scanning AR cards, and that they might encounter some problems when playing the AR board game for the first time. Firstly, students were unfamiliar with the tablet camera because scanning all cards at the same time was a laborious task. Secondly, after watching the simulation of movement path on the screen, students accidentally pressed the wrong icon out of curiosity. This could be the reason why the average score of Question 4 is the lowest (3.58). Thirdly, limited by the tablet’ screen size, the images of ships and swirls in the path simulation were small, and the resolution of Q&A icons was also affected. This could be the reason for the lower average score (3.65) in Question 5.

