4. Data Analysis
To demonstrate the proposed methodology for the processing of the dataset for customer satisfaction data, a list of tasks was formulated and solved.
Task 1. Collect data from an online survey concerning customer opinions about the impact of customer satisfaction from the e-buying process during the COVID-19 pandemic.
Solution
Customers’ data collection
A link to the online survey was shared through partners’ websites, social media (Facebook groups), and email. The respondents were Bulgarian online customers who filled out the questionnaire (voluntary response sample). The questionnaire was designed using Google forms and contained 21 questions to measure the customers’ perceptions about the variables used in the study [
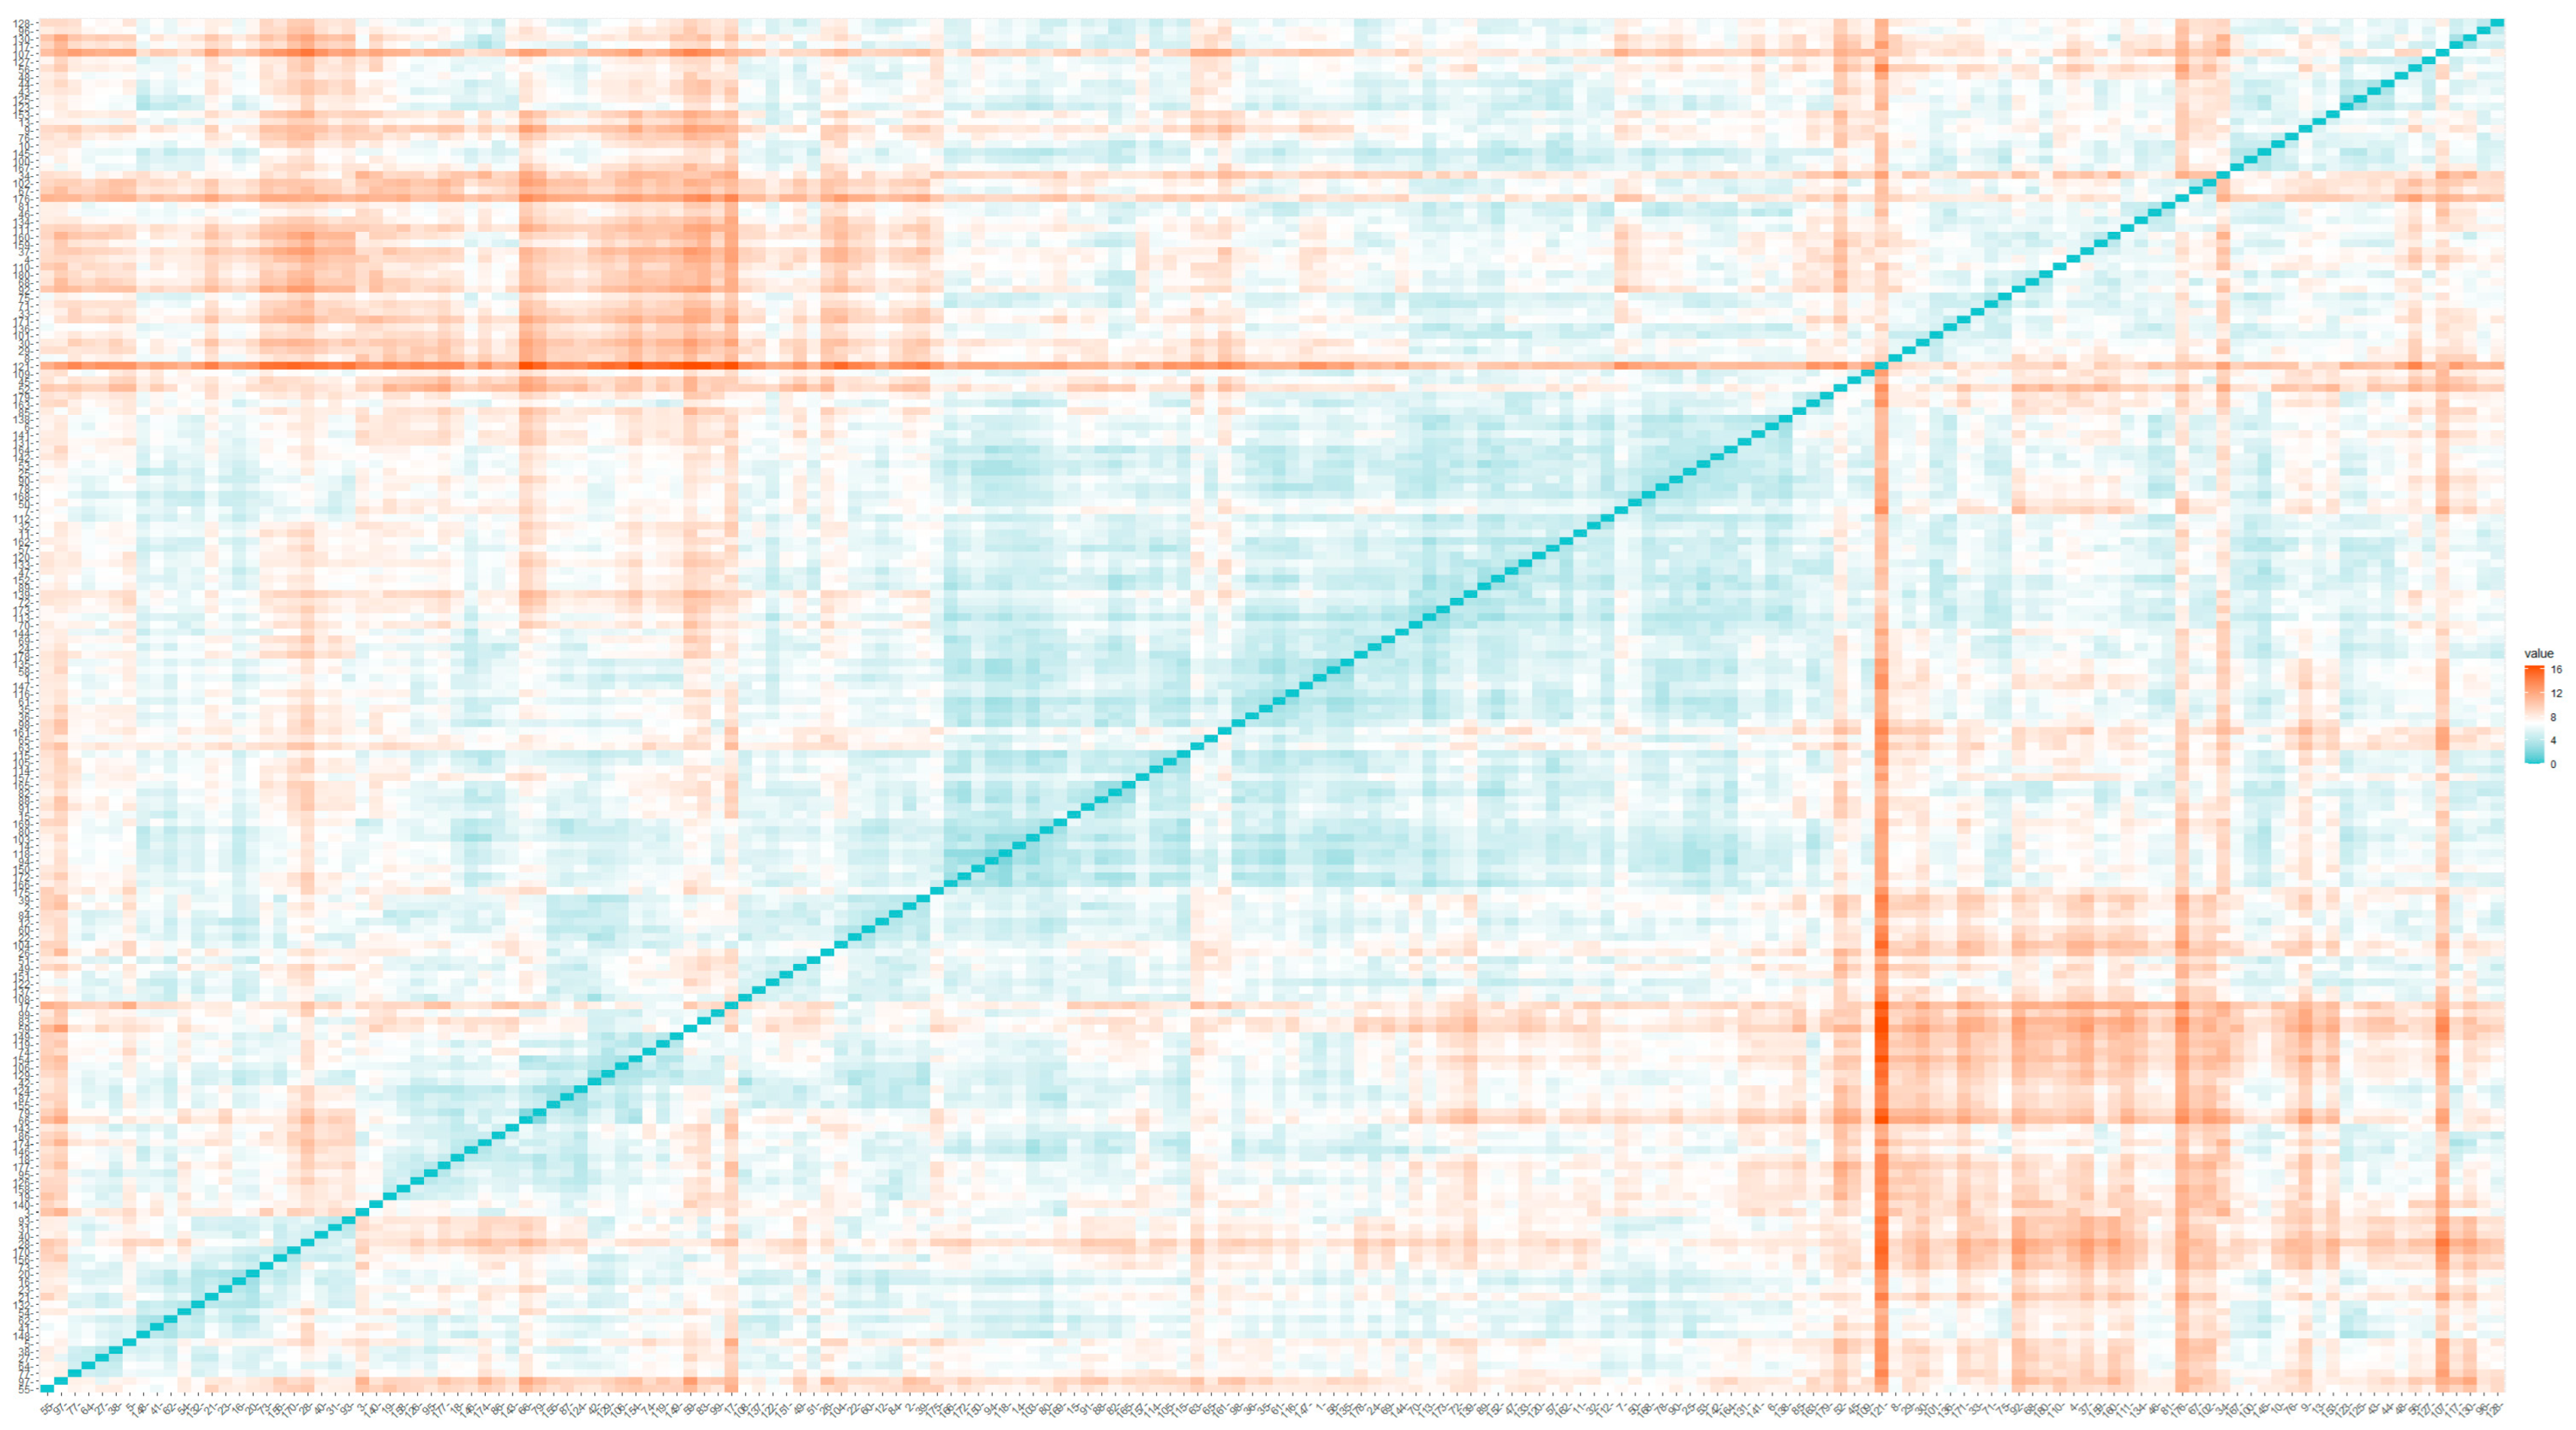
51]. The data about the attitude to e-commerce were collected during the period from 17 March to 30 June 2022. The questionnaire was correctly filled in by 207 respondents. However, 27 observations should be omitted since these respondents do not shop online (Question #7). A duplicate check has shown that there are no identical values in the dataset rows (
Figure 1).
In
Figure 1, the closer distance means the smaller difference between the individuals. The degree of similarity is visualized with different colors: from full coincidence (0—blue color) to maximum difference (10—orange color). There are no duplicate records in the dataset, and all records will participate in the further analysis. To build the dissimilarity matrix, we have applied the fviz_dist function in R programming language.
Data storage
The collected survey data are available online in a data repository [
51].
Data coding
The coding scheme and coded data are also accessible online. Out of all 21 answers, 18 are coded [
51]. The rest of the answers (respondent’s municipality, preferred websites for e-buying, and experience in e-commerce during COVID-19 pandemic) are stored in their original form for further processing.
Task 2. Determine the main characteristics of survey respondents.
Solution
To clarify the profile of survey respondents, we performed data pre-processing and traditional statistical analysis (percentage distribution of responses, descriptive statistics, and correlation analysis).
Main Characteristics of Respondents in the Sample
Table 2 displays the profile of the survey participants. A significant part of the respondents was female (73%) (Question #1). Of the 207 respondents, almost 70% were under the age of 40 (Question #2). The sample was dominated by respondents with at least a university degree (65.2%) (Question #3) and living in urban areas (92.27%) (Question #4).
The distribution of participants by geographical districts and regions shows that the greatest share of respondents was from the Plovdiv district (54.6%), followed by Pazardzhik (11.1%) and Haskovo (7.7%), and the South Central region (81.2%), followed by the South Eastern region (7.7%) (Question #5).
The top three of the most visited international websites for online shopping include Site #1 (AliExpress.com)—56 (31.11%), Site #3 (eBay.com)—20 (11.11%), and Site #2 (Amazon.com)—18 (10.00%). The most widely used Bulgarian e-commerce websites are the following: Site #5 (eMAG.bg)—107 (59.44%), Site #9 (SportDepot.bg)—53 (29.44%), and Site #10 (FashionDays.bg)—53 (29.44%). There is increased interest in food, non-prescription medicine, and nutritional supplements websites: Site #11—Remedium.bg, Site #7—eBag.bg, and Site #8—Glovo.bg (Question #10). Without a doubt, the pandemic has increased the sales of the biggest online retailers and websites for over-the-counter drugs and food delivery.
For more than 70% of the participants, cash on delivery is a preferred method of payment. Almost 1/3 of respondents pay with a debit or credit card (Question #11). In recent years, the number of users paying with credit cards has slightly increased. One of the reasons for such an increase in credit card payments is the fact that most of the banks have a mandatory “credit card” option when taking out a loan. Only 2% of respondents use bank transfer. This ratio is completely different from the situation in developed countries, for example, the United States, where payment cards (credit or debit) are utilized by 78% of the online shoppers, with the most popular online payment alternative being PayPal [
5]. This ratio is similar to the ratio of the world as a whole [
54].
Feature selection
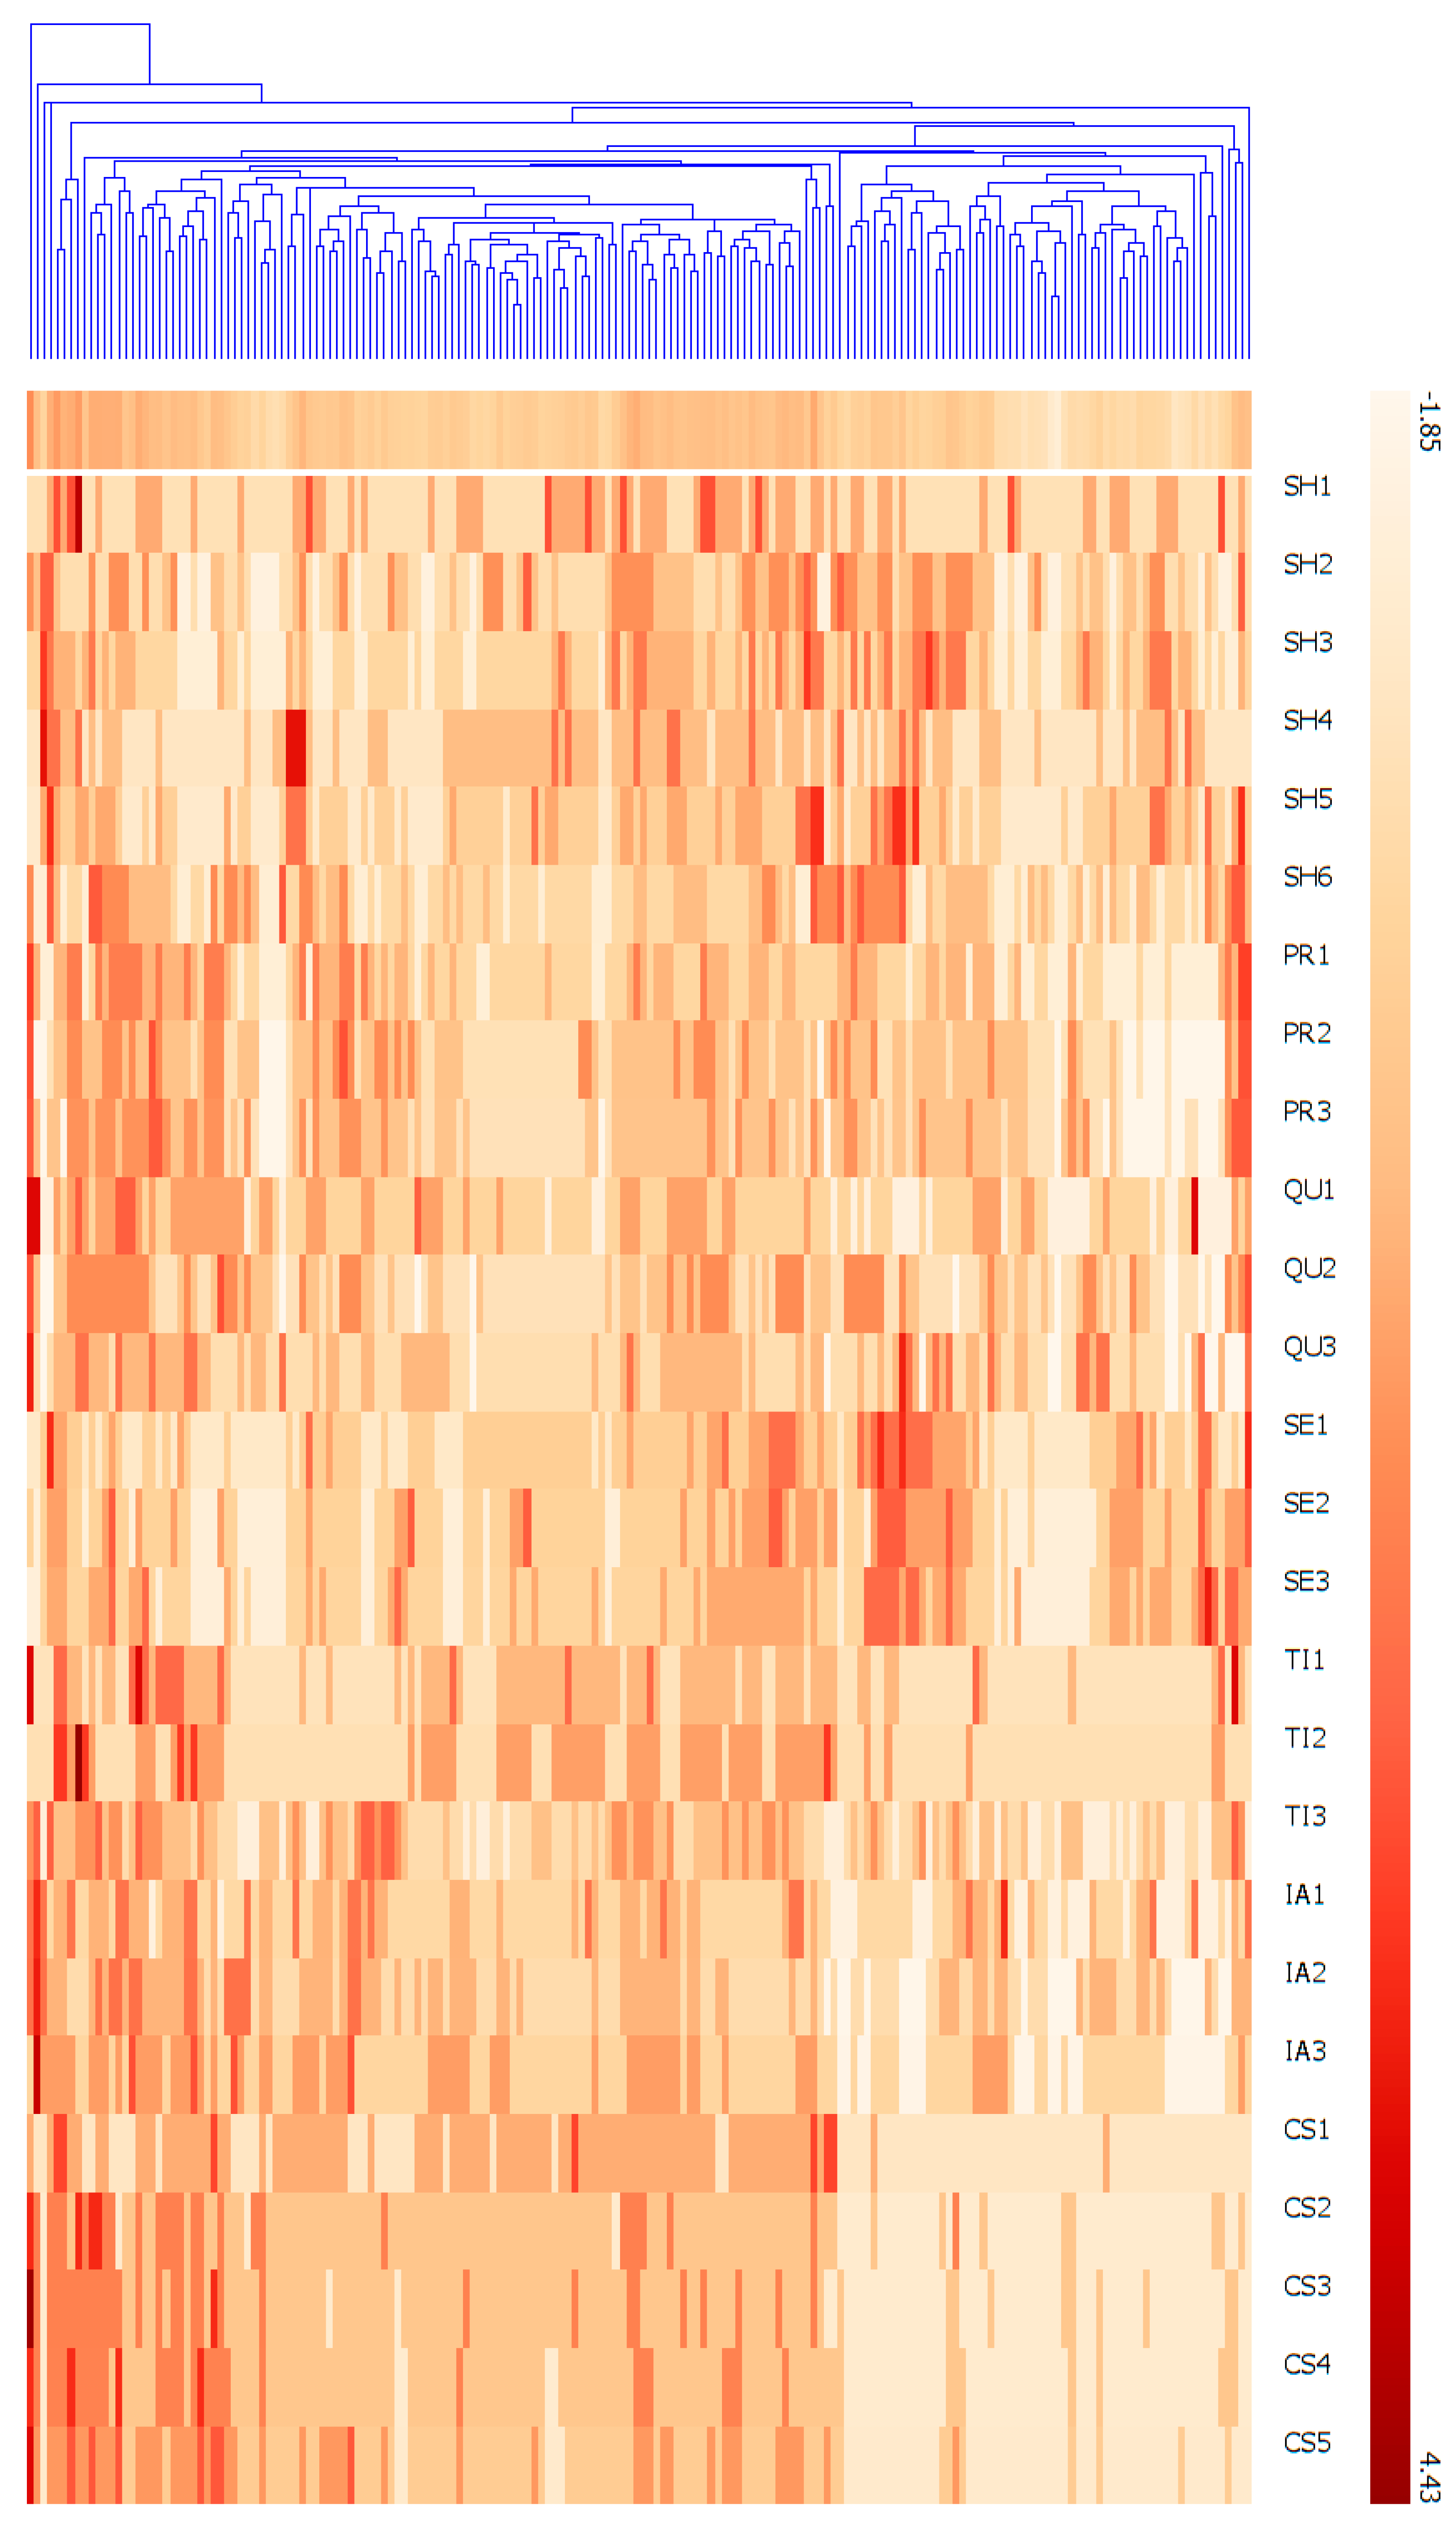
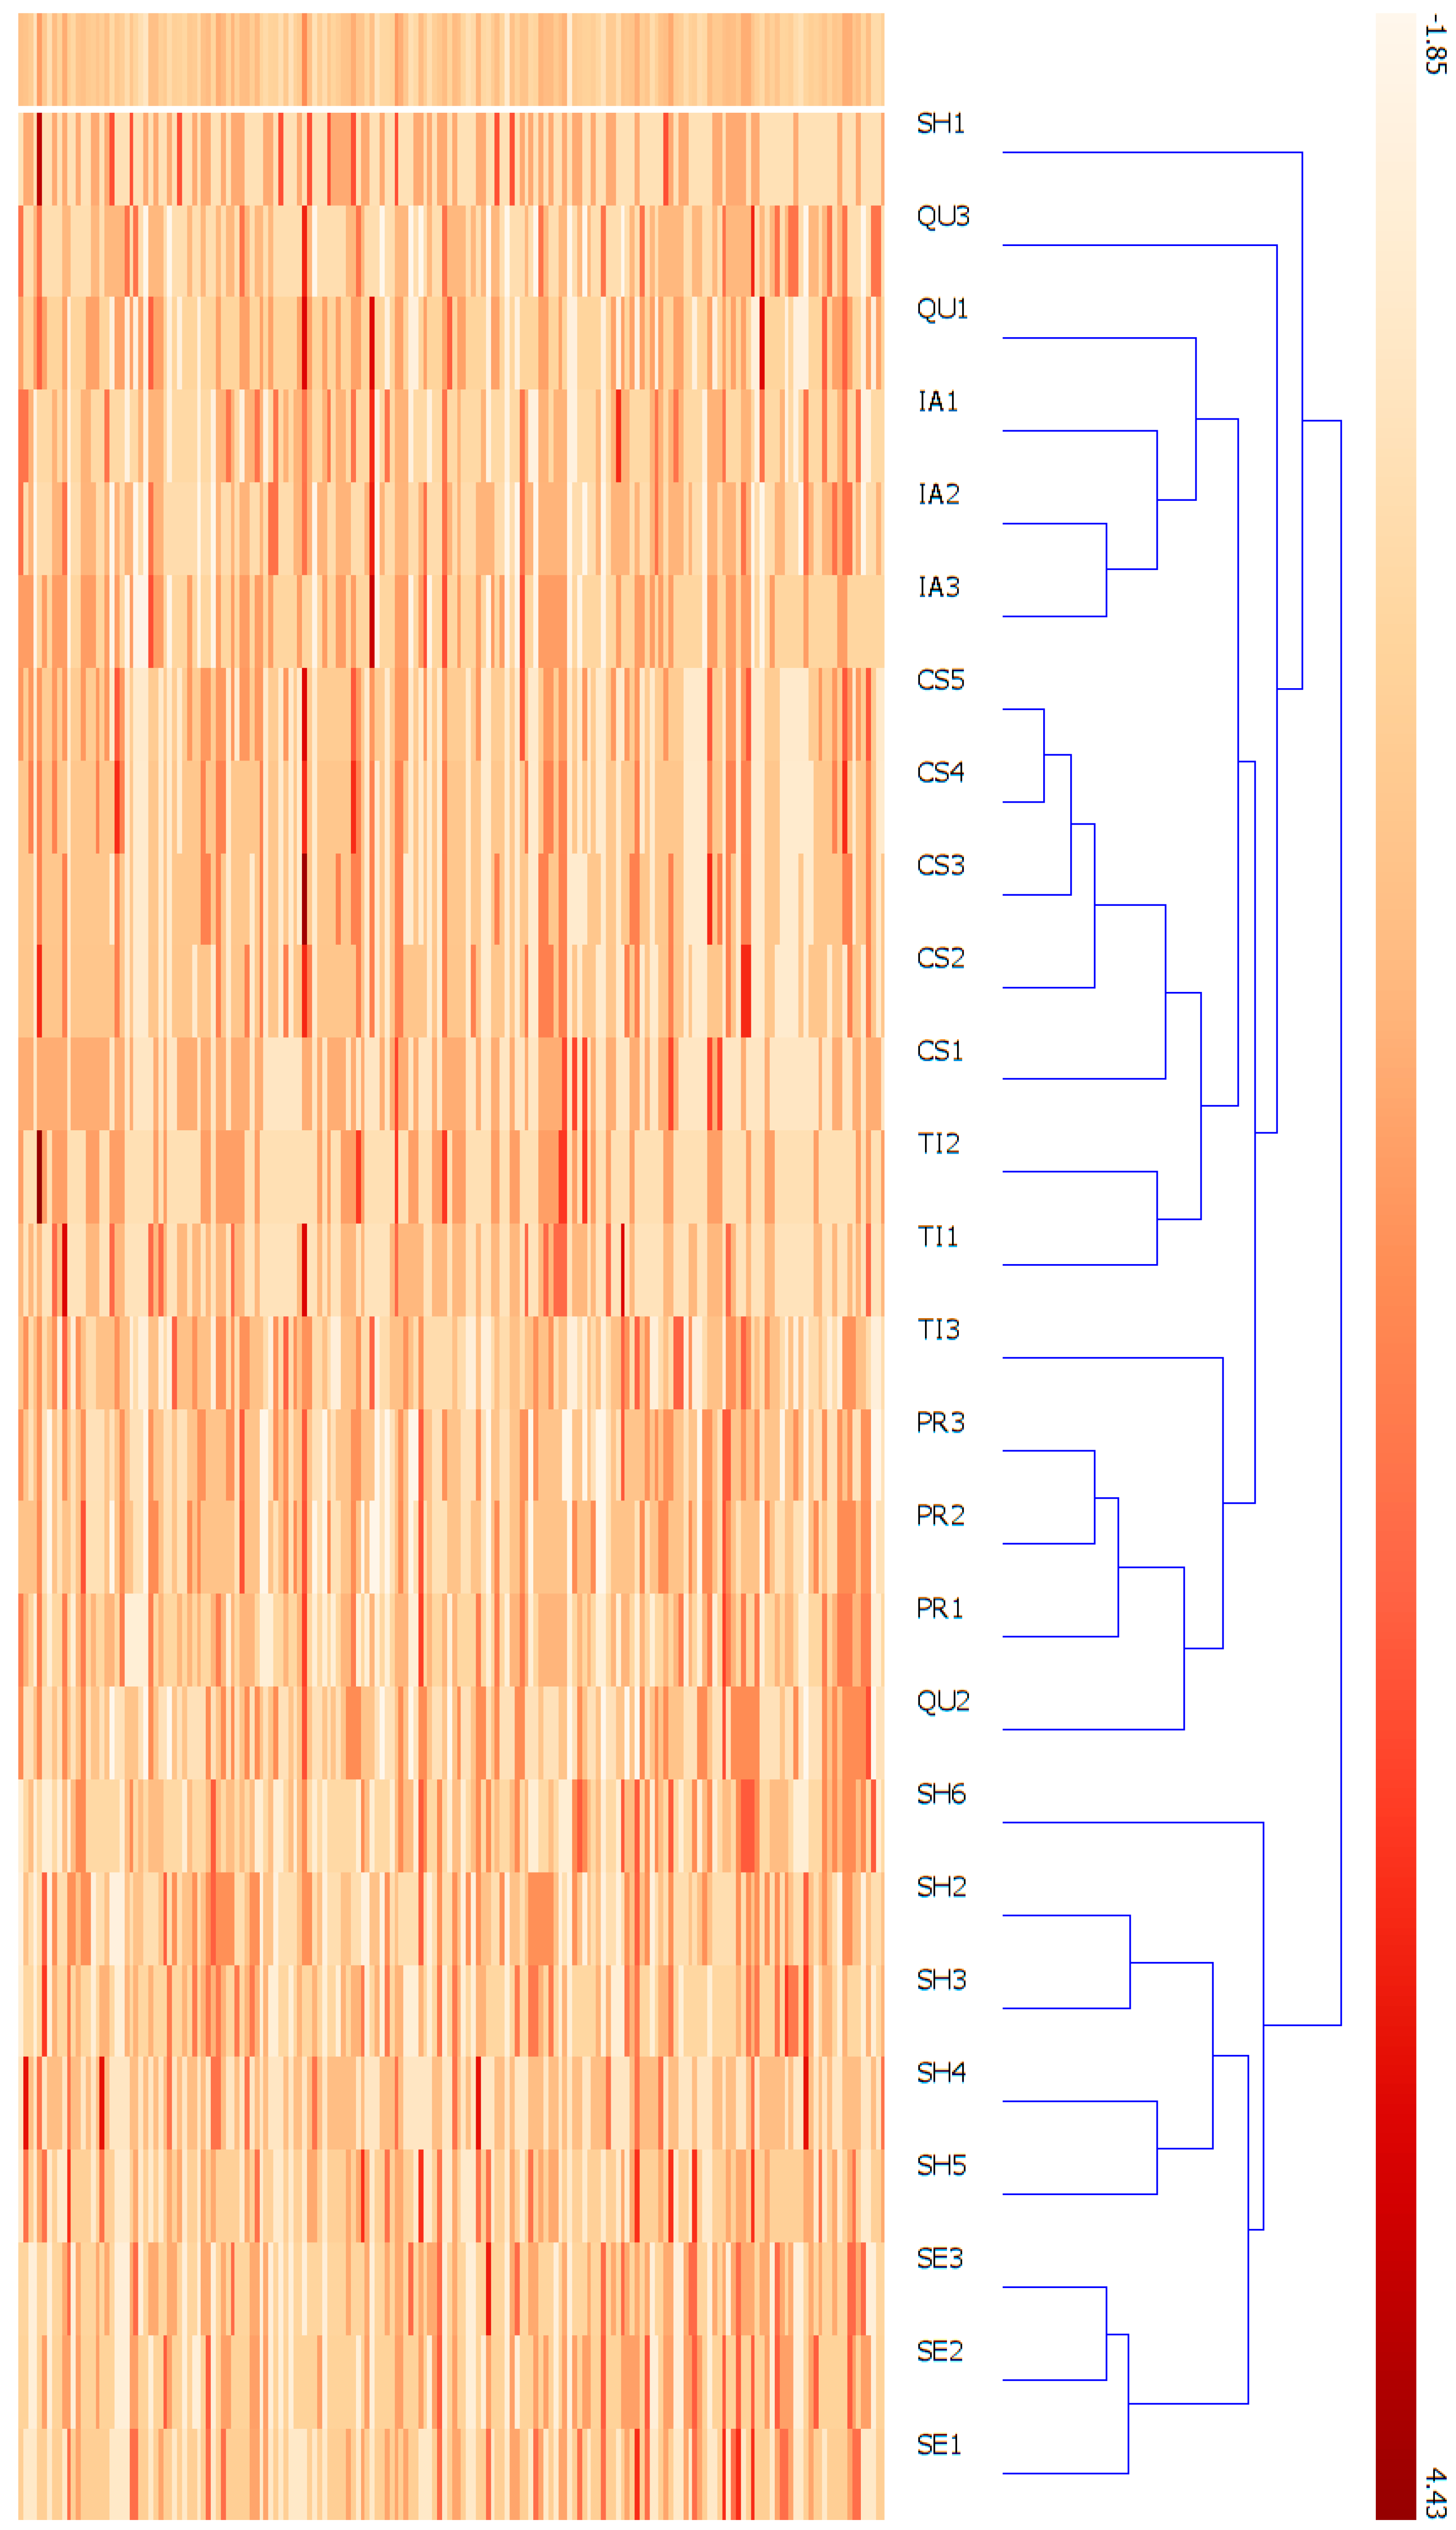
To visualize the attitudes of participants to online shopping, we have employed the hierarchical clustering (heat map) method.
Figure 2 and
Figure 3 depict the similarity between customers’ opinions and attributes (variables) respectively. To create heat maps, we have applied Orange 3.22 software.
Task 3. Identify groups of consumers who share similar buying characteristics and groups of variables with a similar impact on customer attitudes and opinions.
Solution
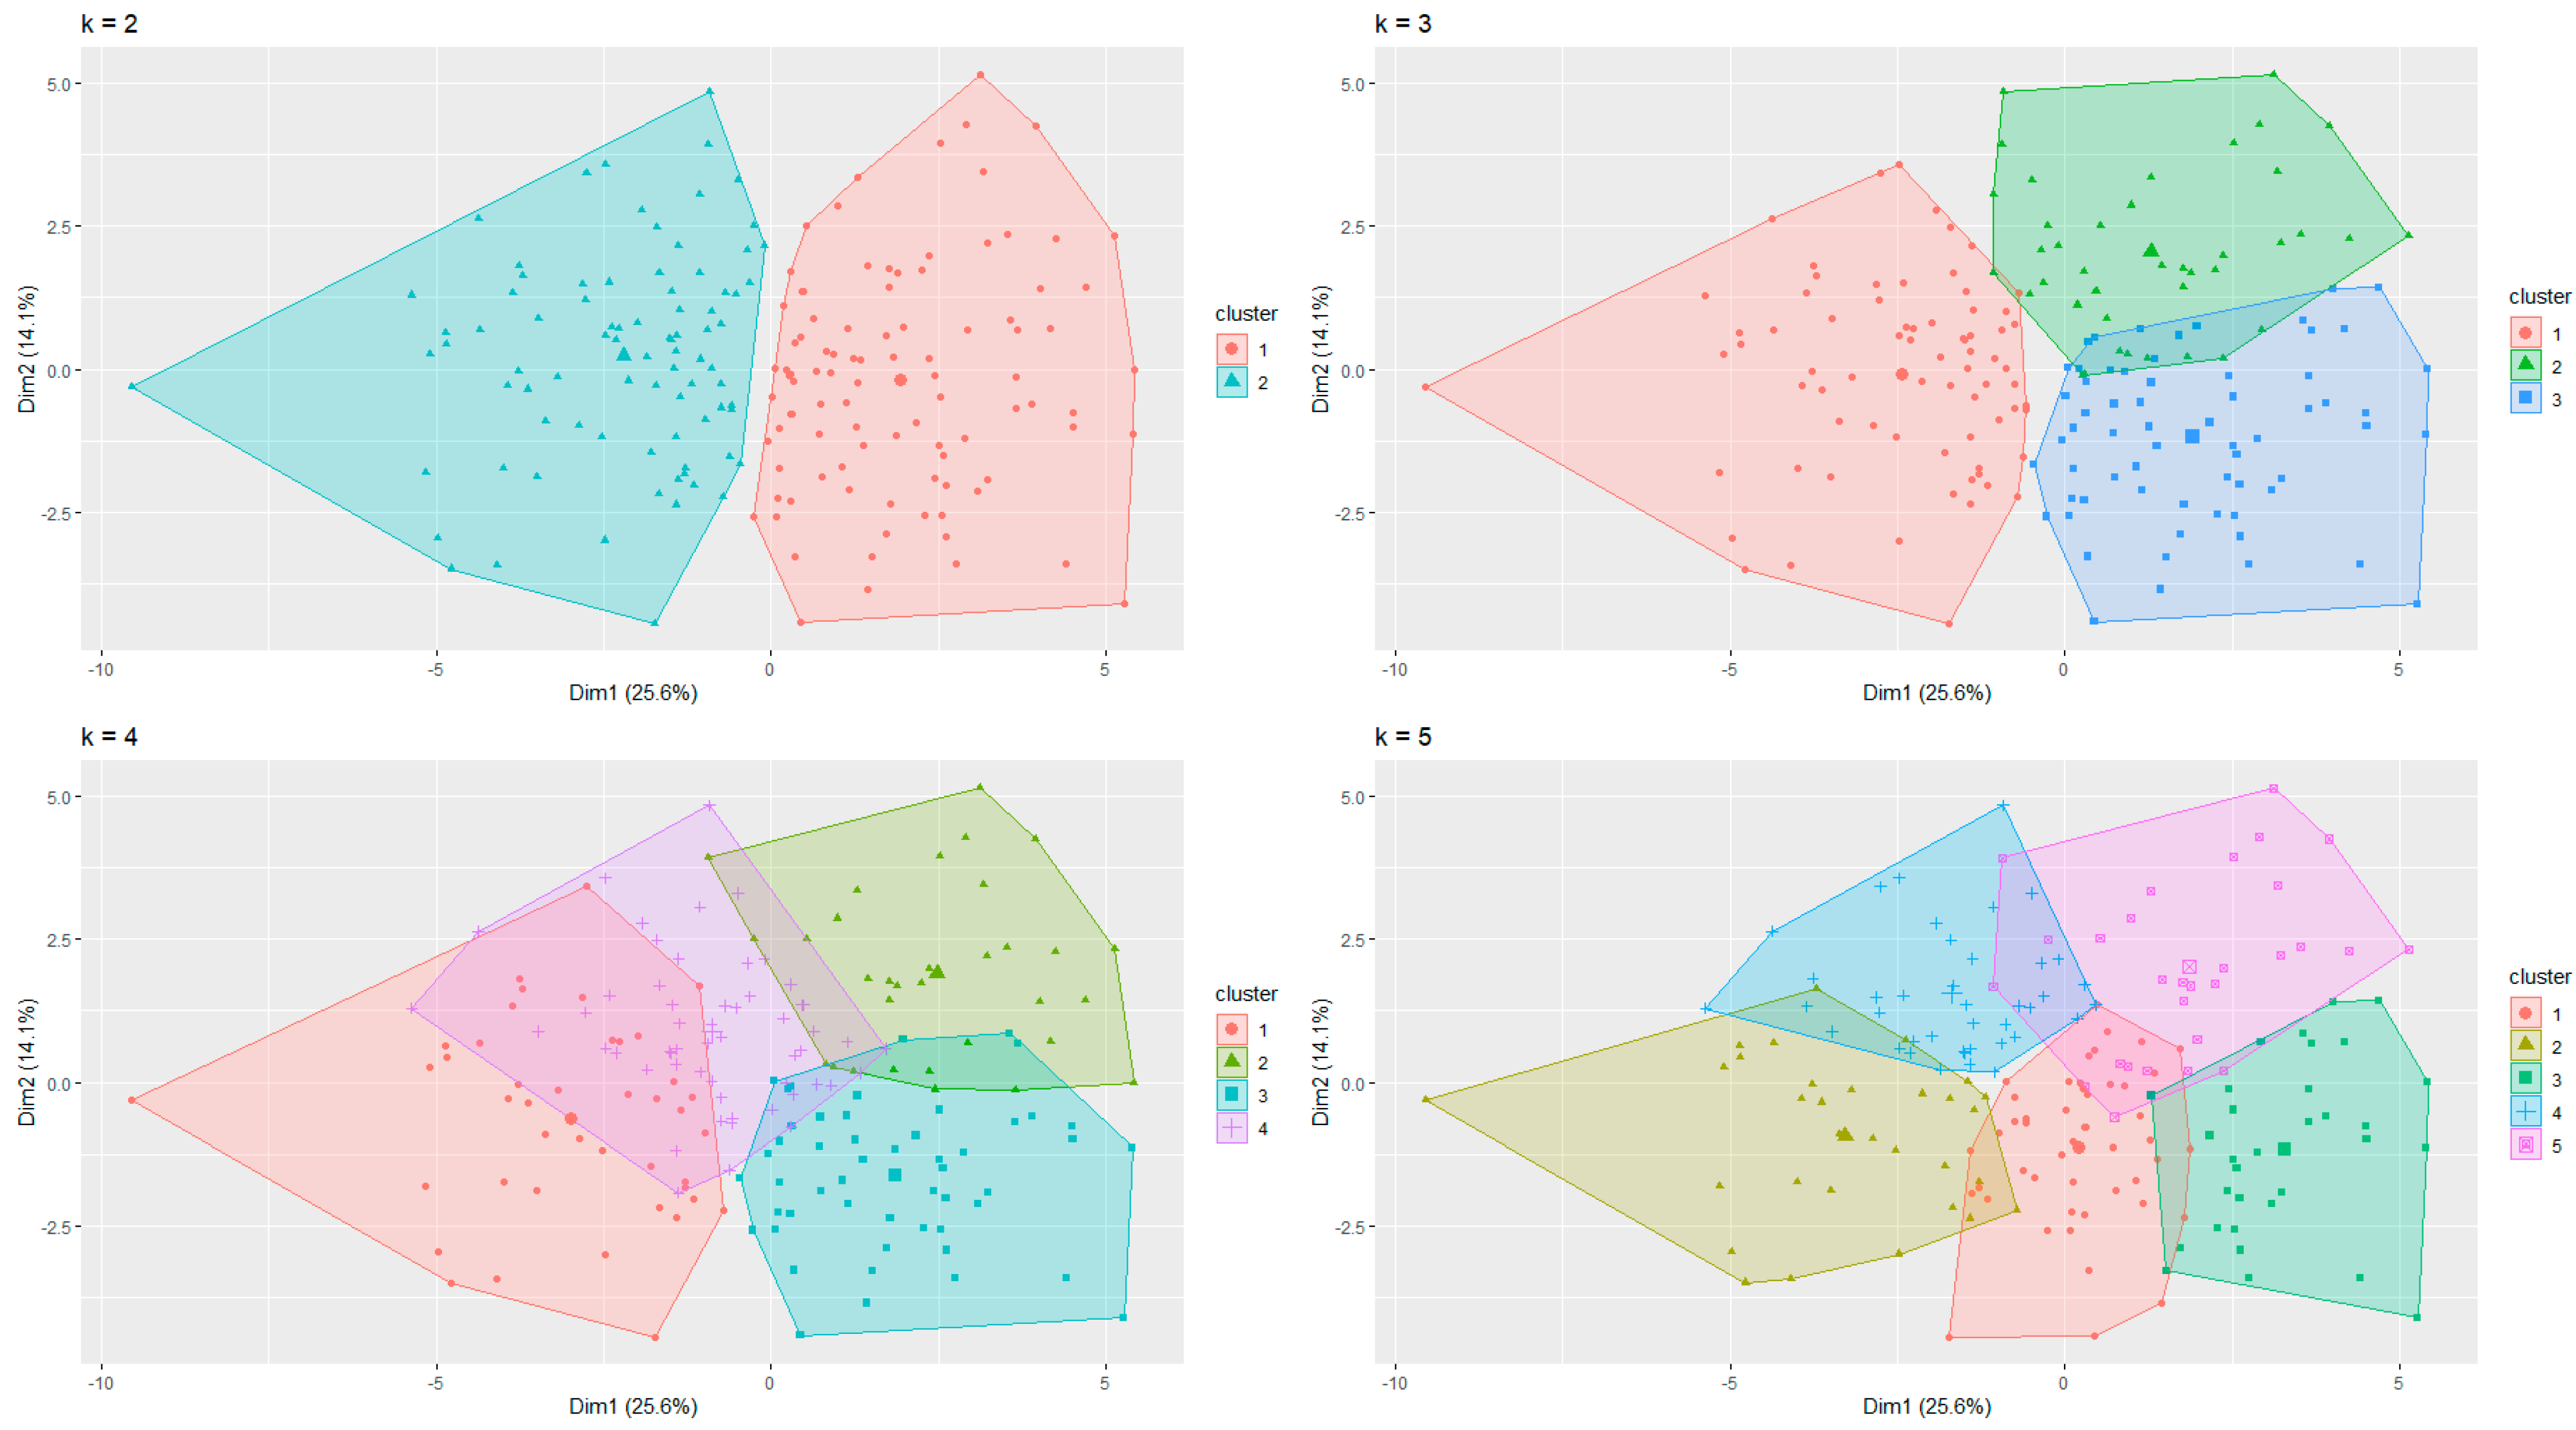
The solution to Task 3 was found using the k-means method for cluster analysis. To determine the optimal number of clusters, we employed the Silhouette method, and the result revealed that the optimal number of clusters is two. As can be seen in
Figure 4, when k = 2, there is no overlap between clusters. This means that the k-means method offers a feasible solution to the problem of identifying clusters of online shoppers with a similar attitude to e-commerce during the COVID-19 pandemic.
The first cluster consists of 115 “dissatisfied” customers—with lower ratings on customer satisfaction (Question #20) (
Table 3). Indicators with the strongest influence on overall dissatisfaction were price (Question #15), quality (Question #16), time (Question #18), and information availability (Question #19). Information availability and time requirements are the most significant factors for the dissatisfaction of the first group of users. In contrast, the consumers from the second cluster demonstrate greater satisfaction in online shopping. In
Table 3, the average estimates of indicators for two clusters, as well as the absolute differences between these estimates, are also depicted.
Task 4. Build customer satisfaction model and verify it.
Solution
According to the previous research (
Section 2), there is no consensus on what should be considered inputs and outputs when evaluating consumer satisfaction in e-commerce purchases. In order to solve this problem, we employed iteratively the PLS-SEM method in SmartPLS software [
55].
The algorithm for constructing a structural regression consists of the following steps:
Step 1. Formulation of hypotheses about latent variables and the relationships between them.
Step 2. Determination of indicators for latent variables.
Step 3. Numerical modeling and assessment of model quality.
Step 4. Examining model fit. If the model fits the data, then go to Step 5, else go to Step 3 to improve the model.
Step 5. Interpretation of obtained results.
Step 1. Hypotheses creation about latent variables and the relationships between them.
Based on the synthesis and comparison of existing models for customer satisfaction (
Table 1), the research hypotheses in this study are as follows [
29]:
H1: There is a significant impact of security on customer Satisfaction.
H2: There is a significant impact of information availability on customer satisfaction.
H3: There is a significant impact of shipping on customer satisfaction.
H4: There is a significant impact of quality on customer satisfaction.
H5: There is a significant impact of price on customer satisfaction.
H6: There is a significant impact of time on customer satisfaction.
H7: Demographic characteristics have a statistically significant impact on customer satisfaction.
Note: The demographic characteristics include gender, age, educational level, and residence.
Step 2. Determination of indicators for latent variables.
Indicators of latent variables are available in the survey questionnaire—7 constructs with 26 indicator variables [
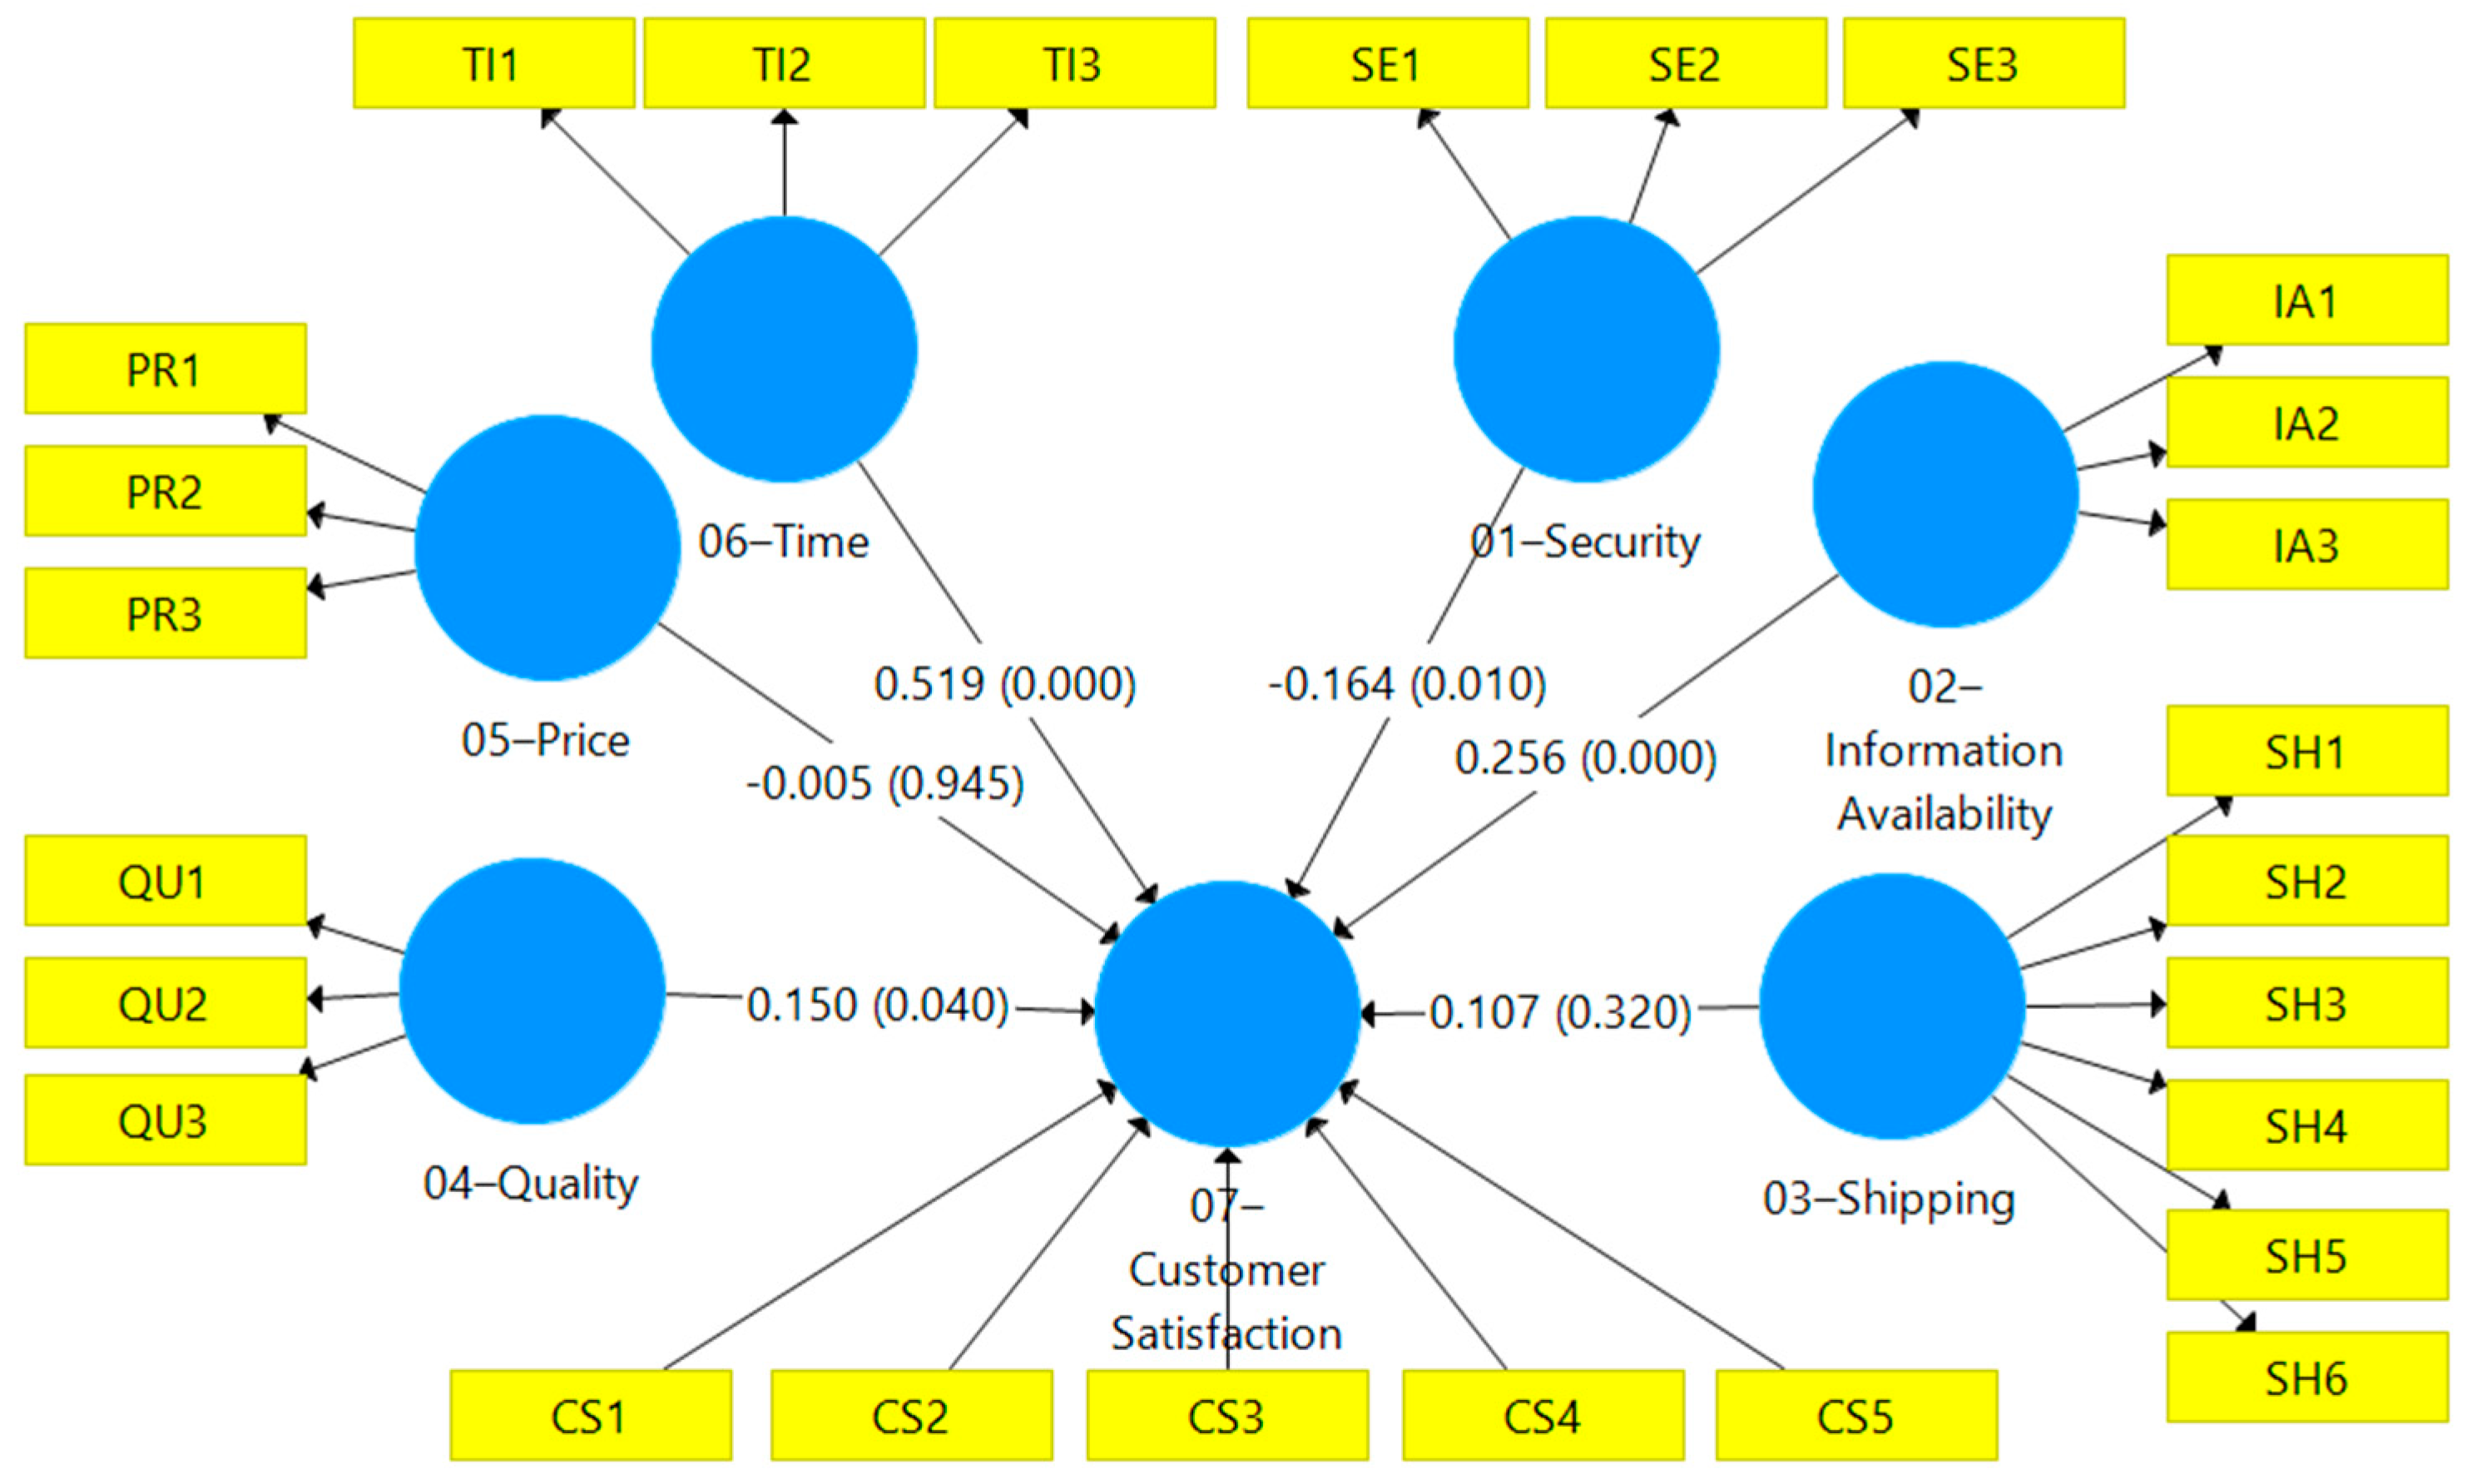
51]. The measurement model consists of 21 input indicator variables: SE1, SE2, SE3 from the latent variable security (SE); IA1, IA2, IA3—from information availability (IA); SH1, SH2, SH3, SH4, SH5, SH6—from latent variable shipping (SH); QU1, QU2, QU3—from latent variable quality (QU); PR1, PR2, PR3—from latent variable price (PR); TI1, TI2, TI3—from latent variable time (TI) and 5 output indicator variables CS1, CS2, CS3, CS4, CS5—from output variable customer satisfaction (CS), represented in
Figure 5.
Step 3. Numerical modeling and assessment of model quality.
The PLS algorithm was employed, and model parameters were calculated.
Step 4. Examining model fit. If the model fits the data, then go to Step 5, else go to Step 3
The assessment of path coefficients shows that the model does not fit well, since
p-values of shipping and price, 0.311 and 0.947, respectively, lie out of their acceptable limits (
Figure 5). Therefore, the process goes back to Step 3, where the model settings are changed by removing the two constructs (shipping and price).
As p-values of path coefficients (Step 4) of the new model are correct, the examination continues with establishing the construct reliability and validity.
Validity and Reliability
The first part of the validity check is to assess the measurement and structural models. The measurement model establishes the validity and reliability of the construct. Its assessment consists of the evaluation of construct reliability, indicator reliability, convergent validity, and discriminant validity of the obtained components (endogenous and exogenous constructs). The structural model measures the significance of hypothesized relationships.
Factor Loadings
Factor loadings show “the extent to which each of the items in the correlation matrix correlates with the given principal component. Factor loadings can range from −1.0 to +1.0, with higher absolute value indicating a higher correlation of the item with the underlying factor” [
56]. All items in the study had factors higher than the recommended value of 0.5 [
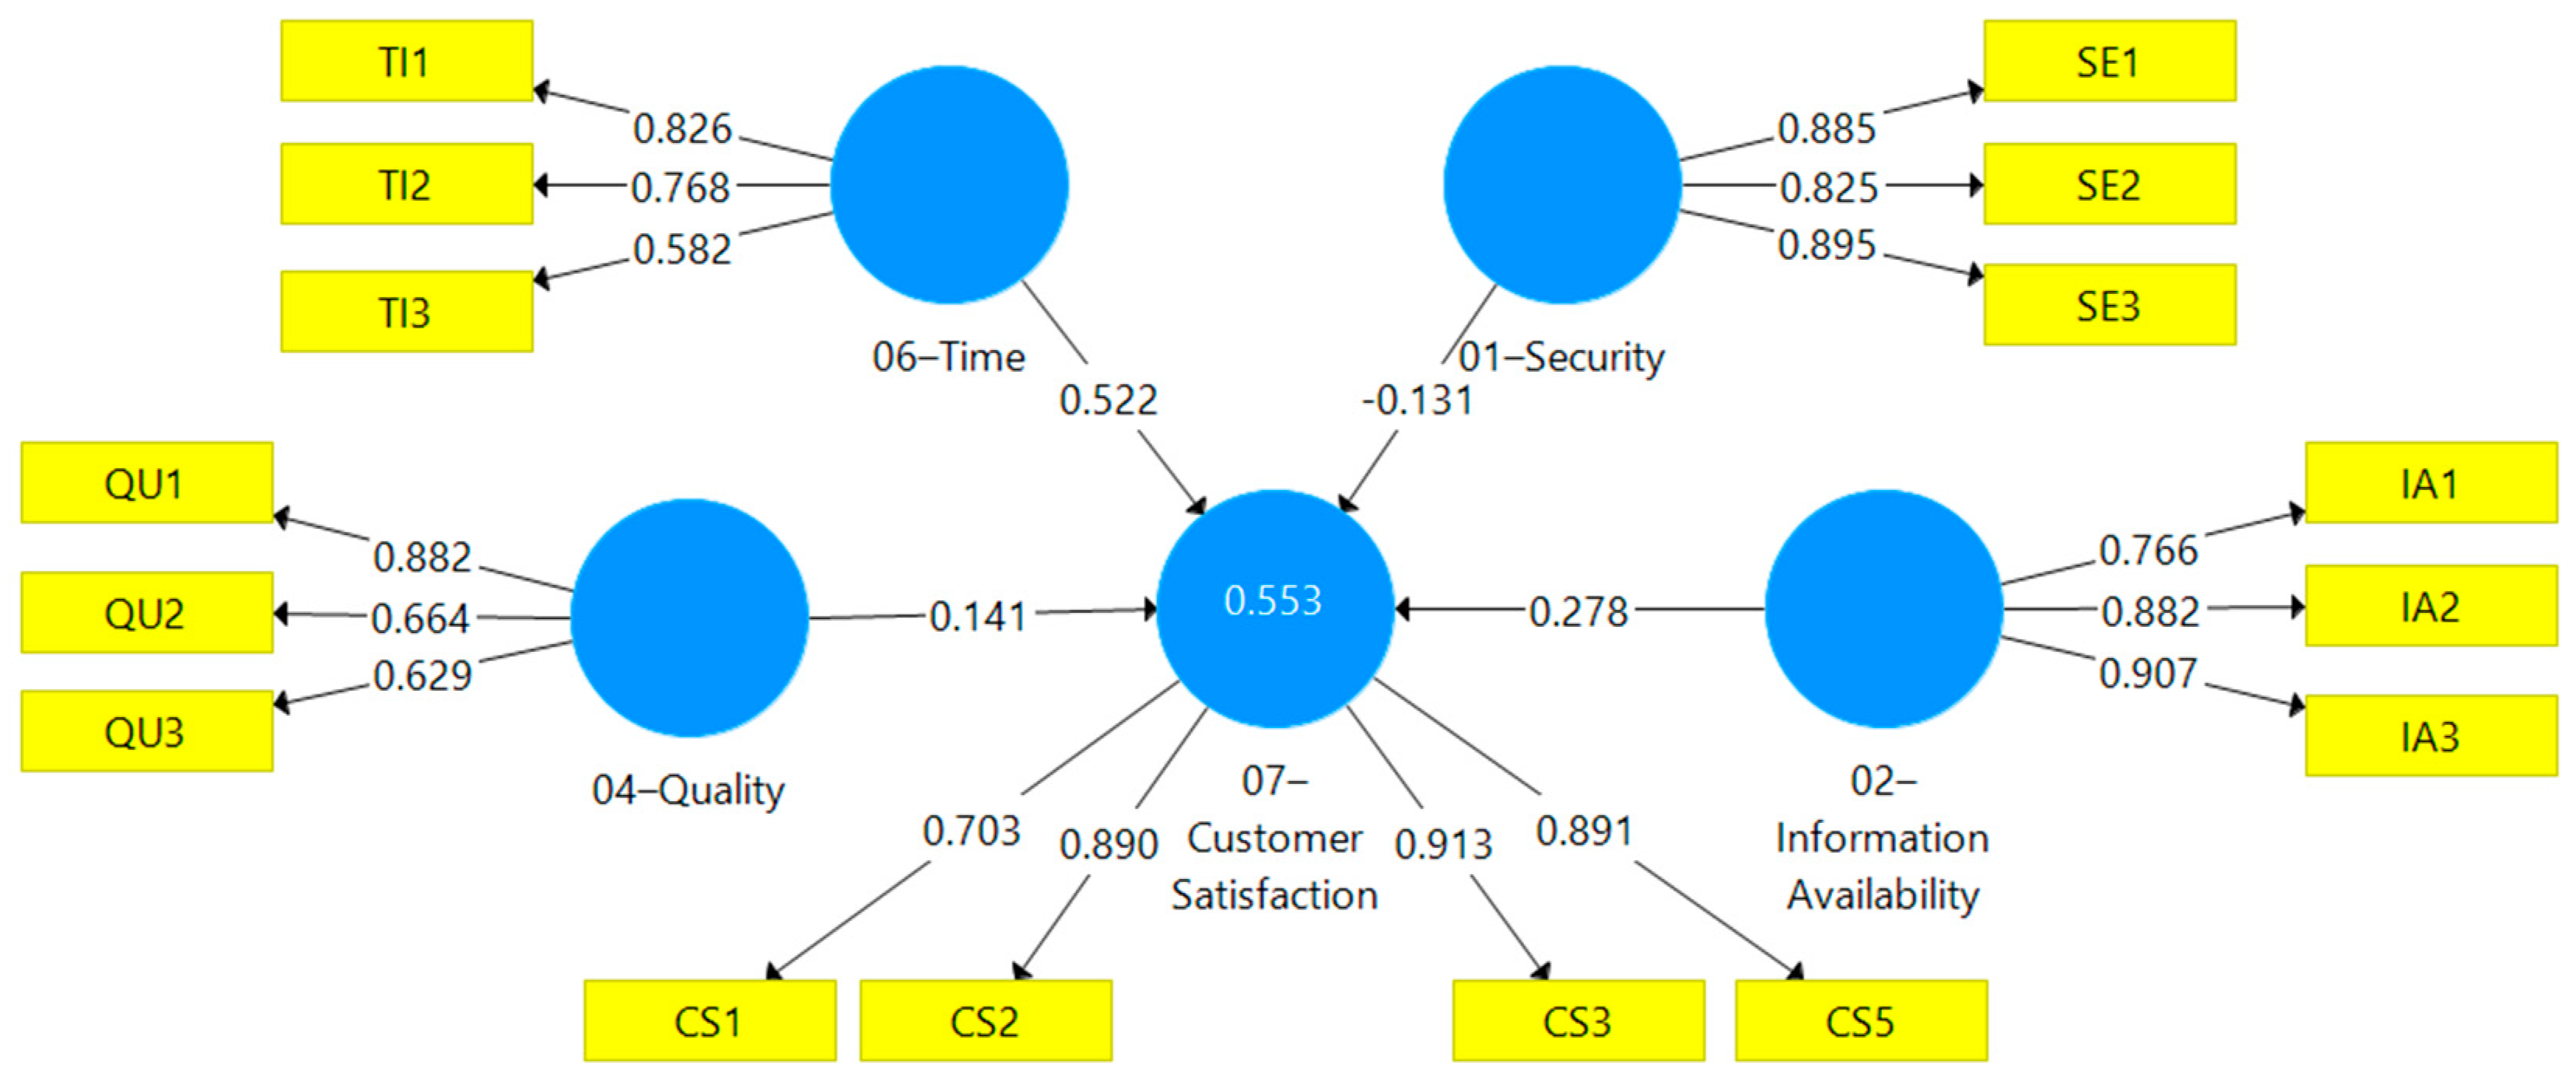
57]. Factor loadings are depicted on
Figure 6 and
Table 4.
Indicator Multicollinearity
The variance inflation factor (VIF) statistic is utilized to access multicollinearity in the indicators [
58]. Multicollinearity is acceptable if the value for VIF is below 5.
Table 3 presents the VIF values for the indicators and reveals that the VIF for each indicator is below the recommended threshold.
Reliability Analysis
The two most used methods for establishing construct reliability (repeatability) include Dillon–Goldstein’s rho (DG rho, rho_A in SmartPLS) and composite reliability (CR). The criterion is that the DG rho and CR values should exceed 0.7 to indicate adequate reliability of the construct [
57]. The measurement model results (
Table 4) have shown that the DG rho and CR values were greater than 0.7, thus, confirming adequate construct reliability. The DG rho ranged from 0.560 to 0.912 whereas CR ranged from 0.773 to 0.914. Both indicators of reliability have reliability statistics over the required threshold, except the time construct, whose value is slightly lower than the threshold. Hence, the construct reliability is established. As a result, the DG rho and CR values for all factors in this study are acceptable.
Construct Validity
The construct validity is established when there is convergent validity and discriminant validity.
Convergent Validity
Convergent validity is the degree of agreement between multiple attempts to measure the same concept. The convergent validity of the construct was determined using average variance extracted (AVE), which should exceed 0.5 [
58]. Since the result revealed that all constructs had substantial AVE, the convergent validity of constructs for this study was verified. The values of DG rho, CR, and AVE are depicted in
Table 5.
Discriminant Validity
Discriminant validity is the degree of distinction between measures of different concepts.
Fornell and Larker Criterion
According to the Fornell and Larker criterion [
59], discriminant validity is established when the square root of AVE for a construct is greater than its correlation with all other constructs. The obtained results show that square root of AVE (in italics) for each construct are greater than its correlation with other constructs (
Table 6), hence, providing strong support for establishment of discriminant validity.
Cross Loadings
Cross loadings are used to test whether an item belonging to a particular construct loads strongly onto its own parent construct or onto other constructs in the model.
Table 7 indicates that factor loadings of all items are greater (in italics) on the underlying construct to which they belong rather than on other constructs. Hence, based on the evaluation of cross loadings, discriminant validity is attained.
Heterotrait-Monotrait Ratio (HTMT)
HTMT is based on the estimation of the correlation between the constructs. Discriminant validity is established based on the HTMT ratio. The threshold for HTMT varies in the existing literature between 0.85 and 0.9. The HTMT results (
Table 8) show that the HTMT ration for the constructs (except Time) is less than the required threshold of 0.9. The value of the time construct lies almost on the threshold and could be considered statistically significant.
Path Coefficients and evaluation of the structural model—hypotheses testing
The
p-value of each pair of constructs is lower than 5% (for security and quality) or 1% (information availability and time), which suggests a strong effect on customer satisfaction (
Figure 7 and
Table 9). These results are consistent with our hypotheses and previous studies. All regression coefficients are positive, except that for security. The R
2 is 0.553, which means that approximately 55% of variance of customer satisfaction with e-commerce websites can be explained by the predictor variables security, information availability, quality and time. The remaining part is explained by various other factors.
At the structural model level, the SE → CS and QU → CS pathways have a weak effect, while the relationships IA → CS and TI → CS have a moderate influence. According to the Q Square value, the model has a good prediction (Q Square is more than zero).
Step 5. Interpretation of obtained results.
The result of H1 testing, which is the effect of security, shows that cyber security measures can increase user satisfaction ( = −0.131, < 0.05). During the pandemic, many Internet users are spending more hours online for work and social interaction, which means that they are more vulnerable to cyber threats. Despite the large number of cyber threats (financial frauds, phishing, DoS attacks, etc.) in e-commerce, the security has the lowest (negative) impact on customer satisfaction. Multi-factor payment authorization and a relatively small share of credit card holders minimize the safety risks of online shopping.
The effect of information availability (H2) shows that the available information can increase customer satisfaction ( = 0.278, < 0.001). The customer online buying process is a complex information extensive process of multi-attribute decision-making. A consumer needs to understand all the options in the online market before making an informed decision. By understanding buyer’s needs and preferences during the pandemic, businesses can set up the most adequate way to present their products and services, especially food, personal care and health products, entertainment products, and communication technology goods.
Hypothesis three (H
3) results concerning the effect of shipping on user satisfaction shows that shipping has no impact on user satisfaction (
Figure 5,
= 0.107,
= 0.320). Often extra fees (taxes and shipping costs) make online transactions disappointing from the customer perspective. Additionally, the coronavirus pandemic exacerbated disruptions along the supply chains. To overcome these disadvantages of online purchases, many e-buyers prefer free shipping deals. Additionally, the pandemic has created a spike in last-mile delivery. This result is in accordance with the survey’s outcome that 40% of survey participants prefer free or reduced shipping rates. Therefore, there is no surprise that shipping is an unimportant factor for e-customer satisfaction during the pandemic.
According to the H4 testing, the quality has a positive effect on customer satisfaction with = 0.141, < 0.001. These values point out that during the pandemic, consumers were not inclined to compromise on the quality of the purchased goods and services.
The test of hypothesis H
5 concerning the effect of price leads to the conclusion that the price does not have a statistically significant impact on customer satisfaction (
Figure 5,
= −0.005,
= 0.945). For online customers, the price does not matter in case of urgent product need. From the other side, online sellers employ different techniques (one-time promotions, flexible payment terms, or credit for future purchases) to meet their near-term needs while providing flexibility for the buyers.
Regarding the test of hypothesis H6 concerning the impact of the time construct on customer satisfaction, the estimates are as follows: = 0.522, < 0.05. The effective time management is very important, especially when working remotely, and not surprisingly, the saved time is an important factor for online consumers.
The obtained results show a positive effect of the model constructs on customer buying process: Information availability and quality are associated with the information gathering and evaluation of alternatives stages, while security and time saved are linked with selecting an option and implementing the decision.
Additionally, the obtained results exhibit that in both cases—before and during a pandemic—the essential factors for customer satisfaction are information availability [
29,
31,
33,
35] and time saved [
17,
29]. The influence of factors quality [
21,
29,
33,
35] and security [
20,
24,
29,
32,
35] also remains significant. While in the pre-pandemic period, price [
19,
20,
29,
32,
33] and shipping [
19,
20,
21,
29,
35] are determinants for inclusion in online transactions, in the pandemics—their influence is reducing.
The limitations of our study are as follows: (1) the subject of our study refers only to a part of the online e-commerce—e-retail industry; (2) the size of the sample is relatively small, and (3) the numbers of male and female participants are not equal. In addition, some factors (for example psychological characteristics and monetary costs) are missing from the model. Furthermore, our research was conducted only on the Bulgarian market; therefore, its findings may be not generalized for other countries. The data are collected from a third party (research university) instead from reports of e-commerce organizations.
Future research can expand the gained results including other markets and particular sectors of retail industry. As the proposed SEM model does not represent the whole picture, in future studies, more perspectives should be included.
Based on the obtained results, some suggested managerial implications for companies selling their production on electronic market are as follows: (1) harmonize the relationships between stakeholders in the supply chain; (2) create an integrated scheduling system for advance planning; (3) implement adaptive marketing strategies; (4) improve consumer database through regular data inputs; (5) and increase customer satisfaction including a broader set of determinants. The proposed approach for analyzing customer satisfaction should be applied periodically by companies. In this way, trends will be revealed in a timely manner and organizations will be able to react quickly even to circumstances beyond their direct control, such as negative reviews on social media.
