1. Introduction
With increasing economic environment changes, how to build, maintain and expand competitive advantages has become a key issue for enterprises. The business ecosystem is based on heterogeneous enterprises and organizations which interact under mutual benefits [
1]. Ecological advantages have two dimensions: overall strength and adaption to the external environment. Traditional advantages focus more on an independent enterprise’s internal factors, while ecological advantages focus on the interaction between the enterprise and the business ecosystem. How enterprises consolidate and form new ecological advantages in the business ecosystem is explored from the perspective of cross-border businesses in this paper.
In recent years, tariffs have been fluctuating largely and frequently in a wide range of products trading worldwide. In July 2018, the United States imposed tariffs on USD 34 billion of Chinese goods, and China imposed retaliatory tariffs on US goods of a similar value [
2,
3]. In September 2019, China imposed 5 to 10% tariffs on one-third of the 5078 goods it imports from America, and the United States imposed new 15% tariffs on about USD 112 billion of Chinese imports [
4]. Besides the China–United States trade conflict, tariff fluctuations are observed worldwide. Yet, little work can be found on the issues related to the impacts of tariff fluctuations on the business ecosystem or on the necessary framework to deal with such challenges. This inspires our study of analyzing the resilience and sustainability of a cross-border business under tariff fluctuations.
When an exogenous disruption occurs, a firm tries to put its operation under control through internal capabilities. Nevertheless, risk management strategies designed proactively in advance with relevant partners are even more beneficial [
5]. These strategies facilitate the continuous power of the enterprise over the external environment with the exchange of materials, energy and information between the enterprise and the environment. Since the disruption risk of tariff fluctuations is inescapable, this study seeks to solve the following research question: What can cross-border enterprises do to mitigate disruptions caused by a tariff increase? To resolve this problem, the dynamic performance of transfer prices is investigated through system dynamics modeling and simulation. The definition and utilities of transfer price have been widely demonstrated for the purpose of tax optimization [
6,
7,
8,
9]. This study attempts to reveal the utility of transfer price on developing ecological advantages.
This research addresses three main questions: (1) how cross-border enterprises are impacted by tariff changes; (2) how to mitigate disruptions caused by tariff fluctuations; and (3) how different operating structures contribute to developing ecological advantages. This paper makes four primary contributions. First, this study, for the first time, investigates the dynamic performance of cross-border enterprises impacted by tariff fluctuations through system dynamics modeling and simulation. The outcome shows that the relation between the change in tariff rate and sales is linear only if the price elasticity coefficient is equal to 1. Second, this study compares the performance of different distribution structures in response to a changing tariff. The comparative results reveal that enterprises with distributors in foreign markets are more resilient to a disruption stimulated by a tariff fluctuation. Third, this study proposes an effective measure to immediately mitigate the disruptions of tariff fluctuations on sales and profits. It suggests that reducing transfer prices within a range leads to a partial recovery of the decreased profits and sales induced by a tariff increase. Fourth, this study discusses the ideal operating structure under a tariff fluctuation for various purposes. It demonstrates that a commissionaire model is ideal for acquiring the highest profit and a fully fledged distributor model is ideal for establishing a friendly market environment for customer retention.
2. Literature Review
The related research is from two streams: sustainable business ecosystem and the impact of a tariff.
2.1. Sustainable Business Ecosystem
Moore [
10] first proposed the definition of a business ecosystem as an economic community constituted by interacting organizations and individuals. Business ecosystems are based on core capabilities to produce core products. Gossain and Kandiah [
11] saw a business ecosystem similar to an integrated value chain. The concept of a business ecosystem emphasizes relationships between organizations, the evolvement of those relationships and the significance of a brand. Lwein and Regine [
12] defined a business ecosystem as a network of companies each occupying a place in its landscape of possibilities. Companies are coupled to competitors, collaborators and complementors. Changes in the landscape of a company cause changes in the landscapes of other participants of a business ecosystem due to interconnectedness. Power and Jerjian [
13] claimed that one cannot manage a business without managing an entire ecosystem. There are four stakeholders to any enterprise: communities of shareholders, employees, customers and businesses. The key feature of an ecosystem is cooperation. A business ecosystem is built on one single company which is highly connected. Iansiti and Levien [
14] described the business ecosystem as a network constituted by interconnected participants who depend on each other for mutual effectiveness and survival. In this ecosystem, participants share their fate together. There are three critical success factors of a business ecosystem: productivity, robustness and opportunities. Peltoniemi and Vuori [
15] defined a business ecosystem as a dynamic structure consisting of interconnected organizations. It develops through self-organization, emergence and co-evolution to achieve adaptability. Business ecosystems should be self-sustaining.
The sustainable business ecosystem is becoming an important research topic, especially in emerging economies. Sustainability has been studied from several perspectives such as flexibility, robustness, stability, dynamics, adaption and recovery [
16]. Zhao et al. [
17] studied how different network topologies affect the network’s resilience against disruptions. Hasani et al. [
18] presented a multi-objective optimization model to configure a global medical device manufacturing system under disruption. Hileman et al. [
19] investigated sustainability challenges in a larger business ecosystem with the presence of organizations that occupy strategic positions around keystone actors. Limited research has focused on sustainability issues in the cross-border enterprise ecosystem.
2.2. The Impact of Tariff
Tariffs have been getting more attention worldwide in recent years, and the impact of a tariff is studied in various fields. The presence of tariffs influences not only the volume of imports but also the original decision concerning manufacturing locations in Horst’s model [
20]. The effects of tariff changes on overall welfare changes in the presence of foreign capital were studied by Bhagwati and Tironi [
21]. Motta [
22] analyzed the impact of a tariff and concluded that a tariff may induce a shift away from the foreign investment decision or lead to “tariff jumping” investment. Castellanos et al. [
23] presented a techno-economic model with a tariff and transportation algorithm and demonstrated that introducing tariffs between countries significantly increases the minimum sustainable price for solar photovoltaics manufacturing and alters the optimal manufacturing locations. Giang [
24] investigated the dynamic impact of a tariff on the economic growth in the Vietnamese economy between 1999 and 2017 empirically and found that tariffs have positive impacts on the economic growth. Barlow [
25] studied the impact of tariff reduction and suggested that tariff changes have an under-recognized impact on public health expenditure and may contribute to global health spending disparities. Crowley et al. [
26] investigated the impacts of tariff changes on foreign market entry decisions and suggested that by establishing stable tariff rates, trade agreements reduce one source of risk for firms to expand internationally.
Different from the foresaid research, this paper focuses on developing ecological advantages toward the risks caused by tariffs. This study employs system dynamics methodology as simulation models can describe complex problems and can be even more powerful than analytical closed-form analysis [
27]. It presents a framework to evaluate the impact of tariff fluctuations on a cross-border enterprise ecosystem.
3. System Dynamics Modeling of a Cross-Border Enterprise
For cross-border enterprises with a sole manufacturing site, three commonly observed distribution operating structures are studied to evaluate the effect of tariff fluctuations: no distributor, commissionaire and fully fledged distributor [
28,
29] as outlined in
Table 1. (1) No distributor: a cross-border enterprise with a headquarters (HQ), having no foreign distributor, undertakes all business actions and decisions for sales in the foreign jurisdiction. Products are shipped directly from HQ to foreign clients. The charged tariff amount is calculated based on the selling price to end customers. The optimal production volume is where HQ finds the maximization of after-tax profit (“overall profit”). (2) Commissionaire: a commissionaire only does sales and distribution with very limited authority and risk. HQ makes decisions for product distribution and profit allocation. In this case, the charged tariff amount is calculated based on the transfer price. The optimal purchase volume by the distributor is decided by HQ, where HQ finds the maximization of after-tax profit (“overall profit”). (3) Fully fledged distributor: a fully fledged distributor has the decision power and takes on business risks. It is a buy–sell entity that makes purchasing decisions and takes ownership of inventory. The charged tariff amount is calculated based on the transfer price. The optimal purchase volume is hereby decided by the distributor itself, where it finds the maximization of after-tax profit (“distributor profit”). Besides these three structures, a limited-risk distribution structure was demonstrated to be rarely optimal [
29], and thus it is not considered in this study.
System dynamics has been shown to be a well-suited modeling and analysis tool for strategic management [
30,
31,
32]. We model a cross-border enterprise using the notation summarized in
Table 2.
To make the analysis tractable, the following assumptions are made in this research:
Assumption 1. Enterprises and distributors, who are rational decision makers and risk neutral, are pursuing profit maximization. For each unit sold, marginal profit is obtained from marginal revenue (MR) minus marginal cost (MC). At the output level where marginal revenue equals marginal cost, the profit is maximized [34]. If marginal revenue is still greater than marginal cost, enterprises are inclined to produce a greater quantity, and vice versa. Assumption 2. The market demandis affected by pricewith an elasticity[35,36]. The elasticity of demand is assumed as The demand function is assumed non-linear as
where
is a coefficient and
. As most branded natural honey is manufactured in a sole site and sold cross-border, we take the honey industry as an example that matches our model assumptions. On the basis of the year 2010′s honey production data [
37], we derive approximately
and
.
3.1. Causal Loop Diagrams
On the basis of an operation process of a cross-border business, causal loop diagrams are constructed depicting three distribution structures: no distributor, commissionaire and fully fledged distributor.
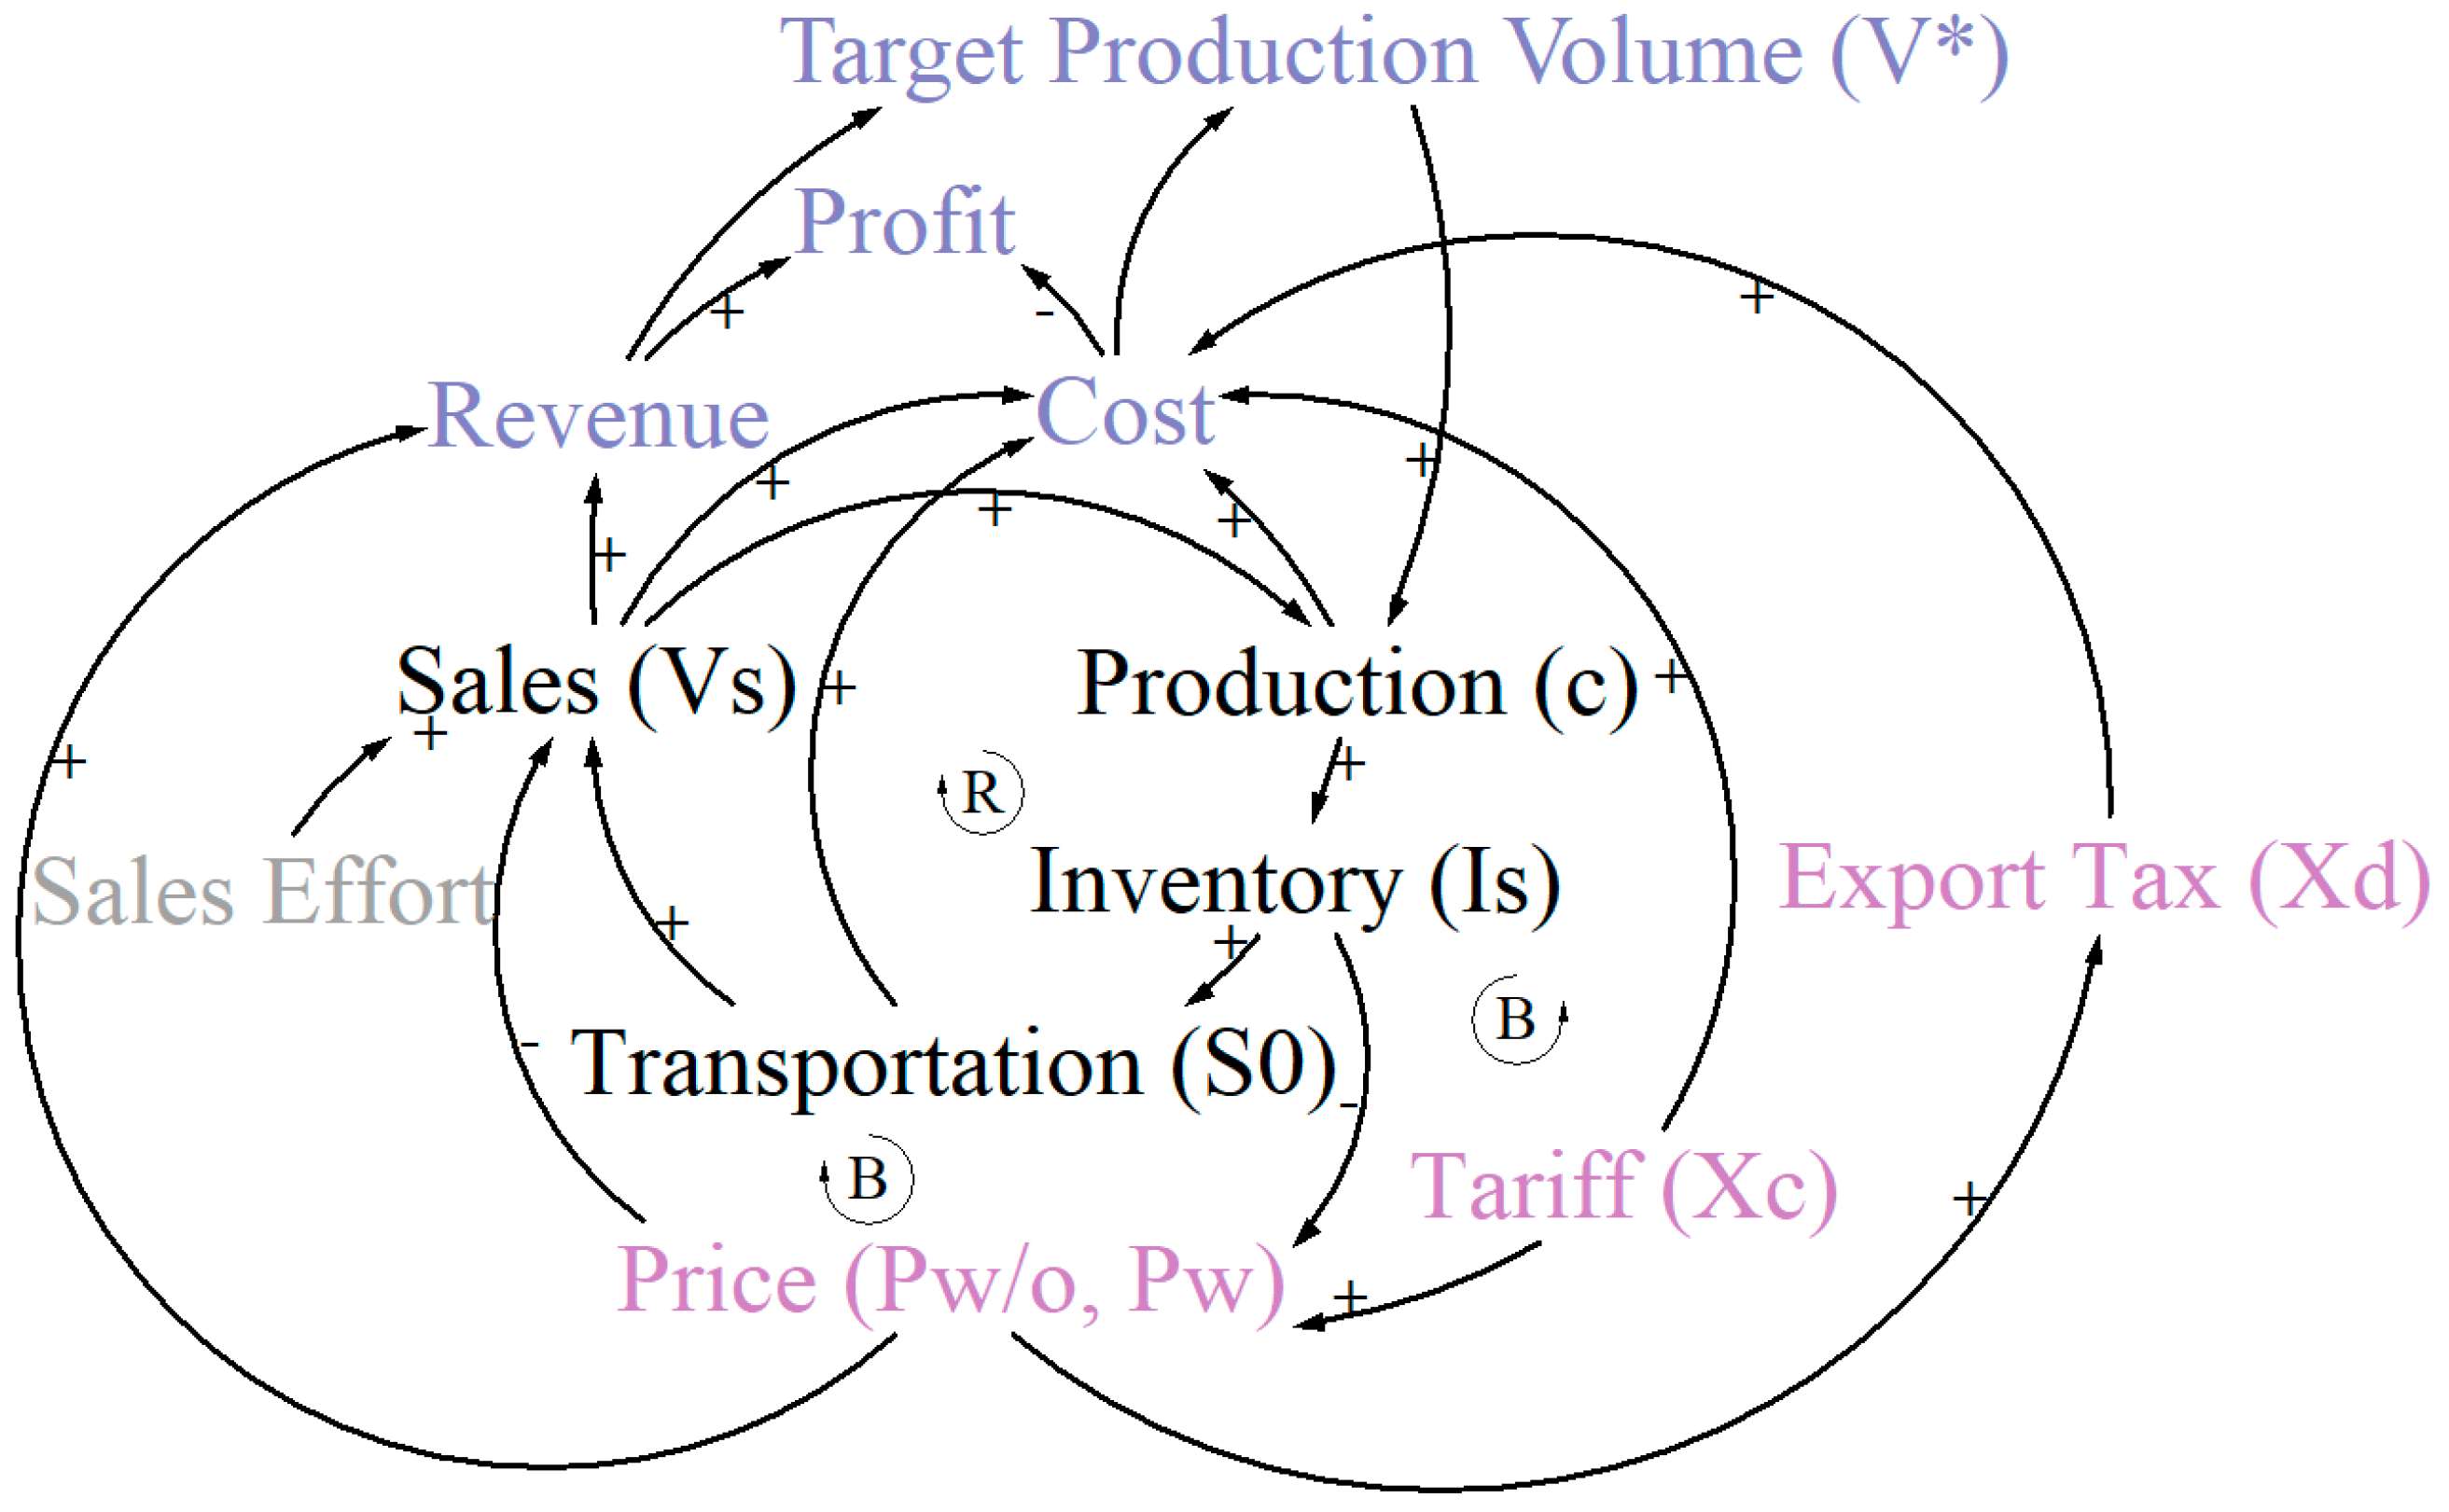
3.1.1. No Distributor Model
In
Figure 1, we present a model with no distributor in its causal loop diagram. For a cross-border enterprise that has no distributor, it has a headquarters (HQ) in its home jurisdiction and sells directly into a foreign jurisdiction. The enterprise pays for export tax and customers pay for tariff tax. Given assumption 1, HQ determines the target production volume, which maximizes its profit. The flow of products goes through the stages of
Production,
Inventory,
Transportation and
Sales. The
Tariff rate and
Export Tax influence both the
Cost and
Price. The activities of
Production,
Transportation and
Sales generate
Cost. The
Production rate is determined by the
Target Production Volume. To achieve maximum profit, HQ employs the optimal sales volume as the
Target Production Volume and aims to sell out all manufactured products. Thus, the
Target Production Volume is determined when marginal
Revenue equals marginal
Cost. The
Sales rate is determined by
Sales Effort,
Price and
Transportation. We assume a market-clearing mechanism [
29], which indicates the inventory equals the demand. Given this assumption,
Price is determined by
Inventory.
Total Cost is a sum of production cost, operation cost, transportation cost, sales cost and taxes. As a minor change in product volume would not have an evident impact on operation cost and sales cost, operation cost and sales cost are considered to be fixed and weakly bonded to units of products. HQ manufactures products at a cost per unit product and delivers products at a unit cost of per order. For simplicity, we assume one order contains only one unit of product, and thus the number of orders equals the number of ordered products. HQ pays export tax at a rate of with a selling price , and customers pay tariff tax at a rate of with a purchasing price . When marginal revenue equals marginal cost, HQ achieves the highest profit.
Proposition 1. In a no-distributor model, the optimal sales price and sales volume for HQ are given as: The optimal sales volume per month () is employed by HQ as the target production volume per month to monitor production. The production rate is determined by target production volume and production capacity.
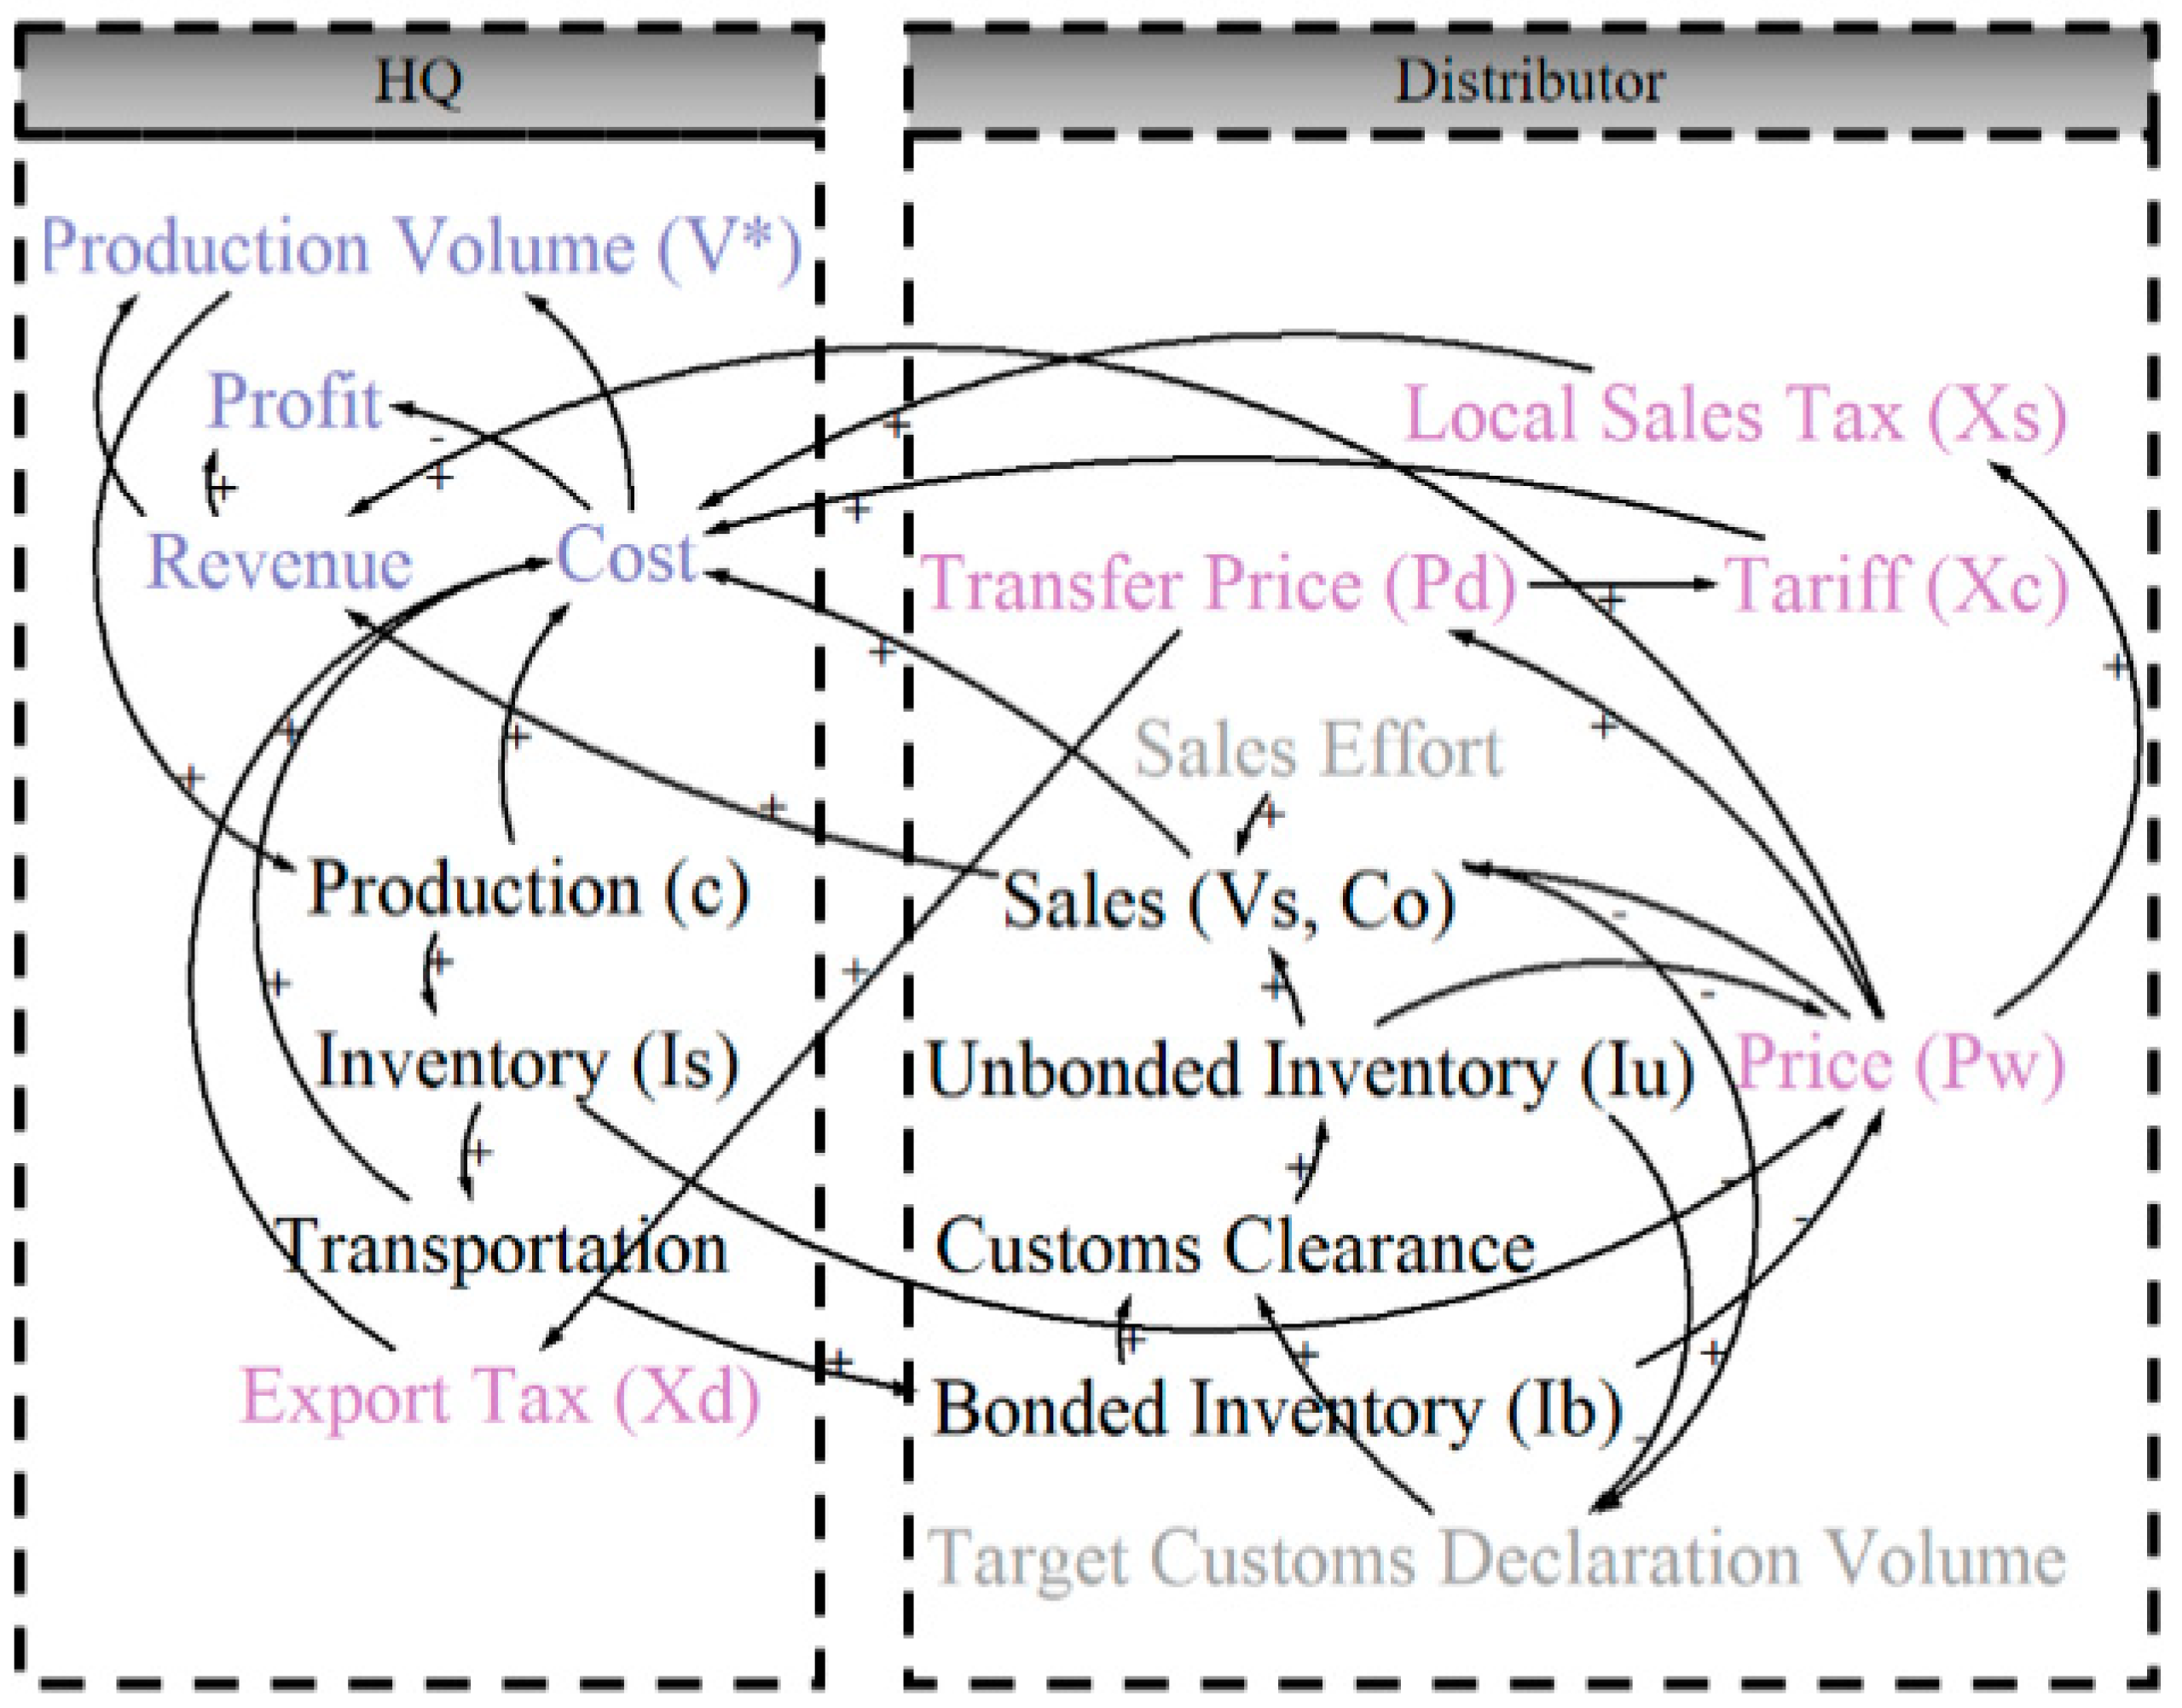
3.1.2. Commissionaire Model
Figure 2 presents a causal loop diagram of a “commissionaire” model, in which the cross-border enterprise has a commissionaire distributor in a foreign jurisdiction. A commissionaire distributor only does sales and distribution, while HQ makes centralized decisions based on profit maximization. In spite of adding overhead costs, the insertion of a distribution division adds overhead costs, but it helps to further penetrate the market with local sales efforts and a shorter delivery timeline to customers. Unlike the “no-distributor” structure, HQ does not do sales. The local distributor is employed to manage inventories and conduct sales activities. A
Transfer Price is charged by HQ to the distributor for each unit of products. In this model,
Price is determined by HQ’s
Inventory (
), distributor’s
Bonded Inventory (
) and
Unbonded Inventory (
).
A distributor is employed as a commissionaire, and HQ determines the target production volume according to the profit maximization concept (i.e., marginal revenue equals marginal cost). Total Cost is a sum of production cost, operation cost, transportation cost, sales cost and taxes. Among these costs, production cost , unit sales cost (for packaging, local delivery, delivery insurance, etc.) and taxes are strongly bonded to units of products. HQ ships products routinely to the distributor warehouse with a lower frequency than that in the “no-distributor” model to control shipping cost. A transfer price is what the distributor pays to HQ for each product. When marginal revenue equals marginal cost, the firm achieves the highest profit.
Proposition 2. In a commissionaire model, the optimal sales price and sales volume for HQ are obtained as: In the structure of a commissionaire model, the distributor pays for tariffs when products get through the customs. Eventually, the tariff cost is transferred to customers when they purchase products from the distributor. The sales effort in the model of a commissionaire is considered higher than that in the “no-distributor” model due to the existence of a local distributor. As the distributor is a commissionaire, transfer price is determined by HQ, and it reflects how much profit HQ transfers to the distributor.
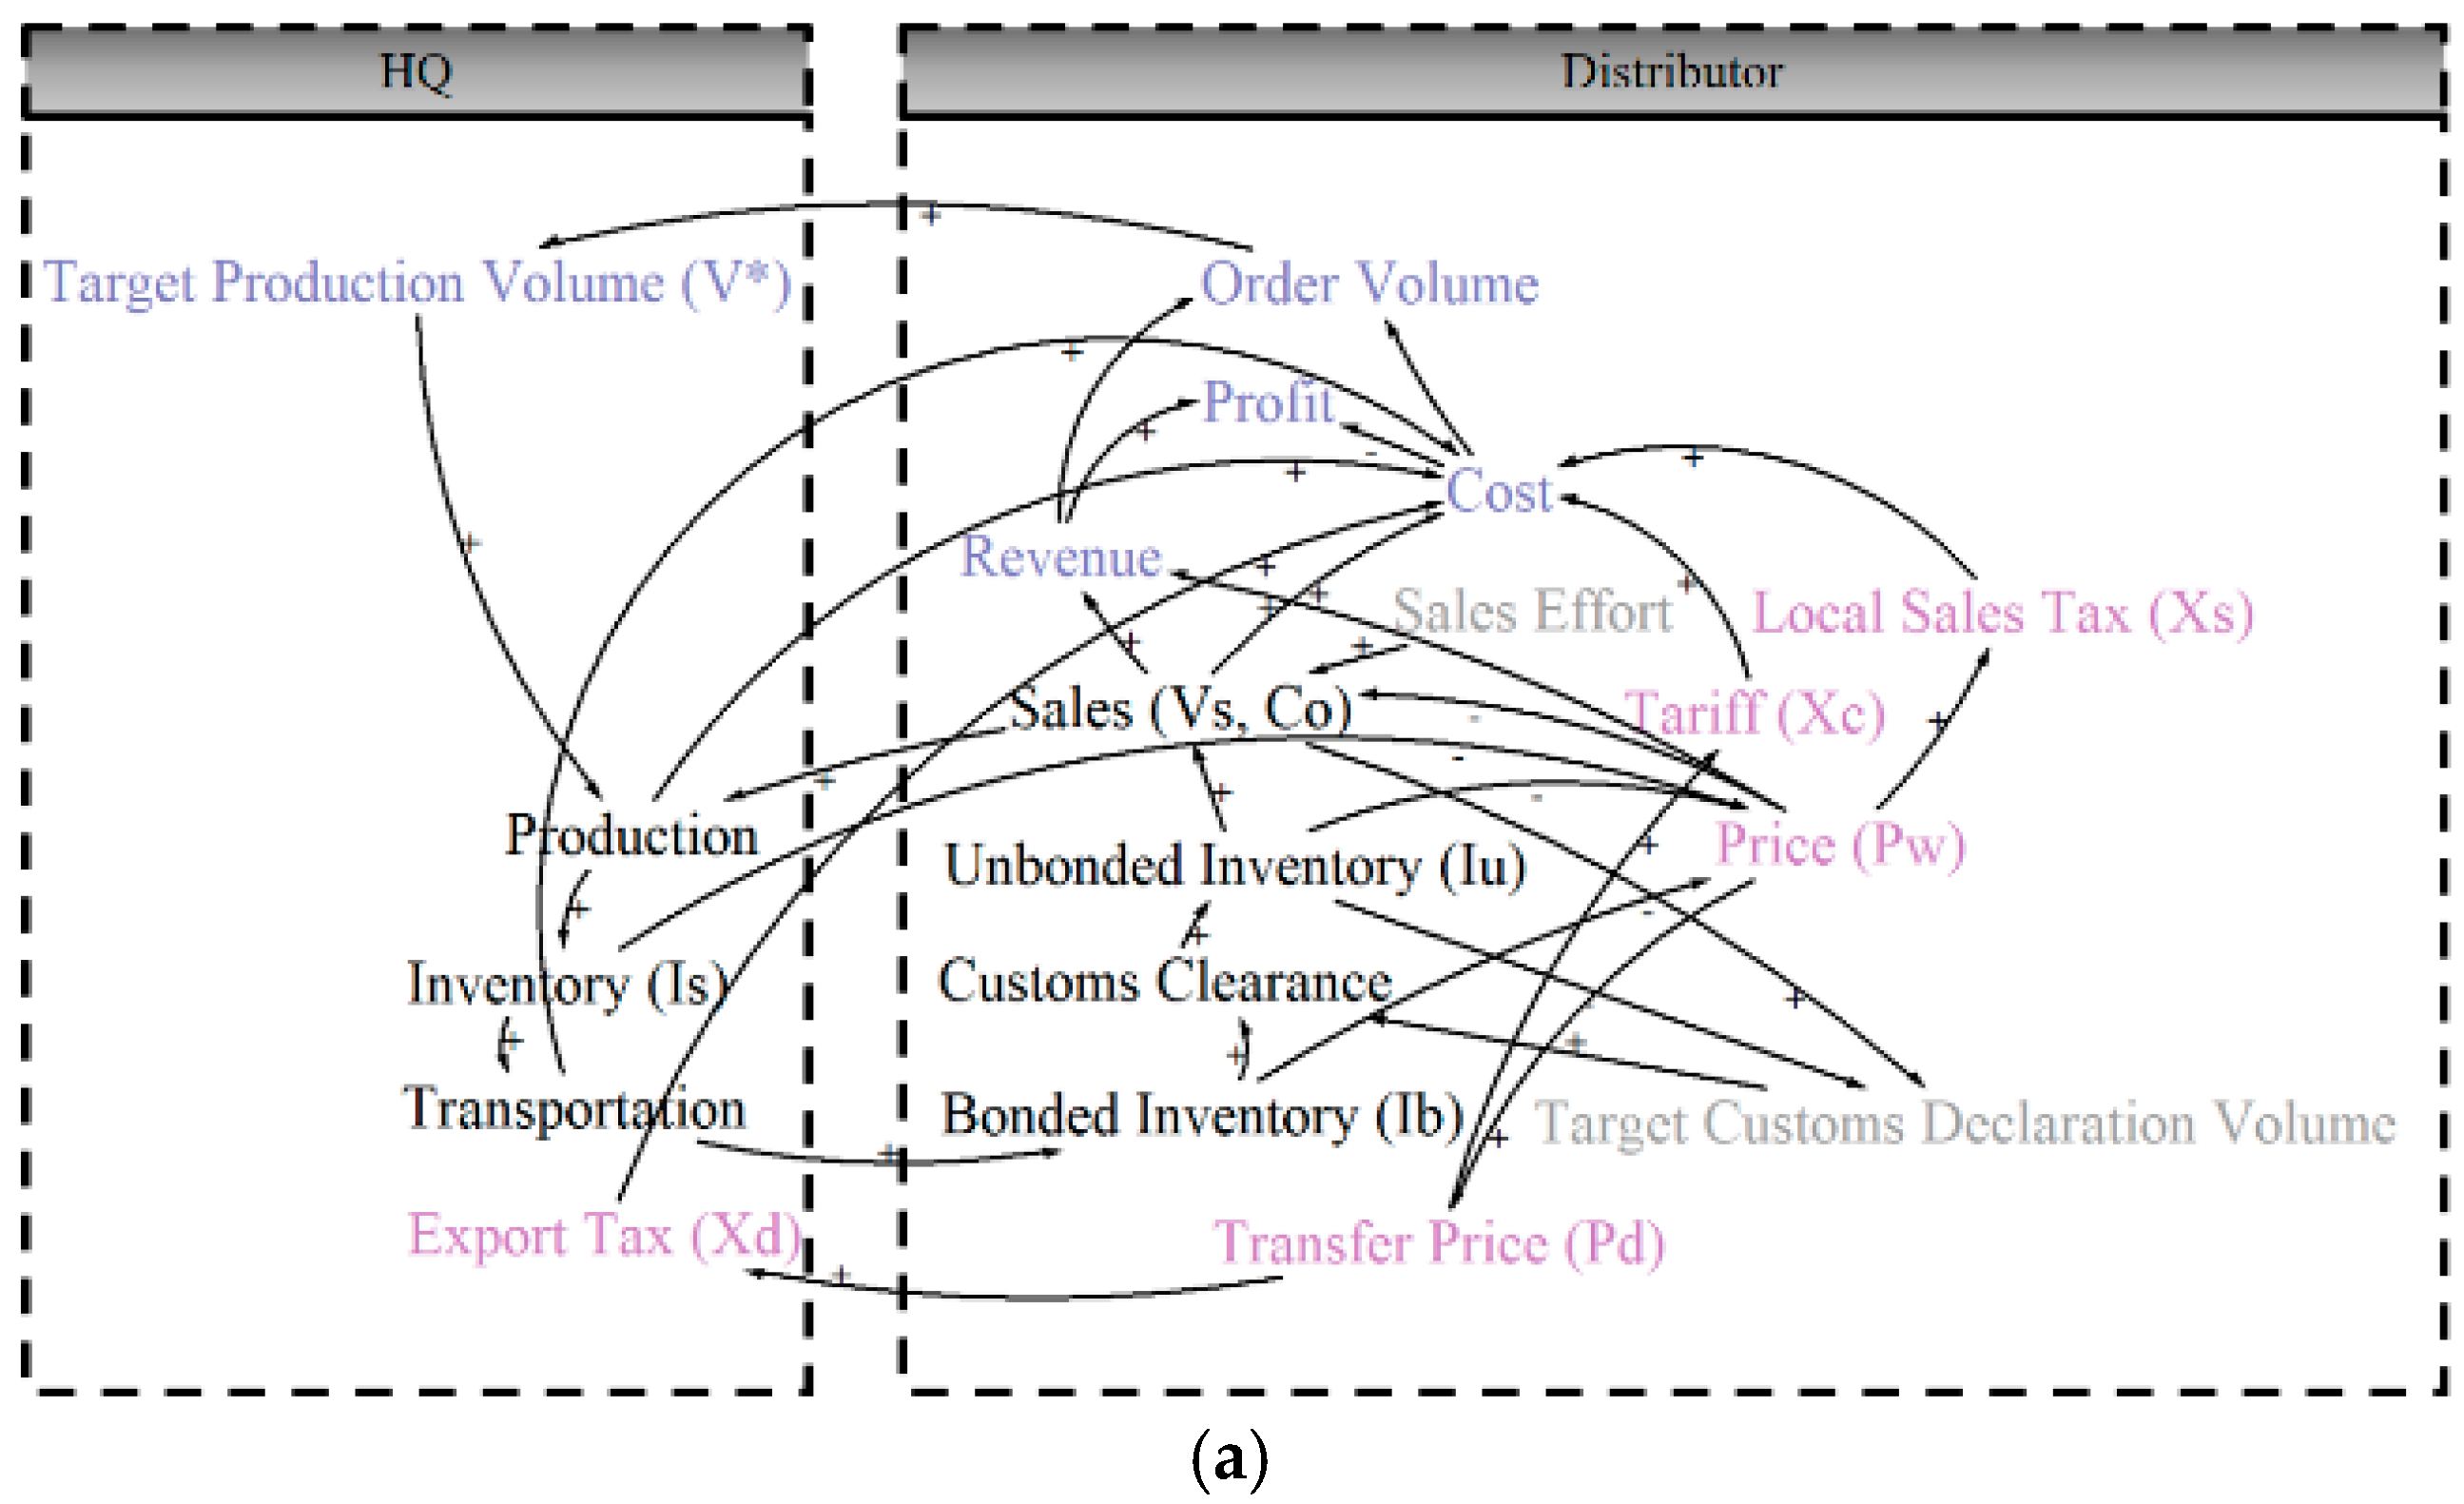
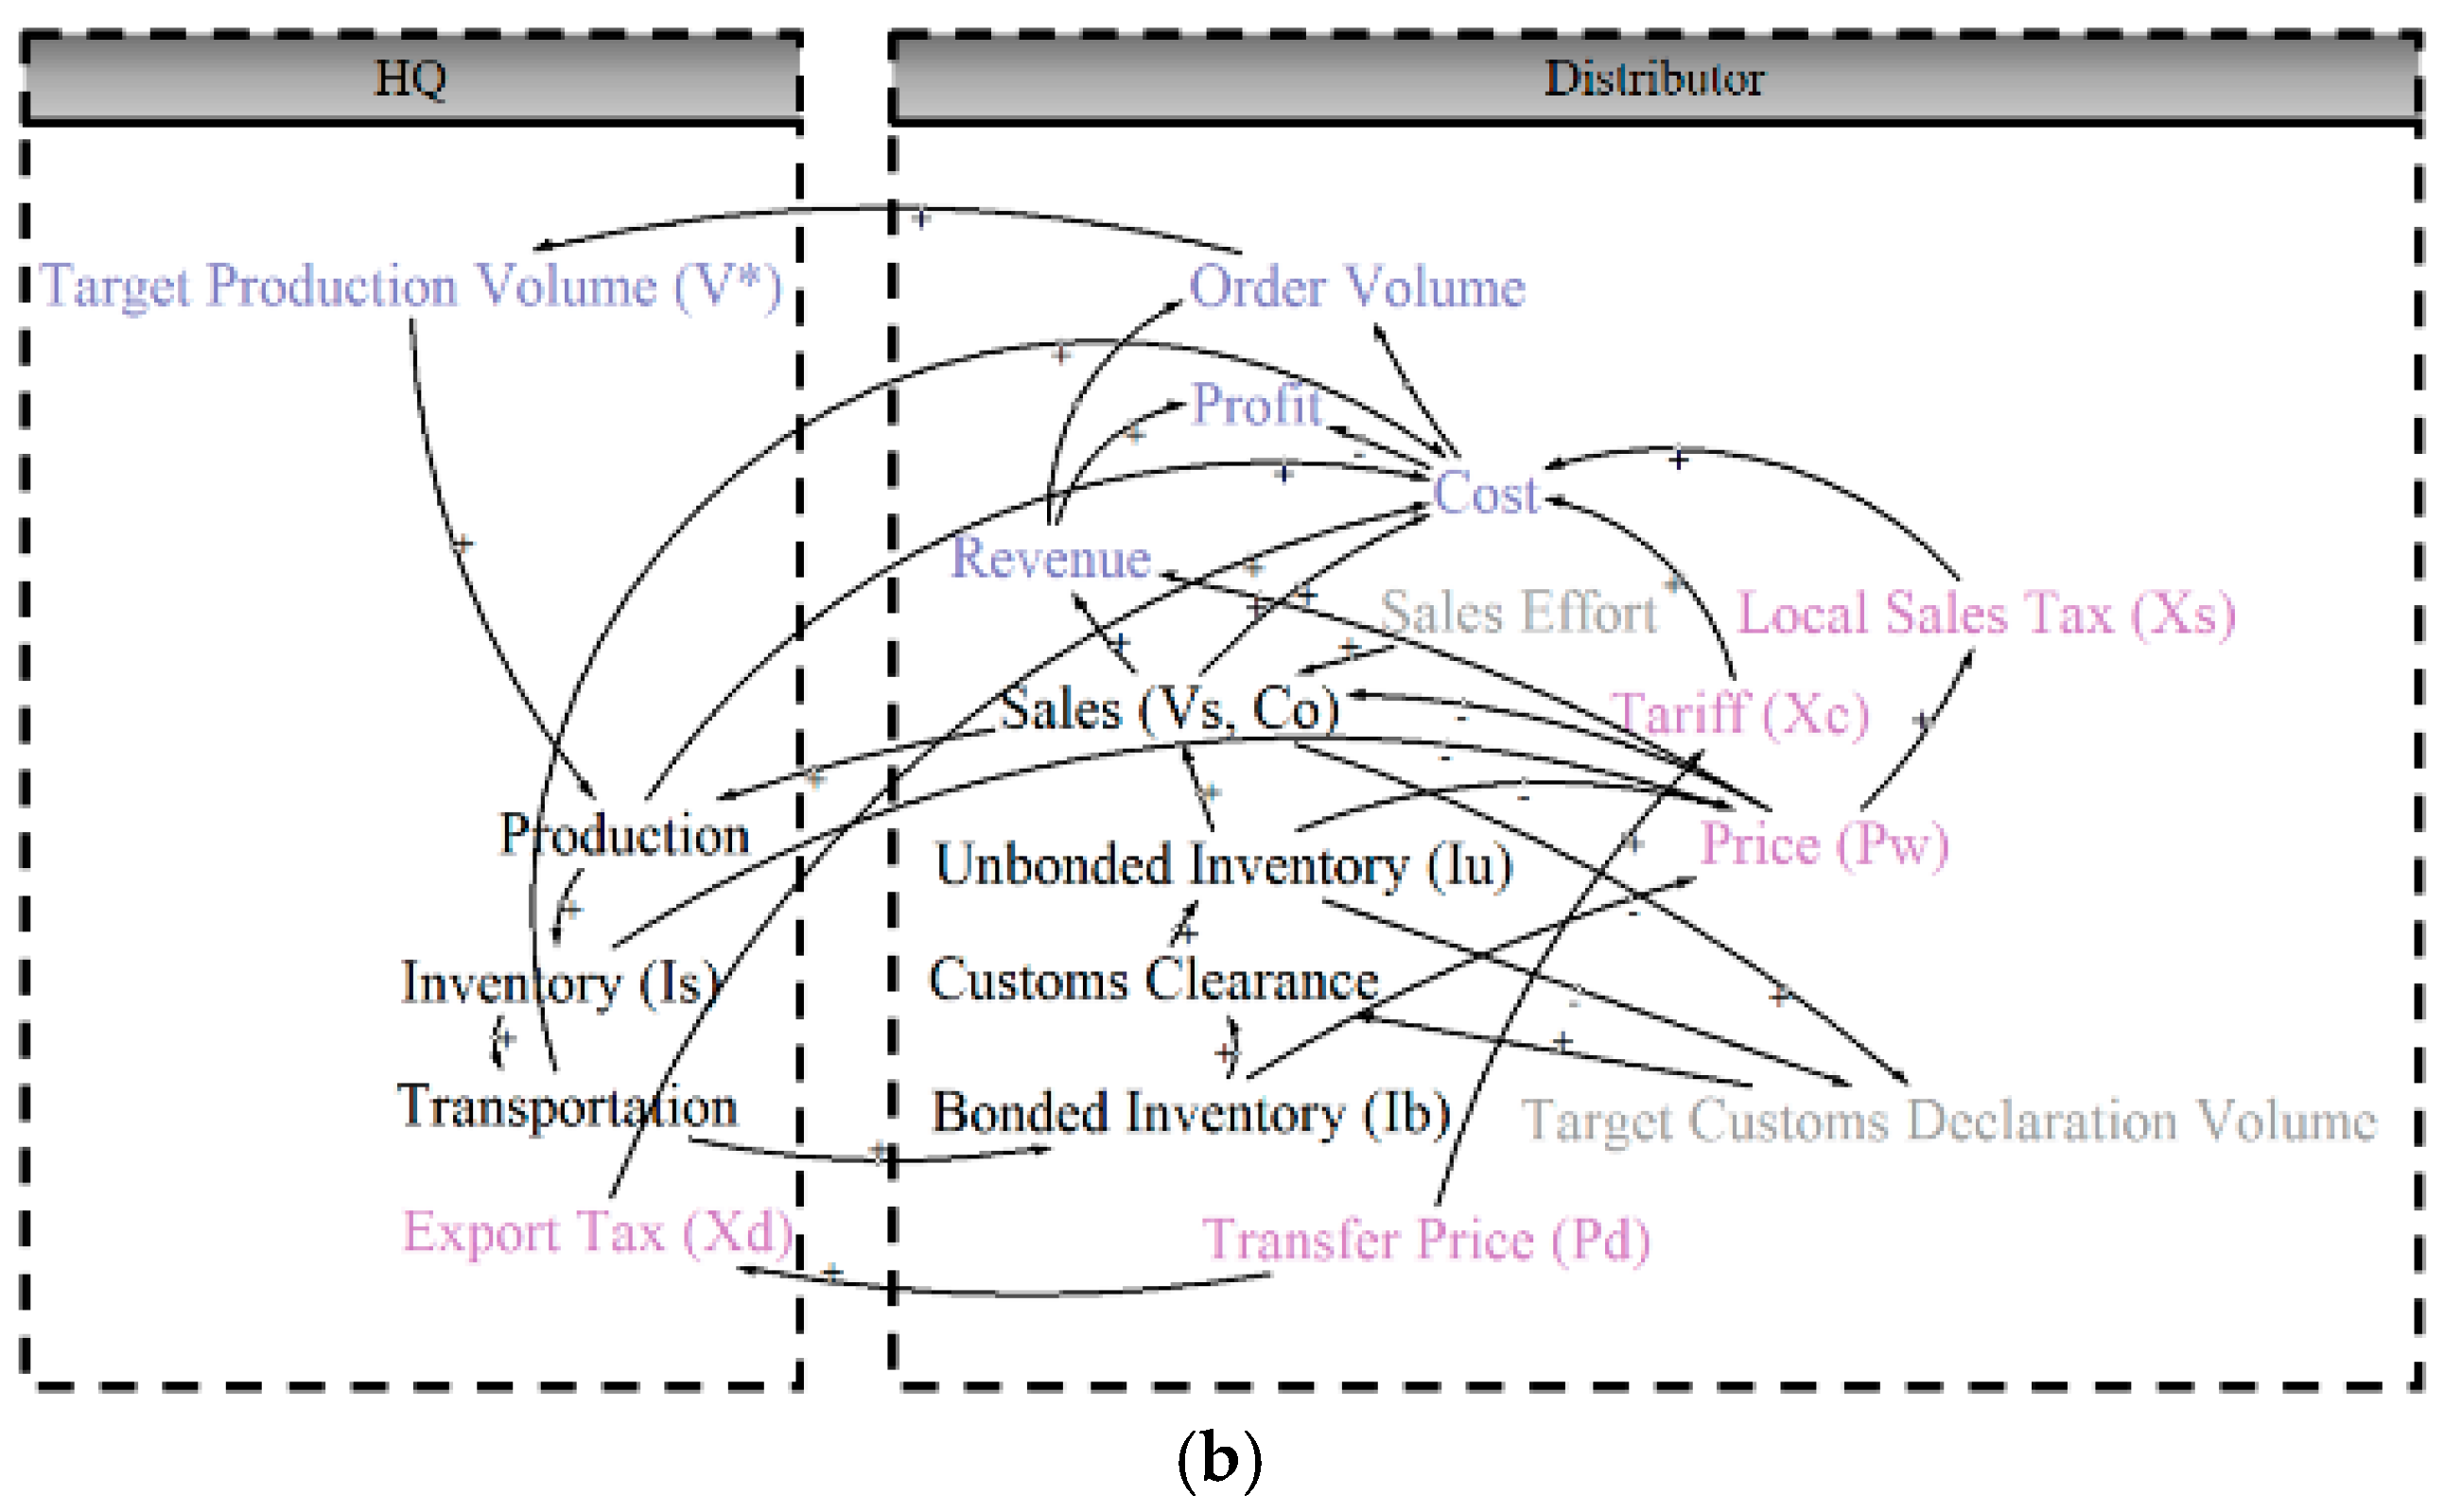
3.1.3. Fully Fledged Distributor Model
Different from a commissionaire, a fully fledged distributor operates independently, makes the purchase decisions and bears business risks. HQ usually establishes a contract with the distributor by offering either a constant transfer coefficient (i.e., a fixed discount) or a fixed transfer price. With a constant transfer coefficient, HQ and the distributor share risks and revenue. With a fixed transfer price, the distributor takes all the risks. The
Order Volume is determined by the distributor’s marginal
Revenue and marginal
Cost. The
Production rate is determined by the distributor’s
Order Volume. The sole difference between
Figure 3a,b is whether there exists a connection between
Price and
Transfer Price. As a fully fledged distributor has a higher motivation to sell products than in previous structures, the sales effort is considered higher than the structure of “no distributor” or “commissionaire”.
In
Figure 3a, transfer price
changes along with the sales price
by a transfer coefficient
as
. In
Figure 3b, transfer price remains constant although the sales price changes. In a fully fledged distributor model (either with a constant transfer coefficient or a fixed transfer price), the order volume and target production volume are determined by distributor revenue and cost.
Proposition 3. In a fully fledged model, the optimal sales price and order volume for the distributor are given as: 3.2. Simulation Models
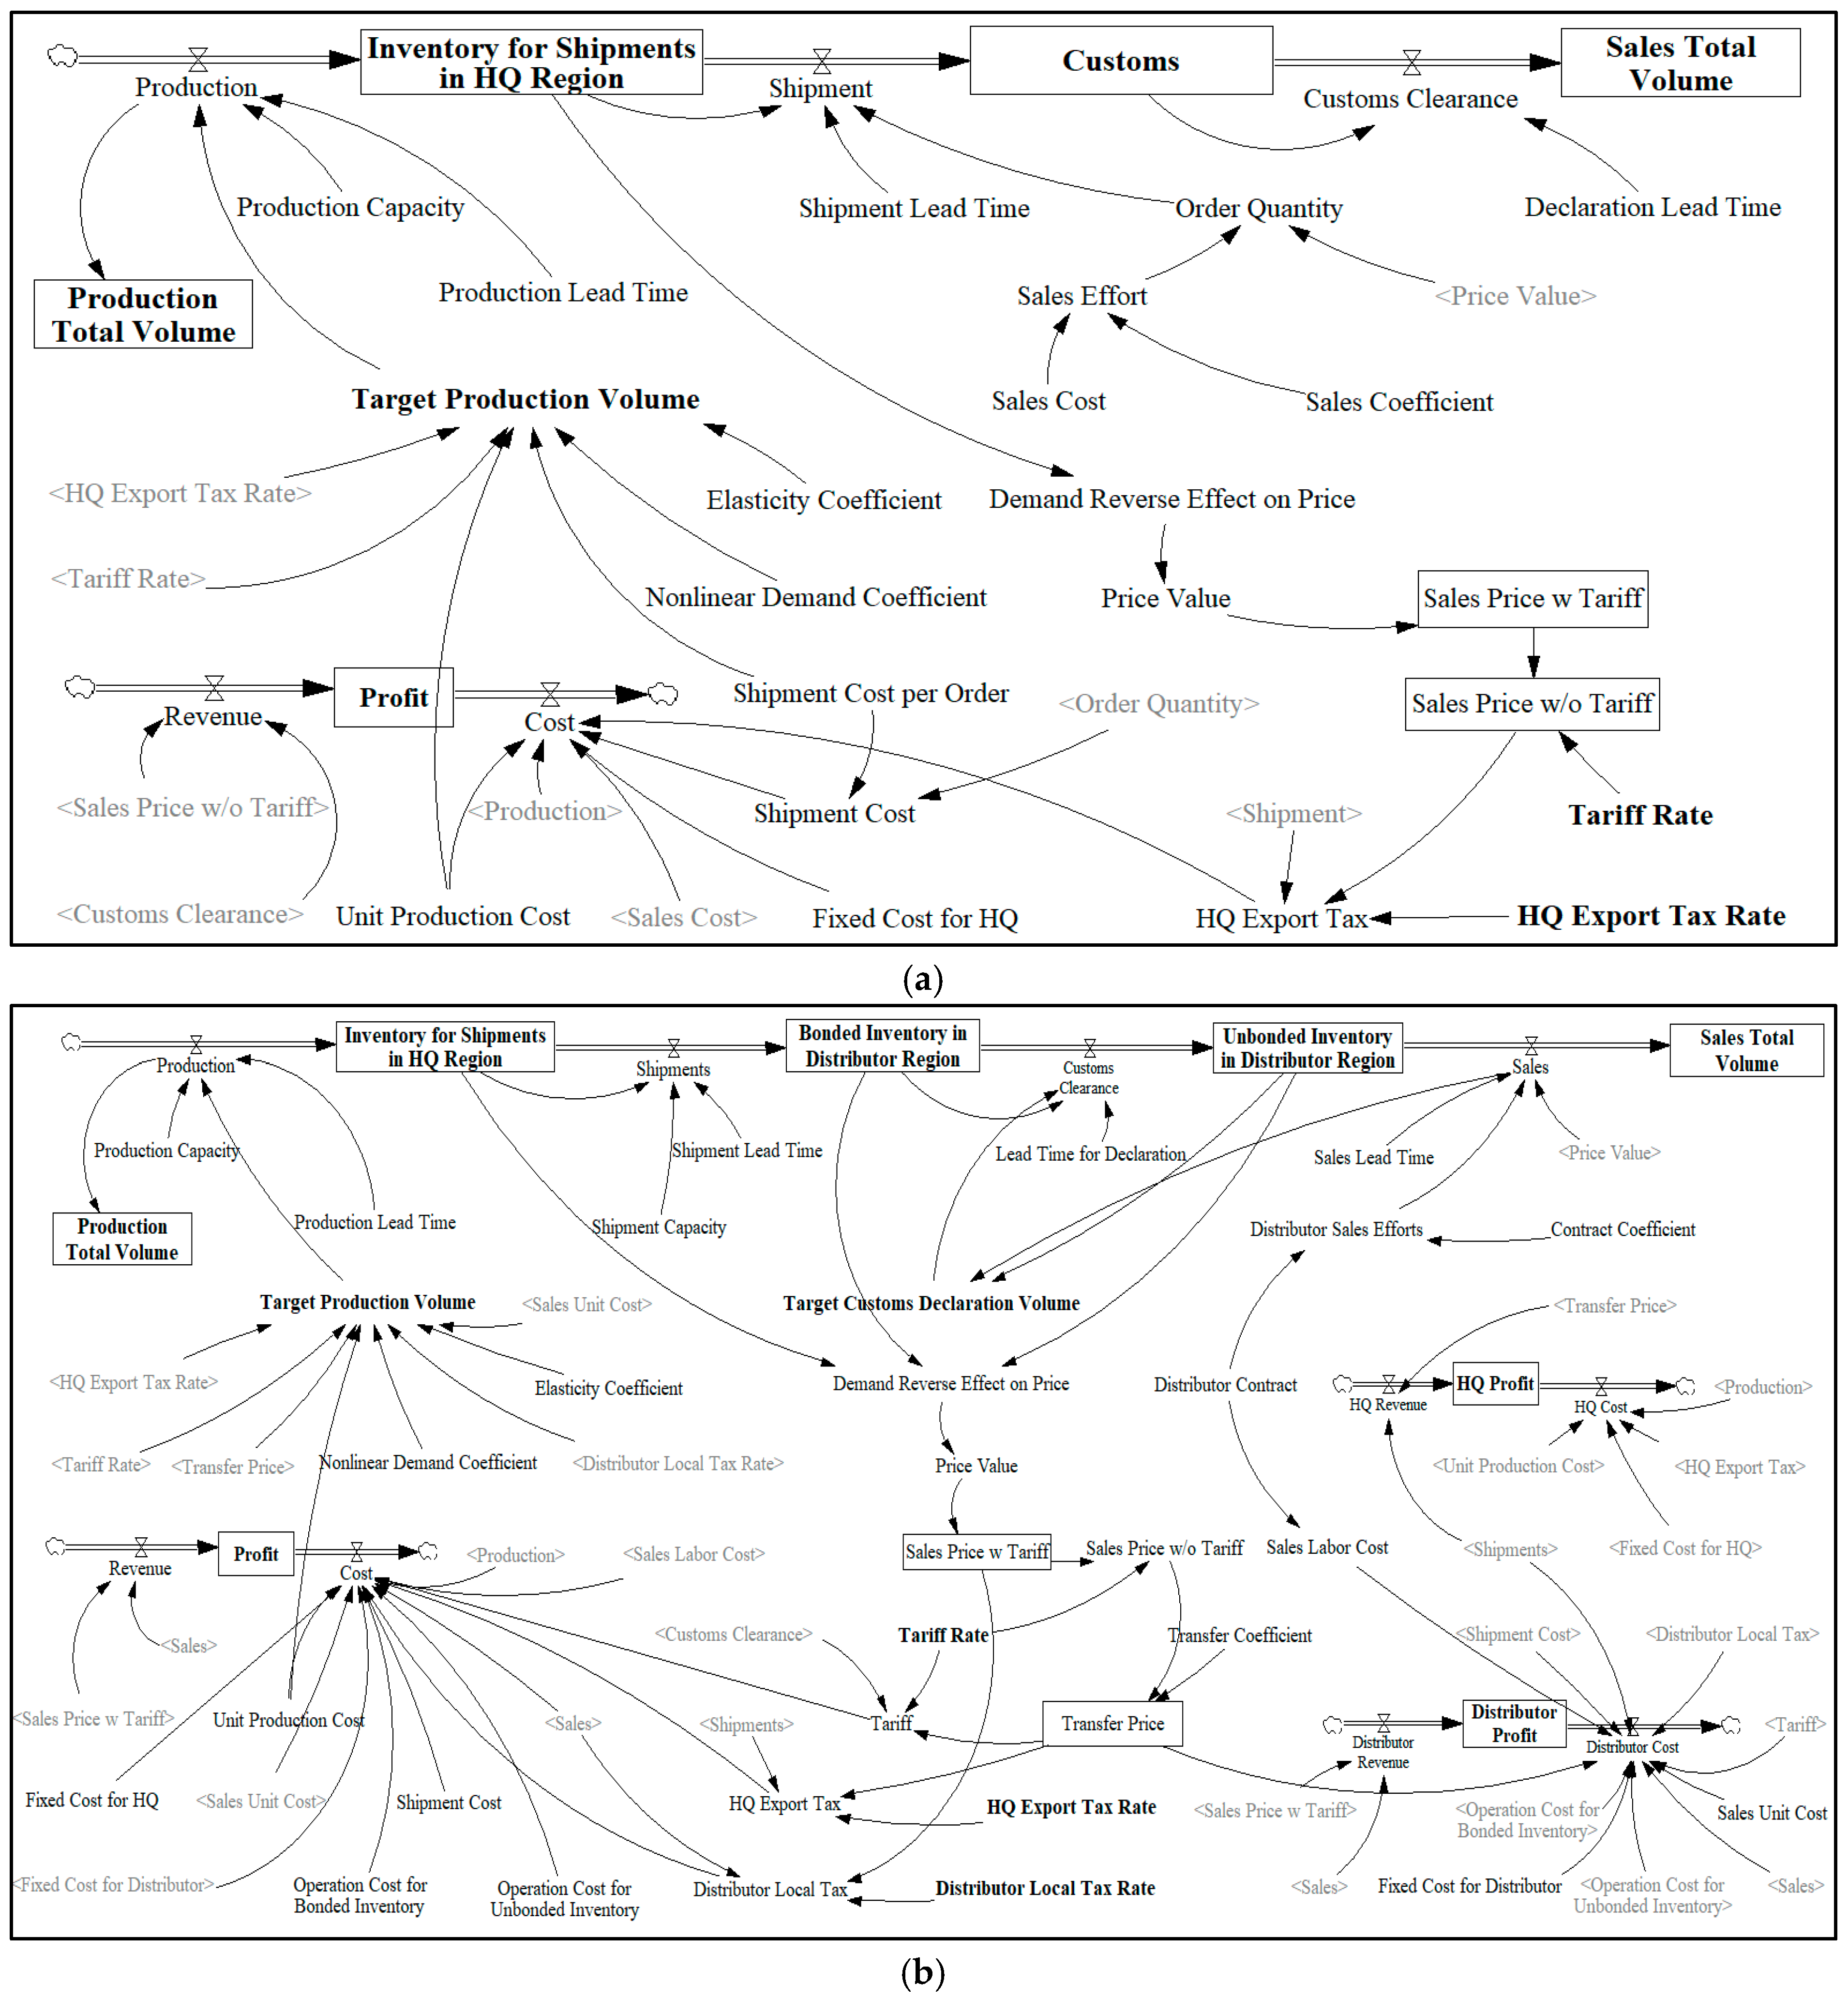
On the basis of causal loop diagrams, the stock–flow diagrams for three distribution structures (i.e., no distributor, commissionaire and fully fledged distributor) are developed on the
Vensim® (Ventana Systems, Inc., Harvard, MA, USA) platform as presented in
Figure 4. The embedded mathematical equations of the models are available from the authors upon request.
4. Simulation Results
Several graphical simulation programs (e.g., i-think®, Powersim®, Stella®, Vensim®) support the study of dynamic systems. In this paper, Vensim® is used for simulation. The natural honey tax data, extracted from the World Trade Organization Tariff Download Facility, shows 43 out of 128 countries have an ad valorem tariff rate ranging from 10 to 30%. Accordingly, we simulate the models with tariff rates at 10%, 20% and 30%, respectively.
4.1. No-Distributor Model Simulation
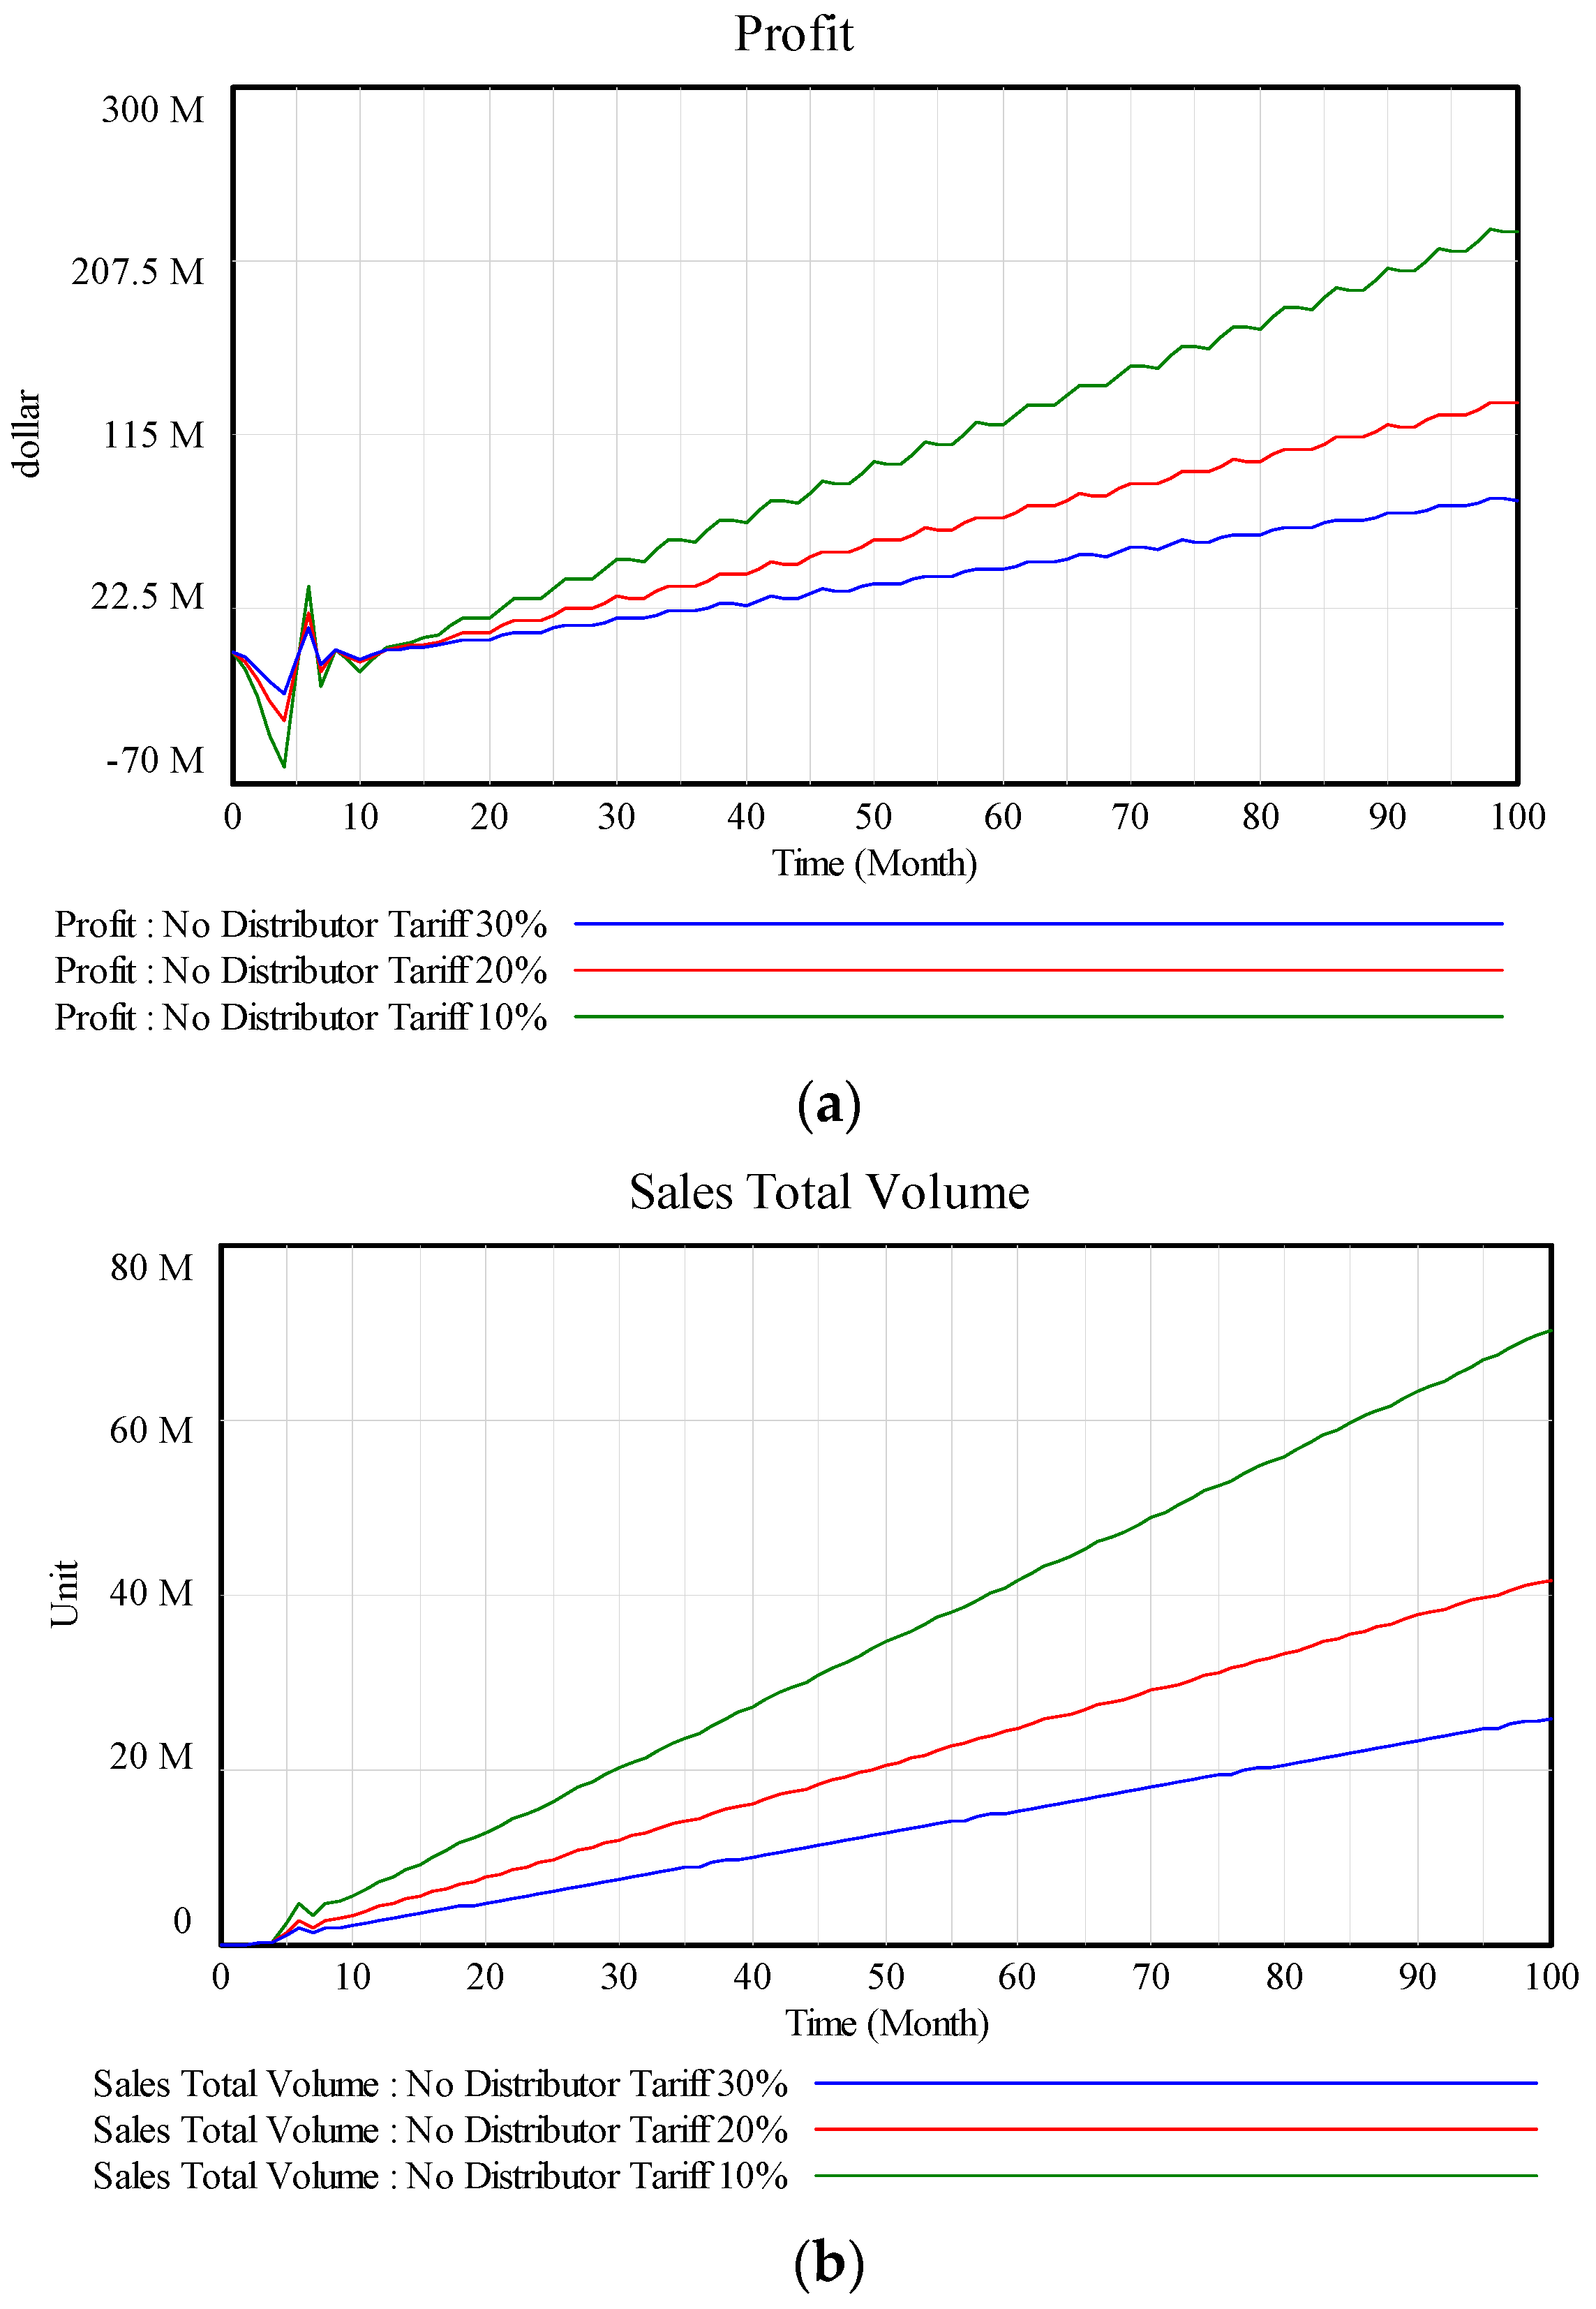
The computational results in
Figure 5 show that, as the tariff rate increases, both profit and sales volume decrease; however, the impact of the tariff rate on both profit and sales volume becomes weaker as the tariff rate goes further up. From Equation (4), it can be seen that the target production volume is affected by the tariff rate with an exponent
, which is a price elasticity coefficient. When
, the impact of the tariff on profit is linear; otherwise, it is non-linear.
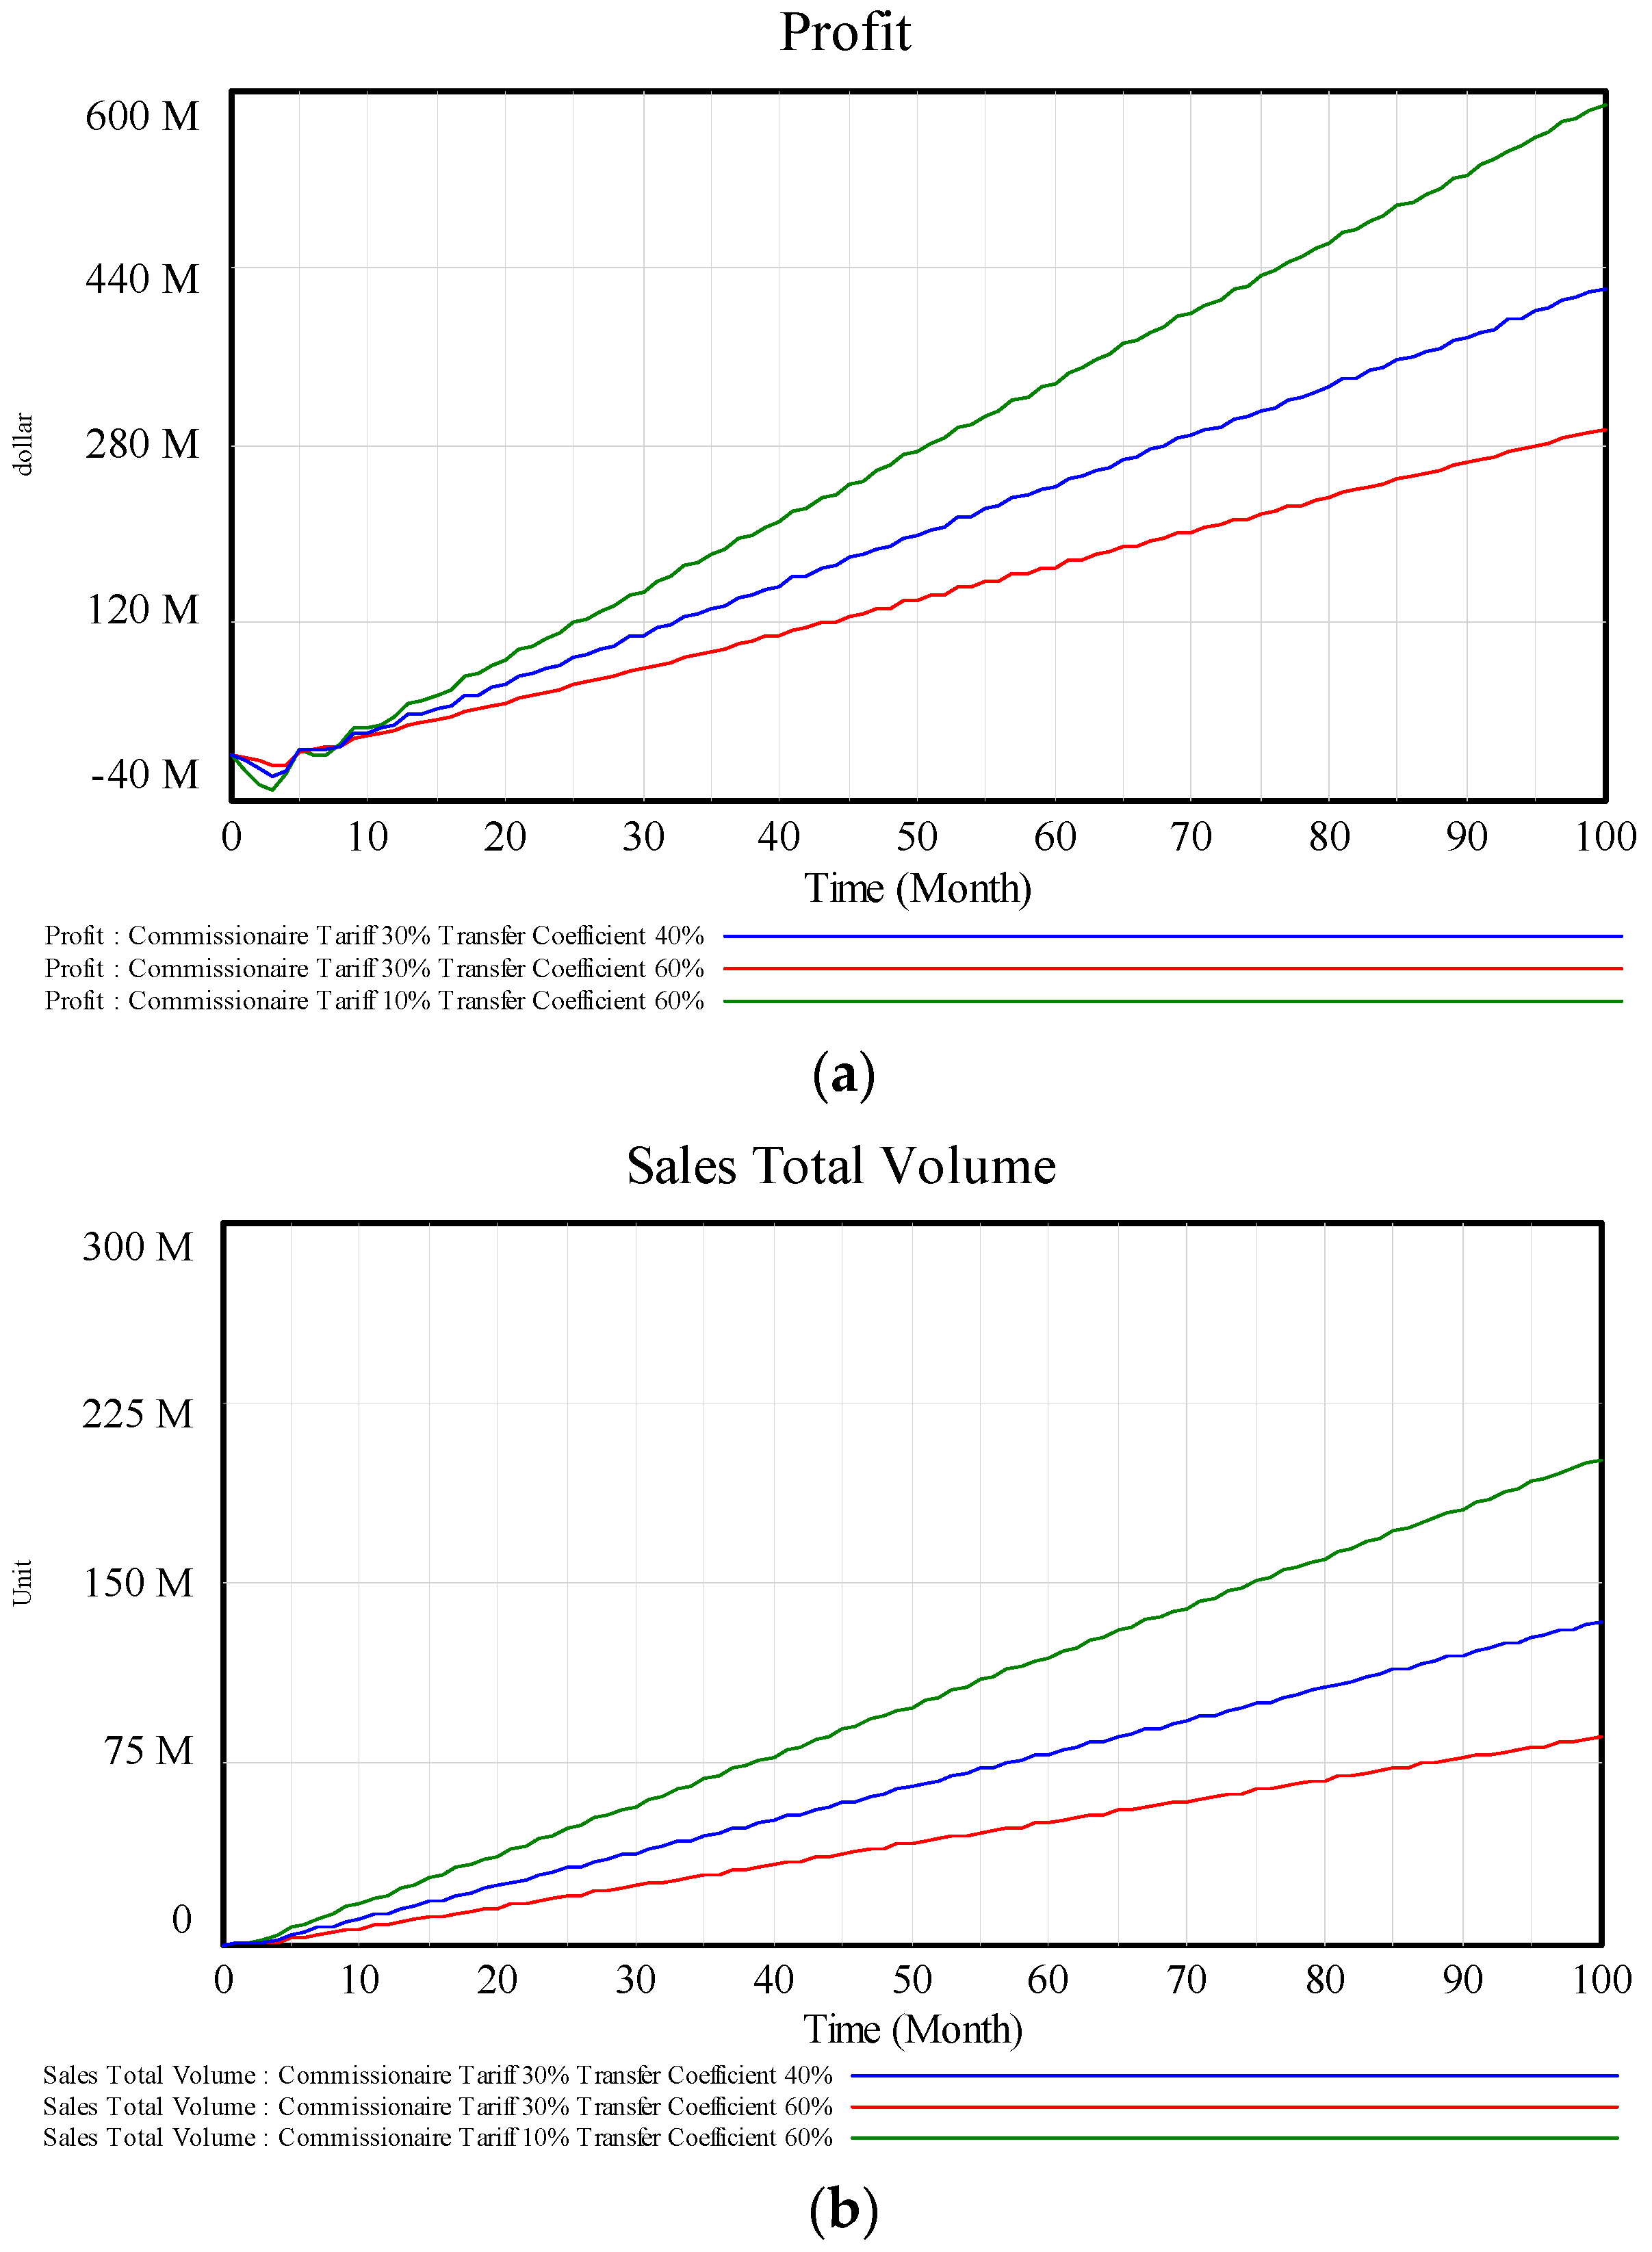
4.2. Commissionaire Model Simulation
The simulation results of a commissionaire model show the same pattern as that of a “no-distributor” model: when the tariff rate increases, profits and sales volume decrease while the impact of the tariff gets weaker. To reduce the economic loss caused by an increase in tariff rate, the enterprise adjusts the transfer coefficient (i.e., discount) to transfer more profit to the distributor. As shown in
Figure 6, profit is partially recovered by decreasing the transfer coefficient from 60 to 40%. The adjustment of the transfer coefficient is an effective measure in response to an increasing tariff rate. However, due to the arm’s length principle invented by tax administrations, the transfer coefficient should stay in a fair range. The arm’s length principle indicates that related entities should agree on the same terms and conditions which would have been agreed upon between non-related entities for comparable uncontrolled transactions. Therefore, transfer price should be adjusted within a certain range to strategically reduce the impact of tariff fluctuations.
4.3. Fully Fledged Distributor Model Simulation
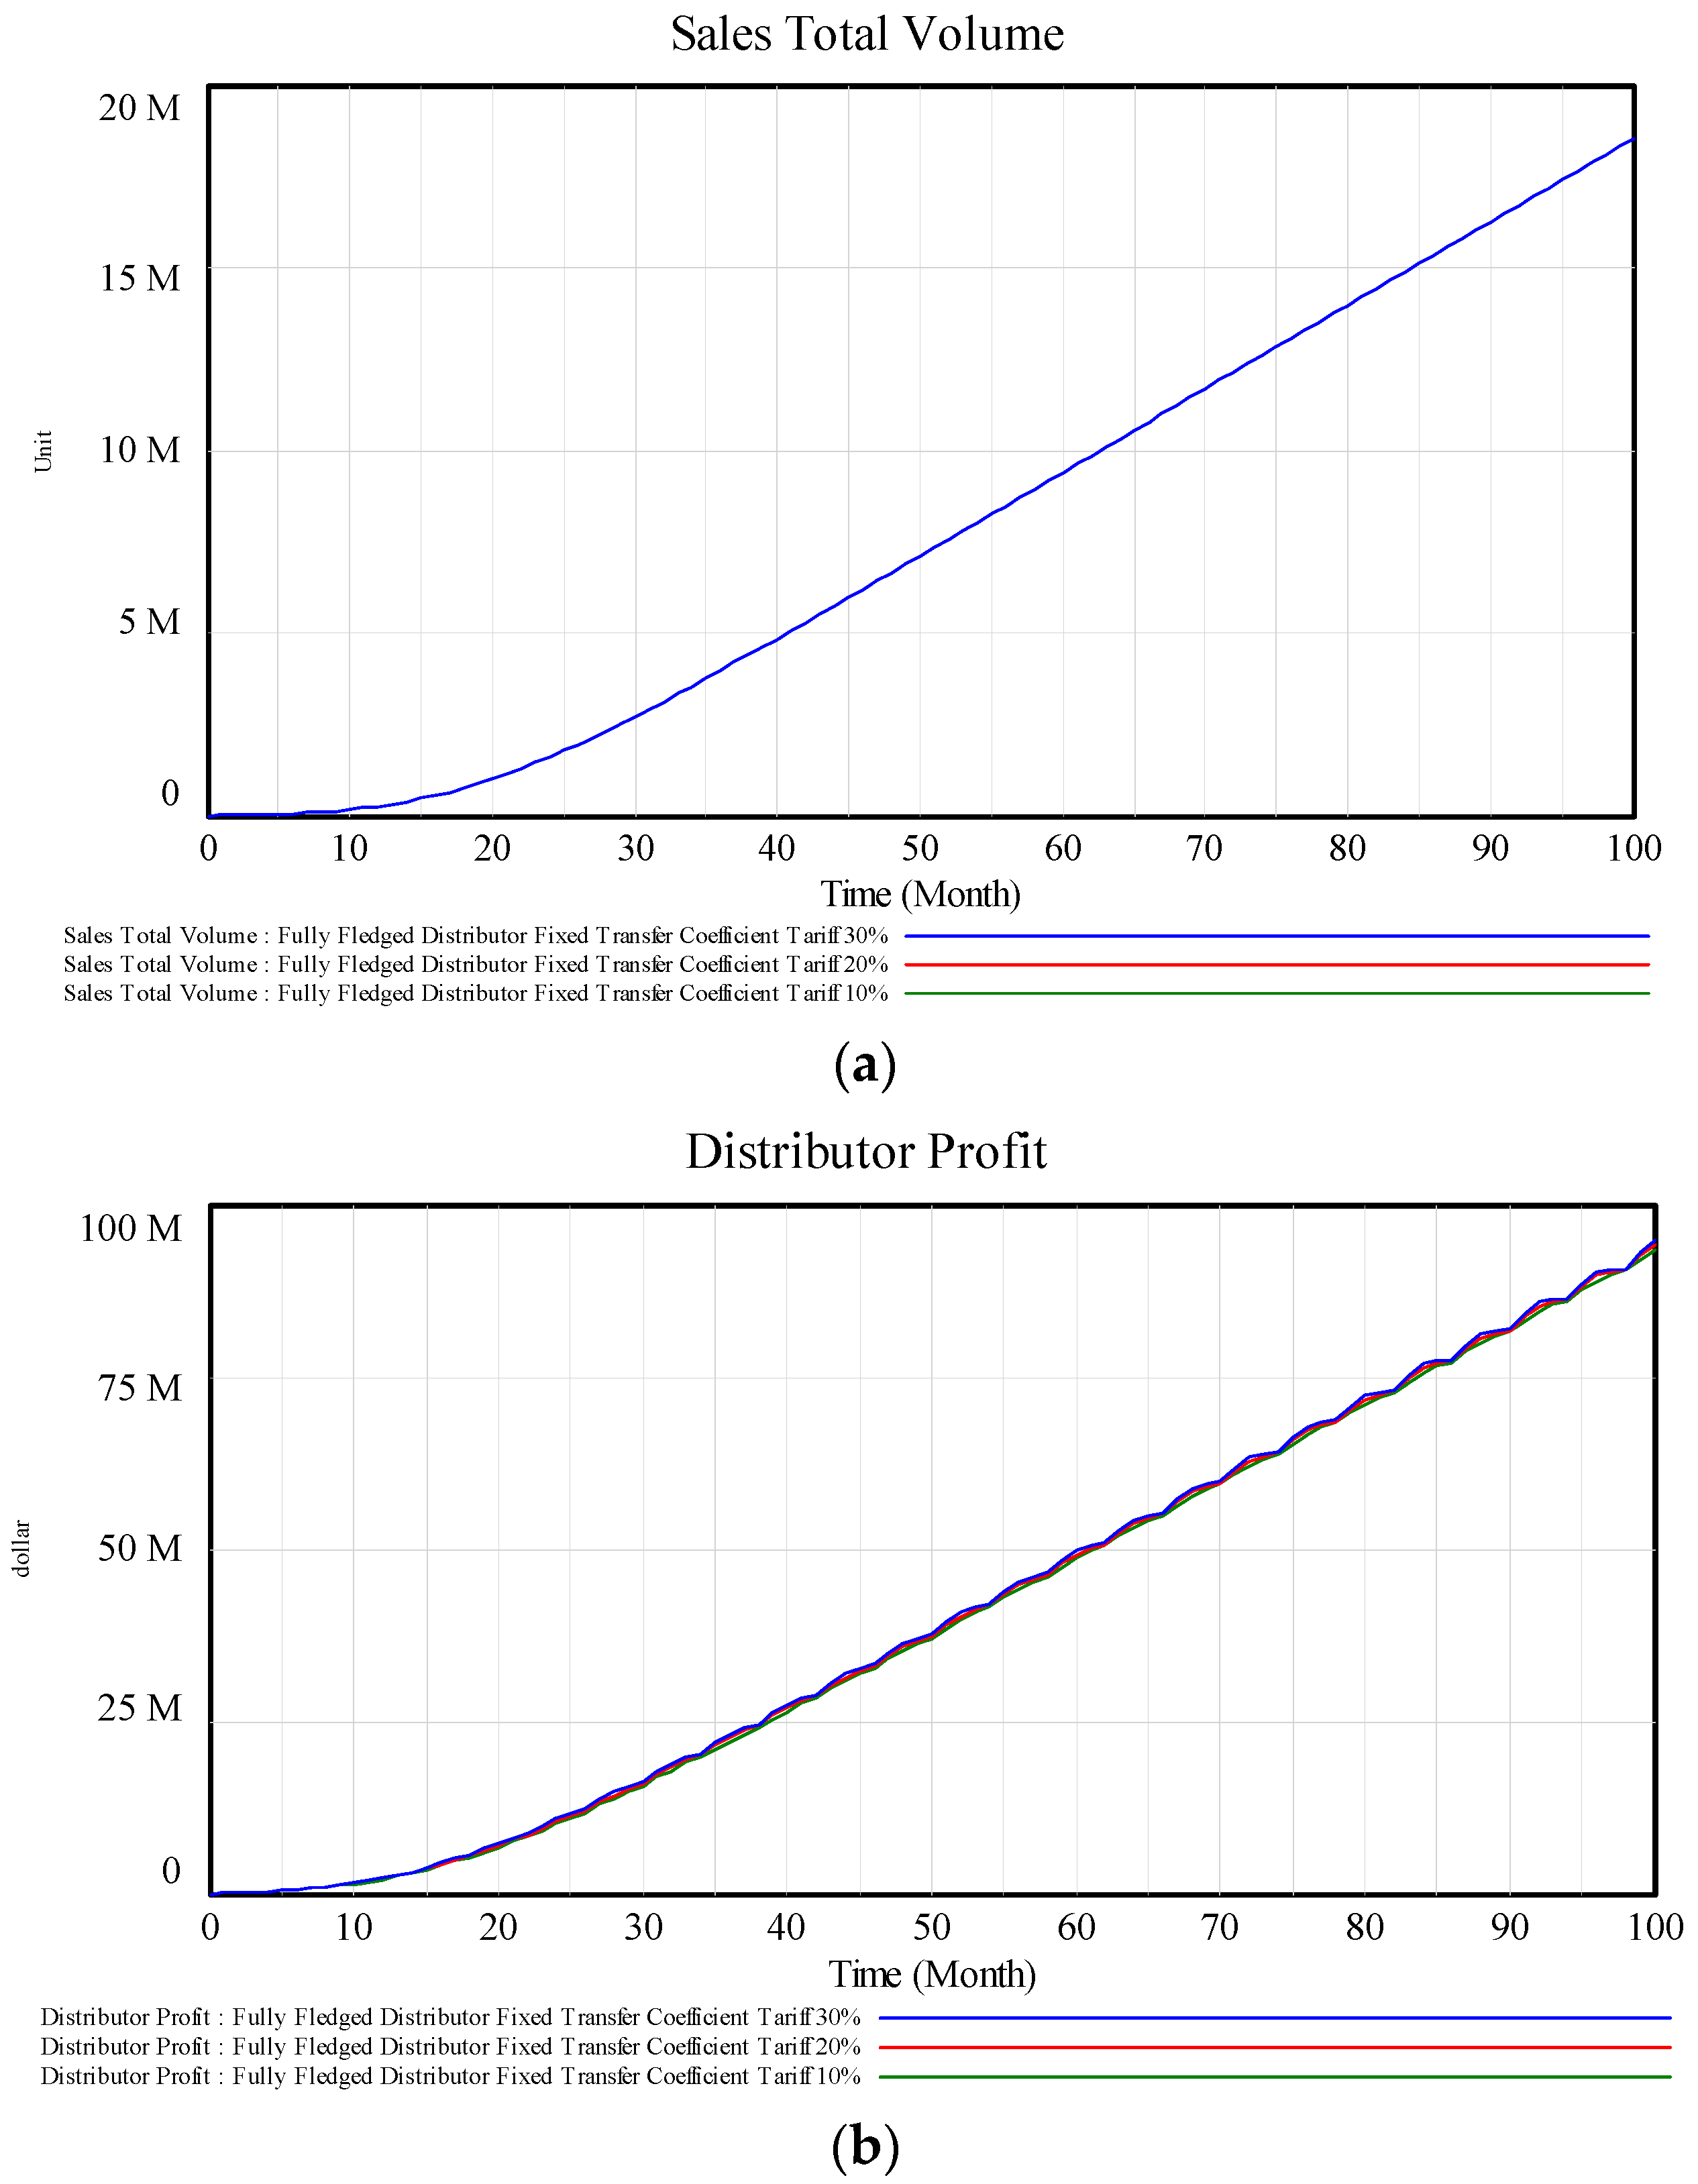
4.3.1. Fixed Transfer Coefficient
The computational results of a fully fledged distributor model with a constant transfer coefficient demonstrate that the total sales volume remains the same under a tariff fluctuation, as shown in
Figure 7. The distributor profit shows no obvious change under the impact of tariff fluctuations.
4.3.2. Fixed Transfer Price
Figure 8 shows the simulation results of a fully fledged distributor model with a fixed transfer price. The profit fluctuates even with a stable tariff rate. If the tariff rate fluctuates, the profit oscillates even more widely.
5. Comparison and Discussion of Different Structures
A summary of the simulation results of different structures is presented in
Table 3. A transfer price is determined when a distributor is employed. The total sales volume of a fully fledged distributor with a fixed transfer coefficient is not impacted by a tariff fluctuation, while that of other structures is affected. The overall profit and HQ profit of all structures show similar patterns under a tariff fluctuation. However, the tariff fluctuation has different impacts on the distributor profit of a commissionaire and a fully fledged distributor. The sales price of a fully fledged distributor with a fixed transfer coefficient remains the same under tariff fluctuations. With other structures, the sales price increases as the tariff rate increases. Hence, the distribution structure of a fully fledged distributor with a fixed transfer coefficient is most friendly to customers as the sales price is stable.
A comparison of the overall profit for each structure is presented in
Figure 9. It shows that a cross-border enterprise acquires the highest profit when it employs a commissionaire structure (red line), rather than other structures.
6. Conclusions and Future Research
To achieve long-term sustainable development, cross-border enterprises need to strengthen their capabilities by considering the health status of their entire ecosystem. By weighing in on which of the structural options a cross-border enterprise should implement, we help enterprises choose an appropriate way of enhancing ecological advantages in the business ecosystem under disruptions. No distributor, commissionaire and fully fledged distributor are possible ways to structure distribution operations of a cross-border enterprise. This research constructed modeling of an enterprise ecosystem including multiple decision makers, flows of products, profit optimization and interactions among enterprises, distributors, customers and governments.
This paper investigates business ecosystem sustainability in three steps: assessing possible structures, constructing dynamic models and developing ecological advantages. The progression of our analysis highlighted each advantage and disadvantage that occurs in the operation of each structure. In summary, this paper makes four primary contributions. First, this study is the first to investigate the dynamic performance of cross-border enterprises impacted by tariff fluctuations through system dynamics modeling and simulation. The outcome shows that the relation between tariff rate and sales is linear only if the price elasticity coefficient is equal to 1. Second, this study compares the performance of different distribution structures in response to a changing tariff. The comparative results reveal that cross-border enterprises with distributors are more resilient to tariff fluctuations than those without distributors. Third, this study proposes an effective measure to immediately mitigate the disruptions of tariff fluctuations on sales and profits. It suggests that reducing transfer prices within a range leads to a partial recovery of the decreased profits and sales induced by a tariff increase. Fourth, this study discusses the ideal operating structure for various purposes under a tariff fluctuation. It demonstrates that a commissionaire model is ideal for acquiring the highest profit, while a fully fledged distributor model is ideal for establishing a friendly market environment for customer retention. This study provides full comparative statistics for the decisions and financial outcomes induced by each of the operating structures. The structural optimization of enterprises promotes the development of business ecosystem sustainability.
This research draws several conclusions with theoretical and practical value. The developed models may prove useful to policy makers and decision makers who are dealing with a wide spectrum of strategic business ecosystem issues. However, the enterprise ecosystem in real life is constituted of a large number of components and is more complicated than constructed models. In future studies, we will expand the dynamic models to include more elements of the business ecosystem and analyze various scenarios under different conditions.
Author Contributions
Conceptualization and methodology, T.Z. and T.Y.; data curation, formal analysis, investigation, software, visualization and writing—original draft, T.Z.; funding acquisition, project administration, resources, supervision, validation and writing—review and editing, T.Y. All authors have read and agreed to the published version of the manuscript.
Funding
This research is funded by the National Natural Science Foundation of China, grant number 71001010.
Data Availability Statement
Data supporting the findings of this study were generated using the equations listed in the
supplementary material and are also available from authors on request.
Conflicts of Interest
The authors declare no conflict of interest.
Appendix A
Proof of Proposition A1. Given Equation (2) and the market clearing mechanism, we have
By the definition of marginal revenue, it can be observed that
By substituting
into
, we get
By the definition of marginal cost, it can be found that
Given assumption 1 of profit maximization when
, it can be concluded that
By simplifying the equation, we arrive at
By combining the above equation, Equation (2) and the definition of
, the optimal sales volume can be determined as
□
Appendix B
Proof of Proposition A2. Given Equation (2) and the market clearing mechanism, we have
By the definition of marginal revenue, it can be observed that
By substituting
into
, we get
By the definition of marginal cost, it can be found that
Given assumption 1 of profit maximization when
, we arrive at
Given Equation (2), the optimal sales volume can be determined as
□
Appendix C
Proof of Proposition A3. Given Equation (2) and the market clearing mechanism, we have
By the definition of marginal revenue, it can be observed that
By substituting
into
, we get
By the definition of marginal cost, it can be concluded that
Given assumption 1 of profit maximization when we have
, we arrive at
Given Equation (2), the optimal sales volume can be determined as
□
References
- Lu, X.; Shan, B.; Pu, Y. Sustainability in the Entrepreneurial Ecosystem: Operating Mechanisms and Enterprise Growth; Gao, G., Tsai, S.-B., Du, X., Xin, X., Eds.; RRP£ 155 (hardback); IGI Global: Hershey, PA, USA, 2020; pp. xiii + 342; ISBN 978-1-79983-495-3. [Google Scholar]
- Wei, H.; Wang, F.; Cheng, L. Update: US Names Products Targeted by $200 Billion in New Tariffs; Caixin Global: Beijing, China, 2019. [Google Scholar]
- Yıldız, N. Sino–US Trade War: A Mini Review on Latin American Involvement. Manag. Econ. Res. J. 2019, 5, 10938. [Google Scholar] [CrossRef]
- Re, G. Steep new US, China tariffs go into effect, as companies warn of higher consumer prices. Fox News, 1 September 2019. [Google Scholar]
- Revilla, E.; Saenz, M.J. The impact of risk management on the frequency of supply chain disruptions: A configurational approach. Int. J. Oper. Prod. Manag. 2017, 37, 557–576. [Google Scholar] [CrossRef]
- Abdallah, W.M. International Transfer Pricing Policies: Decision-Making Guidelines for Multinational Companies; Praeger: Westport, CT, USA, 1989. [Google Scholar]
- Choi, F.D. International Finance and Accounting Handbook; John Wiley & Sons: Hoboken, NJ, USA, 2003. [Google Scholar]
- Shunko, M.; Gavirneni, S. Role of transfer prices in global supply chains with random demands. J. Ind. Manag. Optim. 2007, 3, 99. [Google Scholar] [CrossRef]
- Huh, W.T.; Park, K.S. Impact of transfer pricing methods for tax purposes on supply chain performance under demand uncertainty. Nav. Res. Logist. (NRL) 2013, 60, 269–293. [Google Scholar] [CrossRef]
- Moore, J.F. Predators and prey: A new ecology of competition. Harv. Bus. Rev. 1993, 71, 75–86. [Google Scholar] [PubMed]
- Kandiah, G.; Gossain, S. Reinventing value: The new business ecosystem. Strategy Leadersh. 1998, 26, 28–33. [Google Scholar] [CrossRef]
- Lewin, R. Complexity: Life at the Edge of Chaos; University of Chicago Press: Chicago, IL, USA, 1999. [Google Scholar]
- Power, T.; Jerjian, G. Ecosystem: Living the 12 Principles of Networked Business; Financial Times: London, UK, 2001. [Google Scholar]
- Iansiti, M.; Levien, R. Strategy as ecology. Harv. Bus. Rev. 2004, 82, 68–78, 126. [Google Scholar]
- Peltoniemi, M.; Vuori, E. Business ecosystem as the new approach to complex adaptive business environments. In Frontiers of E-Business Research; University of Tampere: Tampere, Finland, 2004; Volume 2, pp. 267–281. [Google Scholar]
- Yang, T.; Fan, W. Information management strategies and supply chain performance under demand disruptions. Int. J. Prod. Res. 2016, 54, 8–27. [Google Scholar] [CrossRef]
- Zhao, K.; Kumar, A.; Harrison, T.P.; Yen, J. Analyzing the resilience of complex supply network topologies against random and targeted disruptions. IEEE Syst. J. 2011, 5, 28–39. [Google Scholar] [CrossRef]
- Hasani, A.; Mokhtari, H.; Fattahi, M. A multi-objective optimization approach for green and resilient supply chain network design: A real-life case study. J. Clean. Prod. 2021, 278, 123199. [Google Scholar] [CrossRef]
- Hileman, J.; Kallstenius, I.; Häyhä, T.; Palm, C.; Cornell, S. Keystone actors do not act alone: A business ecosystem perspective on sustainability in the global clothing industry. PLoS ONE 2020, 15, e0241453. [Google Scholar] [CrossRef] [PubMed]
- Horst, T. The theory of the multinational firm: Optimal behavior under different tariff and tax rates. J. Political Econ. 1971, 79, 1059–1072. [Google Scholar] [CrossRef]
- Bhagwati, J.N.; Tironi, E. Tariff change, foreign capital and immiserization: A theoretical analysis. J. Dev. Econ. 1980, 7, 71–83. [Google Scholar] [CrossRef]
- Motta, M. Multinational firms and the tariff-jumping argument: A game theoretic analysis with some unconventional conclusions. Eur. Econ. Rev. 1992, 36, 1557–1571. [Google Scholar] [CrossRef]
- Castellanos, S.; Santibañez-Aguilar, J.E.; Shapiro, B.B.; Powell, D.M.; Peters, I.M.; Buonassisi, T.; Kammen, D.M.; Flores-Tlacuahuac, A. Sustainable silicon photovoltaics manufacturing in a global market: A techno-economic, tariff and transportation framework. Appl. Energy 2018, 212, 704–719. [Google Scholar] [CrossRef]
- Giang, N.T. The Role of Tariff in Promoting Economic Growth: A Case Study of Vietnam. J. Financ. Econ. 2020, 8, 86–92. [Google Scholar]
- Barlow, P. Global disparities in health-systems financing: A cross-national analysis of the impact of tariff reductions and state capacity on public health expenditure in 65 low-and middle-income countries, 1996–2015. Health Place 2020, 63, 102329. [Google Scholar] [CrossRef]
- Crowley, M.A.; Exton, O.; Han, L. The looming threat of tariff hikes: Entry into exporting under trade agreement renegotiation. In AEA Papers and Proceedings; American Economic Association: Nashville, TN, USA, 2020; Volume 110, pp. 547–551. [Google Scholar]
- Ivanov, D. Simulation-based ripple effect modelling in the supply chain. Int. J. Prod. Res. 2017, 55, 2083–2101. [Google Scholar] [CrossRef]
- Bakker, A. Transfer Pricing and Business Restructurings: Streamlining All the Way; IBFD: Amsterdam, The Netherlands, 2009. [Google Scholar]
- Shunko, M.; Do, H.T.; Tsay, A.A. Supply chain strategies and international tax arbitrage. Prod. Oper. Manag. 2017, 26, 231–251. [Google Scholar] [CrossRef]
- Forrester, J.W. Industrial dynamics. J. Oper. Res. Soc. 1997, 48, 1037–1041. [Google Scholar] [CrossRef]
- Sterman, J. System Dynamics: Systems Thinking and Modeling for a Complex World; Massachusetts Institute of Technology: Cambridge, MA, USA, 2002. [Google Scholar]
- Georgiadis, P.; Vlachos, D.; Iakovou, E. A system dynamics modeling framework for the strategic supply chain management of food chains. J. Food Eng. 2005, 70, 351–364. [Google Scholar] [CrossRef]
- James, S.R. A Dictionary of Taxation; Edward Elgar Publishing: Cheltenham, UK, 2012. [Google Scholar]
- Olsen, W.; Lipsey, R.; Forrest, D. Workbook for the Seventh Edition of an Introduction to Positive Economics; Oxford University Press: Oxford, UK, 1989. [Google Scholar]
- Krugman, P. Increasing returns and economic geography. J. Political Econ. 1991, 99, 483–499. [Google Scholar] [CrossRef]
- Erkel Rousse, H.; Mirza, D. Import price elasticities: Reconsidering the evidence. Can. J. Econ. /Rev. Can. D’économique 2002, 35, 282–306. [Google Scholar] [CrossRef]
- Li, J. Honey Production in the USA (1998–2012). 2018. Available online: https://www.kaggle.com/datasets/jessicali9530/honey-production (accessed on 1 October 2022).
| Publisher’s Note: MDPI stays neutral with regard to jurisdictional claims in published maps and institutional affiliations. |
© 2022 by the authors. Licensee MDPI, Basel, Switzerland. This article is an open access article distributed under the terms and conditions of the Creative Commons Attribution (CC BY) license (https://creativecommons.org/licenses/by/4.0/).


