
Adaptive QoS-Aware Multi-Metrics Gateway Selection Scheme for Heterogenous Vehicular Network †

 , ,
, ,  and
and
Abstract
1. Introduction
2. Related Work
3. Adaptive QoS-Aware Multi-Metrics Gateway Selection Scheme
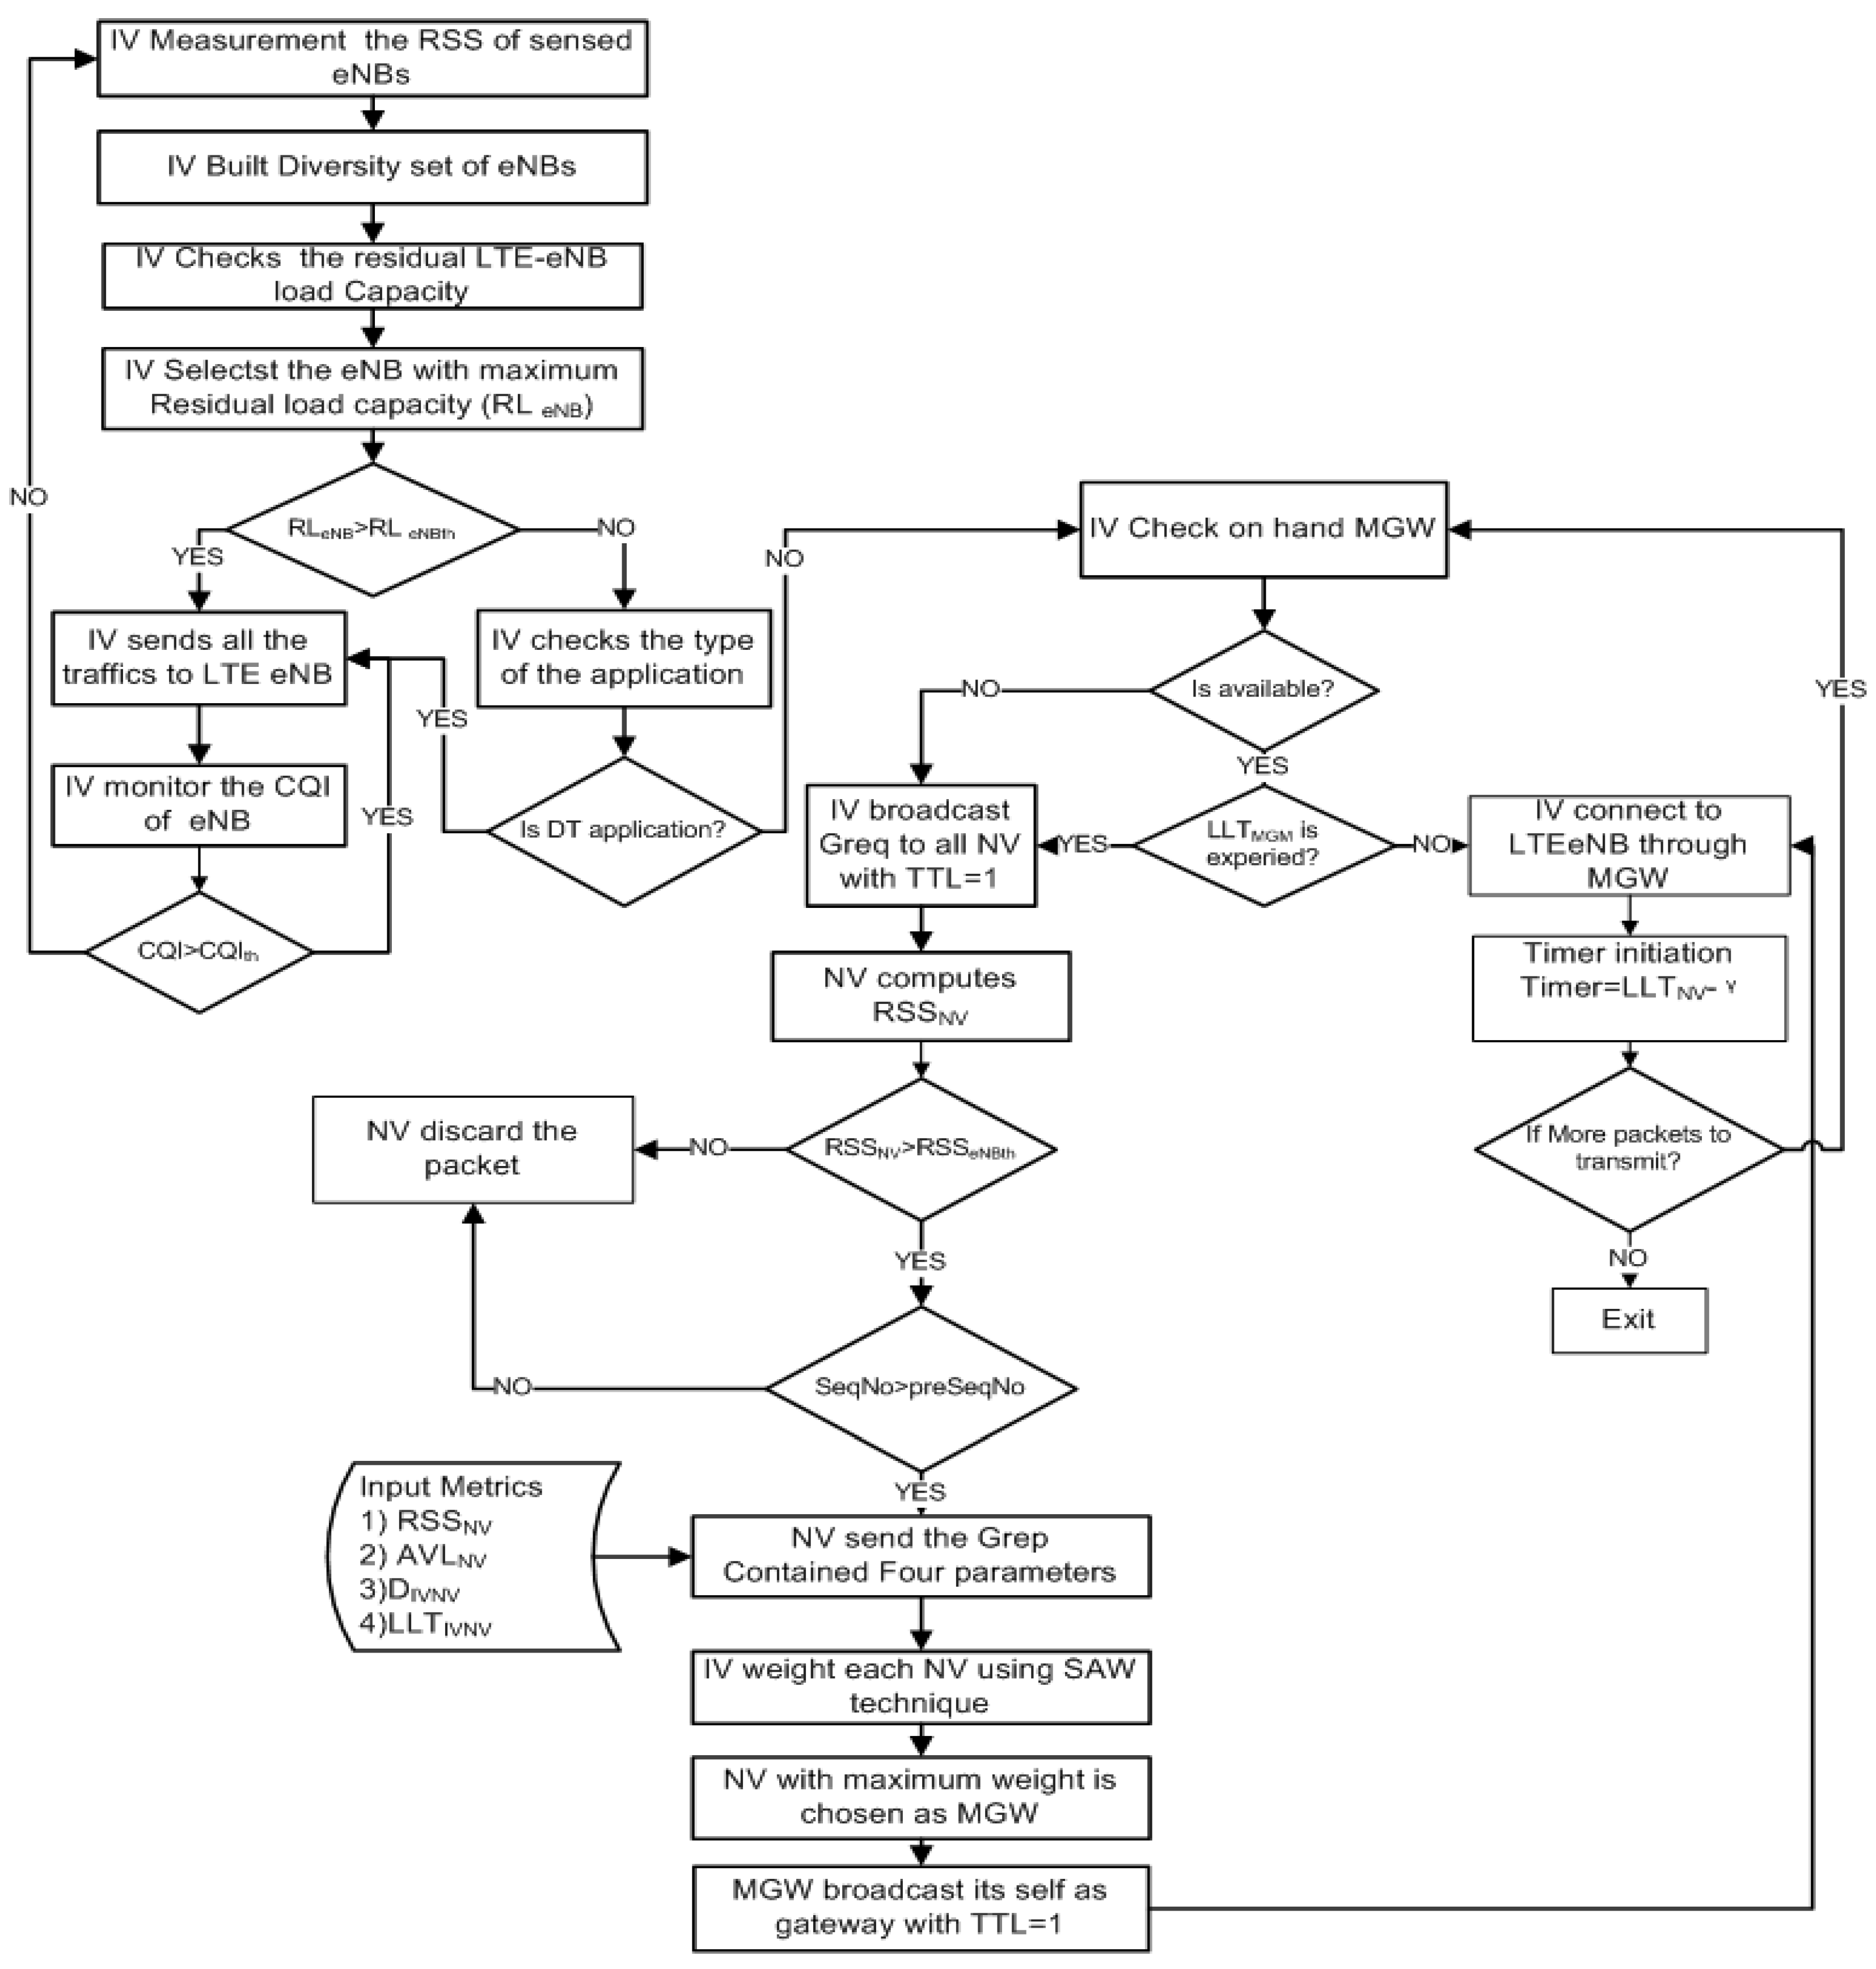
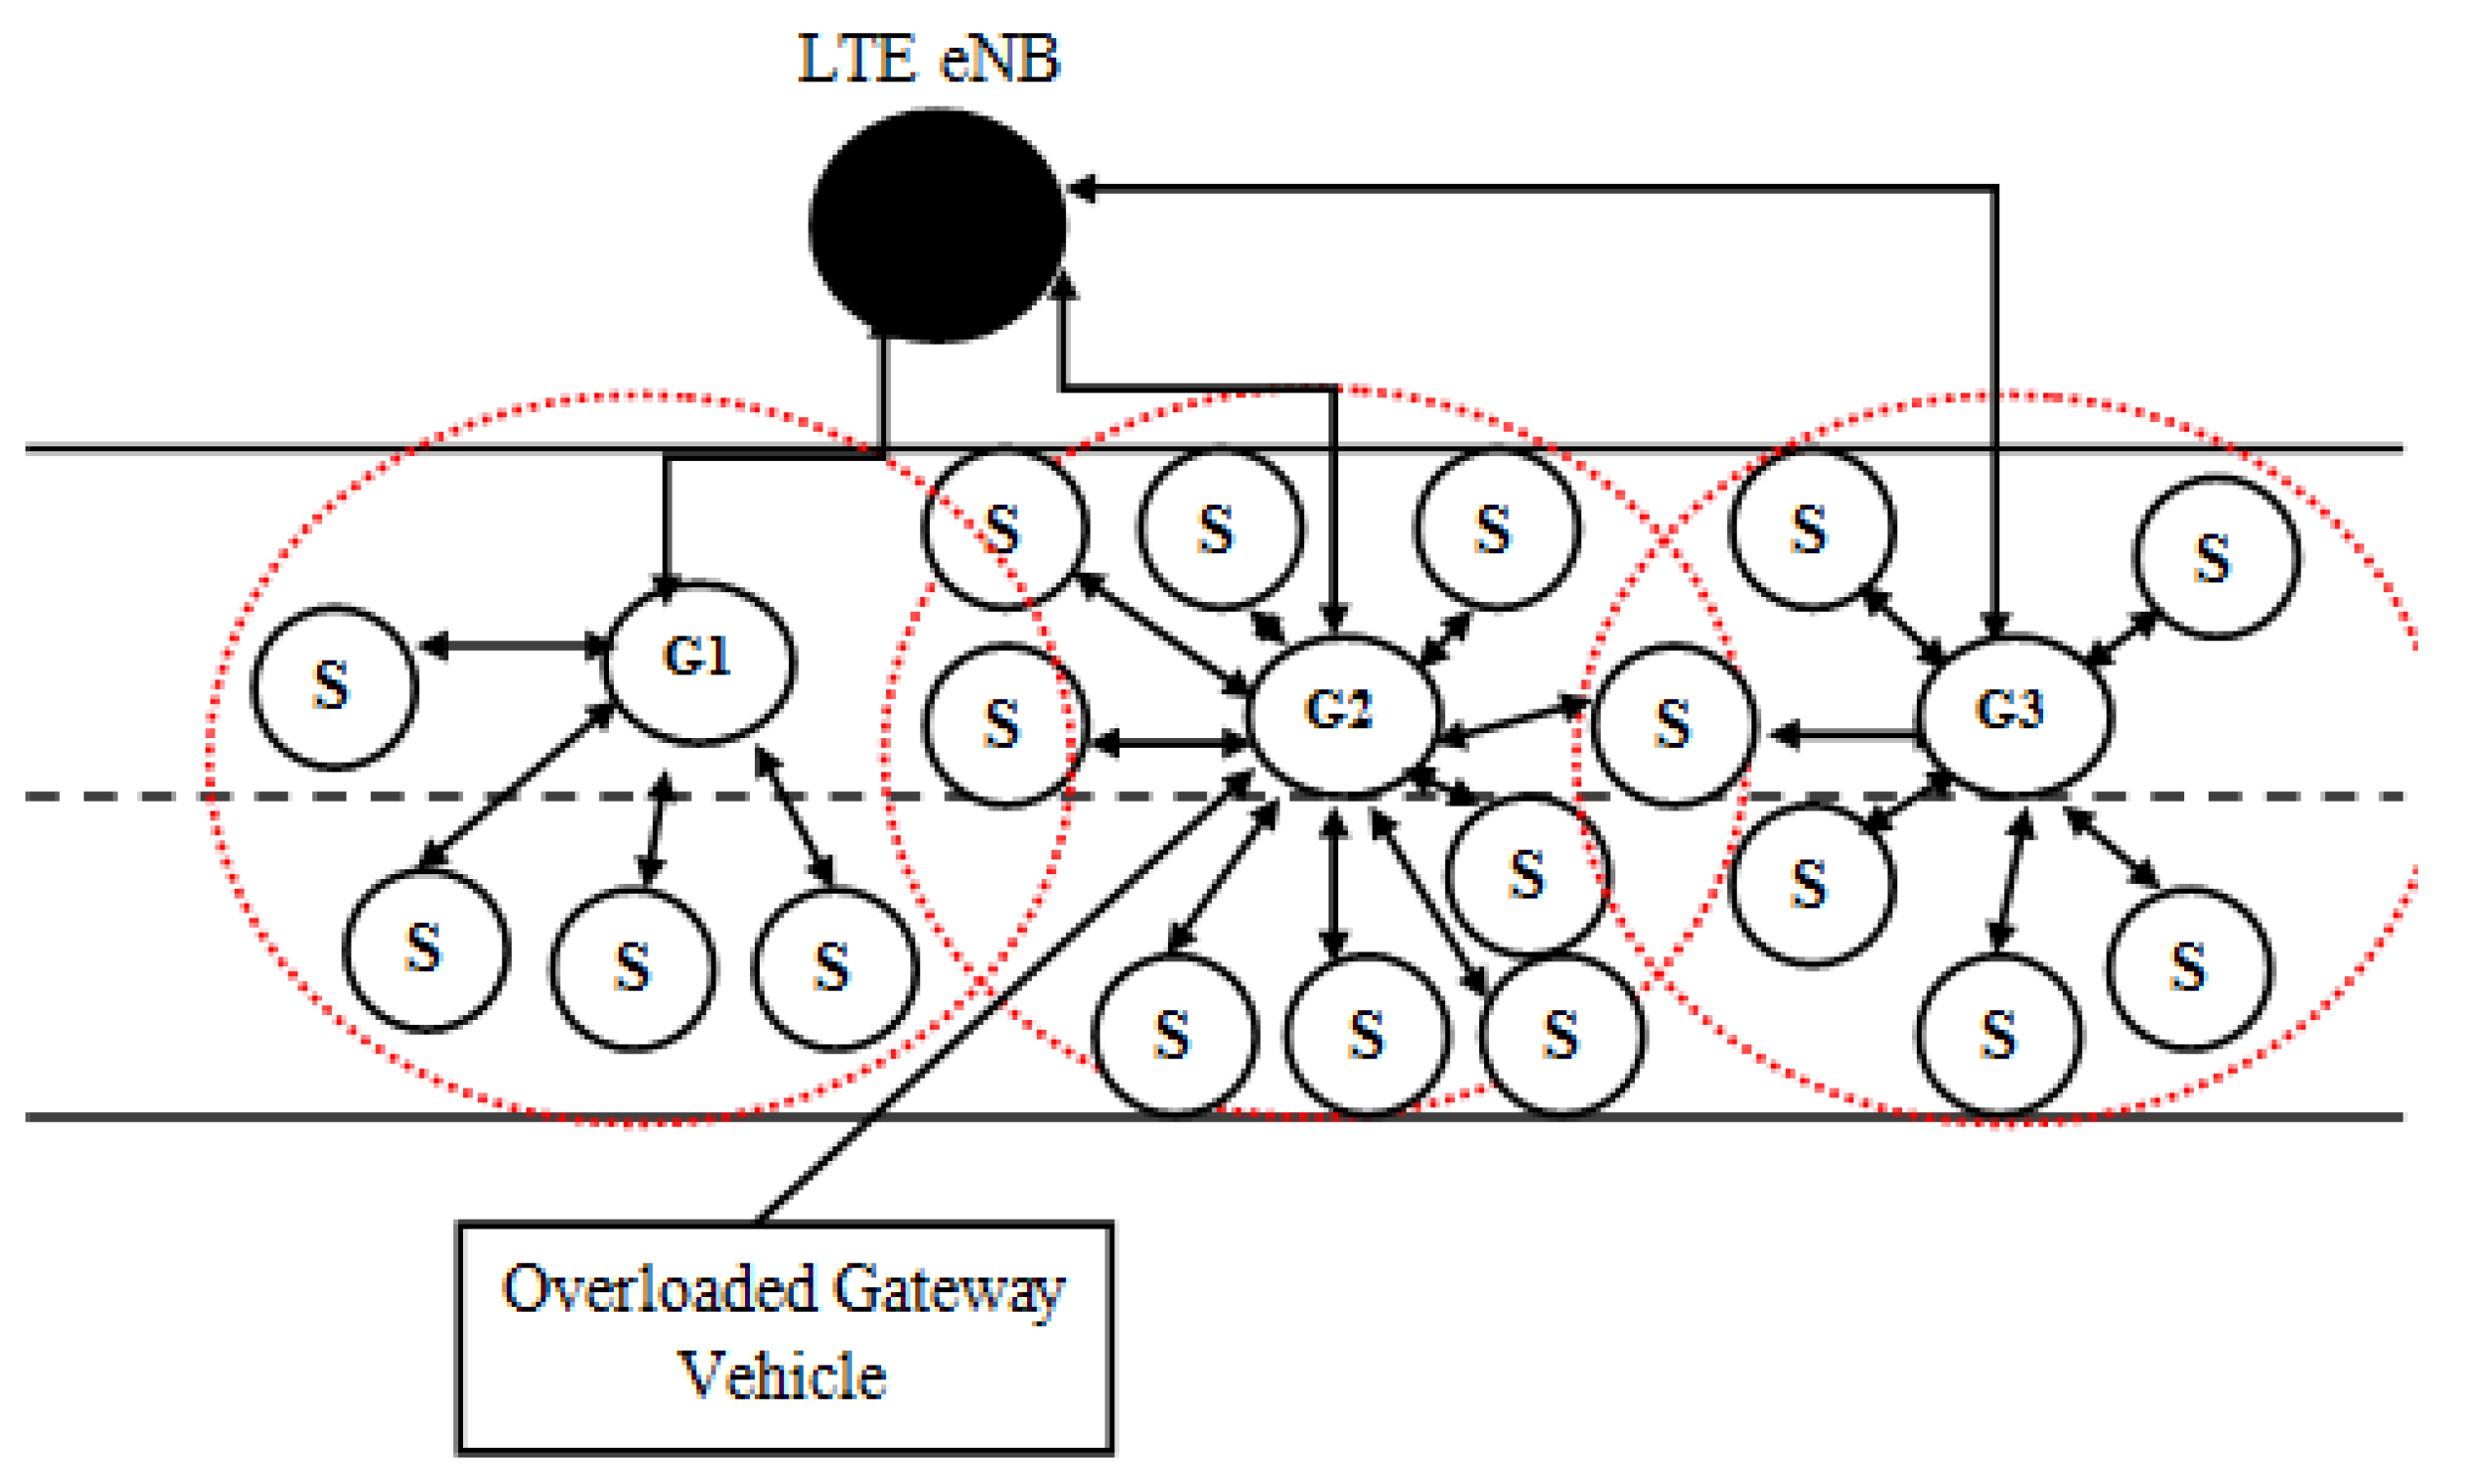
3.1. The AQAGS Overview
3.2. Interest Vehicle LTE-eNB Selection Process
| Algorithm 1 IV eNB selection |
| 1: IV activates its LTE interface to communicate with eNB’s 2: IV detects several numbers of eNBs with different load capacity and RSS 3: for each eNB do 4: if ( then 5: Acquire the 6: end if 7: end for 8: 9: if ) then 10: The IV sends NDT and DT traffics directly to the selected LTE-eNB 11: else 12: if (NDT traffics) 13: IV connects directly to LTE-eNB 14: else 15: Call algorithm 2 16: end if 17: end if |
3.3. Gateway Discovery Process
3.3.1. Receive Signal Strength ()
3.3.2. Gateway Available Capacity (
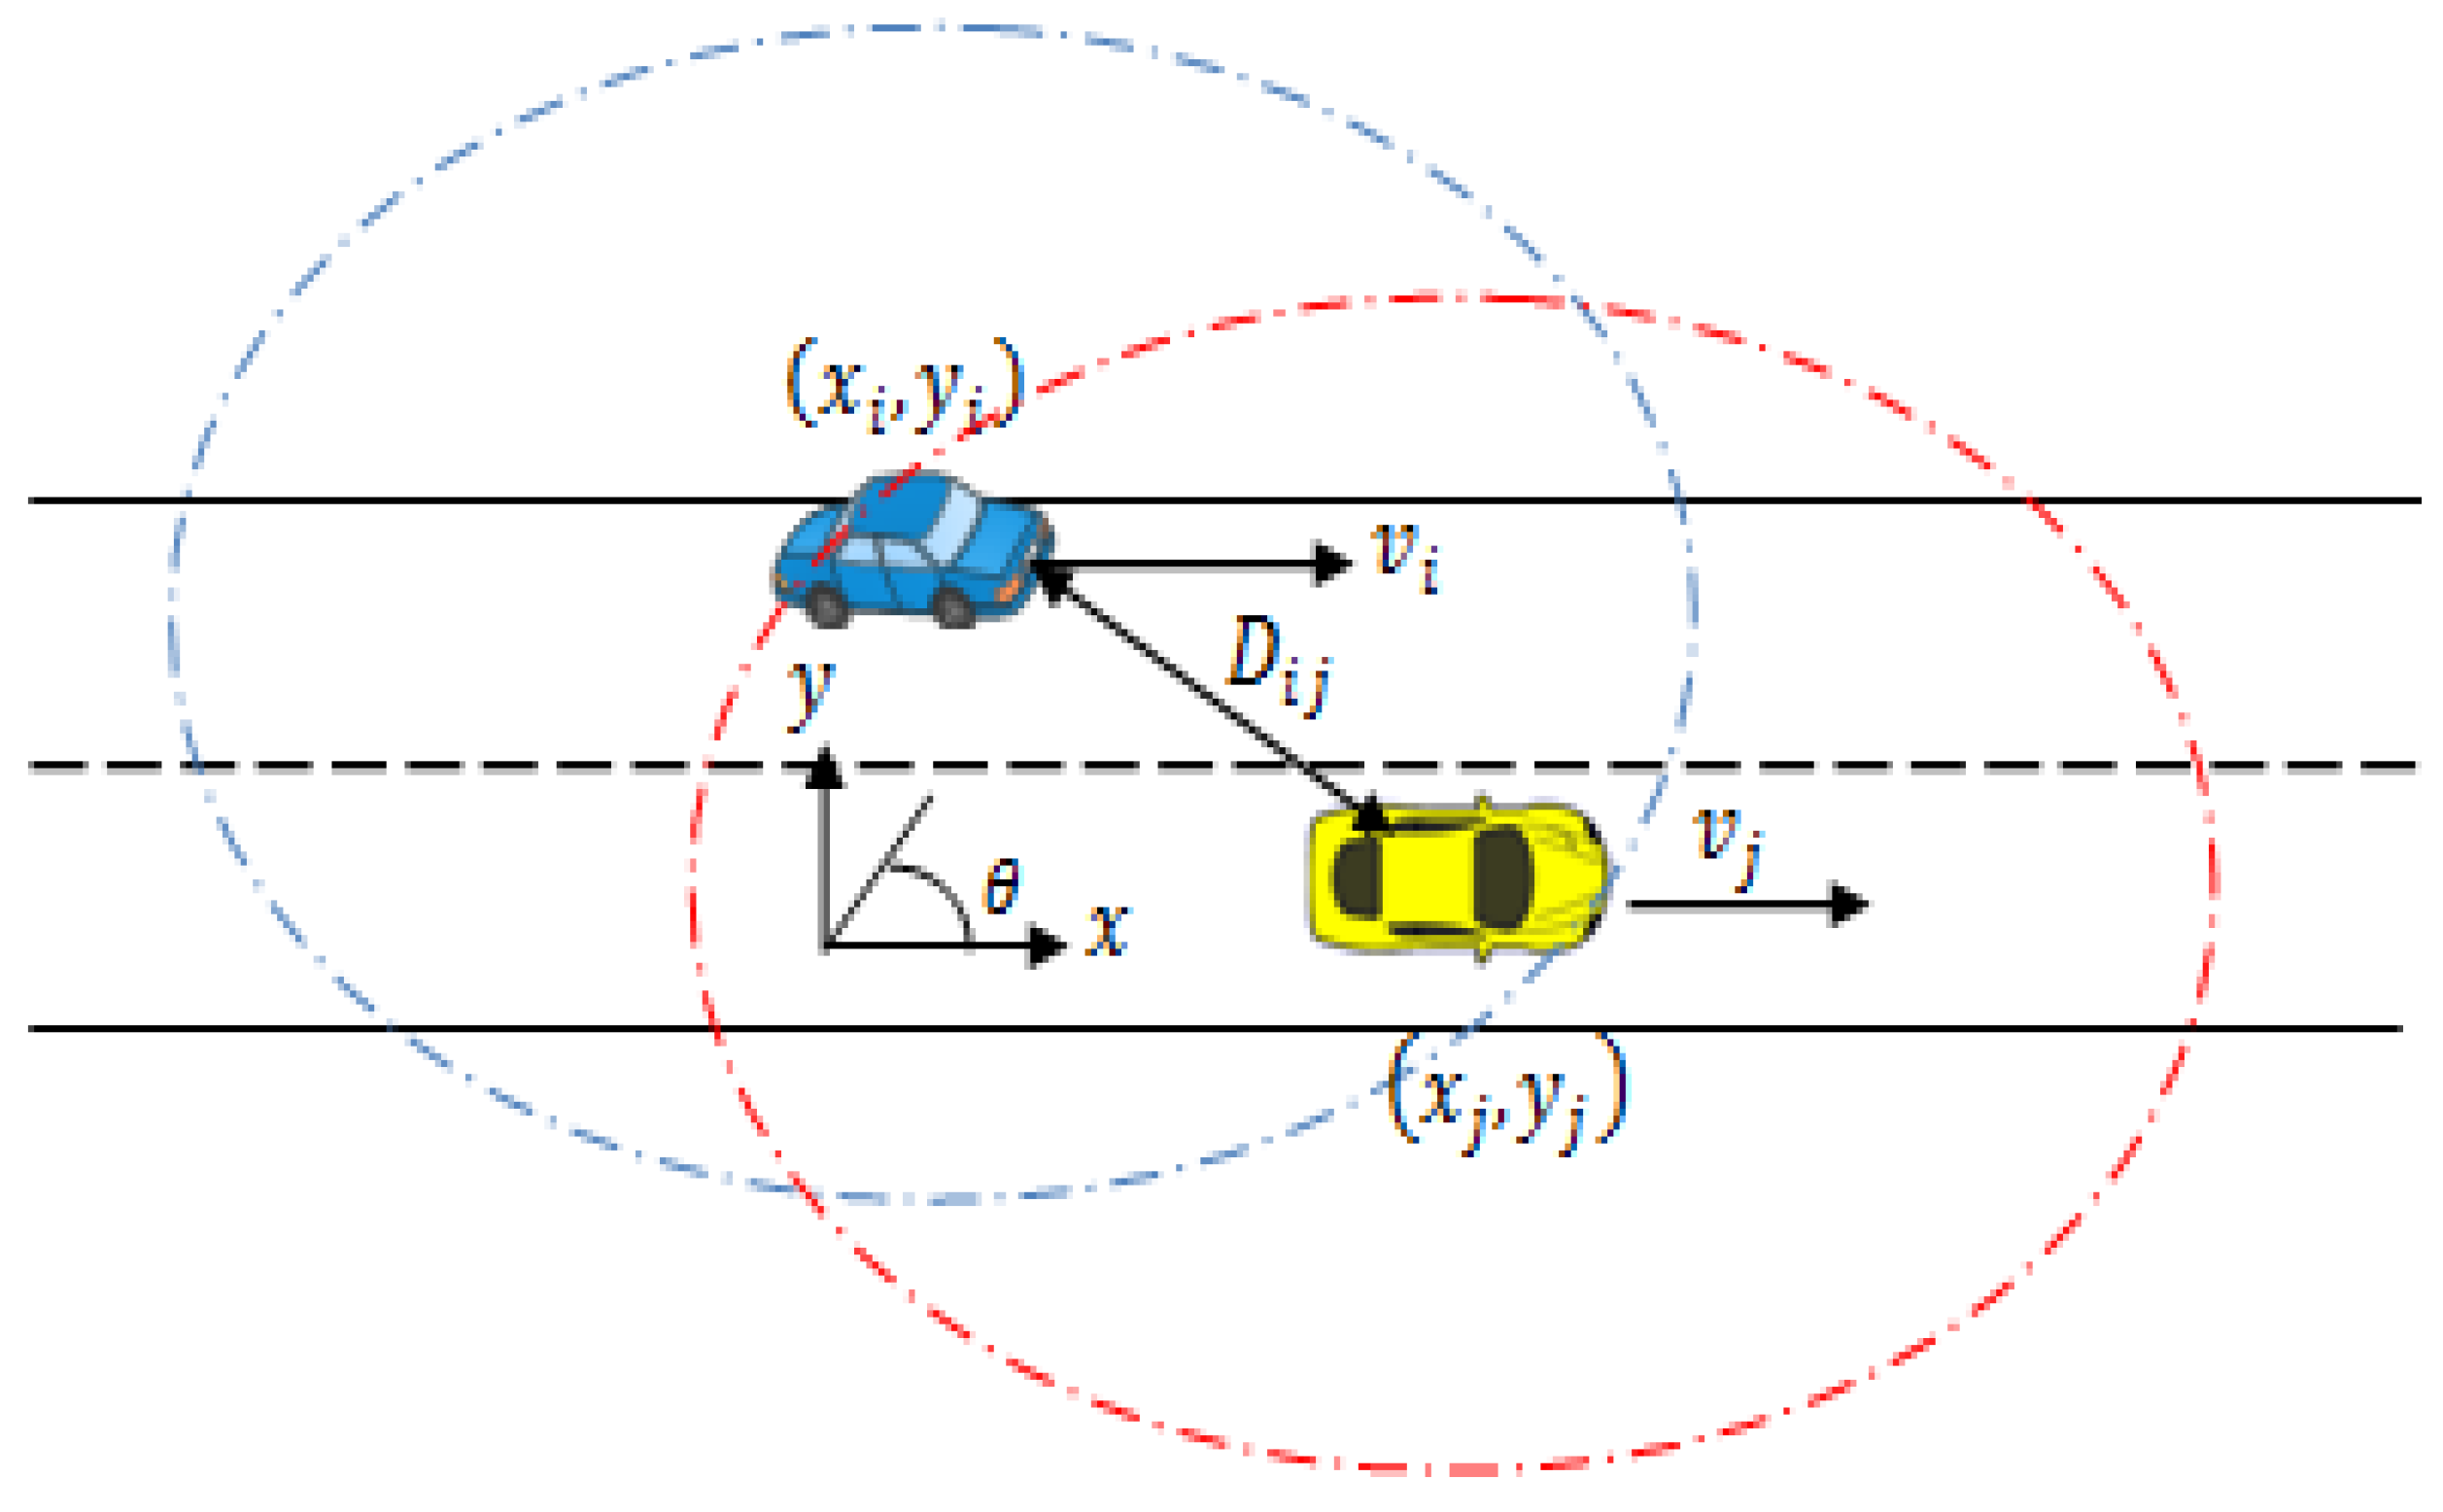
3.3.3. Distance between the IV and NV
3.3.4. Link Lifetime ()
3.4. Simple Adaptive Weight (SAW) Technique
3.4.1. Scaling Stage
3.4.2. Weighting Factor
3.5. Multi-Metric Gateway Selection Process
3.6. Gateway Advertisement Process
| Algorithm 2 Multimetrics gateway selection algorithm |
| 1: The IV search for the NV in its IEEE 802.11p coverage area by sending GWreq message 2: for each NV←1 to r do 3: if > then 4: NV sends GWrep with four metrics ,, and 5: Ignore the duplication message from the same source 6: else 7: Drop the message 8: end if 9: end for 10: IV receive GWrep 11: IV compute the scale metric Xi 12: for each metric of the NV where do 13: ifthen 14: 15: else 16: ifthen 17: 18: end if 19: The IV computes the weight of each NV using 20: end for 21: IV selects the GW with the maximum weight 22: The request from the IV is transmitted to the GW |
3.7. Gateway Maintenance Process
| Algorithm 3 Existing gateway selection |
| 1: The new IV checks for the existing gateway in the coverage area 2: if MGW is FOUND && is not expired then 3: The new IV will transmit the request to the existing gateway 4: else 5: Call Algorithm 2 6: end if |
4. Simulation Experiment Settings
4.1. Packet Delivery Ratio (PDR)
4.2. Throughput
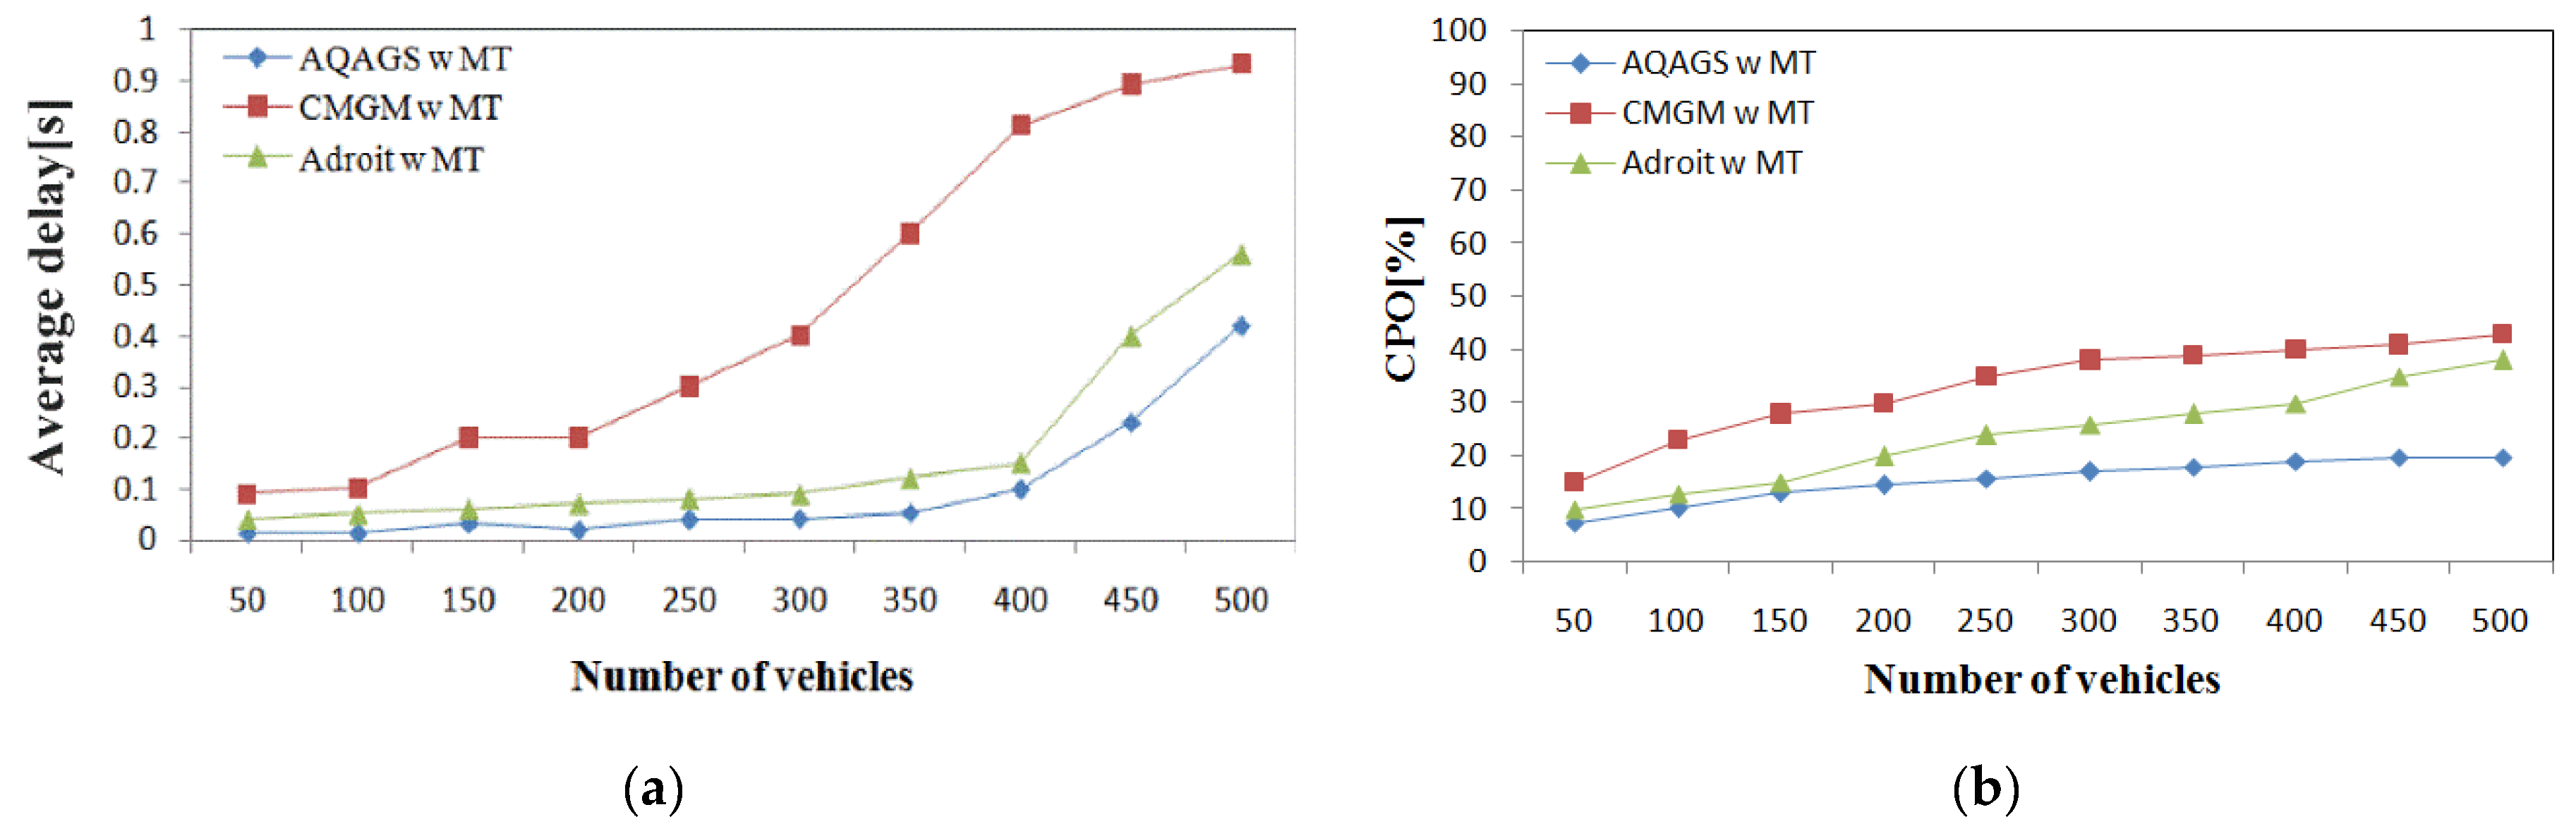
4.3. Average Delay
4.4. Control Packet Overhead (CPO)
5. Results and Discussions
5.1. Evaluation of Fixed Vehicle Applications versus Number of Vehicles
5.2. Evaluation of Mixed Vehicle Applications versus Number of Vehicles
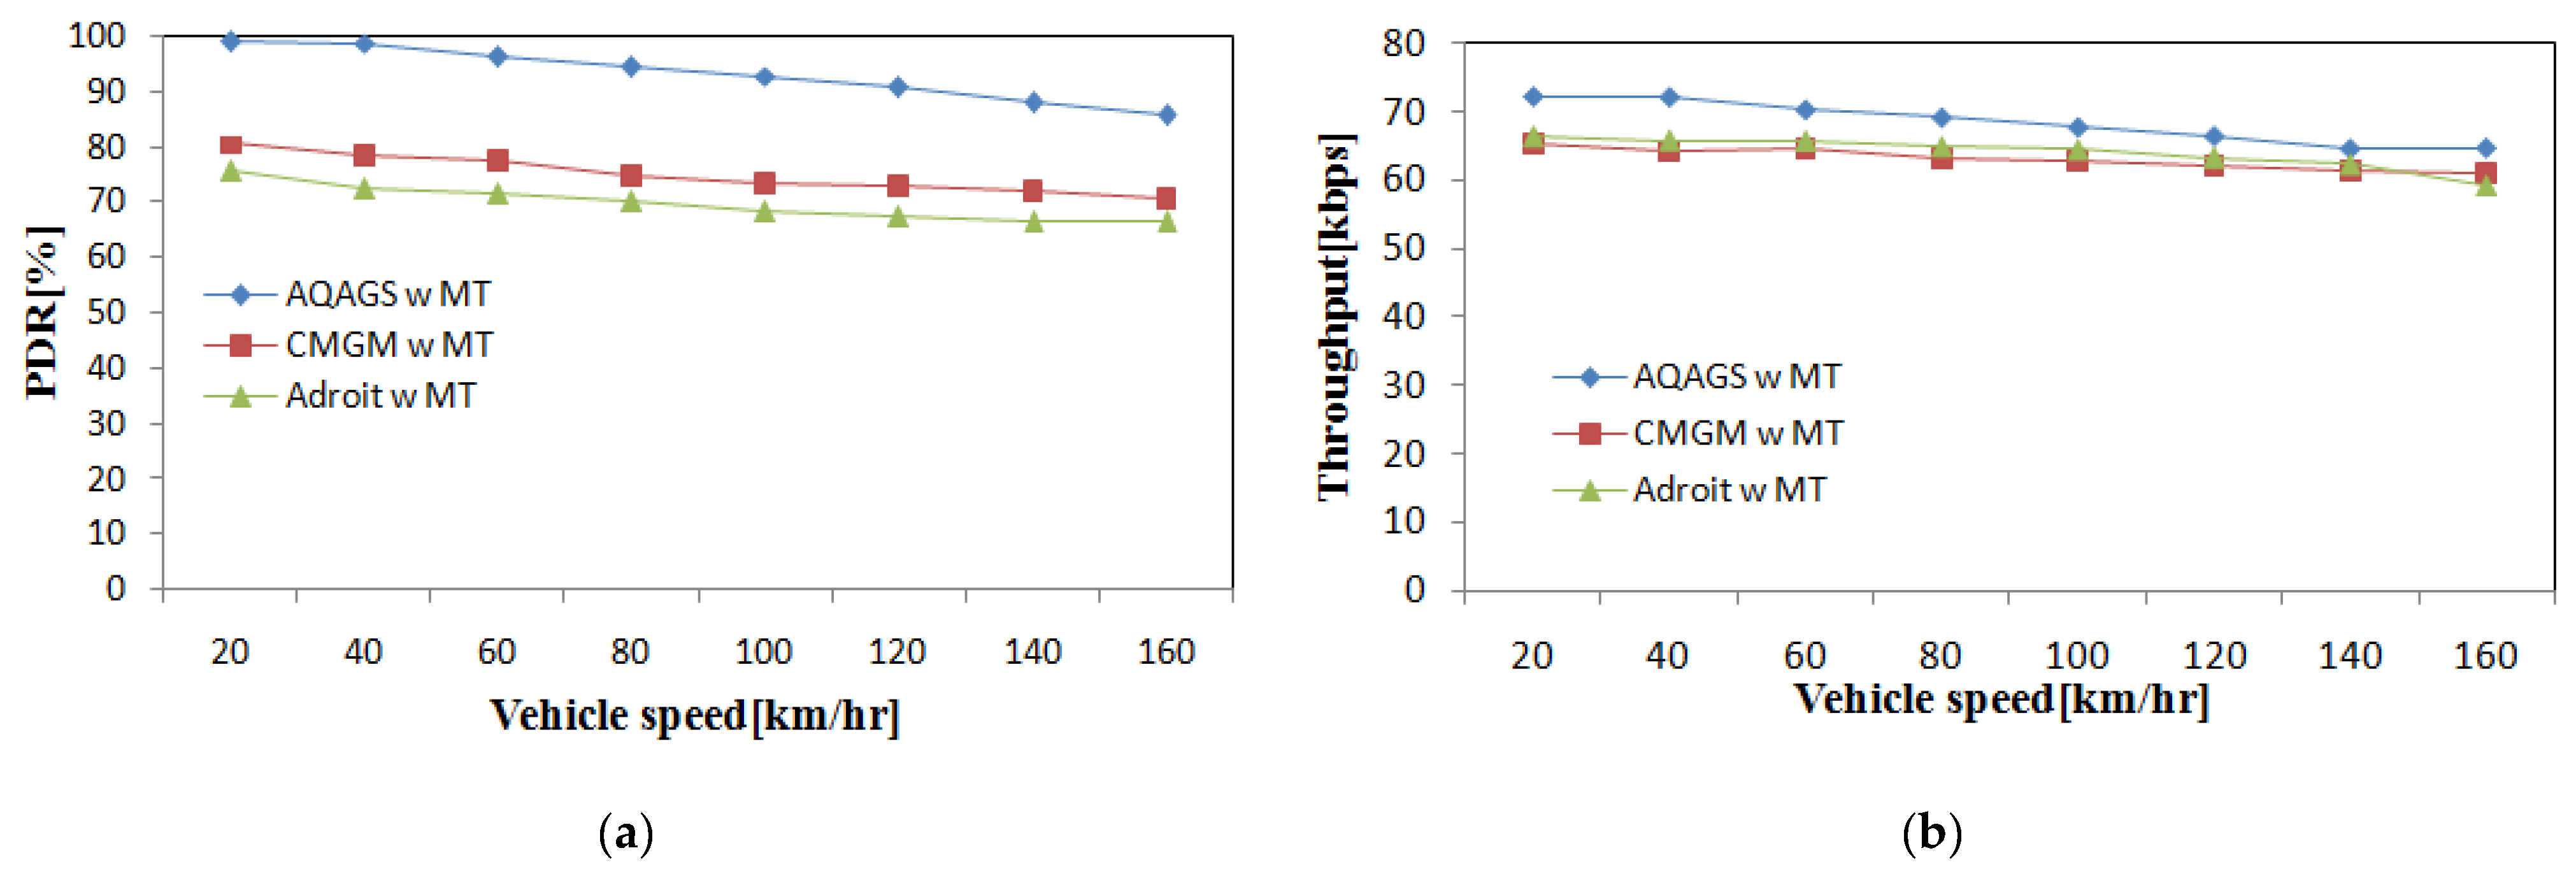
5.3. Evaluation of Mixed Vehicle Applications versus Vehicle Speed
6. Conclusions and Future Work
Author Contributions
Funding
Institutional Review Board Statement
Informed Consent Statement
Data Availability Statement
Acknowledgments
Conflicts of Interest
References
- Faye, S.; Chaudet, C. Characterizing the Topology of an Urban Wireless Sensor Network for Road Traffic Management. IEEE Trans. Veh. Technol. 2015, 65, 5720–5725. [Google Scholar] [CrossRef]
- Sharef, B.T.; Alsaqour, R.A.; Ismail, M. Vehicular communication ad hoc routing protocols: A survey. J. Netw. Comput. Appl. 2014, 40, 363–396. [Google Scholar] [CrossRef]
- Alawi, M.; Sundararajan, E.; Alsaqour, R.; Ismail, M. QoS-enable gateway selection algorithm in heterogeneous vehicular network. In Proceedings of the 2017 6th International Conference on Electrical Engineering and Informatics (ICEEI), Kedah, Malaysia, 25–27 November 2017; pp. 1–6. [Google Scholar]
- Mchergui, A.; Moulahi, T.; Zeadally, S. Survey on Artificial Intelligence (AI) techniques for Vehicular Ad-hoc Networks (VANETs). Veh. Commun. 2021, 34, 100403. [Google Scholar] [CrossRef]
- Kreßel, U.; Schwertberger, W. AKTIV–experiencing the future together. In Proceedings of the Tagung Aktive Sicherheit durch Fahrerassistenz, Berlin, Germany, 27–28 November 2008. [Google Scholar]
- Tahir, M.N.; Leviäkangas, P.; Katz, M. Connected Vehicles: V2V and V2I Road Weather and Traffic Communication Using Cellular Technologies. Sensors 2022, 22, 1142. [Google Scholar] [CrossRef] [PubMed]
- ETSI. 102 638 Technical Report, V1. Intelligent Transport Systems (ITS), Vehicular Communications (VC), Basic Set of Applications, Definitions. 2009. Available online: http://www.etsi.org (accessed on 21 December 2021).
- Ahmed, S.A.; Ariffin, S.H.; Fisal, N. Overview of wireless access in vehicular environment (WAVE) protocols and standards. Environment 2013, 7, 8. [Google Scholar] [CrossRef]
- Li, Y.J. An overview of the DSRC/WAVE technology. In Proceedings of the International Conference on Heterogeneous Networking for Quality, Reliability, Security and Robustness, Shenzhen, China, 22–23 November 2010; pp. 544–558. [Google Scholar]
- Peng, J.; Li, S.; Dou, Z.; Yang, S. Optimization Design and Performance Analysis of Improved IEEE802.11p MAC Mechanism Based on High Mobility of Vehicle. Math. Probl. Eng. 2022, 2022, 1–14. [Google Scholar] [CrossRef]
- Sangaiah, A.K.; Ramamoorthi, J.S.; Rodrigues, J.J.P.C.; Rahman, A.; Muhammad, G.; Alrashoud, M. LACCVoV: Linear Adaptive Congestion Control with Optimization of Data Dissemination Model in Vehicle-to-Vehicle Communication. IEEE Trans. Intell. Transp. Syst. 2020, 22, 5319–5328. [Google Scholar] [CrossRef]
- The Institute of Electrical and Electronics Engineers (IEEE). Part 11: Wireless LAN Medium Access Control (MAC) and Physical Layer (PHY) Specifications. ANSI/IEEE Std.802.11, (a.k.a. ISO/IEC 8802-11:1999(E)). Available online: http://standards.ieee.org (accessed on 15 January 2022).
- Zheng, K.; Hou, L.; Meng, H.; Zheng, Q.; Lu, N.; Lei, L. Soft-defined heterogeneous vehicular network: Architecture and challenges. IEEE Netw. 2016, 30, 72–80. [Google Scholar] [CrossRef]
- Barnett, T.; Jain, S.; Andra, U.; Khurana, T. Cisco visual networking index (vni) complete forecast update, 2017–2022. Americas/EMEAR Cisco Knowledge Network (CKN) Presentation 2018, pp. 1–30.
- Alawi, M.A.; Saeed, R.A.; Hassan, A.A.; Alsaqour, R.A. Simplified gateway selection scheme for multihop relay in vehicular ad hoc network. Int. J. Commun. Syst. 2013, 27, 3855–3873. [Google Scholar] [CrossRef]
- Belamri, F.; Boulfekhar, S.; Aissani, D. A survey on QoS routing protocols in Vehicular Ad Hoc Network (VANET). Telecommun. Syst. 2021, 1–37. [Google Scholar] [CrossRef]
- Watfa, M. Advances in Vehicular Ad-Hoc Networks: Developments and Challenges: Developments and Challenges; IGI Global: Hershey, PA, USA, 2010. [Google Scholar]
- SF.1486. Sharing Methodology between Fixed Wireless Access Systems in the Fixed Service and Very Small Aperture Terminals in the Fixed-Satellite Service in the 3400–3700 MHz Band; ITU-R SF.1486; International Telecommunication Union Radiocommunication Sector (ITU-R): Geneva, Switzerland, 2010. [Google Scholar]
- Karunathilake, T.; Förster, A. A Survey on Mobile Road Side Units in VANETs. Vehicles 2022, 4, 482–500. [Google Scholar] [CrossRef]
- Gillani, M.; Niaz, H.A.; Farooq, M.U.; Ullah, A. Data collection protocols for VANETs: A survey. Complex Intell. Syst. 2022, 1–30. [Google Scholar] [CrossRef]
- Eltahir, A.A.; Saeed, R.A.; Mukherjee, A.; Hasan, M.K. Evaluation and analysis of an enhanced hybrid wireless mesh protocol for vehicular ad hoc network. EURASIP J. Wirel. Commun. Netw. 2016, 2016, 169. [Google Scholar] [CrossRef]
- Benslimane, A.; Taleb, T.; Sivaraj, R. Dynamic Clustering-Based Adaptive Mobile Gateway Management in Integrated VANET—3G Heterogeneous Wireless Networks. IEEE J. Sel. Areas Commun. 2011, 29, 559–570. [Google Scholar] [CrossRef]
- Zhioua, G.E.M.; Tabbane, N.; Labiod, H.; Tabbane, S. A Fuzzy Multi-Metric QoS-Balancing Gateway Selection Algorithm in a Clustered VANET to LTE Advanced Hybrid Cellular Network. IEEE Trans. Veh. Technol. 2014, 64, 804–817. [Google Scholar] [CrossRef]
- P. 1546, I.-R.R. Method for Point-to-Area Predictions for Terrestrial Services in the Frequency Range 30 MHz to 3000 MHz; P.1546-4; International Telecommunication Union Radiocommunication Sector (ITU-R): Geneva, Switzerland, 2009. [Google Scholar]
- Bechler, M.; Wolf, L.; Storz, O.; Franz, W.J. Efficient discovery of Internet gateways in future vehicular communication systems. In Proceedings of the 57th IEEE Semiannual Vehicular Technology Conference, 2003, VTC 2003-Spring, Jeju, South Korea, 22–25 April 2003; pp. 965–969. [Google Scholar] [CrossRef]
- Thaenthong, J.; Gordon, S. Gateway Selection Architecture Using Multiple Metrics for Vehicular Networking. Inf. Technol. J. 2012, 11, 840–849. [Google Scholar] [CrossRef][Green Version]
- Ju, K.; Chen, L.; Wei, H.; Chen, K. An Efficient Gateway Discovery Algorithm with Delay Guarantee for VANET-3G Heterogeneous Networks. Wirel. Pers. Commun. 2014, 77, 2019–2036. [Google Scholar] [CrossRef]
- Dharanyadevi, P.; Venkatalakshmi, K. Proficient selection of gateway and base station by adroit algorithm in cloud-VMesh network. Int. J. Commun. Syst. 2016, 30, e3124. [Google Scholar] [CrossRef]
- Narten, T.; Nordmark, E.; Simpson, W.; Soliman, H. Neighbor Discovery for IP Version 6 (IPv6). 1998. Available online: https://www.rfc-editor.org/rfc/rfc4861.html. (accessed on 21 December 2021).
- Fouladian, M.; Hendessi, F.; Pourmina, M.A. Using AHP and Interval VIKOR Methods to Gateway Selection in Integrated VANET and 3G Heterogeneous Wireless Networks in Sparse Situations. Arab. J. Sci. Eng. 2015, 41, 2787–2800. [Google Scholar] [CrossRef]
- Opricovic, S.; Tzeng, G.-H. Compromise solution by MCDM methods: A comparative analysis of VIKOR and TOPSIS. Eur. J. Oper. Res. 2004, 156, 445–455. [Google Scholar] [CrossRef]
- Idrissi, A.; Retal, S.; Rehioui, H.; Laghrissi, A. Gateway selection in vehicular ad-hoc network. In Proceedings of the 2015 5th International Conference on Information & Communication Technology and Accessibility (ICTA), Marrakech, Morocco, 21–23 December 2015; pp. 1–5. [Google Scholar]
- Brans, J.-P.; Vincke, P. Note—A Preference Ranking Organisation Method: (The PROMETHEE Method for Multiple Criteria Decision-Making). Manag. Sci. 1985, 31, 647–656. [Google Scholar] [CrossRef]
- Chen, K.; Chen, L.; Mao, J.; Zhao, D. A multiple metrics gateway selection algorithm for vehicular ad hoc networks in fading channels. In Proceedings of the 2013 Ninth International Conference on Computational Intelligence and Security, Washington, DC, USA, 14–15 December 2013; pp. 648–652. [Google Scholar]
- Setiawan, F.P.; Bouk, S.H.; Sasase, I. An Optimum Multiple Metrics Gateway Selection Mechanism in MANET and Infrastructured Networks Integration. In Proceedings of the IEEE Wireless Communications and Networking Conference, Las Vegas, NV, USA, 31 March–3 April 2008; pp. 2229–2234. [Google Scholar] [CrossRef]
- Damnjanovic, A.; Montojo, J.; Wei, Y.; Ji, T.; Luo, T.; Vajapeyam, M.; Yoo, T.; Song, O.; Malladi, D. A survey on 3GPP heterogeneous networks. IEEE Wirel. Commun. 2011, 18, 10–21. [Google Scholar] [CrossRef]
- Bouk, S.H.; Sasase, I. Multiple end-to-end QoS metrics gateway selection scheme in Mobile Ad hoc Networks. In Proceedings of the 2009 International Conference on Emerging Technologies, Islamabad, Pakistan, 19–20 October 2009; pp. 446–451. [Google Scholar] [CrossRef]
- Namboodiri, V.; Gao, L. Prediction-Based Routing for Vehicular Ad Hoc Networks. IEEE Trans. Veh. Technol. 2007, 56, 2332–2345. [Google Scholar] [CrossRef]
- Cardote, A.; Sargento, S.; Steenkiste, P. On the connection availability between relay nodes in a VANET. In Proceedings of the 2010 IEEE Globecom Workshops, Miami, FL, USA, 6–10 December 2010; pp. 181–185. [Google Scholar] [CrossRef]
- Tran, P.N.; Boukhatem, N. Comparison of MADM decision algorithms for interface selection in heterogeneous wireless networks. In Proceedings of the 2008 16th International Conference on Software, Telecommunications and Computer Networks, Split, Croatia, 25–27 September 2008; pp. 119–124. [Google Scholar] [CrossRef]
- Stevens-Navarro, E.; Martínez-Morales, J.D.; Pineda-Rico, U. Evaluation of Vertical Handoff Decision Algorightms Based on MADM Methods for Heterogeneous Wireless Networks. J. Appl. Res. Technol. 2012, 10. [Google Scholar] [CrossRef]
- Krajzewicz, D.; Erdmann, J.; Behrisch, M.; Bieker, L. Recent development and applications of SUMO-Simulation of Urban MObility. Int. J. Adv. Syst. Meas. 2012, 5, 128–138. [Google Scholar]
- Fall, K.; Varadhan, K. The Network Simulator–NS. Available online: http://isi.edu/nsnam/ns/2007 (accessed on 21 December 2021).
- Baldo, N.; Maguolo, F.; Miozzo, M.; Rossi, M.; Zorzi, M. ns2-MIRACLE: A modular framework for multi-technology and cross-layer support in network simulator 2. In Proceedings of the 2nd International Conference on Performance Evaluation Methodologies and Tools, Nantes, France, 22–27 October 2007. [Google Scholar] [CrossRef]
- Murray, T.; Murray, T.; Cojocari, M.; Fu, H. Measuring the performance of IEEE 802.11 p using ns-2 simulator for vehicular networks. In Proceedings of the 2008 IEEE International Conference on Electro/Information Technology, Ames, IA, USA, 18–20 May 2008; pp. 498–503. [Google Scholar]
- Chen, S.; Tang, Y. Slowing down internet worms. In Proceedings of the 24th International Conference on Distributed Computing Systems, Tokyo, Japan, 23–24 March 2004; pp. 312–319. [Google Scholar]
- Dharanyadevi, P.; Venkatalakshmi, K. Proficient routing by adroit algorithm in 5G-Cloud-VMesh network. EURASIP J. Wirel. Commun. Netw. 2016, 2016, 1228. [Google Scholar] [CrossRef]
- GPP. 3GPP TS 23.203 V12.0.2013. Available online: https://portal.3gpp.org/#/ (accessed on 21 December 2021).


| Authors | Technique | GWD Technique | GWS Parameters | Selection Technique | Simulator | Drawbacks |
|---|---|---|---|---|---|---|
| [27] | Non-Cluster | Hybrid | Velocity, inter-vehicle distance | Pairwise comparison | Customer | Huge loads are exerted on the selected gateway due to the limited number of gateways available. Willingness of the selected vehicle to act as a gateway need further investigation |
| [26] | Non-cluster | Proactive | Number of hops, throughput, traffic load, route expiration time | SAW | MATLAB | Fixed gateways are used, increasing the number of handovers due to the high speed of the vehicles. This leads to frequency network disconnection, which makes seamless connection difficult to achieve |
| [30] | Non-Cluster | Reactive | Mobility, direction cost of packet, number of hops, RSS, position, delay, throughput, packet jitter, packet loss rate, network security | VIKOR | NS2 | The computation complexity of this method is not measured |
| [32] | Non-Cluster | Reactive | Speed, direction, position, radio transmission range, gateway load | PROMETHEE | Customer | The overloading condition of the base station before GWS is not determined |
| [34] | Non-cluster | Reactive | Correctly decoded probability, gateway delay time, velocity relative to gateway | SAW | MATLAB | The work only considers vehicles moving in the same direction, movements of opposing directions are not taken into account |
| [36] | Cluster | Hybrid | RSS, available route capacity, link stability | SAW | NS2 | Cluster stability and maintenance issues are not addressed |
| [28] | Non-Cluster | Hybrid | RSS, number buffering packets, distance | Fitness value functions | NS2 | The overloading condition of the base station before GWS is not determined |
| [37] | Cluster | Hybrid | RSS, buffering queue load, link connectivity duration | Fuzzy logic | NS2 | This work does not differentiate between standard video and high-Quality video High quality needs high QoS |
| [38] | Non-cluster | Hybrid | RSS, route lifetime, available route capacity | SAW | NS2 | The scheme did not take into consideration the overload issues when all vehicles were allowed to directly connect to the UMTS network |
| [39] | Cluster-based | Reactive | link lifetime, distance, mobility, price | Price-based selection function | Customer | High weight is given to the price factor rather than the network performance factors |
| [40] | Non-cluster | Hybrid | RSS, route lifetime | RSS indicator function | NS2 | The research only focuses on non-safety applications, such as audio, video streaming, or gaming Safety applications are not taken into consideration |
| [41] | Cluster-based | Hybrid | RSS, mobility speed, link stability | SAW | NS2 | The scheme shows higher complexity due to the unstable cluster formation |
| [22] | Cluster-based | Hybrid | Direction, RSS, IEEE802.11p wireless transmission range. | SAW | NS2 | Clusters are not stable and need to be re-formulated every second |
| [15] | Cluster-based | Hybrid | UMTS RSS, speed, IEEE802.11p transmission range | SAW | NS2 | The clustering formation proposed in this design guidelines results in huge network overhead due to the dynamic nature of this architecture |
| [42] | Non-cluster | Reactive | RSS, route lifetime | RSS indicator function | NS2 | The research work only focuses on non-safety applications such as audio, video streaming, or gaming Safety applications are not taken into consideration |
| [43] | Non-Cluster | Reactive | Link lifetime | Link lifetime indicator | Customer | Bottleneck on the selected route due to the single parameter used for selecting the best route. Many potential routes left undiscovered |
| [44] | Non-Cluster | Proactive | Gateway load, available bandwidth, gateways position, market information | Fuzzy logic | Customer | The protocol results in higher overhead especially when the number of Internet gateways is high. This is due to the number of advertisement packets that are normally geocast by each gateway. |
| QCI | Application Type | Carrier Type | Priority | Average Delay |
|---|---|---|---|---|
| 1 | VoIP | Guaranteed Bit Rate (GBR) | 2 | 100 ms |
| 6 | FTP | Non-Guaranteed Bit Rate (Non-GBR) | 6 | 300 ms |
| Parameter | Type of Criterion | Possible Values |
|---|---|---|
| Positive | 0–1 | |
| Positive | 0–1 | |
| Positive | 0–1 | |
| Negative | 0–1 |
| Parameter | Possible Values |
|---|---|
| Type of road | Highway |
| No. of lanes | 2 |
| Maximum speed | 20–160 km/h |
| No. of vehicles | 50–500 |
| Physical/MAC protocols | IEEE 802.11p |
| 300 m | |
| 802.11p data rate | 11 Mbps |
| Interface queue type | Drop Tail/PriQueue |
| Interface queue length | 50 Packets |
| Gateway broadcast timer | 1 s |
| Antenna type | Antenna/OmniAntenna |
| Application type | FTP, VoIP |
| FTP packet size | 1000 bytes |
| VoIP packet size | 160 bytes |
| The data rate of FTP | 0.3 Mbps |
| The data rate of VoIP | 0.064 Mbps |
| 80% | |
| TTL | 1 s |
| Simulation period | 500 s |
| Stop time | to 3 s |
| Parameter | Possible Values |
|---|---|
| Physical layer protocol | LTE |
| Carrier frequency | 2 GH |
| eNB trans power | 42 dBm |
| Queue/LTEQueue QoS | True |
| Source/GWC- eNB link (Data rate) | 10 Mbps |
| Source/GWC- eNB link (LTEQueue type) | ULAirQueue |
| eNB-Serving GW link (Data rate) | 1000 Mbps |
| eNB-Serving GW link (LTEQueue type) | ULSIQueue |
| Number of eNBs | 4 |
| System loss | 1 dB |
| LTE RSS threshold | −94 dBm |
| Node B interface queue length | 50 packets |
| Transmitter/Receiver antenna height (ht/hr) | 1.5/20 m |
| Transmitter/Receiver gain (Gt/Gr) | 1 dB/1 dB |
Publisher’s Note: MDPI stays neutral with regard to jurisdictional claims in published maps and institutional affiliations. |
© 2022 by the authors. Licensee MDPI, Basel, Switzerland. This article is an open access article distributed under the terms and conditions of the Creative Commons Attribution (CC BY) license (https://creativecommons.org/licenses/by/4.0/).
Share and Cite
Alawi, M.; Alsaqour, R.; Abdelhaq, M.; Alkanhel, R.; Sharef, B.; Sundararajan, E.; Ismail, M. Adaptive QoS-Aware Multi-Metrics Gateway Selection Scheme for Heterogenous Vehicular Network. Systems 2022, 10, 142. https://doi.org/10.3390/systems10050142
Alawi M, Alsaqour R, Abdelhaq M, Alkanhel R, Sharef B, Sundararajan E, Ismail M. Adaptive QoS-Aware Multi-Metrics Gateway Selection Scheme for Heterogenous Vehicular Network. Systems. 2022; 10(5):142. https://doi.org/10.3390/systems10050142
Chicago/Turabian StyleAlawi, Mahmoud, Raed Alsaqour, Maha Abdelhaq, Reem Alkanhel, Baraa Sharef, Elankovan Sundararajan, and Mahamod Ismail. 2022. "Adaptive QoS-Aware Multi-Metrics Gateway Selection Scheme for Heterogenous Vehicular Network" Systems 10, no. 5: 142. https://doi.org/10.3390/systems10050142
APA StyleAlawi, M., Alsaqour, R., Abdelhaq, M., Alkanhel, R., Sharef, B., Sundararajan, E., & Ismail, M. (2022). Adaptive QoS-Aware Multi-Metrics Gateway Selection Scheme for Heterogenous Vehicular Network. Systems, 10(5), 142. https://doi.org/10.3390/systems10050142