Article

A Novel Multi-Dimensional Analysis Approach to Teaching and Learning Analytics in Higher Education

Teaching and Learning Centre, Lingnan University, Hong Kong SAR, China
*
Author to whom correspondence should be addressed.
Systems 2022, 10(4), 96; https://doi.org/10.3390/systems10040096
Submission received: 4 May 2022 / Revised: 2 June 2022 / Accepted: 14 June 2022 / Published: 5 July 2022

Abstract

:
E-learning platforms are being used in higher education to liberate teaching and learning from the constraints of time, pace, and space. These platforms provide rich media content, collaborative assessment, and analytics tools and support learning through a variety of online possibilities. However, the focus of most of this research is on learning analytics inside e-learning platforms and does not cover other related institutional surveys and educator professional development activities. This paper outlines a novel conceptual approach for the creation of a teaching and learning data warehouse analytics system that utilizes a Multi-Dimensional Analysis approach to teaching and learning analytics across these e-learning platforms in combination with other institutional data sources, such as various institutional surveys, tracking of professional development activities, and analysis of the use of the learning management system. The novel teaching and learning data warehouse analytics system (TLDWAS) is being developed at Lingnan University, a leading liberal arts university in Hong Kong. The genesis of this project is analyzing large volumes of teaching and learning data and presenting a big picture for senior management to gain insight from massive amounts of student courses and teacher evaluation data, fill the research gaps mentioned above, and help educators identify problems and solutions more effectively. The TLDWAS provides a visual interface for identifying some indicators and storing, classifying, and analyzing teaching and learning data in various forms to generate statistics, analyze models, and identify meaningful patterns in the data in order to improve teaching and learning. The TLDWAS not only provides more evidence-based decision-making for senior management but is also capable of being applied to identify patterns and relations pertaining to students’ academic performance, usage of e-learning systems, and associated staff development activities.

1. Introduction

Learning analytics can be defined as, “the measurement, collection, analysis, and reporting of data about learners and their contexts at course level (e.g., assessment results from Learning Management System (LMS) and institutional level (e.g., data stored in student information systems, registry, financial systems, and institutional research units), for purposes of understanding and optimizing learning and the environments in which it occurs” [1]. Teaching and learning analytics has been recognized by [2] to be effective in analyzing the student life-cycle at the classroom, program, department, and university levels [2]. The teaching and learning data warehouse analytics system (TLDWAS) increases the effectiveness of this data analysis by including data sets across various institutional sources not usually combined. These can be drawn from the Learning Management System (LMS), institutional surveys, such as an Employer and Alumni survey, First year and Final year surveys, end of Course/Subject data assets, and finally, data available from teaching professional development activities, etc.
The vast amounts of tracking data generated by learning management systems can be used to study learning (or learner) behavior in all education sectors [3].To determine how pre-entry data predict attrition and academic performance, Refs. [4,5] present methodologies for analyzing big datasets from the LMS as proxies for student engagement analysis.
Some studies have adopted the use of data warehouses (DW) to analyze the decision-making behavior of students when using the LMS to formulate decisions with reference to their assessment [6]. The data captured by the data warehouses (DW) was drawn from students’ navigation of the LMS. In this instance, the reports generated by the DW related to student navigation and assessment were referred to as the Online Analytical Processing (OLAP) technique. This technique involved the Moodle Mining Tool and Educational Data Mining, Automated Data Extraction, etc. It was noted that the use of a data warehouse for analysis and reporting of this type of data was beneficial for improving the Learning Management System and relevant evaluation by students [7].
Some other works are related to the same subject, i.e., using DW techniques to analyze students’ behavior in an e-learning environment [8] or the application of Microsoft SQL Server Analysis Services (SSAS) to analyze the Web server log file [9]. The system developed by [10] is used to retrieve data pertaining to its popularity, nature of use, and the engagement of the participants from the logs by analyzing eLearning environments’ web logs for knowledge discovery.
Inspired by current research, this study explores the novel teaching and learning data warehouse analytics system by answering the following research question: How to set up an analysis framework for integrating e-learning platforms data, various institutional surveys, educator professional development activities data, etc., for senior management to view the entire teaching and learning cycle from students’ perspectives, including their applications, admission procedures, registration process, and academic progress/status until their graduation. Following up on this, the study as a pilot research project will move liberal arts education institutions towards more evidence-based and data-informed decision-making by providing structured and one-stop data, as well as a strategic decision support system, with the following advantages:
  • Allow teachers/senior management to quickly access vital teaching and learning data from sources all in one place;
  • Provide relational information to create snapshots of teaching and learning performance for teaching and learning quality improvement;
  • Provide the interface for users to analyze different time periods and trends to make future predictions on teaching and learning changes;
  • Expand capabilities for deeper insights and more robust analysis of teaching and learning performance;
  • Develop visualizations and forward-looking business intelligence from big teaching and learning data;
  • Offer “what-if” scenarios to inform practical decisions based on more comprehensive analysis.
This paper, firstly, recapitulates recent research in teaching and learning analytics in Section 2 and describes the benchmark of existing DW practices in Section 3. The multi-dimensional analysis approach and a detailed system design are described in Section 4. We conclude with the contribution of this study in Section 5.

2. Literature Review

A data warehouse (DW) is a collection of extensive data with its tools and technologies experiencing massive growth during the 21st century, which is manifested by the increased amount of educational data that has been continually collected in the fields of teaching, learning, and assessment, etc. [11]. For example, it has been implemented to solve various types of problems in the education field [12]. According to the works by [13], a data warehouse is characterized by subject-oriented, integrated, time-varying, and non-volatile data collections (p. 2). No matter what features a data warehouse holds, its design must support the queries for which it is being used [14]. Motivated by the increasing number of students entering higher education, education institutions need massive amounts of data, which necessitates analysis in order to improve the quality of teaching. The higher education environment is becoming more complex and competitive, no matter whether between private higher education institutions or public ones. Responding to growing expectations from students and their parents, higher education institutions require prompt action in the provision of their teaching and learning strategies to ensure their competitiveness [13].
As an efficient tool to gather all company data in one place, data warehouses could offer tremendous support to different sections of education institutions, such as teachers, learning system developers, and administrators. The data, if properly analyzed and categorized, would be capable of presenting an overall picture and possibly neglected details of the institution’s operations, thus offering a better understanding of the needs of learners and, thereby, helping to improve their performance [15]. Several countries have established their own systems to govern and administrate higher education, thus ensuring quality during their teaching and learning processes.
According to [16], twenty years ago, in order to review institutional practices concerning the assessment of student learning quality and outcomes, America set up the quality assurance principal mechanism in higher education. Following their policy, scores of new quality assurance agencies and practices have been developed worldwide. However, traditional analytics in learning quality assurance are unable to handle the load of such massive and diverse data nowadays [17]. An examination of previous research proves that data warehousing is widely implemented in the education industry to support decision-making as well as analytical activities in terms of didactics, research, and management [18]. Ref. [19] presented a design model for building a data warehouse for a typical university with four stages of data migration to complete preparation of storing and sorting academic documents for university accreditation.
Previous research has shown that data warehouses could contribute to teaching and learning quality assurance in different aspects. Various studies have been conducted to measure academics’ performance based on student evaluation, and these have indicated that evaluation plays a significant role in academics’ promotion and decision-making [20,21,22]. However, the analysis of these massive amounts of data in an efficient way has been a pending issue in conducting teacher evaluations. The study conducted by [6] presented the usage of a data warehouse (DW) in analyzing students’ behavior on the e-learning platform to make decisions concerning their assessment. The works by [23] have analyzed the possibility of designing a data warehouse for quality assurance in evaluating lecturer performance. Lecturers play a key role in higher education because they are responsible for planning and implementing the learning process, teaching, and assessing learning and training results. Besides, they have direct contact with students, and, to quite a large extent, the quality of their interaction plays a highly decisive role in the overall learning experience and performance of the students. In designing a better higher education system and environment, a corresponding data warehouse is a precious asset and technical support to facilitate the accessibility of information (for system designers, the policymaker, and lecturers to reflect and improve). As Ref. [17] noted, the data warehouse supports the decision system. Data warehouses could be applied in building Decision Support Systems to provide solutions to top-level management to effectively enable them to grasp the university’s learning and teaching conditions. Wise decision-making is a crucial factor in ensuring learning quality during the administrative process, and this is definitely achievable if a data warehouse is utilized during the decision-making process [24].
With the rapid development of IT, scholars try to use various data analysis technologies and visualization methodologies in higher education, especially in teaching and learning-related fields. Scholars [25] carried out a systematic review of learning analytic visualizations and concluded that, despite a voluminous amount of work done in the field, studies that employ sophisticated visualizations while engaged deeply with educational theories are not sufficient (p. 129). The works by [26] describe how to implement the adaptivity technology in a specific Open Source LMS using the data mining technology to help develop e-learning methodologies. A Microsoft business intelligence (BI) solution is proposed by [27] to help educators identify the less-able students during the early stages of a course module by using the Moodle user log data. Ref. [28] proposed a scalable data warehouse system architecture for easier data management and access. Ref. [29] introduces the implementation process of a data warehouse at Waist University to improve admission and examination processes. Furthermore, the recent data warehouse applications in education are summarized by [30,31] to help institutions explore various methods to mine the teaching and learning data.
Given the growing demands from educators, especially program leaders and policymakers at senior management level, an efficient solution utilizing current data analytics is needed. In this paper, researchers present a multi-dimensional analysis approach-based data warehouse system to provide more evidence-based decision-making for senior management, improve student-centered instruction, foster close teacher-student relationships, enrich campus activities, and promote cross-border mobility and cross-cultural experiences. This system aims to provide an easy and effective visualization for relevant administrators and policymakers so that they are able to identify issues promptly, adjust policies, and take the necessary action to improve and enhance teaching and learning strategies. Furthermore, the system may also be applied to identify extraordinary patterns and relations between students’ academic performance, usage of e-learning systems, and the knowledge levels of students.

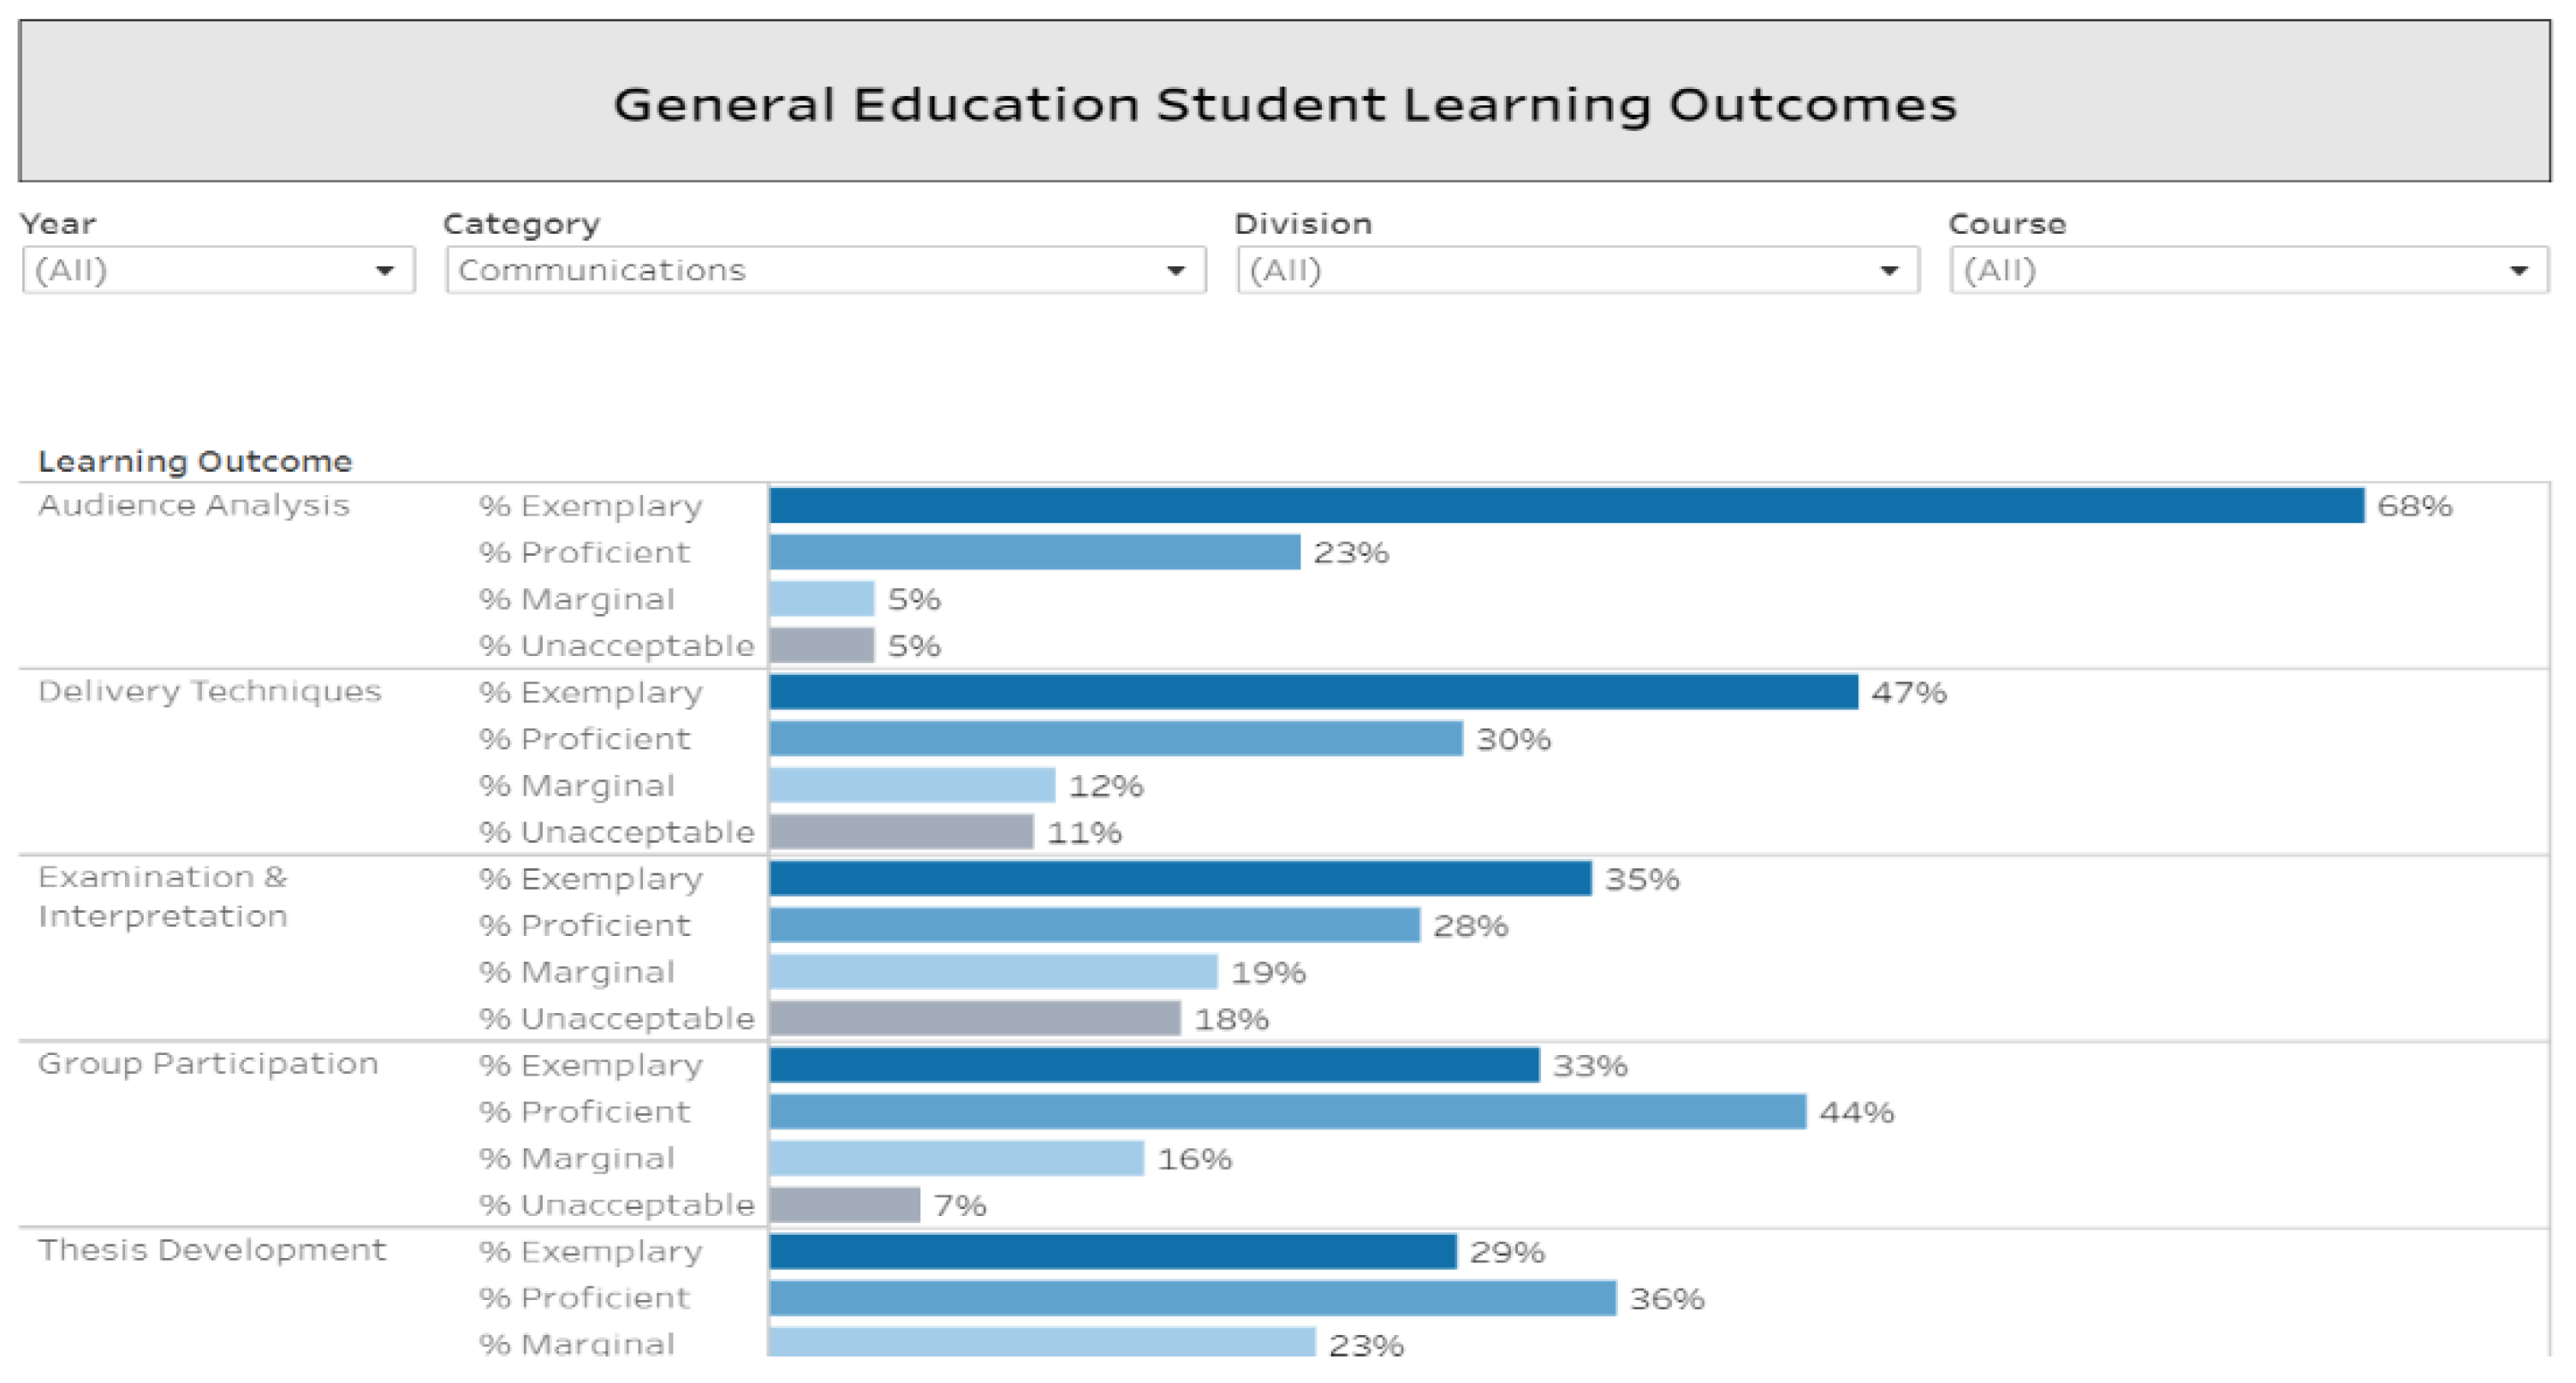
3. Benchmark of International Practices

In recent years, a variety of teaching and learning analytics systems are being used in higher education courses. For instance, an institutional effectiveness dashboard has been developed by [32] that involves the entire institution in the assessment of the college’s performance on key indicators, referred to as Institutional Effectiveness Measures (IEMs). For example, SAT scores are included in the student data book dashboards developed by [33], which present students’ SAT score distributions by faculty, program, and year, as shown in Figure 1.
Graduate Student Experience, an important aspect of teaching and learning information, is a comprehensive, longitudinal study designed to help answer questions about the potential relationship between students’ outcomes, program characteristics, and graduates’ experiences at the University of California, San Diego [34]. The dashboard developed by [34] seeks to gain a greater understanding of their students as well as their experiences in terms of their behaviors.
For improving teaching and learning through meaningful assessment, visualization of the student’s assessment is a fundamental aspect. Truckee Meadows Community College (TMCC) developed a powerful dashboard of students’ general education assessments [35]. The system helps TMCC faculty and staff to document and discuss courses that are offered and plan how they can make them even better in the future. This dashboard provides 3 years of Student Learning Outcomes (SLO) data. It can be disaggregated by year, Division, SLO category, and course (Figure 2).
Enrollment data, Degrees Awarded, Retention, Student Credit Hours, Faculty, and General Education are developed in the Institutional and Departmental Dashboards at the University of Tennessee at Chattanooga (UTC) [36]. The dashboards represent a multi-year summary of UTC and its colleges, departments, and programs. A dashboard about student experience/Satisfaction Survey is developed in Power BI by the New Jersey Institute of Technology [37]. It covers Academic Satisfaction, Campus Satisfaction, Resources Satisfaction, and Services Satisfaction.
The University of South Dakota (USD) Student Satisfaction Dashboard [38] summarises data collected from all recent administrations of the Ruffalo Noel Levitz Student Satisfaction Inventory (SSI) survey. Users can explore all individual survey items or view items related to particular themes only. A dashboard, developed by SUNY Buffalo State College [39], contains various student opinion surveys. The dashboard is a wide representation of students’ perceptions, including perceptions of prejudice, campus climate satisfaction, and institutional contributions to student personal development, etc. Stony Brook University also developed a data warehouse system [33] for teaching and learning. It covers Enrolment, Credit Hours and Registrations, Degree Completions, Graduation and Retention Rates, and Stony Brook Analytics, etc. Figure 3 shows a screen capture of the dashboard on Degree Completions.

4. Methodology and System Design
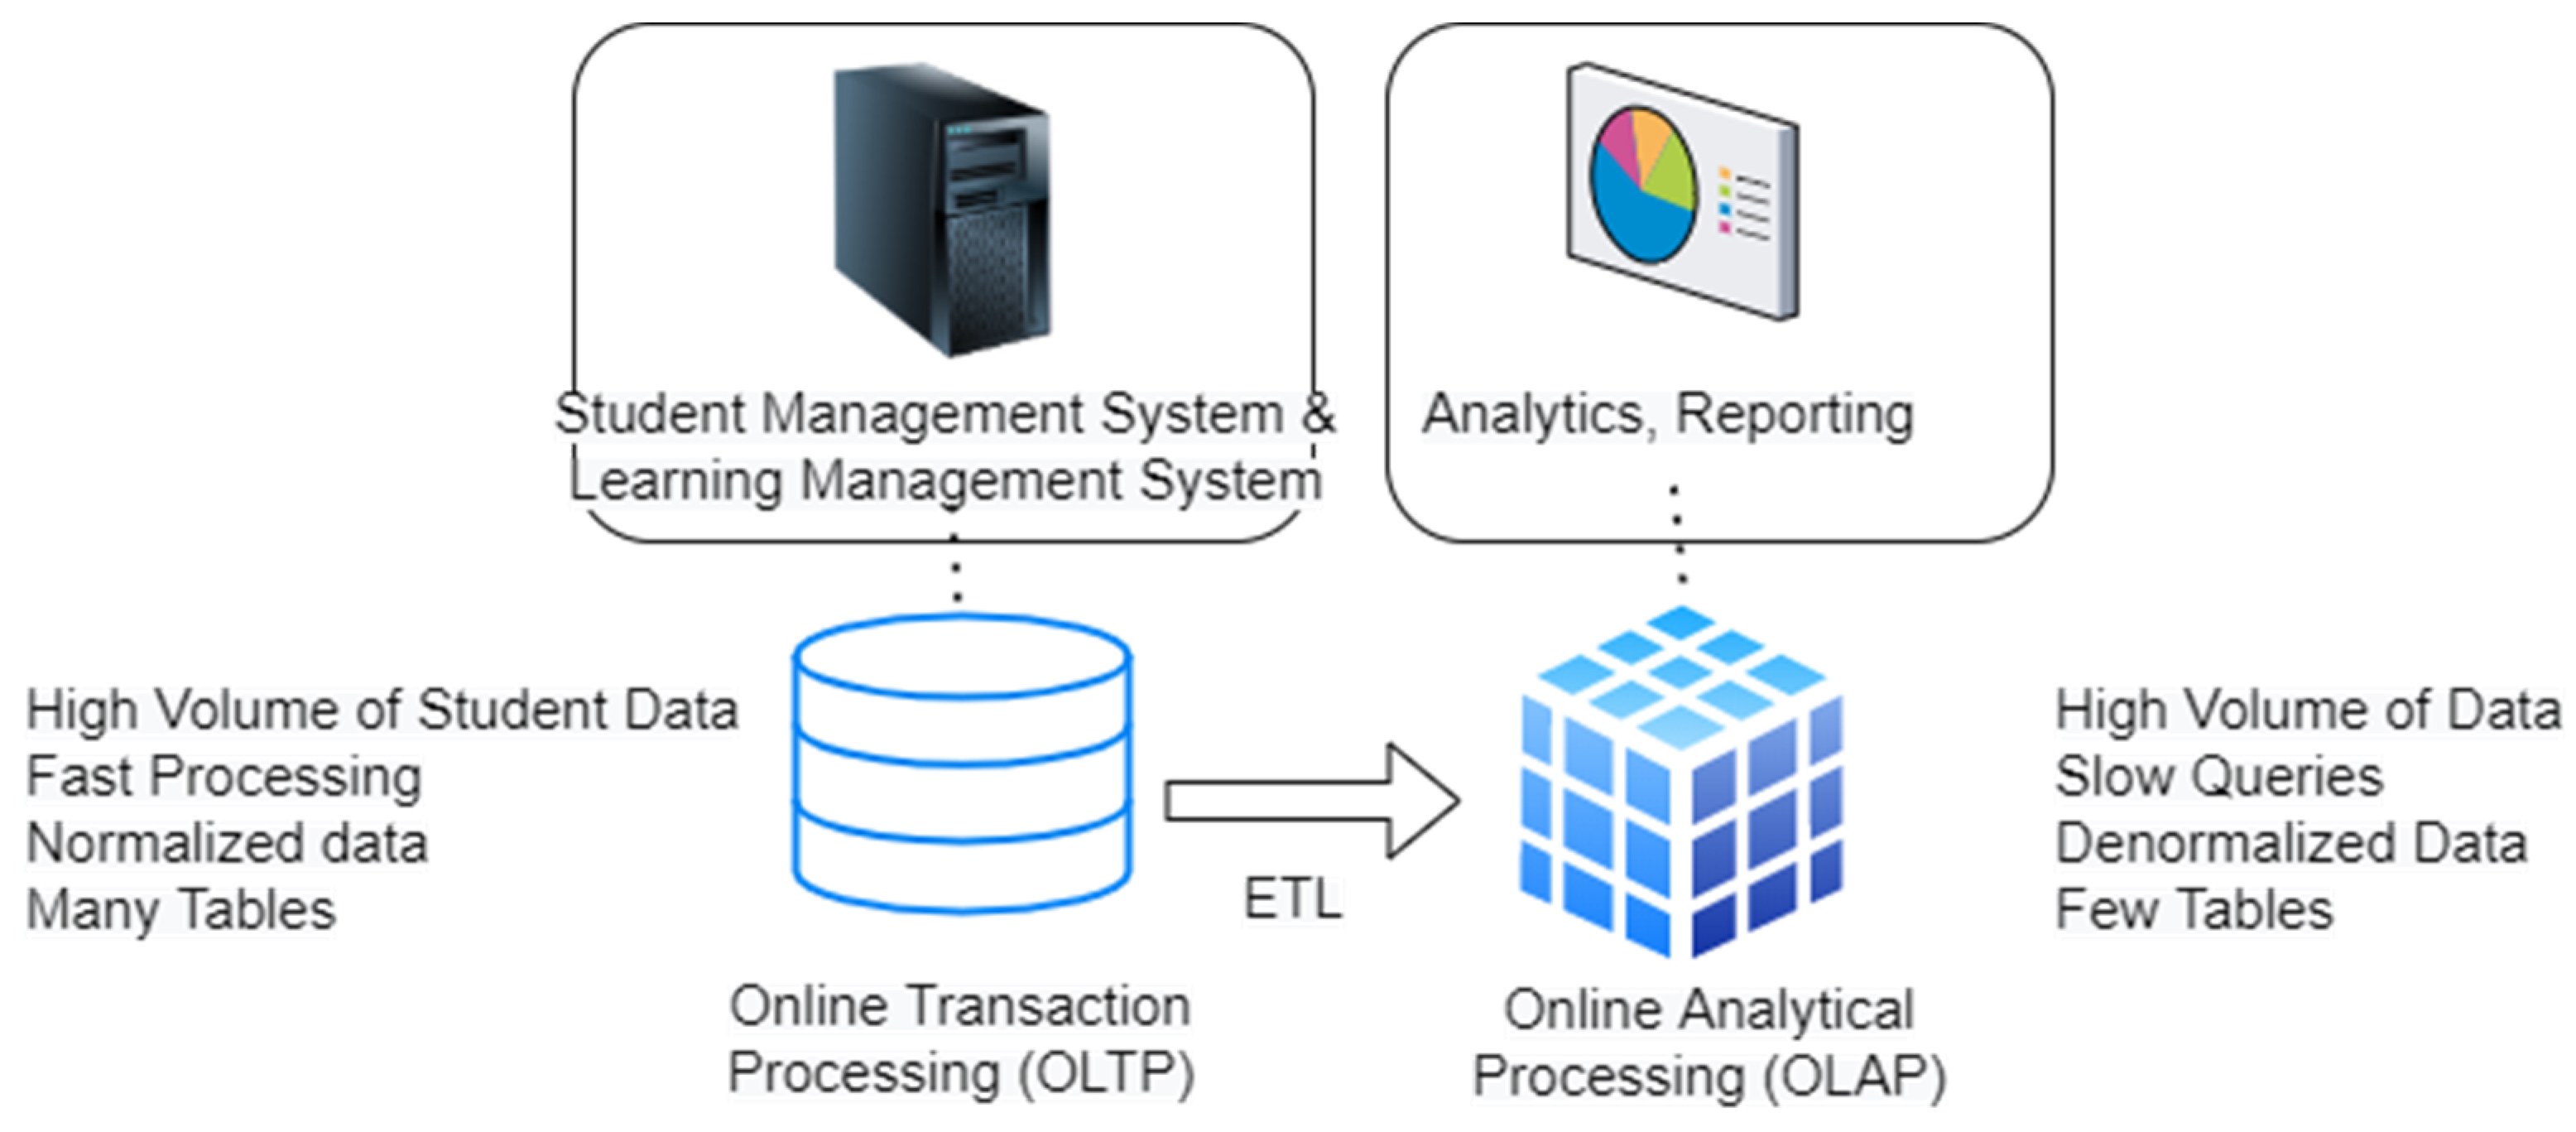
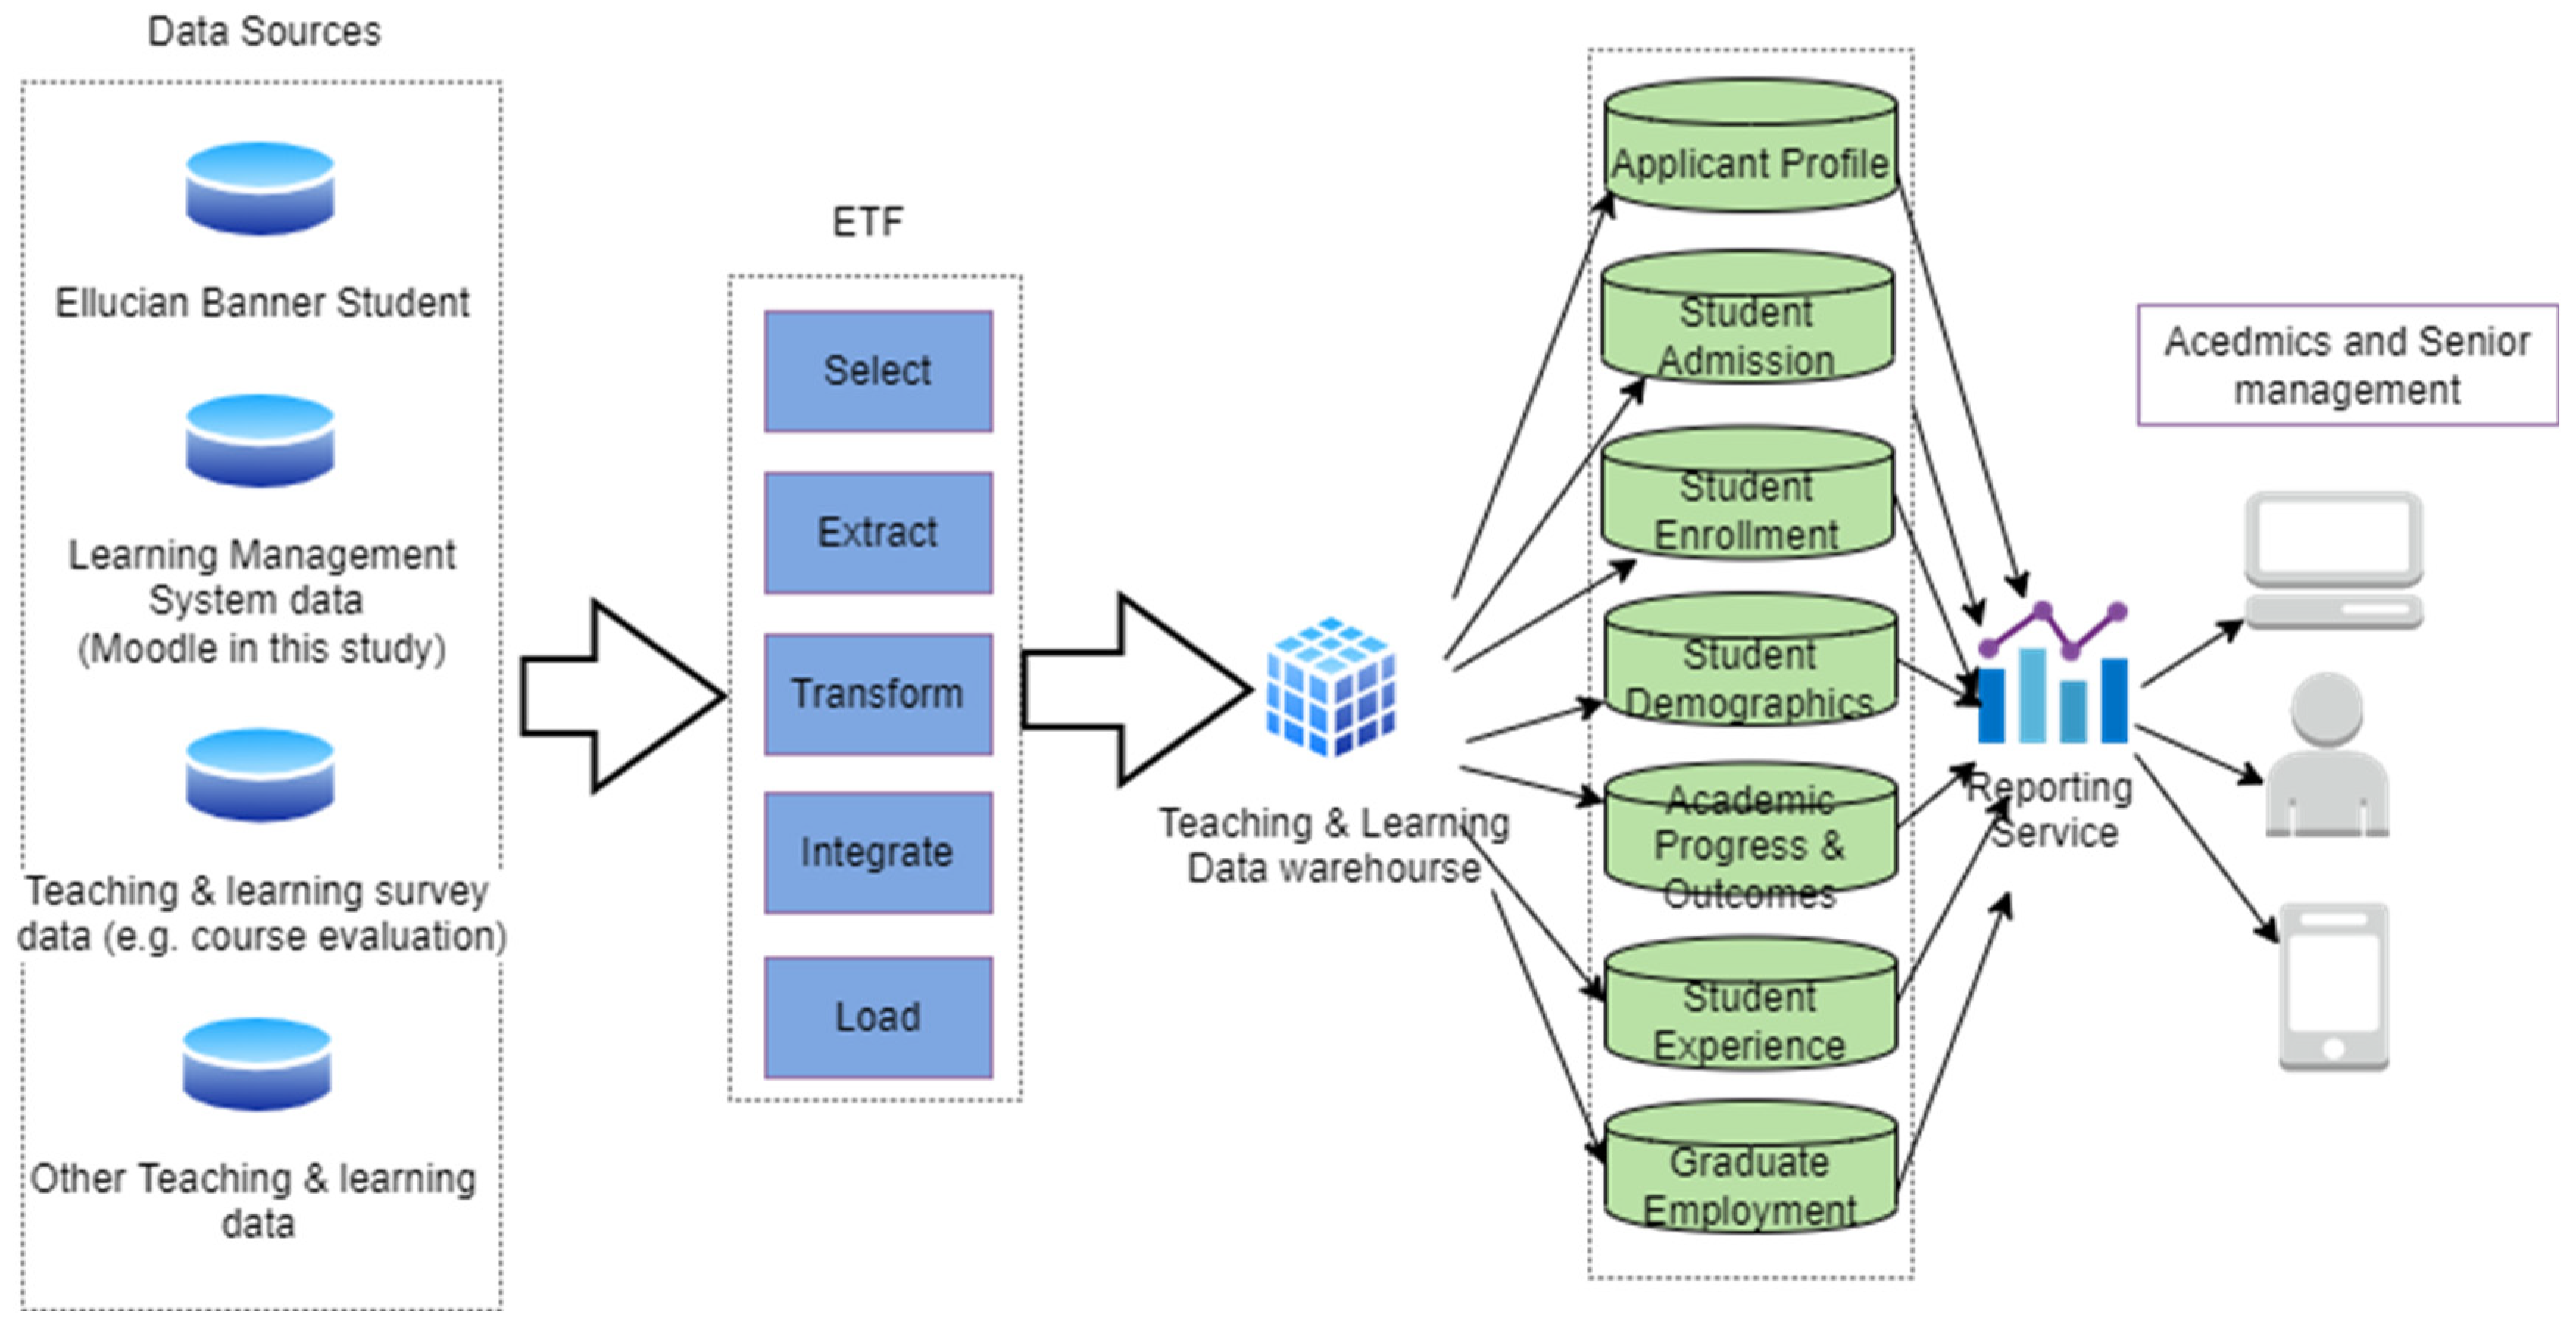
Over the past decade, the rise of data analytics technology has revealed the substantial potential to address the subject of teaching and learning analytics. However, only a limited number of research papers cover all aspects of LMS analytics, various institutional surveys, and professional development activities. To surmount these challenges, especially from the system architecture and friendly user interface, this section describes the proposed multi-dimensional analysis approach and detailed system architecture to address these demands and demonstrates how to enhance teaching and learning quality assurance.

4.1. Data Source

This study focuses on the implementation of a teaching and learning data warehouse analytics system (TLDWAS) in a leading liberal arts university in Asia that is committed to maintaining the highest program and teaching standards. The system compiles the data from multiple sources including:
(a)
Student Management under the Banner ERP System;
(b)
Learning Management System (Moodle);
(c)
Data from Institutional Surveys (for example, Term-End Course Teaching and Learning Evaluation (CTLE) Survey raw data, First Year Student Learning Experience Survey data, Final Year Student Learning Experience Survey data, Employers Survey data, and Alumni Survey, etc.);
(d)
Data of professional development activities.

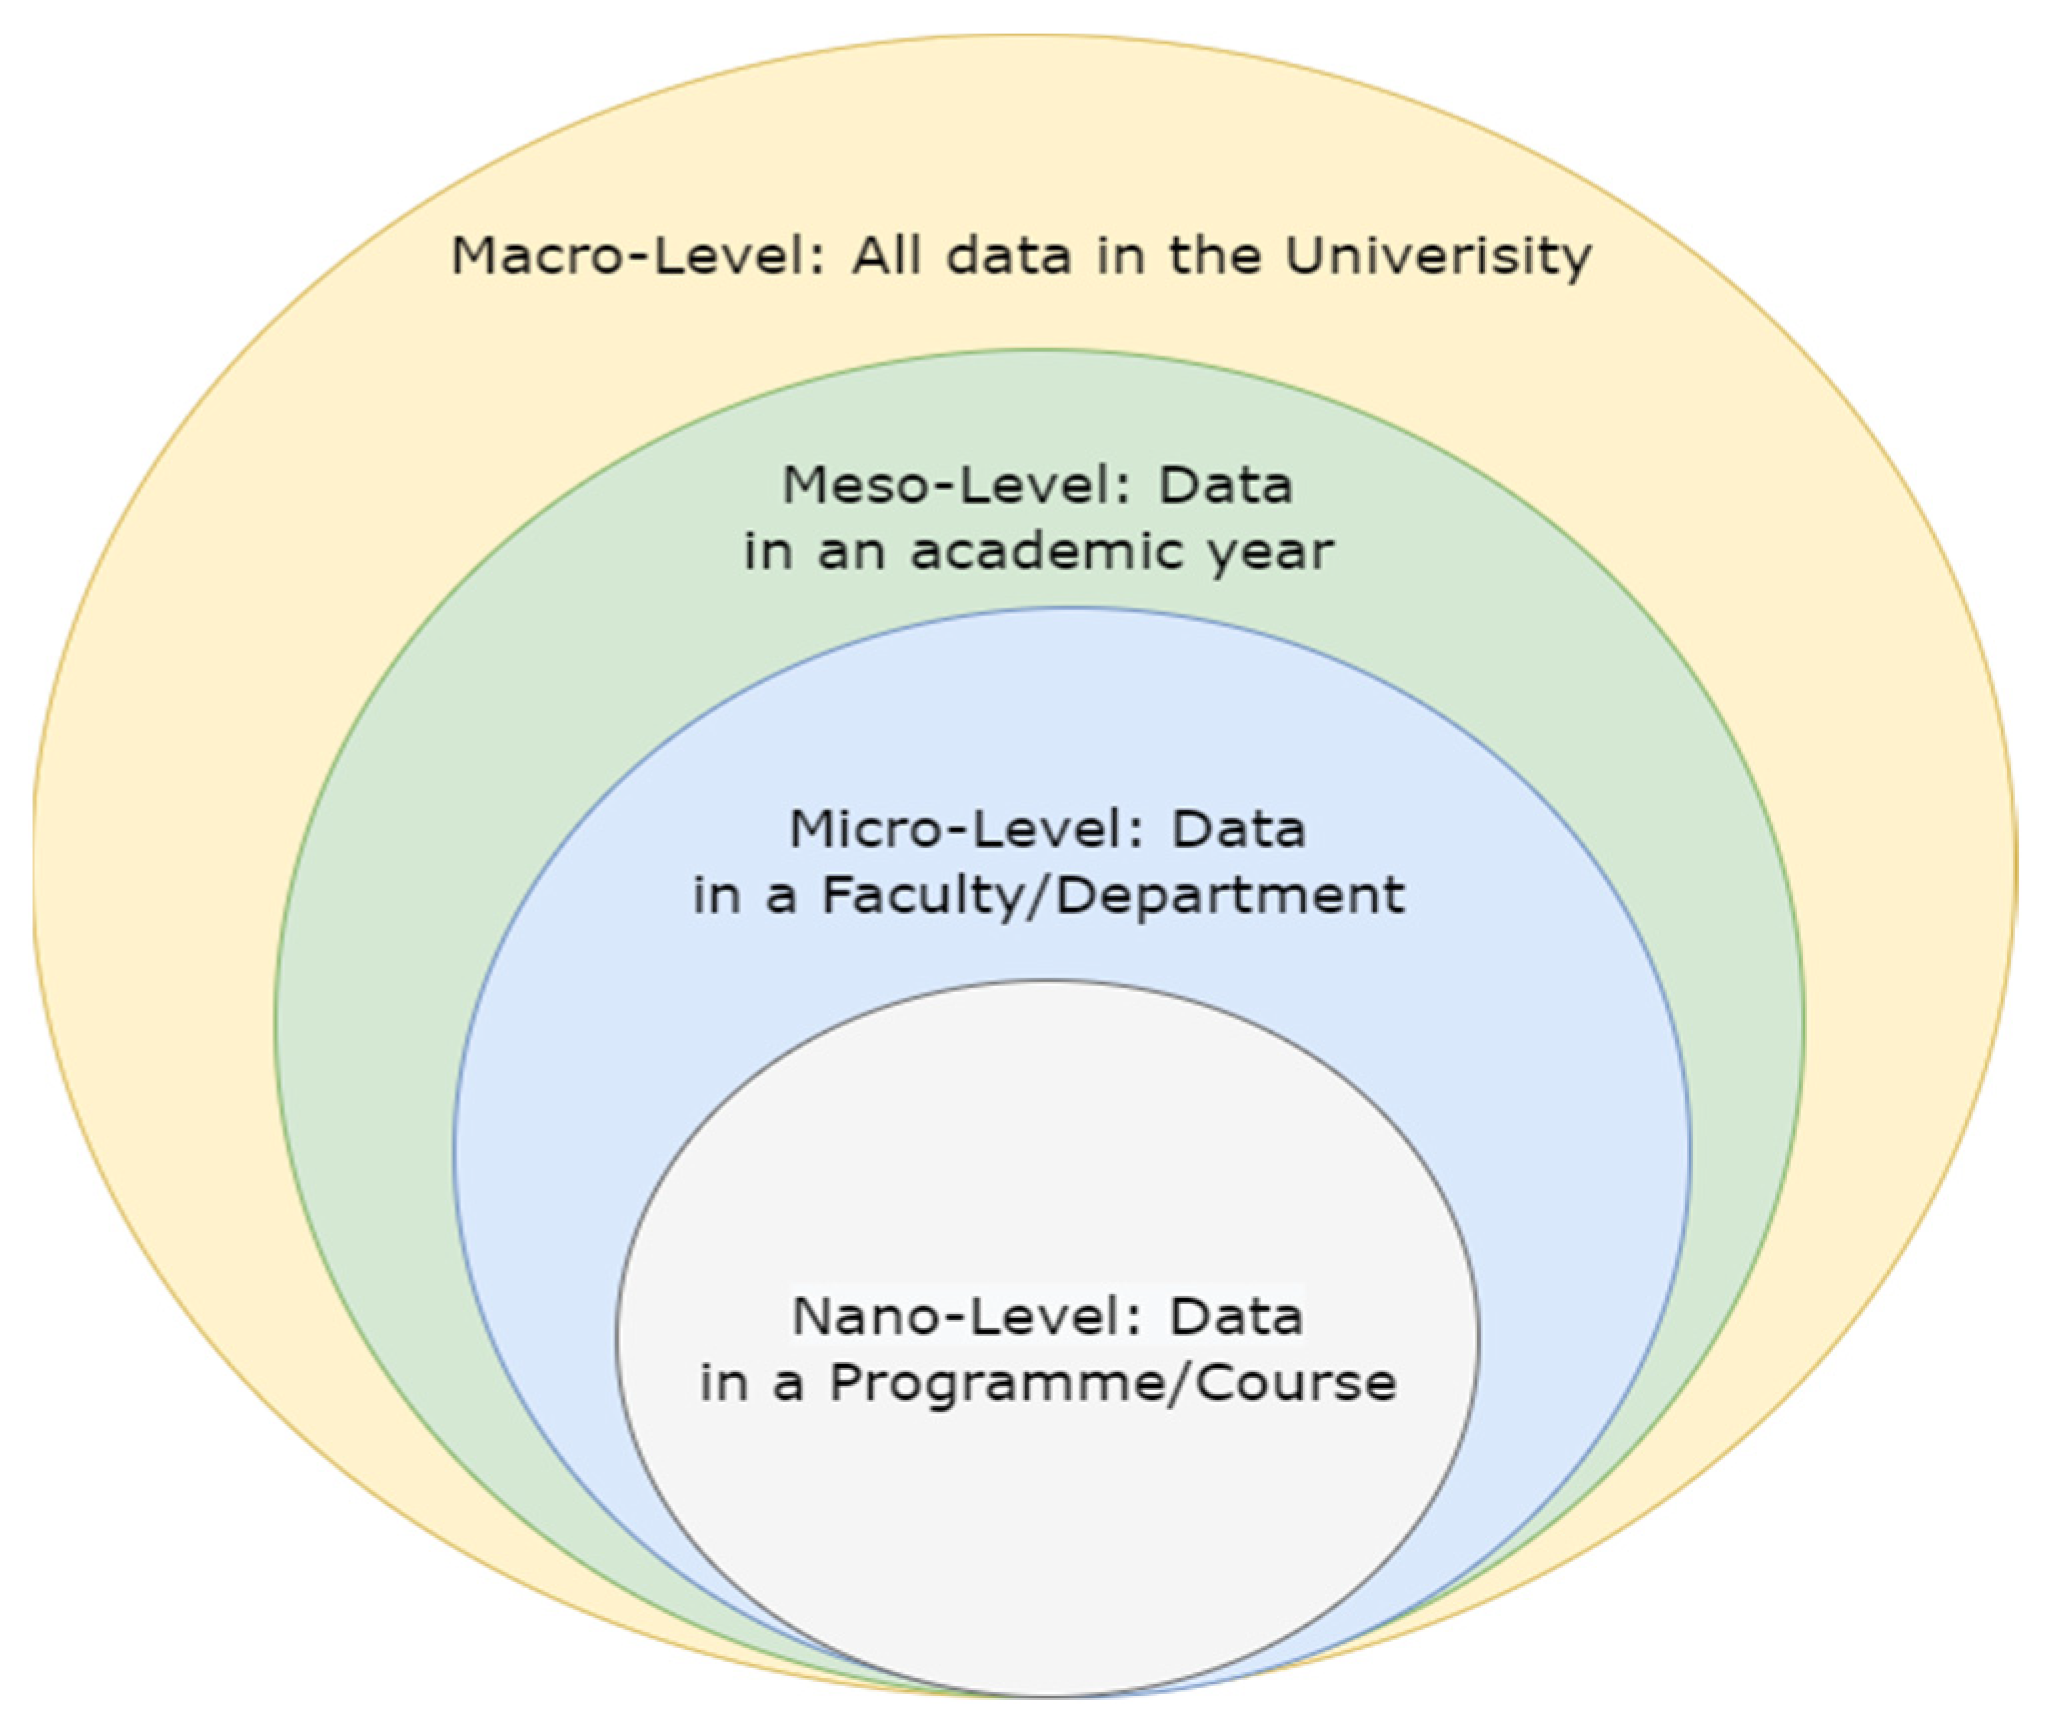
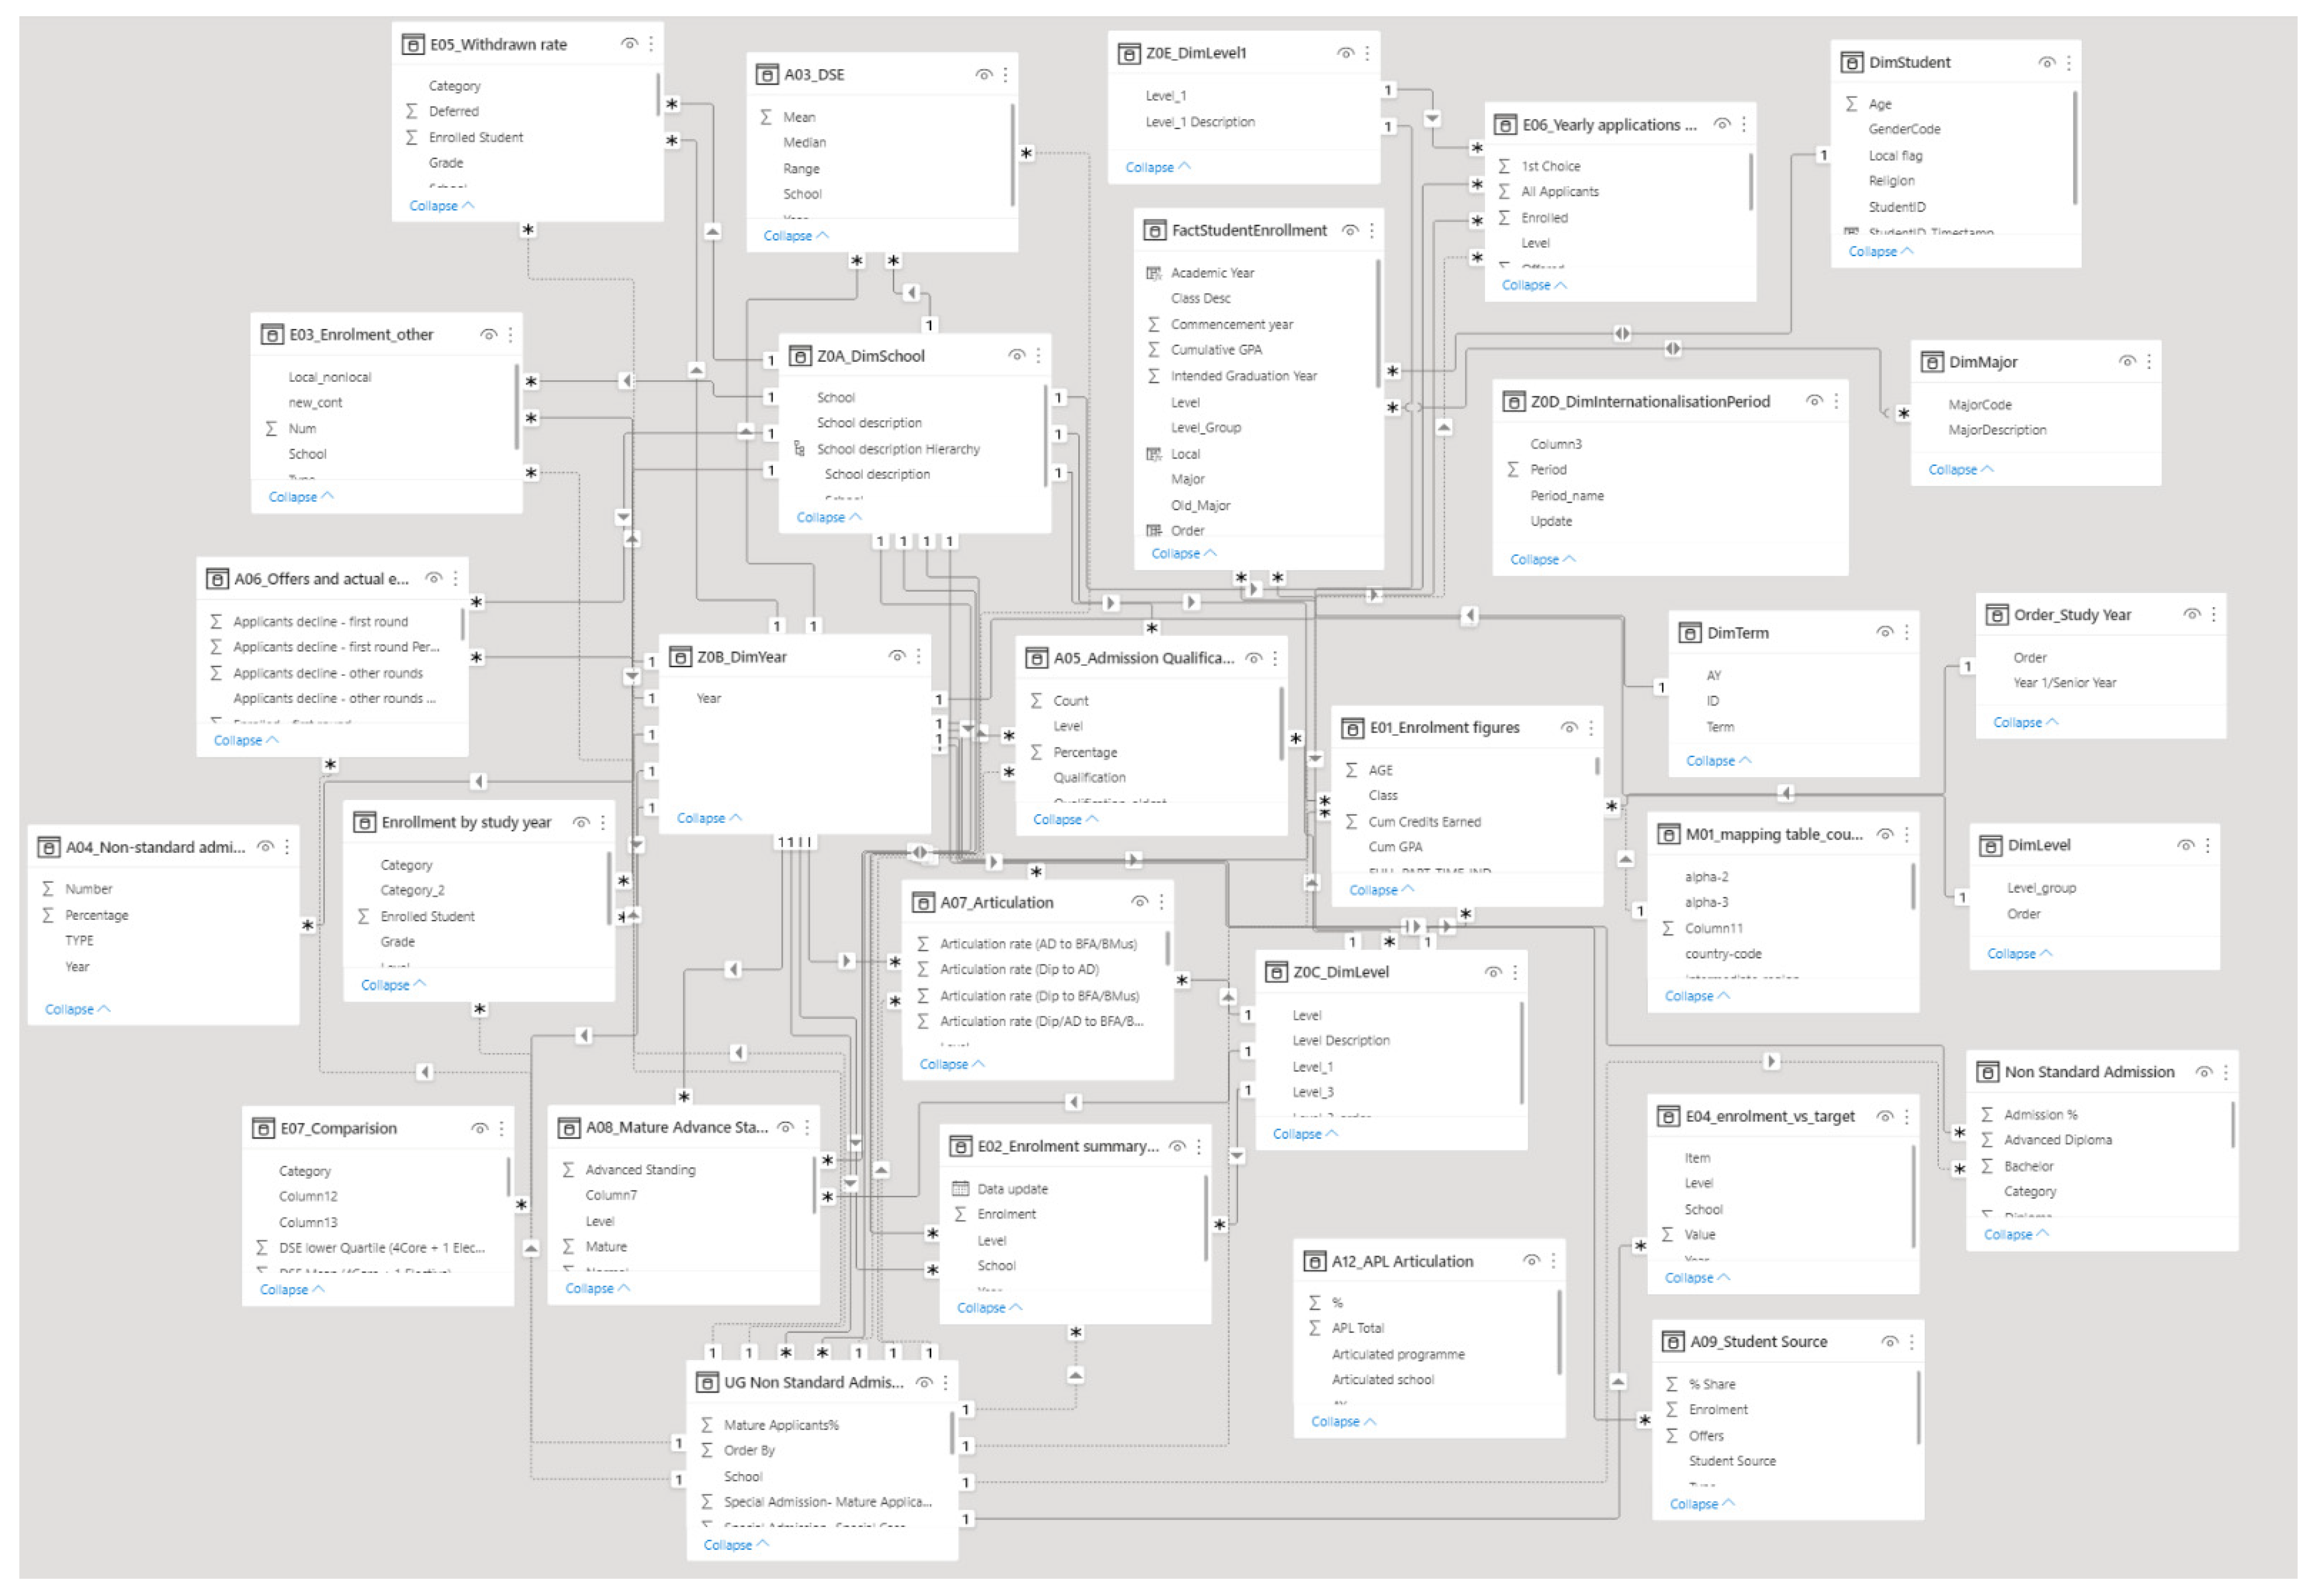
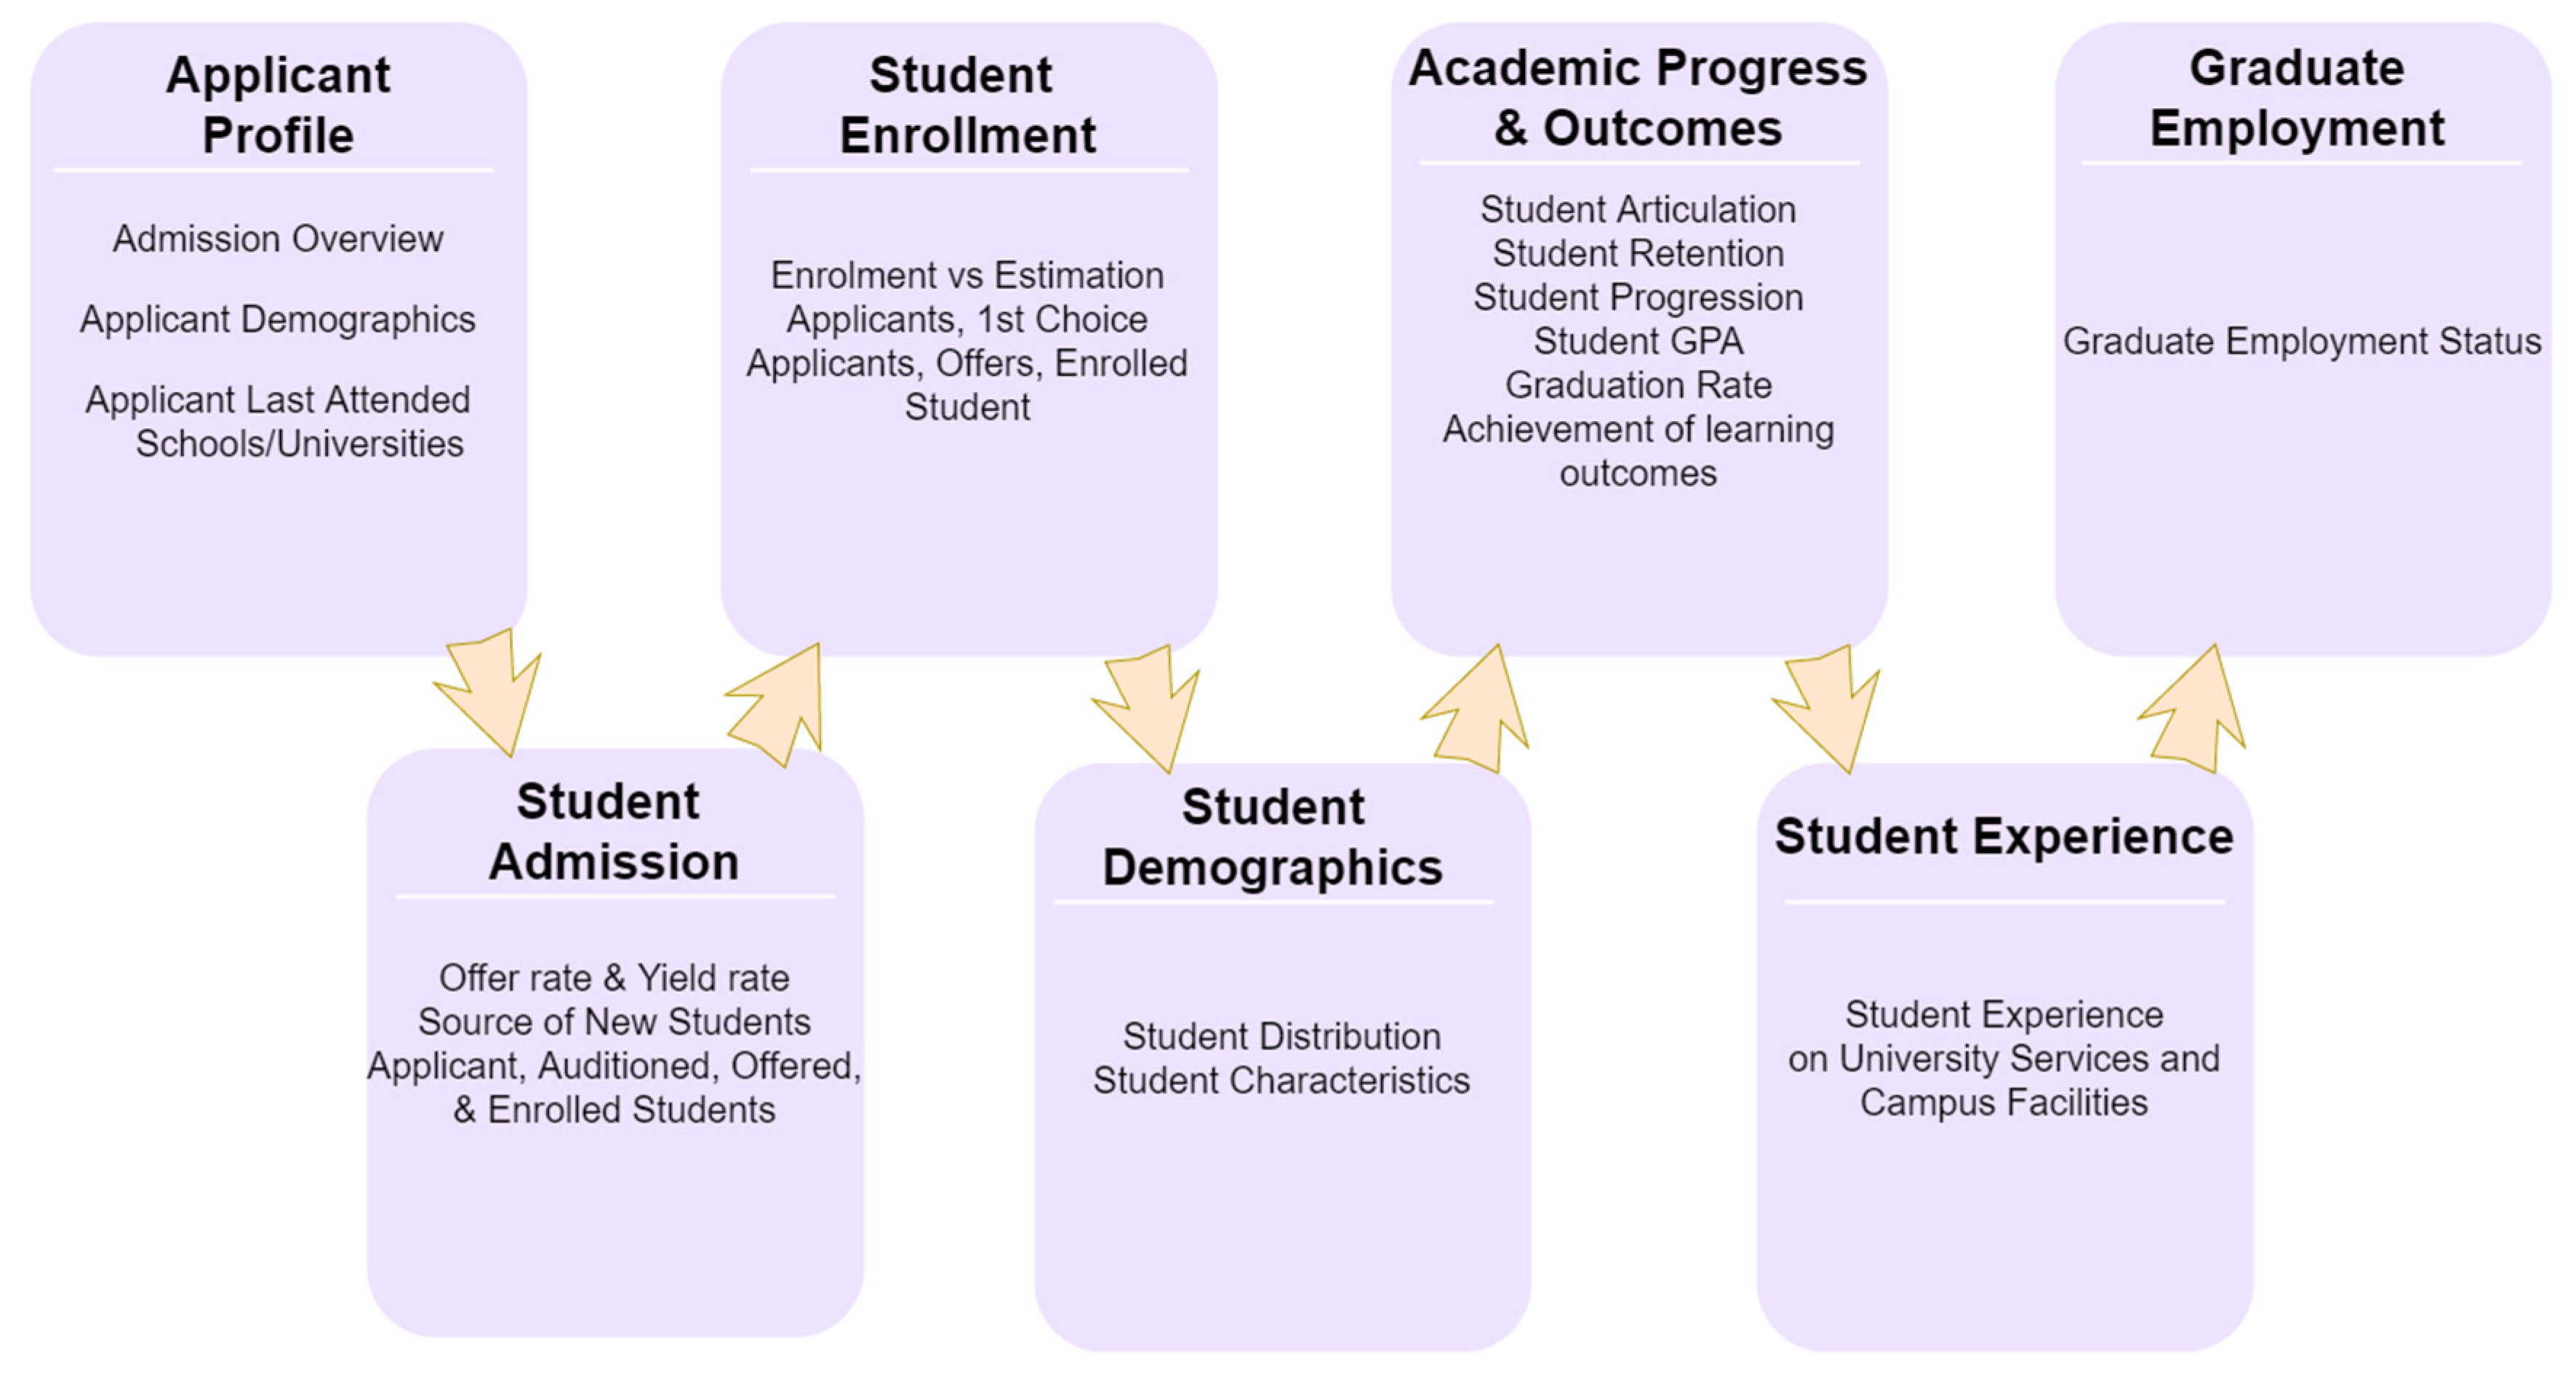
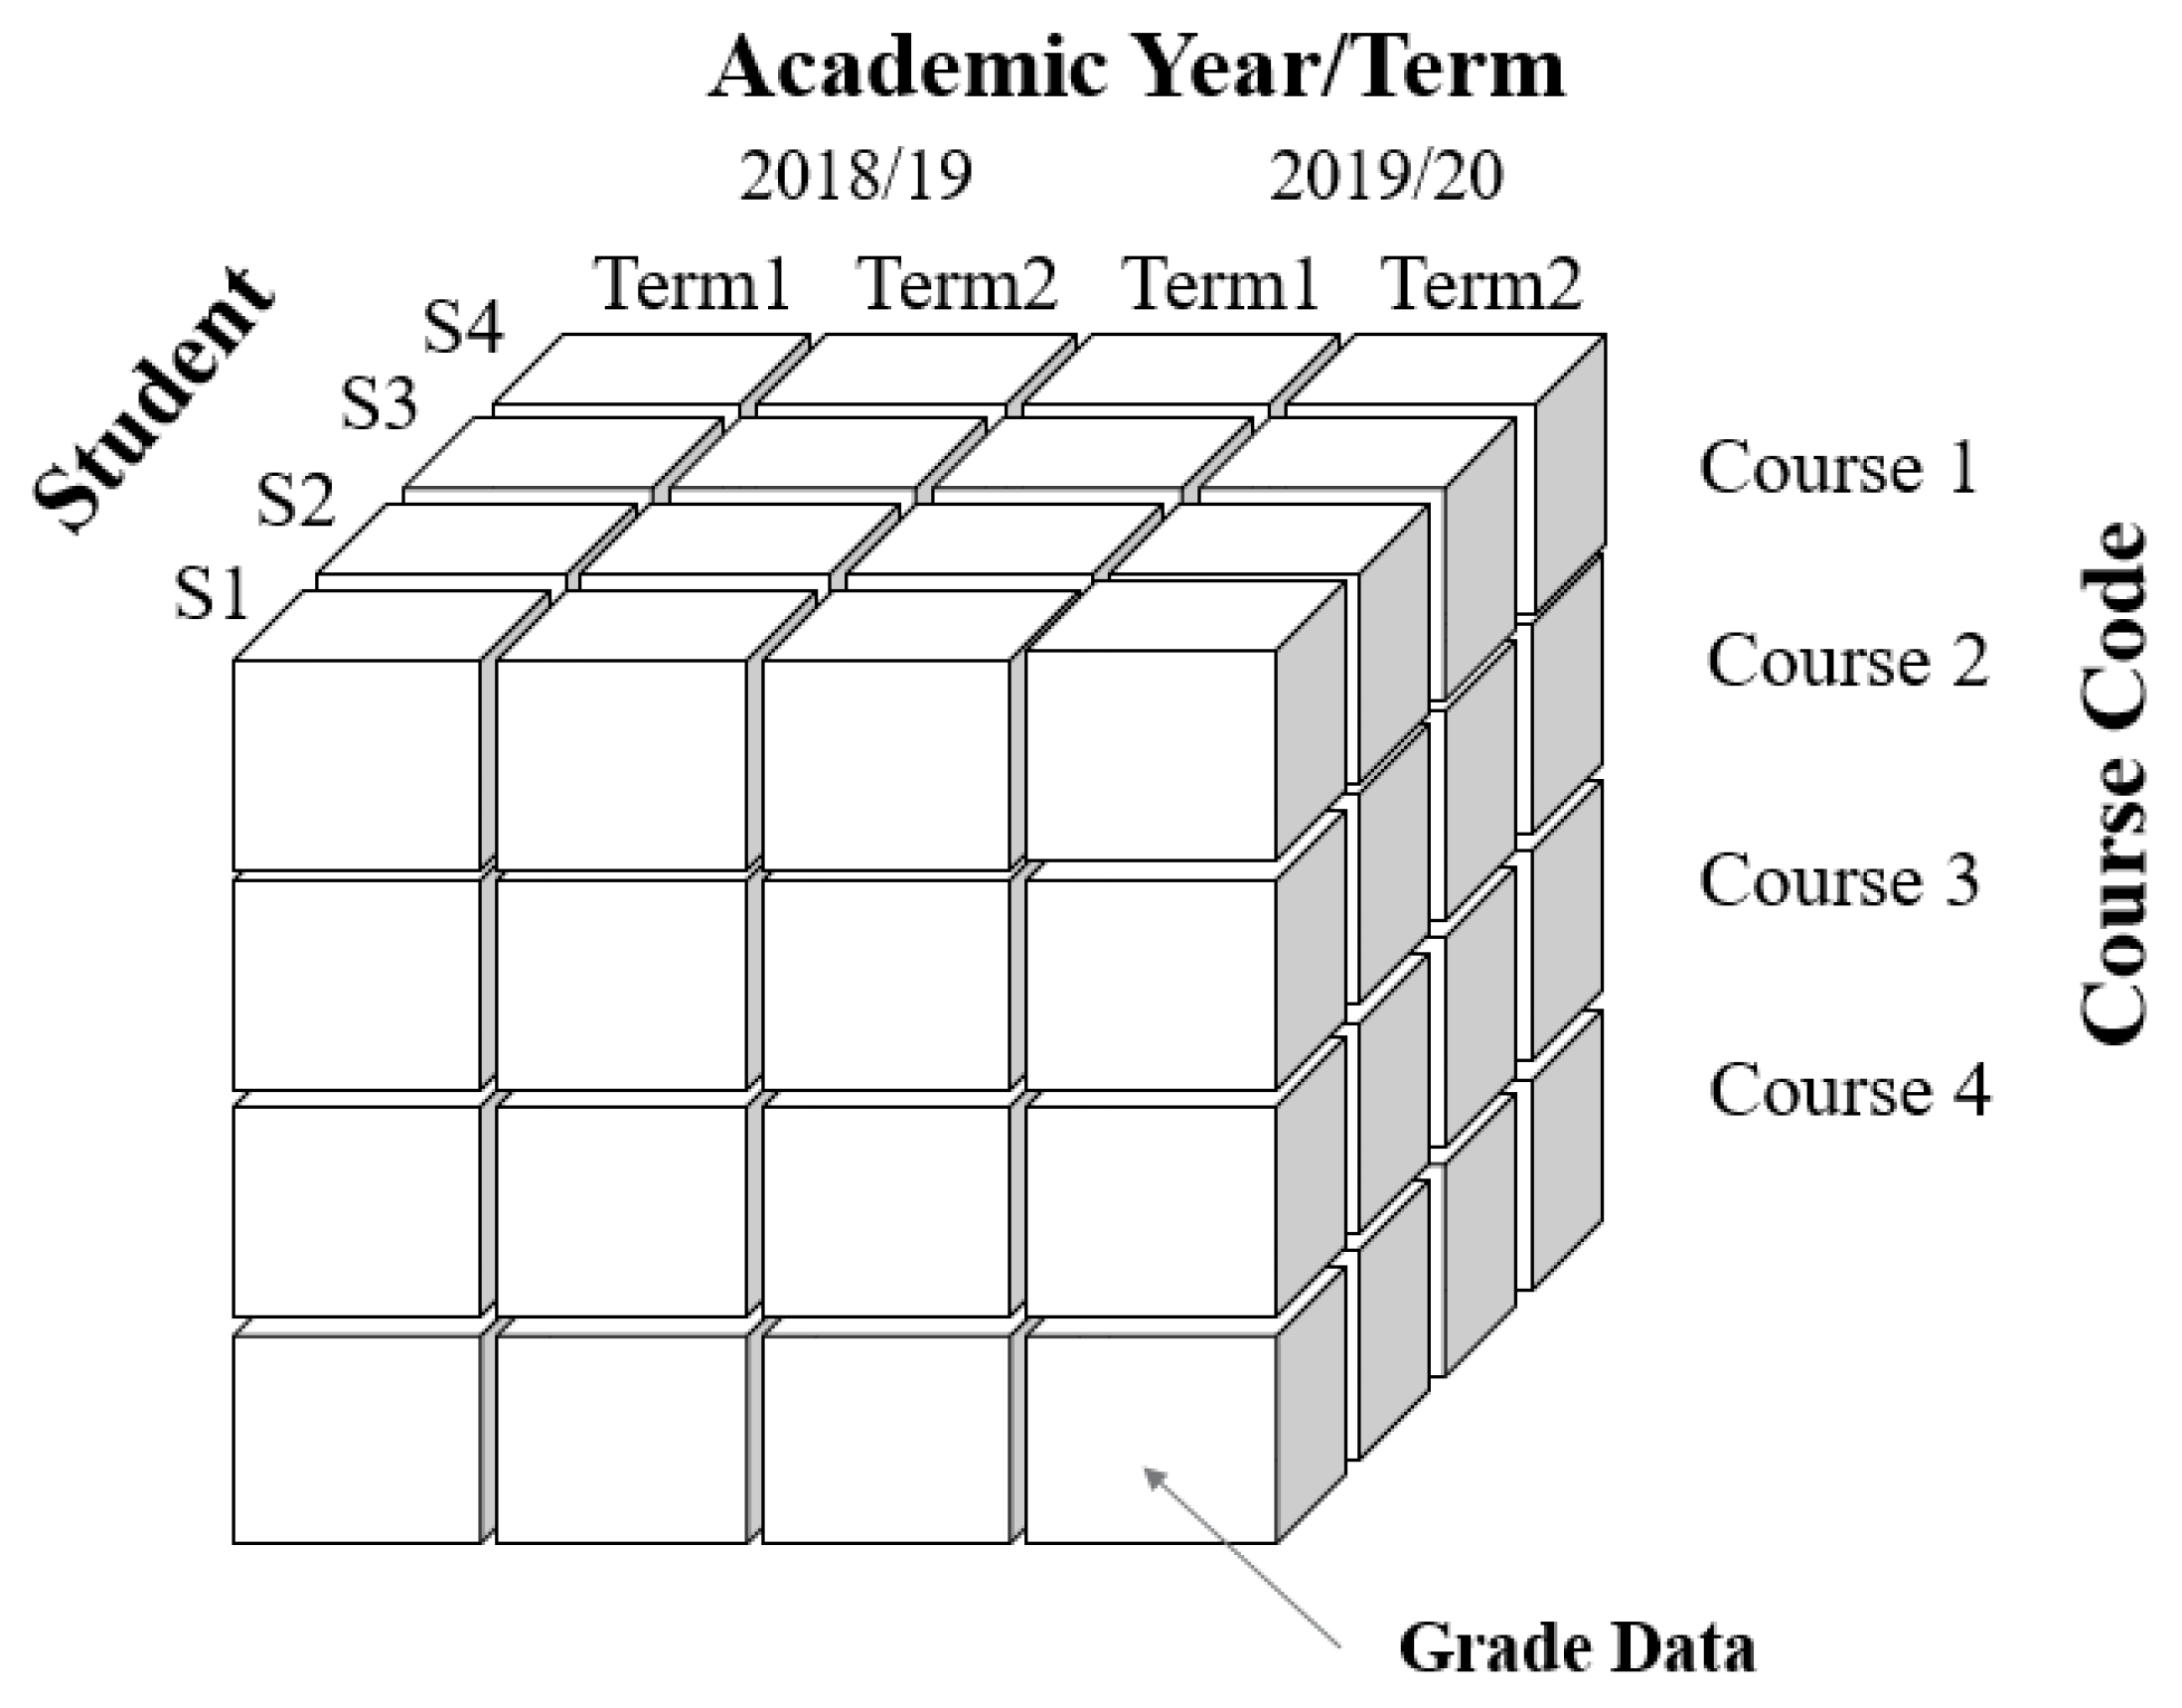
4.2. Scope and Multidimensional Data Model

The system provides a simple interface for senior management to view the complete status of students at universities, including their applications, admission procedures, registration process, and academic progress/status until their graduation. Figure 4 illustrates seven key areas that are addressed in this study.
Ref. [40], Figure 5 demonstrates the four-level classification of the analytics: ‘Nano-level’ points to the information/data in a course, program or department; the ‘Micro-level’ indicates many courses in a faculty; the ‘Meso-level’ includes many courses in many faculties in a specific academic year; the ‘Macro-level’ refers to all faculties and years in the institution.
A multi-dimensional model is used in this study to build up the relation among the various data dimensions, e.g., student information, program information, academic year, and course information. For example, as shown in Figure 6, time, student, and course are kept as dimension information in TLDWAS, and the grade data as the fact information (in face table) in the data warehouse. Each dimension relates to a table in the system, called a dimensional table, that describes the dimension hierarchy information.

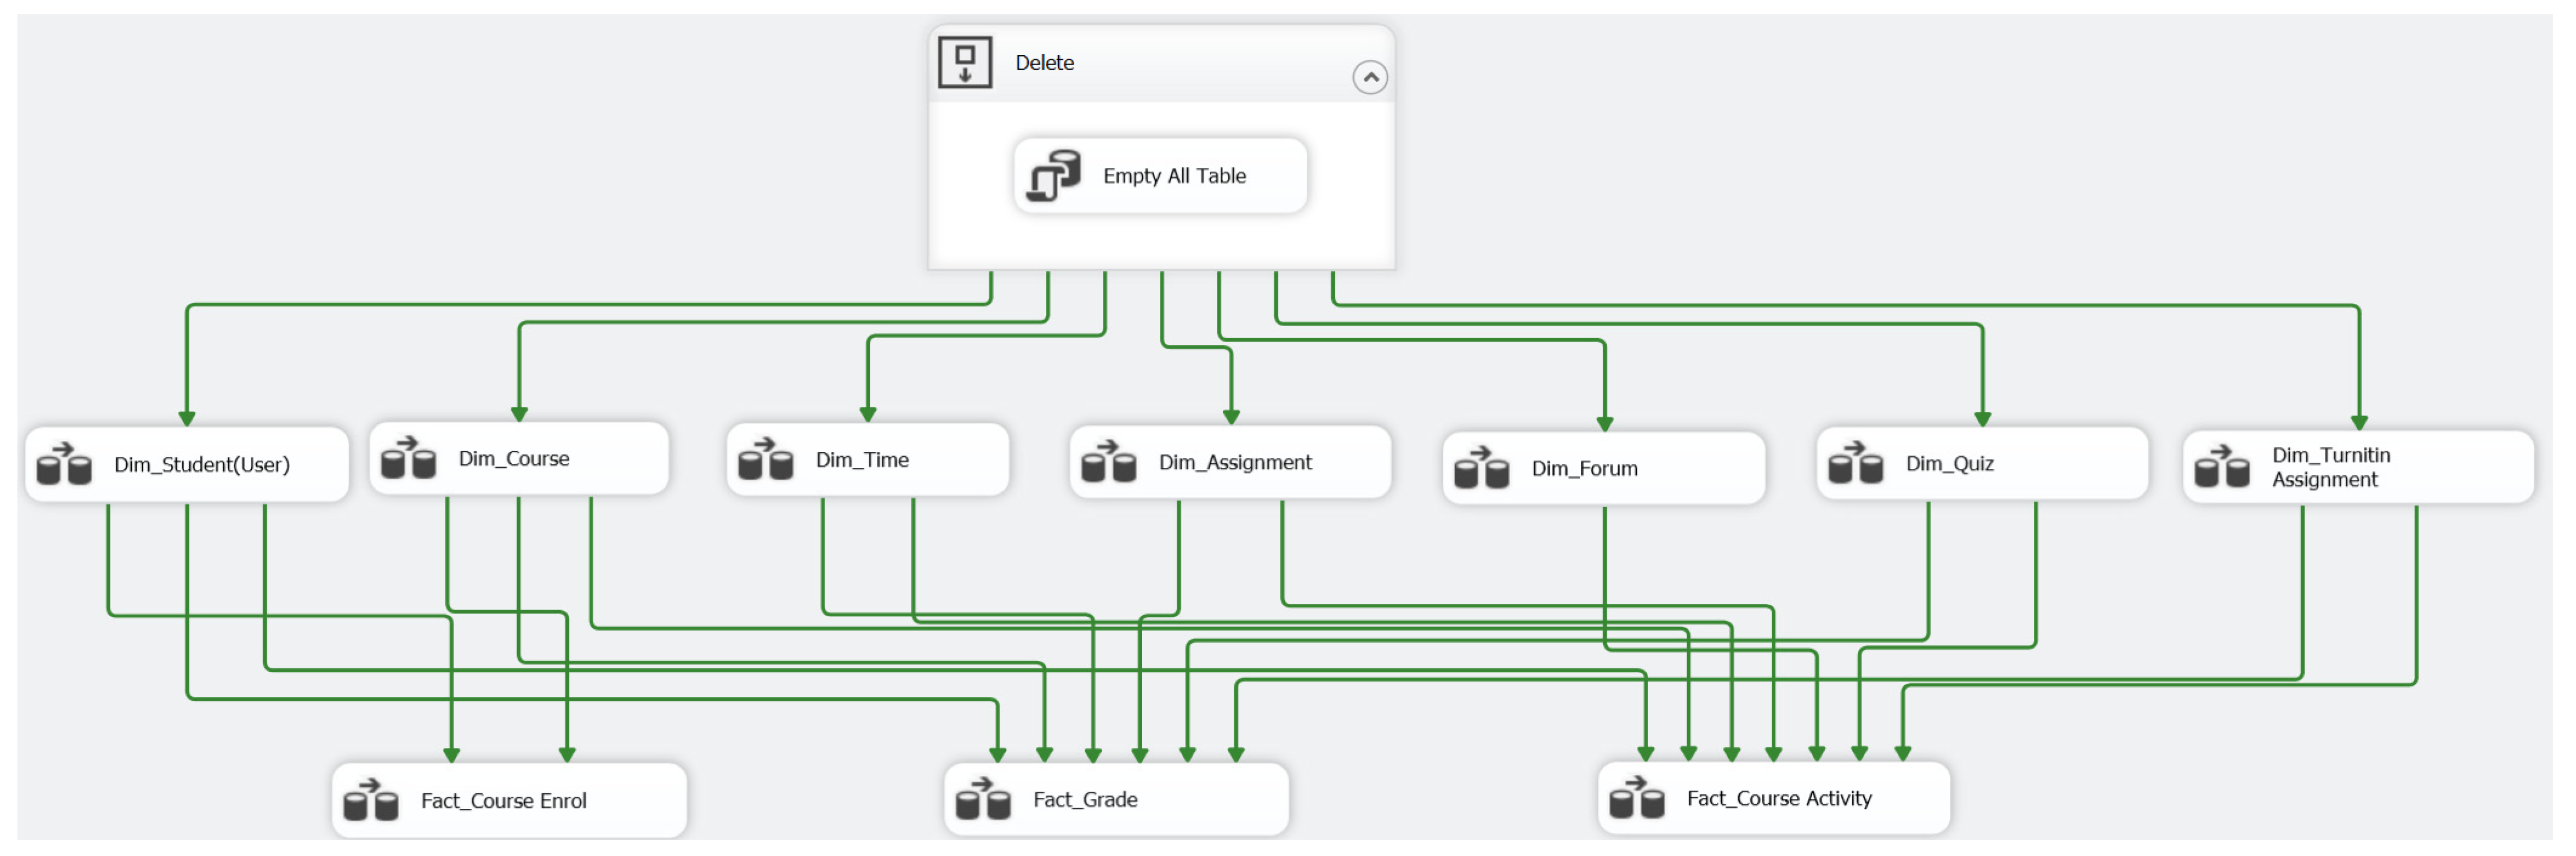
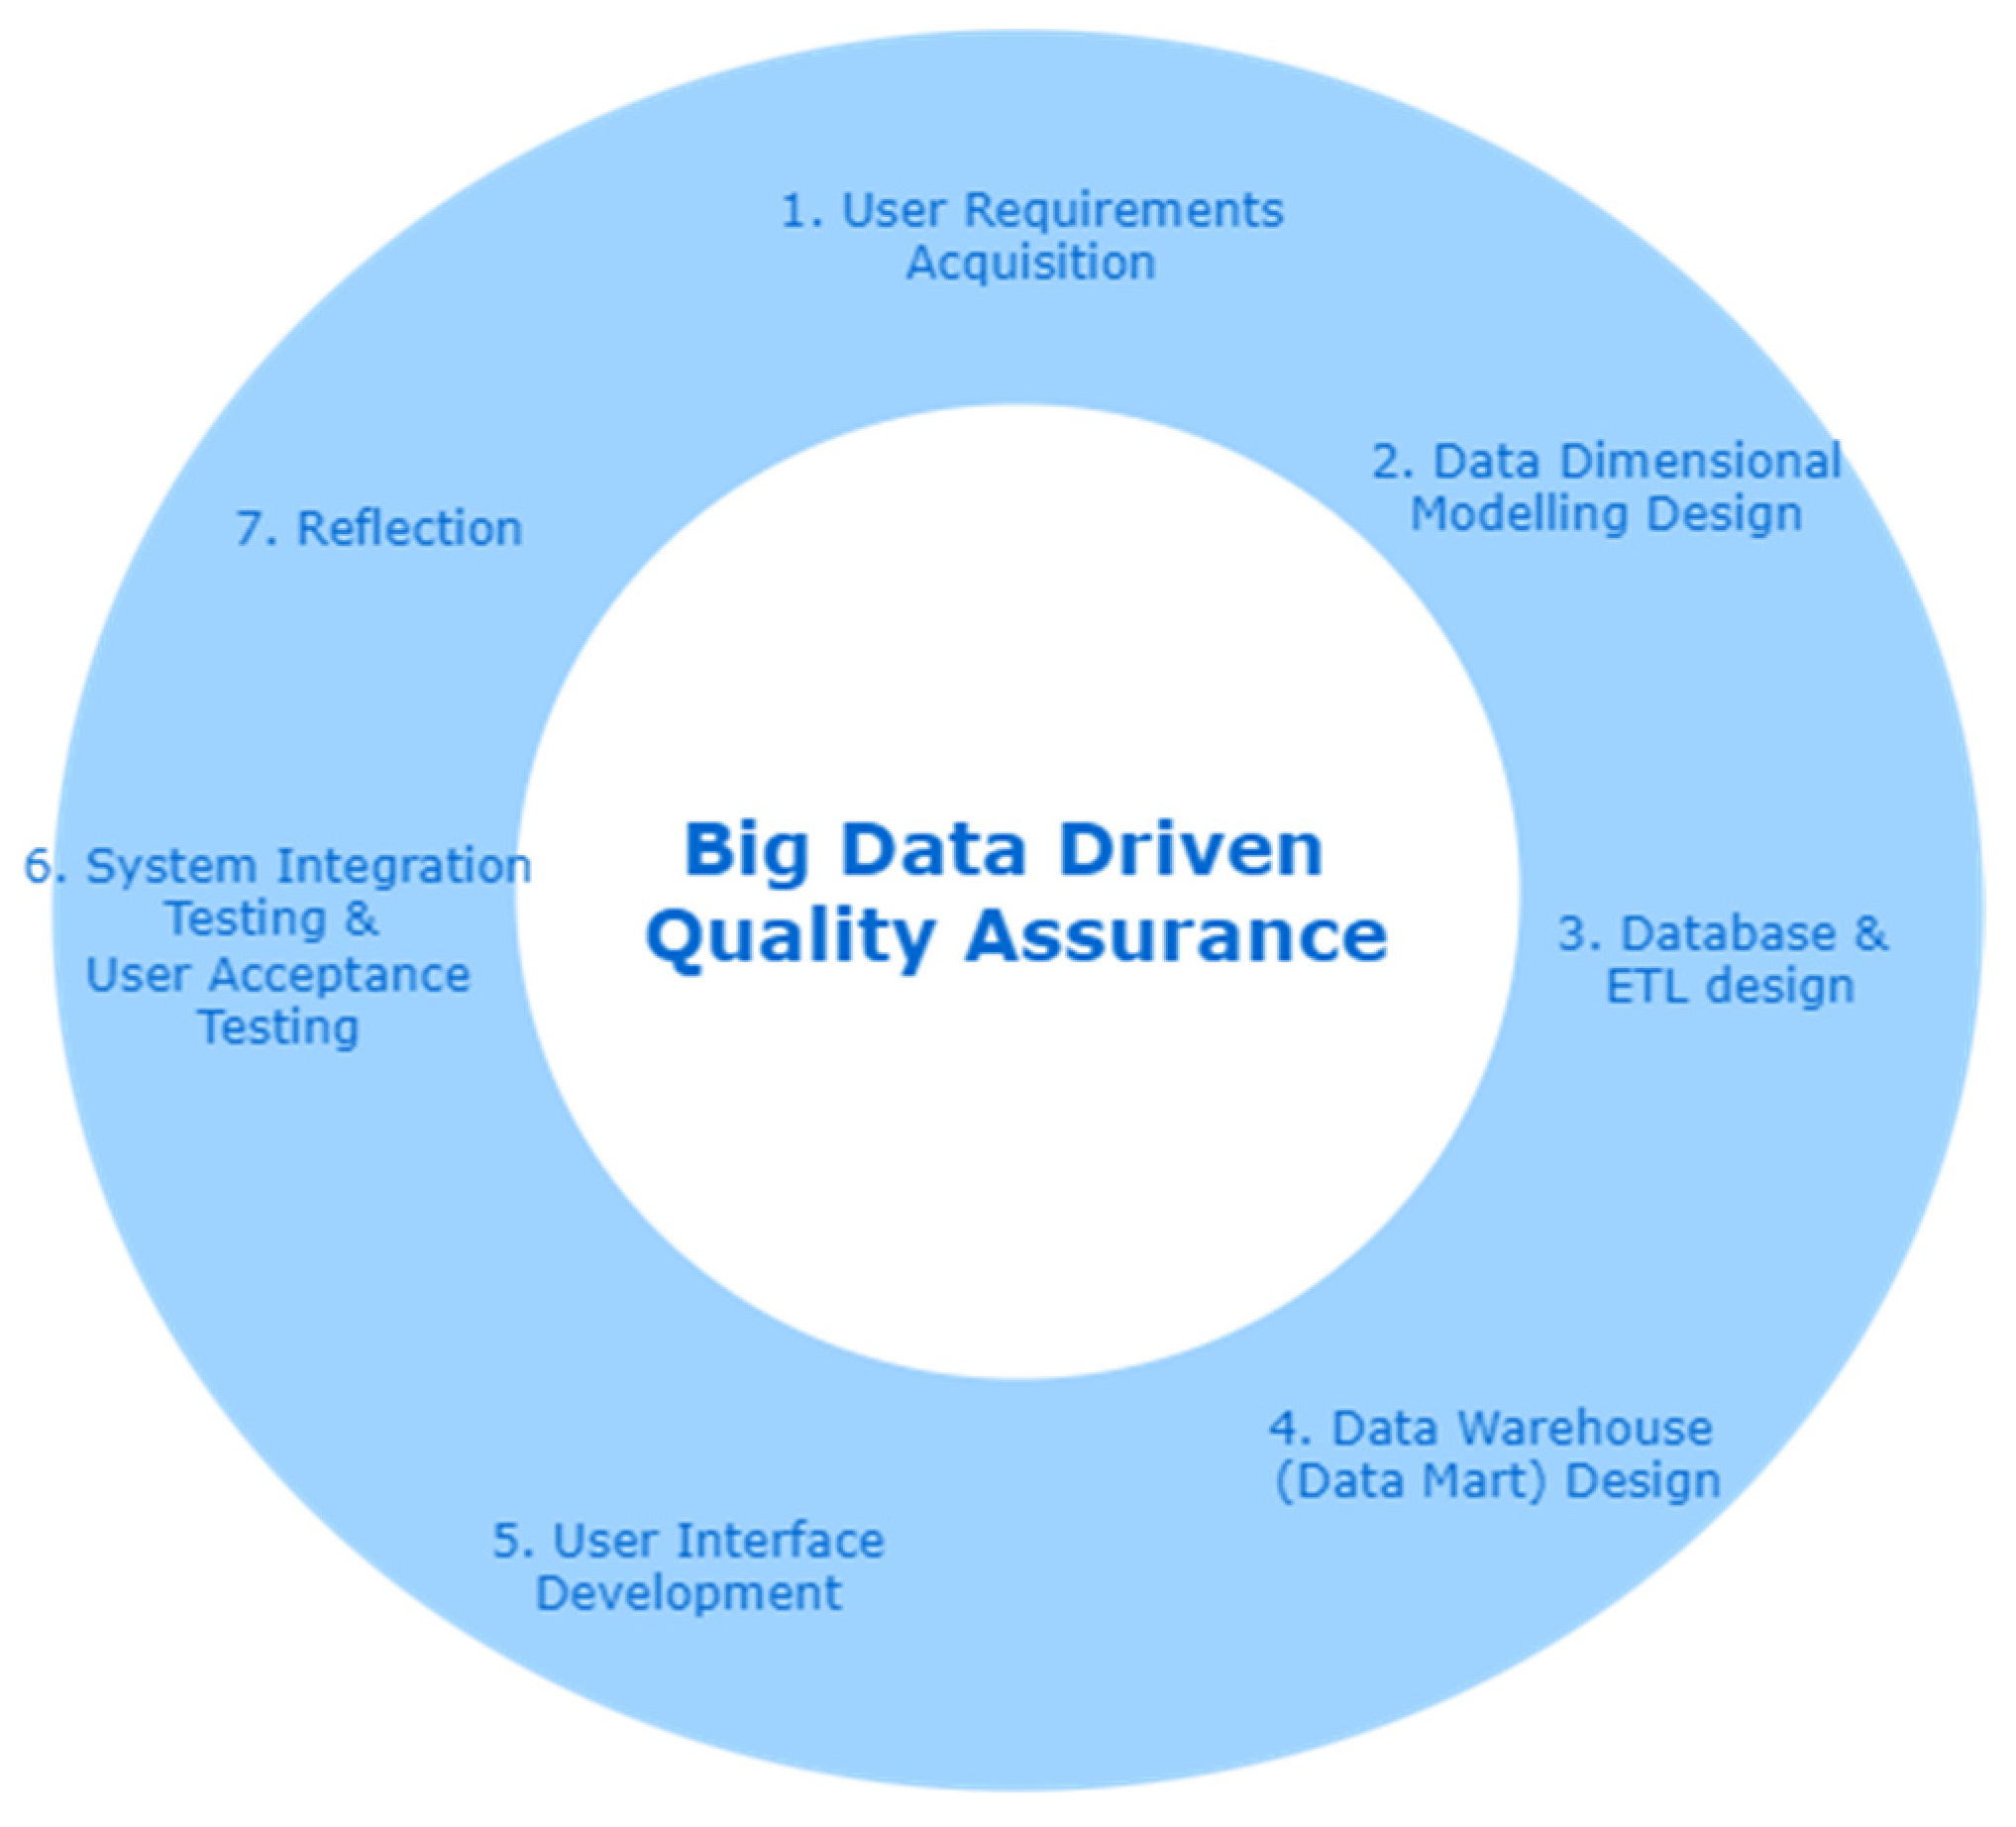
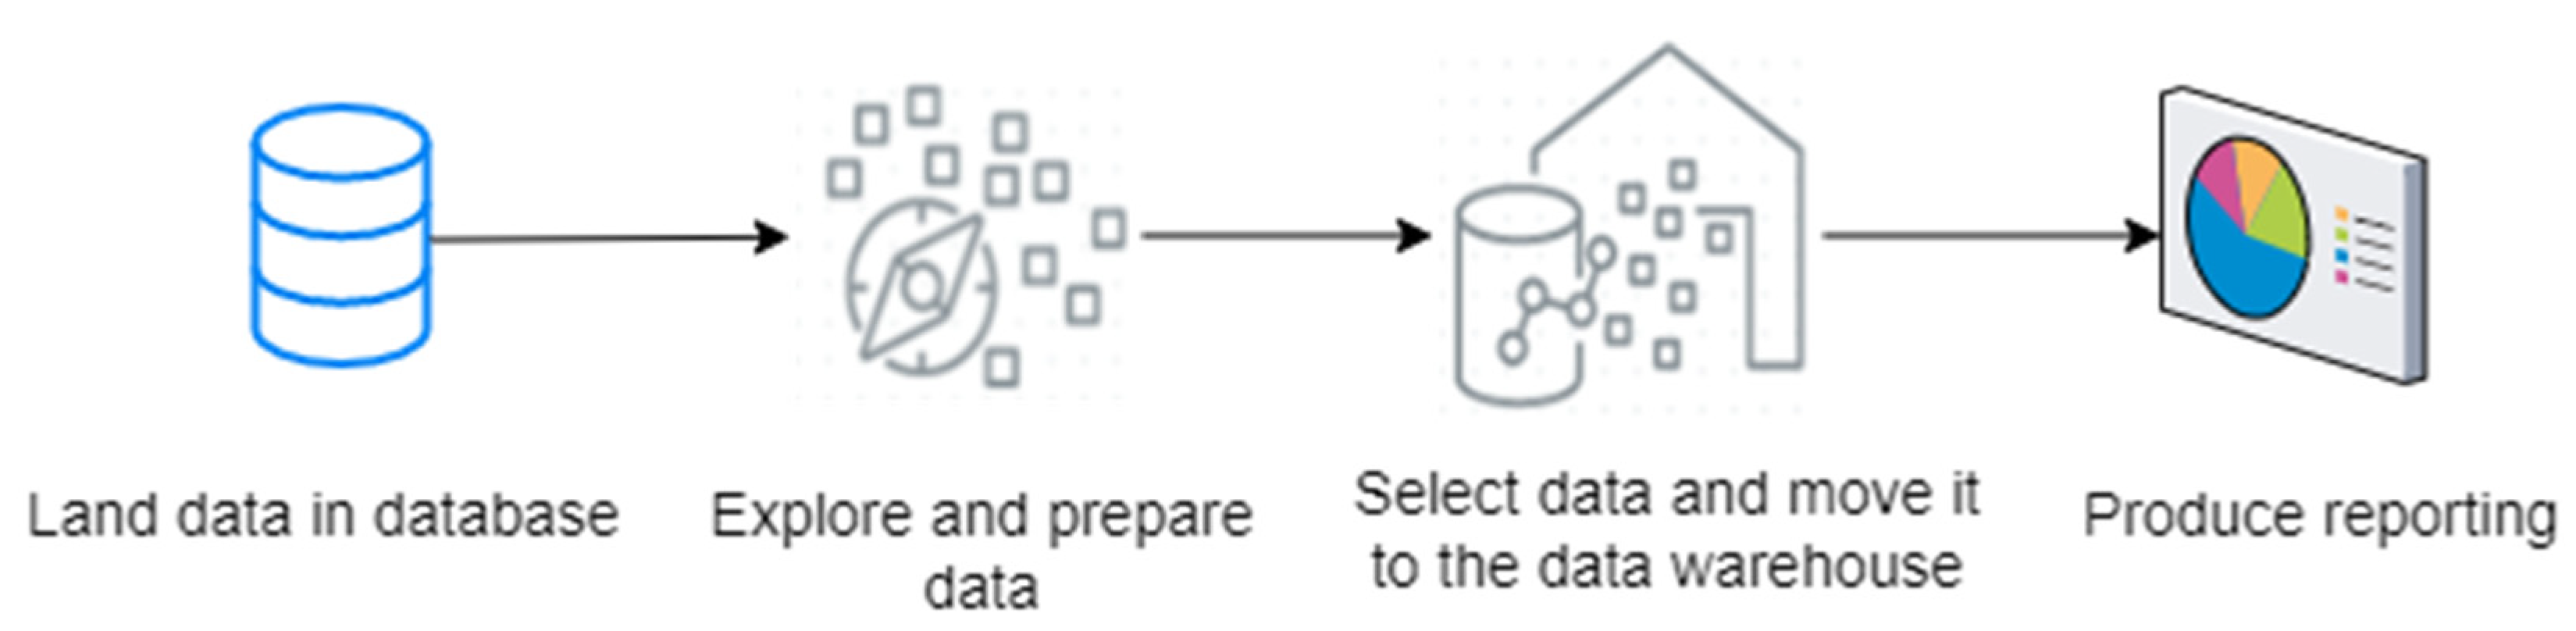
4.3. Data Warehouse Architecture

Our proposed TLDWAS attempts to provide educators with useful information in the form of static and dynamic reports and to graphically present the discovered patterns of student behavior to them. The managed data, such as virtual courses, e-learning log files, student demographics and academic data, and admission/registration information, are distributed across different data sources, and the same information is frequently collected in different formats and codes, such as course codes on the e-learning platform (Moodle) and the same codes in the registration system (Banner).
Data warehouse (DW), a data reporting and analysis system, is adopted as a key part of business intelligence to build the multi-dimensional model in the teaching and learning data warehouse analytics system (TLDWAS), as shown in Figure 7 [41]. In addition to analyzing sophisticated data for a wide range of users, such as senior management and decision-makers, DW enables developers to create customized and complex queries to retrieve information from multiple data sources. Furthermore, the system enables systematic access to information with the aid of a simple operation, thus facilitating decision making, which is practical for business users to extract key information efficiently from massive amounts of data in the form of reports, grids, and charts.
Unlike a traditional operational database, DW is optimized for analytic access patterns. Online transaction processing (OLTP) is primarily concerned with transaction-oriented tasks [42], and online analytical processing (OLAP) is a fast solution to multi-dimensional analytical (MDA) queries in computing and a component of Business Intelligence (BI) applications. Figure 8 demonstrates the difference between OLAP and OLTP.
Considering the developers’ skillset and development experience and the Microsoft authentication services used in the university, Microsoft systems (SQL Server and Power BI) are selected in this study for the system development. Meanwhile, this study utilized the Extract, Transform, and Load (ETL) tool (SSIS) to extract data from various databases such as student information, learning management systems, and surveys. These data were then transformed into staging locations such as format and structure and loaded into the final stage in DW every night. For example, the database of the LMS is configured as a linked server in the SQL Server environment to enable the SQL Server database engine for executing the TSQL statement in the MySQL database (retrieving data). Meanwhile, the SSIS package is developed in Visual Studio, and it is captured in Figure 9. This package is also distributed in the SQL Server Agent service.
According to the works by [40], the data flow of this system is shown in Figure 10. ETL aggregates raw student data from the operational database and then processes it to the data warehouse, where it is divided into different data marts for reporting. SQL Server was adopted as the technical platform for developing the entire system because it provides developers with a set of integrated development tools (such as DW, ETL, reporting, and data mining) for business intelligence, making the process of defining and updating various elements simple and agile.
As shown in Figure 10, the data warehouse is composed of seven data marts: Application Profile, Student Admission, Student Enrollment, Student Demographics, Student Academic Progress & Outcomes, Student Experience, and Graduate Employment. There are corresponding data cubes in the data warehouse from the system level, which consisted of dimension and fact data tables. For instance, the E-R model of Student Enrollment is shown in Figure 11.
The data warehouse consists of sources, staging areas, final areas, and access tools of data. Data covering student information, courses, survey, academic performances, and e-learning platforms are input as data sources. Based on SQL Server Integration Services, the ETL process extracts, transforms, and loads these data into the designed dimensional database (data area) and then updates them as a necessary synchronization task between the operational and analytical systems.
Once the ETL process was completed, a data cube with the basic multi-dimensional data model was created in the data warehouse, in which the data were modelled/stored and could be viewed in multiple dimension tables. Meanwhile, the fact table contained measures on the raw data and foreign keys with related dimension tables in the data warehouse.
Meanwhile, the final data was stored and accessible to users’ direct queries, in addition to being used for supplementary functions such as analytical and reporting applications. The final data was not only organized in detail (raw data) but also summarized from various perspectives. Admission departments, for example, require information on the number of students enrolled in each course per academic year, whereas professors want to know how this number is broken down by age range, demographics, or academic levels.
The final component is the analytical/reporting tools for educators, which allow them to access the information stored in the data warehouse through an intuitive, graphical, and user-friendly interface. In this paper, we focus primarily on data analysis through queries and reports via Power BI.
In this paper, referring to the works by Mahnic [43], the teaching and learning data warehouse system development lifecycle, an iterative approach based on the following seven steps is demonstrated in Figure 12.
(1)
Determine system requirements and obtain appropriate values from program leaders and senior management; acquire a diverse set of user requirements from various academic departments in order to obtain the necessary data and reports; identify data sources such as owner, availability, constraints, and quality;
(2)
Design and build a high-performing multi-dimensional model in the database, according to the data from the user requirements in step 1, i.e., SQL Server in this study, according to the user requirements collected from step 1;
(3)
Collaborate with data source owners and IT teams to create database schema and the ETL program for extracting, transforming, and loading source data into the data warehouse system;
(4)
Design the data marts and OLAP cubes in the data warehouse and perform complex measurements and calculations based on user requirements;
(5)
Develop a dynamic and interactive user interface in Power BI for end-users to explore data via mobile, PC, or other applications (for example, Excel, Power BI);
(6)
Launch the System Integration Testing (SIT) and User Acceptance Test (UAT) of the developed solution with end-users and deploy it to the Power BI Cloud;
(7)
Review the developed solution and user feedback and continue the dashboard development.
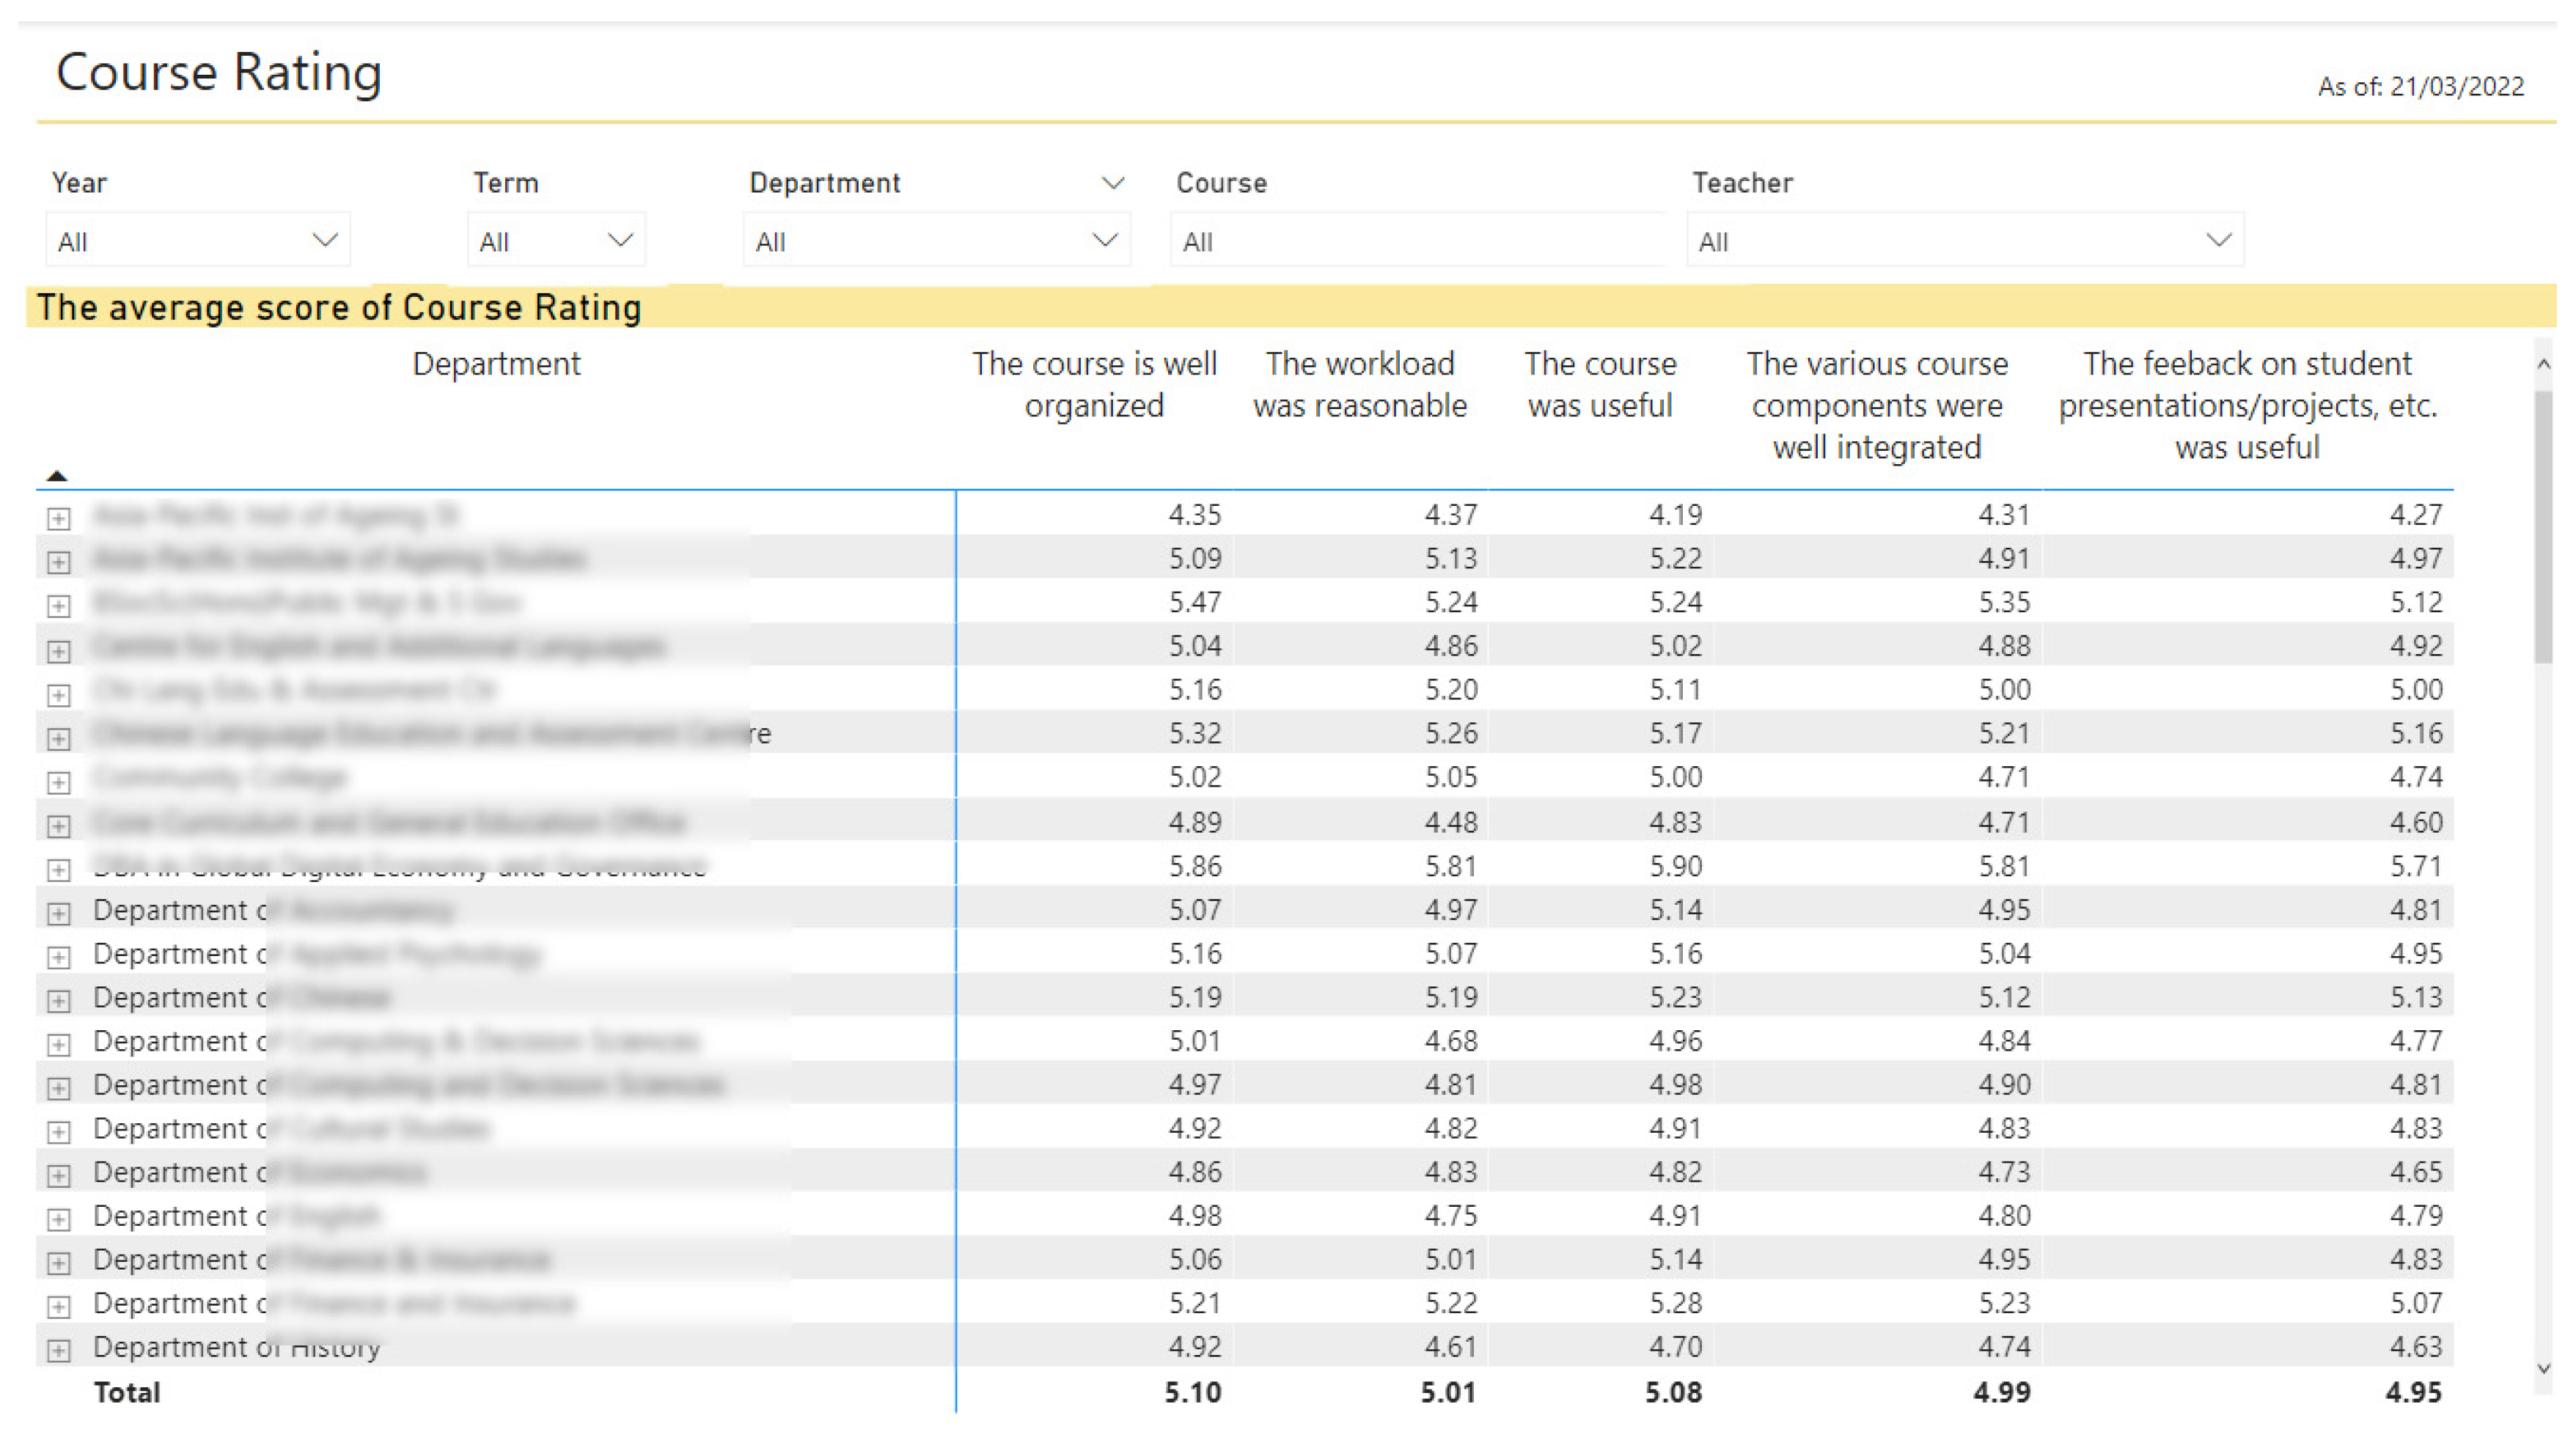
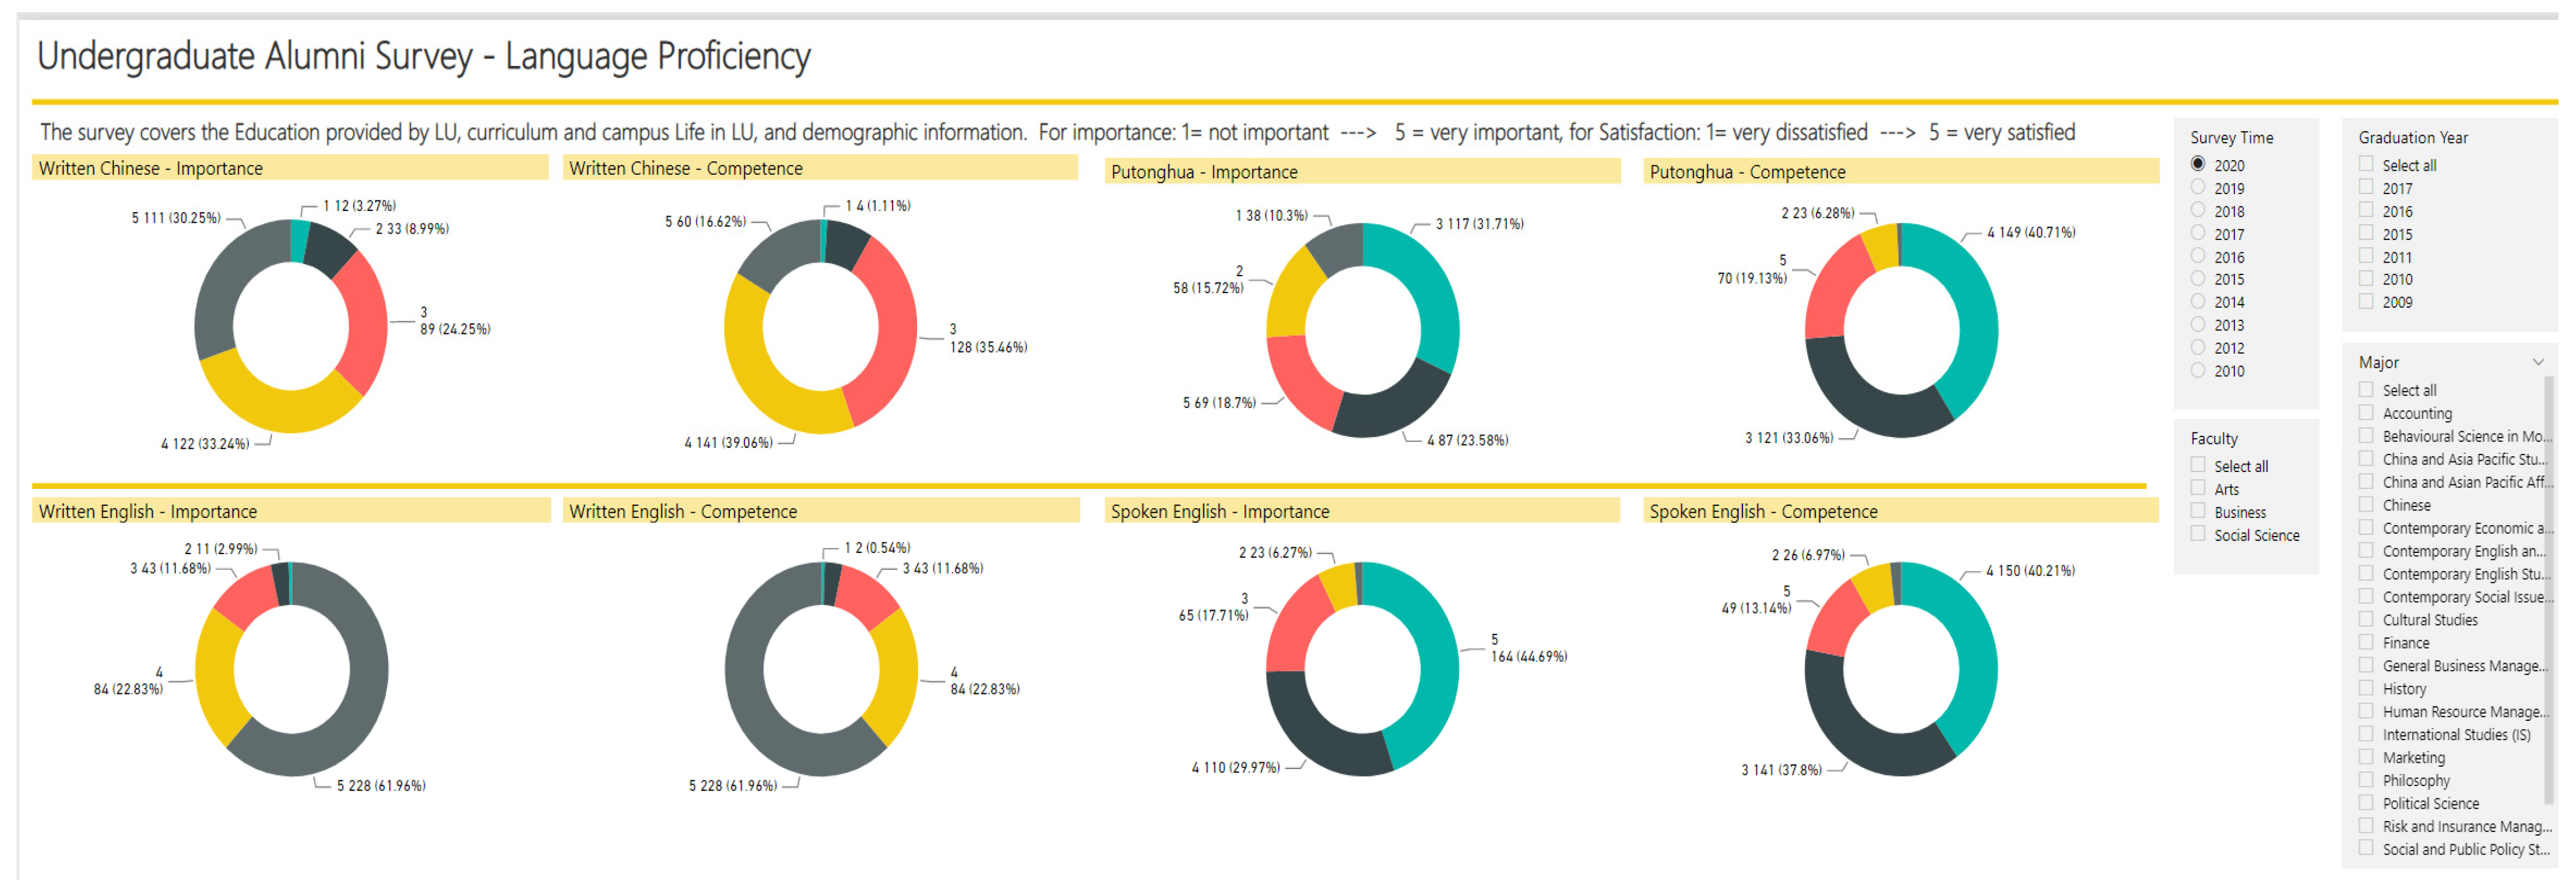
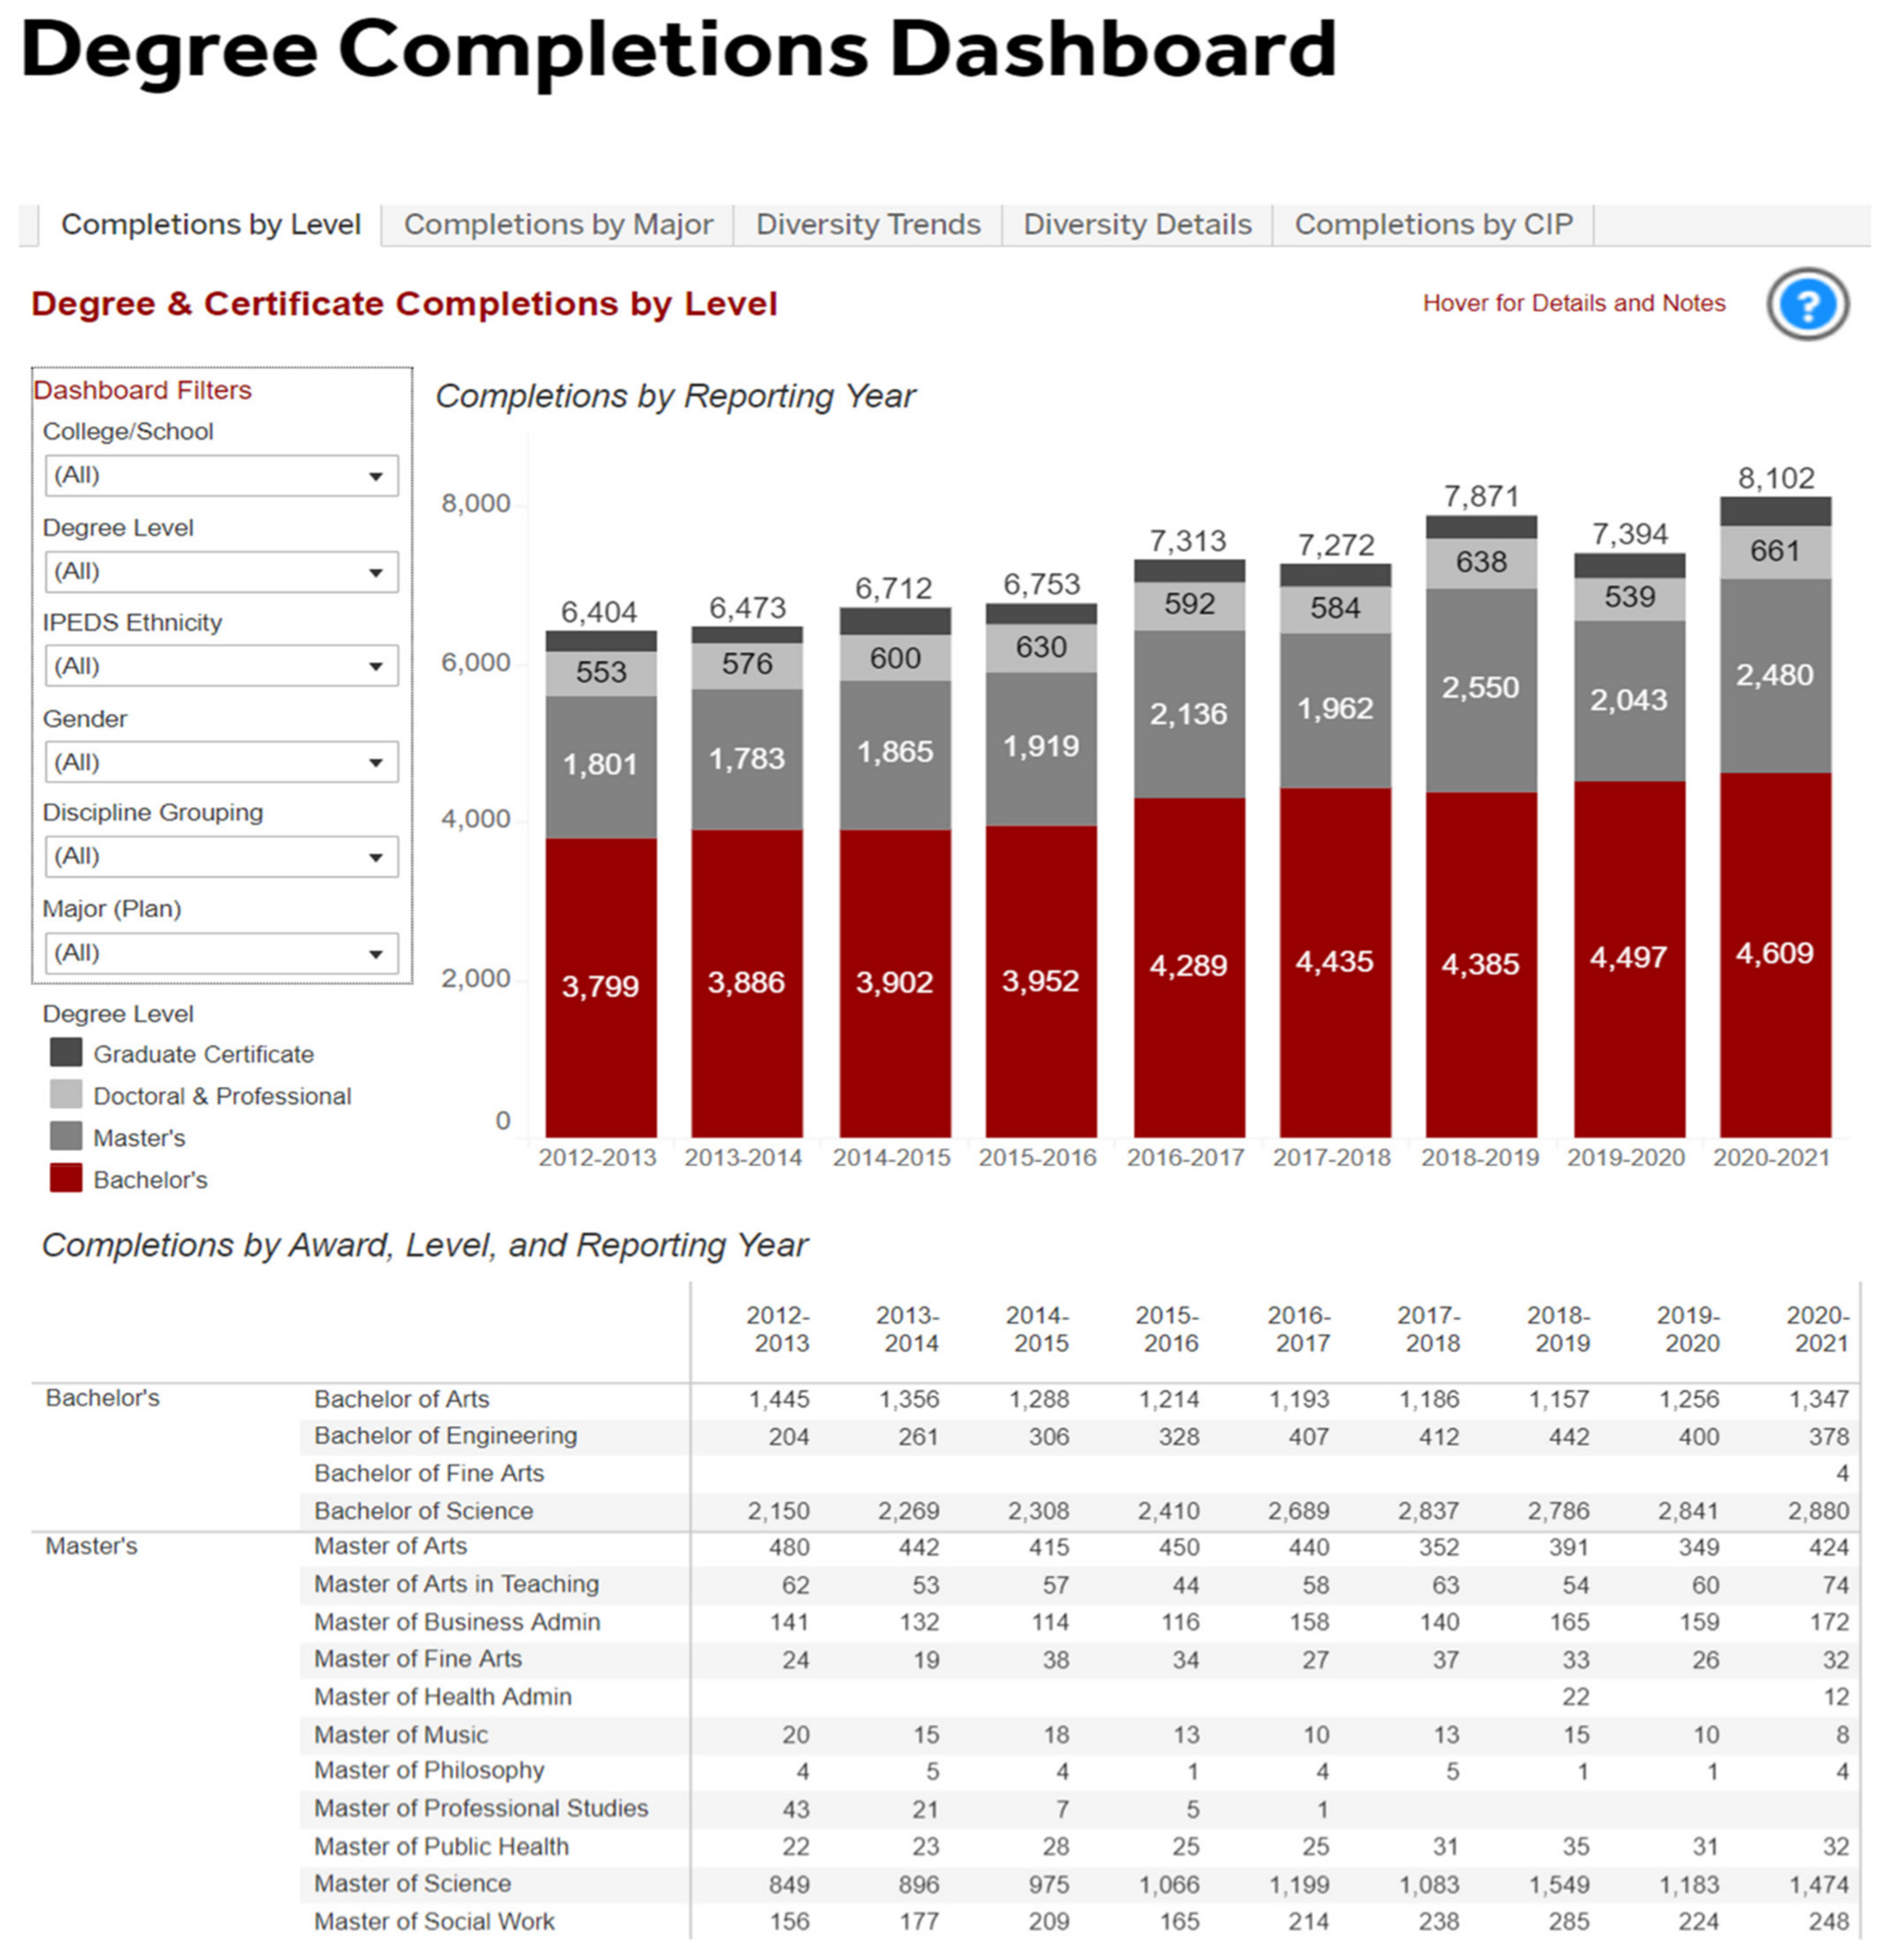
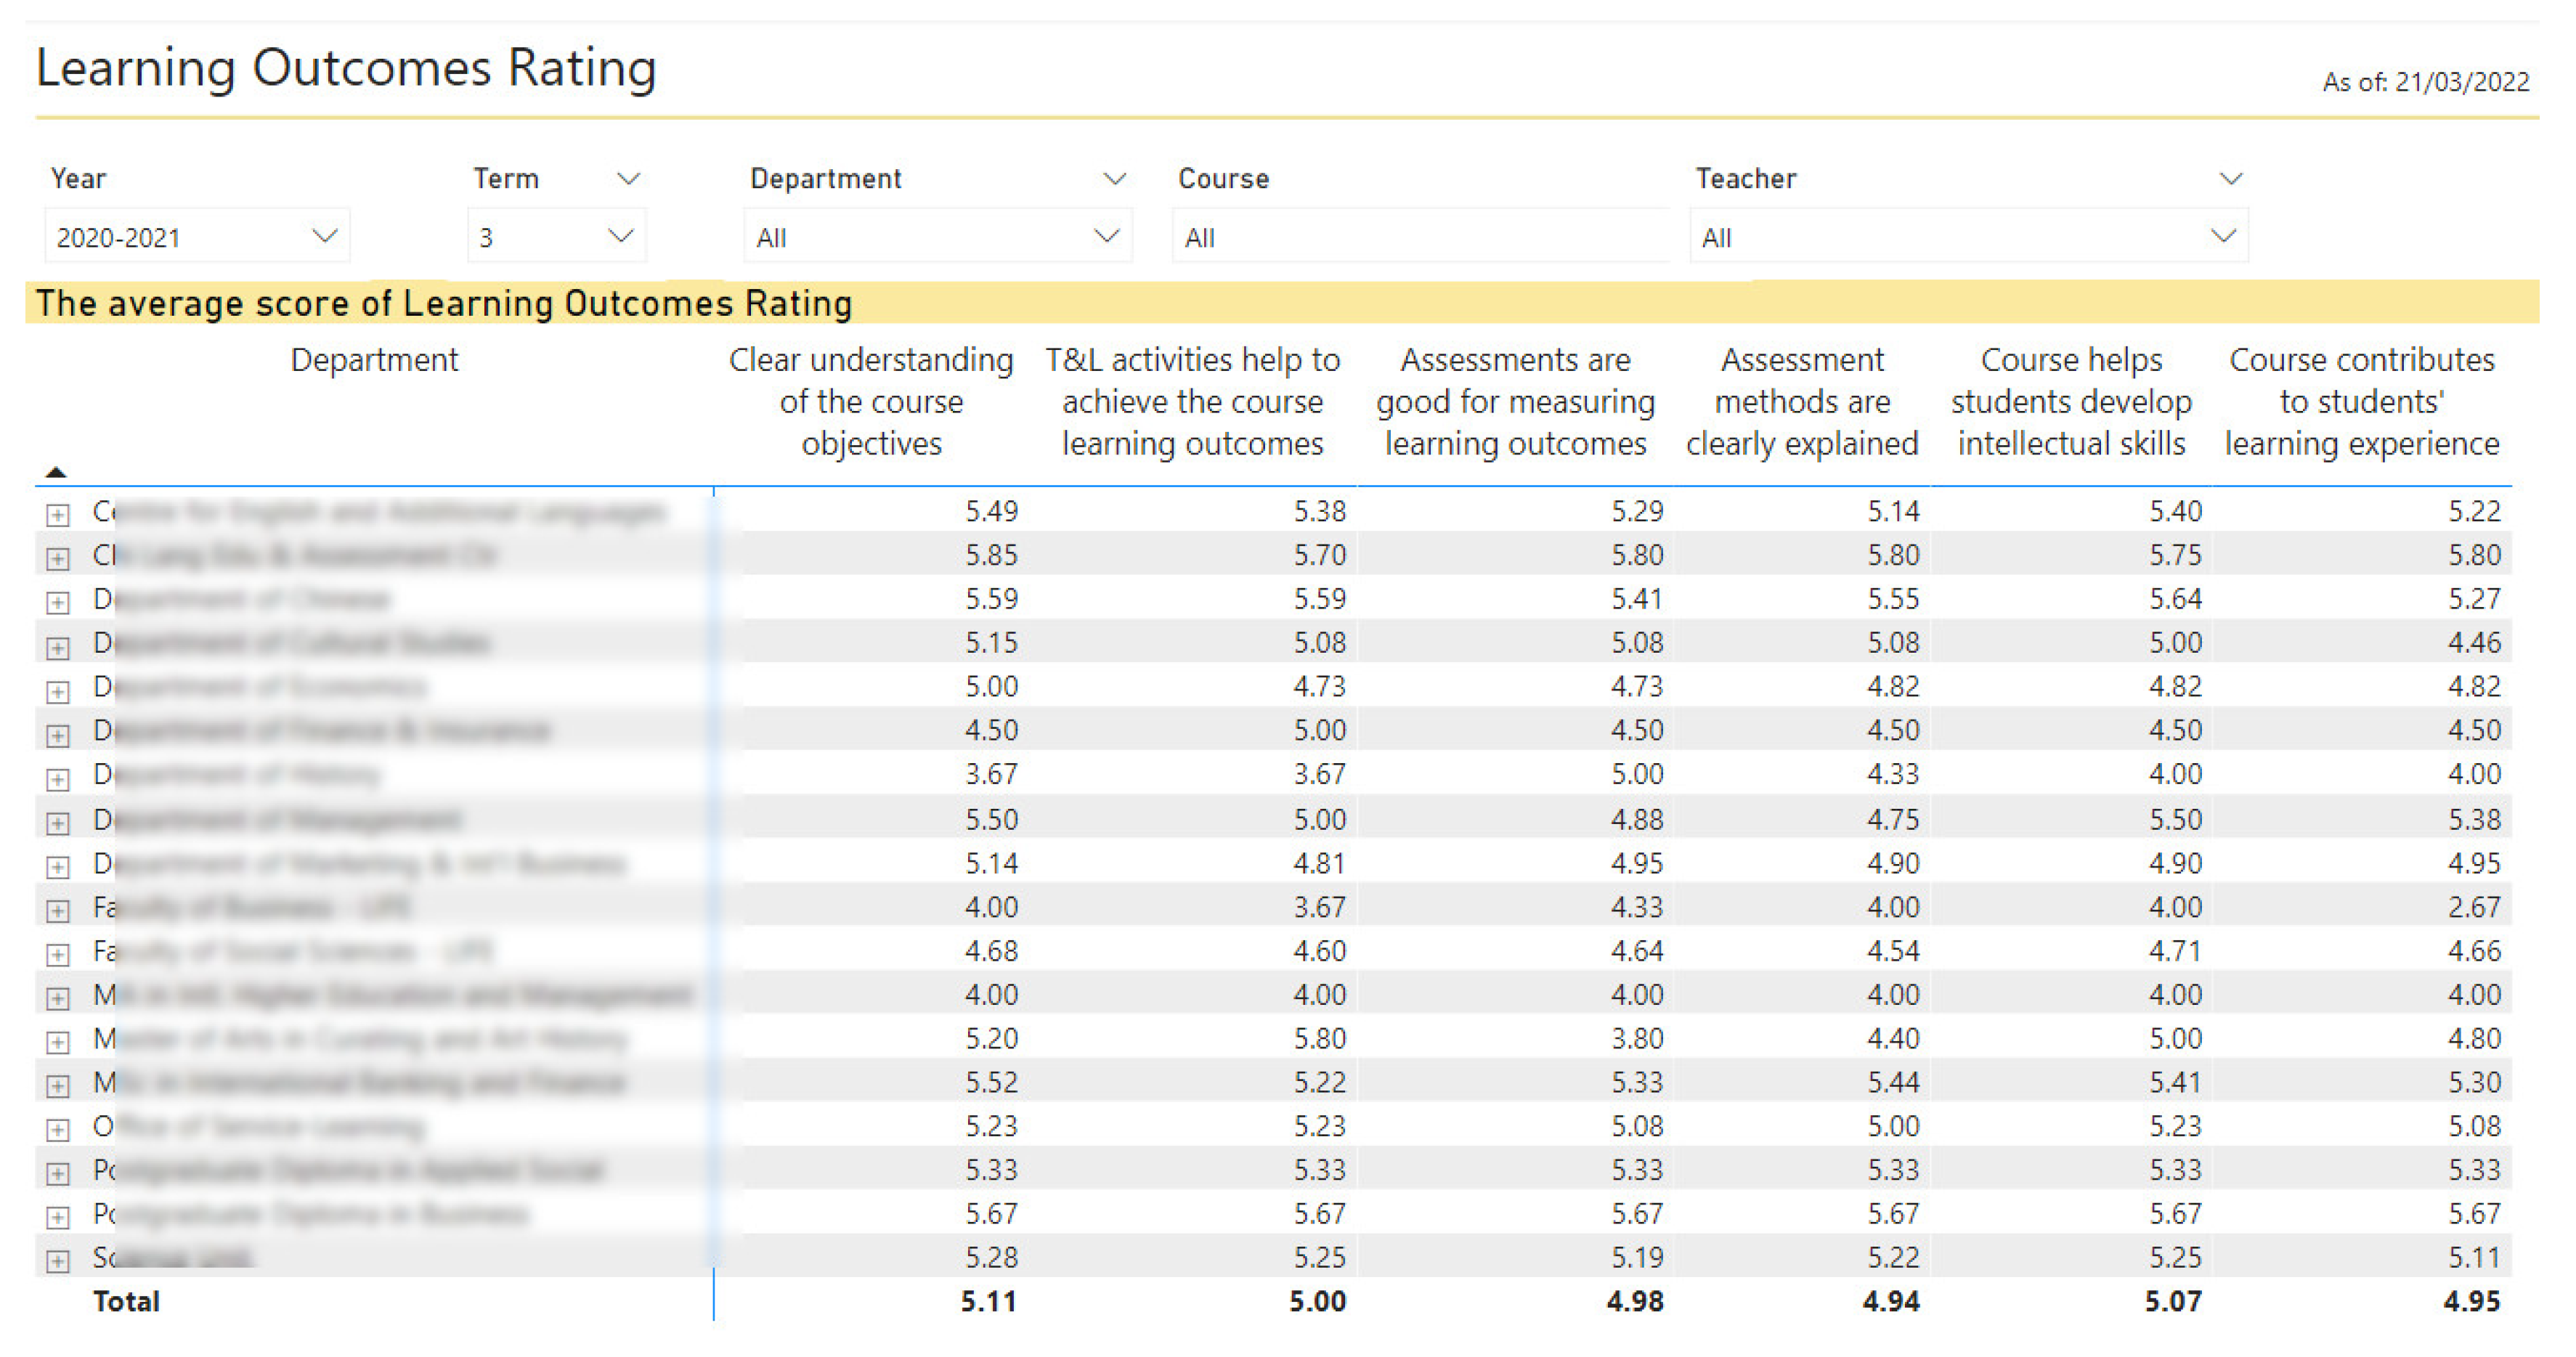
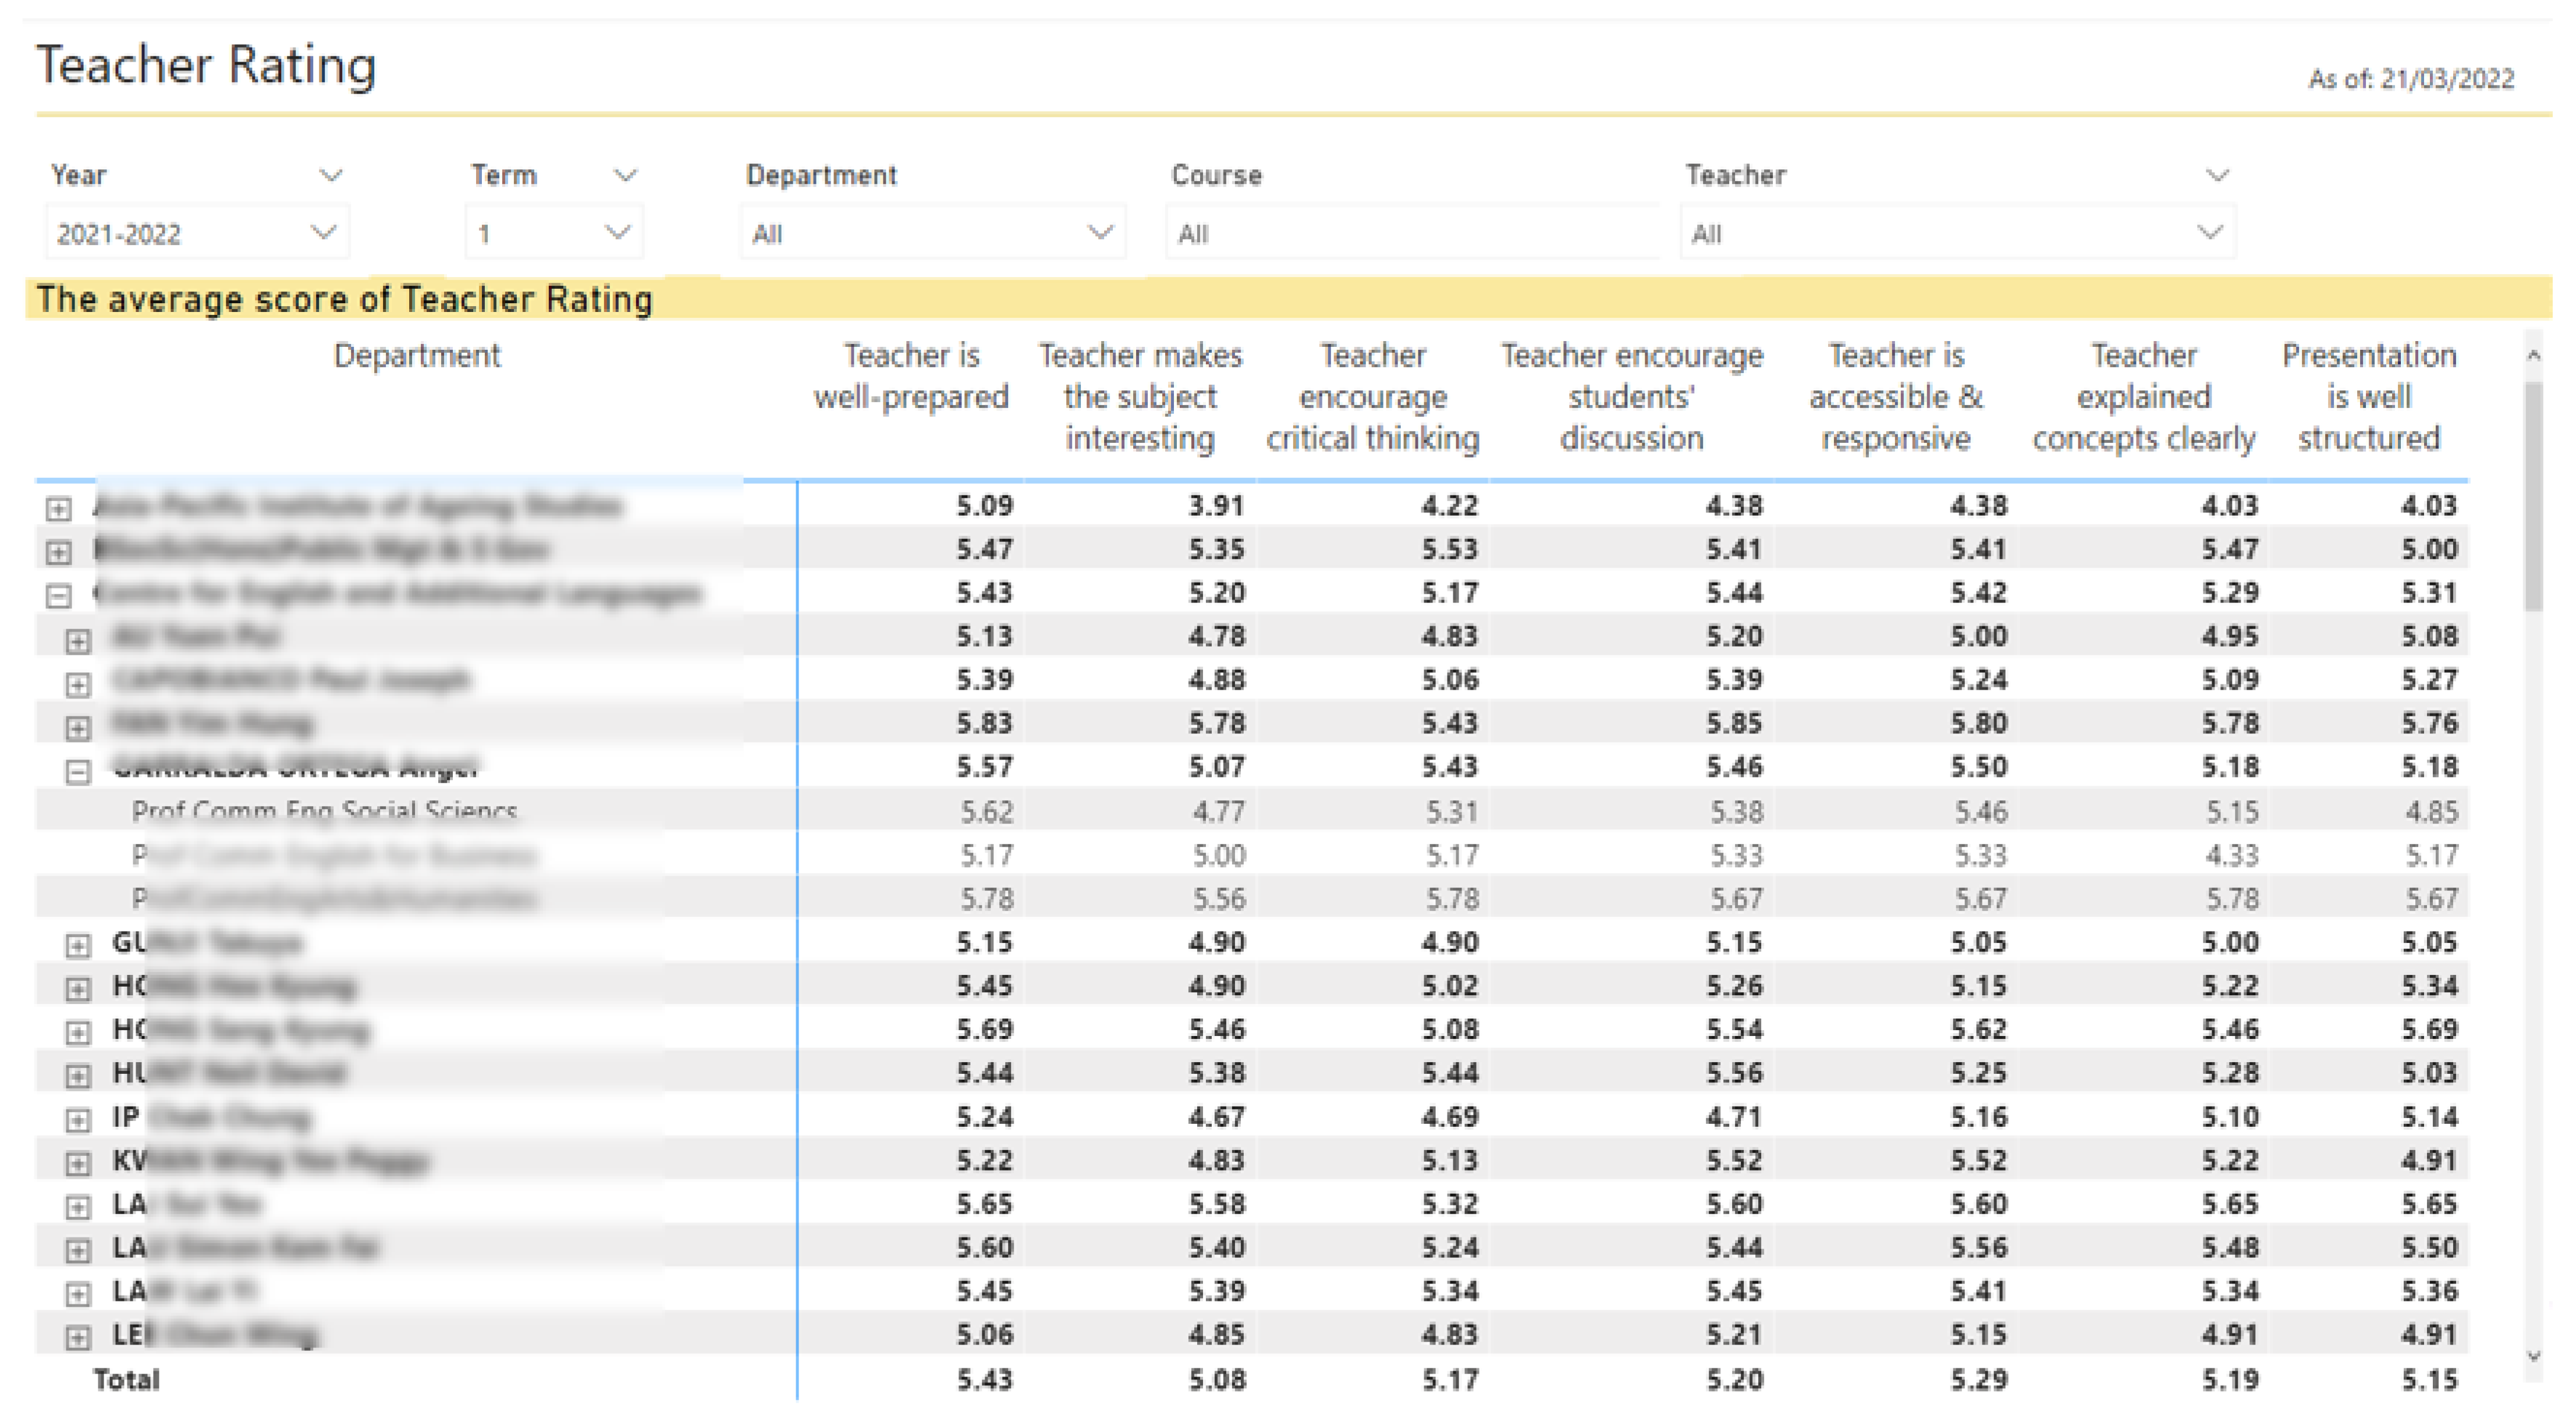
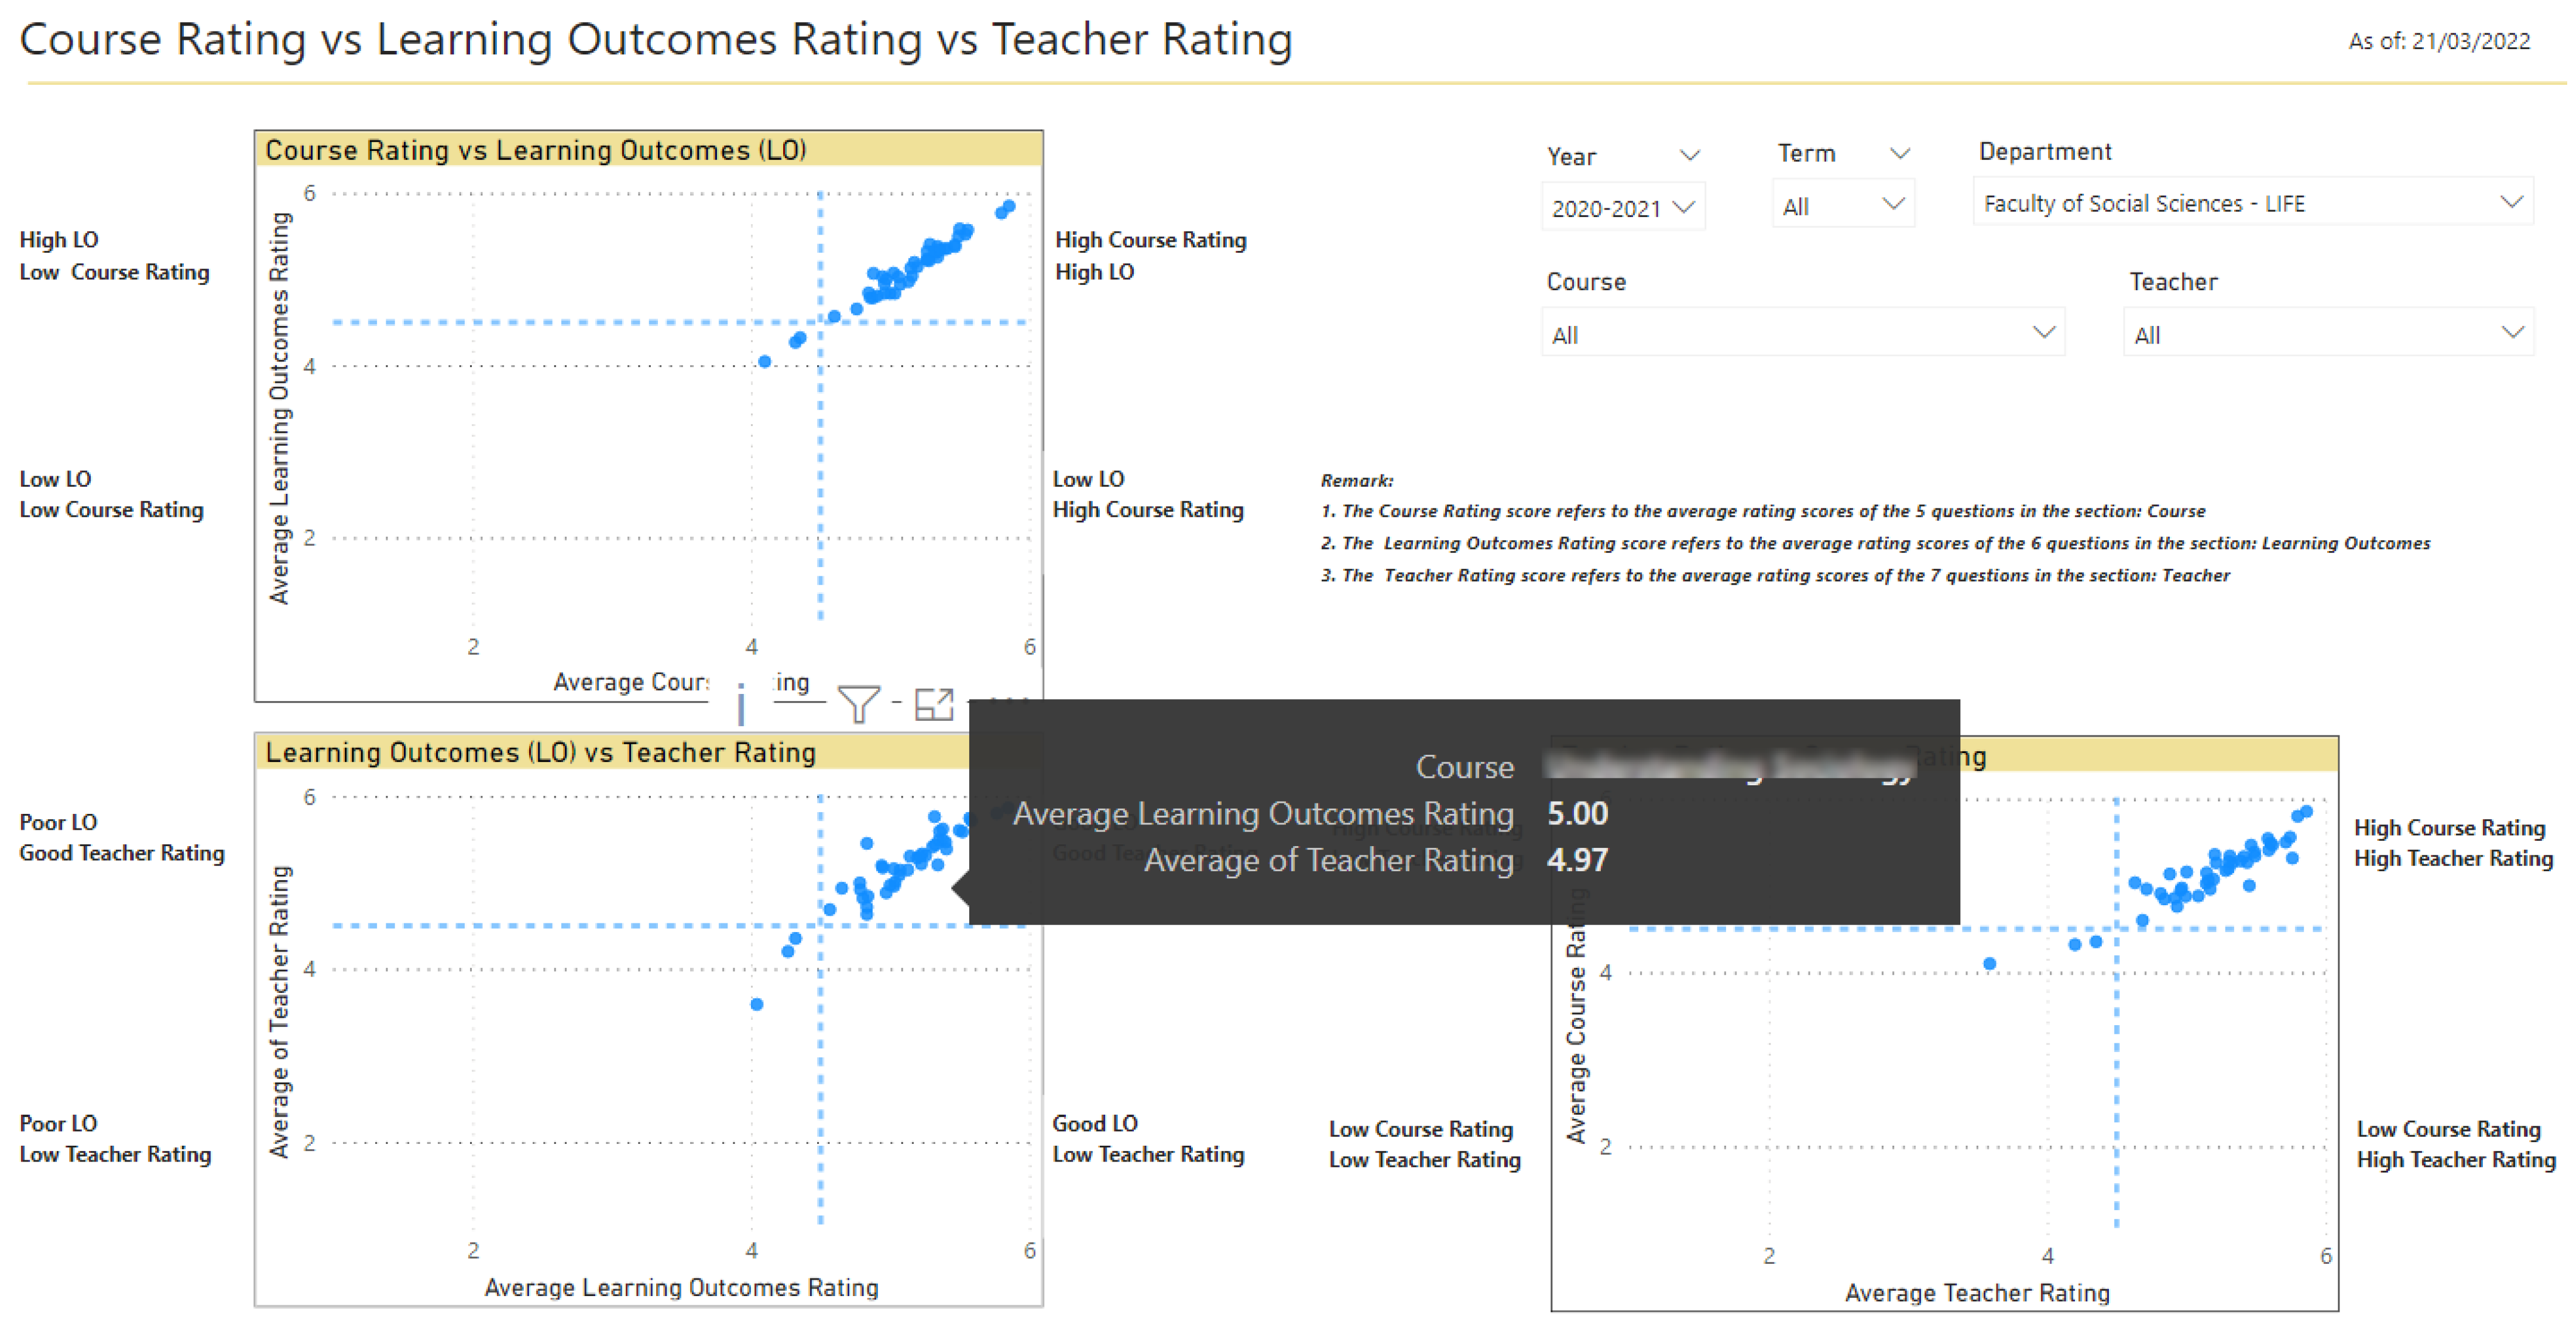
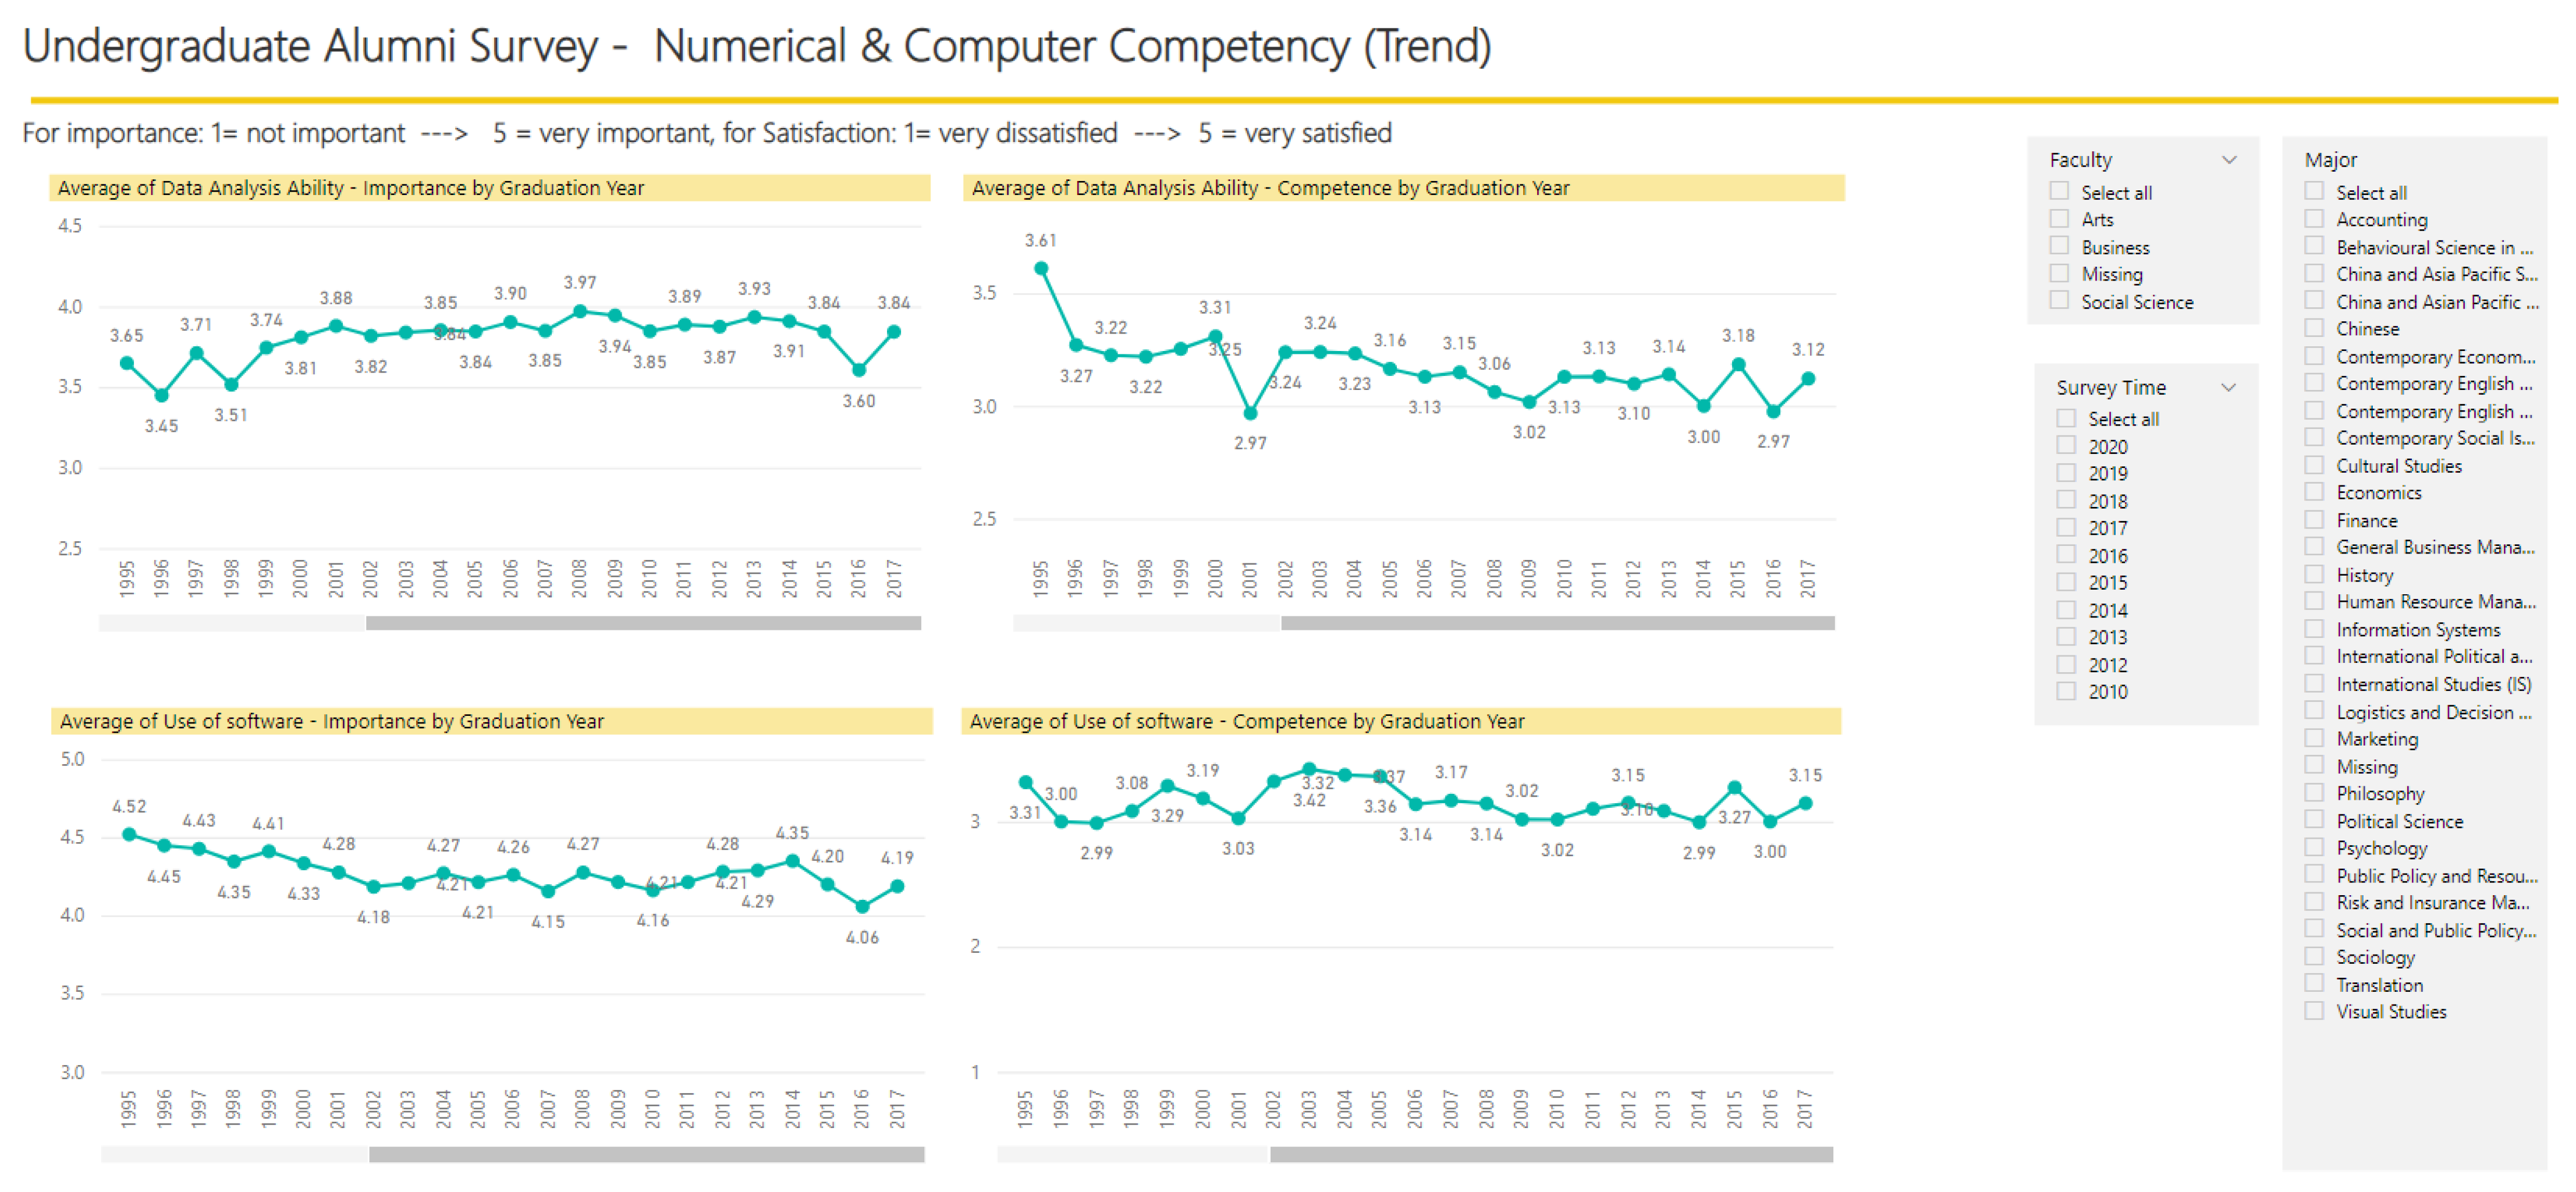
Figure 12. Data warehouse development lifecycle.
Systems 10 00096 g012

4.4. User Interface

This data warehouse makes the collection, visualization, and interrogation of course evaluation data easily accessible for course coordinators and senior administrators. The user interfaces enumerated below permit users to take swift and necessary actions.
The user interface of the course student evaluation, which is a key aspect of the teaching and learning quality assurance for higher education, is presented in this section to demonstrate the viability of the data warehouse system. The data warehouse system provides interactive dashboards for senior management to easily consider and evaluate which courses/teachers need closer scrutiny and ascertain what areas of course enhancement measures are warranted.
Course Teaching and Learning Evaluation (CTLE) in the university is the most common way for students to provide feedback about faculty teaching and course design and delivery, regardless of discipline, program, degree awarded, or institution type [44]. CTLE provides useful information for the review and improvement of courses and of learning resources and processes, and students are encouraged and feel positive about educators who seek feedback on their teaching performance, for example, CTLE results provide staff applying for promotion, substantiation, and contract renewal with some form of evidence on various aspects of their teaching [45].
The three sections of the CTLE questionnaire: (1) Course (5 questions), (2) Learning Outcomes (6 questions), and Teacher (7 questions), are all integrated into the system. For example, students’ ratings on courses (Figure 13), learning outcomes (Figure 14), teachers (Figure 15), correlation of course, and learning outcomes and teacher ratings (Figure 16) are demonstrated below.
As shown in Figure 15, users can view the ratings data of different academic terms and schools by selecting the slicer ‘Year’, ‘Semester’, or ‘Department’ in the dashboard. The slicers ‘Course’ and ‘Teacher’ help users to filter data related to a specific course and course teachers to gain deeper insight by focusing on a particular course.
Users are able to scroll down to the teacher and course levels in the table to see the detailed learning outcomes rating data on a specific teacher and course, as shown in Figure 16.
To monitor and improve the quality of teaching and learning, the university adopts a threshold score of 4.5 as a university-wide acceptable score for all courses as a general reference. With reference to the threshold, a dashboard is developed to demonstrate the correlation between course, learning outcomes, and teacher ratings (Figure 16). This integrated dashboard provides senior management with quick and easy access to all critical data. It compiles all the data together for a deeper understanding and more robust analysis.
For instance, Figure 16 presents the ratings of the courses of a specific department, and end-users can locate the courses with ratings below 4.5. Users can move the mouse over the course point in the visuals, and the pop-up window shows the course name and ratings.
Furthermore, Figure 17 and Figure 18 demonstrate a more interactive dashboard of the system of the university on the alumni survey result to gauge views of alumni on the quality of program and the learning environment of Lingnan. Users can view the ratings data of Written English/Chinese, Spoken English/Chinese, and Putonghua by selecting the slicer-‘Survey Year’, ‘Graduation Year’, ‘Faculty’, and ‘Major’. This would lead to swift and effective action, if necessary.
The yearly changes (Trend) in the numerical & computer competency of alumni are demonstrated in Figure 18. With these dashboards, senior management can easily obtain the following information: level of importance of different skills and competencies obtained in the university for the alumni in the working environment; level of satisfaction with the university provided in terms of nurturing different skills and competencies of students; alumni’s experiences and views on supporting staffs; and the engagement with the university after graduation.
These integrated dashboards present senior management with swift and immediate access to critical data. These dashboards compile all data together for a deeper understanding and more robust analysis. Users can also click on the visuals to filter the data in the report. This would lead to swift and effective action, if necessary.

5. Conclusions

This paper presents a novel teaching and learning analytics data warehouse system that uses a multi-dimensional analysis methodology to analyze large volumes of teaching and learning data. The system provides a simple/interactive interface for senior management/educators to view the status of students at universities comprehensively, including their applications, admission procedures, registration process, and academic progress/status until their graduation.
This novel analytic system allows for effective assessment and solution-based actions, as it enables policymakers and senior management to observe the big picture and gain insight from massive amounts of student courses and teacher evaluation data.
This streamlined system identifies if and where course enhancement measures are needed, benefits teachers/senior management by offering quick access to key data from various sources in one place, facilitates improvements in the quality of teaching and learning by providing snapshots of their creation with relevant information, provides users with a distinct interface to analyze trends over time and to predict future changes in the teaching and learning field, extends teaching and learning performance by enhancing the ability of profound insights and robust analysis, and provides more accurate and comprehensive analysis to support practical decision making by offering hypothetical scenarios.
Overall, this paper suggests liberal arts institutions may use the novel analytical system as a diagnostic tool to monitor, in real-time, their students’ academic performance effectively through their entire learning cycle in the university and identify students/courses requiring special attention so as to take appropriate enhancement actions. Different university stakeholders, especially policymakers and senior management, could be better engaged in the decision-making process by using the system to adjust education policies in time and develop specific, multi-faceted feedback and professional development strategies. They can also provide constructive advice to various academic programmers and associate staff during programmers and teacher performance reviews based on this system. Furthermore, this system is easily adaptable to other disciplines and subject areas to achieve similar results in other tertiary institutions.

Author Contributions

Conceptualization, Q.L. and P.D.; methodology, Q.L.; software, Q.L.; validation, P.D. and Z.Z.; formal analysis, Q.L.; investigation, Q.L.; resources, P.D.; data curation, P.D.; writing—original draft preparation, Q.L.; writing—review and editing, Q.L., P.D. and Z.Z.; visualization, Q.L.; supervision, P.D.; project administration, P.D.; funding acquisition, P.D. All authors have read and agreed to the published version of the manuscript.

Funding

This research was funded by the Special Grant for Strategic Development of Virtual Teaching and Learning: Creating a Learning Enhancement Analytics Platform/Teaching and Learning Datawarehouse. And the APC was funded by this project.

Institutional Review Board Statement

Not applicable.

Informed Consent Statement

Not applicable.

Data Availability Statement

Not applicable, exclude this statement.

Conflicts of Interest

The authors declare no conflict of interest.

References

  1. SOLAR. What Is Learning Analytics. Available online: https://www.solaresearch.org/about/what-is-learning-analytics/ (accessed on 1 March 2022).
  2. Siemens, G. Learning Analytics: The Emergence of a Discipline. Am. Behav. Sci. (Beverly Hills) 2013, 57, 1380–1400. [Google Scholar] [CrossRef] [Green Version]
  3. Wolfgang, G.; Hendrik, D. Translating Learning into Numbers: A Generic Framework for Learning Analytics. J. Educ. Technol. Soc. 2012, 15, 42–57. Available online: http://www.jstor.org/stable/jeductechsoci.15.3.42 (accessed on 1 March 2022).
  4. Freitas, S.; Gibson, D.; Plessis, C.; Halloran, P.; Williams, E.; Ambrose, M.; Dunwell, I.; Arnab, S. Foundations of dynamic learning analytics: Using university student data to increase retention. Br. J. Educ. Technol. 2014, 46, 1175–1188. [Google Scholar] [CrossRef] [Green Version]
  5. Seidel, E.; Kutieleh, S. Using predictive analytics to target and improve first year student attrition. Aust. J. Educ. 2017, 61, 200–218. [Google Scholar] [CrossRef]
  6. Ali, F.; Ng, S. Moodle Data Retrieval for Educational Data Mining. Int. J. Sci. Eng. Technol. 2015, 4, 523–525. [Google Scholar] [CrossRef] [Green Version]
  7. Zorrilla, M. Data Warehouse technology for e-learning. In Methods and Supporting Technologies for Data Analysis; Sage Publishing: New York, NY, USA, 2009; Volume 225, pp. 1–20. [Google Scholar]
  8. Silva, D.; Vieira, M. Using Data Warehouse and Data Mining Resources for Ongoing Assessment of Distance Learning. 2002. Available online: http://citeseerx.ist.psu.edu/viewdoc/summary?doi=10.1.1.104.5146 (accessed on 1 March 2022).
  9. Zorrilla, M.; Menasalvas, E.; Marín, D.; Mora, E.; Segovia, J. Web usage mining project for improving web-based learning sites. In Proceedings of the International Conference on Computer Aided Systems Theory, Las Palmas de Gran Canaria, Spain, 7–11 February 2005; pp. 205–210. [Google Scholar] [CrossRef]
  10. Lam, P.; Keing, C.; McNaught, C.; Cheng, K.-F. Monitoring eLearning environments through analyzing web logs of institution-wide eLearning platforms. In Proceedings of the ASCILITE 2006—The Australasian Society for Computers in Learning in Tertiary Education, Sydney, Australia, 3–6 December 2006; Volume 1. [Google Scholar]
  11. Govindan, K.; Cheng, T.C.E.; Mishra, N.; Shukla, N. Big data analytics and application for logistics and supply chain management. Transp. Res. Part E Logist. Transp. Rev. 2018, 114, 343–349. [Google Scholar] [CrossRef]
  12. Chaurasia, S.S.; Frieda Rosin, A. From Big Data to Big Impact: Analytics for teaching and learning in higher education. Ind. Commer. Train. 2017, 49, 321–328. [Google Scholar] [CrossRef]
  13. Sinaga, A.S.; Girsang, A.S. University Accreditation using Data Warehouse. J. Phys. Conf. Ser. 2017, 801, 12030. [Google Scholar] [CrossRef]
  14. Viswanath, D.K.; Kusuma, S.; Gupta, S.K. Cloud Computing Issues and Benefits Modern Education. Glob. J. Comput. Sci. Technol. 2012, 7, 508. Available online: https://computerresearch.org/index.php/computer/article/view/508 (accessed on 1 March 2022).
  15. Ivanović, M.; Klašnja-Milićević, A. Big data and collective intelligence. Int. J. Embed. Syst. 2019, 11, 573–583. [Google Scholar] [CrossRef]
  16. Ewell, P. Twenty Years of Quality Assurance in Higher Education: What’s Happened and What’s Different? Qual. High. Educ. 2010, 16, 173–175. [Google Scholar] [CrossRef]
  17. Santoso, L.W. Data Warehouse with Big Data Technology for Higher Education. Procedia Comput. Sci. 2017, 124, 93–99. [Google Scholar] [CrossRef]
  18. Aljawarneh, I.M. Design of a data warehouse model for decision support at higher education: A case study. Inf. Dev. 2016, 32, 1691–1706. [Google Scholar] [CrossRef]
  19. Bassil, Y. A Data Warehouse Design for a Typical University Information System. arXiv 2012, arXiv:1212.2071. [Google Scholar]
  20. Arthur, L. From performativity to professionalism: Lecturers’ responses to student feedback. Teach. High. Educ. 2009, 14, 441–454. [Google Scholar] [CrossRef]
  21. Shah, M.; Sid Nair, C. The changing nature of teaching and unit evaluations in Australian universities. Qual. Assur. Educ. 2012, 20, 274–288. [Google Scholar] [CrossRef]
  22. Boring, A.; Ottoboni, K.; Stark, P. Student Evaluations of Teaching (Mostly) Do Not Measure Teaching Effectiveness. Sci. Res. 2016. [Google Scholar] [CrossRef]
  23. Kumaladewi, N.; Sugiarti, Y. Design analysis of data warehouse for lecturer performance evaluation (Case study: Faculty of science and technology UIN Jakarta). In Proceedings of the 2016 4th International Conference of Cyber IT Service Management, Bandung, Indonesia, 26–27 April 2016; pp. 1–6. [Google Scholar]
  24. Pérez-Pérez, Y.M.; Rosado-Gómez, A.A.; Puentes-Velásquez, A.M. Application of business intelligence in the quality management of higher education institutions. J. Phys. Conf. Ser. 2018, 1126, 12053. [Google Scholar] [CrossRef]
  25. Vieira, C.; Parsons, P.; Byrd, V. Visual learning analytics of educational data: A systematic literature review and research agenda. Comput. Educ. 2018, 122, 119–135. [Google Scholar] [CrossRef]
  26. Marengo, A.; Pagano, A.; Barbone, A. Data mining methods to assess student behavior in adaptive e-learning processes. In Proceedings of the 2013 Fourth International Conference on e-Learning Best Practices in Management, Design and Development of e-Courses: Standards of Excellence and Creativity, Washington, DC, USA, 7–9 May 2013; pp. 303–309. [Google Scholar] [CrossRef]
  27. Jayakody, J.; Perera, I. Enhancing competencies of less-able students to achieve learning outcomes: Learner aware tool support through Business intelligence. In Proceedings of the 2016 IEEE International Conference on Teaching, Assessment, and Learning for Engineering (TALE), Bangkok, Thailand, 7–9 December 2016; pp. 154–160. [Google Scholar]
  28. Daniel, A.; Pablo, G.; Luis, H.-I.; David, F. Educational Warehouse: Modular, Private and Secure Cloudable Architecture System for Educational Data Storage, Analysis and Access. Appl. Sci. 2021, 11, 806. [Google Scholar] [CrossRef]
  29. Neamah, A. Adoption of Data Warehouse in University Management: Wasit University Case Study. J. Phys. Conf. Ser. 2021, 1860, 012027. [Google Scholar] [CrossRef]
  30. Yu, X. The Application of Data Warehouse in Teaching Management in Colleges and Universities. J. Phys. Conf. Ser. 2021, 1738, 012090. [Google Scholar] [CrossRef]
  31. Jayashree, G.; Priya, C. Comprehensive guide to implementation of data warehouse in education. In Intelligent Computing and Innovation on Data Science; Peng, L.H., Son, G., Balaganesh, S.D., Eds.; Springer: Singapore, 2020; pp. 1–8. [Google Scholar]
  32. Harper College, Institutional Effectiveness Dashboard. Available online: https://www.harpercollege.edu/leadership/accountability/iem/index.php (accessed on 1 March 2022).
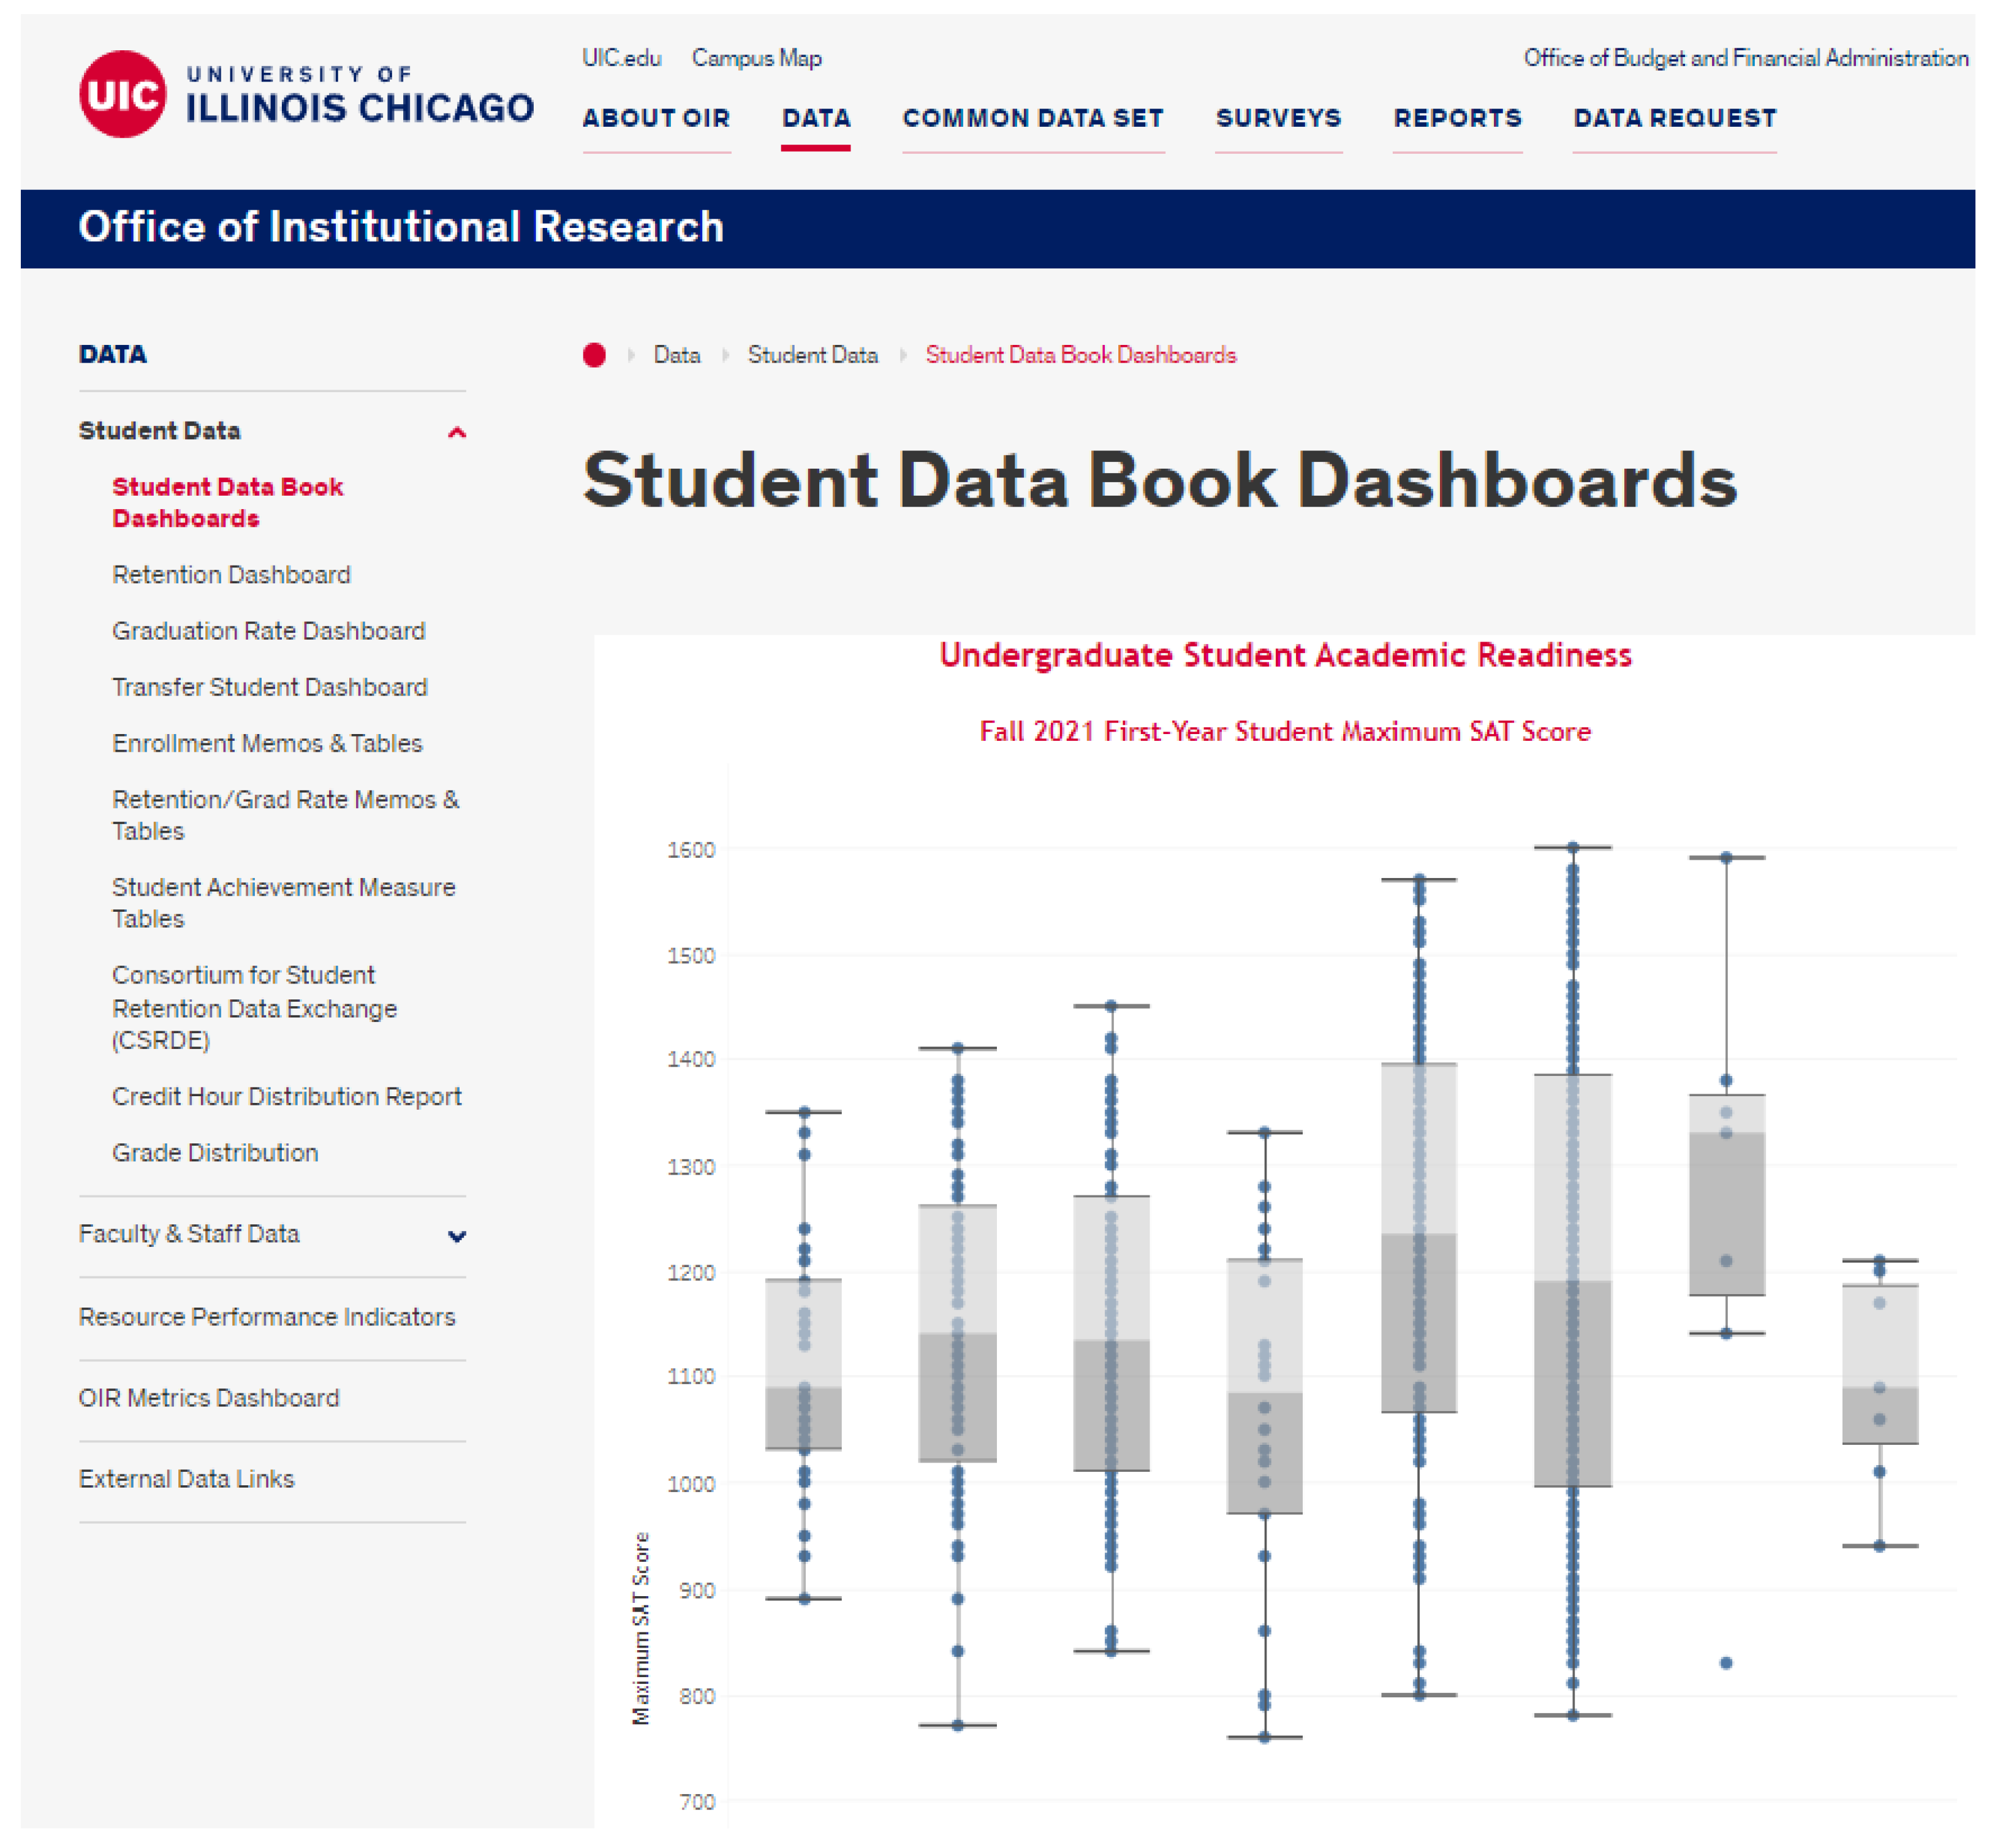
  33. University of Illinois Chicago. Student Data Book Dashboards. Available online: https://oir.uic.edu/data/student-data/data-book-dashboards-2/ (accessed on 1 March 2022).
  34. UOCs Diego. Graduate Student Experience in the Research University (gradSERU) Results. Available online: https://ir.ucsd.edu/grad/surveys/gradseru/gradseru-results.html (accessed on 1 March 2022).
  35. TMCC. General Education Assessment. Available online: https://www.tmcc.edu/institutional-research/data-dashboards/institutional-effectiveness/general-education-assessment (accessed on 1 March 2022).
  36. University of Tennessee at Chattanooga. Institutional Dashboard: General Education. Available online: https://www.utc.edu/academic-affairs/planning-evaluation-and-institutional-research/institutional-dashboards/general-education (accessed on 1 March 2022).
  37. NJIT. Student Experience/Satisfaction Survey Reports. Available online: https://www.njit.edu/oie/student-experiencesatisfaction-survey-reports (accessed on 1 March 2022).
  38. USD. Student Satisfaction Dashboard. Available online: https://www.usd.edu/institutional-research/student-satisfaction-dashboard (accessed on 1 March 2022).
  39. Buffalo State, SUNY Student Opinion Survey. Available online: https://institutionaleffectiveness.buffalostate.edu/suny-student-opinion-survey (accessed on 1 March 2022).
  40. Qingyun, L.; Zihao, L.; Jie, H.; Huimin, M. Quality Assurance for Performing Arts Education: A Multi-Dimensional Analysis Approach. Appl. Sci. 2022, 12, 4813. [Google Scholar] [CrossRef]
  41. Chen, H.; Chiang, R.H.L.; Storey, V.C. Business Intelligence and Analytics: From Big Data to Big Impact. MIS Q. 2012, 36, 1165–1188. [Google Scholar] [CrossRef]
  42. Database Guide. What Is OLTP? Available online: https://database.guide/what-is-oltp/#:~:text=OLTP%20(Online%20Transactional%20Processing)%20is,a%20large%20number%20of%20users (accessed on 1 March 2022).
  43. Mahnic, V. Data warehouse for an e-learning platform. In Proceedings of the 14th WSEAS International Conference on Computers, Corfu Island, Greece, 23–25 July 2010. [Google Scholar]
  44. Anderson, H.M.; Cain, J.J.; Bird, E.R. Online Student Course Evaluations: Review of Literature and a Pilot Study. Available online: https://www.semanticscholar.org/paper/Online-Student-Course-Evaluations-%3A-Review-of-and-a-Anderson-Cain/99fa9c23abdae1871db9690af1d427e10e5a32ff (accessed on 1 March 2022).
  45. Lingnan University. Term-End Course Teaching and Learning Evaluation (CTLE) Policy and Guidelines. Available online: https://www.ln.edu.hk/itsc/services/learning-and-teaching-services/ctle (accessed on 1 March 2022).
Figure 1. The Dashboard developed by [33].
Systems 10 00096 g001
Figure 2. The General Education Dashboard developed by TMCC [35].
Systems 10 00096 g002
Figure 3. The Degree Completion Dashboard developed by Stony Brook University [33].
Systems 10 00096 g003
Figure 4. Seven key areas implemented in this study.
Systems 10 00096 g004
Figure 5. Overlapping of the analytics levels in this study referring.
Systems 10 00096 g005
Figure 6. A 3D data cube for the student performance tracking.
Systems 10 00096 g006
Figure 7. An overview of the data flow in a data warehouse.
Systems 10 00096 g007
Figure 8. OLTP vs. OLAP.
Systems 10 00096 g008
Figure 9. The ETL SSIS package for retrieving the LMS data.
Systems 10 00096 g009
Figure 10. The data flow in the data warehouse in this study referring [40].
Systems 10 00096 g010
Figure 11. The entity relationship diagram of Student Enrollment in the data warehouse.
Systems 10 00096 g011
Figure 13. The Course Rating Dashboard. Note: Information pertaining to department names is blurred.
Systems 10 00096 g013
Figure 14. The Learning Outcomes Rating Dashboard. Note: Information pertaining to department names has been blurred.
Systems 10 00096 g014
Figure 15. The Teacher Rating Dashboard. Note: Information pertaining to department names has been blurred.
Systems 10 00096 g015
Figure 16. The correlation between course, learning outcomes and teacher. Note: Information pertaining to department names has been blurred.
Systems 10 00096 g016
Figure 17. The dashboard of Language Proficiency in alumni survey.
Systems 10 00096 g017
Figure 18. The dashboard of Numerical & Computer Competency in alumni survey.
Systems 10 00096 g018
Publisher’s Note: MDPI stays neutral with regard to jurisdictional claims in published maps and institutional affiliations.

