
Combining the MDM and BWM Algorithm to Determine the Optimal Crowdfunding Tokenization Solution for Digital Assets Market Startups

1
Department of International Business Administration, Chinese Culture University, 55 Hwa-Kang Road, Yang-Ming-Shan, Taipei City 111, Taiwan
2
Department of Public Finance and Tax Administration, National Taipei University of Business, 321, Sec. 1, Jinan Road, Zhongzheng District, Taipei City 100, Taiwan
*
Author to whom correspondence should be addressed.
Systems 2022, 10(4), 87; https://doi.org/10.3390/systems10040087
Submission received: 28 March 2022
/
Revised: 5 May 2022
/
Accepted: 9 May 2022
/
Published: 28 June 2022
(This article belongs to the Special Issue Decision-Making Process and Its Application to Business Analytic)
Abstract
:This study aimed to use the modified Delphi method and best worst method to establish an evaluation model for analyzing the perspectives and key influencing factors used in evaluating startups’ optimal token-financing solutions. In accordance with the modified Delphi method, a list of influencing factors was obtained through expert opinions and a literature review, and, further, adopted to construct an evaluation model and the subsequent weights. Thereafter, the relative weight of each factor in the best worst method framework was determined, to obtain the optimal token-financing solution. This study makes important contributions in theory and in practice by providing a decision-making model based on the modified Delphi method and the best worst method, which can serve as a valuable reference and measurement tool for startups to evaluate optimal solutions, when undertaking token financing. Academically, it contributes to the literature by providing an application process that integrates the modified Delphi method and the best worst method, and introduces an optimal evaluation framework for startups to use when undertaking token financing. In addition, it makes a practical contribution in the context of the rapid development of FinTech, as the evaluation model proposed in this study can be a valuable measurement tool for startup entrepreneurs who intend to use token financing to improve the capital turnover rate of their equity.
1. Introduction
In recent years, financial technology (FinTech) has displayed a tendency toward the goal of inclusive financing. FinTech, which aims to use information technology to provide financial solutions, is an important indicator of new business model development in the financial industry. Its scope includes areas such as information security, financial services, mobile payments, and crowdfunding. Solving financial problems through information technology can reduce costs, improve the quality of financial services, and create a diversified and stable financial landscape to reshape the financial industry [1,2,3]. Owing to the rise of FinTech and the deregulations of the Jumpstart Our Business Startups (JOBS) Act in the United States [4], crowdfunding has become the latest financing mechanism for companies to obtain external funds [5,6]. In 2014, the scale of crowdfunding reached USD 16.2 billion, an increase of 167% from 2013 [7]. In addition, the total transaction value of alternative financing measured by Statista Inc. (Hamburg, Germany) (2020) was USD 6.1 billion, of which crowdfunding had the largest market share [8]. It proves that the crowdfunding market has been rapidly expanding within the global financial market.
There are several crowdfunding formats. First, in donation-based crowdfunding, voluntary donations are collected to support the execution of projects. Second, in reward-based crowdfunding, investors obtain non-monetary rewards in exchange for their contributions. Third, in debt-based crowdfunding, credit agreements are drawn up between investors and fundraisers with specific interest-related stipulations. Fourth, in equity-based crowdfunding, private company offer securities to raise capital from groups of investors, including current shareholders and customers. In return for capital, investors receive small slivers of ownership in the business, as well as dividends and an increased share value in that business, if the business succeeds [9,10,11].
Estrin et al. (2016) pointed out that equity-based crowdfunding is primarily conducted through the Internet or social media, not only reducing transaction costs but also providing startups new mechanisms to generate investor goodwill [12]. Although crowdfunding has many financing advantages for startups, it poses risks such as uncertain equity rights, liquidity, and the impairment of shareholders’ equity [13,14,15]. Therefore, studies have, also, proposed that startups issue tokens to obtain funds based on the distributed and immutable ledger technology that blockchains use. This method not only reduces the potential risks of traditional crowdfunding platforms but also improves transaction transparency [15,16,17,18]. Howell et al. (2020) found that token financing has become an important digital-platform financing source for companies [19]. Currently, the development of crowdfunding tokenization mainly includes three modes: (1) initial coin offerings (ICO); (2) initial exchange offerings (IEO); and (3) security token offerings (STO). The advantages of ICO are the low cost and high speed of issuances. However, risks such as theft and fraud exist [19,20,21]. IEOs’ advantages include the guarantees by third-party platforms based on their reputation and direct trading systems, but it poses concerns about token price manipulation [20,22]. Finally, the advantages of STOs are their high level of security and protection by regional government regulations. However, STOs are impeded by high audit complexity and low liquidity [20,23]. Studies have also indicated that token financing is more efficient than equity financing for startups [24]. Due to the features of decentralization, companies resorting to financing tokenization can expect fewer tokens, when inventors’ entry barriers and platform fees incurred are considered, for encouraging them to join the platform by reducing entrepreneurs’ financing burdens. Token financing is, thus, an important strategy for companies to improve their operational efficiency. The advantages, disadvantages, and potential risks of the three token-financing solutions vary. If startups fail to raise funds through optimal token-financing channels, it is likely to affect their financing efficiency and lead to equity turnover. Prior studies on token financing mainly focus on risk–return analyses [25,26,27,28], token regulations [29,30,31], the hedging capability of tokens [32,33,34,35], predicting token price volatility [36,37,38,39], and financial risks evaluation [40,41,42]. However, relevant evidence and applicable measurement tools for evaluating the optimal token-financing solutions available to startups are rare. In addition, processes with multiple decision-making criteria can be used to construct an evaluation model to obtain an optimal solution [43,44,45,46]. Furthermore, studies have clearly pointed out that optimal solutions can be obtained by applying an Analytic Hierarchy Process (AHP) or other multiple criteria decision-making method [45,47,48,49,50], such as Kumar et al. (2021) evaluating the circular economy adoption barriers by ISM-ANP, Bathrinath et al. (2021) applying the AHP-TOPSIS to evaluate the risk in textile industries, and Emamat et al. (2022) using the ELECTRE-TRI method to select a stock portfolio [51,52,53]. AHP is suitable for evaluating optimal solutions in various fields. Lam and Zhao (1998) indicated that AHP is a subjective model for research focusing on a specific problem, therefore, it is not necessary to apply a large sample [54]. Cheng and Li (2002) represented that it may not be necessary to utilize AHP in research with a large sample size because ‘cold-called’ experts may provide arbitrary responses, which may have a significant effect on the consistency of judgments [55]. However, since AHP uses a pairwise comparison matrix to find a solution, the process is complex, and evaluations are easily distorted if there are excessive evaluation criteria. Therefore, Rezaei (2015, 2016) proposed the Best Worst Method (BWM) to solve the challenges of AHP in large-scale pairwise comparisons and when lacking in consistency [56,57]. Rezaei (2015) constructed a new framework to overcome the complex comparisons’ problem [56]. The best and the worst objects are the predefined benchmarks or references for all the rest of the objects. BWM offers an effective way to make strategic decisions: it enables decision-makers to quantitatively implement several criteria concepts, in order to identify possible alternatives and, then, select the optimal solution. The BWM is a new architecture of pairwise comparisons, which is quite different from the AHP concept [58]. Moreover, studies, also, consider BWM a powerful research tool for evaluating and finding optimal solutions [59,60,61,62].
The goal of inclusive finance has led to the rapid development of FinTech, which mainly uses information technology to provide financial solutions. It has become an important aspect in the future development of new business models in the financial industry. Startups find it difficult to raise funds from traditional financial institutions because of their limited operational and financial structures. Therefore, alternative financing methods have gradually emerged as an important avenue for startups to raise funds. In this study, the information on the factors that affect the token financing of startups was collected based on the modified Delphi method (MDM), and, further, BWM was applied to analyze the advantages and disadvantages of the three different token-financing solutions, to construct an optimal decision-making evaluation model for token financing.
2. Determination Model
In accordance with the MDM, a list of influencing factors was obtained through expert opinions and a literature review, and, further, adopted to construct an evaluation model and the subsequent weights. The research methods are described as follows:
2.1. Modified Delphi Method
The Delphi method is a technique for decision-making by a group of anonymous experts. Individuals and small groups of experts are surveyed anonymously on certain issues or future events. Through set procedures and repeated steps, this method combines the experts’ knowledge, opinions, and speculations in a distraction-free environment to reach a consistent and stable consensus. It can be used to infer possible events, effectively predict future trends, or obtain consistent conclusions on certain issues [63,64]. The Delphi method is based on expert judgments and uses multiple rounds of feedback to solve complex decision-making problems. The traditional Delphi method emphasizes the following five basic principles [65,66]:
- Anonymity: All experts express their opinions individually and strictly comply with the principle of anonymity.
- Iterations: A facilitator gathers the expert opinions and distributes them among the other experts. This process is repeated.
- Controlled feedback: In each round, experts answer a pre-designed questionnaire. The results are used as a reference for the next assessment.
- Statistical group response: The number of opinions gathered must be calculated before a comprehensive judgment is made.
- Expert consensus: The final goal is the integration of all expert opinions to reach a consensus.
The Delphi procedure is as follows [67]:
- A.
- Select anonymous experts;
- B.
- Conduct the first round of the survey;
- C.
- Conduct the second round of the survey;
- D.
- Conduct the third round of the survey;
- E.
- Integrate expert opinions and reach a consensus.
2.2. Best Worst Method
The BWM proposed by Rezaei (2015) aims to resolve multi-criteria decision-making problem based on multi-objective programming and the extremely complicated evaluation process of AHP [56]. For example, if there are n criteria in an AHP hierarchy, n(n−1)/2 pairwise comparisons are required. A larger n is likely to cause the pairwise comparison matrix to be too large and increase the level of difficulty in application for decision-makers. Therefore, the BWM was used to perform an optimal evaluation of multi-criteria decision-making because it possesses the advantages of reducing complexity and improving efficiency [58].
The evaluation process was as follows:
Step 1. Construct a hierarchy and a set of decision criteria
The hierarchy and decision criteria for the BWM were formulated using common tools such as literature reviews, the Delphi method, focus group interviews, and brainstorming. Once decision makers or experts specify n appropriate evaluation criteria that conform to the decision-making problem, n evaluation criteria can be defined as .
Step 2. Select the best and worst criteria
From the n criteria formulated in Step 1, the decision-makers or experts selected the best (i.e., the most satisfactory, preferred, or important) and the worst (i.e., the least satisfactory, preferred, or important) criteria. This step considered only a subjective and approximate comparison between the criteria and not their actual weight ratios.
Step 3. Construct the Best-to-Others (BO) vector based on the best criterion
Each decision-maker or expert assigned a pairwise comparison value to the best and remaining criteria on a scale of one to nine, with one indicating that the criterion was as important as the best criterion, and nine indicating that the criterion was much less important than the best criterion. The best criterion and remaining criteria produced the BO vector as follows:
where represents the preference for the best criterion b over the criterion j. The pairwise comparison value between the best criterion and itself must be one, that is, .
Step 4. Construct the Others-to-Worst (OW) vector based on the worst criterion
The decision-maker or expert assigned a pairwise comparison value to the worst and remaining criteria on a scale of one to nine. The pairwise comparison values of the worst and remaining criteria generated an OW vector as follows:
where represents the relative importance of the remaining criterion j compared to the worst criterion w. The pairwise comparison value between the worst criterion and itself must be one, that is, .
Step 5. Calculate the weights of criteria: ()
The calculation of the weight of the best criterion was based on the linear programming (LP) model. The input data comprised a BO and an OW vector (or the weight ratio of the best criterion compared to the remaining criteria, and the weight ratio of the worst criterion compared to the remaining criteria, respectively) and the absolute deviations of the expert-defined values (). The absolute deviation values were maximized. Finally, the minimum value of the two was selected as the best objective function value. The complete model can be represented as follows:
subject to
Equation (1) can be converted to the objective function of Equation (2) to facilitate calculation as follows:
subject to
min z
Assuming the total number of criteria to be n, the model has 4n-5 restrictions on pairwise comparisons, and the sum of the weights (w) of the final restriction is one. Therefore, given an appropriate value of z, such that the feasible solution region is a non-empty set, the intersection of the constraints in the LP model indicates the optimal value in the feasible solution region. The optimal values of the criteria are the weights () and the minimized objective value z.
In the solution set of the positive weights in Equation (2), the sum of the criterion weights is one, and the maximum deviation between the ratios of the weights and the corresponding pairwise comparison values is z. When the number of criteria exceeds three, these two restrictions can generate multiple optimal solutions. Therefore, Rezaei (2016) modified the original model to that shown in Equation (3) [57]. If the minimization of the maximum restriction set is modified to the minimization of the maximum restriction set , the condition of the original model generating multiple optimal solutions will be improved, which, in turn, leads to one single optimal solution for the final criterion weight. The modified model is as follows:
subject to
The minimization of the maximum objective function in Equation (3) can be converted into a linear objective function for calculation and is represented by the following model:
subject to
After solving Equation (4), a test for the consistency ratio (CR) must be conducted to determine the logic used by the experts in filling out the questionnaire. When the consistency index reflects poor consistency, the target value z is affected. Rezaei (2015) proposed values for the consistency index for n criteria, as shown in Table 1 [56].
Rezaei (2015) proposed a formula for calculating the CR, as shown in Equation (5) [56]:
The smaller the value of z in Equation (5) is, the lower the value calculated in Equation (4) and the CR, indicating a higher consistency of the questionnaire results.
3. Case Study
In this study, the MDM and BWM were applied to the startup samples, to construct an evaluation process for an optimal token-financing solution (see Figure 1). First, the influencing factors were collected through literature reviews and expert opinions. Then, the BWM was applied to calculate the weights. Finally, the obtained weights were ranked to obtain the optimal token-financing solution. The research hierarchical framework is shown in Figure 2.
Step 1. Construct a hierarchy and a set of decision criteria
Studies have proposed that experts must reach a consensus on the hierarchy and decision-making criteria, before a research model can be constructed [70,71,72]. Previous studies, also, indicated that the number of experts should be restricted between five and nine [68,69]. Therefore, this work implemented six experts, including two scholars in the financial sector, two startup entrepreneurs in the commercial field, and two experts in the government. The primary purpose of this study was to construct an optimal solution for evaluating token financing. Using startups as samples, literature reviews, and the MDM results, a total of 17 criteria, 5 constructs, and 3 token-financing solutions (as shown in Figure 2) were obtained. The related data sources are shown in Table 2.
The definitions and descriptions of the evaluation construct, criteria, and token-financing schemes are as follows.
- Finance: Including issuance, platform, and transaction costs.
- ◆
- Issuance costs: The costs of token issuance vary depending on the types of token-financing solutions; for example, MINT coin exchanges.
- ◆
- Platform fees: Fees for token-financing solutions differ across platforms; for example: the platform fee that Binance charges.
- ◆
- Transaction costs: There are various transaction costs involved in token-financing schemes, for example, handling fees.
- Laws and regulations: Including place of issuance, government policy, token security regulations, and information disclosure transparency.
- ◆
- Place of issuance: The laws, regulations, and restrictions on issuing tokens in different countries.
- ◆
- Government policy: The amount of government support for token financing.
- ◆
- Token security regulations: The laws and regulations for token security.
- ◆
- Information disclosure transparency: The laws and regulations for the level of information disclosures when companies issue tokens.
- Risk: Including financing schedules, token price fluctuations, reputation, share-holding proportions, and financing success rates.
- ◆
- Financing schedule: The duration of the financing schedule; for example, ICO has shorter financing schedule relative to STO.
- ◆
- Token price fluctuation: Significant fluctuations in token transaction price affect financing efficiency.
- ◆
- Reputation: The degree of corporate reputation required by the token-financing solution; for example, ICO has fewer corporate reputation requirements.
- ◆
- Shareholding proportion: The proportion of equity holding corresponding to the tokens held by investors.
- ◆
- Financing success rate: The company’s success rate in token financing for different financing solutions.
- Investors: Including financing object and financing threshold.
- ◆
- Financing object: The types of investors that companies deal with when issuing tokens for financing; for example, ICO and IEO focus on retail investors, whereas STO targets professional investors.
- ◆
- Financing threshold: The entry threshold for companies to issue tokens; for example, STO has a higher threshold.
- Online community: Including online share of voice, online public sentiment, and online trend.
- ◆
- Online share of voice: The influence of investors on the preference for online share of voice on different financing platforms.
- ◆
- Online public sentiment: The influence of investors on public sentiments on social media on different financing platforms.
- ◆
- Online trend: The influence of investors on the development of the overall environment and trends of token financing.
- Token-financing solutions: Including ICO, IEO, and STO.
- ◆
- ICO: It combines blockchain technology and the concept of virtual tokens to develop, maintain, and exchange for financing.
- ◆
- IEO: Tokens are endorsed, issued, and sold on exchanges, which are responsible for Know Your Customer (KYC) and Anti-Money Laundering (AML) systems.
- ◆
- STO: Through the securitization of corporate assets, the government-regulated ICO ties the corporate assets to tokens and sells them.
Step 2. Select the best and worst criteria
The best and worst criteria were analyzed and determined, based on the experts’ opinions as shown in Table 3.
Step 3. Construct the Best-to-Others (BO) vector based on the best criterion
Based on the results of Step 2, the experts’ opinions were used to determine the preference for the best criterion relative to the other criteria. A score of one indicated the best criterion, and a score of nine indicated that the best criterion was much more important than this criterion.
The Best-to-Other (BO) vector of each construct and criterion was established, based on the preferences and opinions of all the experts, as shown in Table 4 and Table 5.
Step 4. Construct the Other-to-Worst (OW) vector based on the worst criterion
Based on the results of Step 2, the opinions of the expert group were used to determine the preference for the best criterion, relative to the other criteria. A score of one indicated the worst criterion, and a score of nine indicated that this criterion was much more important than the worst criterion. The Other-to-Worst (OW) vector of each construct and each criterion was established based on the preferences and opinions of all experts, as shown in Table 6 and Table 7.
Step 5. Calculate the weights of the criteria: ()
The expert groups’ preferences were calculated with the linear programming concept of the BW method and, further, transformed into the final weights of BWM through the simple average method. The method proposed by Rezaei (2015) was used to calculate the CRs [56]. The CR thresholds suggested by Liang et al. (2020) were used to judge whether the opinions of the expert group were consistent [61]. A CR value less than the threshold indicated that the expert group had reached a consensus. The weight and consistency results of each construct, criterion, and token-financing solution are presented in Table 8 and Table 9. The results of the final standardized token-financing schemes are shown in Table 10.
The optimal token-financing solution for new ventures was evaluated with BWM in this study. The results of the evaluated constructs were as follows: The risk construct (0.304) ranked the highest, followed by the financial dimension (0.301), laws and regulations (0.209), investor dimension (0.115), and online communities (0.071). The evaluation criteria were ranked in the order of issuance costs (0.136), platform fees (0.119), financing success rate (0.112), financing threshold (0.096), financing schedule (0.092), government policies (0.090), information disclosure transparency (0.071), equity-holding proportions (0.048), transaction costs (0.046), online share of voice (0.044), token security regulations (0.033), token price fluctuations (0.032), financing object (0.020), reputation (0.019), online public sentiment (0.018), place of issuance (0.015), and online trends (0.008). Finally, the ranking of the optimal token-financing solutions for startups was ordered as follows: ICO (0.439), IEO (0.397), and STO (0.164). Thus, ICO emerged as the optimal financing solution for startups, when undertaking token financing.
4. Conclusions
The goal of inclusive finance has led to the rapid development of FinTech, which mainly uses information technology to provide financial solutions. It has become an important aspect in the future development of new business models in the financial industry. Startups find it difficult to raise funds from traditional financial institutions because of their limited operational and financial structures. Therefore, alternative financing methods have gradually emerged as an important avenue for startups to raise funds.
Token financing is a relatively new model in the field of alternative financing, which addresses the deficiencies and problems of traditional crowdfunding. However, the development of token financing is diverse and complex. Prior studies have primarily focused on analyzing the value of virtual currencies. Most startup entrepreneurs are relatively inexperienced in the evaluation and decision-making of new token financing. Therefore, in this study, a model for startups to evaluate an optimal token-financing solution, based on the MDM and BWM algorithm, is proposed. The proposed model combined the MDM, BWM, and startups as samples, to determine the optimal token-financing solution. First, the constructs, criteria, and solutions were collected by literature reviews and expert opinions, which include 5 constructs, 17 criteria, and 3 token-financing solutions. Then, the BWM was utilized to calculate the weights of each level. Finally, the obtained weights were ranked, to measure the optimal token-financing solution for startups in the digital assets market.
The results of this study showed that risk is the most important construct of all those evaluated. It signifies that the risk evaluation issue is, essentially, a critical perspective, when startups would like to raise capital by token-financing. Accordingly, it is the first construct that must be considered when startups want to raise funds through new token-financing solutions. This also indicates that the risks inherent in the virtual token-financing market and platform continue to be extremely high for investors. Moreover, the financing success rate and financing schedule are the key factors in risk perspective, which means that startups are unable to endure a long financing period and a failing financing plan because they have a core problem with a lower level of financial structure and operational efficiency. Based on the ranking results, when a startup wants to raise funds using a new token-financing scheme, the key indicators are the issuance costs, platform fees, and the financing success rates, strongly implying that the costs aspects and financing success rates would affect the optimal token-financing solution for startups to obtain the funds via the virtual environment. Finally, ICO is the optimal token-financing solution for startups. The advantages of ICO are the low costs and high speed of issuances, which are suitable for their financing activity on the digital platform. In other words, after considering the various risks and tradeoff between costs and financing success rates, startup founders should use ICO financing to improve their companies’ financing efficiency.
An optimal token-financing evaluation model for startups constructed with the MDM and BWM was proposed in this study, even though optimal solutions can be evaluated by AHP and so on. Nevertheless, the comparison matrix to obtain the solution is highly complex and easily distorted, if there are excessive evaluation criteria. Hence, the proposed method can reduce this problem for the issue of finding an optimal solution. Furthermore, this combination model could help practitioners better understand and judge the value of the MDM and BWM, in addressing specific decision-making issues in tokenization solutions for digital assets market startups, which could promote a broader applications in digital capital. Academically, it contributes to the literature by providing an application process that integrates the MDM and BWM, introducing an optimal evaluation framework for startups to use when undertaking token financing. In addition, it makes a practical contribution in the context of the rapid development of FinTech, as the evaluation model proposed in this study can be a valuable measurement tool for startup entrepreneurs, who intend to use token financing to improve the capital turnover rate of their equity.
Author Contributions
Conceptualization, C.-H.C. and C.-Y.L.; methodology, C.-Y.L.; software, C.-Y.L.; validation, C.-H.C. and C.-Y.L.; formal analysis, C.-H.C. and C.-Y.L.; investigation, C.-Y.L.; resources, C.-H.C.; data curation, C.-H.C. and C.-Y.L.; writing—original draft preparation, C.-H.C. and C.-Y.L.; writing—review and editing, C.-H.C.; visualization, C.-H.C. and C.-Y.L.; supervision, C.-Y.L.; project administration, C.-H.C. and C.-Y.L.; funding acquisition, C.-H.C. All authors have read and agreed to the published version of the manuscript.
Funding
This research received no external funding.
Institutional Review Board Statement
Not applicable.
Informed Consent Statement
Not applicable.
Data Availability Statement
Data sharing is not applicable to this article.
Conflicts of Interest
The authors declare no conflict of interest.
Abbreviations
| FinTech | financial technology |
| JOBS | Jumpstart Our Business Startups |
| ICO | initial coin offerings |
| IEO | initial exchange offerings |
| STO | security token offerings |
| AHP | analytic hierarchy process |
| BWM | best worst method |
| MDM | modified Delphi method |
| BO | Best-to-Others |
| OW | Others-to-Worst |
| LP | linear programming |
| CR | consistency ratio |
References
- Gai, K.; Qiu, M.; Sun, X. A survey on FinTech. J. Netw. Comput. Appl. 2018, 103, 262–273. [Google Scholar] [CrossRef]
- Lee, I.; Shin, Y.J. Fintech: Ecosystem, business models, investment decisions, and challenges. Bus. Horiz. 2018, 61, 35–46. [Google Scholar] [CrossRef]
- Mackenzie, A. The fintech revolution. Lond. Bus. Sch. Rev. 2015, 26, 50–53. [Google Scholar] [CrossRef]
- Ivanov, V.; Knyazeva, A. US Securities-Based Crowdfunding under Title III of the JOBS Act; DERA White Paper; Securities Exchange Commission: Washington, DC, USA, 2017.
- Rossi, M. The new ways to raise capital: An exploratory study of crowdfunding. Int. J. Financ. Res. 2014, 5, 8–18. [Google Scholar] [CrossRef]
- Walthoff-Borm, X.; Schwienbacher, A.; Vanacker, T. Equity crowdfunding: First resort or last resort? J. Bus. Ventur. 2018, 33, 513–533. [Google Scholar] [CrossRef]
- Massolution. 2015CF: The Crowdfunding Industry Report. Massolution. 2015. Available online: https://www.smv.gob.pe/Biblioteca/temp/catalogacion/C8789.pdf (accessed on 20 January 2022).
- Statista Inc. Alternative Financing Report 2021. 2021. Available online: https://www.statista.com/study/47352/fintech-report-alternative-financing/ (accessed on 10 January 2022).
- Bagheri, A.; Chitsazan, H.; Ebrahimi, A. Crowdfunding motivations: A focus on donors’ perspectives. Technol. Forecast. Soc. Chang. 2019, 146, 218–232. [Google Scholar] [CrossRef]
- Lu, Y.; Chang, R.; Lim, S. Crowdfunding for solar photovoltaics development: A review and forecast. Renew. Sustain. Energy Rev. 2018, 93, 439–450. [Google Scholar] [CrossRef]
- Petruzzelli, A.M.; Natalicchio, A.; Panniello, U.; Roma, P. Understanding the crowdfunding phenomenon and its implications for sustainability. Technol. Forecast. Soc. Chang. 2019, 141, 138–148. [Google Scholar] [CrossRef]
- Estrin, S.; Gozman, D.; Khavul, S. Case Study of the Equity Crowdfunding Landscape in London: An Entrepreneurial and Regulatory Perspective; FIRES Case Study; Utrecht University: Utrecht, The Netherlands, 2016; pp. 1–62. [Google Scholar]
- Agrawal, A.; Catalini, C.; Goldfarb, A. Some simple economics of crowdfunding. Innov. Policy Econ. 2014, 14, 63–97. [Google Scholar] [CrossRef] [Green Version]
- Kuti, M.; Madarász, G. Crowdfunding. Public Financ. Q. 2014, 59, 355–366. [Google Scholar]
- Zhu, H.; Zhou, Z.Z. Analysis and outlook of applications of blockchain technology to equity crowdfunding in China. Financ. Innov. 2016, 2, 29. [Google Scholar] [CrossRef] [Green Version]
- Baber, H. Blockchain-Based Crowdfunding. In Blockchain Technology for Industry 4.0; Springer: Singapore, 2020; pp. 117–130. [Google Scholar]
- Chod, J.; Lyandres, E. A theory of icos: Diversification, agency, and information asymmetry. Manag. Sci. 2021, 67, 5969–5989. [Google Scholar] [CrossRef]
- Chod, J.; Trichakis, N.; Yang, S.A. Platform tokenization: Financing, governance, and moral hazard. Manag. Sci. 2022. forthcoming. [Google Scholar] [CrossRef]
- Howell, S.T.; Niessner, M.; Yermack, D. Initial coin offerings: Financing growth with cryptocurrency token sales. Rev. Financ. Stud. 2020, 33, 3925–3974. [Google Scholar] [CrossRef] [Green Version]
- Ante, L.; Fiedler, I. Cheap Signals in Security Token Offerings (STOs). Quant. Financ. Econ. 2020, 4, 608–639. [Google Scholar] [CrossRef]
- Amsden, R.; Schweizer, D. Are Blockchain Crowdsales the New ‘Gold Rush’? Success Determinants of Initial Coin Offerings. Success Determinants of Initial Coin Offerings. 16 April 2018. Available online: https://papers.ssrn.com/sol3/papers.cfm?abstract_id=3163849 (accessed on 24 March 2021).
- Miglo, A. Choice between IEO and ICO: Speed vs. Liquidity vs. Risk. Risk. 26 March 2020. Available online: https://mpra.ub.uni-muenchen.de/99600/1/MPRA_paper_99600.pdf (accessed on 5 April 2021).
- Kondova, G.; Simonella, G. Blockchain in Startup Financing: ICOs and STOs in Switzerland. J. Strateg. Innov. Sustain. 2019, 14, 43–48. [Google Scholar]
- Gryglewicz, S.; Mayer, S.; Morellec, E. Optimal financing with tokens. J. Financ. Econ. 2021, 142, 1038–1067. [Google Scholar] [CrossRef]
- Borri, N. Conditional tail-risk in cryptocurrency markets. J. Empir. Financ. 2019, 50, 1–19. [Google Scholar] [CrossRef]
- Canh, N.P.; Wongchoti, U.; Thanh, S.D.; Thong, N.T. Systematic risk in cryptocurrency market: Evidence from DCC-MGARCH model. Financ. Res. Lett. 2019, 29, 90–100. [Google Scholar] [CrossRef]
- Liu, Y.; Tsyvinski, A. Risks and returns of cryptocurrency. Rev. Financ. Stud. 2021, 34, 2689–2727. [Google Scholar] [CrossRef]
- Zhang, W.; Li, Y.; Xiong, X.; Wang, P. Downside risk and the cross-section of cryptocurrency returns. J. Bank. Financ. 2021, 133, 106246. [Google Scholar] [CrossRef]
- Borri, N.; Shakhnov, K. Regulation spillovers across cryptocurrency markets. Financ. Res. Lett. 2020, 36, 101333. [Google Scholar] [CrossRef]
- Chokor, A.; Alfieri, E. Long and short-term impacts of regulation in the cryptocurrency market. Q. Rev. Econ. Financ. 2021, 81, 157–173. [Google Scholar] [CrossRef]
- Feinstein, B.D.; Werbach, K. The impact of cryptocurrency regulation on trading markets. J. Financ. Regul. 2021, 7, 48–99. [Google Scholar] [CrossRef]
- Beneki, C.; Koulis, A.; Kyriazis, N.A.; Papadamou, S. Investigating volatility transmission and hedging properties between Bitcoin and Ethereum. Res. Int. Bus. Financ. 2019, 48, 219–227. [Google Scholar] [CrossRef]
- Okorie, D.I.; Lin, B. Crude oil price and cryptocurrencies: Evidence of volatility connectedness and hedging strategy. Energy Econ. 2020, 87, 104703. [Google Scholar] [CrossRef]
- Sebastião, H.; Godinho, P. Bitcoin futures: An effective tool for hedging cryptocurrencies. Financ. Res. Lett. 2020, 33, 101230. [Google Scholar] [CrossRef]
- Thampanya, N.; Nasir, M.A.; Huynh, T.L.D. Asymmetric correlation and hedging effectiveness of gold & cryptocurrencies: From pre-industrial to the 4th industrial revolution. Technol. Forecast. Soc. Chang. 2020, 159, 120195. [Google Scholar]
- Köchling, G.; Schmidtke, P.; Posch, P.N. Volatility forecasting accuracy for Bitcoin. Econ. Lett. 2020, 191, 108836. [Google Scholar] [CrossRef]
- Ma, F.; Liang, C.; Ma, Y.; Wahab, M.I.M. Cryptocurrency volatility forecasting: A Markov regime-switching MIDAS approach. J. Forecast. 2020, 39, 1277–1290. [Google Scholar] [CrossRef]
- Walther, T.; Klein, T.; Bouri, E. Exogenous drivers of Bitcoin and Cryptocurrency volatility—A mixed data sampling approach to forecasting. J. Int. Financ. Mark. Inst. Money 2019, 63, 101133. [Google Scholar] [CrossRef]
- Yen, K.C.; Cheng, H.P. Economic policy uncertainty and cryptocurrency volatility. Financ. Res. Lett. 2021, 38, 101428. [Google Scholar] [CrossRef]
- Al Rahahleh, N.; Bhatti, M.I. Co-movement measure of information transmission on international equity markets. Phys. A Stat. Mech. Appl. 2017, 470, 119–131. [Google Scholar] [CrossRef]
- Do, H.Q.; Bhatti, M.I.; Shahbaz, M. Is ‘oil and gas’ industry of ASEAN5 countries integrated with the US counterpart? Appl. Econ. 2020, 52, 4112–4134. [Google Scholar] [CrossRef]
- Li, Y.; Guo, J. The asymmetric impacts of oil price and shocks on inflation in BRICS: A multiple threshold nonlinear ARDL model. Appl. Econ. 2022, 54, 1377–1395. [Google Scholar] [CrossRef]
- Hamdan, S.; Cheaitou, A. Supplier selection and order allocation with green criteria: An MCDM and multi-objective optimization approach. Comput. Oper. Res. 2017, 81, 282–304. [Google Scholar] [CrossRef]
- Lin, S.W. Identifying the critical success factors and an optimal solution for mobile technology adoption in travel agencies. Int. J. Tour. Res. 2017, 19, 127–144. [Google Scholar] [CrossRef]
- Lin, C.Y. Optimal Core Operation in Supply Chain Finance Ecosystem by Integrating the Fuzzy Algorithm and Hierarchical Framework. Int. J. Comput. Intell. Syst. 2020, 13, 259–274. [Google Scholar] [CrossRef]
- Yang, Y.; Song, X. Research on Face Intelligent Perception Technology Integrating Deep Learning under Different Illumination Intensities. J. Comput. Cogn. Eng. 2022, 1, 32–36. [Google Scholar]
- Awad, J.; Jung, C. Extracting the Planning Elements for Sustainable Urban Regeneration in Dubai with AHP (Analytic Hierarchy Process). Sustain. Cities Soc. 2022, 76, 103496. [Google Scholar] [CrossRef]
- Achu, A.L.; Thomas, J.; Reghunath, R. Multi-criteria decision analysis for delineation of groundwater potential zones in a tropical river basin using remote sensing, GIS and analytical hierarchy process (AHP). Groundw. Sustain. Dev. 2020, 10, 100365. [Google Scholar] [CrossRef]
- Gündoğdu, F.K.; Duleba, S.; Moslem, S.; Aydın, S. Evaluating public transport service quality using picture fuzzy analytic hierarchy process and linear assignment model. Appl. Soft Comput. 2021, 100, 106920. [Google Scholar] [CrossRef]
- Kilic, B.; Ucler, C. Stress among ab-initio pilots: A model of contributing factors by AHP. J. Air Transp. Manag. 2019, 80, 101706. [Google Scholar] [CrossRef]
- Kumar, S.; Raut, R.D.; Nayal, K.; Kraus, S.; Yadav, V.S.; Narkhede, B.E. To identify industry 4.0 and circular economy adoption barriers in the agriculture supply chain by using ISM-ANP. J. Clean. Prod. 2021, 293, 126023. [Google Scholar] [CrossRef]
- Bathrinath, S.; Bhalaji, R.K.A.; Saravanasankar, S. Risk analysis in textile industries using AHP-TOPSIS. Mater. Today Proc. 2021, 45, 1257–1263. [Google Scholar] [CrossRef]
- Emamat, M.S.M.M.; de Miranda Mota, C.M.; Mehregan, M.R.; Sadeghi Moghadam, M.R.; Nemery, P. Using ELECTRE-TRI and FlowSort methods in a stock portfolio selection context. Financ. Innov. 2022, 8, 1–35. [Google Scholar] [CrossRef]
- Lam, K.; Zhao, X. An application of quality function deployment to improve the quality of teaching. Int. J. Qual. Reliab. Manag. 1998, 15, 389–413. [Google Scholar] [CrossRef]
- Cheng, E.W.; Li, H. Construction partnering process and associated critical success factors: Quantitative investigation. J. Manag. Eng. 2002, 18, 194–202. [Google Scholar] [CrossRef]
- Rezaei, J. Best-worst multi-criteria decision-making method. Omega 2015, 53, 49–57. [Google Scholar] [CrossRef]
- Rezaei, J. Best-worst multi-criteria decision-making method: Some properties and a linear model. Omega 2016, 64, 126–130. [Google Scholar] [CrossRef]
- Mi, X.; Tang, M.; Liao, H.; Shen, W.; Lev, B. The state-of-the-art survey on integrations and applications of the best worst method in decision making: Why, what, what for and what’s next? Omega 2019, 87, 205–225. [Google Scholar] [CrossRef]
- Kheybari, S.; Kazemi, M.; Rezaei, J. Bioethanol facility location selection using best-worst method. Appl. Energy 2019, 242, 612–623. [Google Scholar] [CrossRef]
- Liu, P.; Zhu, B.; Wang, P. A weighting model based on best–worst method and its application for environmental performance evaluation. Appl. Soft Comput. 2021, 103, 107168. [Google Scholar] [CrossRef]
- Liang, F.; Brunelli, M.; Rezaei, J. Consistency issues in the best worst method: Measurements and thresholds. Omega 2020, 96, 102175. [Google Scholar] [CrossRef]
- Rezaei, J.; van Roekel, W.S.; Tavasszy, L. Measuring the relative importance of the logistics performance index indicators using Best Worst Method. Transp. Policy 2018, 68, 158–169. [Google Scholar] [CrossRef]
- Linstone, H.A.; Turoff, M. (Eds.) The Delphi Method; Addison-Wesley: Reading, MA, USA, 1975; pp. 3–12. [Google Scholar]
- Murry, J.W., Jr.; Hammons, J.O. Delphi: A versatile methodology for conducting qualitative research. Rev. High. Educ. 1995, 18, 423–436. [Google Scholar] [CrossRef]
- Okoli, C.; Pawlowski, S.D. The Delphi method as a research tool: An example, design considerations and applications. Inf. Manag. 2004, 42, 15–29. [Google Scholar] [CrossRef] [Green Version]
- Skulmoski, G.J.; Hartman, F.T.; Krahn, J. The Delphi method for graduate research. J. Inf. Technol. Educ. Res. 2007, 6, 1–21. [Google Scholar] [CrossRef]
- Wu, C.R.; Lin, C.T.; Chen, H.C. Evaluating competitive advantage of the location for Taiwanese hospitals. J. Inf. Optim. Sci. 2007, 28, 841–868. [Google Scholar] [CrossRef]
- Hasson, F.; Keeney, S. Enhancing rigour in the Delphi technique research. Technol. Forecast. Soc. Chang. 2011, 78, 1695–1704. [Google Scholar] [CrossRef]
- Sung, W.C. Application of Delphi method, a qualitative and quantitative analysis, to the healthcare management. J. Healthc. Manag. 2001, 2, 11–19. [Google Scholar]
- Ali-Yrkkö, J.; Rouvinen, P.; Seppälä, T.; Ylä-Anttila, P. Who captures value in global supply chains? Case Nokia N95 Smartphone. J. Ind. Compet. Trade 2011, 11, 263–278. [Google Scholar] [CrossRef] [Green Version]
- Linden, G.; Kraemer, K.L.; Dedrick, J. Who captures value in a global innovation network? The case of Apple’s iPod. Commun. ACM 2009, 52, 140–144. [Google Scholar] [CrossRef]
- Ketokivi, M.; Turkulainen, V.; Seppälä, T.; Rouvinen, P.; Ali-Yrkkö, J. Why locate manufacturing in a high-cost country? A case study of 35 production location decisions. J. Oper. Manag. 2017, 49, 20–30. [Google Scholar] [CrossRef]
- Cong, L.W.; Li, Y.; Wang, N. Tokenomics: Dynamic adoption and valuation. Rev. Financ. Stud. 2021, 34, 1105–1155. [Google Scholar] [CrossRef]
- Myalo, A.S. Comparative analysis of ICO, DAOICO, IEO and STO. Case study. Financ. Theory Pract. 2019, 23, 6–25. [Google Scholar] [CrossRef]
- Momtaz, P.P. Entrepreneurial finance and moral hazard: Evidence from token offerings. J. Bus. Ventur. 2021, 36, 106001. [Google Scholar] [CrossRef]
- Giudici, G.; Adhami, S. The impact of governance signals on ICO fundraising success. J. Ind. Bus. Econ. 2019, 46, 283–312. [Google Scholar] [CrossRef]
- Fisch, C.; Masiak, C.; Vismara, S.; Block, J. Motives and profiles of ICO investors. J. Bus. Res. 2021, 125, 564–576. [Google Scholar] [CrossRef]
Figure 1.
The evaluation process for an optimal token-financing solution.
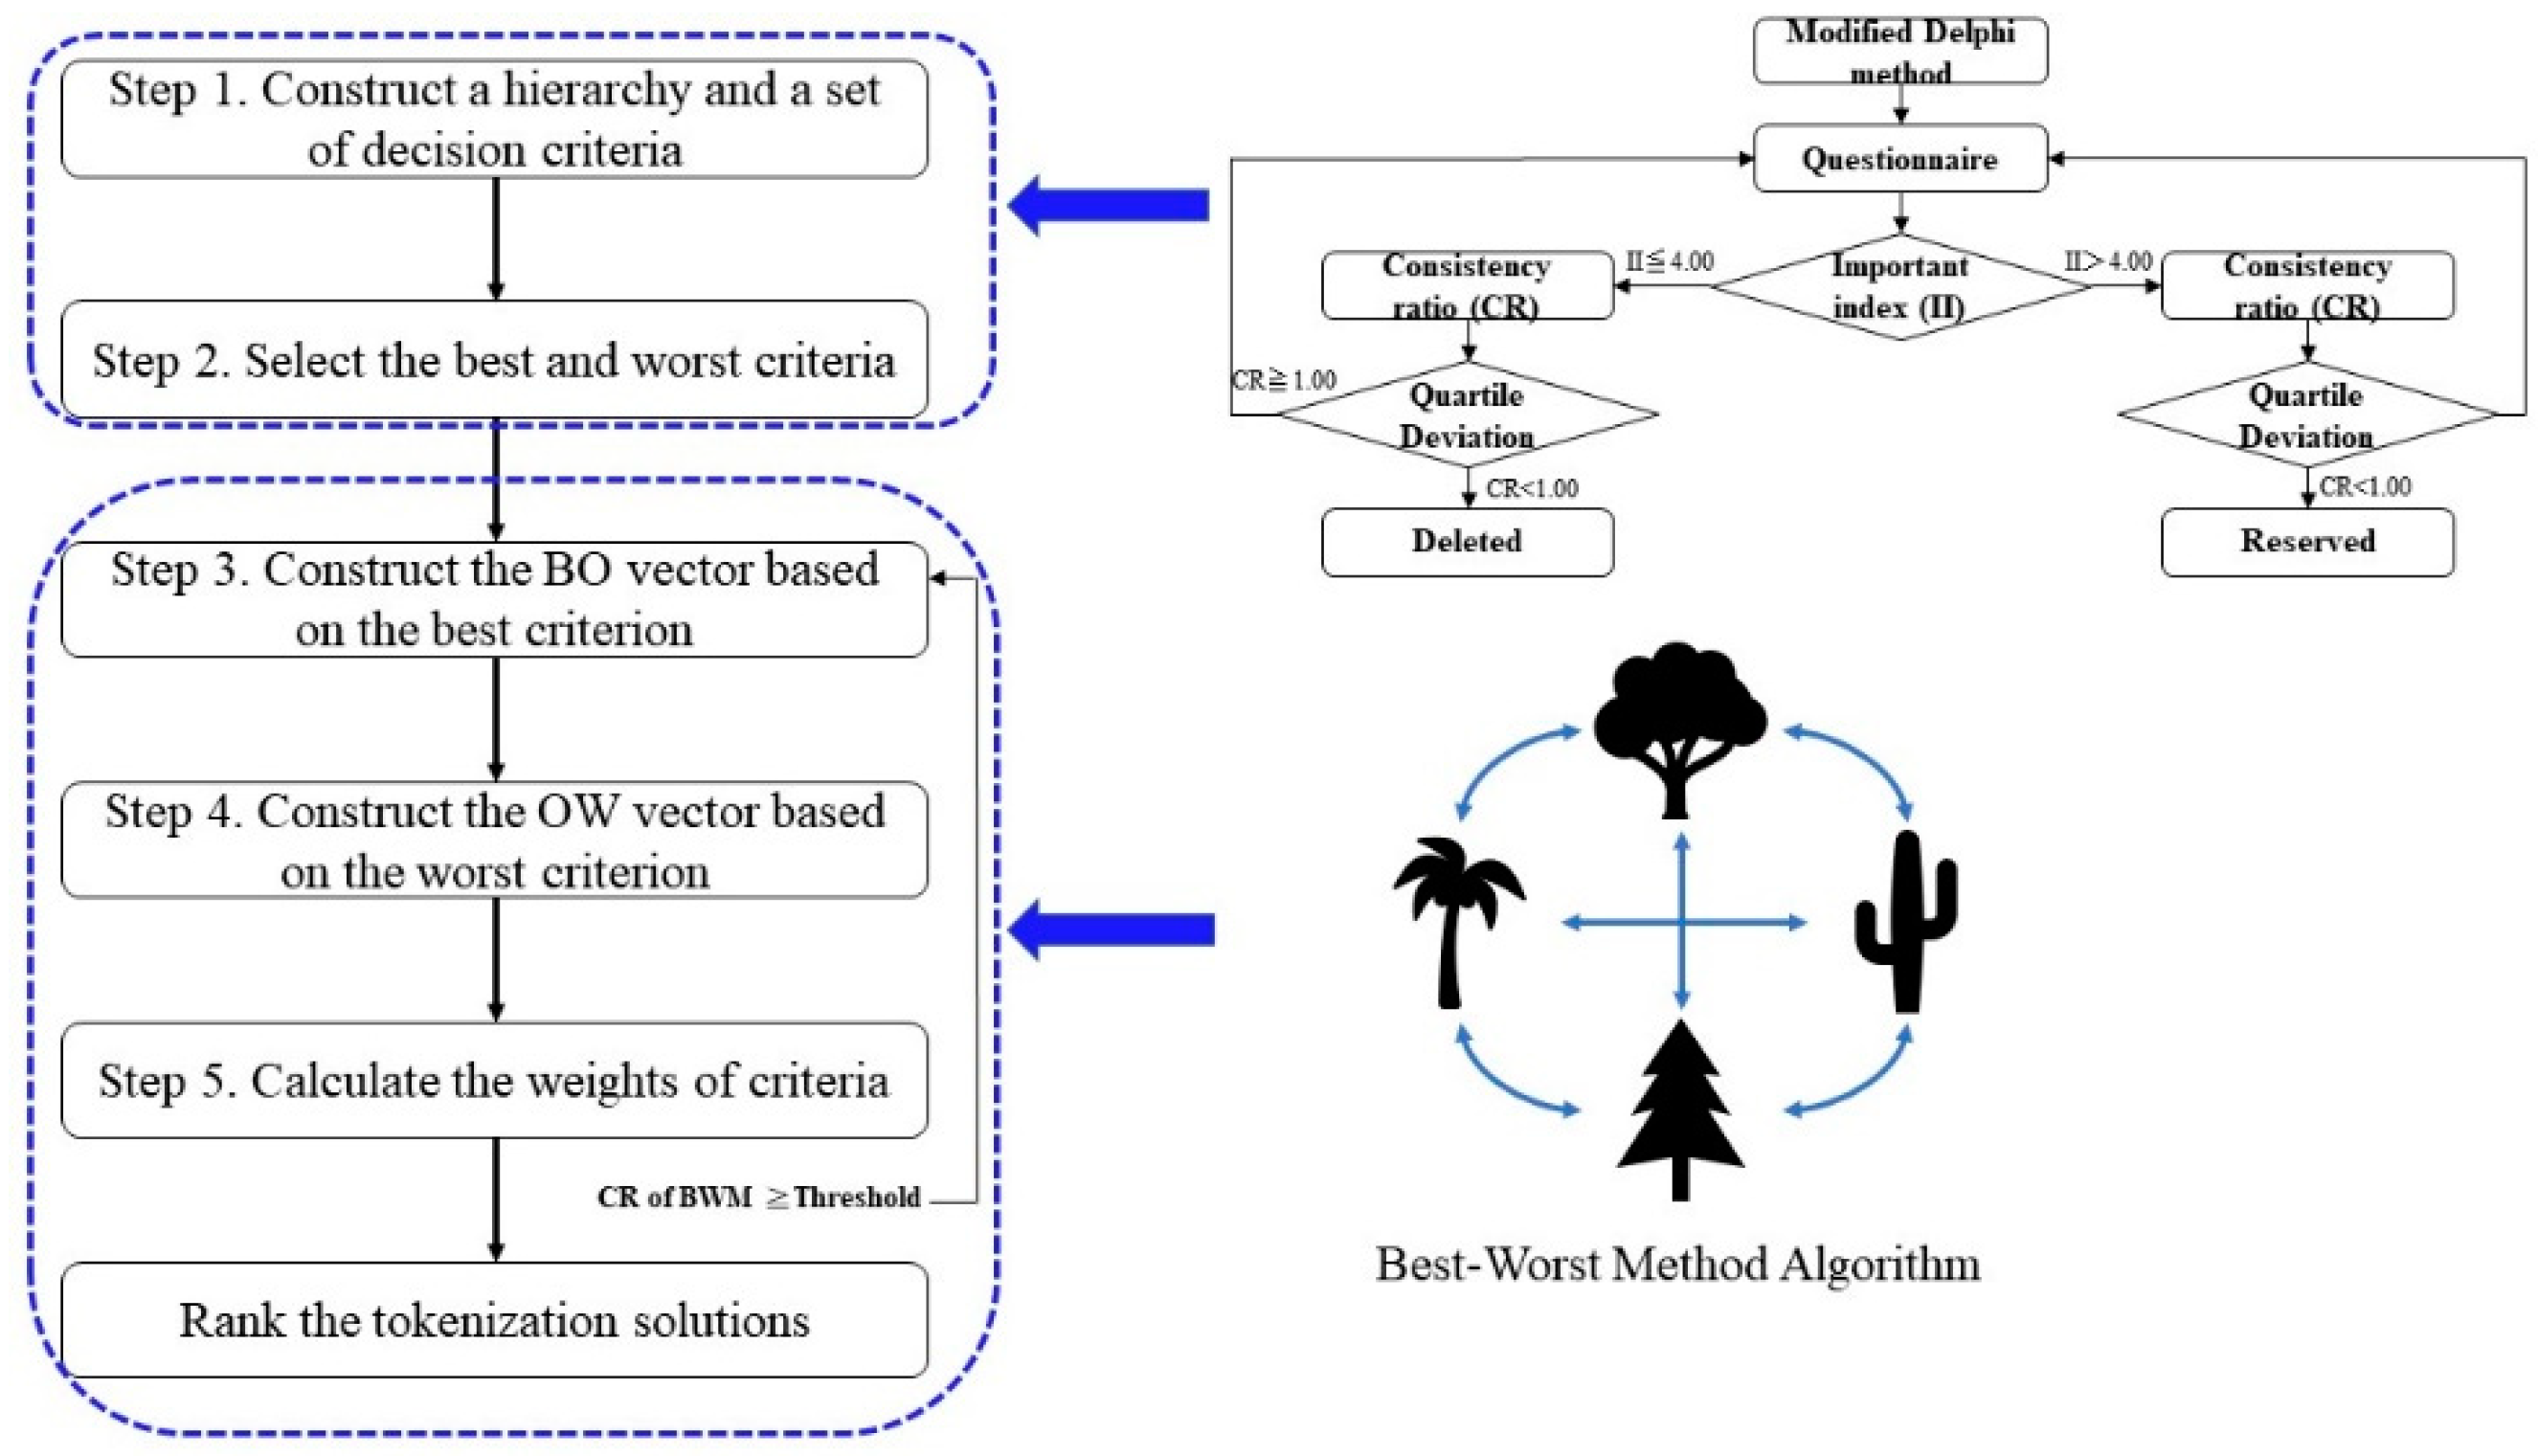
Figure 2.
The research hierarchical framework.


Table 1.
Consistency index.
| 1 | 2 | 3 | 4 | 5 | 6 | 7 | 8 | 9 | |
|---|---|---|---|---|---|---|---|---|---|
| Consistency Index | 0.00 | 0.44 | 1.00 | 1.63 | 2.30 | 3.00 | 3.71 | 4.47 | 5.23 |
Data source: Reprint from Ref. [56]. Note: .
Table 2.
The related data sources of criteria.
| Constructs | Criteria | Sources |
|---|---|---|
| Finance | Issuance costs | [73,74] |
| Platform fees | [73] | |
| Transaction costs | [73] | |
| Laws and regulations | Place of issuance | |
| Government policy | ||
| Token security regulations | [74] | |
| Information disclosure transparency | [17] | |
| Risk | Financing schedule | |
| Token price fluctuation | [73] | |
| Reputation | [75] | |
| Shareholding proportion | ||
| Financing success rate | [76] | |
| Investors | Financing object | |
| Financing threshold | ||
| Online community | Online share of voice | [77] |
| Online public sentiment | ||
| Online trend |
Table 3.
The best and worst criteria in the dimensions.
| Experts | Dimension | |
|---|---|---|
| The Best Criterion | The Worst Criterion | |
| A | Risk | Investor |
| B | Risk | Online community |
| C | Finance | Online community |
| D | Risk | Investor |
| E | Risk | Online community |
| F | Finance | Online community |
Table 4.
BO vectors (construct) of the expert group.
| Expert | Finance | Laws and Regulations | Risk | Investor | Online Community |
|---|---|---|---|---|---|
| A | 4 | 2 | 1 | 7 | 6 |
| B | 2 | 2 | 1 | 4 | 5 |
| C | 1 | 3 | 2 | 4 | 7 |
| D | 3 | 2 | 1 | 6 | 5 |
| E | 2 | 2 | 1 | 3 | 4 |
| F | 1 | 2 | 2 | 3 | 6 |
Table 5.
The BO vectors (criteria) of the expert group.
| Exp. | Finance | Laws and Regulations | Risk | Investor | Online Community | |||||||||||||
|---|---|---|---|---|---|---|---|---|---|---|---|---|---|---|---|---|---|---|
| Issuance Costs | Platform Fees | Transaction Costs | Place of Issuance | Govern-ment Policy | Token Security Regulations | Information Disclosure Transparency | Financing Schedule | Token Price Fluctuation | Reputation | Shareholding Proportion | Financing Success Rate | Financing Object | Financing Threshold | Online Share of Voice | Online Public Sentiment | Online Trend | ||
| A | Best | Platform fees | Government policy | Financing success rate | Financing threshold | Online share of voice | ||||||||||||
| BO | 2 | 1 | 3 | 7 | 1 | 4 | 3 | 2 | 7 | 6 | 3 | 1 | 4 | 1 | 1 | 3 | 6 | |
| B | Best | Issuance costs | Government policy | Financing success rate | Financing threshold | Online share of voice | ||||||||||||
| BO | 1 | 2 | 3 | 6 | 1 | 3 | 2 | 2 | 3 | 5 | 3 | 1 | 6 | 1 | 1 | 3 | 5 | |
| C | Best | Issuance costs | Information disclosure transparency | Financing schedule | Financing threshold | Online share of voice | ||||||||||||
| BO | 1 | 2 | 4 | 5 | 2 | 4 | 1 | 1 | 5 | 7 | 4 | 2 | 5 | 1 | 1 | 3 | 5 | |
| D | Best | Platform fees | Government policy | Financing success rate | Financing threshold | Online share of voice | ||||||||||||
| BO | 2 | 1 | 4 | 6 | 1 | 4 | 2 | 2 | 6 | 5 | 3 | 1 | 3 | 1 | 1 | 2 | 5 | |
| E | Best | Issuance costs | Government policy | Financing success rate | Financing threshold | Online share of voice | ||||||||||||
| BO | 1 | 2 | 3 | 5 | 1 | 3 | 2 | 2 | 3 | 4 | 3 | 1 | 5 | 1 | 1 | 2 | 3 | |
| F | Best | Issuance costs | Information disclosure transparency | Financing schedule | Financing threshold | Online share of voice | ||||||||||||
| BO | 1 | 2 | 3 | 4 | 2 | 3 | 1 | 1 | 4 | 5 | 3 | 2 | 3 | 1 | 1 | 3 | 4 | |
Table 6.
OW vectors (constructs) of the expert group.
| Expert | Finance | Laws and Regulations | Risk | Investor | Online Community |
|---|---|---|---|---|---|
| A | 5 | 6 | 7 | 1 | 3 |
| B | 3 | 3 | 5 | 2 | 1 |
| C | 7 | 5 | 3 | 4 | 1 |
| D | 4 | 5 | 6 | 1 | 2 |
| E | 2 | 2 | 3 | 2 | 1 |
| F | 6 | 4 | 2 | 3 | 1 |
Table 7.
The expert group’s BO vectors (criteria).
| Exp. | Finance | Laws and Regulations | Risk | Investor | Online Community | |||||||||||||
|---|---|---|---|---|---|---|---|---|---|---|---|---|---|---|---|---|---|---|
| Issuance Costs | Platform Fees | Transaction Costs | Place of Issuance | Government Policy | Token Security Regulations | Information Disclosure Transparency | Financing Schedule | Token Price Fluctuation | Reputation | Shareholding Proportion | Financing Success Rate | Financing Object | Financing Threshold | Online Share of Voice | Online Public Sentiment | Online Trend | ||
| A | Worst | Transaction costs | Place of issuance | Token price fluctuation | Financing object | Online trend | ||||||||||||
| OW | 2 | 3 | 1 | 1 | 7 | 4 | 3 | 6 | 1 | 2 | 5 | 7 | 1 | 4 | 6 | 3 | 1 | |
| B | Worst | Transaction costs | Place of issuance | Reputation | Financing object | Online trend | ||||||||||||
| OW | 3 | 2 | 1 | 1 | 6 | 4 | 3 | 5 | 3 | 1 | 3 | 5 | 1 | 6 | 5 | 3 | 1 | |
| C | Worst | Transaction costs | Place of issuance | Reputation | Financing object | Online trend | ||||||||||||
| OW | 4 | 3 | 1 | 1 | 5 | 3 | 5 | 7 | 5 | 1 | 4 | 2 | 1 | 5 | 6 | 3 | 1 | |
| D | Worst | Transaction costs | Place of issuance | Token price fluctuation | Financing object | Online trend | ||||||||||||
| OW | 2 | 4 | 1 | 1 | 6 | 3 | 3 | 5 | 1 | 2 | 4 | 6 | 1 | 3 | 5 | 3 | 1 | |
| E | Worst | Transaction costs | Place of issuance | Reputation | Financing object | Online trend | ||||||||||||
| OW | 3 | 2 | 1 | 1 | 5 | 3 | 2 | 4 | 3 | 1 | 3 | 4 | 1 | 5 | 3 | 2 | 1 | |
| F | Worst | Transaction costs | Place of issuance | Reputation | Financing object | Online trend | ||||||||||||
| OW | 4 | 3 | 1 | 1 | 4 | 2 | 4 | 5 | 4 | 1 | 3 | 2 | 1 | 3 | 4 | 2 | 1 | |
Table 8.
Weights and consistency ratios (CRs) of dimensions and criteria.
| Objective | Construct | Weight | CR | CR Threshold | Criterion | Weight | CR | CR Threshold |
|---|---|---|---|---|---|---|---|---|
| Optimal token-financing solution | Finance | 0.301 | 0.018 | 0.373 | Issuance costs | 0.136 | 0.034 | 0.158 |
| Platform fees | 0.119 | |||||||
| Transaction costs | 0.046 | |||||||
| Laws and regulations | 0.209 | Place of issuance | 0.015 | 0.023 | 0.331 | |||
| Government policy | 0.090 | |||||||
| Token security regulations | 0.033 | |||||||
| Information disclosure transparency | 0.071 | |||||||
| Risk | 0.304 | Financing schedule | 0.092 | 0.025 | 0.373 | |||
| Token price fluctuations | 0.032 | |||||||
| Reputation | 0.019 | |||||||
| share-holding proportion | 0.048 | |||||||
| Financing success rate | 0.112 | |||||||
| Investor | 0.115 | Financing object | 0.020 | 0.000 | 0.000 | |||
| Financing threshold | 0.096 | |||||||
| Online community | 0.071 | Online share of voice | 0.044 | 0.020 | 0.216 | |||
| Online public sentiment | 0.018 | |||||||
| Online Trend | 0.008 |
CR = z/consistency index.
Table 9.
Weights and consistency ratios of criteria and solutions.
| Criterion | Solution | Weight of Solution | CR | CR Threshold |
|---|---|---|---|---|
| Issuance costs | ICO | 0.069 | 0.045 | 0.211 |
| IEO | 0.040 | |||
| STO | 0.027 | |||
| Platform fees | ICO | 0.084 | 0.021 | 0.209 |
| IEO | 0.012 | |||
| STO | 0.023 | |||
| Transaction costs | ICO | 0.031 | 0.024 | 0.216 |
| IEO | 0.005 | |||
| STO | 0.010 | |||
| Place of issuance | ICO | 0.002 | 0.02 | 0.209 |
| IEO | 0.010 | |||
| STO | 0.003 | |||
| Government policy | ICO | 0.025 | 0.018 | 0.209 |
| IEO | 0.050 | |||
| STO | 0.014 | |||
| Token security regulations | ICO | 0.003 | 0.021 | 0.209 |
| IEO | 0.023 | |||
| STO | 0.007 | |||
| Information disclosure transparency | ICO | 0.035 | 0.016 | 0.209 |
| IEO | 0.025 | |||
| STO | 0.011 | |||
| Financing schedule | ICO | 0.016 | 0.015 | 0.216 |
| IEO | 0.062 | |||
| STO | 0.013 | |||
| Token price fluctuation | ICO | 0.002 | 0.019 | 0.216 |
| IEO | 0.013 | |||
| STO | 0.004 | |||
| Reputation | ICO | 0.016 | 0.018 | 0.209 |
| IEO | 0.006 | |||
| STO | 0.010 | |||
| Share-holding proportion | ICO | 0.005 | 0.015 | 0.216 |
| IEO | 0.033 | |||
| STO | 0.010 | |||
| Financing success rate | ICO | 0.057 | 0.017 | 0.209 |
| IEO | 0.042 | |||
| STO | 0.013 | |||
| Financing object | ICO | 0.010 | 0.018 | 0.209 |
| IEO | 0.007 | |||
| STO | 0.002 | |||
| Financing threshold | ICO | 0.066 | 0.019 | 0.227 |
| IEO | 0.021 | |||
| STO | 0.009 | |||
| Online share of voice | ICO | 0.008 | 0.018 | 0.227 |
| IEO | 0.032 | |||
| STO | 0.004 | |||
| Online public sentiment | ICO | 0.007 | 0.016 | 0.209 |
| IEO | 0.010 | |||
| STO | 0.002 | |||
| Online trend | ICO | 0.001 | 0.014 | 0.227 |
| IEO | 0.006 | |||
| STO | 0.002 |
CR: consistency ratio.
Table 10.
Results of standardized token-financing solutions.
| Solution | Weight | Rank |
|---|---|---|
| ICO | 0.439 | 1 |
| IEO | 0.397 | 2 |
| STO | 0.164 | 3 |
Publisher’s Note: MDPI stays neutral with regard to jurisdictional claims in published maps and institutional affiliations. |
© 2022 by the authors. Licensee MDPI, Basel, Switzerland. This article is an open access article distributed under the terms and conditions of the Creative Commons Attribution (CC BY) license (https://creativecommons.org/licenses/by/4.0/).
Share and Cite
MDPI and ACS Style
Chou, C.-H.; Lin, C.-Y. Combining the MDM and BWM Algorithm to Determine the Optimal Crowdfunding Tokenization Solution for Digital Assets Market Startups. Systems 2022, 10, 87. https://doi.org/10.3390/systems10040087
AMA Style
Chou C-H, Lin C-Y. Combining the MDM and BWM Algorithm to Determine the Optimal Crowdfunding Tokenization Solution for Digital Assets Market Startups. Systems. 2022; 10(4):87. https://doi.org/10.3390/systems10040087
Chicago/Turabian StyleChou, Chien-Heng, and Chun-Yueh Lin. 2022. "Combining the MDM and BWM Algorithm to Determine the Optimal Crowdfunding Tokenization Solution for Digital Assets Market Startups" Systems 10, no. 4: 87. https://doi.org/10.3390/systems10040087
Note that from the first issue of 2016, this journal uses article numbers instead of page numbers. See further details here.