Abstract
We explore the directional spillover network among economic sentiment indicators and the economic policy uncertainty (EPU) index from Europe. We derive our results by fitting the directional spillover index approach to the monthly frequency data of eleven European countries, economic sentiment indicators and the European EPU index, spanning from 1 January 1987, to 1 February 2019. The empirical results indicate that the economic sentiment indicators of the largest European economies (Germany, France, and Italy) spillover with each other the most. The economic sentiment indicators of Germany and France most strongly influence the EU and Euro area economic sentiment indicators. The economic sentiment indicators of France and Italy have the most influence on the European EPU index, while the latter has the strongest influence on the economic sentiment indicators of Germany and France.
1. Introduction
In the last two decades most notably, it has been acknowledged that economies around the world are influenced by behavioral factors that underlie the confidence and expectations of investors and consumers regarding future economic outcomes. The standard rational view of economics inevitably made space for the domain of economic decision-making that is considered irrational and which relies on feelings and confidence to better grasp and forecast the behavior of financial and macroeconomic variables. Past financial and economic events, such as the 2008 global financial crisis, showed that confidence (or sentiment) is at the heart of economic decision-making and that researchers cannot neglect its importance [1,2].
The multiplier effect of confidence shows that domino effects in the corporate sector are a real phenomenon that can be triggered when confidence in the markets deteriorates. Periods of low confidence in the short term have been observed to cause credit markets to freeze up as lenders do not trust that they will be paid back. When people are confident, they go out and buy, thus helping boost the economy and causing prices to rise. On the other hand, when people are unconfident, they withdraw (e.g., save and stop buying) and sell their investment positions, thus impacting prices negatively and contributing to the formation of cycles of confidence [3]. If the above is true it is implied that confidence or measures of economic sentiment can be used as indicators of future performance in financial markets and the corporate sector, as investors can buy or sell with anticipation, and be encouraged or discouraged to invest. In this context, investigating the spillover influence between economic sentiment indicators across European countries is worthwhile. For spillover recipients, knowing which countries have the largest spillover effect on them can provide a time advantage in deciding when to buy or sell their portfolios of assets.
Economic policy uncertainty, which could be viewed as the risk related to unspecified future economic decisions from governments, has become a major concern to business and financial investors since the 2008–2009 global financial crisis and the 2010–2013 European Sovereign debt crisis. The increased interconnectedness among world economies has also increased the significant role that uncertainty in policies of economic character plays in investment behavior, financial decision, consumer spending, risk management and optimal policy design. For instance, studies have shown that high economic policy uncertainty tends to negatively affect economic growth and corporate investment by delaying it, while also increasing volatility in stock markets [4,5]. The relationship of causality between economic policy uncertainty and economic market sentiment could be seen as bidirectional. Specifically, high economic policy uncertainty would negatively impact consumer market sentiment on the individual and institutional levels, causing in turn higher savings levels and reduced spending and investment. Accordingly, high consumer market sentiment, and the higher consumption, investment, and tax collection it entails would reduce the uncertainty in economic policy oriented to determine where and how much to invest in the economy. In general, times of financial recession, characterized by low consumer market sentiment, make it more difficult (increase uncertainty) for economic policymakers to decide where and how much to invest in the economy to stimulate it. It is therefore in light of the aforementioned bidirectional relationship between economic policy uncertainty and economic market sentiment that an investigation of their mutual spillover effects is also worth undertaking.
This study investigates the risk spillovers between European economic sentiment indicators and between those indicators and European economic policy uncertainty (EPU) using Diebold and Yilmaz’s [6,7] directional spillover index, which is very suitable for identifying connectivity and measuring the degree of influence among multiple time series data. This complex multivariate network measure, unlike Granger causality and copula measures which focus on feedback relationships and dynamic coefficients of dependence between variables, respectively [8,9], is more advantageous as it provides an efficient way to describe the dynamic process and connectedness of a complex system and enables one to identify the spillover transmitters and receivers and the magnitude of the bidirectional spillovers. Our main objectives are (i) to identify the direction and magnitude of spillovers across the economic sentiment indicators in the European Union (EU) and Euro area (EA), (ii) identify the recipients and transmitters of spillovers across these sentiment indicators, (iii) visualize the network of spillovers among these sentiment indicators, and (iv) identify those economic sentiment indicators from Europe that most largely spillover on the European economic policy uncertainty, and vice versa. This research we conduct is important because it sheds light on the linkages that exist between European behavioral variables (i.e., economic sentiment across European countries), and between those behavioral variables and the uncertainty in economic policy implementation in Europe. Based on this study, economic policymakers would have a greater understanding of who is most strongly affected by their uncertainty in economic policy implementation, and what countries’ economic sentiment has the most potential to affect the level of uncertainty in economic policy implementation. For business analysts and investors, knowing what European countries’ economic market sentiment spillover is the strongest helps them determine with greater accuracy when to invest and divest, given the correlation between countries’ economies and markets.
We contribute to the relevant literature in two ways. First, our study appears to be the first to investigate the spillover effects among economic sentiment indicators from Europe and the spillovers between those European economic sentiment indicators and European economic policy uncertainty. Second, we report new and original findings indicating that the economic sentiment indicators of the largest European economies (Germany, France, and Italy) have the highest spillover effects among them. The EU and EA economic sentiment indicators are most strongly influenced by the economic sentiment indicators of Germany and France. The European EPU experiences the most influence from the economic sentiment indicators of France and Italy. The European EPU has the strongest influence on the economic sentiment indicators of Germany and France.
The implications of the results suggest that economic contagion is highly likely among the largest spillover transmitters and receivers, in our case, among Germany, France, and Italy. This means that economic optimism or pessimism can more easily spread across those countries’ markets and economies. Additionally, since the economic sentiment indicators of Germany and France have the strongest influence on the EU and EA economic sentiment indicators, they should be used as proxies or indicators for expectations to buy or sell investment positions or for timely investment and divestment. The identified mutual effects between European economic policy uncertainty and European economic market sentiment indicators attest to the importance that behavioral factors have in determining economic and fiscal policy, particularly during times of economic and financial distress when policymakers struggle the most to identify the best possible avenues to stimulate economies and improve economic sentiment. The largest spillover effects from the economic sentiment indicators of France and Italy to the European EPU suggest that the performance and consumer spending and investment of those two large Eurozone economies have an impact on the uncertainty faced by European economic policymakers. On the other hand, France’s and Germany’s willingness to spend (save) and invest is most sensitive to uncertainty displayed by economic policymakers in Europe.
2. Literature Review
Financial researchers have long shown interest in “sentiment” or “confidence” concepts when analyzing economic activities [10,11,12]. Although the two terms are identical in economic and financial analysis, sentiment is usually used in relation to financial markets (i.e., investor sentiment), whereas confidence is used in relation to consumer decisions and behaviors (i.e., consumer confidence).
Although it is not easy to quantify investor sentiment or consumer confidence in financial market trading and real economic activities, many academics and practitioners introduce several sentiment indicators and confidence indices used in many countries. For example, see Adams [13,14] and Mueller [12,15], for early studies in this area. Recently, several indices are used in the U.S., such as the U.S. consumer confidence index of the Conference Board, the Consumer Sentiment Index of the University of Michigan’s Institute for Social Research, the Washington Post-ABC News Consumer Comfort Index, the Acertus Market Sentiment Indicator by Acertus Capital Management, and the market volatility index (VIX) of the Chicago Board Options Exchange (CBOE). Some recent studies propose new indices that use text mining and machine learning methods [16,17,18].
Using these indexes or indicators, researchers explore the impact of investor sentiment (or confidence) on the price fluctuation of financial assets, such as stocks [19,20,21,22,23,24,25,26,27,28,29,30,31,32,33,34,35], commodities [36], Bitcoin [37], and gold [38]. Among others, Kim et al. [27] investigate the impact of investor sentiment on the link between disagreement among investors and stock market returns and find that this relationship varies over time depending on the characteristics of investor sentiment. Balcilar et al. [38] examine the nonlinear causal impact of investor sentiment on the gold market and find that the influence of investor sentiment is more prevalent for intraday volatility rather than daily returns. Ryu et al. [30] investigate how trading behavior and investor sentiment influence stock returns and find that high investor sentiment leads to higher returns in the Korean stock market. Eom et al. [37] explore the statistical characteristics of Bitcoin returns and volatility and their connection to investor sentiment. They find that the Bitcoin market depends on investor sentiment rather than on a monetary asset.
Some studies apply consumer confidence (or sentiment) to analyze macroeconomic activities, such as household decisions on debt and savings [39]; consumer spending, business cycles and economic growth [10,40,41,42,43,44,45,46,47], financial stability [48,49], and tourism demand [50]. For example, Acemoglu and Scott [10] apply the consumption capital asset pricing model (CAPM) to U.K. data and show that consumer confidence has forecasting ability for the level of consumption. Mehra and Martin [41] indicate that consumer sentiment foreshadows current expectations about economic conditions, implying that consumer sentiment can be a useful indicator of the near-term prospects for household spending. Ludvigson [40] finds that sentiment indices contain some meaningful independent information on forecasting aggregate consumer spending growth while arguing that much of this information is available from other popular economic and financial indicators. Vuchelen [42] demonstrates that a measure of expected growth and uncertainty, as well as macroeconomic variables such as the inflation rate, unemployment, interest rates and equity market indices can forecast the sentiment of Belgian consumers. Dragouni et al. [50] find that sentiment and mood indicators are net transmitters of spillover shocks to outbound tourism demand. Białowolski [39] explores the impact of Polish consumers’ economic sentiment on household financial behaviors toward debt and savings. The author reports that consumer confidence stimulates debt for mortgages and durables, whereas lower confidence increases the likelihood of saving for consumption.
Some studies aim to construct an economic risk index. For instance, Baker et al. [51] propose a popular EPU index based on newspaper coverage frequency and indicate that EPU shocks increase the volatility of equity prices and decrease investment and employment in policy-sensitive sectors such as infrastructure construction, healthcare, and defense industries. In addition, policy uncertainty shocks reduce a country’s investment and employment. Davis [52] proposes a monthly index of Global EPU (GEPU) that covers 16 countries. It is the GDP-weighted average of national EPU indices that account for two-thirds of global GDP. Alexopoulos and Cohen [53] propose indicators based on texting, which account for general economic and policy-specific uncertainty from newspapers and checked their effect on business cycles, equity markets and the economy. They demonstrate that shocks measured by their indicators reduce economic activity, expand equity market volatility, and decrease equity market returns, showing similar effects to the EPU index.
Recent research focuses on the spillover effects of the EPU index and other financial asset prices such as stock [54,55,56,57,58,59,60,61,62,63,64,65,66], Bitcoin [67,68,69], crude oil [56,57,70,71,72,73], gold [74,75], commodity [59,76,77], house [78,79], foreign exchange [59,63,80,81], and sovereign bond [58,63,82]. Recent research also focuses on the impact of the EPU index on the stock–bond correlation [83], bank loans [84,85], economic growth [84,86], consumption [86], investment [86,87], inflation [88], unemployment [89], the business cycle [58,90,91,92,93], tourism demand [94], and the EPU of other countries [95,96]. Among others, Colombo [90] examines the influence of a U.S. EPU shock on some Euro-area macroeconomic aggregates using structural VAR models and determines that a shock to U.S. EPU causes a significant decrease in the European industrial production and price levels. Karnizova and Li [58] explore the ability of an EPU index to forecast future U.S. recessions using Probit recession forecasting models and find that the EPU index is significant in forecasting recessions. Liu and Zhang [64] study the influence of global EPU on Chinese equity market volatility and find that fluctuations in the GEPU can cause high volatility in stock markets. Wang et al. [77] employ the price changes in 23 EPU indices and demonstrates that commodity price changes can be a leading indicator of EPU. Balcilar et al. [80] investigate the predictability of 16 foreign exchange rates based on an EPU index by employing a nonparametric causality-in-quantiles test and find that the EPU index has the predictive ability for both the returns and volatility of some exchange rates. Balcilar et al. [88] find that the forecasting ability of U.S. inflation improves when controlling for the long-memory feature and EPU. Balli et al. [95] investigate the spillovers and determinants between EPUs across countries and find that bilateral factors such as trade and a common language are highly significant in explaining the magnitude of EPU spillovers. Demir et al. [67] demonstrate that the EPU has predictive power for Bitcoin returns. Kido [59] explores the effects of U.S. EPU spillovers on global financial markets using a factor-augmented VAR model and reports that U.S. EPU affects the equity and foreign exchange markets of several countries. Das et al. [55] compare the impact of international EPU, geopolitical risk (GPR) and financial stress (FS) on 24 emerging equity markets using a nonparametric causality-in-quantiles test and find that they have a highly significant effect compared to the two other shock indicators (GPR and FS). Trung [92] finds that U.S. EPU changes have a significant impact on global business cycle fluctuations. Nevertheless, the spillovers across countries are heterogeneous and defined by the characteristics of the recipient country (e.g., quality of institutions, financial openness, trade, and level of development).
As shown above, although there are many studies on the economic sentiment and EPU and their linkage to the economy and financial market, we cannot find studies that analyze spillovers among economic sentiment of several countries or the relationship between economic sentiment and EPU. Our study is the first one to fill this research gap, which investigates the spillover effects among economic sentiment indicators of European countries, and the spillovers between European economic sentiment indicators and European economic policy uncertainty.
3. Methodology
We analyze the spillover effects across economic sentiment indicators following Diebold and Yilmaz’s [6,7] directional spillover index methodology, which fits a generalized VAR (GVAR) approach and incorporates the variance decomposition matrix. This spillover approach provides estimates of total, net, and directional spillover effects among economic sentiment indicators. We assume that the evolution of the logarithmic differences corresponding to economic sentiment indicators follows the covariance stationary VAR in Equation (1):
The variable is an vector of the logarithmic differences in the economic sentiment indicator, and is an matrix of the autoregressive coefficients denoting the effect of past observations on the evolution of , the predicted observations. is an error term that accounts for the effect of variables not considered in the evolution of the process. We assume that this term is serially uncorrelated. A moving average representation of Equation (1) is where . In applying the GVAR, we can express the effects of variable on the -step-ahead generalized forecast error variance of variable as follows:
In Equation (2), the parameter is a non-orthogonalised covariance matrix of errors corresponding to the VAR system. The parameter represents a vector of standard deviations of the error term for the equation, and is an vector with a value of one as the element and a value of zero otherwise. The term accounts for coefficients that scale the -lagged error in the infinite moving-average representation of VAR.
We estimate the pairwise directional spillovers from economic sentiment indicator to economic sentiment indicator as follows:
We estimate all directional spillovers from all other economic sentiment indicators to the economic sentiment indicator as the sum of the off-diagonal values from the resulting connectedness matrix, as follows:
The total and off-diagonal sums of the columns represent the total directional connectedness between all other economic sentiment indicators and the economic sentiment indicator:
The net total directional connectedness is
The total connectedness for the system-wide network is the ratio of the sum of to-others (from-others) elements of the variance decomposition matrix to the sum of all elements:
In developing the network topology of market connectedness, Diebold and Yilmaz [7,97] interpret the variance decomposition matrix as the adjacency matrix of a weighted directed network. The adjacency matrix elements include pairwise directional connectedness, ; the row sums of the adjacency matrix (node in-degrees) denote total directional connectedness ‘from’, ; and the column sums of the adjacency matrix (node out-degrees) denote total directional connectedness ‘to’, .
4. Sample Data
We use eleven economic sentiment indicator series from the following European countries: France, Belgium, Germany, Italy, the Netherlands, Luxemburg, Austria, Greece, Ireland, Denmark, and Finland. We select economic sentiment indicators from these countries because they represent a good variety of economies in terms of size and from different parts of Europe. Other European countries’ economic sentiment indicators were not included due to the unavailability of data for the length of the sample targeted. We also add two economic sentiment indicators for the whole European Union and Euro Area, and the European Economic Policy Uncertainty. All time series are at the monthly frequency and span from 1 January 1987 to 1 February 2019. All data series have been downloaded from the European Commission’s Eurostat website. The economic sentiment indicators are a composite of the following five sectoral confidence indicators weighted proportionally: the construction confidence indicator (5%), the retail trade confidence indicator (5%), the consumer confidence indicator (20%), the services confidence indicator (30%), and the industrial confidence indicator (40%). The surveys for each economic sentiment indicator are defined within the Joint Harmonized EU Programme of Business and Consumer Surveys.
Table 1 reports the descriptive statistics of the economic sentiment indicators. We can see that all historical means are in the range of zero. Only two economic sentiment indicator time series have a kurtosis larger than 3, indicating the absence of normality in those series. In addition, most of the time series have a negative skewness, suggesting a stronger tendency of economic sentiment indicators to decrease than increase across time.

Table 1.
Descriptive statistics of the European economic sentiment indicators and European Economic Policy Uncertainty (EPU) index.
5. Empirical Results
In this section, we first report the results of the analysis of spillovers between the selected European countries’ economic sentiment indicators. Next, we present the spillovers between the economic sentiment indicators of the selected European countries and that of the entire EU and EA. Lastly, we present the spillovers between the selected European countries’ economic sentiment indicators and European EPU.
Table 2 presents the spillovers between the economic sentiment indicators of the selected European countries. We can see that the largest spillover transmitters are the economic sentiment indicators from France, Belgium, the Netherlands, Germany, and Austria. On the contrary, the smallest spillover transmitters are the economic sentiment indicators from Luxembourg, Greece, Denmark, Ireland, and Finland. The largest spillover transmitters are also the largest spillover receivers. In terms of the spillovers between pairs of economic sentiment indicators, France’s economic sentiment indicator has large spillovers on those of Belgium (11.1), Germany (8.53) and Austria (8.1). The economic sentiment indicator of Belgium has large spillovers on those of France (13.45), Germany (10.66), the Netherlands (11.82), Austria (8.95), and Italy (8.38). The economic sentiment indicator from Germany has large spillovers on those of the Netherlands (12.08), Belgium (10.98), Austria (10.54), and France (9.31). The economic sentiment indicator from the Netherlands has large spillovers on those of Belgium (7.15) and Germany (7.06). Finally, the economic sentiment indicator from Austria has large spillovers on those of Germany (9.48) and Belgium (7.74).

Table 2.
Spillover index between selected countries’ economic sentiment indicators.
Table 3 reports the spillovers between the economic sentiment indicators of the selected European countries and the economic sentiment indicators for all the EU and EA. Accordingly, the country’s economic sentiment indicators that most largely influence (spillover) the EU’s economic sentiment indicator are those of Germany (11.6) and France (9.0), followed by Belgium (7.95) and Italy (6.84). Austria’s economic sentiment indicator has a medium-size influence (4.72) on the EU’s economic sentiment indicator. The economic sentiment indicators that most strongly influence the economic sentiment indicator of the entire EA are also those of Germany (13.4), France (8.78), Belgium (8.07) and Italy (7.88). The economic sentiment indicator from Austria has a medium-size effect (5.05) on the EA’s economic sentiment indicator. On the other side of the spectrum, the EU’s economic sentiment indicator has the strongest spillovers on Germany (18.77), France (16.24), Italy (14.97), Belgium (14.79), the Netherlands (13.9) and Austria (12.03), in decreasing order. The EA’s economic sentiment indicator also has the strongest effect on the economic sentiment indicators in these countries.

Table 3.
Spillover index between selected countries’ economic sentiment indicators and the EU and EA economic sentiment indicators.
Table 4 presents the spillovers between the selected European countries’ economic sentiment indicators and European EPU. We find that the economic sentiment indicators of France (1.66), Italy (1.62) and Belgium (1.31) have the strongest impact on European EPU. On the other hand, European EPU has the strongest influence on the economic sentiment indicators of Germany (2.17), France (1.89), Italy (1.74) and Luxembourg (1.61).

Table 4.
Spillover index between selected countries’ economic sentiment indicators and EPU index for Europe.
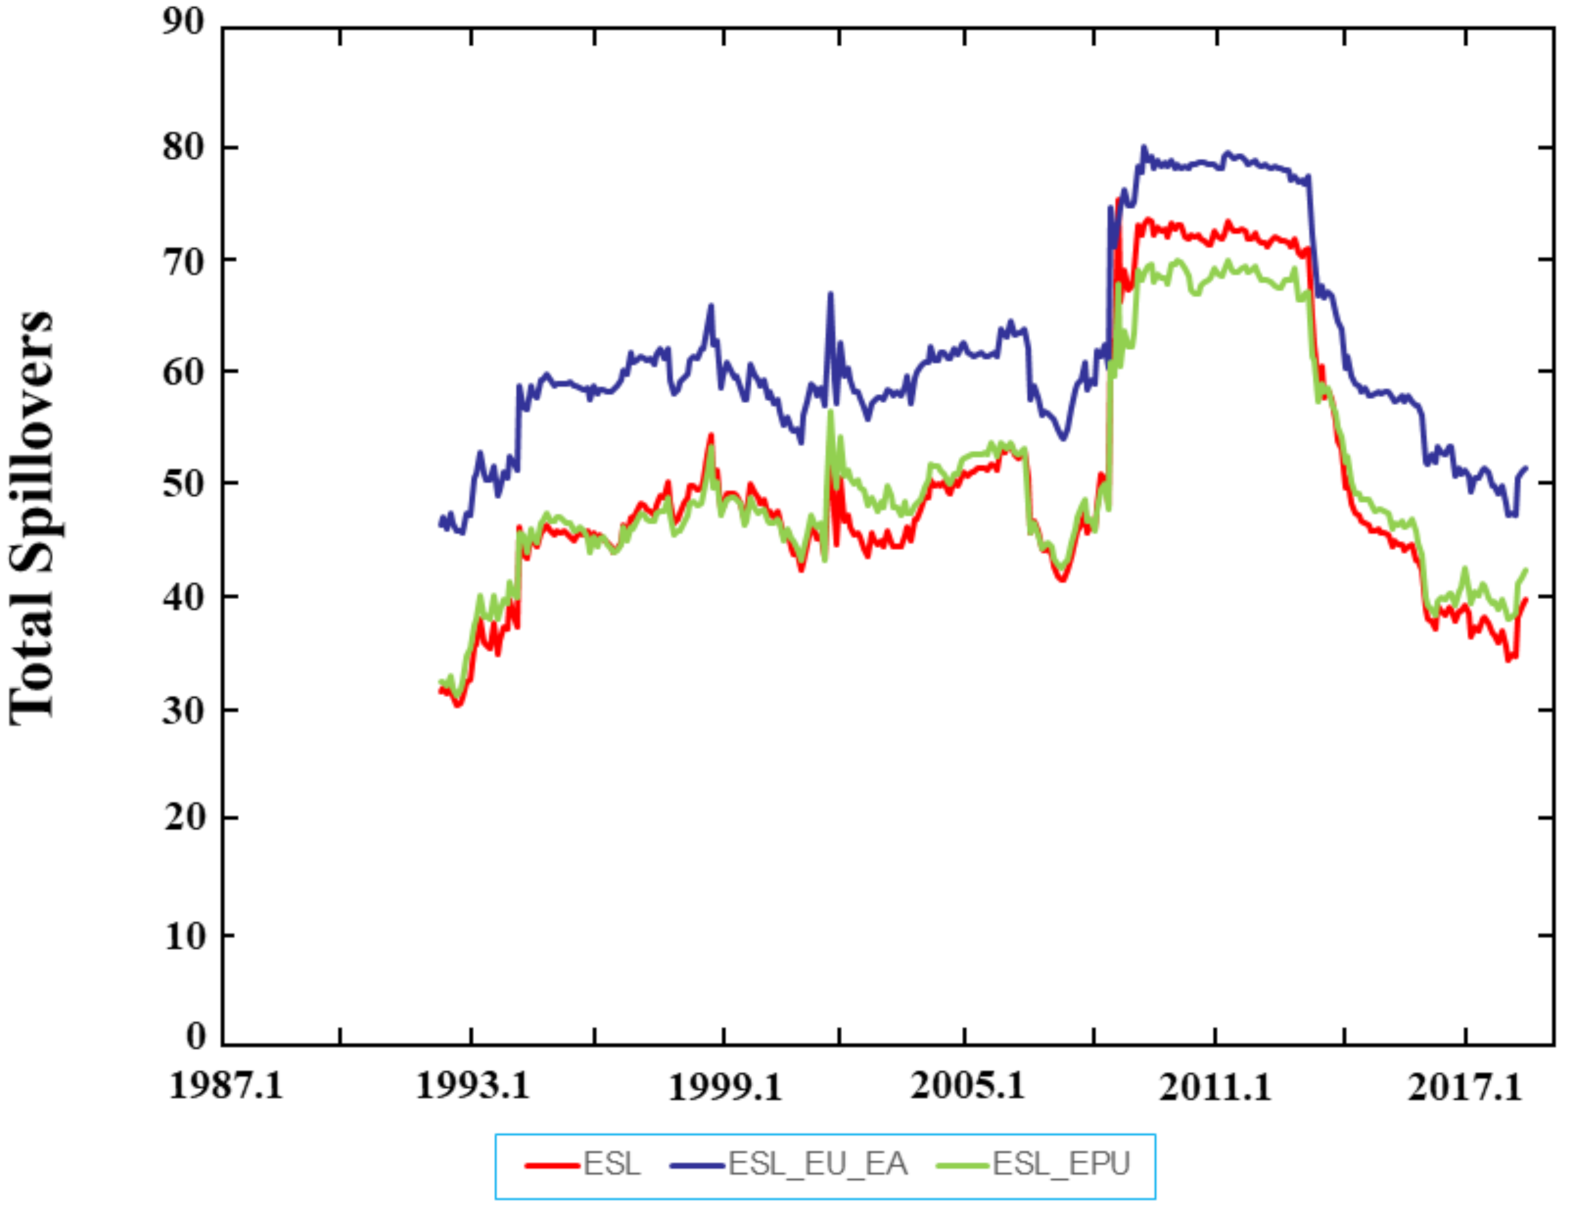
Figure 1 illustrates the dynamics of the spillovers among the economic sentiment indicators of the selected European countries (in red), between the economic sentiment indicators of the selected European countries and the EU and EA economic sentiment indicators (in blue), and between the European countries’ economic sentiment indicators and European EPU (in green). Note that all spillovers in the medium- and long-term show similar dynamics, though at different scales.
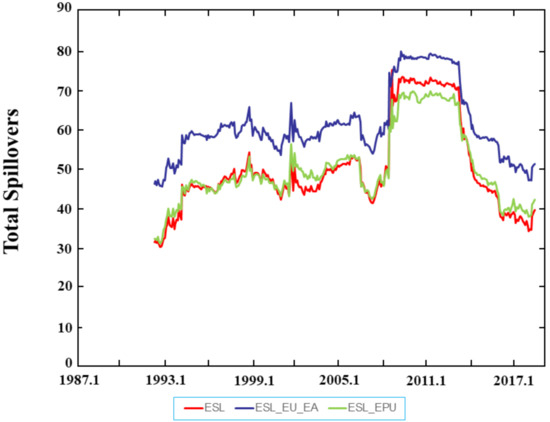
Figure 1.
Dynamics of total spillover indices of the economic sentiment indicators. Note: This plot uses the forecast error variance decompositions of the 10-step-ahead forecasts with 60-month rolling windows.
As Figure 1 shows, we see that the spillovers between the European countries’ economic sentiment indicators and the EU and EA economic sentiment indicators are larger than for its counterparties. The spillovers for all three cases show an increasing trend from 1993 to 1999. Afterwards, all spillovers show a declining trend until 2002. From 2002 to the middle of 2006, all spillovers undergo a mild trend of increase and then sharply decline through to the third quarter of 2007. The largest increase in the spillovers occurs around 2008, most likely reflecting the influence of the 2008 global financial crisis. The spillovers remain high throughout 2008–2013 and decline around the first quarter of 2014.
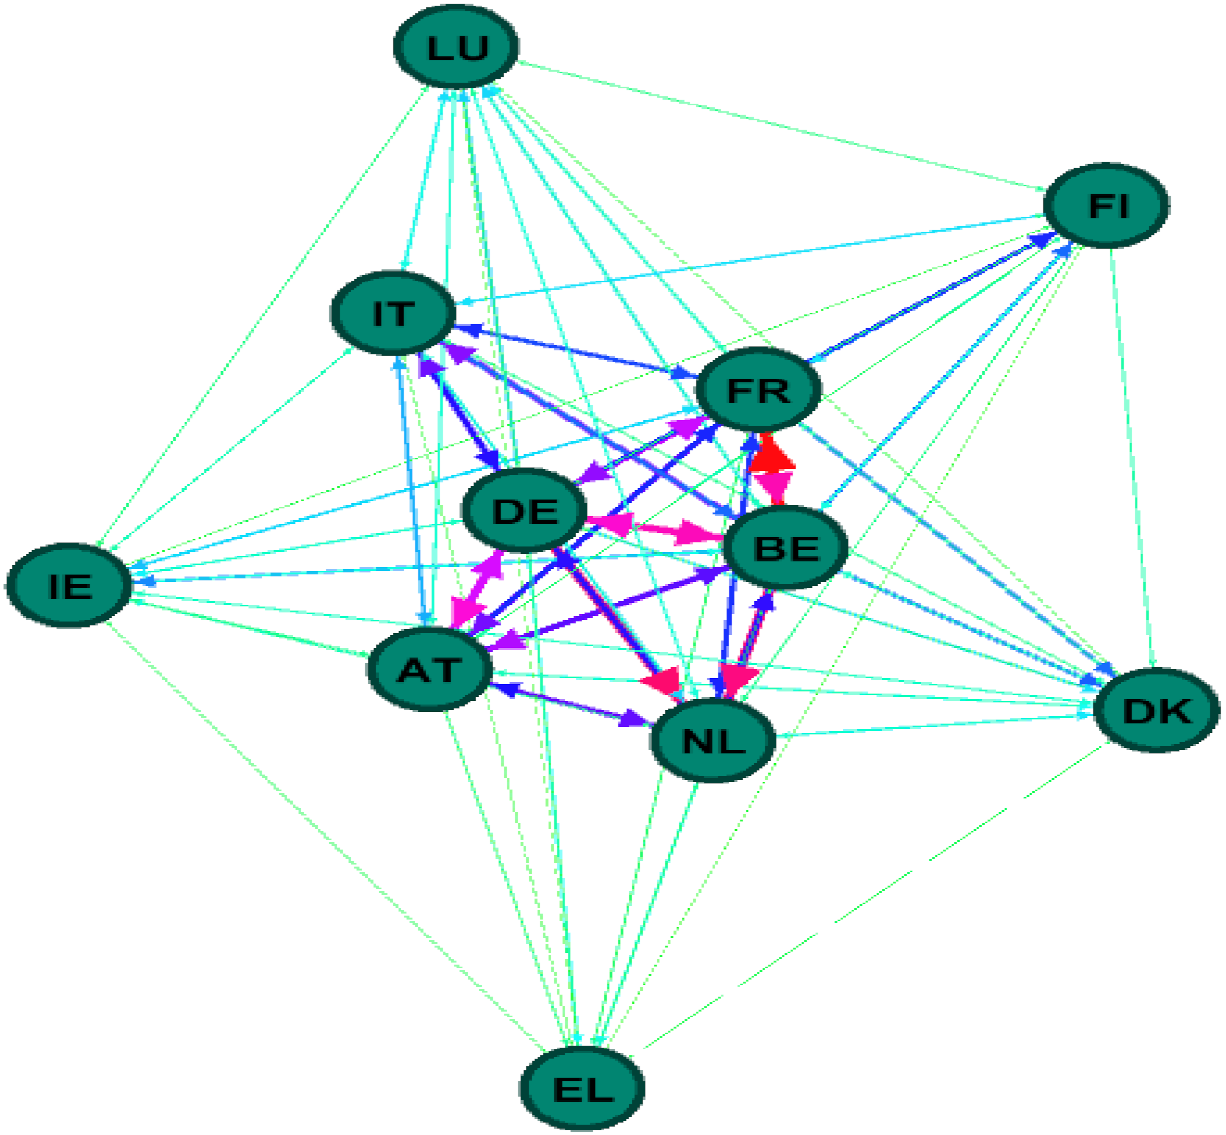
Figure 2 provides a visualization of the system-wide network among European countries’ economic sentiment indicators. We find the largest spillovers among the largest European economies in our sample. For instance, the economic sentiment indicators of France (FR) and Belgium (BE) have a pairwise directional spillover with each other. We also see a large level of pairwise directional spillovers between the sentiment indicators of Belgium (BE) and Germany (DE). Medium pairwise directional spillovers occur between the economic sentiment indicators of Germany (DE) and Italy (IT), Belgium (BE) and Italy (IT), France (FR) and Italy (IT), and Germany (DE) and the Netherlands (NL). The economic sentiment indicators of Germany (DE) and Austria (AT) largely spillover with each other. Austria’s economic sentiment indicator also transmits and receives medium size spillovers to/from France (FR), Belgium (BE) and the Netherlands (NL). The economic sentiment indicators of Ireland (IE), Greece (EL), Denmark (DK), Finland (FI), and Luxemburg (LU) act mainly as small spillover recipients from the economic sentiment indicators of the largest European economies.
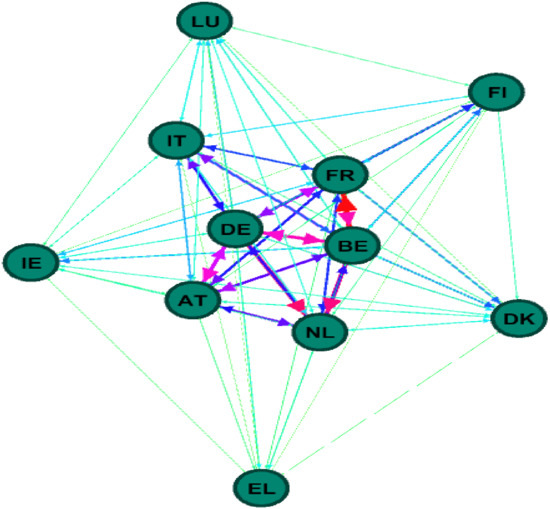
Figure 2.
System-wide network of economic sentiment indicators. Notes: The size of the node indicates the magnitude of the net pairwise connectedness. The edge size indicates the magnitude of the net pairwise connectedness. The colors also indicate the magnitude (green (small), light blue (medium), and blue and red (large)).
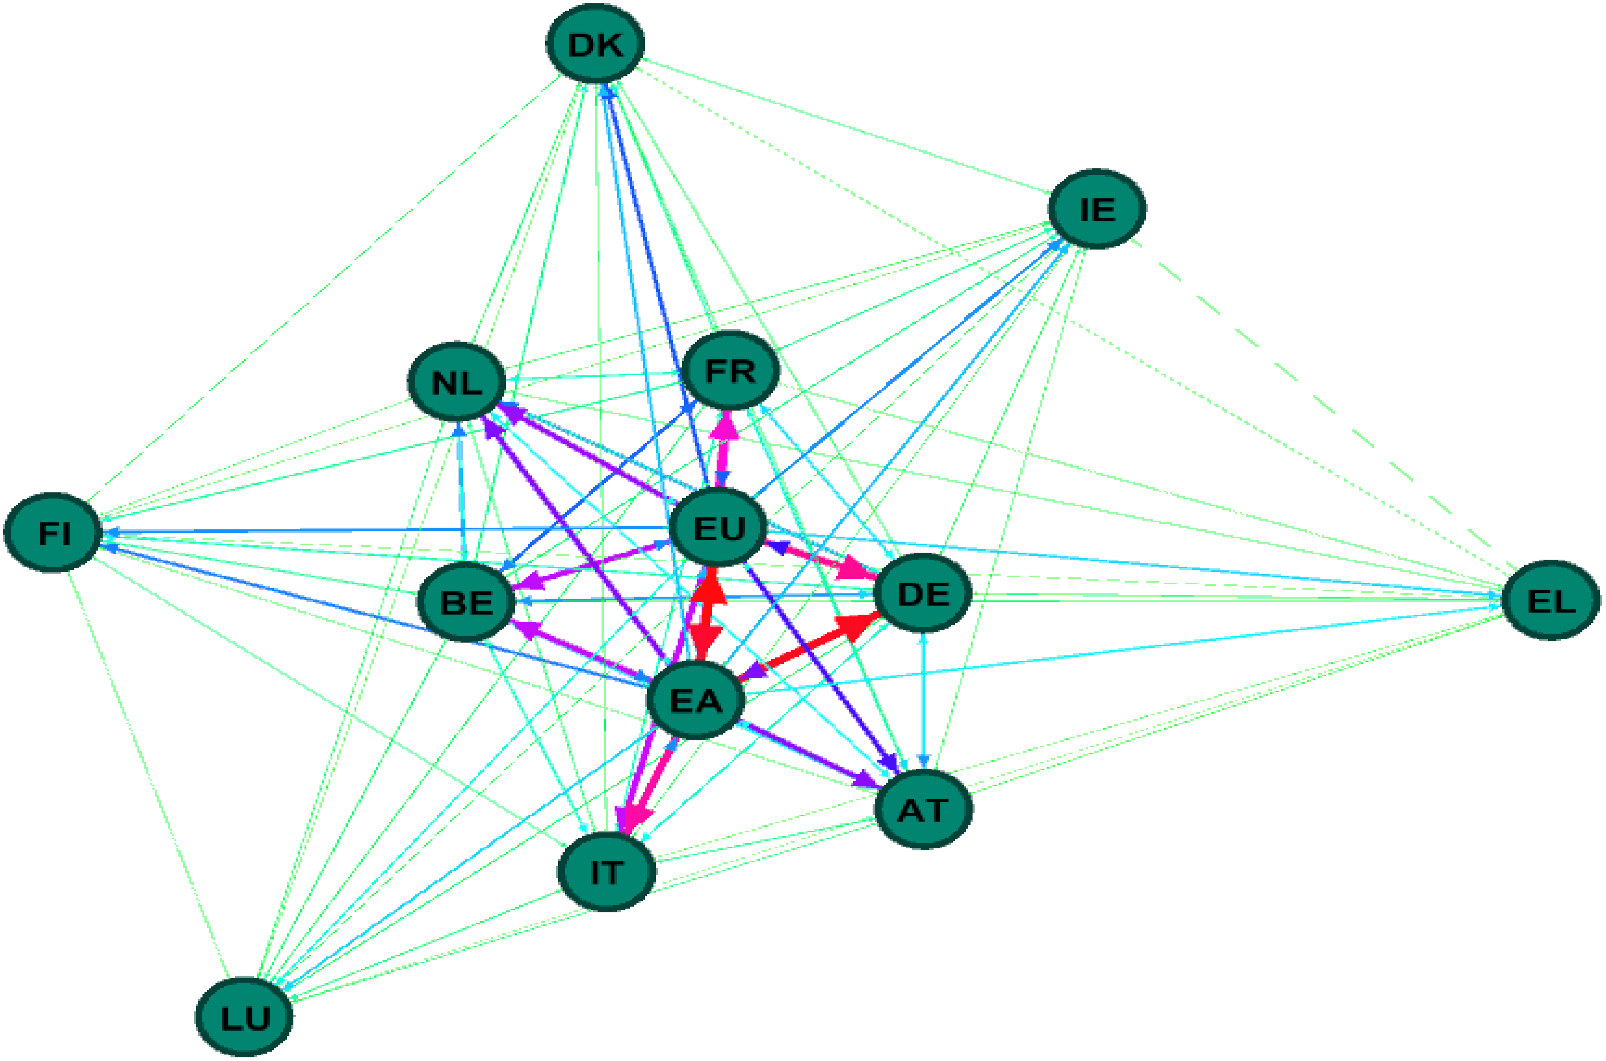
Figure 3 illustrates the system-wide network between the economic sentiment indicators of the selected European countries and the economic sentiment indicators of the EU and EA. We observe that the largest spillovers (in red) occur between the economic sentiment indicators of the whole EU and the EA. In addition, the economic sentiment indicators of the largest European economies (e.g., Germany, France, and Italy) transmit and receive large and medium-size spillovers to/from the economic sentiment indicators of the EU and EA. For instance, the economic sentiment indicator from Germany (DE) transmits and receives large spillovers to/from the economic sentiment indicators from the EU and EA. France’s economic sentiment indicator transmits and receives semi-strong spillovers to/from the EU’s economic sentiment indicator. The EU and EA economic sentiment indicators transmit medium size spillovers to the Netherlands (NL), Austria (AT) and Belgium (BE). Here again, the economic sentiment indicators of Ireland, Finland, Greece, Luxemburg, and Denmark act as small and medium-size spillover recipients of the economic sentiment indicators of the largest European economies.
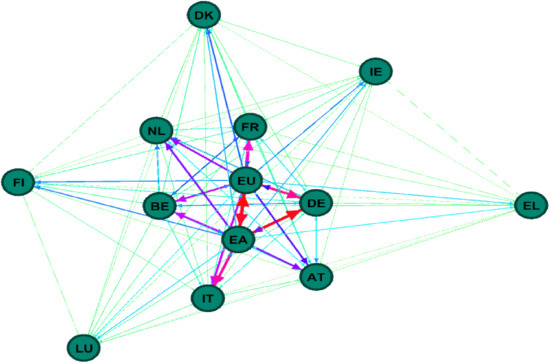
Figure 3.
System-wide network of economic sentiment indicators including the EU and EA. Note: See the notes in Figure 2.
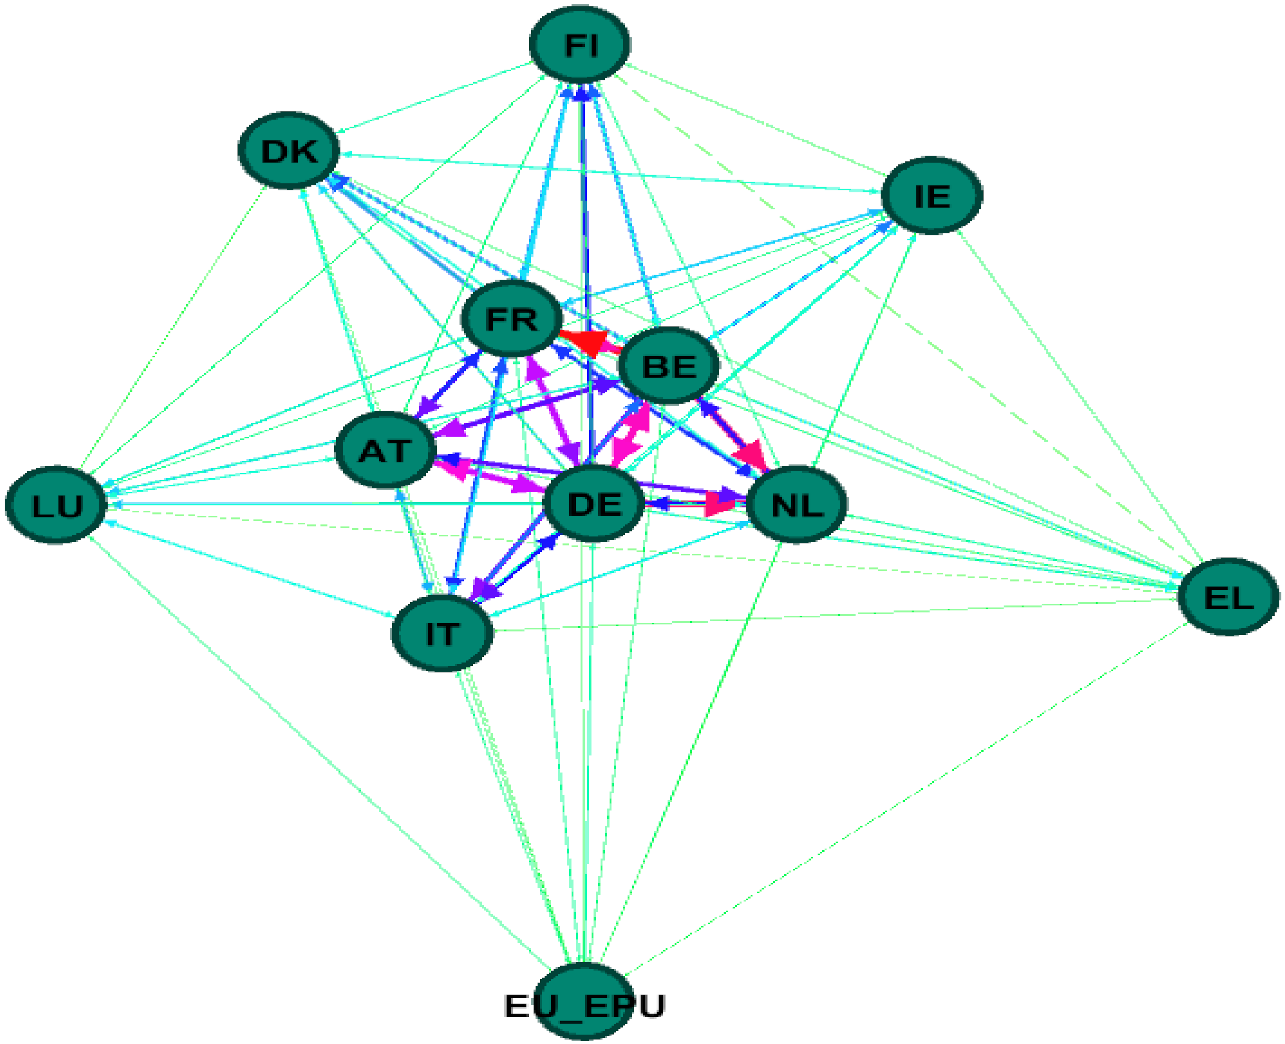
Figure 4 presents the system-wide network between the selected European countries’ economic sentiment indicators and European EPU. We find that EPU acts mainly as a spillover transmitter. For instance, European EPU has a weak spillover (influence on) compared to all other economic sentiment indicators. The largest and medium-sized spillovers occur among the economic sentiment indicators of the largest economies.
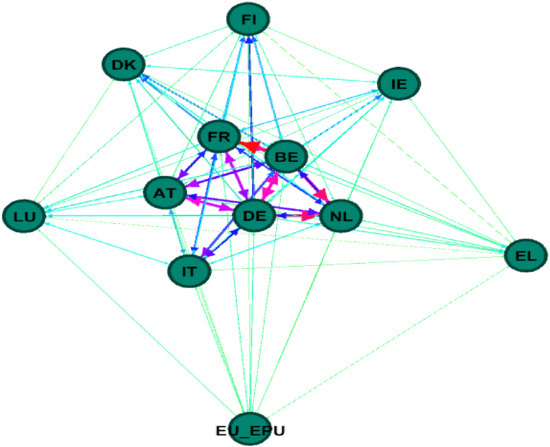
Figure 4.
System-wide network of economic sentiment indicators and EPU index. Note: See the notes in Figure 2.
6. Conclusions
In finance and economics, decisions about investments and divestments involve an element of confidence (expectations) about future economic outcomes, in addition to traditional measures of risk and performance. Investors specifically put together and synthetize small bits of economic and financial information to derive a sense of where the overall and individual sectors of the economy are heading to better allocate their financial resources. To this end, economic sentiment indicators play an important role because they are based on the confidence and expectations of investors and the corporate sector regarding the performance of various economic sectors. Accordingly, economic sentiment indicators can become a source of risk if they have spillovers, and could positively or negatively influence consumer spending, investment, and economic growth. On the other side of the spectrum, economic policy uncertainty also poses a risk to economic growth and investment by discouraging investors to engage in investment projects that could generate employment and income. Further, due to the increasing integration of economies and financial markets, economic policy uncertainty is increasingly playing an important role in determining cross-country risk management and investment behavior, optimal policy design, consumer spending, financial decision making and stock market volatility [4,5]. This effect of economic policy uncertainty has been more pronounced during times of financial turmoil characterized by low consumer market confidence (sentiment). Hence, a link exists between economic policy uncertainty and consumer market sentiment, with high levels of the former negatively impacting (reducing) economic sentiment and high levels of the latter positively affecting (reducing) economic policy uncertainty.
It is consequently under the above understanding of economic market sentiment and economic policy uncertainty as potential sources of risk that an investigation of bidirectional spillovers between economic sentiment indicators from Europe, and between these economic sentiment indicators and European economic policy uncertainty is worth undertaking. To address this problem our research study implements the spillover index of Diebold and Yilmaz’s [7] which provides an efficient way to describe the dynamic process and connectedness of a complex system and enables one to identify the spillover transmitters and receivers and the magnitude of the bidirectional spillovers. Our empirical results show that the economic sentiment indicators of the largest European economies (Germany, France, and Italy) have the most spillovers among them. The European Union and Euro Area economic sentiment indicators are most strongly influenced by those of Germany and France. The European EPU experiences the most spillover (influence) from the economic sentiment indicators of France and Italy. The European EPU has the strongest influence on the economic sentiment indicators of Germany and France
The identified bidirectional effects between European economic market sentiment and European economic policy uncertainty show the important relationship that exists between behavioral factors and economic policy. This relationship has been particularly clear during times of financial crisis when economic policy markers struggle the most to come up with adequate investment approaches to revitalize economies and improve economic sentiment [1,2]. The identified largest spillovers between European economic sentiment indicators suggest that economic contagion is highly likely among the largest EU economies (Germany, France, and Italy) which happen to be the largest spillover transmitters and receivers. Additionally, since the economic sentiment indicators of these economies have the strongest influence on the EU and EA economic sentiment indicators, they should be used as proxies or indicators in anticipation of selling or buying.
Although we explored spillovers among economic sentiment indicators of eleven European countries, other European countries’ economic sentiment indicators were not included due to unavailability of data or too short length of the sample series. As data availability expands, more countries’ economic sentiment indicators could be included in the study. Furthermore, our research methodology can be applied to countries in Africa, America, and Asia.
Author Contributions
All the authors contributed to the entire process of writing this paper. Conceptualization, J.A.H., S.H.K., Z.J. and S.-M.Y.; Data curation, J.A.H. and Z.J.; Methodology, J.A.H. and S.H.K.; Formal analysis, J.A.H., S.H.K., Z.J. and S.-M.Y.; Funding acquisition, Z.J. and S.-M.Y.; Investigation, S.H.K. and Z.J.; Project administration, S.-M.Y.; Software, J.A.H., S.H.K. and Z.J.; Supervision, S.-M.Y.; Validation, J.A.H. and S.H.K.; Visualization, J.A.H. and S.H.K.; Writing—original draft, J.A.H., S.H.K., Z.J. and S.-M.Y.; Writing—review & editing, Z.J. and S.-M.Y. All authors have read and agreed to the published version of the manuscript.
Funding
This work was supported by the Ministry of Education of the Republic of Korea and the National Research Foundation of Korea (NRF-2020S1A5B8103268).
Data Availability Statement
The economic sentiment indicators data that support the findings of this study are openly available in the Eurostat website at https://ec.europa.eu/eurostat/ accessed on 28 June 2022. These data were derived from the following resources available in the public domain: https://ec.europa.eu/eurostat/statistics-explained/index.php/Glossary:Economic_sentiment_indicator_(ESI) accessed on 28 June 2022. And the Economic Policy Uncertainty Index data that support the findings of this study are openly available in the Economic Policy Uncertainty website at https://www.policyuncertainty.com accessed on 28 June 2022.
Acknowledgments
We would like to thank seminar participants at the Department of Economics and IEIT at Pusan National University.
Conflicts of Interest
The authors declare no conflict of interest.
References
- Zouaoui, M.; Nouyrigat, G.; Beer, F. How does investor sentiment affect stock market crises? Evidence from panel data. Financ. Rev. 2011, 46, 723–747. [Google Scholar] [CrossRef] [Green Version]
- Chiu, J.; Chung, H.; Ho, K.-Y.; Wu, C.-C. Investor sentiment and evaporating liquidity during the financial crisis. Int. Rev. Econ. Financ. 2018, 55, 21–36. [Google Scholar] [CrossRef]
- Akerlof, G.A.; Shiller, R.J. Animal Spirits: How Human Psychology Drives the Economy, and Why It Matters for Global Capitalism; Princeton University Press: Princeton, NJ, USA, 2009. [Google Scholar]
- Bloom, N. The impact of uncertainty shocks. Econometrica 2009, 77, 623–685. [Google Scholar]
- Baker, S.R.; Bloom, N.; Davis, S.J. Measuring Economic Policy Uncertainty. Chicago Booth Research Paper 13–02; Stanford University Press: Stanford, UK, 2013. [Google Scholar]
- Diebold, F.X.; Yilmaz, K. Better to give than to receive: Predictive directional measurement of volatility spillovers. Int. J. Forecast. 2012, 28, 57–66. [Google Scholar] [CrossRef] [Green Version]
- Diebold, F.X.; Yilmaz, K. On the network topology of variance decompositions: Measuring the connectedness of financial firms. J. Econom. 2014, 182, 119–134. [Google Scholar] [CrossRef] [Green Version]
- Granger, C.W.J. Investigating causal relations by econometric models and cross-spectral methods. Econometrica 1969, 37, 424–438. [Google Scholar] [CrossRef]
- Patton, A. A review of copula models for economic time series. J. Multivar. Anal. 2012, 110, 4–18. [Google Scholar] [CrossRef] [Green Version]
- Acemoglu, D.; Scott, A. Consumer confidence and rational expectations: Are agents’ beliefs consistent with the theory? Econ. J. 1994, 104, 1–19. [Google Scholar] [CrossRef]
- Blanchard, O. Consumption and the recession of 1990–1991. Am. Econ. Rev. 1993, 83, 270–274. [Google Scholar]
- Mueller, E. Ten years of consumer attitude surveys: Their forecasting record. J. Am. Stat. Assoc. 1963, 58, 899–917. [Google Scholar] [CrossRef]
- Adams, F.G. Consumer attitudes, buying plans, and purchases of durable goods: A principal components, time series approach. Rev. Econ. Stat. 1964, 46, 347–355. [Google Scholar] [CrossRef]
- Adams, F.G. Prediction with consumer attitudes: The time-series cross-section paradox. Rev. Econ. Stat. 1965, 47, 367–378. [Google Scholar] [CrossRef]
- Mueller, E. Effects of consumer attitudes on purchases. Am. Econ. Rev. 1957, 47, 946–965. [Google Scholar]
- Barber, B.M.; Odean, T. All that glitters: The effect of attention and news on the buying behavior of individual and institutional investors. Rev. Financ. Stud. 2008, 21, 785–818. [Google Scholar] [CrossRef] [Green Version]
- Bollen, J.; Mao, H.; Zeng, X. Twitter mood predicts the stock market. J. Comput. Sci. 2011, 2, 1–8. [Google Scholar] [CrossRef] [Green Version]
- Gabrovšek, P.; Aleksovski, D.; Mozetič, I.; Grčar, M. Twitter sentiment around the Earnings Announcement events. PLoS ONE 2017, 12, e0173151. [Google Scholar] [CrossRef] [PubMed]
- Antoniou, C.; Doukas, J.A.; Subrahmanyam, A. Cognitive dissonance, sentiment, and momentum. J. Financ. Quant. Anal. 2013, 48, 245–275. [Google Scholar] [CrossRef] [Green Version]
- Baker, M.; Wurgler, J. Investor sentiment and the cross-section of stock returns. J. Financ. 2006, 61, 1645–1680. [Google Scholar] [CrossRef] [Green Version]
- Barberis, N.; Shleifer, A.; Vishny, R. A model of investor sentiment. J. Financ. Econ. 1998, 49, 307–343. [Google Scholar] [CrossRef]
- Daniel, K.; Hirshleifer, D.; Subrahmanyam, A. Investor psychology and security market under-and overreactions. J. Financ. 1998, 53, 1839–1885. [Google Scholar] [CrossRef] [Green Version]
- Hong, H.; Stein, J.C. A unified theory of underreaction, momentum trading, and overreaction in asset markets. J. Financ. 1999, 54, 2143–2184. [Google Scholar] [CrossRef] [Green Version]
- Lemmon, M.; Portniaguina, E. Consumer confidence and asset prices: Some empirical evidence. Rev. Financ. Stud. 2006, 19, 1499–1529. [Google Scholar] [CrossRef]
- Yoon, S.-M.; Kang, S.-H. Weather effects on returns: Evidence from the Korean stock market. Phys. A 2009, 388, 682–690. [Google Scholar] [CrossRef]
- Kang, S.H.; Jiang, Z.; Lee, Y.; Yoon, S.-M. Weather effects on the returns and volatility of the Shanghai stock market. Phys. A 2010, 389, 91–99. [Google Scholar] [CrossRef]
- Kim, J.S.; Ryu, D.; Seo, S.W. Investor sentiment and return predictability of disagreement. J. Bank. Financ. 2014, 42, 166–178. [Google Scholar] [CrossRef]
- Lee, Y.-H.; Tucker, A.L.; Wang, D.K.; Pao, H.-T. Global contagion of market sentiment during the US subprime crisis. Glob. Financ. J. 2014, 25, 17–26. [Google Scholar] [CrossRef]
- Yacob, N.; Mahdzan, N.S. The predictive ability of consumer sentiment’s volatility to the Malaysian stock market’s volatility. Afro-Asian J. Financ. Account. 2014, 4, 460–476. [Google Scholar] [CrossRef]
- Ryu, D.; Kim, H.; Yang, H. Investor sentiment, trading behavior and stock returns. Appl. Econ. Lett. 2017, 24, 826–830. [Google Scholar] [CrossRef]
- Yang, H.; Ryu, D.; Ryu, D. Investor sentiment, asset returns and firm characteristics: Evidence from the Korean stock market. Invest. Anal. J. 2017, 46, 132–147. [Google Scholar] [CrossRef]
- Jiang, Z.; Kang, S.H.; Cheong, C.; Yoon, S.-M. The effects of extreme weather conditions on Hong Kong and Shenzhen stock market returns. Int. J. Financ. Stud. 2019, 7, 70. [Google Scholar] [CrossRef] [Green Version]
- Pan, W.-F. Does investor sentiment drive stock market bubbles? Beware of excessive optimism! J. Behav. Financ. 2020, 21, 27–41. [Google Scholar] [CrossRef]
- Choi, K.-H.; Yoon, S.-M. Investor sentiment and herding behavior in the Korean stock market. Int. J. Financ. Stud. 2020, 8, 34. [Google Scholar] [CrossRef]
- Jiang, Z.; Gupta, R.; Subramaniam, S.; Yoon, S.-M. The effect of air quality and weather on the Chinese stock: Evidence from Shenzhen Stock Exchange. Sustainability 2021, 13, 2931. [Google Scholar] [CrossRef]
- Bahloul, W.; Bouri, A. The impact of investor sentiment on returns and conditional volatility in U.S. futures markets. J. Multinatl. Financ. Manag. 2016, 36, 89–102. [Google Scholar] [CrossRef]
- Eom, C.; Kaizoji, T.; Kang, S.H.; Pichl, L. Bitcoin and investor sentiment: Statistical characteristics and predictability. Phys. A 2019, 514, 511–521. [Google Scholar] [CrossRef]
- Balcilar, M.; Bonato, M.; Demirer, R.; Gupta, R. The effect of investor sentiment on gold market return dynamics: Evidence from a nonparametric causality-in-quantiles approach. Resour. Policy 2017, 51, 77–84. [Google Scholar] [CrossRef]
- Białowolski, P. Economic sentiment as a driver for household financial behavior. J. Behav. Exp. Econ. 2019, 80, 59–66. [Google Scholar] [CrossRef]
- Ludvigson, S.C. Consumer confidence and consumer spending. J. Econ. Perspect. 2004, 18, 29–50. [Google Scholar] [CrossRef] [Green Version]
- Mehra, Y.P.; Martin, E.W. Why does consumer sentiment predict household spending? Econ. Q. 2003, 89, 51–67. [Google Scholar]
- Vuchelen, J. Consumer sentiment and macroeconomic forecasts. J. Econ. Psychol. 2004, 25, 493–506. [Google Scholar] [CrossRef]
- Aromi, J.D.; Clements, A. Facial expressions and the business cycle. Econ. Model. 2021, 102, 105563. [Google Scholar] [CrossRef]
- Claveria, O.; Monte, E.; Torra, S. Economic forecasting with evolved confidence indicators. Econ. Model. 2020, 93, 576–585. [Google Scholar] [CrossRef]
- Guo, Y.; He, S. Does confidence matter for economic growth? An analysis from the perspective of policy effectiveness. Int. Rev. Econ. Financ. 2020, 69, 1–19. [Google Scholar] [CrossRef]
- Kotz, M.; Wenz, L.; Stechemesser, A.; Kalkuhl, M.; Levermann, A. Day-to-day temperature variability reduces economic growth. Nat. Clim. Chang. 2021, 11, 319–325. [Google Scholar] [CrossRef]
- Kanas, A.; Zervopoulos, P.D. Systemic risk, real GDP growth, and sentiment. Rev. Quant. Financ. Account. 2021, 57, 461–485. [Google Scholar] [CrossRef]
- Niţoi, M.; Pochea, M.M. Time-varying dependence in European equity markets: A contagion and investor sentiment driven analysis. Econ. Model. 2020, 86, 133–147. [Google Scholar] [CrossRef]
- Qi, X.-Z.; Ning, Z.; Qin, M. Economic policy uncertainty, investor sentiment and financial stability—an empirical study based on the time varying parameter-vector autoregression model. J. Econ. Interact. Coord. 2022, 17, 779–799. [Google Scholar] [CrossRef]
- Dragouni, M.; Filis, G.; Gavriilidis, K.; Santamaria, D. Sentiment, mood and outbound tourism demand. Ann. Tour. Res. 2016, 60, 80–96. [Google Scholar] [CrossRef]
- Baker, S.R.; Blooms, N.; Davis, S.J. Measuring economic policy uncertainty. Q. J. Econ. 2016, 131, 1593–1636. [Google Scholar] [CrossRef]
- Davis, S.J. An Index of Global Economic Policy Uncertainty; NBER: Cambridge, MA, USA, 2016. [Google Scholar]
- Alexopoulos, M.; Cohen, J. The power of print: Uncertainty shocks, markets, and the economy. Int. Rev. Econ. Financ. 2015, 40, 8–28. [Google Scholar] [CrossRef]
- Adebayo, T.S.; Saint Akadiri, S.; Rjoub, H. On the relationship between economic policy uncertainty, geopolitical risk and stock market returns in South Korea: A quantile causality analysis. Ann. Financ. Econ. 2022, 17, 2250008. [Google Scholar] [CrossRef]
- Das, D.; Kannadhasan, M.; Bhattacharyya, M. Do the emerging stock markets react to international economic policy uncertainty, geopolitical risk and financial stress alike? N. Am. J. Econ. Financ. 2019, 48, 1–19. [Google Scholar] [CrossRef]
- Fang, L.; Chen, B.; Yu, H.; Xiong, C. The effect of economic policy uncertainty on the long-run correlation between crude oil and the U.S. stock markets. Financ. Res. Lett. 2018, 24, 56–63. [Google Scholar] [CrossRef]
- Ftiti, Z.; Hadhri, S. Can economic policy uncertainty, oil prices, and investor sentiment predict Islamic stock returns? A multi-scale perspective. Pac.-Basin Financ. J. 2019, 53, 40–55. [Google Scholar] [CrossRef]
- Karnizova, L.; Li, J. Economic policy uncertainty, financial markets and probability of US recessions. Econ. Lett. 2014, 125, 261–265. [Google Scholar] [CrossRef] [Green Version]
- Kido, Y. The transmission of US economic policy uncertainty shocks to Asian and global financial markets. N. Am. J. Econ. Financ. 2018, 46, 222–231. [Google Scholar] [CrossRef]
- Ko, J.-H.; Lee, C.-M. International economic policy uncertainty and stock prices: Wavelet approach. Econ. Lett. 2015, 134, 118–122. [Google Scholar] [CrossRef]
- Li, X.-M. New evidence on economic policy uncertainty and equity premium. Pac.-Basin Financ. J. 2017, 46, 41–56. [Google Scholar] [CrossRef]
- Li, X.; Balcilar, M.; Gupta, R.; Chang, T. The causal relationship between economic policy uncertainty and stock returns in China and India: Evidence from a bootstrap rolling window approach. Emerg. Mark. Financ. Trade 2016, 52, 674–689. [Google Scholar] [CrossRef] [Green Version]
- Liow, K.H.; Liao, W.-C.; Huang, Y. Dynamics of international spillovers and interaction: Evidence from financial market stress and economic policy uncertainty. Econ. Model. 2018, 68, 96–116. [Google Scholar] [CrossRef]
- Liu, L.; Zhang, T. Economic policy uncertainty and stock market volatility. Financ. Res. Lett. 2015, 15, 99–105. [Google Scholar] [CrossRef] [Green Version]
- Raza, S.A.; Zaighum, I.; Shah, N. Economic policy uncertainty, equity premium and dependence between their quantiles: Evidence from quantile-on-quantile approach. Phys. A 2018, 492, 2079–2091. [Google Scholar] [CrossRef]
- Gong, Y.; He, Z.; Xue, W. EPU spillovers and stock return predictability: A cross-country study. J. Int. Financ. Mark. Inst. Money 2022, 78, 101556. [Google Scholar] [CrossRef]
- Demir, E.; Gozgor, G.; Lau, C.K.M.; Vigne, S.A. Does economic policy uncertainty predict the Bitcoin returns? An empirical investigation. Financ. Res. Lett. 2018, 26, 145–149. [Google Scholar] [CrossRef] [Green Version]
- Mokni, K. When, where, and how economic policy uncertainty predicts Bitcoin returns and volatility? A quantiles-based analysis. Q. Rev. Econ. Financ. 2021, 80, 65–73. [Google Scholar] [CrossRef]
- Choi, S.; Shin, J. Bitcoin: An inflation hedge but not a safe haven. Financ. Res. Lett. 2022, 46, 102379. [Google Scholar] [CrossRef]
- Antonakakis, N.; Chatziantoniou, I.; Filis, G. Dynamic spillovers of oil price shocks and economic policy uncertainty. Energy Econ. 2014, 44, 433–447. [Google Scholar] [CrossRef] [Green Version]
- Yang, L. Connectedness of economic policy uncertainty and oil price shocks in a time domain perspective. Energy Econ. 2019, 80, 219–233. [Google Scholar] [CrossRef]
- You, W.; Guo, Y.; Zhu, H.; Tang, Y. Oil price shocks, economic policy uncertainty and industry stock returns in China: Asymmetric effects with quantile regression. Energy Econ. 2017, 68, 1–18. [Google Scholar] [CrossRef]
- Yuan, D.; Li, S.; Li, R.; Zhang, F. Economic policy uncertainty, oil and stock markets in BRIC: Evidence from quantiles analysis. Energy Econ. 2022, 110, 105972. [Google Scholar] [CrossRef]
- Raza, S.A.; Shah, N.; Shahbaz, M. Does economic policy uncertainty influence gold prices? Evidence from a nonparametric causality-in-quantiles approach. Resour. Policy 2018, 57, 61–68. [Google Scholar] [CrossRef]
- Chiang, T.C. The effects of economic uncertainty, geopolitical risk and pandemic upheaval on gold prices. Resour. Policy 2022, 76, 102546. [Google Scholar] [CrossRef]
- Shahzad, S.J.H.; Raza, N.; Balcilar, M.; Ali, S.; Shahbaz, M. Can economic policy uncertainty and investors sentiment predict commodities returns and volatility? Resour. Policy 2017, 53, 208–218. [Google Scholar] [CrossRef]
- Wang, Y.; Zhang, B.; Diao, X.; Wu, C. Commodity price changes and the predictability of economic policy uncertainty. Econ. Lett. 2015, 127, 39–42. [Google Scholar] [CrossRef]
- Antonakakis, N.; Gupta, R.; André, C. Dynamic co-movements between economic policy uncertainty and housing market returns. J. Real Estate Portf. Manag. 2015, 21, 53–60. [Google Scholar] [CrossRef]
- Yang, Y.; Chen, L. Is real estate considered a safe asset in East Asia? Appl. Econ. Lett. 2022, 29, 604–614. [Google Scholar] [CrossRef]
- Balcilar, M.; Gupta, R.; Kyei, C.; Wohar, M.E. Does economic policy uncertainty predict exchange rate returns and volatility? Evidence from a nonparametric causality-in-quantiles test. Open Econ. Rev. 2016, 27, 229–250. [Google Scholar] [CrossRef] [Green Version]
- Kido, Y. On the link between the US economic policy uncertainty and exchange rates. Econ. Lett. 2016, 144, 49–52. [Google Scholar] [CrossRef]
- Bernal, O.; Gnabo, J.-Y.; Guilmin, G. Economic policy uncertainty and risk spillovers in the Eurozone. J. Int. Money Financ. 2016, 65, 24–45. [Google Scholar] [CrossRef]
- Li, X.-M.; Zhang, B.; Gao, R. Economic policy uncertainty shocks and stock–bond correlations: Evidence from the US market. Econ. Lett. 2015, 132, 91–96. [Google Scholar] [CrossRef]
- Bordo, M.D.; Duca, J.V.; Koch, C. Economic policy uncertainty and the credit channel: Aggregate and bank level U.S. evidence over several decades. J. Financ. Stab. 2016, 26, 90–106. [Google Scholar] [CrossRef] [Green Version]
- Danisman, G.O.; Demir, E.; Ozili, P. Loan loss provisioning of US banks: Economic policy uncertainty and discretionary behavior. Int. Rev. Econ. Financ. 2021, 71, 923–935. [Google Scholar] [CrossRef]
- Biljanovska, N.; Grigoli, F.; Hengge, M. Fear thy Neighbor: Spillovers from Economic Policy Uncertainty; Working Paper No. 17/240; IMF: Washington, DC, USA, 2017. [Google Scholar]
- Wang, Y.; Chen, C.R.; Huang, Y.S. Economic policy uncertainty and corporate investment: Evidence from China. Pac. Basin Financ. J. 2014, 26, 227–243. [Google Scholar] [CrossRef]
- Balcilar, M.; Gupta, R.; Jooste, C. Long memory, economic policy uncertainty and forecasting US inflation: A Bayesian VARFIMA approach. Appl. Econ. 2017, 49, 1047–1054. [Google Scholar] [CrossRef]
- Caggiano, G.; Castelnuovo, E.; Figueres, J.M. Economic policy uncertainty spillovers in booms and busts. In Proceedings of the 2017 Annual Meeting, Chicago, IL, USA, 6–8 January 2017. [Google Scholar]
- Colombo, V. Economic policy uncertainty in the US: Does it matter for the Euro area? Econ. Lett. 2013, 121, 39–42. [Google Scholar] [CrossRef] [Green Version]
- Istiak, K.; Serletis, A. Economic policy uncertainty and real output: Evidence from the G7 countries. Appl. Econ. 2018, 50, 4222–4233. [Google Scholar] [CrossRef]
- Trung, N.B. The spillover effects of US economic policy uncertainty on the global economy: A global VAR approach. N. Am. J. Econ. Financ. 2019, 48, 90–110. [Google Scholar] [CrossRef]
- Houari, O. Uncertainty shocks and business cycles in the US: New insights from the last three decades. Econ. Model. 2022, 109, 105762. [Google Scholar] [CrossRef]
- Gozgor, G.; Ongan, S. Economic policy uncertainty and tourism demand: Empirical evidence from the USA. Int. J. Tour. Res. 2017, 19, 99–106. [Google Scholar] [CrossRef]
- Balli, F.; Uddin, G.S.; Mudassar, H.; Yoon, S.-M. Cross-country determinants of economic policy uncertainty spillovers. Econ. Lett. 2017, 156, 179–183. [Google Scholar] [CrossRef]
- Luk, P.; Cheng, M.; Ng, P.; Wong, K. Economic policy uncertainty spillovers in small open economies: The case of Hong Kong. Pac. Econ. Rev. 2020, 25, 21–46. [Google Scholar] [CrossRef]
- Diebold, F.X.; Yilmaz, K. Financial and Macroeconomic Connectedness: A Network Approach to Measurement and Monitoring; Oxford University Press: Oxford, NY, USA, 2015. [Google Scholar]
Publisher’s Note: MDPI stays neutral with regard to jurisdictional claims in published maps and institutional affiliations. |
© 2022 by the authors. Licensee MDPI, Basel, Switzerland. This article is an open access article distributed under the terms and conditions of the Creative Commons Attribution (CC BY) license (https://creativecommons.org/licenses/by/4.0/).

