
A Heterogeneous Information-Based Multi-Attribute Decision Making Framework for Teaching Model Evaluation in Economic Statistics


Abstract
:1. Introduction
2. Literature Review
- (1)
- As an interdisciplinary and borderline major, statistical teaching has its own uniqueness [23,24]. On the one hand, it should not only be based on the teaching of knowledge theory but also pay attention to the training of practical skills. On the other hand, we should pay attention not only to the progress of the teaching process but also to the acquisition of teaching results. Therefore, the evaluation of the teaching model of economic statistics should not be solely guided by the classroom teaching effect or practical operation ability but should also be fully integrated into the evaluation process. However, the existing methods generally lack thinking about the nature and characteristics of different majors. In particular, the understanding and embodiment of the characteristics of the statistics specialty are insufficient, so it is difficult to directly evaluate the teaching model of economic statistics.
- (2)
- The teaching model of economic statistics presents the characteristics of multidimensiond, systematicness, and complexity [25,26]. In regard to the content, it involves the whole process of teaching, from theoretical knowledge to practical skills. With regard to form, it involves all-round cultivation from classroom teaching to post guidance. On the subject, it involves the diverse roles of teachers, students, and employers. Therefore, in the evaluation, the above multiple dimensions should be considered comprehensively to construct the indicator system. At the same time, the system includes objective facts, subjective feelings, and expected conditions with different properties, different sources, and even different forms of diversified attributes. In addition, especially in the face of subjective feelings, expected conditions, and other types of attributes, evaluators often have difficulty directly providing accurate evaluation information and even appear in the special situation of hesitation between several options or scores. The evaluation information in existing methods appears mainly in the single form of qualitative data or real numbers, which cannot meet the needs of diversified information collection in the evaluation of statistical teaching models and can adversely affect the effectiveness of the evaluation results.
- (3)
- As a kind of peer evaluation, the educators usually participate in the process of teaching model evaluation. Due to differences in professional background, knowledge level, qualifications, and work experience among different DMs, different members should not be treated equally in the evaluation process. Especially when there are opinion leaders or industry authorities among the DMs, the opinions of other members will be influenced to some extent by such members. At this point, if the method of equal authority is adopted, part of the authoritative information will be covered up, while the method of empowerment by the organizer is difficult to objectively grasp the relative relationship between DMs. Therefore, how determining the weight of DMs is important for the peer evaluation of teaching model evaluation.
- (4)
- The weight determination method of attributes is single, and the persuasiveness and stability of the evaluation results need to be improved. The weight structure has different effects on the evaluation results of the teaching model. In the existing methods, the weight of evaluation attributes is simply determined by the subjective weight method (such as the analytic hierarchy process and Delphi method) or objective weight methods (such as the entropy weight method and data envelopment analysis method) [11,27]. However, these two methods have shortcomings in the evaluation of teaching models: the subjective weighting method mainly relies on experts to judge the importance of attributes, but experts do not consider their actual value in this process, so it is difficult to reflect the real information of evaluation attribute [28]. At the same time, the teaching model evaluation results in too many subjective factors and lacks convincing results. The objective weighting method judges the importance of attributes according to their actual value, and the weight structure changes with the values of an attribute, so it is not stable enough when evaluating the teaching model.
3. Materials and Methods
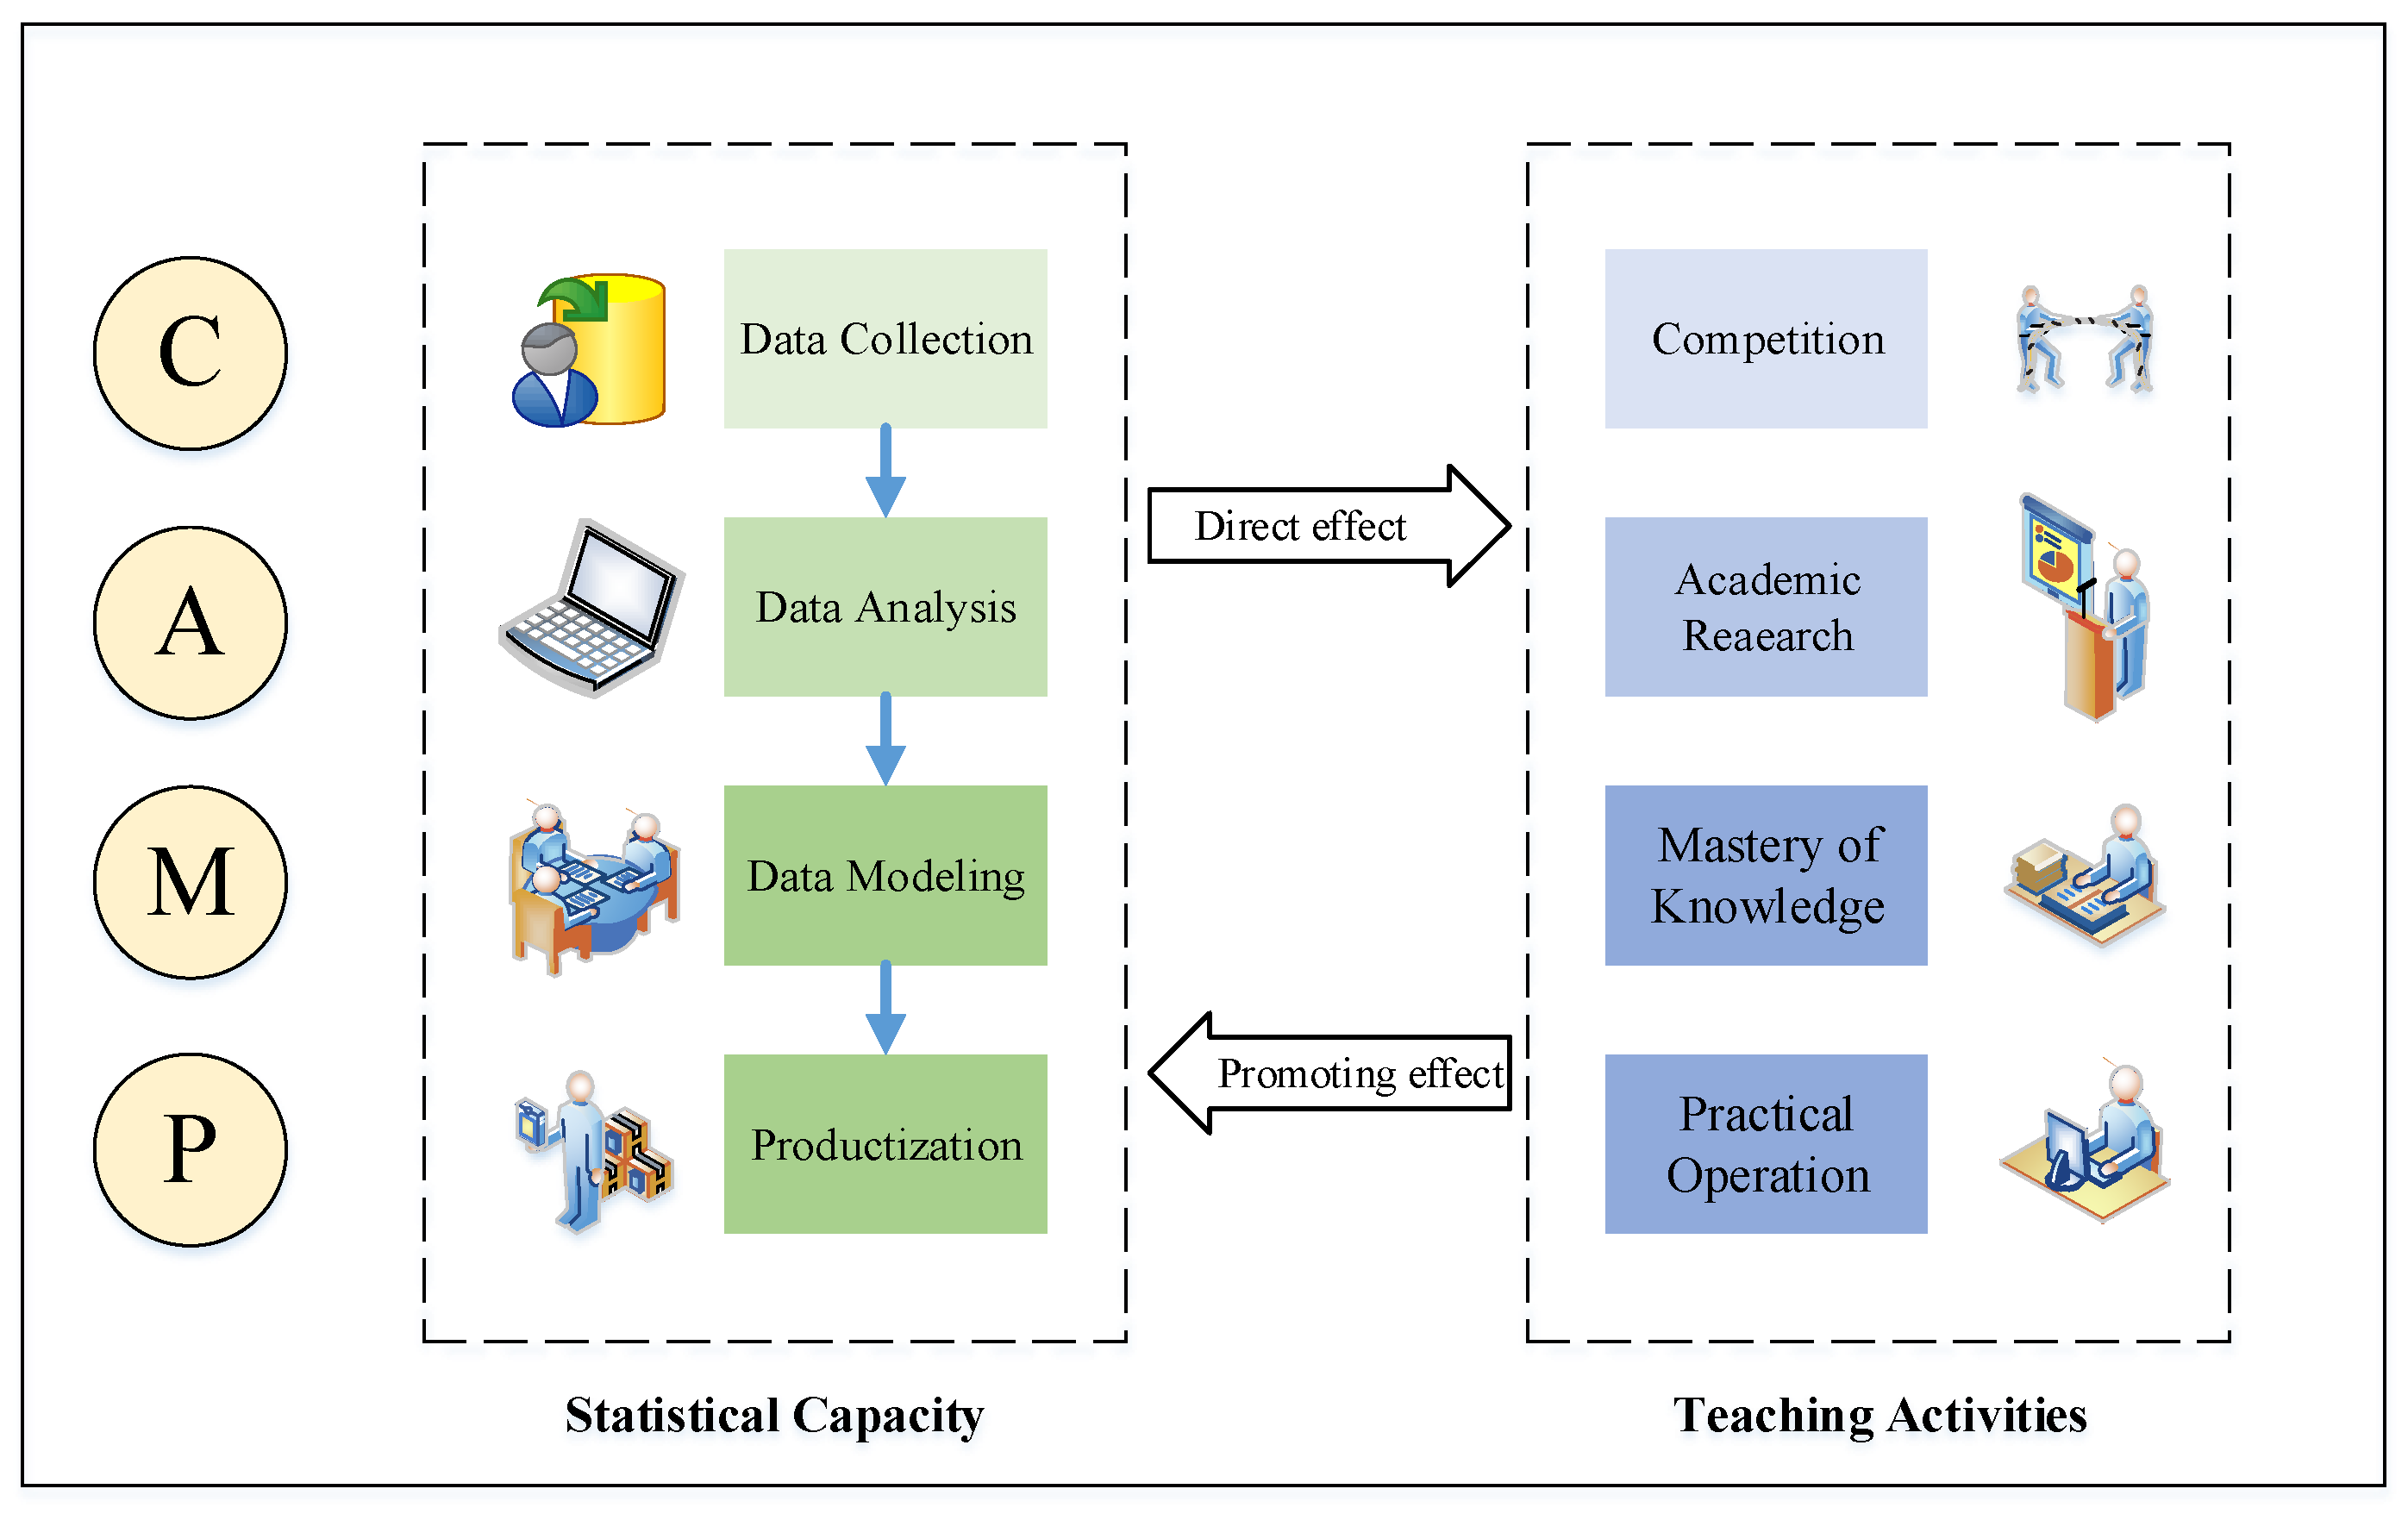
3.1. Multi-Attribute System of CAMP
- (1)
- Competition
- (2)
- Academic Research
- (3)
- Master of Knowledge
- (4)
- Practical operation
3.2. Related Concepts of Heterogeneous Information
- (1)
- Interval Number
- (2)
- Real Number
- (3)
- Linguistic Number
- (4)
- Intuitionistic Fuzzy Number
3.3. Conversion Methods of Heterogeneous Information
- (1)
- Conversion between interval number and intuitionistic fuzzy number
- (2)
- Conversion between real numbers and intuitionistic fuzzy numbers
- (3)
- Conversion between linguistic numbers and intuitionistic fuzzy numbers
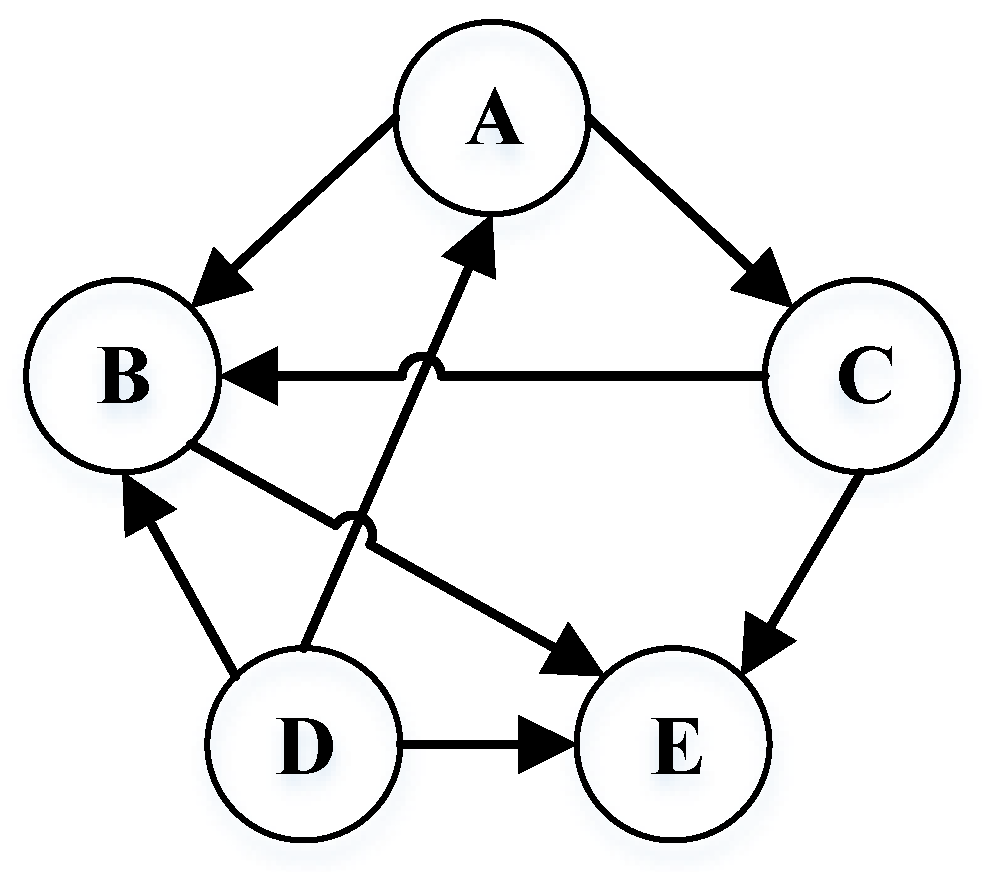
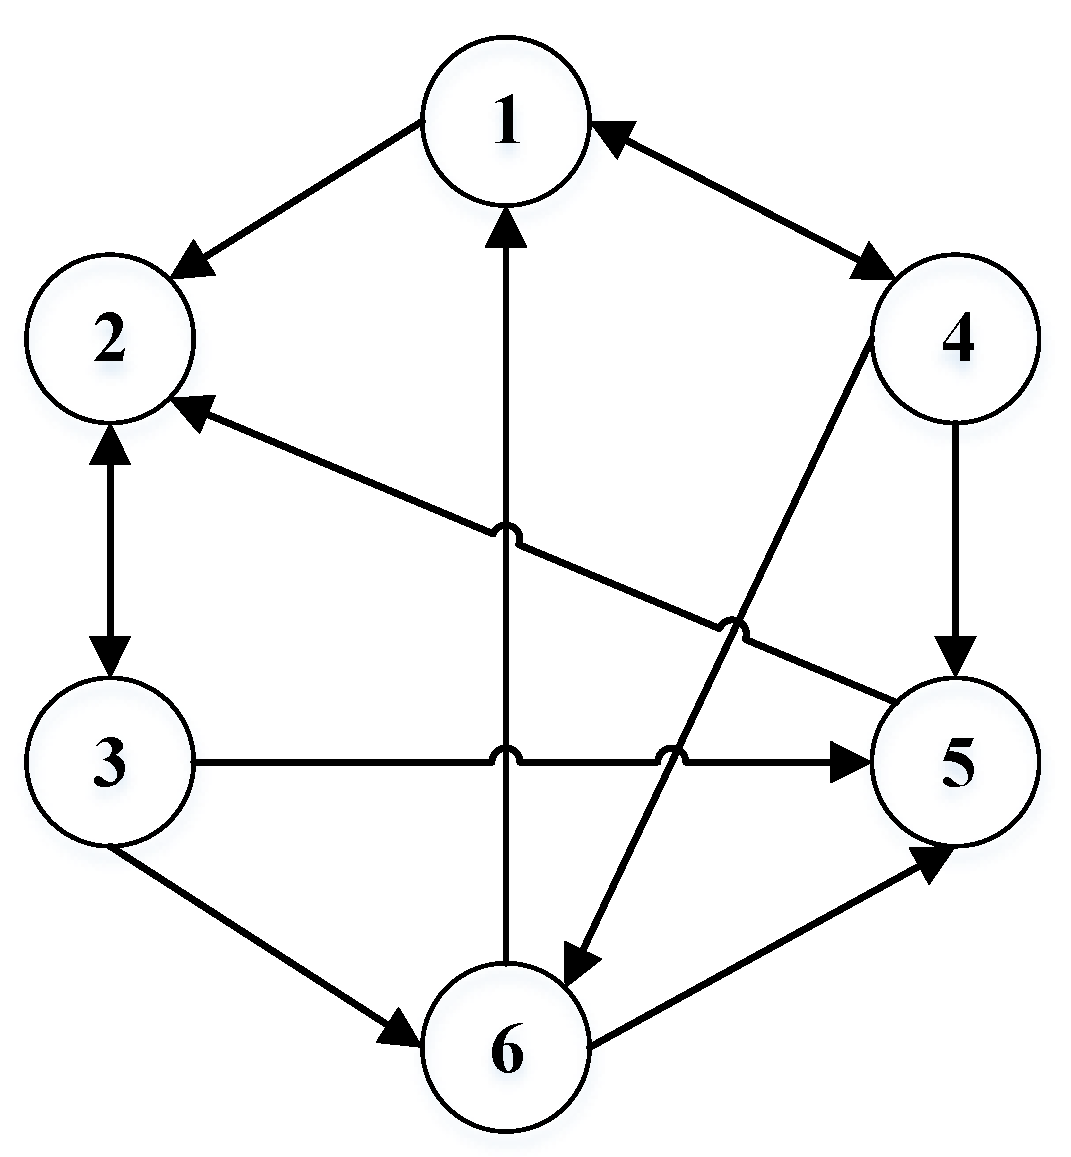
3.4. Fuzzy–Social Network
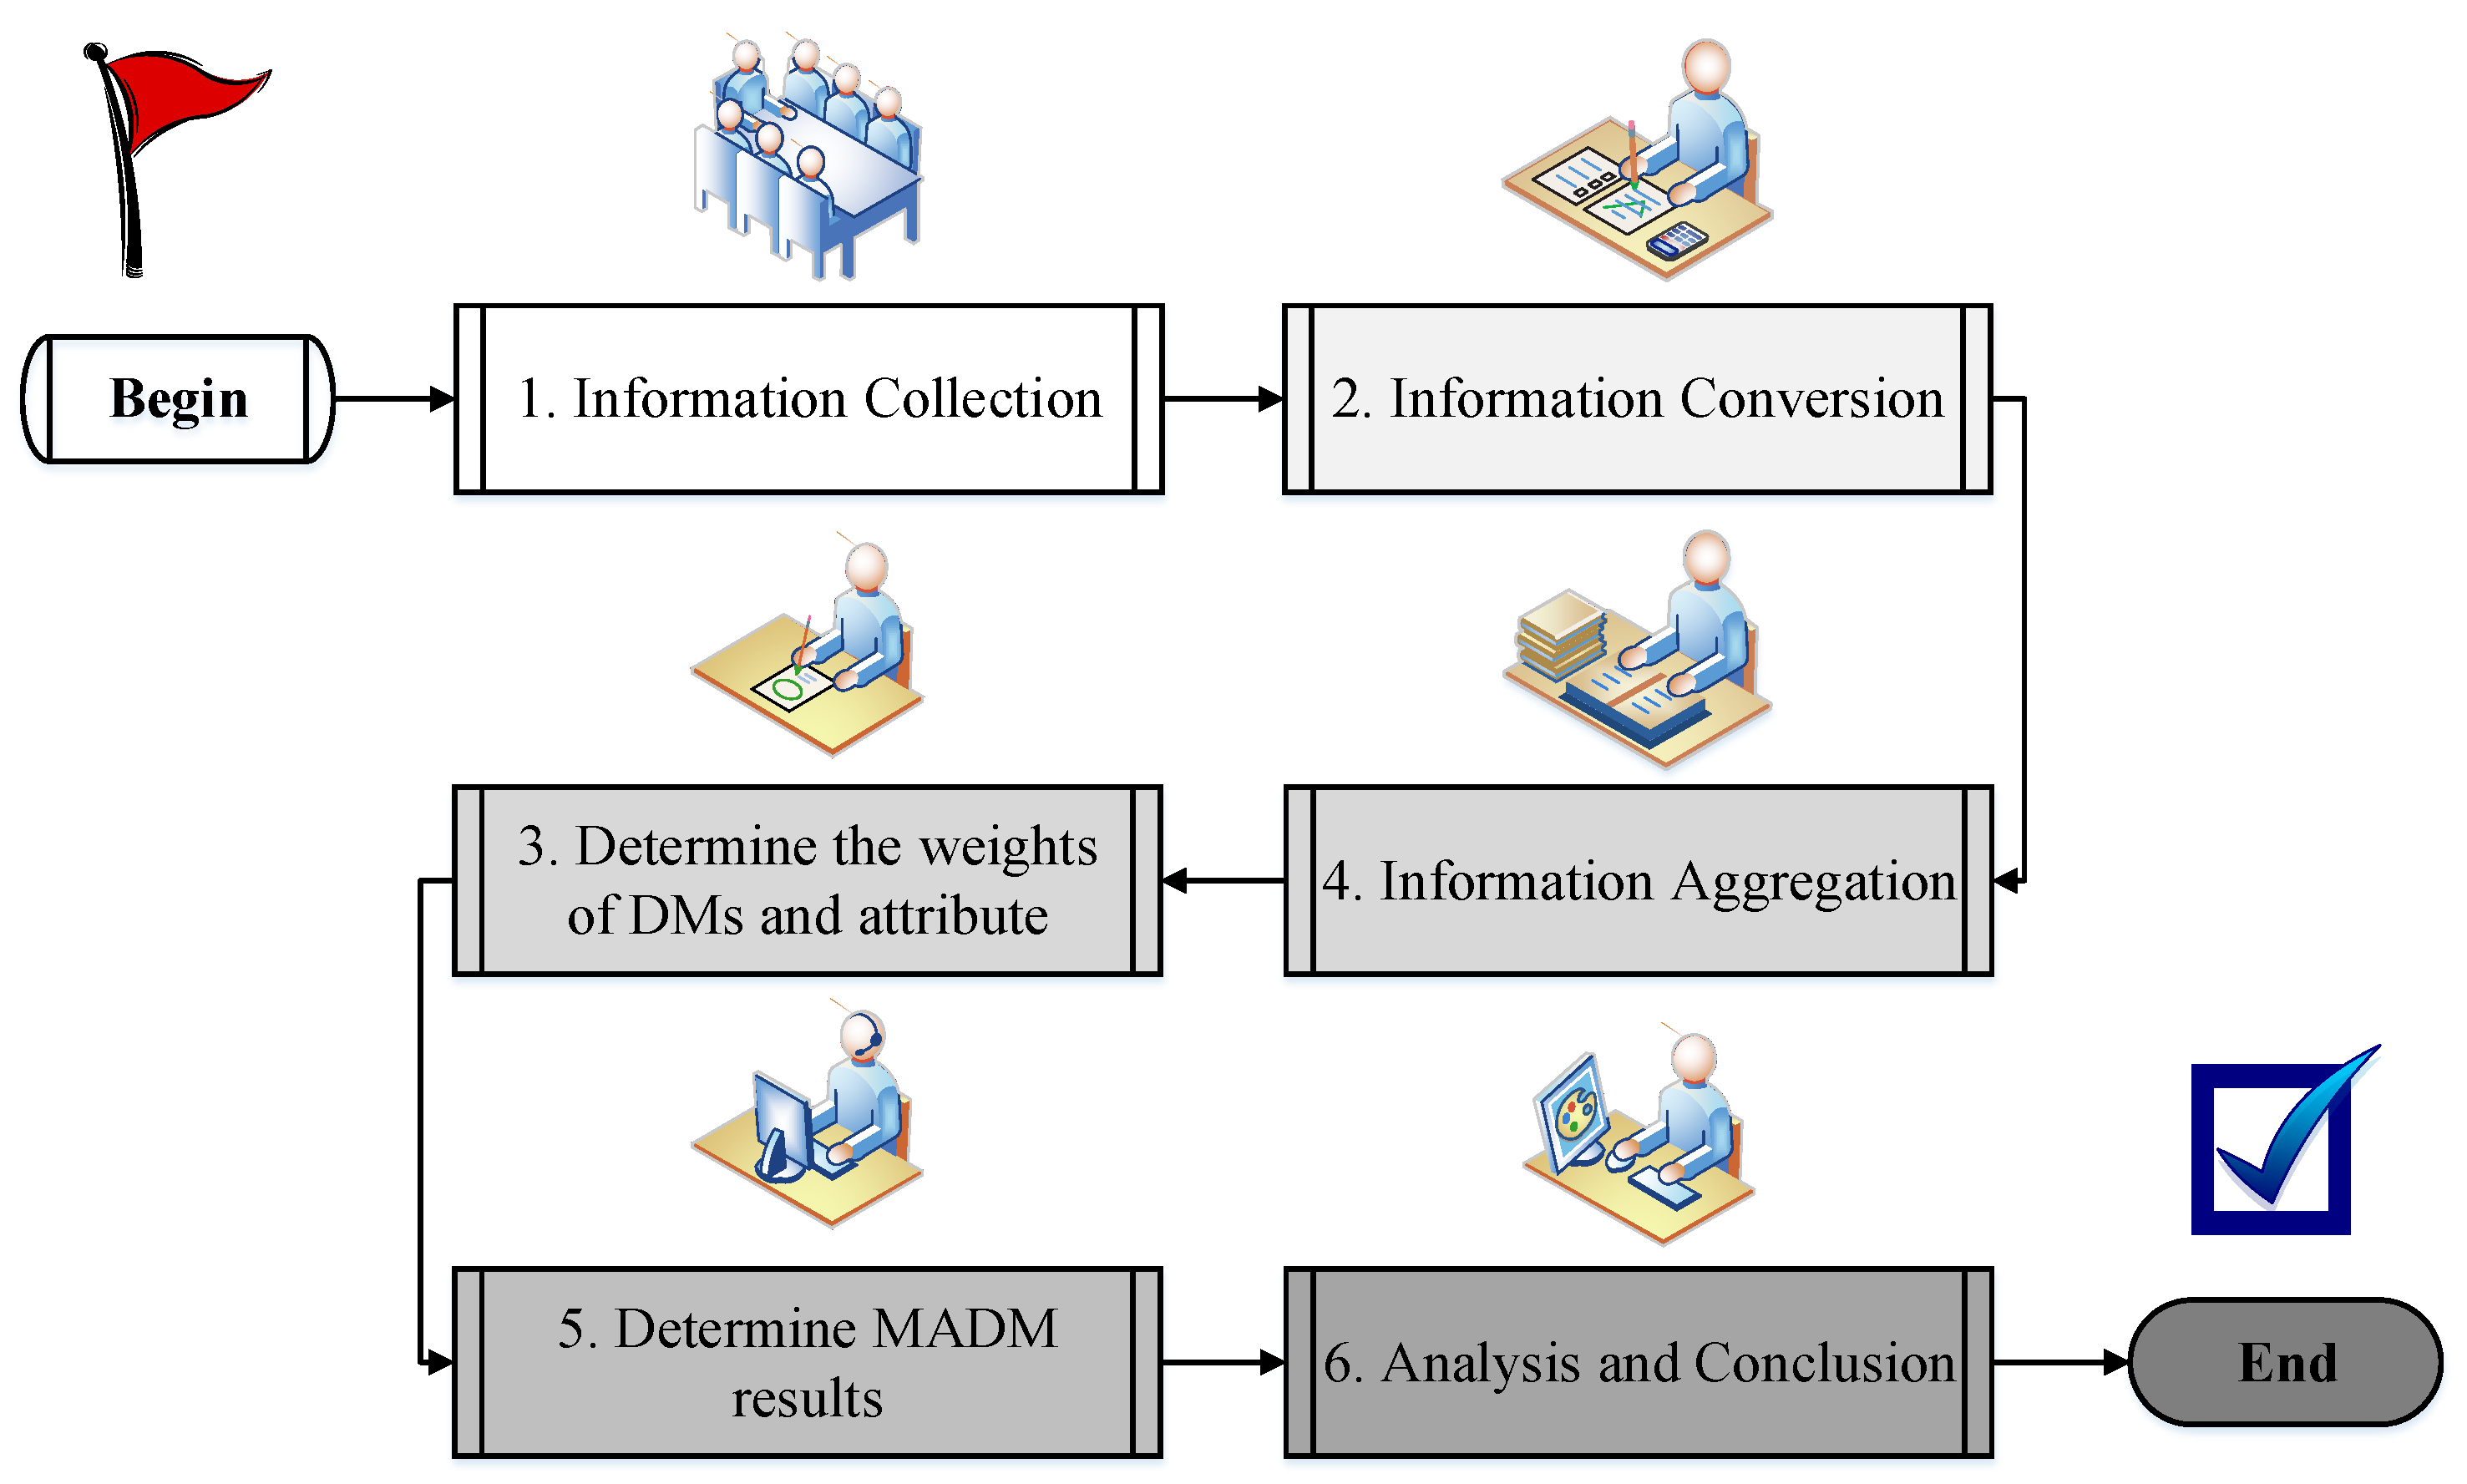
4. A Heterogeneous Information-Based MADM Framework
4.1. Fuzzy–Social Network for Determining DMs’ Weights
- (1)
- Compute the degree centrality of DMj.
- (2)
- Obtain the degree of trust .
- (3)
- Compute the total degree of trust .where, m refers to the number of DMs in the social network.
- (4)
- Determining the weights of DMs.
4.2. Entropy–AHP Method for Determining Attribute Weights
- (1)
- Determine the objective weight of attribute
- (2)
- Determine the subjective weight of attribute
- (3)
- Determine the combined weights of attribute
4.3. Aggregation Operator and Score Function of Heterogeneous Information
4.4. MADM Framework for Statistical Teaching Model Evaluation
5. Case Study: Evaluation of Teaching Models in Economic Statistics
5.1. Backgrounds of Teaching Models
- (1)
- CDIO teaching model
- (2)
- OBE teaching model
- (3)
- Flipped Classroom teaching model
- (4)
- Blended teaching model
5.2. The Processes of Evaluation
5.3. Results
5.4. Comparison and Analysis
6. Policy Implications
7. Conclusions
Author Contributions
Funding
Institutional Review Board Statement
Informed Consent Statement
Data Availability Statement
Conflicts of Interest
Appendix A

| 1 | 2 | 3 | 4 | 5 | 6 | |
|---|---|---|---|---|---|---|
| C1 | (0.9000, 0.1000) | (0.7500, 0.2000) | (0.7500, 0.2000) | (0.5000, 0.4500) | (0.7500, 0.2000) | (0.9000, 0.1000) |
| C2 | (0.5000, 0.5000) | (0.3000, 0.7000) | (0.4000, 0.6000) | (0.3000, 0.7000) | (0.5000, 0.5000) | (0.4000, 0.6000) |
| C3 | (0.7500, 0.2000) | (0.9000, 0.1000) | (0.9000, 0.1000) | (0.7500, 0.2000) | (0.7500, 0.2000) | (0.9000, 0.1000) |
| C4 | (0.3779, 0.6220) | (0.5039, 0.4960) | (0.3779, 0.6220) | (0.2519, 0.7480) | (0.3779, 0.6220) | (0.5039, 0.4960) |
| C5 | (0.3131, 0.3479) | (0.2435, 0.2784) | (0.2784, 0.3131) | (0.1740, 0.2088) | (0.3131, 0.3479) | (0.2784, 0.3131) |
| C6 | (0.2914, 0.3238) | (0.2590, 0.2914) | (0.2914, 0.3238) | (0.1943, 0.2266) | (0.2914, 0.3238) | (0.2914, 0.3238) |
| C7 | (0.6000, 0.2000) | (0.9000, 0.1000) | (0.7000, 0.3000) | (0.8000, 0.9000) | (0.9000, 0.2000) | (0.8000, 0.1000) |
| C8 | (0.8000, 0.3000) | (0.9000, 0.0500) | (0.4000, 0.5000) | (0.5000, 0.6000) | (0.8000, 0.3000) | (0.8000, 0.2000) |
| 1 | 2 | 3 | 4 | 5 | 6 | |
|---|---|---|---|---|---|---|
| C1 | (0.5000, 0.4500) | (0.5000, 0.4500) | (0.7500, 0.2000) | (0.5000, 0.4500) | (0.5000, 0.4500) | (0.7500, 0.2000) |
| C2 | (0.3430, 0.6570) | (0.5145, 0.4855) | (0.3430, 0.6570) | (0.5145, 0.4855) | (0.3430, 0.6570) | (0.3430, 0.6570) |
| C3 | (0.7500, 0.2000) | (0.5000, 0.4500) | (0.9000, 0.1000) | (0.5000, 0.4500) | (0.5000, 0.4500) | (0.7500, 0.2000) |
| C4 | (0.2949, 0.7051) | (0.4423, 0.5577) | (0.5898, 0.4102) | (0.2949, 0.7051) | (0.4423, 0.5577) | (0.2949, 0.7051) |
| C5 | (0.2721, 0.3109) | (0.2332, 0.2721) | (0.1943, 0.2332) | (0.3109, 0.3498) | (0.2721, 0.3109) | (0.3109, 0.3498) |
| C6 | (0.2789, 0.3187) | (0.1992, 0.2391) | (0.2789, 0.3187) | (0.2391, 0.2789) | (0.3187, 0.3586) | (0.2789, 0.3187) |
| C7 | (0.7000, 0.2000) | (0.8000, 0.2000) | (0.5000, 0.4000) | (0.6000, 0.3000) | (0.8000, 0.1000) | (0.8000, 0.2000) |
| C8 | (0.6000, 0.3000) | (0.7000, 0.1000) | (0.5000, 0.3000) | (0.4000, 0.5000) | (0.6000, 0.4000) | (0.6000, 0.3000) |
| 1 | 2 | 3 | 4 | 5 | 6 | |
|---|---|---|---|---|---|---|
| C1 | (0.7500, 0.2000) | (0.5000, 0.4500) | (0.5000, 0.4500) | (0.3500, 0.6000) | (0.5000, 0.4500) | (0.5000, 0.4500) |
| C2 | (0.5883, 0.4117) | (0.3922, 0.6078) | (0.3922, 0.6078) | (0.1961, 0.8039) | (0.3922, 0.6078) | (0.3922, 0.6078) |
| C3 | (0.5000, 0.4500) | (0.7500, 0.2000) | (0.9000, 0.1000) | (0.5000, 0.4500) | (0.7500, 0.2000) | (0.7500, 0.2000) |
| C4 | (0.3779, 0.6220) | (0.3779, 0.6220) | (0.5039, 0.4960) | (0.2520, 0.7480) | (0.3779, 0.6220) | (0.5039, 0.4960) |
| C5 | (0.2346, 0.2737) | (0.2737, 0.3128) | (0.2346, 0.2737) | (0.2737, 0.3128) | (0.3128, 0.3519) | (0.2737, 0.3128) |
| C6 | (0.2045, 0.2454) | (0.2454, 0.2863) | (0.2863, 0.3271) | (0.2863, 0.3271) | (0.2863, 0.3271) | (0.2863, 0.3271) |
| C7 | (0.6000, 0.4000) | (0.7000, 0.3000) | (0.7000, 0.2000) | (0.7000, 0.3000) | (0.9000, 0.1000) | (0.9000, 0.2000) |
| C8 | (0.6000, 0.3000) | (0.7000, 0.2000) | (0.6000, 0.4000) | (0.5000, 0.4000) | (0.8000, 0.2000) | (0.7000, 0.3000) |
| 1 | 2 | 3 | 4 | 5 | 6 | |
|---|---|---|---|---|---|---|
| C1 | (0.5000, 0.4500) | (0.5000, 0.4500) | (0.5000, 0.4500) | (0.5000, 0.4500) | (0.5000, 0.4500) | (0.5000, 0.4500) |
| C2 | (0.2582, 0.7418) | (0.5164, 0.4836) | (0.5164, 0.4836) | (0.2582, 0.7418) | (0.2582, 0.7418) | (0.5164, 0.4836) |
| C3 | (0.7500, 0.2000) | (0.5000, 0.4500) | (0.5000, 0.4500) | (0.5000, 0.4500) | (0.5000, 0.4500) | (0.7500, 0.2000) |
| C4 | (0.5669, 0.4331) | (0.3779, 0.6220) | (0.1889, 0.8110) | (0.1889, 0.8110) | (0.3779, 0.6220) | (0.5669, 0.4331) |
| C5 | (0.2005, 0.2506) | (0.2506, 0.3008) | (0.2005, 0.2506) | (0.3008, 0.3509) | (0.3008, 0.3509) | (0.3008, 0.3509) |
| C6 | (0.2368, 0.2841) | (0.2841, 0.3315) | (0.1894, 0.2368) | (0.2368, 0.2841) | (0.3315, 0.3788) | (0.2841, 0.3315) |
| C7 | (0.6000, 0.4000) | (0.6000, 0.2000) | (0.4000, 0.5000) | (0.6000, 0.3000) | (0.7000, 0.3000) | (0.7000, 0.2000) |
| C8 | (0.5000, 0.4000) | (0.5000, 0.3000) | (0.5000, 0.5000) | (0.4000, 0.3000) | (0.6000, 0.4000) | (0.5000, 0.3000) |
References
- Clayson, D. The student evaluation of teaching and likability: What the evaluations actually measure. Assess. Eval. High. Educ. 2022, 47, 313–326. [Google Scholar] [CrossRef]
- Hendriks, R.A.; de Jong, P.G.M.; Admiraal, W.F.; Reinders, M.E.J. Teaching modes and social-epistemological dimensions in medical Massive Open Online Courses: Lessons for integration in campus education. Med. Teach. 2019, 41, 917–926. [Google Scholar] [CrossRef] [PubMed] [Green Version]
- Caird, S.; Lane, A. Conceptualising the role of information and communication technologies in the design of higher education teaching models used in the UK. Br. J. Educ. Technol. 2015, 46, 58–70. [Google Scholar] [CrossRef]
- Oon, P.T.; Spencer, B.; Kam, C.C.S. Psychometric quality of a student evaluation of teaching survey in higher education. Assess. Eval. High. Educ. 2017, 42, 788–800. [Google Scholar] [CrossRef]
- Bruce, J.; Marsha, W.; Emily, C. Model of Teaching; Pearson Education: New York, NY, USA, 2008. [Google Scholar]
- Taajamaa, V.; Eskandari, M.; Karanian, B.; Airola, A.; Pahikkala, T.; Salakoski, T. O-CDIO: Emphasizing design thinking in CDIO engineering cycle. Int. J. Eng. Educ. 2016, 32, 1530–1539. [Google Scholar]
- Mahboob, K.; Ali, S.A.; Laila, U.E. Investigating learning outcomes in engineering education with data mining. Comput. Appl. Eng. Educ. 2020, 28, 1652–1670. [Google Scholar] [CrossRef]
- Limataha, I.; Wasis; Sutoyo, S.; Prahani, B.K. Development of CDSR teaching model to improve science process skills of pre-service physics teachers. J. Balt. Sci. Educ. 2018, 17, 812–827. [Google Scholar] [CrossRef]
- Aherne, M.; Lamble, W.; Davis, P. Continuing medical education, needs assessment, and program development: Theoretical constructs. J. Contin. Educ. Health Prof. 2001, 21, 6–14. [Google Scholar] [CrossRef]
- Tuna, H.; Basdal, M. Curriculum evaluation of tourism undergraduate programs in Turkey: A CIPP model-based framework. J. Hosp. Leis. Sport Tour. Educ. 2021, 29, 100324. [Google Scholar] [CrossRef]
- Tokmak, H.S.; Baturay, H.M.; Fadde, P. Applying the Context, Input, Process, Product Evaluation Model for Evaluation, Research, and Redesign of an Online Master’s Program. Int. Rev. Res. Open Distrib. Learn. 2013, 14, 273–293. [Google Scholar]
- La Rocca, M.; Parrella, M.L.; Primerano, I.; Sulis, I.; Vitale, M.P. An integrated strategy for the analysis of student evaluation of teaching: From descriptive measures to explanatory models. Qual. Quant. 2017, 51, 675–691. [Google Scholar] [CrossRef]
- Alaeddini, M.; Mir-Amini, M. Integrating COBIT with a hybrid group decision-making approach for a business-aligned IT roadmap formulation. Inf. Technol. Manag. 2020, 21, 63–94. [Google Scholar] [CrossRef]
- Wang, P.; Zhang, P.F.; Li, Z.W. A three-way decision method based on Gaussian kernel in a hybrid information system with images: An application in medical diagnosis. Appl. Soft Comput. 2019, 77, 734–749. [Google Scholar] [CrossRef]
- Wolfe, A.W. Social network analysis: Methods and applications. Contemp. Sociol. 1995, 91, 219–220. [Google Scholar] [CrossRef]
- Wu, J.; Chang, J.L.; Cao, Q.W.; Liang, C.Y. A trust propagation and collaborative filtering based method for incomplete information in social network group decision making with type-2 linguistic trust. Comput. Ind. Eng. 2019, 127, 853–864. [Google Scholar] [CrossRef]
- Zeng, S.Z.; Zhang, N.; Zhang, C.H.; Su, W.H.; Carlos, L.A. Social network multiple-criteria decision-making approach for evaluating unmanned ground delivery vehicles under the Pythagorean fuzzy environment. Technol. Forecast. Soc. Change 2022, 175, 121414. [Google Scholar] [CrossRef]
- Su, W.H.; Zhang, L.; Zeng, S.Z.; Jin, H.H. A Fuzzy-Social Network Multi-criteria Group Decision-Making Framework for Selection of Renewable Energy Project: A Case of China. Int. J. Fuzzy Syst. 2021, 24, 1059–1078. [Google Scholar] [CrossRef]
- La Velle, J.M.; Lovato, C.; Stephenson, C.L. Pedagogical considerations for the teaching of evaluation. Eval. Program Plan. 2020, 79, 101786. [Google Scholar] [CrossRef]
- Spooren, P.; Brockx, B.; Mortelmans, D. On the validity of student evaluation of teaching: The state of the art. Rev. Educ. Res. 2013, 83, 598–642. [Google Scholar] [CrossRef] [Green Version]
- Uttl, B.; White, C.A.; Gonzalez, D.W. Meta-analysis of faculty’s teaching effectivess: Student evaluation of teaching ratings and student learning are not related. Stud. Educ. Eval. 2017, 54, 22–42. [Google Scholar] [CrossRef]
- Zhang, C.H.; Jiang, N.Y.; Su, T.T.; Chen, J.; Streimikience, D.; Balezentis, T. Spreading knowledge and technology: Research efficiency at universities based on the three-stage MCDM-NRSDEA method with bootstrapping. Technol. Soc. 2022, 68, 101915. [Google Scholar] [CrossRef]
- Zeng, W.Y.; Xiao, H.Y.; Pang, H.; Zhu, J.P. The Innovations on Educational Reform of Economic Statistics. Stat. Res. 2010, 27, 3–6. [Google Scholar]
- Phelps, A.L.; Szabat, K.A. The Current Landscape of Teaching Analytics to Business Students at Institutions of Higher Education: Who is Teaching What? Am. Stat. 2017, 71, 155–161. [Google Scholar] [CrossRef]
- Franklin, C.; Hartlaub, B.; Peck, R.; Scheaffer, R.; Thiel, D.; Freier, K.T. AP Statistics: Building Bridges Between High School and College Statistics Education. Am. Stat. 2011, 65, 177–182. [Google Scholar] [CrossRef]
- Zeng, S.Z.; Pan, Y.; Jin, H.H. Online Teaching Quality Evaluation of Business Statistics Course Utilizing Fermatean Fuzzy Analytical Hierarchy Process with Aggregation Operator. Systems 2022, 10, 63. [Google Scholar] [CrossRef]
- Sulis, I.; Porcu, M.; Capursi, V. On the Use of Student Evaluation of Teaching: A Longitudinal Analysis Combining Measurement Issues and Implications of the Exercise. Soc. Indic. Res. 2019, 142, 1305–1331. [Google Scholar] [CrossRef]
- Solaiman, B.; Gueriot, D.; Almouahed, S.; Alsahwa, B.; Bosse, E. A New Hybrid Possibilistic-Probabilistic Decision-Making Scheme for Classification. Entropy 2021, 23, 67. [Google Scholar] [CrossRef]
- Luo, L.Q. The development and reform of social-economic statistics education. Educ. Educ. Manag. 2012, 5, 269–275. [Google Scholar]
- Wang, Z.G.; Xu, Z.P. Research on the paths of talents’ training in economic statistics major of colleges and universities. In Proceedings of the 2015 2nd International Conference on Creative Education, London, UK, 27–28 June 2015; Volume 1, pp. 13–16. [Google Scholar]
- Zadeh, L.A. The concept of a linguistic variable and its application to approximate reasoning. Inf. Sci. 1975, 8, 199–249. [Google Scholar] [CrossRef]
- Herrera, F.; Herrera-Viedma, E.; Verdegay, J.L. A model of consensus in group decision making under linguistic assessments. Fuzzy Sets Syst. 1996, 78, 73–87. [Google Scholar] [CrossRef]
- Atanassov, K.T. Intuitionistic fuzzy sets. Fuzzy Sets Syst. 1986, 20, 87–96. [Google Scholar] [CrossRef]
- Szmidt, E.; Kacprzyk, J. Distances between intuitionistic fuzzy sets. Fuzzy Sets Syst. 2000, 114, 505–518. [Google Scholar] [CrossRef]
- Xu, Z.S. Intuitionistic Fuzzy Aggregation Operators. IEEE Trans. Fuzzy Syst. 2013, 15, 1179–1187. [Google Scholar]
- Zhang, C.H.; Hu, Q.Q.; Zeng, S.Z.; Su, W.H. IOWLAD-based MCDM model for the site assessment of a household waste processing plant under a Pythagorean fuzzy environment. Environ. Impact Assess. Rev. 2021, 89, 106579. [Google Scholar] [CrossRef]
- Monroe, T.; Beruvides, M.; Tercero-Gomez, V. Derivation and Application of the Subjective-Objective Probability Relationship from Entropy: The Entropy Decision Risk Model (EDRM). Systems 2020, 8, 46. [Google Scholar] [CrossRef]
- Guo, J. Hybrid Multiattribute Group Decision Making Based on Intuitionistic Fuzzy Information and GRA Method. Isrn Appl. Math. 2013, 2013, 146026. [Google Scholar] [CrossRef]
- Zhang, C.H.; Su, W.H.; Zeng, S.Z.; Balezentis, T.; Herrera-Viedma, E. A Two-stage subgroup Decision-making method for processing Large-scale information. Expert Syst. Appl. 2021, 171, 114586. [Google Scholar] [CrossRef]
- Akram, M.; Peng, X.D.; Sattar, A. A new decision-making model using complex intuitionistic fuzzy Hamacher aggregation operators. Soft Comput. 2021, 25, 7059–7086. [Google Scholar] [CrossRef]
- Muneeza; Abdullah, S. Multicriteria Group Decision-Making for Supplier Selection Based on Intuitionistic Cubic Fuzzy Aggregation Operators. Int. J. Fuzzy Syst. 2020, 22, 810–823. [Google Scholar] [CrossRef]
- Garg, H. Generalized intuitionistic fuzzy interactive geometric interaction operators using Einstein t-norm and t-conorm and their application to decision making. Comput. Ind. Eng. 2016, 101, 53–69. [Google Scholar] [CrossRef]
- Forcael, E.; Garces, G.; Orozco, F. Relationship Between Professional Competencies Required by Engineering Students According to ABET and CDIO and Teaching-Learning Techniques. IEEE Trans. Educ. 2021, 65, 46–55. [Google Scholar] [CrossRef]
- Lin, H.; You, J.; Xu, T. Evaluation of Online Teaching Quality: An Extended Linguistic MAGDM Framework Based on Risk Preferences and Unknown Weight Information. Symmetry 2021, 13, 192. [Google Scholar] [CrossRef]
- Wright, G.W.; Park, S. The effects of flipped classrooms on K-16 students’ science and math achievement: A systematic review. Stud. Sci. Educ. 2022, 58, 95–136. [Google Scholar] [CrossRef]
- Amstelveen, R. Flipped a college mathematics classroom: An action research project. Educ. Inf. Technol. 2019, 24, 1337–1350. [Google Scholar] [CrossRef]
- Hamilton, J.; Tee, S. Blending teaching and learning: A two-way systems approach. High. Educ. Res. Dev. 2013, 32, 748–764. [Google Scholar] [CrossRef]
- Yang, L.Q. Comprehensive evaluation of music course teaching level based on improved multi-attribute fuzzy evaluation model. Int. J. Emerg. Technol. Learn. 2020, 15, 107–121. [Google Scholar] [CrossRef]
- Jeremy, R.B.; Timothy, M.D. Combining Inquiry-Based and Team-Teaching Models to Design a Research-Driven, Cross-Disciplinary Laboratory Course. J. Chem. Educ. 2019, 96, 660–667. [Google Scholar]
- Vallee, A.; Blacher, J.; Cariou, A.; Sorbets, E. Blended Learning Compared to Traditional Learning in Medical Education: Systematic Review and Meta-Analysis. J. Med. Internet Res. 2020, 22, e16504. [Google Scholar] [CrossRef]
- Fouskakis, D.; Petrakos, G.; Vavouras, I. A Bayesian hierarchical model for comparative evaluation teaching quality indicators in higher education. J. Appl. Stat. 2016, 43, 195–211. [Google Scholar] [CrossRef] [Green Version]


| Model | Merits | Demerits | Reference |
|---|---|---|---|
| Tyler model | Integrate social needs into evaluation Strong reference value | The link between teaching process and results is ingroed Overly result-oriented | [9] |
| CIPP | Highly systematic | Lack of value judgment in the results Process are complicated | [10,11] |
| Response evaluation | Strong operability Simple process | Difficult to collect quantitative data | [12,19] |
| SETs | Emphasis on student evaluation | Unstable evaluation information | [20,21] |
| Aspect | Attribute | Form of Data | Reference |
|---|---|---|---|
| Competition | Cultivation of competitive atmosphere | Linguistic number | [23,24] |
| Skills of competition | Real number | [26] | |
| Academic Research | Creation of academic atmosphere | Linguistic number | [24,26] |
| Academic level | Real number | [25,29] | |
| Mastery of knowledge | Understanding of knowledge | Interval number | [26,30] |
| Innovation ability | Interval number | [24,25] | |
| Practical Operation | Ability of practical operation | Intuitionistic fuzzy number | [25] |
| Professional skills | Intuitionistic fuzzy number | [26,29] |
| Linguistic Number | Intuitionistic Fuzzy Number |
|---|---|
| very good | (0.90, 0.10, 0.00) |
| good | (0.75, 0.20, 0.05) |
| medium | (0.50, 0.45, 0.05) |
| bad | (0.35, 0.60, 0.05) |
| very bad | (0.10, 0.90, 0.00) |
| 1 | 2 | 3 | 4 | 5 | 6 | |
|---|---|---|---|---|---|---|
| C1 | very good | good | good | medium | good | very good |
| C2 | 5 | 3 | 4 | 3 | 5 | 4 |
| C3 | good | very good | very good | good | good | very good |
| C4 | 3 | 4 | 3 | 2 | 3 | 4 |
| C5 | [9,10] | [7,8] | [8,9] | [5,6] | [9,10] | [8,9] |
| C6 | [9,10] | [8,9] | [9,10] | [6,7] | [9,10] | [9,10] |
| C7 | (0.6,0.2) | (0.9,0.1) | (0.7,0.3) | (0.8,0.9) | (0.9,0.2) | (0.8,0.1) |
| C8 | (0.8,0.3) | (0.9,0.05) | (0.4,0.5) | (0.5,0.6) | (0.8,0.3) | (0.8,0.2) |
| 1 | 2 | 3 | 4 | 5 | 6 | |
|---|---|---|---|---|---|---|
| C1 | medium | medium | good | medium | medium | good |
| C2 | 2 | 3 | 2 | 3 | 2 | 2 |
| C3 | good | medium | very good | medium | medium | good |
| C4 | 2 | 3 | 4 | 2 | 3 | 2 |
| C5 | [7,8] | [6,7] | [5,6] | [8,9] | [7,8] | [8,9] |
| C6 | [7,8] | [5,6] | [7,8] | [6,7] | [8,9] | [7,8] |
| C7 | (0.7,0.2) | (0.8,0.2) | (0.5,0.4) | (0.6,0.3) | (0.8,0.1) | (0.8,0.2) |
| C8 | (0.6,0.3) | (0.7,0.1) | (0.5,0.3) | (0.4,0.5) | (0.6,0.4) | (0.6,0.3) |
| 1 | 2 | 3 | 4 | 5 | 6 | |
|---|---|---|---|---|---|---|
| C1 | good | medium | medium | bad | medium | medium |
| C2 | 3 | 2 | 2 | 1 | 2 | 2 |
| C3 | medium | good | very good | medium | good | good |
| C4 | 3 | 3 | 4 | 2 | 3 | 4 |
| C5 | [6,7] | [7,8] | [6,7] | [7,8] | [8,9] | [7,8] |
| C6 | [5,6] | [6,7] | [7,8] | [7,8] | [7,8] | [7,8] |
| C7 | (0.6,0.4) | (0.7,0.3) | (0.7,0.2) | (0.7,0.3) | (0.9,0.1) | (0.9,0.2) |
| C8 | (0.6,0.3) | (0.7,0.2) | (0.6,0.4) | (0.5,0.4) | (0.8,0.2) | (0.7,0.3) |
| 1 | 2 | 3 | 4 | 5 | 6 | |
|---|---|---|---|---|---|---|
| C1 | medium | medium | medium | medium | medium | medium |
| C2 | 1 | 2 | 2 | 1 | 1 | 2 |
| C3 | good | medium | medium | medium | medium | good |
| C4 | 3 | 2 | 1 | 1 | 2 | 3 |
| C5 | [4,5] | [5,6] | [4,5] | [6,7] | [6,7] | [6,7] |
| C6 | [5,6] | [6,7] | [4,5] | [5,6] | [7,8] | [6,7] |
| C7 | (0.6,0.4) | (0.6,0.2) | (0.4,0.5) | (0.6,0.3) | (0.7,0.3) | (0.7,0.2) |
| C8 | (0.5,0.4) | (0.5,0.3) | (0.5,0.5) | (0.4,0.3) | (0.6,0.4) | (0.5,0.3) |
| DM 1 | DM 2 | DM 3 | DM 4 | DM 5 | DM 6 | |
|---|---|---|---|---|---|---|
| DM 1 | / | {0.8|0.8, 0.9|0.2} | / | {0.4|0.5, 0.5|0.5} | / | / |
| DM 2 | / | / | {0.5|0.7, 0.6|0.3} | / | / | / |
| DM 3 | / | {0.9|0.6, 1|0.4} | / | / | {0.8|0.3, 0.9|0.7} | {0.6|0.8, 0.7|0.2} |
| DM 4 | {0.6|0.8, 0.7|0.2} | / | / | / | {0.7|0.6, 0.8|0.4} | {0.8|0.7, 0.9|0.3} |
| DM 5 | / | {0.7|0.4, 0.8|0.6} | / | / | / | / |
| DM 6 | {0.7|0.6, 0.8|0.4} | / | / | / | {0.8|0.4, 0.9|0.6} | / |
| DM | 1 | 2 | 3 | 4 | 5 | 6 |
|---|---|---|---|---|---|---|
| Weight | 0.1681 | 0.2072 | 0.1314 | 0.1115 | 0.2037 | 0.1780 |
| (A) | (B) | (C) | (D) | |
|---|---|---|---|---|
| C1 | (0.8033,0.1723) | (0.5965,0.3502) | (0.5417,0.4055) | (0.5000,0.4500) |
| C2 | (0.4111,0.5889) | (0.4034,0.5966) | (0.4127,0.5873) | (0.4053,0.5947) |
| C3 | (0.8443,0.1398) | (0.6816,0.2789) | (0.7309,0.2291) | (0.6066,0.3399) |
| C4 | (0.4179,0.5819) | (0.4043,0.5957) | (0.4079,0.5920) | (0.4146,0.5853) |
| C5 | (0.2736,0.3038) | (0.2660,0.3014) | (0.2705,0.3079) | (0.2616,0.3073) |
| C6 | (0.2745,0.3045) | (0.2671,0.3031) | (0.2647,0.3032) | (0.2694,0.3122) |
| C7 | (0.8217,0.1910) | (0.7391,0.1991) | (0.7929,0.2221) | (0.6219,0.2881) |
| C8 | (0.7783,0.3585) | (0.5939,0.2534) | (0.6812,0.2724) | (0.5124,0.354) |
| C1 | C2 | C3 | C4 |
|---|---|---|---|
| 0.3424 | 0.3383 | 0.2123 | 0.3378 |
| C5 | C6 | C7 | C8 |
| 0.6911 | 0.6904 | 0.1986 | 0.3045 |
| C1 | C2 | C3 | C4 |
|---|---|---|---|
| 0.1353 | 0.1358 | 0.1464 | 0.1358 |
| C5 | C6 | C7 | C8 |
| 0.0801 | 0.0802 | 0.1473 | 0.1391 |
| C1 | C2 | C3 | C4 |
|---|---|---|---|
| 0.0409 | 0.1169 | 0.0902 | 0.0710 |
| C5 | C6 | C7 | C8 |
| 0.1482 | 0.0703 | 0.2243 | 0.2381 |
| C1 | C2 | C3 | C4 |
|---|---|---|---|
| 0.0976 | 0.1282 | 0.1239 | 0.1099 |
| C5 | C6 | C7 | C8 |
| 0.1073 | 0.0763 | 0.1781 | 0.1787 |
| (A) | (B) | (C) | (D) | |
|---|---|---|---|---|
| C1 | 0.6310 (1) | 0.2463 (2) | 0.1362 (3) | 0.0500 (4) |
| C2 | −0.1778 (2) | −0.1932 (4) | −0.1746 (1) | −0.1894 (3) |
| C3 | 0.7045 (1) | 0.4027 (3) | 0.5018 (2) | 0.2667 (4) |
| C4 | −0.1640 (1) | −0.1914 (4) | −0.1841 (3) | −0.1707 (2) |
| C5 | −0.0302 (1) | −0.1841 (4) | −0.0374 (2) | −0.0457 (3) |
| C6 | −0.0300 (1) | −0.0374 (2) | −0.0385 (3) | −0.0428 (4) |
| C7 | 0.6307 (1) | 0.5400 (3) | 0.5708 (2) | 0.3338 (4) |
| C8 | 0.4198 (1) | 0.3405 (3) | 0.4088 (2) | 0.1584 (4) |
| Total value | 0.2891 (1) | 0.1545 (3) | 0.1871 (2) | 0.0664 (4) |
| Method | A | B | C | D | Sorting Result |
|---|---|---|---|---|---|
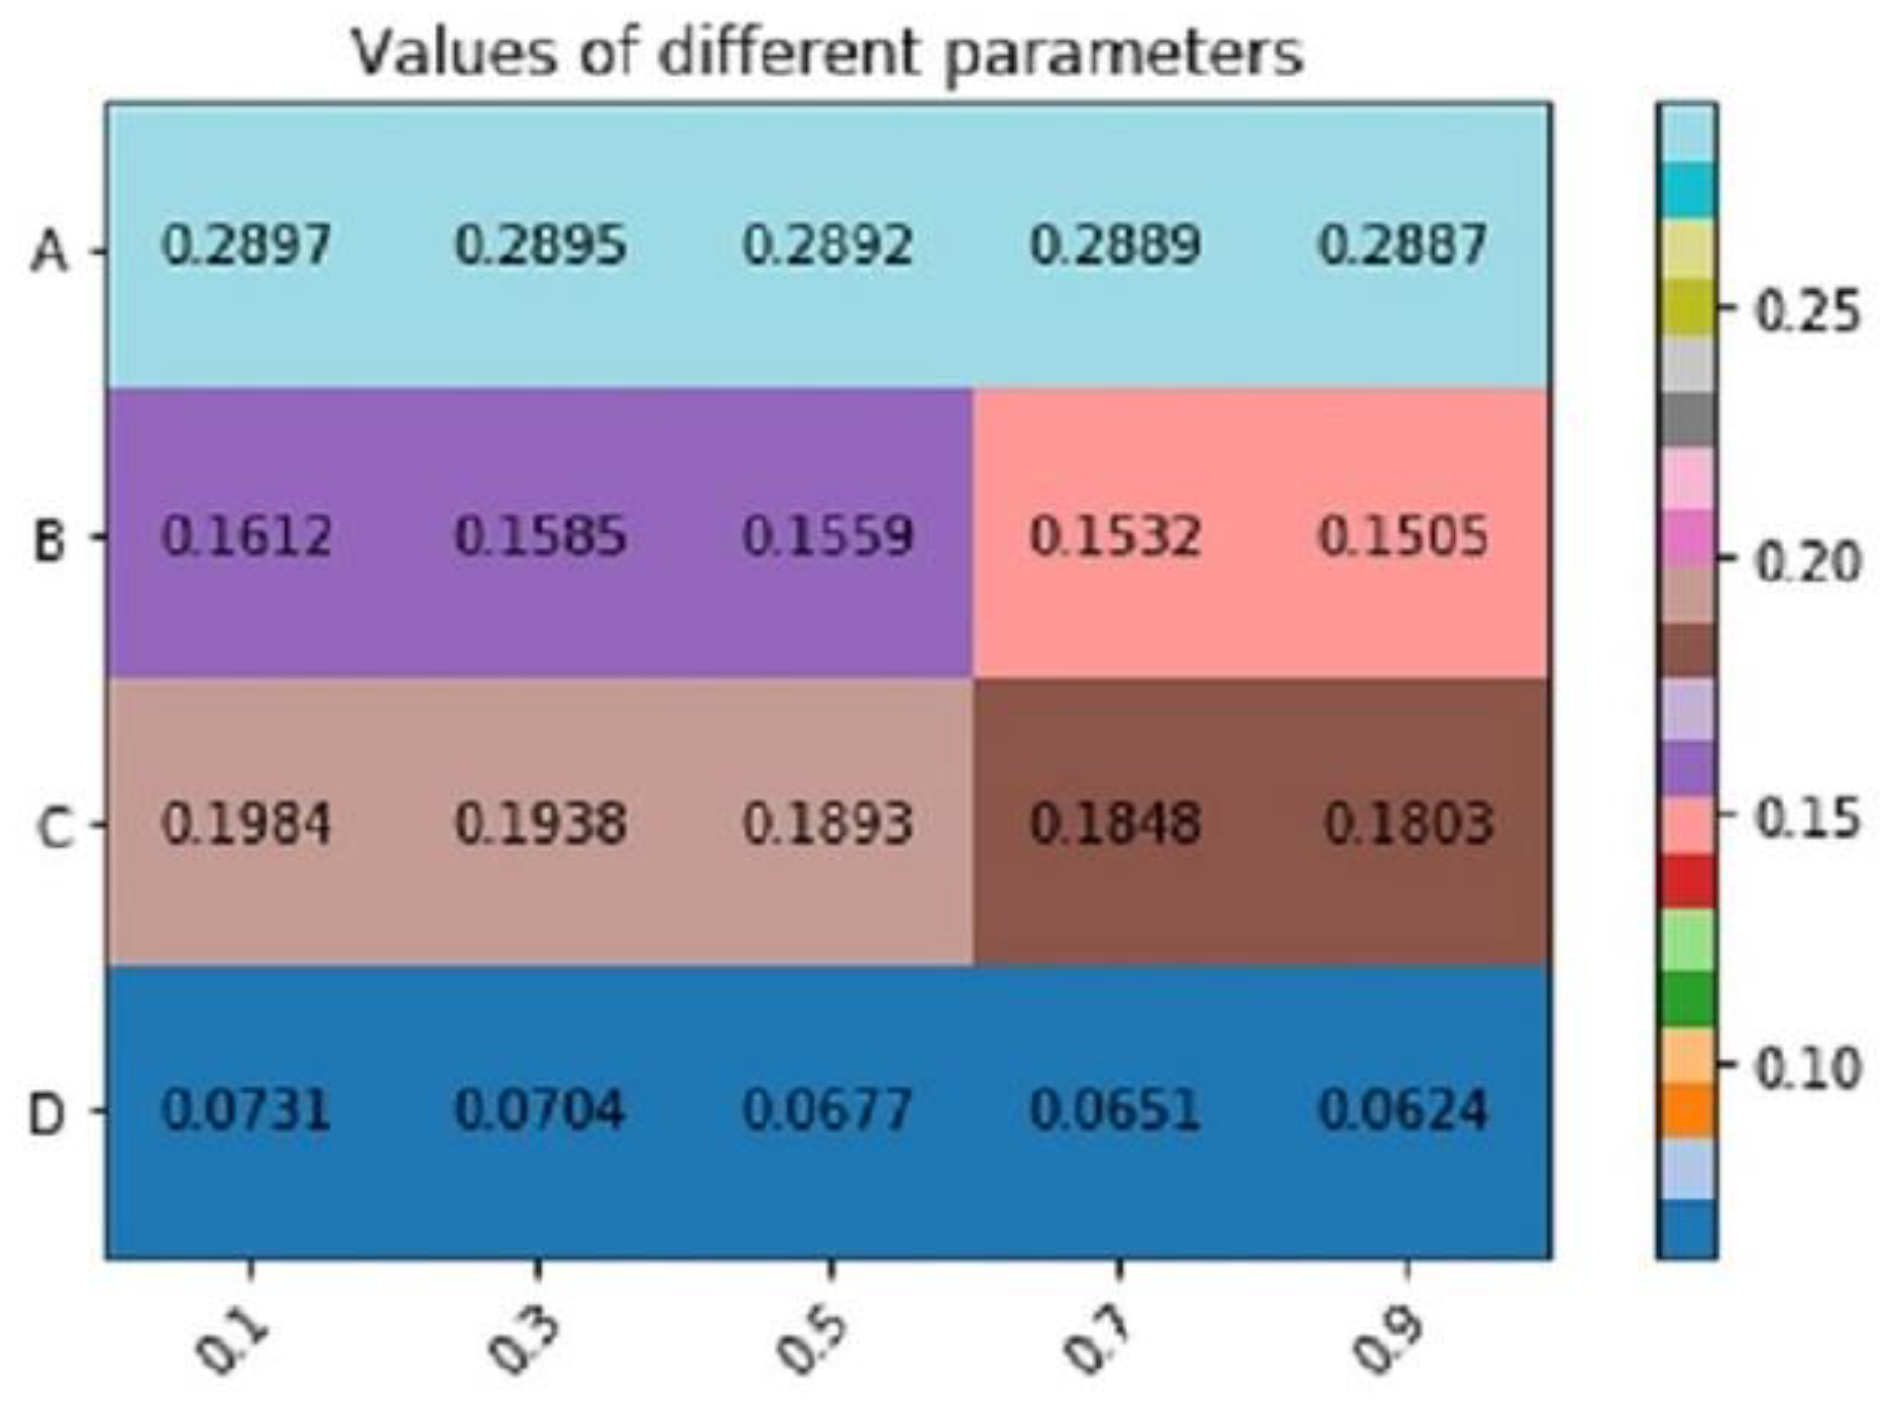
| method 1 | 0.2891 | 0.1545 | 0.1871 | 0.0664 | |
| method 2 | 0.2918 | 0.1825 | 0.2345 | 0.0946 | |
| method 3 | 0.2886 | 0.1492 | 0.1780 | 0.0610 | |
| method 4 | 0.3799 | 0.2090 | 0.2077 | 0.0834 |
Publisher’s Note: MDPI stays neutral with regard to jurisdictional claims in published maps and institutional affiliations. |
© 2022 by the authors. Licensee MDPI, Basel, Switzerland. This article is an open access article distributed under the terms and conditions of the Creative Commons Attribution (CC BY) license (https://creativecommons.org/licenses/by/4.0/).
Share and Cite
Su, W.; Zhang, L.; Zhang, C.; Zeng, S.; Liu, W. A Heterogeneous Information-Based Multi-Attribute Decision Making Framework for Teaching Model Evaluation in Economic Statistics. Systems 2022, 10, 86. https://doi.org/10.3390/systems10040086
Su W, Zhang L, Zhang C, Zeng S, Liu W. A Heterogeneous Information-Based Multi-Attribute Decision Making Framework for Teaching Model Evaluation in Economic Statistics. Systems. 2022; 10(4):86. https://doi.org/10.3390/systems10040086
Chicago/Turabian StyleSu, Weihua, Le Zhang, Chonghui Zhang, Shouzhen Zeng, and Wangxiu Liu. 2022. "A Heterogeneous Information-Based Multi-Attribute Decision Making Framework for Teaching Model Evaluation in Economic Statistics" Systems 10, no. 4: 86. https://doi.org/10.3390/systems10040086
APA StyleSu, W., Zhang, L., Zhang, C., Zeng, S., & Liu, W. (2022). A Heterogeneous Information-Based Multi-Attribute Decision Making Framework for Teaching Model Evaluation in Economic Statistics. Systems, 10(4), 86. https://doi.org/10.3390/systems10040086