Supply Chain Recovery Strategies for High Demand Products Based on the Impact of Capacity and Transportation Disruptions
Abstract
:1. Introduction
2. Literature Review
3. System Dynamics Framework
3.1. System Dynamics Model Boundaries
3.2. System Dynamics Model Hypothesis
- (1)
- Only after the production capacity is interrupted can the manufacturer proceed.
- (2)
- The size of the expediting rate represents the extent of production. The higher the pilot rate, the higher the complexity cost.
- (3)
- The advanced stage of the support chain is known and fixed.
- (4)
- The capacity interruption rate being 1 represents complete interrupt, and the capacity interruption rate being 0.5 represents partial interrupt.
- (5)
- Transport interrupts are expressed through the interruption of the transport interrupt; the transport interruption time of 30 generations means a partial interrupt, and the transport interruption time of 50 represents complete interrupt.
- (6)
- Due to the severity of the capacity interruption, the manufacturer operates in a specific capacity and costs when the production capacity is interrupted.
- (7)
- The transport truck cost and load weight of the manufacturer and distribution center are the same.
- (8)
- The production capacity interruption and transportation interruption start at the same time.
- (9)
- Government subsidies start from the supply chain interruption time.
- (10)
- The order implements the “advanced first-out” principle.
- (11)
- The manufacturer’s demand is derived from orders in the distribution center.
- (12)
- Government subsidies and capacity are positive linear relationships, and there is a government subsidy to the capacity of capacity and the increased production capacity after subsidies.
- (13)
- The government needs a certain amount of time to develop new production capacity, and there is a subsidy of production capacity to take effect.
- (14)
- The production capacity interruption only occurs for the manufacturer, and the transport interruption only occurs at the distribution center.
- (15)
- The demand is subject to a uniform distribution.
- (16)
- Limitations on the warehouse capacity of manufacturers and distribution centers are not taken into account.
- (17)
- Government subsidies can only subsidize one of the objects and distribution centers of the manufacturer and distribution center, representing the choice of subsidy strategy. The government subsidy is set to 0 or 1.
3.3. System Structure Analysis
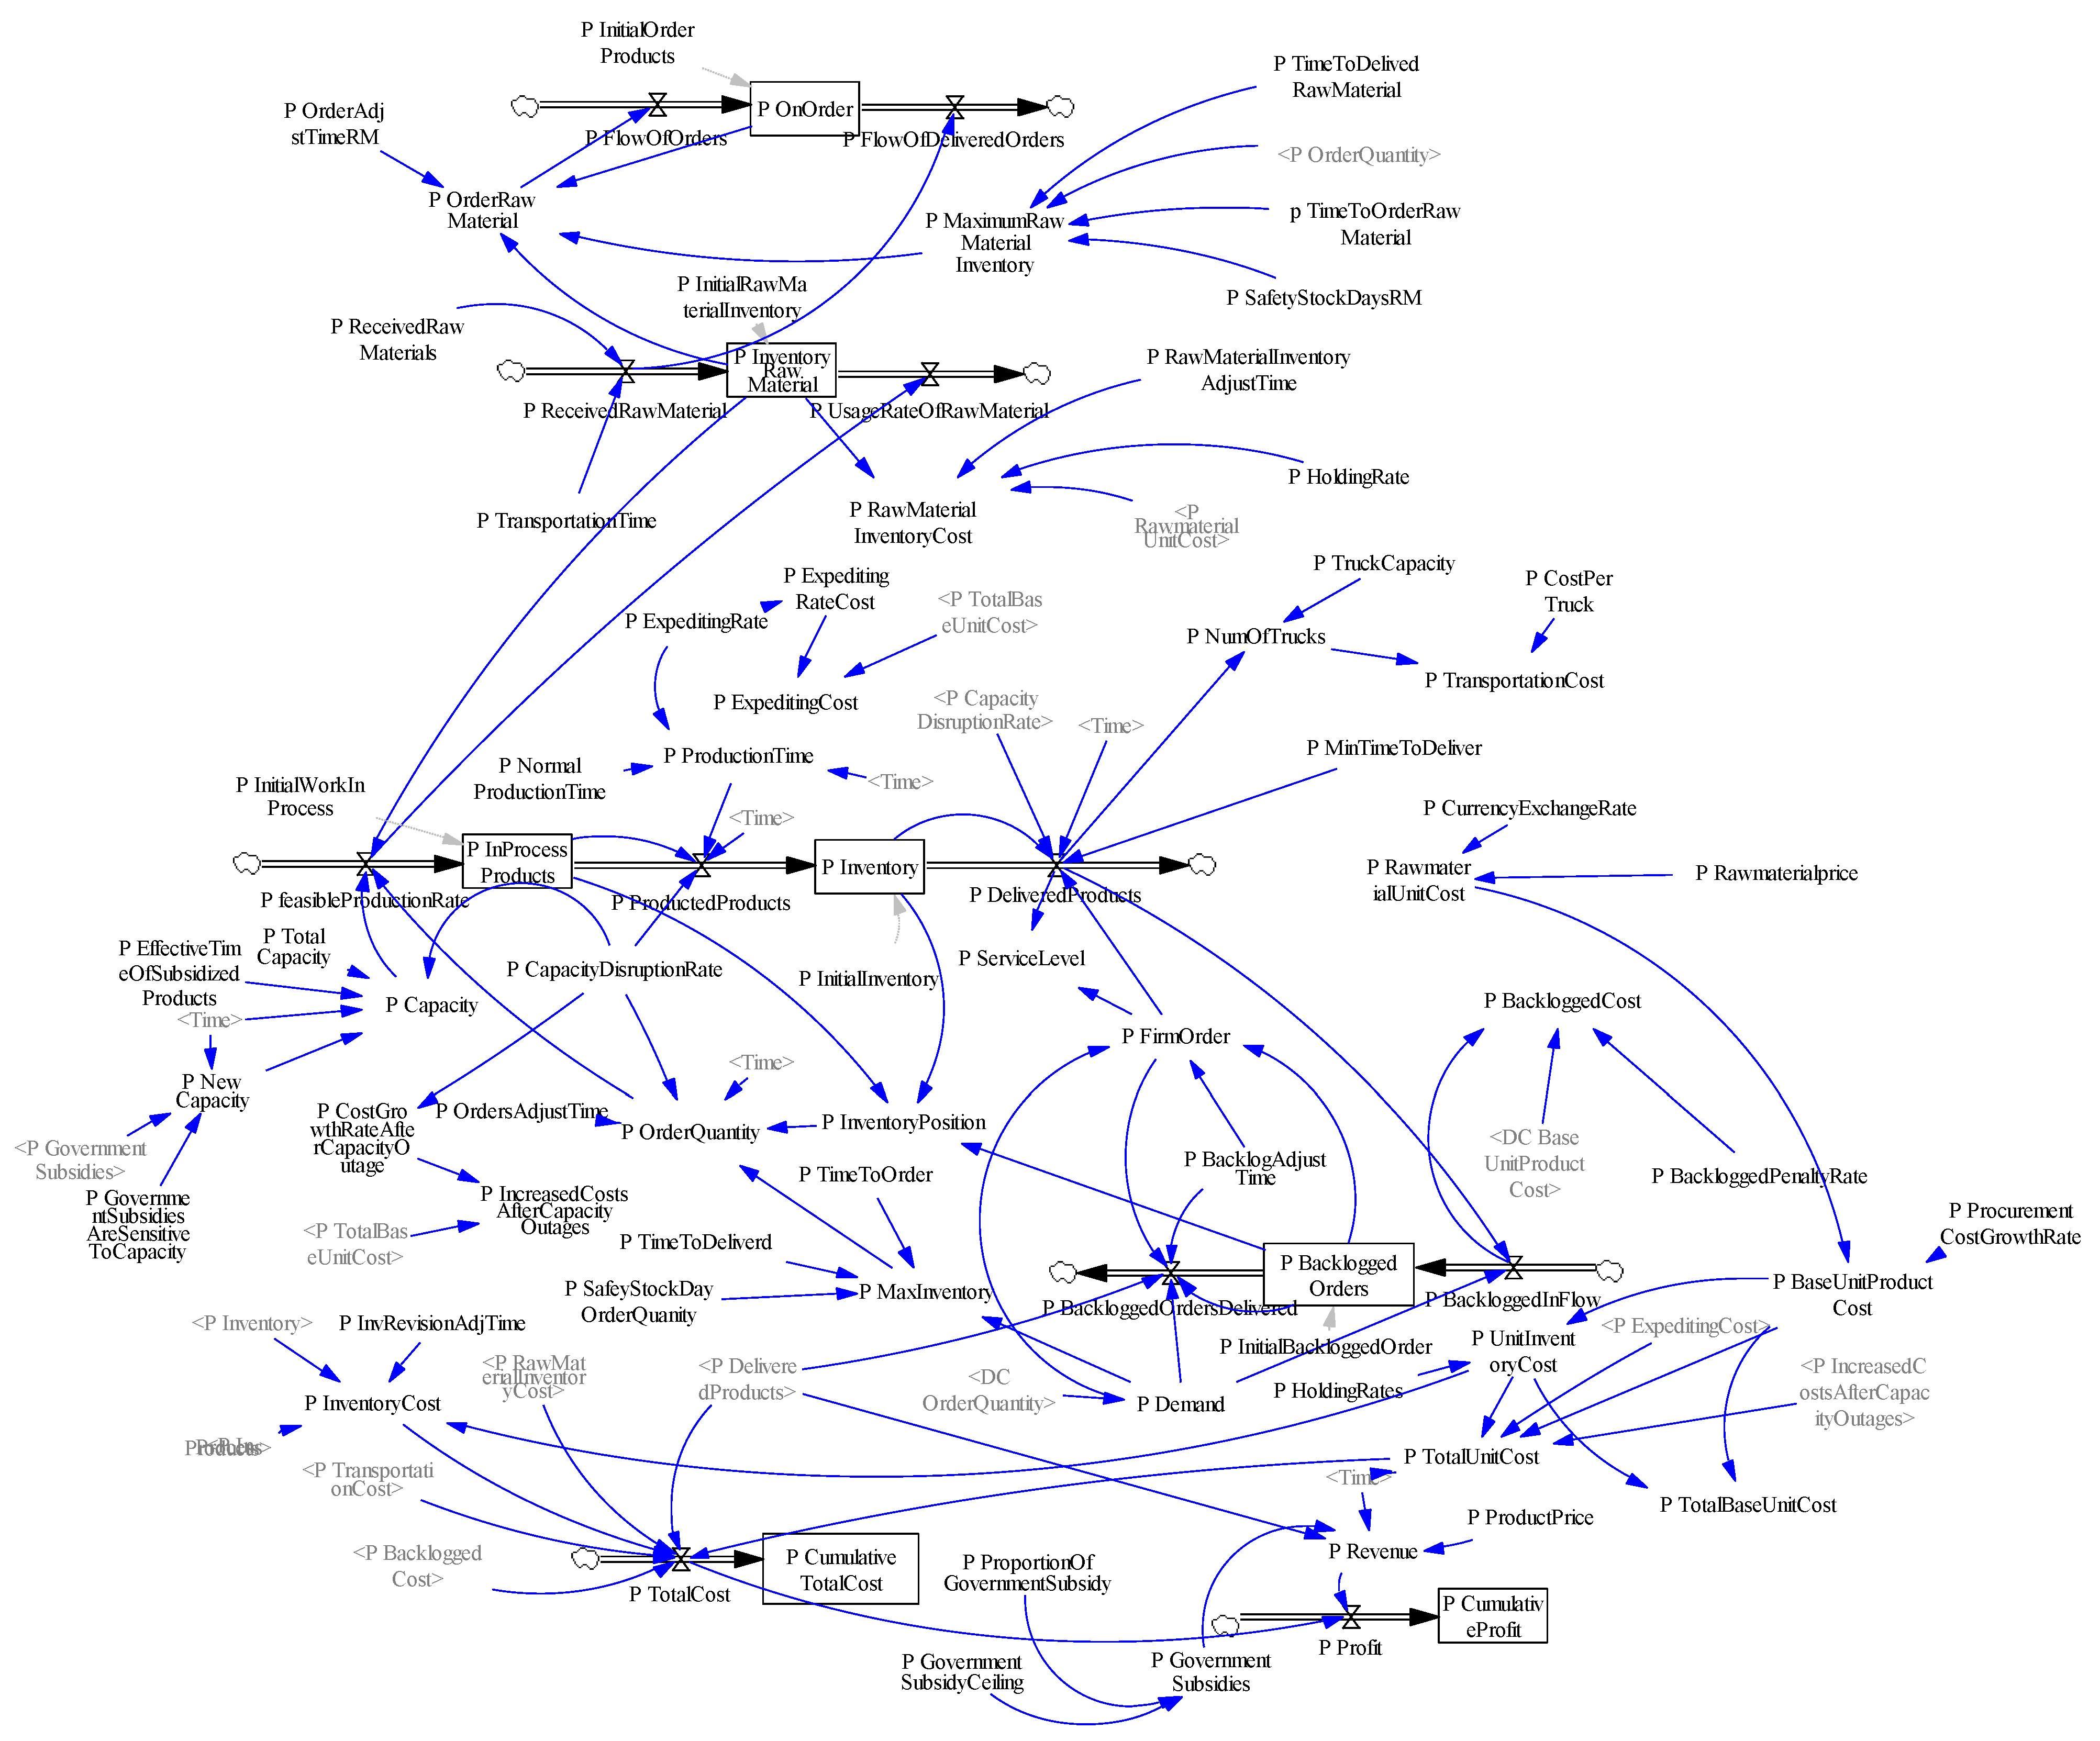
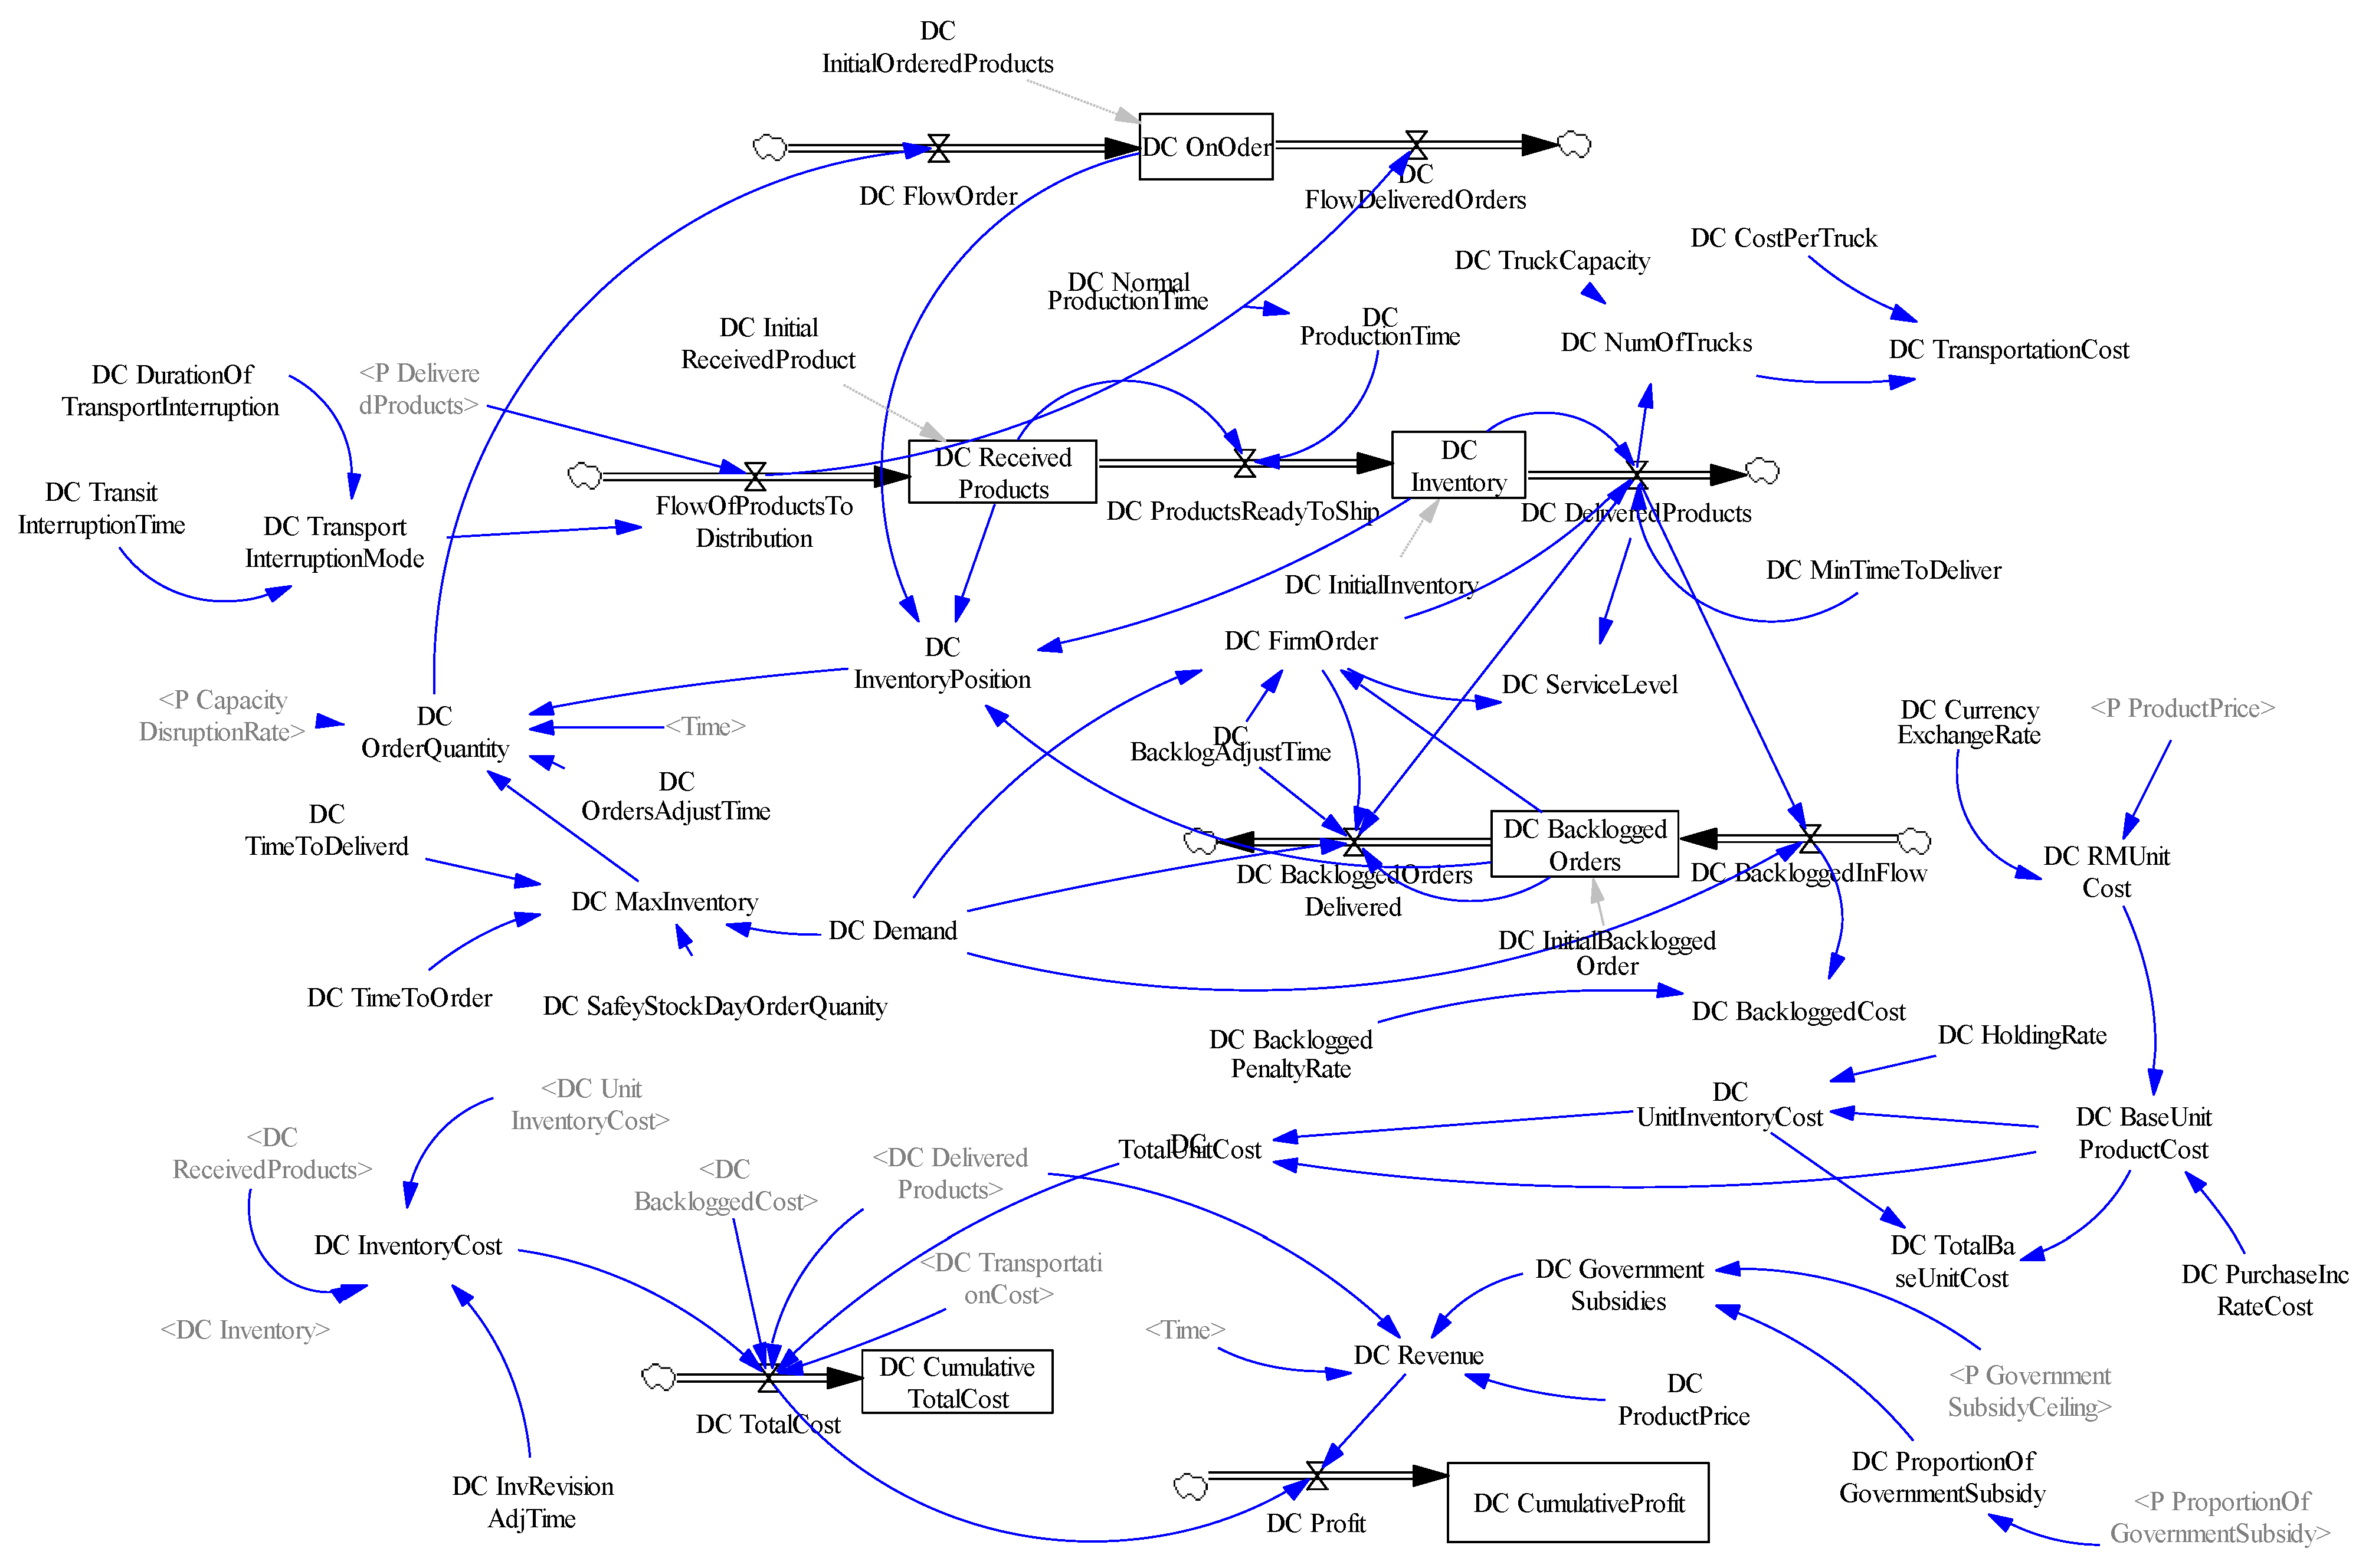
3.4. System Stock Traffic Diagram
3.5. Model Equations and Parameters
4. Numerical Study and Results
4.1. Parameter Setting
4.2. System Dynamics Model Checking
Reality Check
4.3. Analysis of Simulation Results
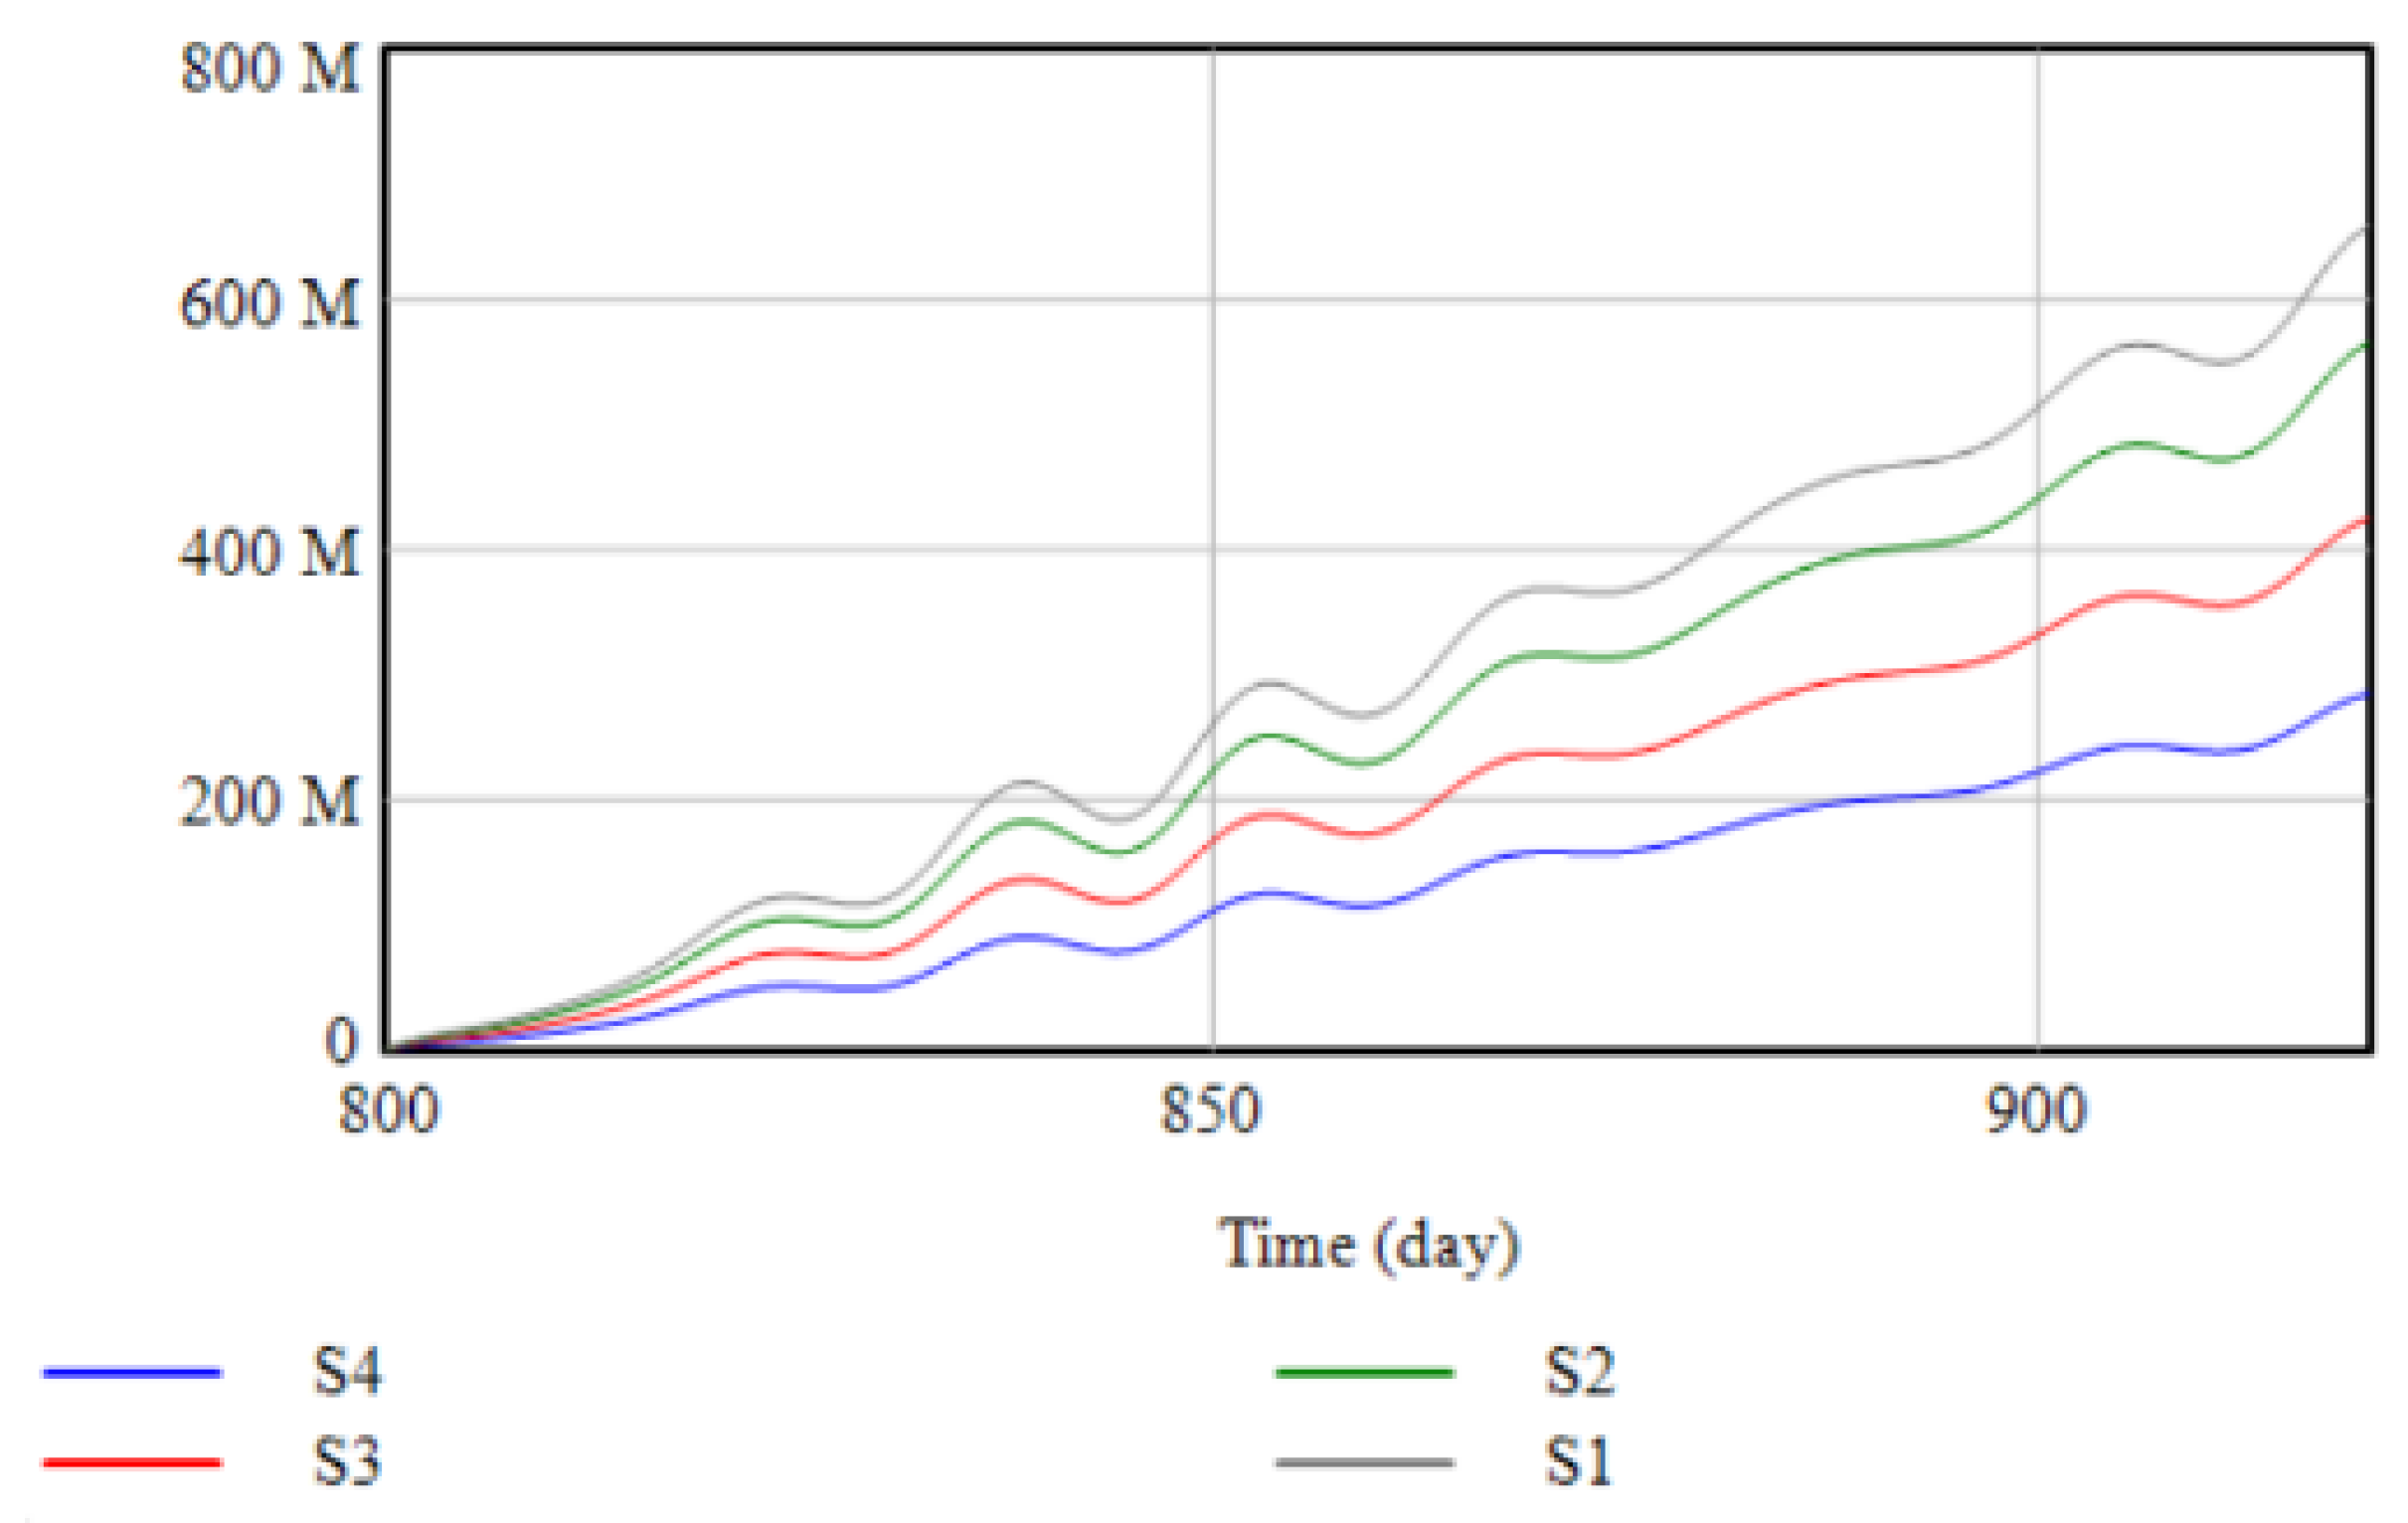
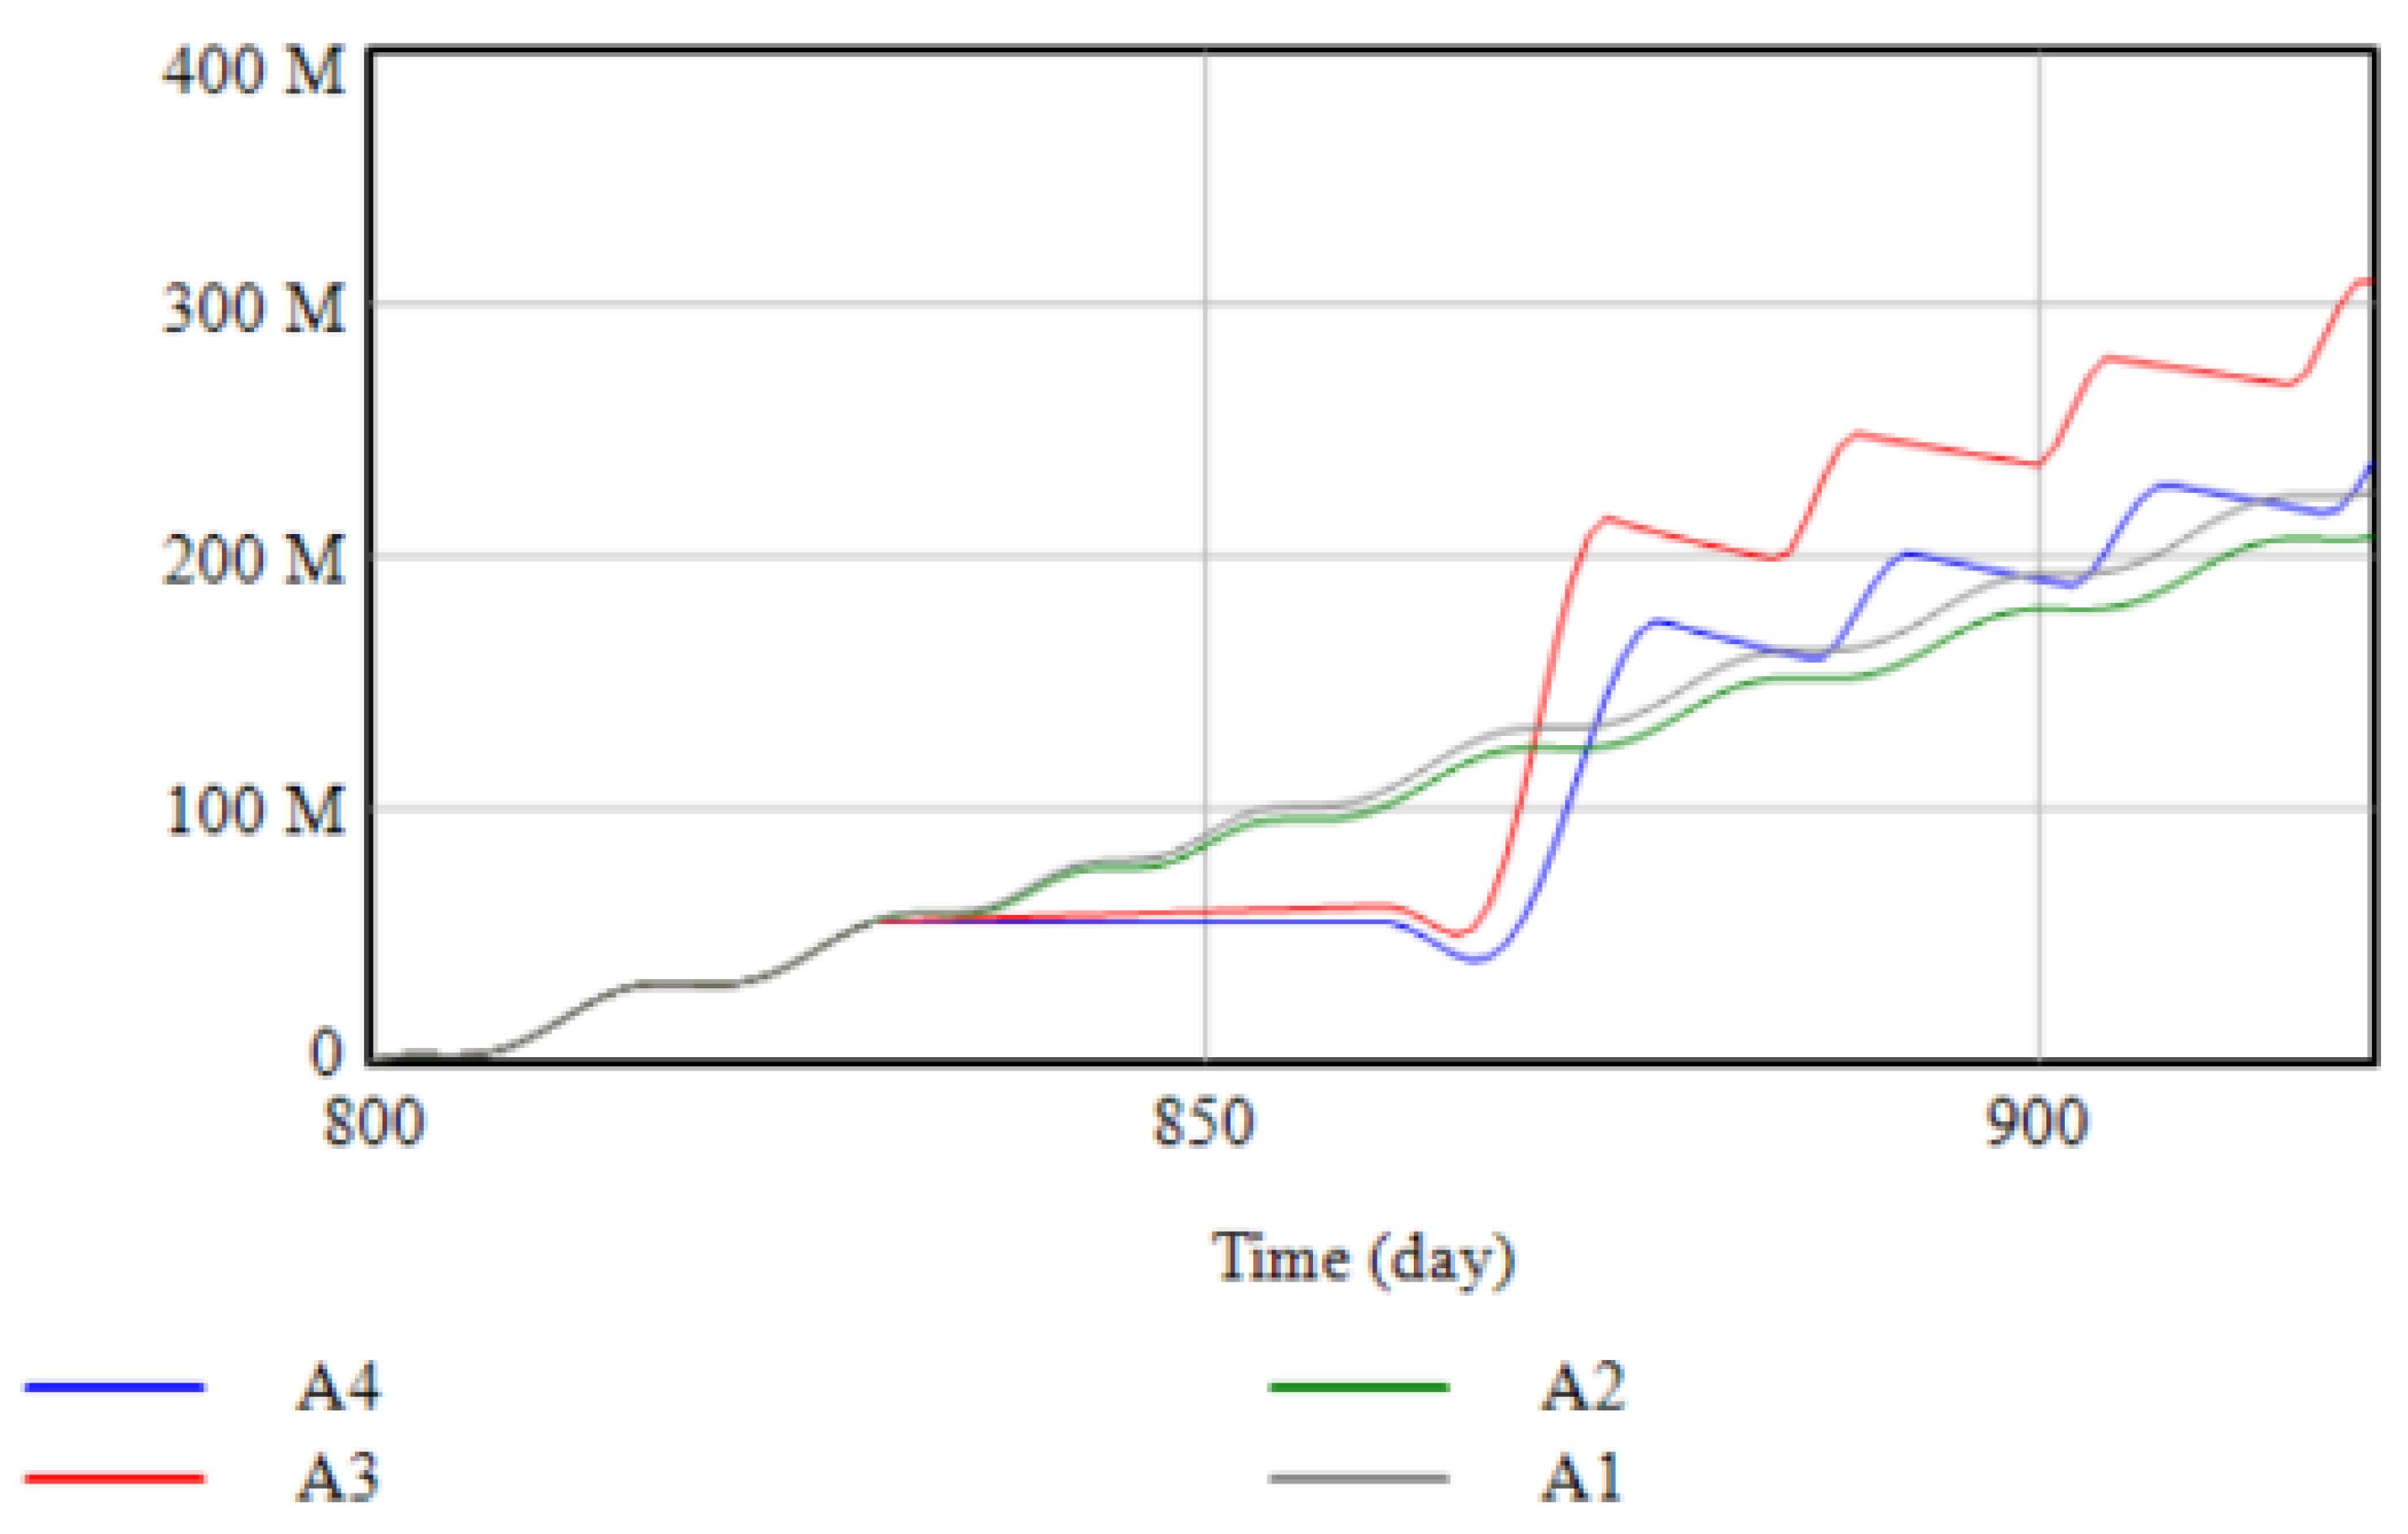
4.3.1. Analysis of Simulation Results of Transportation Partial Interruption and Capacity Interruption
4.3.2. Analysis of Simulation Results of Complete Transportation Interruption and Capacity Interruption
5. Conclusions
- (1)
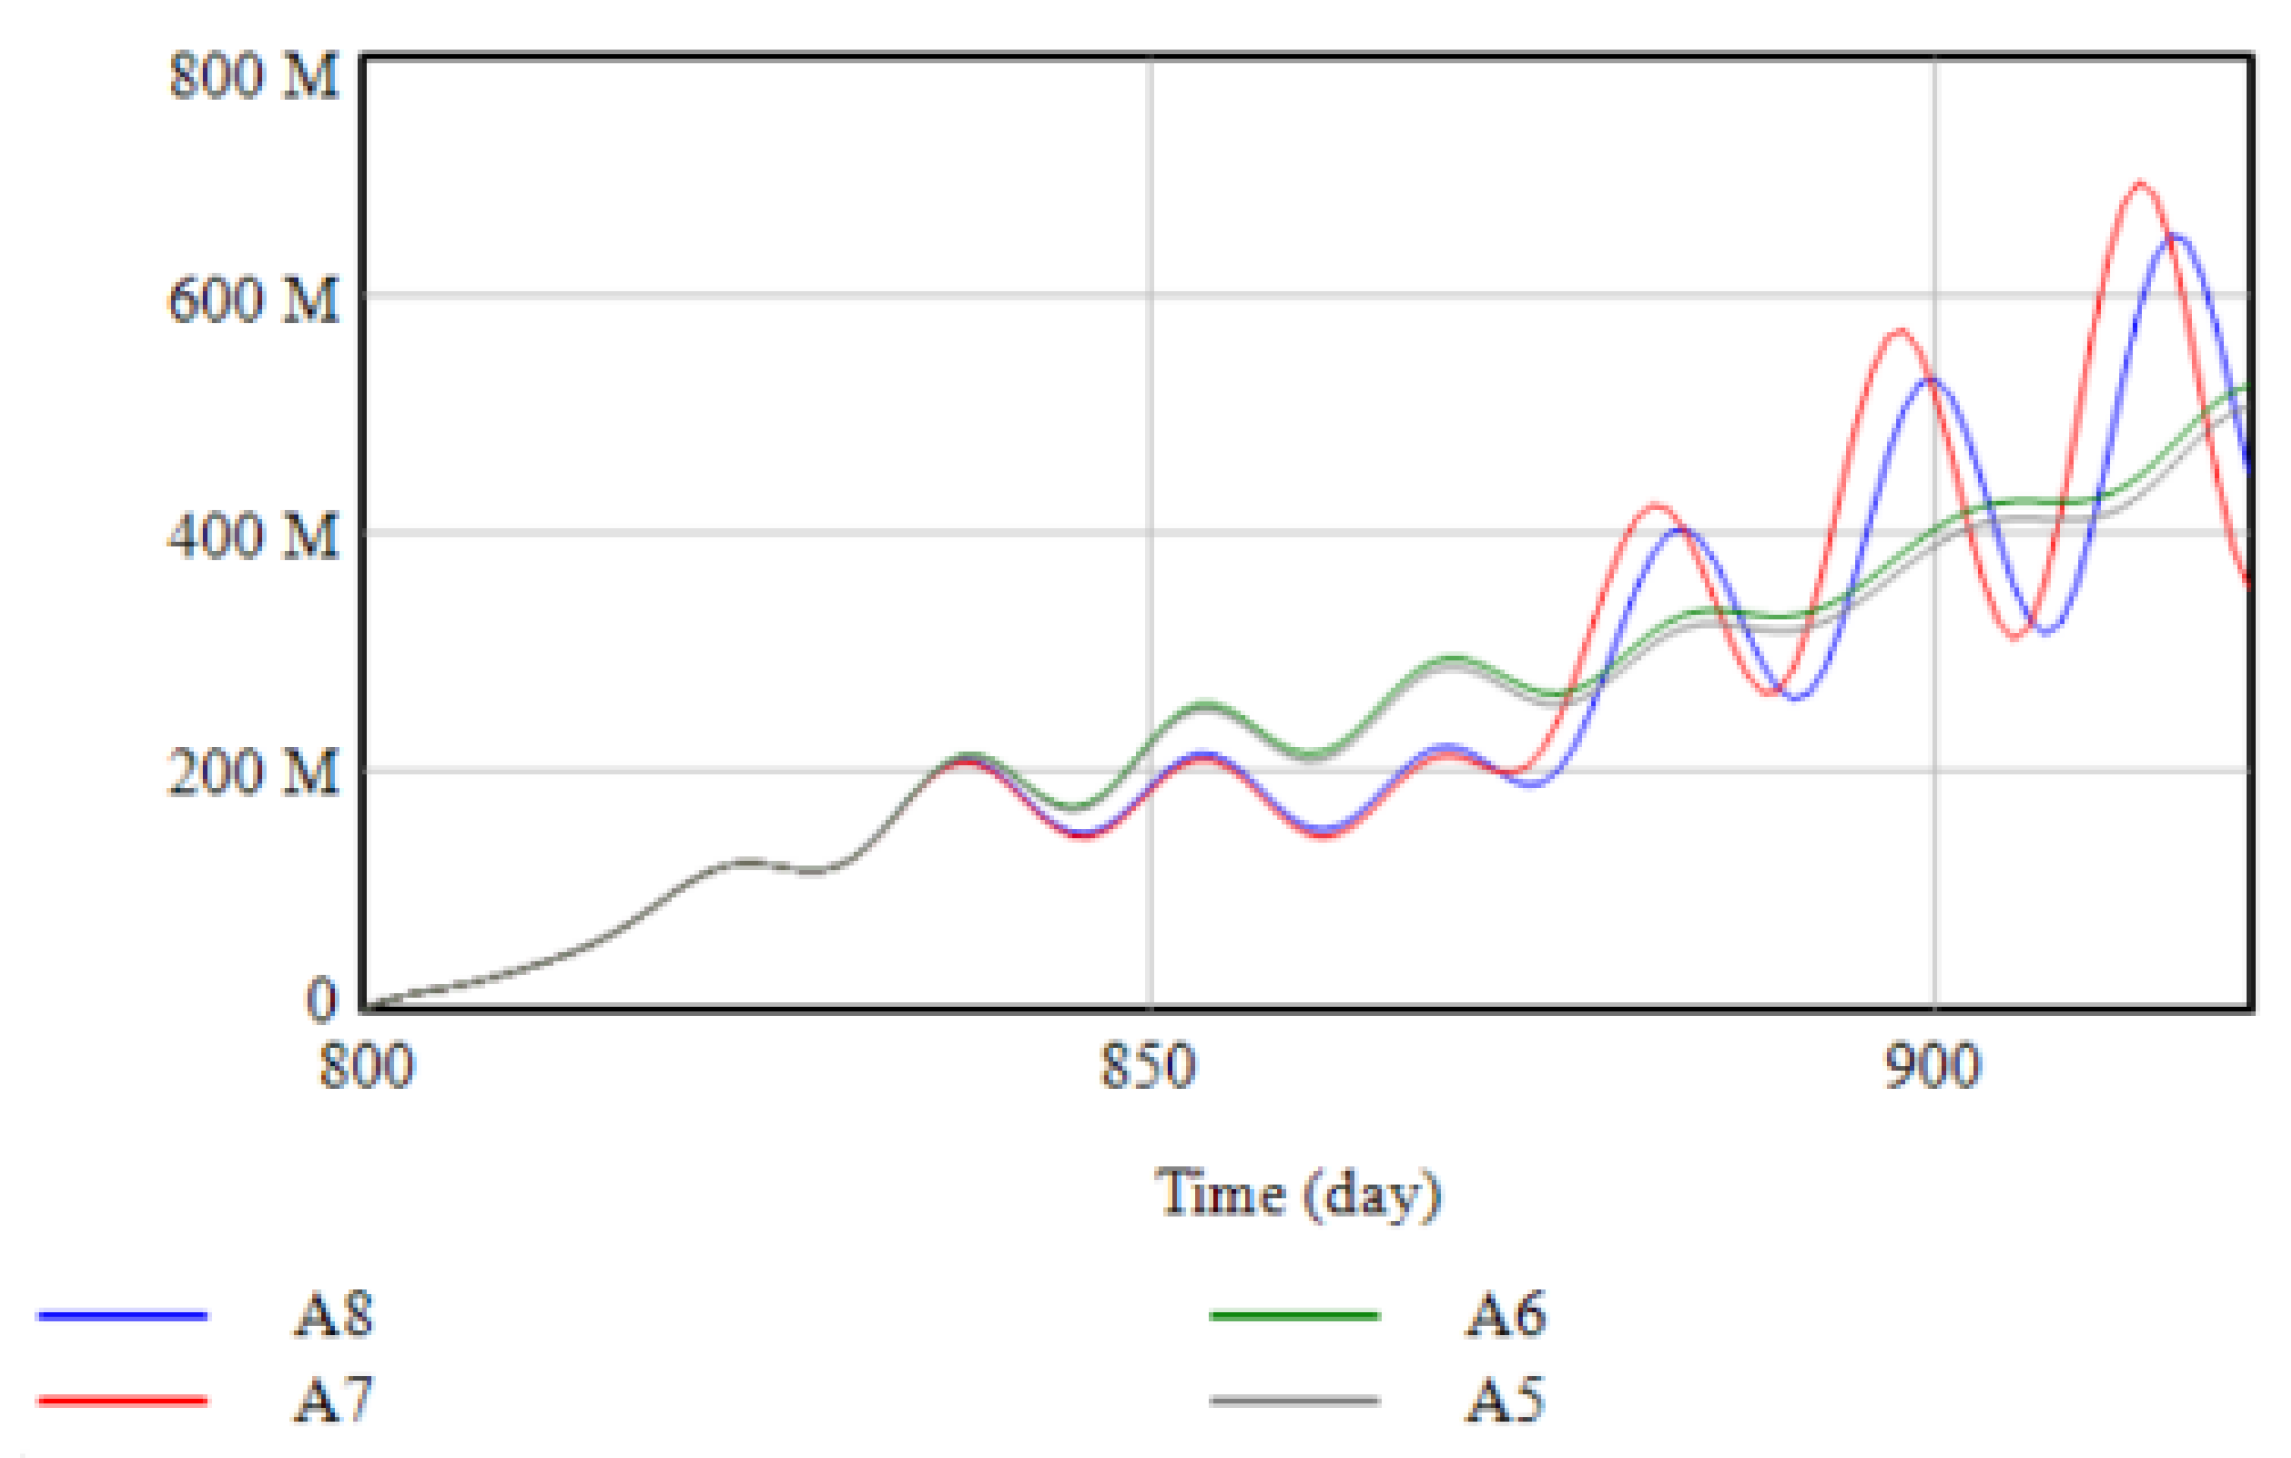
- In the case of transportation interruption and capacity interruption, whether the transportation is partially or completely interrupted, the government subsidizes the manufacturer and the recovery effect is better than subsidizing the distribution center. Most of the labor used by manufacturers is near the factory. During the epidemic, the transmission speed can be controlled in a small area. Most of the labor in the distribution center passes through multiple locations during the distribution process. During the epidemic, the risk level of various places may change at any time. Delivery workers are more likely to be out of work, so government subsidies to manufacturers can restore productivity faster, boosting the recovery of cumulative profits for supply chain members.
- (2)
- The government subsidy strategy does not have an immediate recovery effect in the complete interruption of transportation and production capacity. When production capacity and transportation are completely interrupted, it means that the production and manufacturers’ and distribution centers’ transportation facilities have been completely paralyzed, and government subsidies need to re-integrate resources. In addition, there are material and information delays in the supply chain, so government subsidies cannot work right away.
- (3)
- When the government chooses the subsidy strategy, the different production capacity levels and transportation interruption will lead to different effects of government subsidies on supply chain recovery. The severity of capacity disruptions can cause companies to operate at different efficiencies and costs. The more severe the capacity disruption, the less productive the manufacturer will be and the corresponding increase in operating costs. In the partial interruption scenario, government subsidies can allow manufacturers and distribution centers to obtain capital and labor resources to quickly resume production. In the complete interruption scenario, due to the rapid spread of the epidemic and the different isolation measures in various parts of China, it is difficult to resume production in a short period quickly. Integrate resources and restore production capacity, so the recovery effect is not as good as the partially interrupted scene.
- (4)
- Under the complete interruption of production capacity, the cumulative total value of the supply chain after increasing government subsidies has rebounded in a spiral. Due to the delay in the arrival of materials in the production process of the manufacturer’s work in progress, the cumulative total profit of the supply chain after the government subsidy will decline, and the overall recovery trend will spiral upward.
Author Contributions
Funding
Institutional Review Board Statement
Informed Consent Statement
Data Availability Statement
Conflicts of Interest
Appendix A
Appendix B
| Serial Number | Constant | Numerical Value |
|---|---|---|
| 1 | P government subsidy ceiling (yuan) | 200,000 |
| 2 | Blackout start time (days) | Day 830 |
| 3 | P effective Time of Subsidized products capacity to take effect (days) | 10 days |
| 4 | Blackout end time (days) | Day 860 |
| 5 | P initial product inventory (set) | 800 |
| 6 | DC initial product inventory (set) | 1200 |
| 7 | P capacity disruption rate | Simulation settings |
| 8 | DC duration of transport interruption | Simulation settings |
| 9 | P minimum delivery time (days) | 3 |
| 10 | Dc minimum delivery time (days) | 4 |
| 11 | P backlog adjustment time (days) | 2 |
| 12 | DC backlog adjustment time (days) | 1 |
| 13 | P initial backlogged order (sets) | 0 |
| 14 | DC initial backlogged order (set) | 0 |
| 15 | P initial work in process (set) | 0 |
| 16 | DC initially received product (set) | 0 |
| 17 | P product shipping time (days) | 4 |
| 18 | P total capacity (units/day) | 1200 |
| 19 | P normal production time (days) | 6 |
| 20 | DC normal production time (days) | 6 |
| 21 | P expediting rate | 0.5 |
| 22 | P product delivery time (days) | 6 |
| 23 | DC product delivery time (days) | 6 |
| 24 | P product safety stock time | 2 |
| 25 | DC product safety stock time (days) | 2 |
| 26 | P order time (days) | 1 |
| 27 | P product price (yuan/unit) | 10,000 |
| 28 | DC product price (yuan/set) | 30,000 |
| 29 | DC order time (days) | 1 |
| 30 | P order adjustment time (days) | 5 |
| 31 | DC order adjustment time (days) | 10 |
| 32 | P initial raw material inventory (set) | 200 |
| 33 | P raw material transportation time (days) | 2 |
| 34 | P raw material adjustment time (days) | 1 |
| 35 | P time to order raw materials (days) | 5 |
| 36 | P raw material delivery time (days) | 6 |
| 37 | P raw material safety stock time (days) | 4 |
| 38 | P initial order product (set) | 0 |
| 39 | DC initial order product (set) | 0 |
| 40 | P truck capacity (unit/car) | 80 |
| 41 | DC truck capacity (unit/car) | 80 |
| 42 | P Transport truck unit cost (yuan/car) | 100 |
| 43 | DC transport truck unit cost (yuan/car) | 100 |
| 44 | P raw material price (yuan/set) | 2000 |
| 45 | P currency rate | 1.5 |
| 46 | DC currency exchange rate | 1.5 |
| 47 | P procurement cost growth rate | 0.8 |
| 48 | DC procurement cost growth rate | 0.2 |
| 49 | P holding rate | 0.12 |
| 50 | DC holding rate | 0.15 |
| 51 | P backlog penalty rate | 0.1 |
| 52 | DC backlog Penalty Rate | 0.1 |
| 53 | P raw material holding ratio | 0.1 |
| 54 | P raw material inventory adjustment time (days) | 10 |
| 55 | P inventory adjustment time (days) | 10 |
| 56 | DC inventory adjustment time (days) | 7 |
| 57 | Expediting time (days) | 20 |
| 58 | P received raw material (units/day) | 300 |
References
- Dolgui, A.; Ivanov, D.; Sokolov, B. Ripple effect in the supply chain: An analysis and recent literature. Int. J. Prod. Res. 2018, 56, 414–430. [Google Scholar] [CrossRef] [Green Version]
- Ju, C.; Li, G.; Bao, F.; Gao, T.; Zhu, Y. Social Relationship Prediction Integrating Personality Traits and Asymmetric Interactions. Front. Psychol. 2022, 13, 778722. [Google Scholar] [CrossRef] [PubMed]
- Ju, C.; Bao, F.; Xu, C.; Fu, X. A Novel Method of Interestingness Measures for Association Rules Mining Based on Profit. Discret. Dyn. Nat. Soc. 2015, 2015, 868634. [Google Scholar] [CrossRef] [Green Version]
- Bao, F.; Xu, W.; Feng, Y.; Xu, C. A Topic-Rank Recommendation Model Based on Microblog Topic Relevance & User Preference Analysis. Hum. Cent. Comput. Inf. Sci. 2022, 12, 10. [Google Scholar] [CrossRef]
- Ivanov, D. Predicting the impacts of epidemic outbreaks on global supply chains: A simulation-based analysis on the coronavirus outbreak (COVID-19/SARS-CoV-2) case. Transp. Res. Part E Logist. Transp. Rev. 2020, 136, 101922. [Google Scholar] [CrossRef] [PubMed]
- Bao, F.; Mao, L.; Zhu, Y.; Xiao, C.; Xu, C. An Improved Evaluation Methodology for Mining Association Rules. Axioms 2022, 11, 17. [Google Scholar] [CrossRef]
- Ju, C.; Jiang, Y.; Bao, F.; Zou, B.; Xu, C. Online Rumor Diffusion Model Based on Variation and Silence Phenomenon in the Context of COVID-19. Front. Public Health 2022, 9, 788475. [Google Scholar] [CrossRef]
- Ju, C.; Wang, C.; Jiang, Y.; Bao, F.; Zhou, H.; Xu, C. Exploring a Multi-layer Coupled Network Propagation Model Based on Information Diffusion and Bounded Trust. Int. J. Public Health, 2022; in press. [Google Scholar]
- Li, X.; Li, Y. On green market segmentation under subsidy regulation. Supply Chain. Manag. Int. J. 2017, 22, 284–294. [Google Scholar] [CrossRef]
- Liu, Y.; Ren, W.; Xu, Q.; Liu, Z. A coordination mechanism through cost sharing of corporate social responsibility and government subsidy in a two-echelon supply chain. J. Bus. Ind. Mark. 2021, 37, 29–46. [Google Scholar] [CrossRef]
- Bonilla, D.; Keller, H.; Schmiele, J. Climate policy and solutions for green supply chains: Europe’s predicament. Supply Chain. Manag. Int. J. 2015, 20, 249–263. [Google Scholar] [CrossRef] [Green Version]
- Xu, Y.; Liu, Q.; Zhou, L. Research on closed-loop dual-channel recycling supply chain decision-making based on game theory. J. Syst. Simul. 2022, 34, 396–408. [Google Scholar]
- Berger, P.D.; Gerstenfeld, A.; Zeng, A.Z. How many suppliers are best? A decision-analysis approach. Omega 2004, 32, 9–15. [Google Scholar] [CrossRef]
- Sawik, T. Selection of supply portfolio under disruption risks. Omega 2011, 39, 194–208. [Google Scholar] [CrossRef]
- Sawik, T. Selection of resilient supply portfolio under disruption risks. Omega 2013, 41, 259–269. [Google Scholar] [CrossRef]
- Hosseini, S.; Barker, K. A Bayesian network model for resilience-based supplier selection. Int. J. Prod. Econ. 2016, 180, 68–87. [Google Scholar] [CrossRef]
- Yan, Y.; Liu, X.; Zhuang, X. Emergency Management Strategy of Elastic Supply Chain Based on Node Failure. Control Decis. 2010, 25, 25–30. [Google Scholar]
- Li, N. Research on collaborative management of emergency supply chain for novel coronavirus pneumonia. Health Econ. Res. 2020, 37, 7–9. [Google Scholar]
- Fan, X.; Lu, M. Influencing factors and evaluation of supply chain resilience of auto companies under the new crown epidemiccoronavirus pandemic. Ind. Technol. Econ. 2020, 39, 21–28. [Google Scholar]
- Govindan, K.; Mina, H.; Alavi, B. A decision support system for demand management in healthcare supply chains considering the epidemic outbreaks: A case study of coronavirus disease 2019 (COVID-19). Transp. Res. Part E Logist. Transp. Rev. 2020, 138, 101967. [Google Scholar] [CrossRef]
- Ivanov, D.; Dolgui, A. Viability of intertwined supply networks: Extending the supply chain resilience angles towards survivability. A position paper motivated by COVID-19 outbreak. Int. J. Prod. Res. 2020, 58, 2904–2915. [Google Scholar] [CrossRef] [Green Version]
- Yang, Y.; Zou, M.; Xie, G.; Li, Z.; Ni, W. Supply chain recovery mechanism under major public health emergencies. J. Manag. 2020, 17, 1433–1442. [Google Scholar]
- Paul, S.K.; Chowdhury, P. A production recovery plan in manufacturing supply chains for a high-demand item during COVID-19. Int. J. Phys. Distrib. Logist. Manag. 2020, 51, 104–125. [Google Scholar] [CrossRef]
- Ivanov, D.; Das, A. Coronavirus (COVID-19/SARS-CoV-2) and supply chain resilience: A research note. Int. J. Integr. Supply Manag. 2020, 13, 90–102. [Google Scholar] [CrossRef]
- Cheng, Y.S.; Chiou, C.C.; Tai, C.C. A system dynamics modeling approach for the strategic management of TFT-LCD supply chains. In Proceedings of the PICMET’08—2008 Portland International Conference on Management of Engineering & Technology, Cape Town, South Africa, 27–31 July 2008; pp. 1689–1697. [Google Scholar]
- Campuzano, F.; Mula, J.; Peidro, D. Fuzzy estimations and system dynamics for improving supply chains. Fuzzy Sets Syst. 2010, 161, 1530–1542. [Google Scholar] [CrossRef]
- Langroodi, R.R.P.; Amiri, M. A system dynamics modeling approach for a multi-level, multi-product, multi-region supply chain under demand uncertainty. Expert Syst. Appl. 2016, 51, 231–244. [Google Scholar] [CrossRef]
- Wilson, M.C. The impact of transportation disruptions on supply chain performance. Transp. Res. Part E Logist. Transp. Rev. 2007, 43, 295–320. [Google Scholar] [CrossRef]
- Huang, M.; Yang, M.; Zhang, Y.; Liu, B. System dynamics modeling-based study of contingent sourcing under supply disruptions. Syst. Eng. Procedia 2012, 4, 290–297. [Google Scholar] [CrossRef] [Green Version]
- Pimenta, M.L.; Cezarino, L.O.; Piato, E.L.; da Silva, C.H.P.; Oliveira, B.G.; Liboni, L.B. Supply chain resilience in a Covid-19 scenario: Mapping capabilities in a systemic framework. Sustain. Prod. Consum. 2022, 29, 649–656. [Google Scholar] [CrossRef]
- Misra, B.; Prigogine, I.; Courbage, M. From deterministic dynamics to probabilistic descriptions. Phys. A Stat. Mech. Its Appl. 1979, 98, 1–26. [Google Scholar] [CrossRef]
- Xie, K.; Zhu, S.; Gui, P. A Game-Theoretic Approach for CSR Emergency Medical Supply Chain during COVID-19 Crisis. Sustainability 2022, 14, 1315. [Google Scholar] [CrossRef]
- Guo, D.; He, Y.; Wu, Y.; Xu, Q. Analysis of supply chain under different subsidy policies of the government. Sustainability 2016, 8, 1290. [Google Scholar] [CrossRef] [Green Version]
- Wang, W.; Zhang, P.; Ding, J.; Li, J.; Sun, H.; He, L. Closed-loop supply chain network equilibrium model with retailer-collection under legislation. J. Ind. Manag. Optim. 2019, 15, 199. [Google Scholar] [CrossRef] [Green Version]
- Olivares-Aguila, J.; ElMaraghy, W. System dynamics modelling for supply chain disruptions. Int. J. Prod. Res. 2020, 59, 1757–1775. [Google Scholar] [CrossRef]
- Macdonald, J.R.; Corsi, T.M. Supply chain disruption management: Severe events, recovery, and performance. J. Bus. Logist. 2013, 34, 270–288. [Google Scholar] [CrossRef]
- Zeng, Z.; Guan, D. Methodology and application of flood footprint accounting in a hypothetical multiple two-flood event. Philos. Trans. R. Soc. A 2020, 378, 20190209. [Google Scholar] [CrossRef] [Green Version]
- Ivanov, D.; Rozhkov, M. Coordination of production and ordering policies under capacity disruption and product write-off risk: An analytical study with real-data based simulations of a fast moving consumer goods company. Ann. Oper. Res. 2017, 291, 387–407. [Google Scholar] [CrossRef]
- Guan, D.; Wang, D.; Hallegatte, S.; Davis, S.J.; Huo, J.; Li, S.; Bai, Y.; Lei, T.; Xue, Q.; Coffman, D.M.; et al. Global supply-chain effects of COVID-19 control measures. Nat. Hum. Behav. 2020, 4, 577–587. [Google Scholar] [CrossRef]
- Schmitt, T.G.; Kumar, S.; Stecke, K.E.; Glover, F.W.; Ehlen, M.A. Mitigating disruptions in a multi-echelon supply chain using adaptive ordering. Omega 2017, 68, 185–198. [Google Scholar] [CrossRef]
- Cao, Y.; Mao, Q. How do government subsidies affect the capacity utilization rate of Chinese enterprises? Ind. Econ. Res. 2020, 2, 58–72. [Google Scholar]
- Shao, W.; Yang, K.; Bai, X. Impact of financial subsidies on the R&D intensity of new energy vehicles: A case study of 88 listed enterprises in China. Energy Strategy Rev. 2021, 33, 100580. [Google Scholar]
- Jia, S.; Xu, D. The Paradox of Overcapacity and the Mystery of China’s Investment Expansion: A New Explanation. Economist 2016, 11, 71–82. [Google Scholar]
- Xu, C.; Ding, A.S.; Zhao, K. A novel POI recommendation method based on trust relationship and spatial-temporal factors. Electron. Commer. Res. Appl. 2021, 48, 101060. [Google Scholar] [CrossRef]
- Tao, L.; Sun, H.; Cao, Y.; Wen, X.; Liu, C.; Yuan, J. Recovery strategies considering government subsidies in the circumstances of supply chain interruption. Comput. Integr. Manuf. Syst. 2022, 28, 242–257. [Google Scholar]
- Xu, C.; Liu, D.; Mei, X. Exploring an Efficient POI Recommendation Model Based on User Characteristics and Spatial-Temporal Factors. Mathematics 2021, 9, 2673. [Google Scholar] [CrossRef]
- Xu, C. A novel recommendation method based on social network using matrix factorization technique. Inf. Process. Manag. 2018, 54, 463–474. [Google Scholar] [CrossRef]
- Wang, J.; Xu, C.; Liu, W. Understanding the adoption of mobile social payment: From the cognitive behavioral perspective. Int. J. Mob. Commun. 2022, 20, 483–506. [Google Scholar]
- Han, X.; Ju, C.; Bao, F.; Xu, C.; Zhu, Y.; Chen, Y. Sharing Reward Program Based on Face Consciousness in Social Media. Psychol. Res. Behav. Manag. 2022, 15, 1147–1166. [Google Scholar] [CrossRef]
- Xiang, K.; Xu, C.; Wang, J. Understanding the Relationship Between Tourists’ Consumption Behavior and Their Consumption Substitution Willingness Under Unusual Environment. Psychol. Res. Behav. Manag. 2021, 14, 483–500. [Google Scholar] [CrossRef]



| Situation | P Capacity Interruption Rate | Length of Transport Interruption | P Government Subsidy Ratio | DC Government Subsidy Ratio |
|---|---|---|---|---|
| A1 | 0.5 | 30 | 1 | 0 |
| A2 | 0.5 | 30 | 0 | 1 |
| A3 | 1 | 30 | 1 | 0 |
| A4 | 1 | 30 | 0 | 1 |
| A5 | 0.5 | 50 | 1 | 0 |
| A6 | 0.5 | 50 | 0 | 1 |
| A7 | 1 | 50 | 1 | 0 |
| A8 | 1 | 50 | 0 | 1 |
Publisher’s Note: MDPI stays neutral with regard to jurisdictional claims in published maps and institutional affiliations. |
© 2022 by the authors. Licensee MDPI, Basel, Switzerland. This article is an open access article distributed under the terms and conditions of the Creative Commons Attribution (CC BY) license (https://creativecommons.org/licenses/by/4.0/).
Share and Cite
Ju, C.; Zhao, J.; Li, K.; Bao, F.; Xu, C.; Ran, J. Supply Chain Recovery Strategies for High Demand Products Based on the Impact of Capacity and Transportation Disruptions. Systems 2022, 10, 88. https://doi.org/10.3390/systems10040088
Ju C, Zhao J, Li K, Bao F, Xu C, Ran J. Supply Chain Recovery Strategies for High Demand Products Based on the Impact of Capacity and Transportation Disruptions. Systems. 2022; 10(4):88. https://doi.org/10.3390/systems10040088
Chicago/Turabian StyleJu, Chunhua, Jiehao Zhao, Ke Li, Fuguang Bao, Chonghuan Xu, and Jiarui Ran. 2022. "Supply Chain Recovery Strategies for High Demand Products Based on the Impact of Capacity and Transportation Disruptions" Systems 10, no. 4: 88. https://doi.org/10.3390/systems10040088
APA StyleJu, C., Zhao, J., Li, K., Bao, F., Xu, C., & Ran, J. (2022). Supply Chain Recovery Strategies for High Demand Products Based on the Impact of Capacity and Transportation Disruptions. Systems, 10(4), 88. https://doi.org/10.3390/systems10040088


