
Optimization of the Decision-Making System for Advertising Strategies of Small Enterprises—Focusing on Company A


Department of Industrial and Systems Engineering, Dongguk University, Seoul 04620, Korea
*
Author to whom correspondence should be addressed.
†
These authors contributed equally to this work.
Systems 2022, 10(4), 116; https://doi.org/10.3390/systems10040116
Submission received: 30 June 2022
/
Revised: 2 August 2022
/
Accepted: 2 August 2022
/
Published: 6 August 2022
(This article belongs to the Special Issue Decision-Making Process and Its Application to Business Analytic)
Abstract
:In the post-COVID-19 era, the founding rates of micro enterprises and startups will increase due to the low youth employment rates and increased retirement of baby boomers. Therefore, the portion of small enterprises among all enterprises is expected to grow. The rapid change in consumption patterns due to the COVID-19 pandemic has accelerated the entry of small enterprises into the online advertising market. However, advertising costs spent in running the businesses are taking up a large portion of their sales budgets due to intense competition and various advertising platforms. This study examines the decision-making system to optimize advertising expenditures considering the difference in advertising costs depending on various media types and keywords based on limited advertising budgets for stable management of small enterprises. To this end, this study modeled the advertising system of small enterprise A (Company A) with system dynamics and used the Java-based simulation software AnyLogic. Through simulation modeling, we conducted optimization analysis of two scenarios, maximum buyers and minimum advertising costs, in the post-COVID-19 era. Based on the results, this study forecast the conditions for optimization of decision-making in each advertising platform.
1. Introduction
According to Article 2 (2) of the Framework Act on Small and Medium Enterprises, small enterprises in Korea are those where the annual sales are less than 12 billion KRW for manufacturing business and 1 to 8 billion KRW for 40 other types of businesses. These small enterprises include famous IT ventures. Here, micro enterprises must satisfy the requirements of small enterprises that the number of full-time workers is less than 10 and the number of full-time workers by business category, and so on, meets the standards prescribed by Presidential Decree. The United States defines micro enterprises as those with fewer than five full-time workers including the owner, and Japan as those with fewer than 20 full-time workers in general [1]. Micro enterprises in Korea account for about 85% of all enterprises, as at 2019 [2]. Experts are predicting that closure rates of micro and small enterprises will be increased by higher youth unemployment rates, lower youth employment rates, and economic recession caused by COVID-19. At the same time, there will be an increase in retirees among baby boomers as well as younger generations who choose to start a company instead of being employed, which will also increase the startup rates in the post-COVID-19 era [3].
The COVID-19 pandemic has created a non-contact culture and accelerated digital innovation. It is also rapidly changing the media usage and consumption patterns of consumers worldwide. This change will be established as the new normal of the post-COVID-19 era [4]. In addition, the advertising market is also rapidly changing. The online advertising market has already exceeded 50% of the global advertising market, and online display advertising and online search advertising are ranked first and second, respectively. Unlike the situation in Korea, global mobile advertising has shown a degrowth. The mobile advertising market in Korea has experienced explosive growth, overwhelming the PC online advertising market. Search advertising and display advertising are ranked first and second in Korea, respectively [5]. Previously, small and micro enterprises accounted for a huge portion of the online advertising market, but the competition has recently become more intense with large corporations quickly joining the market [6]. The advertising costs spent by small and micro enterprises in running their business are accounting for increasingly large portions of their operating expenses budget due to increased advertising costs of online platforms, intense competition, and emergence of various advertising platforms, which have become major difficulties in running a business [7]. Research has proved that, although increased advertising costs due to expansion of various online channels contribute to increased sales for micro enterprises, sales no longer increase two years after channel expansion [8], which raises the need to verify the effect of advertising costs.
However, micro enterprises lack a specialized marketing department or the manager’s expertise in advertising, which makes it difficult to make decisions about the complicated advertising standards of various platforms with a limited advertising budget. Therefore, they incur advertising costs along with consulting fees by using an external advertising consulting company [9] or focus only on one advertising platform. However, it is not easy to make rational choices or optimize advertising costs by analyzing the effects of executing advertising costs with these methods.
The main purpose of this study is to present a basic study for optimization of a multi-purpose decision system that considers the complex structure of various types of advertisements and detailed strategies of advertisements based on the limited advertising cost budget of small companies. This study was conducted by receiving actual advertisement analysis data in 2019 from small enterprise A (company A).
The rest of this paper is organized as follows. Section 2 provides the results of a literature review and how this study is differentiated from previous research. Section 3 analyzes the characteristics of actual data provided by Company A as well as advertising types. Section 4 reviews the constraints on media advertising considered by Company A, costs based on keywords, and difference in competition and presents the system dynamics model for analysis. Section 5 converts the system dynamics model from Section 4 into the simulation model with AnyLogic and conducts analysis. Section 6 examines each optimization scenario based on the simulation model. Section 7 discusses the strengths, weaknesses, and future research of this study. Finally, Section 8 provides the overall conclusions and limitations of this study as well as topics to expand in further research.
2. Literature Review
2.1. Previous Studies on Advertising Cost Optimization
Advertising cost optimization is studied based on the fact that each platform has different standards for the advertising system, different advertising effects and conversion rates depending on the billing plans (CPM, CPC, CPA, etc.) [10], different standards set by local and global consumers, and different optimization goals depending on the purpose of the advertiser.
Early studies were mostly limited to keyword search. Advertisers bid for keywords and advertise their products using those keywords [11]. With limited advertising budgets, advertisers generally bid so that the amount of money offered was equivalent to the return on investment (ROI) of keywords. This bidding heuristic is actually general and was also suggested in a different theoretical context [12]. Borgs et al. (2007) considered the issue of online keyword advertising auction with multiple bidders with limited budget and investigated natural bidding heuristics in which the advertiser optimizes utility by balancing the ROI throughout all keywords [13].
Archak et al. (2010) used the Markov decision process to optimize the correlation conditions between CPC of online advertising campaigns and advertising exposure [14]. The current study used the correlation between advertising exposure and cost through the Markov decision process but was limited to keyword advertising, with fixed analysis without change in cost by keyword.
Lee et al. (2016) examined optimization of the advertising system considering price fluctuations due to competition over advertising keywords [15]. The purpose of this study is to maximize advertising exposure with limited budget based on the cost and effect of keywords. This study presented only the optimization model for the single advertising platform using CPM (cost per mille).
Hwang et al. (2019) studied cost-effective keyword selection methods based on a case analysis of online search advertising performance of a specific company in Korea [16]. This study suggested analysis at the level of key attributes that form keywords instead of analysis at the keyword level.
Liu et al. (2017) suggested an optimization method based on role-based collaboration (RBC) and the E-CARGO (the Environments—Classes, Agents, Roles, Groups, and Objects) model to rationalize and maximize marketing investments in keyword search bidding [17]. The authors verified their suggestion via a simulation experiment, although the study was limited to search word advertising.
Yang et al. (2019) conducted research on decision-making about advertising expenditure, which was conducted divisionally according to the advertising system of each platform [18]. This study presented a forecasting model with portfolios based on statistical modeling from the advertiser’s perspective and examined optimization plans and strategies based on empirical data. However, it has limitations in that data such as price per keyword and click rate were not obtained and, thus, only has predictive values and the optimization system is built based on short-term data.
As various advertising platforms and styles are developed and activated, studies began to investigate advertising cost optimization that comparatively analyzed various advertising platforms and styles. Yoon et al. (2017) presented the weight of each platform for advertising in each generation on all platforms with the main goal of examining the reach in three advertising platforms such as TV, mobile, and PC and eliminating redundant advertising costs [19]. This study considered only fixed costs to increase the effectiveness of eliminating redundant costs but did not consider various other forms of advertising expenditure. Rautela et al. (2016) built a model for budget minimization and exposure to optimize the offline advertising portfolio model and determined the optimum combinations of advertising media [20]. This study considered advertising effects of each location as well as various advertising forms, but it failed to provide optimization plans for advertising costs in terms of change in costs and effects in each period as it analyzed only the short-term advertising system with fixed expenditures.
Recent studies have suggested various methods and models for optimizing advertising costs, but they have been conducted focusing on optimizing advertising costs in specific domains or specific media rather than optimizing advertising costs in various advertising platforms. Yan Long. et al. (2022) presented a mathematical model explaining the relationship between advertising inputs and corporate earnings by analyzing simultaneous dynamic activities in advertising competition between the two companies based on game theory [21]. Yosi Luzon. et al. (2022) conducted a study on SNS (Facebook, Instagram) to optimize advertisers’ spending over time on viewers in addition to optimizing budget allocation over time for advertising campaigns [22]. Alessandro Nuara et al. (2022) studied the co-bidding/daily budget optimization and automation of online advertising campaigns for publishers who allocate daily advertising costs. In particular, this study presents an algorithm with theoretical guarantees that can be used in practice when there is a lack of published data in auction-type bids [23].
2.2. Differentiation from Previous Studies
As the form and billing standard of the online advertising platform became more diverse since 2015, the complexity of the decision-making process also increased, which resulted in more constraints on making each decision. With increased complexity, previous studies focused on optimization of one field or on various forms of advertising and platforms in a restricted environment. Some studies convert the heuristic view into a simulation model. However, there is insufficient research on assessment of advertising costs in each advertising platform and potential customer inflow through actual long-term data and the decision-making system through advertising cost optimization according to the advertising purpose of companies. Furthermore, there is also insufficient research on the characteristics of the Korean advertising market and on advertising costs depending on firm size.
Therefore, this study is differentiated from previous research in that it examines various advertising platforms in the Korean online advertising market based on actual data provided by Company A. Furthermore, it considers various standards of advertising expenditure, and investigates simulation models considering long-term click rates, traffic, and advertising cost data as well as optimization models for making decisions on advertising systems.
3. Analysis of Company A’s Advertising Type and Features
Company A is an education-related company founded in 2011 providing online services for users in Korea and overseas and is one of the top companies in the industry. As of 2019, the ratio of Korean and global buyers of A is 7:3, and the percentage of advertising is also high for the Korean advertising platform.
A advertises on Naver (Korea’s No. 1 search engine), YouTube, SNS (Instagram, Facebook, etc.), in press, and offline. Here, offline advertising refers to events such as seminars and expositions and is, therefore, excluded from this study.
Company A’s advertising standards for each advertising platform are as follows.
- For Naver search engine ads, only advertise with major keywords in the industry (the exposure ranking must be the top three for each keyword);
- Banner advertising is implemented for YouTube and SNS;
- Online article banner advertising is implemented for the press.
The main features of each advertising platform Company A advertises on are summarized in Table 1.
We selected and analyzed five advertising keywords by classifying Naver into the PC and mobile version, where the keywords are different. These keywords have different cost-per-click every month depending on keyword competition, as well as different inflow from keyword search. In addition, in search engine advertising, users click on ads through keyword search and, thus, has high ad targeting.
There is a price difference due to keywords for SNS and YouTube, but since Company A bids for keywords in the education industry, the competition is not intense and, thus, there is no large price difference in keywords on SNS and YouTube. Moreover, although there is an ad-targeting function, the targeting is limited through related search instead of direct search such as Naver, which is why ad targeting is relatively lower than Naver.
Press advertising has a fixed cost and, thus, does not have cost-per-click after the monthly payment of advertising costs. Moreover, advertisements are presented on articles produced by search results based on keyword search, and, thus, ad targeting is high. Press advertising is classified into press that belongs to Naver News search and that belonging to other search engines, or is searched as a web document.
4. System Dynamics Analytical Model
There are various methods for optimization research on decision-making. S. Zhang et al. (2021) conducted a metaheuristic-based study for a multi-objective decision system (MDMS) [24], and in the study of A. Tazikiková et al. (2021) conducted a study using a multi-objective optimization (MOO) algorithm [25]. Y. Zhang et al. (2002) studied using system dynamics for the resource allocation system of elderly care welfare with high complexity [26].
Decision-making on advertising expenditures has different features and cost standards depending on the advertising platform and has high causal relationship and complexity in exchange of effects. Therefore, we used system dynamics to analyze Company A’s advertising process and investigate decision optimization.
System dynamics is a methodology to dynamically examine changes in existing phenomena comprised of complicated relationships from the perspective of circular causality [27]. System dynamics focuses on operational thinking. Operational thinking is focused on the process of change, such as how change actually occurs. In other words, it is to determine the mechanism of system dynamics [28]. Therefore, system dynamics is top–down modeling at the system level. The results of modeling analysis on the process of Company A’s advertising expenditure through system dynamics are summarized in this section.
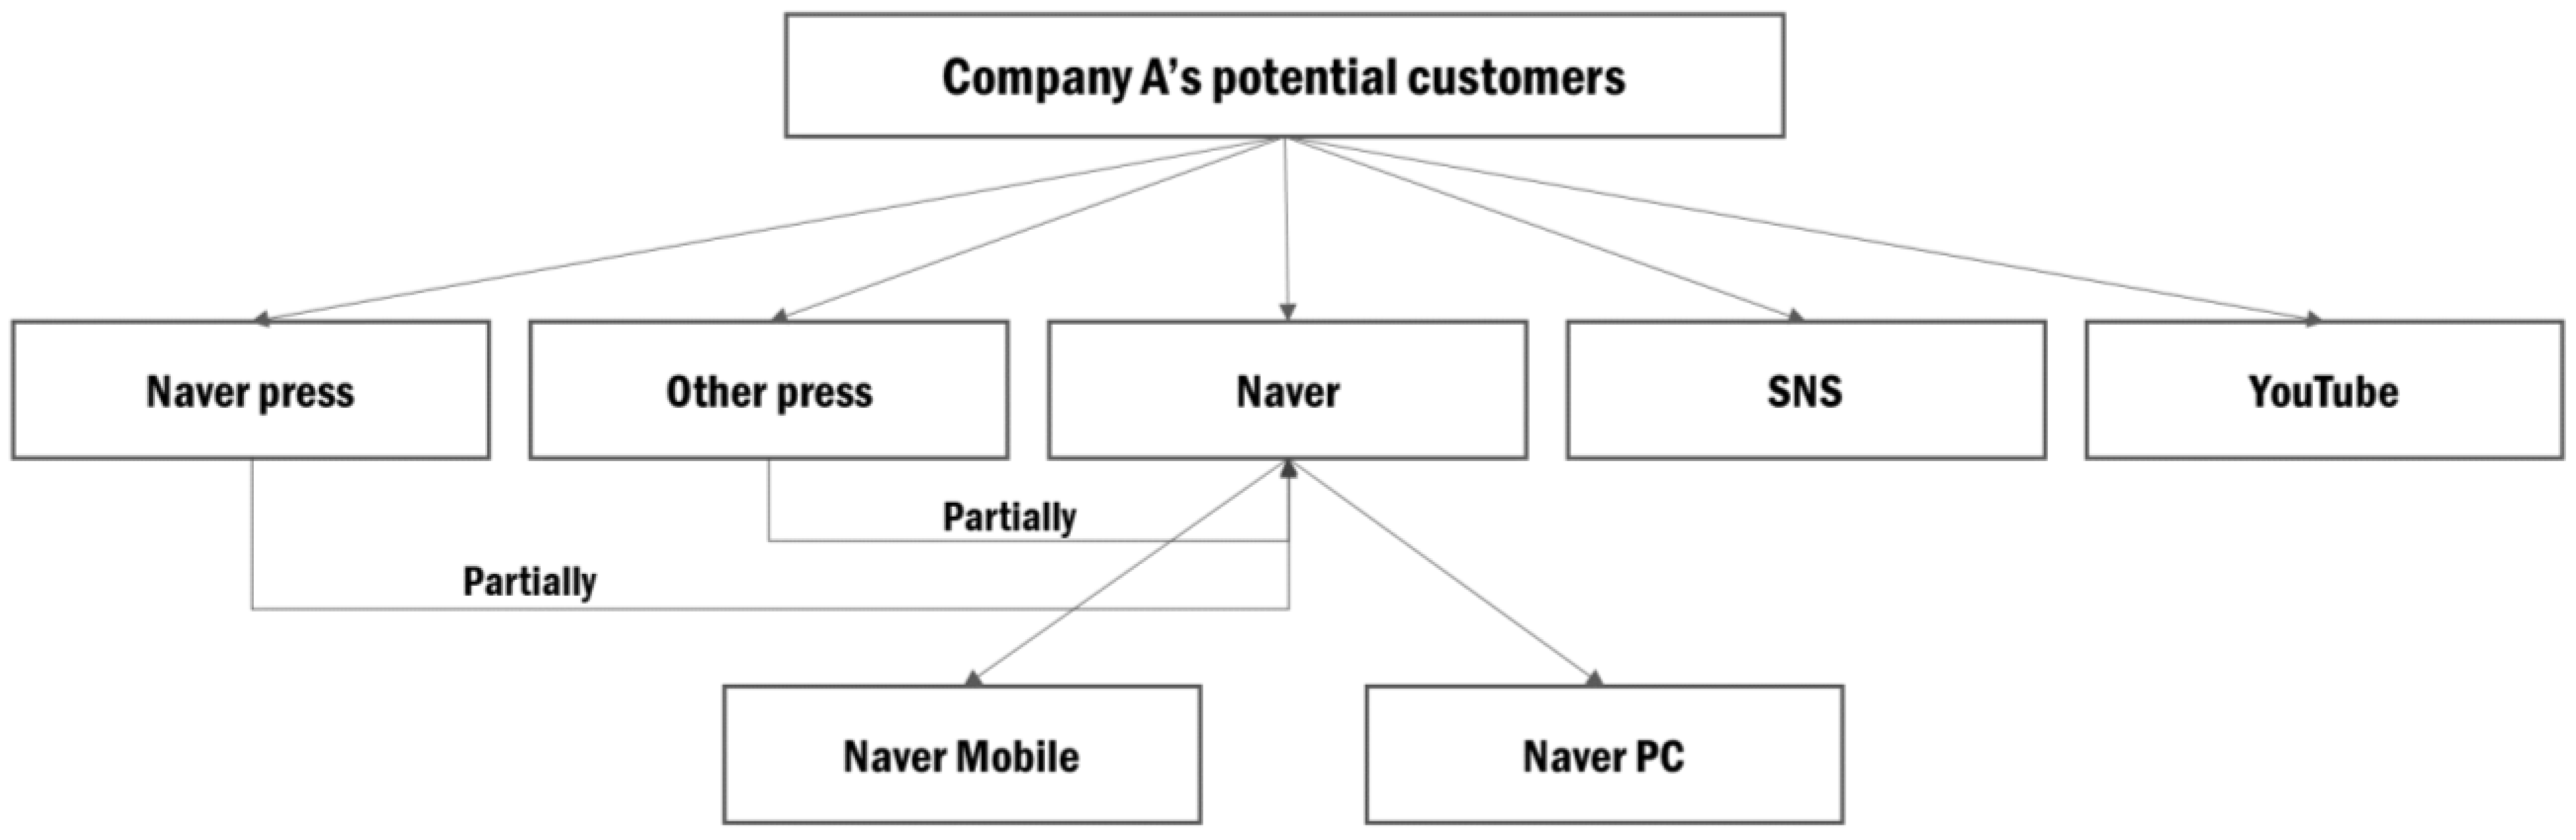
4.1. Potential Customers
Potential customers basically approach via press, Naver, YouTube, and SNS. Some customers who saw an advertisement in the press tend to go to Naver and search it online. This indicates that, since A does not link their website in the press for publicity, customers have to do the search again. The flow of potential customers who may access the website through Company A’s advertisement is presented in Figure 1.
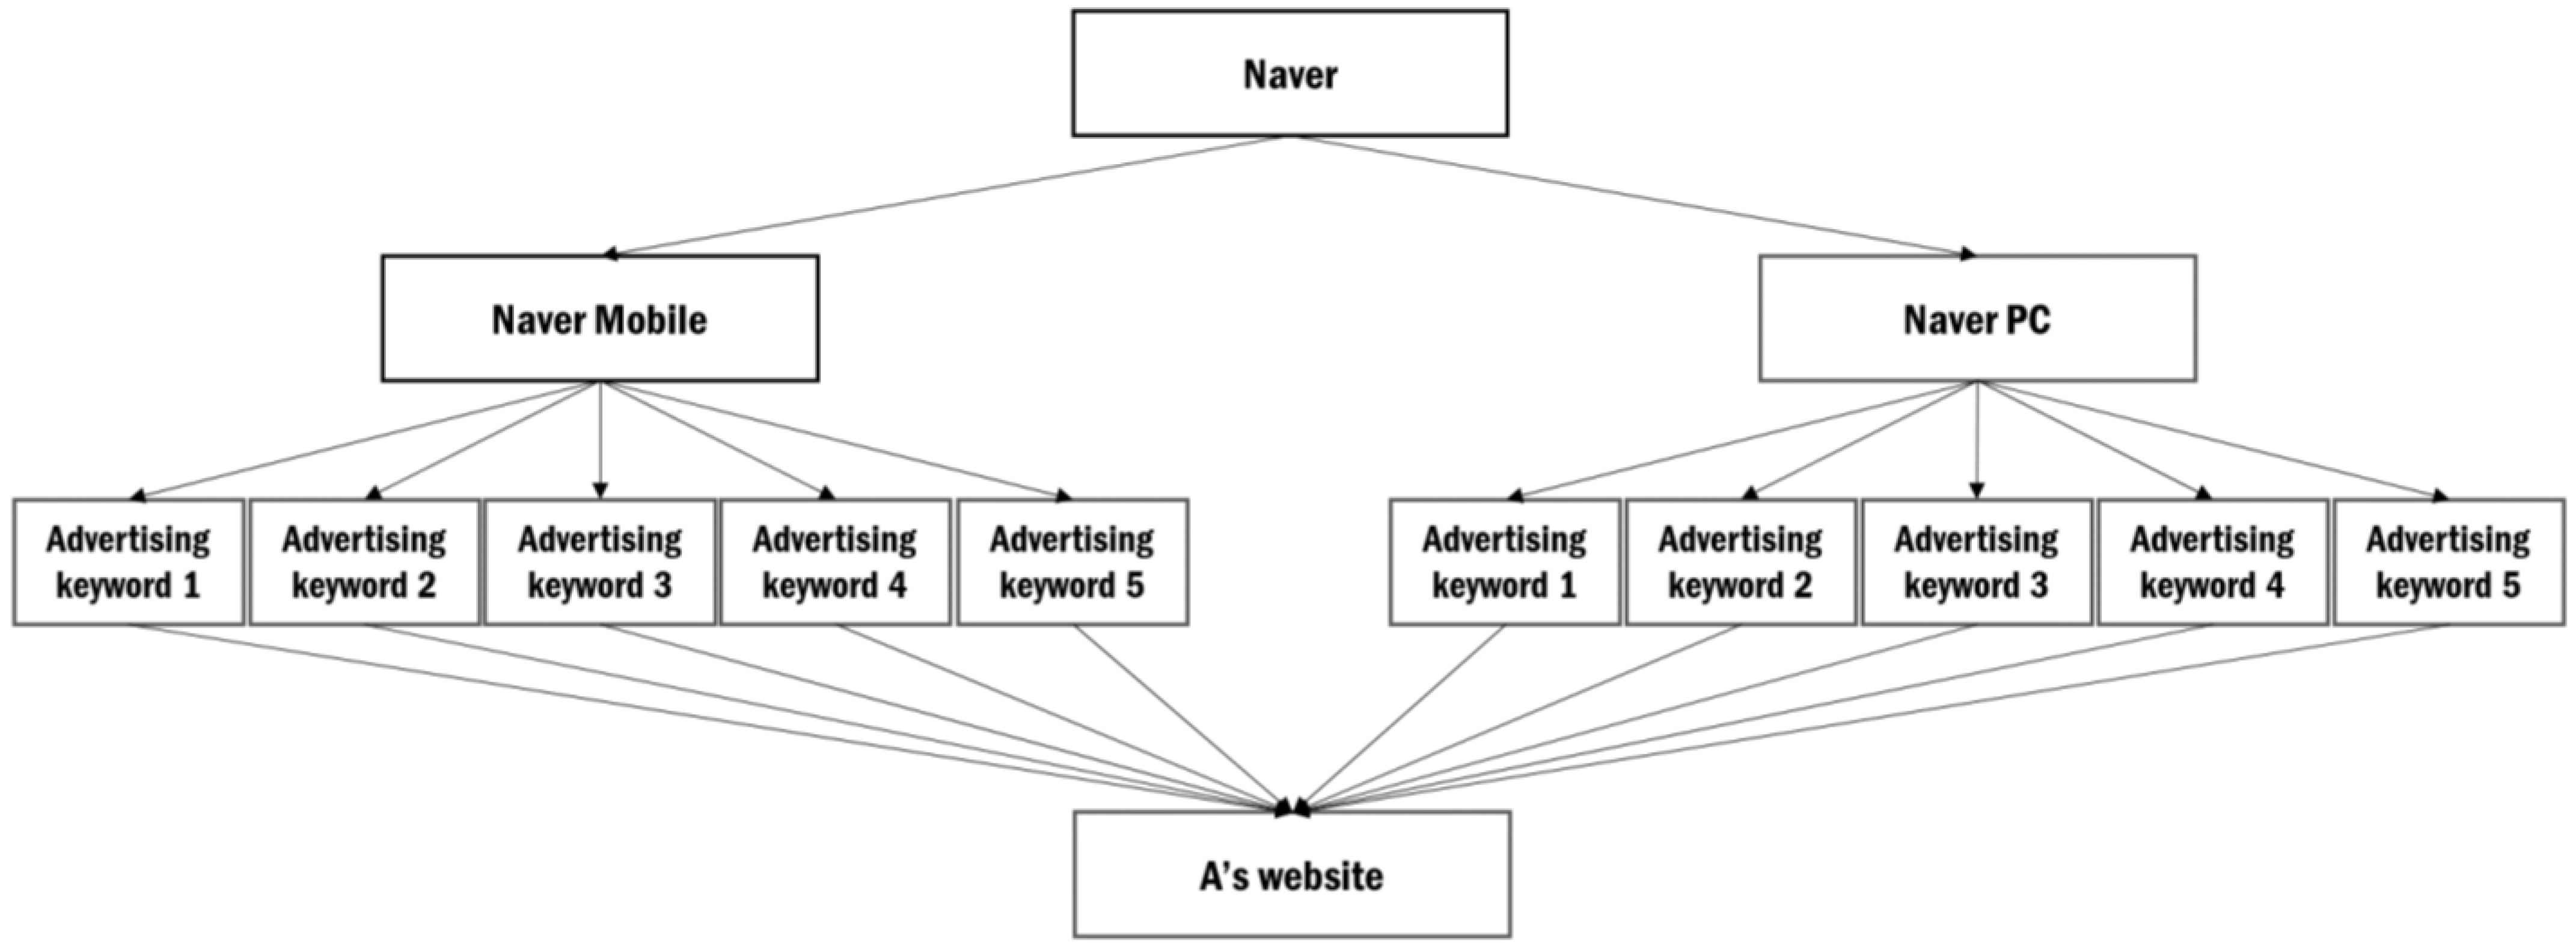
4.2. Entry through Naver Ads
The model for entry into Company A’s website through Naver Ads is illustrated in Figure 2. Naver has different top keywords for Naver mobile and PC, as well as different values and price fluctuations due to competition, and, thus, the modeling was done separately.
4.3. Entry through SNS and YouTube
The model for entry into Company A’s website through SNS and YouTube is illustrated in Figure 3.
4.4. After Entry into Company A’s Website
The customer flow after entry into Company A’s website through various advertisements is illustrated in Figure 4. Visitors are classified into those who revisit by entering the URL(Uniform Resource Locator) after accessing Company A’s website, those who put off purchase, those who make purchase, and those who go back to being potential customers with mere interest.
5. Simulation Model for Optimization
We converted the system dynamics model suggested in Section 4 into a simulation model using AnyLogic. The final results are presented in Figure 5. The numerical models for this simulation are summarized after explaining the variables and parameters.
5.1. Classification of Traffic on Advertising Platforms
We analyzed the traffic on advertising platforms used by Company A and conducted the modeling. Stocks, dynamic variables, parameters, and flows used in the simulation are reported in Table 2.
We entered 1 million randomly for the number of potential customers. We then summarized advertising exposure traffic data provided by each advertising platform and used the data for modeling. Potential customers move to each advertising platform, and we entered the average monthly traffic on each advertising platform provided by Company A.
For advertising in the form of an article, customers cannot enter the website by clicking, and, thus, the inflow rate data for this is not provided. Therefore, the inflow rate is assumed based on interviews with experts in media marketing.
For press advertisements registered on Naver search, we entered 0.3 for NPressToN, assuming that about 30% of the traffic may see keywords related to A by entering through the Naver search engine. For other press advertisements, we entered 0.2 for OPressToN, assuming that about 20% of the traffic may enter through the Naver search engine.
N_DR(Naver search engine), NP_DR(press registered on Naver), OP_DR(other press), SNS_DR, and YouTube_DR are parameters to use in the optimization stage with the default value of 1. Here, 1 indicates that the existing traffic is assigned 100%. The figure 0.8 indicates that it receives 20% lower traffic. Lowering the traffic indicates reducing the portion of advertising.
5.2. Detailed Classification of Traffic on the Naver Advertising Platform
5.3. Naver Desktop Keyword Classification
For Naver desktop advertising, we classified the traffic of each keyword and conducted the modeling so that users move to Company A’s website through monthly click rate and monthly cost-per-click. Stocks, dynamic variables, parameters, and flows used in the simulation are reported in Table 4. Potential customers entering through Naver desktop click on the advertisements through keyword search. ND_SearchRate_Ki (i = 1, 2, 3, 4, and 5) refers to monthly data for traffic classification by keyword. ND_ClickRate_Ki (i = 1, 2, 3, 4, and 5) refers to monthly click rate data by desktop keyword of Company A on the Naver advertising system.
5.4. Naver Mobile Keyword Classification
For Naver mobile advertising, we classified the traffic of each keyword and conducted the modeling so that users move to Company A’s website through monthly click rate and monthly cost-per-click. Stocks, dynamic variables, parameters, and flows used in the simulation are presented in Table 5. As with Naver desktop, potential customers entering through Naver mobile click on the advertisements through keyword search. There are keywords that are not redundant on Naver desktop and mobile. NM_SearchRate_Ki (i = 1, 2, 3, 4, and 5) refers to monthly data for traffic classification by keyword. NM_ClickRate_Ki (i = 1, 2, 3, 4, and 5) refers to monthly click rate data by mobile keyword of A on the Naver advertising system.
5.5. Final Traffic of Company A’s Website
We analyzed the traffic of advertising platforms where Company A advertises and conducted modeling. Stocks, dynamic variables, and flows used in the simulation are reported in Table 6. The website is accessed by clicking on advertisements on all advertising platforms. SNS and YouTube were modeled so that potential customers enter the website through the monthly click rate data provided by each advertising platform in traffic classification.
Company A’s conversion rate among potential customers who entered was 20% in 2019 on average, and thus we set Buyer, which is the stock that indicates purchasing customers, as 20% of all website visitors. Since advertising is discontinued once the budget is used up, additional conditions are entered to prevent more inflow in Buyer.
5.6. Calculation of Advertising Costs
This study provides the optimization model within limited advertising budget, and thus there must be a model on handling expenses. In this section, we conducted modeling to show the ultimate advertising costs that occur on each advertising platform. Stocks, dynamic variables, parameters, and flows used in the simulation are presented in Table 7. Budget refers to Company A’s advertising budget, and we entered 75 million KRW, which is the online advertising platform budget out of total advertising budget of Company A. Paid, which is the flow, is the sum of all advertising costs that occur in all platforms. Conditions are added so that advertising is discontinued, and no more costs occur when the budget is 0.
5.7. Numerical Model
The numerical models developed by summarizing the variables and parameters analyzed in Section 5.1, Section 5.2 , Section 5.3, Section 5.4, Section 5.5, Section 5.6 are presented below.
6. Optimization Analysis
This section provides the results of optimization and sensitivity analysis according to the constraints and purpose of decision-making based on simulation results.
6.1. Simulation Results
6.2. Optimization Scenarios
The optimization scenarios requested by A are as follows.
- ▪
- Scenario 1: Optimization to generate maximum buyers at the current cost;
- ▪
- Scenario 2: Optimization to maintain the same number of buyers while minimizing advertising costs if there is economic decline or slow-down of economic recovery in the post-COVID-19 era.
We, therefore, performed optimization simulations for each scenario.
6.3. Optimization Results and Analysis for Scenario 1
The optimization goal in this scenario is to optimize the parameters to generate maximum buyers with limited advertising budget. The numerical model applied in this optimization scenario is as follows.
The constraints for optimization analysis are as follows.
- ▪
- Company A limits the percentage of press to maximum 30%. In addition, since press advertising registered on Naver helps increase brand reliability, it can be reduced by a maximum 50%. Other press can be reduced by 70%;
- ▪
- Company A’s SNS advertising with weak ad targeting is to be reduced by a maximum 90% and minimum 30%. YouTube advertising helps promote brand awareness but actually has low conversion rates, and thus is limited to a maximum 50% decrease and maximum 50% increase;
- ▪
- The portion of Naver is limited to a maximum 300% increase and maximum 90% decrease, and the weights of Naver desktop traffic and Naver mobile traffic must always add up to 1;
- ▪
- Conditions must be added so that the advertising budget is not 0 because advertising should not be discontinued due to lack of budget;
- ▪
- Conditions must be added so that the stocks of each platform are not simulated below 0.
The optimization results of Scenario 1 are presented in Table 9.
The optimization results can be analyzed as follows.
- Press registered on the Naver search engine must be reduced by about 40% for advertising;
- Other press advertising must be reduced by about 70% for advertising;
- The portion of Naver Ads must be increased by about 300%, and the ratio of desktop advertising and mobile advertising must be controlled to 17:82;
- YouTube advertising must be increased by 50%, and SNS reduced by 30%;
- By meeting the above conditions, the expected number of buyers will increase by at least 1.9 times compared to the current advertising method.
6.4. Optimization Results and Analysis for Scenario 2
The optimization goal in this scenario is to minimize total advertising costs while maintaining the current number of buyers when there is economic decline or slow-down of economic recovery in the post-COVID-19 era. The numerical model applied in this optimization scenario is as follows.
The constraints for optimization analysis are as follows.
- ▪
- Company A limits the percentage of press to a maximum 30%. In addition, since press advertising registered on Naver helps increase brand reliability, it can be reduced by a maximum 50%. Other press can be reduced by 70%;
- ▪
- Company A’s SNS advertising with weak ad targeting is to be reduced by a maximum 90% and minimum 30%. YouTube advertising helps promote brand awareness but actually has low conversion rates, and, thus, is limited to a maximum 50% decrease and maximum 50% increase;
- ▪
- The portion of Naver is limited to a maximum 300% increase and maximum 90% decrease, and the weights of Naver desktop traffic and Naver mobile traffic must always add up to 1;
- ▪
- The number of customers is limited to over 10,000 based on 10,654, which is the result of the simulation.
- ▪
- Conditions must be added so that the advertising budget is not 0 because advertising should not be discontinued due to lack of budget;
- ▪
- Conditions must be added so that the stocks of each platform are not simulated below 0.
The optimization results of Scenario 2 are presented in Table 10.
The optimization results can be analyzed as follows.
- Press registered on the Naver search engine must be reduced by about 48% for advertising;
- Other press advertising must be reduced by about 62% for advertising;
- The portion of Naver Ads must be increased by about 165%, and the ratio of desktop advertising and mobile advertising must be controlled to 12:88;
- YouTube advertising must be maintained as it is, and SNS must be reduced by about 90%;
- By meeting the above conditions, the current number of buyers can be similarly maintained with a 40% decrease in advertising costs.
7. Discussion
Research on advertising cost optimization is one of the areas with high complexity. There are differences in advertisement settings between various advertisement platforms, and there are also differences in keyword bidding methods. In addition, online advertisements have a systematic difference from offline advertisements. Unlike offline advertisements that have single directional characteristics that are delivered only to consumers, online advertisements have interactive characteristics that can track advertising results such as viewers, click, and visiting websites. Therefore, since it is possible to track the results of advertisements, the possibility of deriving optimization according to various purposes is higher than that of offline advertising optimization. Moreover, the existing advertising market is rapidly changing as the advertising environment accounts for more portion of online advertising due to COVID-19.
In addition, as the services of SNS, online media, and online search become more diverse, online promotion is difficult to produce an effect with just one channel promotion. For large companies with sufficient advertising budgets, the desired promotional effect can be obtained without detailed optimization. However, in the case of small enterprises, there is difficulty in maximizing publicity on a limited budget. Currently, small enterprises have increased their share of advertising costs, forcing them to invest more than 50% of their sales. For these small enterprises, I think an approach to how system dynamics modeling and simulation solve complex decisions is important. Therefore, we think that research on optimization of advertising costs has no choice but to differ in research methods depending on the research perspective, such as advertising type or corporate advertising purpose.
In previous studies, there were many studies focusing on advertising methods and keyword auctions. In addition, previous studies have often conducted only theoretical modeling designs, not actual data. In terms of applying the raw data of advertisements provided by companies, we could confirm that previous studies mainly optimized in a single network advertisement type.
Through this process, we found that it was difficult to generalize and compare other studies that studied online advertising. It is possible to introduce information on what methods of studying each other or the advantages of those methods. However, we thought it was not reasonable to compare research methods or results by creating its own or the same criteria for studies with different criteria for single advertising types and optimization. In addition, it was not reasonable to compare different complex corporate requirements with the same criteria in the studies conducted by analyzing the entire advertising network. This is because the value of optimization can be evaluated according to each advertising purpose, and the value of various decision-making methodologies can be also evaluated according to the purpose.
As a result, in this study, it was necessary to develop a system dynamics model by analyzing various factors of various advertising types. In particular, considering the constraints of small businesses, such as budget, personnel, and analysis of advertising results, it was intended to propose a system that can optimize advertising strategies that require high-complexity decision-making with only advertising raw data. As a result, an optimized strategy that can be applied to each advertisement type was derived according to the advertising purpose of the company.
8. Results and Further Research
The purpose of this study was to present a methodology that can derive optimization from complex decision systems of various online advertising types. This study provided a decision-making system for Company A’s advertising strategies using system dynamics and AnyLogic. For the analytical model, system dynamics was used to model the process of entering Company A’s website and making purchases with focus on key factors, such as traffic, clicks, and costs, depending on the features of each advertising platform. Simulations for optimization were conducted using AnyLogic based on this modeling, and optimization was performed according to the scenarios for Company A’s decision-making. As a result, it was found that Company A can increase sales by 1.9 times through optimization at a similar level of advertising costs. Moreover, Company A can reduce about 40% of costs with a similar number of buyers. Therefore, it was proved that optimization through simulation is valuable when small enterprises make decisions about advertising strategies.
The raw data of advertisements is often confidential in terms of business strategy, so there is a practical limitation that it is not easy to secure data. Therefore, in previous studies, there are not many papers that derive optimization by directly simulating actual data. Therefore, this study, which was conducted based on actual advertisement data and detailed regulations of each advertisement type, is considered to be of high value at this point. In addition, online advertising will continue to develop new and diverse forms of advertisements. If various types of advertisements increase, the complexity of advertising strategies will increase. In this case, unlike most large companies that operate professional marketing departments, small enterprises will face difficulties in establishing optimized strategies within limited budgets. Therefore, this study will help in that small enterprises with these difficulties will be able to establish optimized advertising strategies through applying this study. Finally, the government encourages to make start-up and small enterprises as policy, and provides initial funds. Therefore, this study will be helpful to establish an online advertising strategy suitable for the purpose by applying the optimization method suggested in this study to startups and small businesses that must simultaneously conduct various types of advertisements with limited advertising budgets.
The limitations of this study are as follows. Firstly, this study was conducted without the return of expenditure costs incurred by negative clicks and the factors of fluctuations caused by exchange rates. Secondly, the raw data about advertisements has a practical limitation in that it is difficult to receive data from multiple companies because this data is treated confidentially by most companies. This study also has limitations in that there are areas of data that should not be disclosed to the outside, and some areas of data cannot be compared with past advertising results because the raw data on past advertising results are not provided. Finally, even if the advertising types are the same, it is difficult to analyze the advertising results based on the same standard because the company’s brand power, detailed strategies for each advertising type, and advertising budgets are different. Therefore, there is a limitation in conducting research that generalizes advertisement data of other companies and compares them with each other.
As a future study of this subject, we propose the following. First, we present an optimization study applying both online and offline advertisements. In addition, it is judged that a complex decision-making study is possible considering changes in detailed factors of advertising, such as the number of keywords and the number of advertising media. Third, it is expected that it will be able to expand to research on optimization that includes quantitative factors of online advertising and qualitative factors, such as brand awareness and customer satisfaction. Finally, based on this study, we think it is necessary to develop an advertising strategy framework that is convenient for small businesses in various fields to use for each of their purposes.
Author Contributions
Conceptualization, methodology, software, validation, writing—original draft, J.J.; formal analysis, investigation, resources, writing—review and editing D.H.; visualization, project administration, S.Y. All authors have read and agreed to the published version of the manuscript.
Funding
This research received no external funding.
Institutional Review Board Statement
Not applicable.
Informed Consent Statement
Not applicable.
Data Availability Statement
Not applicable.
Acknowledgments
The raw data of online advertisement for research was supported by Brick&Soft.
Conflicts of Interest
The authors declare no conflict of interest.
References
- Nam, Y.H.; An, S.Y.; Kim, S.D. The Effects of CEO′s Capacity on Business Performance in Small Business-Moderating Effects of Social Capital. J. Channel Retail. 2021, 26, 25–51. [Google Scholar] [CrossRef]
- e-Index Micro Enterprises Status; Statistics Korea: Seoul, Korea, 2019.
- Report on Prospects of Change in the Self-Employment Ecosystem and Strategies in the Post-COVID-19 Era; Korea Small Business Institute: Seoul, Korea, 2020.
- Hwang, J. Untact Consumption Trend Triggered by COVID-19 and Future Prospects; Future Horizon: Sejong, Korea, 2020; pp. 28–35. [Google Scholar]
- Korea Advertising Expenditure Research; KOBACO: Seoul, Korea, 2020.
- Promoting SNS Marketing in the COVID-19 Pandemic; Korea Industrial Marketing Institute Editorial Department: Seoul, Korea, 2020; Volume 54, pp. 16–29.
- Survey on Businesses in Online Platforms; The Korea Federation of SMEs (KBIZ): Seoul, Korea, 2021.
- Kang, S.H.; Lee, C.S. The Effect of Channel Expansion on Sales in Small Business: Focusing on Online Channel Subscription Period. Korea Res. Acad. Distrib. Manag. 2018, 21, 43–50. [Google Scholar]
- Jun, L.B.; Young, P.M. Online search advertising platforms and protection for small-sized enterprises. Korea Distrib. Law Assoc. 2018, 5, 135–193. [Google Scholar]
- Kim, D.H.; Moon, T.H.; Kim, D.H. System Dynamics; Daeyoung Moonhwasa Publishing Company: Seoul, Korea, 1999. [Google Scholar]
- Varian, H. Position auctions. Int. J. Ind. Organ. 2007, 25, 1163–1178. [Google Scholar] [CrossRef]
- Rusmevichientong, P.; Williamson, D. An adaptive algorithm for selecting profitable keywords for search-based advertising services. In Proceedings of the 7th ACM Conference on Electronic Commerce 2006, Ann Arbor, MI, USA, 11–15 June 2006. [Google Scholar]
- Borgs, C.; Chayes, J.; Immorlica, N.; Jain, K.; Etesami, O.; Mahdian, M. Dynamics of bid optimization in online advertisement auctions. In Proceedings of the 16th International Conference on World Wide Web (WWW ‘07), Banff, AB, Canada, 8–12 May 2007; pp. 531–540. [Google Scholar]
- Archak, N.; Mirrokni, V.; Muthukrishnan, S. Budget optimization for online advertising campaigns with carryover effects. In Internet and Network Economics. WINE 2012; Lecture Notes in Computer Science; Springer: Berlin/Heidelberg, Germany, 2012; Volume 7695, pp. 86–99. [Google Scholar]
- Lee, K.C.; Jalali, A.; Dasdan, A. Real time bid optimization with smooth budget delivery in online advertising. In Proceedings of the Seventh International Workshop on Data Mining for Online Advertising 2013, Chicago, IL, USA, 11 August 2013; pp. 1–9. [Google Scholar]
- Hwang, J.; Min, D.; Kim, A.J. Selection of Effective Keywords for Online Search Advertising Using Attribute-based Clustering Analysis. J. Korean Inst. Ind. Eng. 2019, 45, 451–464. [Google Scholar]
- Liu, D.-N.; Wu, X.L.; Lu, M.-J.; Teng, S.-H.; Liang, L.; Hou, Y. Portfolio Prediction of Online Advertisement Keywords’ Biding via Role Based Collaboration. In Proceedings of the Ch ineseCSCW’17, Chongqing, China, 22–23 September 2017. [Google Scholar]
- Yang, H.; Hong, J.; Kim, W. An Empirical Study on Statistical Optimization Model for the Portfolio Construction of Sponsored Search Advertising (SSA). J. Intell. Inf. Syst. 2019, 25, 167–194. [Google Scholar]
- Yoon, S.; Choi, S.M. Total Exposure Effects of TV/Online Video Advertising and Optimizing Advertising Budget Allocation: Using 3-Screen (TV, PC, Mobile) Single Source Panel Data. Korean J. Advert. Public Relat. 2017, 19, 180–209. [Google Scholar]
- Rautela, A.; Mohan, N.; Sharma, S.K.; Bhardwaj, P. Optimization Model for Advertisement Decision. In Proceedings of the 2016 International Conference on Industrial Engineering and Operations Management, Kuala Lumpur, Malaysia, 8–10 March 2016. [Google Scholar]
- Long, Y.; Zhao, H. Marketing Resource Allocation Strategy Optimization Based on Dynamic Game Model. J. Math. 2022, 2022, 4370298. [Google Scholar] [CrossRef]
- Luzon, Y.; Pinchover, R. Eugene Khmelnitsky, Dynamic budget allocation for social media advertising campaigns: Optimization and learning. Eur. J. Oper. Res. 2022, 299, 223–234. [Google Scholar] [CrossRef]
- Nuara, A.; Trovò, F.; Gatti, N.; Restelli, M. Online joint bid/daily budget optimization of Internet advertising campaigns. Artif. Intell. 2022, 305, 103663. [Google Scholar] [CrossRef]
- Zhang, S.; Zhang, J.; Meng, M.; Chen, P.; Liu, X.; Liu, G.; Gu, Z. A Multi-Objective Decision Making System (MDMS) for a Small Agricultural Watershed Based on Meta-Heuristic Optimization Coupling Simulation. Water 2021, 13, 1338. [Google Scholar] [CrossRef]
- Tažiková, A.; Struková, Z.; Kozlovská, M. The Analysis of Small Investors’ Demands on a Thermal Insulation System for a Family House: A Case Study. Sustainability 2021, 13, 2491. [Google Scholar] [CrossRef]
- Zhang, Y.; Zhang, M.; Hu, H.; He, X. Research on supply and demand of aged services resource allocation in China: A system dynamics model. Systems 2002, 10, 59. [Google Scholar] [CrossRef]
- Moon, T.H. Issues and Methodological Status of System Dynamics. Korean Syst. Dyn. Rev. 2002, 3, 1. [Google Scholar]
- Oh, C. Study of the characteristics of Internet keyword advertising’s rate system and it’s unfair click types. Korean J. Advert. 2008, 19, 7–27. [Google Scholar]
Figure 1.
The flow of Company A’s potential customers.

Figure 2.
The model for entry through Naver Ads.

Figure 3.
The model for entry through SNS and YouTube.
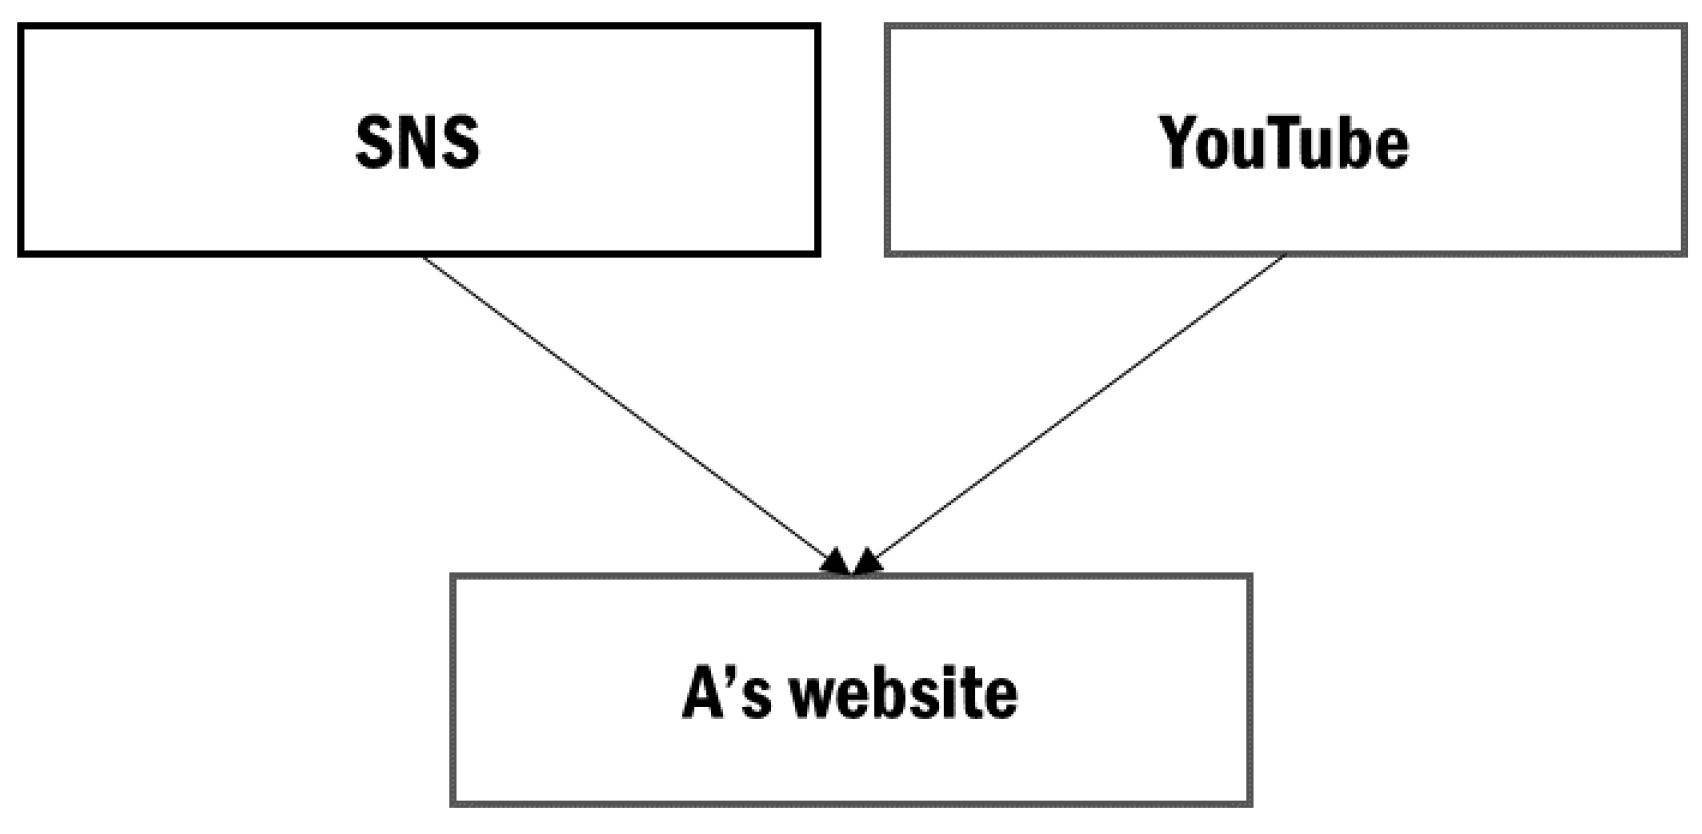
Figure 4.
Customer flow after entry into Company A’s website.

Figure 5.
Simulation model using AnyLogic.


Table 1.
Main features of each advertising platform Company A uses.
| Feature | Naver | Naver Mobile | SNS | YouTube | Press |
|---|---|---|---|---|---|
| Price difference due to keyword competition | O | O | O | O | O |
| Cost-per-click | O | O | O | O | O |
| Ad targeting | High | High | Low | Low | High |
Table 2.
Stocks, dynamic variables, and flows connected to PotentialCustomer.
| Feature | Description | |
|---|---|---|
| Stock | PotentialCustomer | 1,000,000 persons |
| NaverPress | Press advertising platform registered on Naver | |
| Naver_Search_Customer | Naver advertising platform | |
| Other_Press | Press advertising platform not registered on Naver | |
| SNS | SNS advertising platform | |
| YouTube | YouTube advertising platform | |
| Dynamic Variable | N_Press_Traffic | Average monthly traffic exposed in press advertising registered on Naver |
| N_Traffic | Average monthly traffic exposed on Naver Ads | |
| O_Press_Traffic | Average monthly traffic exposed in press advertising not registered on Naver | |
| SNS_Traffic | Average monthly traffic exposed on SNS advertising | |
| YT_Traffic | Average monthly traffic exposed on YouTube advertising | |
| NPressToN | =0.3 | |
| OPressToN | =0.2 | |
| N_DR | =1 | |
| NP_DR | =1 | |
| OP_DR | =1 | |
| SNS_DR | =1 | |
| YouTube_DR | =1 | |
| Flow | F_N_Press | =N_Press_Traffic |
| F_Naver_Total | =N_Traffic | |
| F_OtherPress | =O_Press_Traffic | |
| F_SNS_Total | =SNS_Traffic | |
| F_YouTube_Total | =YT_Traffic |
Table 3.
Stocks, dynamic variables, and flows connected to Naver_Search_Customer.
| Feature | Description | |
|---|---|---|
| Stock | NaverDesktop | Naver desktop advertising |
| NaverMobile | Naver mobile advertising | |
| Dynamic Variable | ND_DR | =0.6 |
| NM_DR | =0.4 | |
| Flow | F_NaverDesktop | =F_Naver_Total*ND_DR |
| F_NaverMobile | =F_Naver_Total*NM_DR |
Table 4.
Stocks, dynamic variables, and flows connected to NaverDesktop.
| Feature | Description | |
|---|---|---|
| Stock | ND_Ki (i = 1, 2, 3, 4, and 5) | Potential customers entered through advertising keyword i (i = 1, 2, 3, 4, and 5) |
| NaverDesktopTraffic | Total potential customers who clicked on the keyword | |
| Dynamic Variable | ND_SearchRate_K1 | 0.71825 |
| ND_SearchRate_K2 | 0.0258 | |
| ND_SearchRate_K3 | 0.2304 | |
| ND_SearchRate_K4 | 0.01907 | |
| ND_SearchRate_K5 | 0.00648 | |
| ND_ClickRate_Ki (i = 1, 2, 3, 4, and 5) | Monthly click rate of keyword i (i = 1, 2, 3, 4, and 5) | |
| Flow | F_ND_Ki (i = 1, 2, 3, 4, and 5) | =F_NaverDesktop*ND_SearchRate_Ki (i = 1, 2, 3, 4, and 5) |
| F_ND_C_Ki (i = 1, 2, 3, 4, and 5) | =F_ND_Ki*ND_ClickRate_Ki (i = 1, 2, 3, 4, and 5) |
Table 5.
Stocks, dynamic variables, and flows connected to NaverMobile.
| Feature | Description | |
|---|---|---|
| Stock | NM_Ki (i = 1, 2, 3, 4, and 5) | Potential customers entered through advertising keyword i (i = 1, 2, 3, 4, and 5) |
| NaverMobileTraffic | Total potential customers who clicked on the keyword | |
| Dynamic Variable | NM_SearchRate_K1 | 0.80567 |
| NM_SearchRate_K2 | 0.17352 | |
| NM_SearchRate_K3 | 0.01444 | |
| NM_SearchRate_K4 | 0.0026 | |
| NM_SearchRate_K5 | 0.00377 | |
| NM_ClickRate_Ki (i = 1, 2, 3, 4, and 5) | Monthly click rate of keyword i (i = 1, 2, 3, 4, and 5) | |
| Flow | F_NM_Ki (i = 1, 2, 3, 4, and 5) | =F_NaverDesktop*NM_SearchRate_Ki (i = 1, 2, 3, 4, and 5) |
| F_NM_C_Ki (i = 1, 2, 3, 4, and 5) | =F_NM_Ki*NM_ClickRate_Ki (i = 1, 2, 3, 4, and 5) |
Table 6.
Stocks, dynamic variables, and flows connected to Website.
| Feature | Description | |
|---|---|---|
| Stock | Website | Total potential customers who entered Company A’s website |
| Buyer | Potential customers who actually made purchase | |
| Return | Potential customers who left the website without purchase | |
| Dynamic Variable | SNS_ClickRate | Monthly click rate of SNS advertising |
| YouTube_ClickRate | Monthly click rate of YouTube advertising | |
| Flow | F_NaverDesktopTraffic | =NaverDesktopTraffic |
| F_NaverMobileTraffic | =NaverMobileTraffic | |
| F_SNSTraffic | =F_SNS_Total*SNS_ClickRate | |
| F_YouTubeTraffic | =F_YouTube_Total*YouTube_ClickRate | |
| F_Buyer | =AD_Budget ≤ 0 ? 0: Website*0.2 | |
| F_Return | =Website*0.8 |
Table 7.
Stocks, dynamic variables, and flows connected to AD_Cost.
| Feature | Description | |
|---|---|---|
| Stock | AD_Budget | =Budget |
| AD_cost | Advertising cost used | |
| Input value connected to AD_Cost | ND_P_D_Ki (i = 1, 2, 3, 4, and 5) | Cost of monthly click of keyword i (i = 1, 2, 3, 4, and 5) |
| ND_C_Ki (i = 1, 2, 3, 4, and 5) | F_ND_C_Ki*ND_P_D_Ki (i = 1, 2, 3, 4, and 5) | |
| NM_P_D_Ki (i = 1, 2, 3, 4, and 5) | Cost of monthly click of keywords 1~5 | |
| NM_C_Ki (i = 1, 2, 3, 4, and 5) | F_NM_C_Ki*NM_P_D_Ki (i = 1, 2, 3, 4, and 5) | |
| Budget | 75,000,000 | |
| Flow | Paid | =AD_Budget ≤ 0 ? 0: SNS_C + YouTube_C + ND_C_K1 + ND_C_K2 + ND_C_K3 + ND_C_K4 + ND_C_K5 + NM_C_K1 + NM_C_K2 + NM_C_K3 + NM_C_K4 + NM_C_K5 + N_Press_C + Other_Press_C |
Table 8.
Simulation results.
| Feature | Description | Feature |
|---|---|---|
| Buyer | 10,654 | Buyer |
| AD_cost | 72,379,198 | AD_cost |
Table 9.
Optimization results of Scenario 1.
| Item | Before Optimization | Optimization Result |
|---|---|---|
| N_Press_DR | 1 | 0.597 |
| OtherPress_DR | 1 | 0.3 |
| N_DR | 1 | 3 |
| ND_DR | 0.6 | 0.171 |
| NM_DR | 0.4 | 0.829 |
| YouTube_DR | 1 | 1.5 |
| SNS_DR | 1 | 0.7 |
| Buyer | 10,654 | 20,461 |
| AD_Cost | 72,379,196 | 72,776,444 |
Table 10.
Optimization results of Scenario 2.
| Item | Before Optimization | Optimization Result |
|---|---|---|
| N_Press_DR | 1 | 0.517 |
| OtherPress_DR | 1 | 0.373 |
| N_DR | 1 | 1.652 |
| ND_DR | 0.6 | 0.126 |
| NM_DR | 0.4 | 0.874 |
| YouTube_DR | 1 | 1.007 |
| SNS_DR | 1 | 0.102 |
| Buyer | 10,654 | 10,048 |
| AD_Cost | 72,379,196 | 42,187,552 |
Publisher’s Note: MDPI stays neutral with regard to jurisdictional claims in published maps and institutional affiliations. |
© 2022 by the authors. Licensee MDPI, Basel, Switzerland. This article is an open access article distributed under the terms and conditions of the Creative Commons Attribution (CC BY) license (https://creativecommons.org/licenses/by/4.0/).
Share and Cite
MDPI and ACS Style
Jeong, J.; Hong, D.; Youm, S. Optimization of the Decision-Making System for Advertising Strategies of Small Enterprises—Focusing on Company A. Systems 2022, 10, 116. https://doi.org/10.3390/systems10040116
AMA Style
Jeong J, Hong D, Youm S. Optimization of the Decision-Making System for Advertising Strategies of Small Enterprises—Focusing on Company A. Systems. 2022; 10(4):116. https://doi.org/10.3390/systems10040116
Chicago/Turabian StyleJeong, Jihoon, Dongchul Hong, and Sekyoung Youm. 2022. "Optimization of the Decision-Making System for Advertising Strategies of Small Enterprises—Focusing on Company A" Systems 10, no. 4: 116. https://doi.org/10.3390/systems10040116
Note that from the first issue of 2016, this journal uses article numbers instead of page numbers. See further details here.