Abstract
Background: The COVID 19 pandemic increased publication productivity enormously with numerous new COVID-19-related articles appearing daily, despite the fact that many health care workers in the partially overburdened national health care systems were faced with major challenges. Methods: In a cross-sectional, observational, retrospective study we compared and correlated 17 epidemiologic, health care system-related and health-economic factors from medical databases and intergovernmental organisations potentially influencing the COVID-19 and non-COVID-19 publication productivity between 1 January and 30 April 2020 amongst the 30 countries most severely affected by the pandemic. These factors were additionally correlated with the national pre-COVID-19 publication rate for the same pre-year period to identify potential changes in the general publication behaviour. Findings: COVID-19 and non-COVID-19 publication rates correlated strongest with access to and quality of health care (ρ = 0.80 and 0.87, p < 0.0001), COVID-19 cases per capita (ρ = 0.78 and 0.72, p < 0.0001), GDP per capita (ρ = 0.69 and 0.76, p < 0.0001), health spending per capita (ρ = 0.61 and 0.73, p < 0.0001) and the pre-COVID-19 Hirsch-Index (ρ = 0.61 and 0.62, p = 0.002 and <0.0001). Ratios of publication rates for “Cancer”, “Diabetes” and “Stroke” in 2020 versus the pre-year period were 0.88 ± 0.06, 1.02 ± 0.18 and 0.9 ± 0.20, resulting in a pooled ratio of 0.93 ± 0.06 for non-COVID-19 publications. Interpretation: There are marked geographic and national differences in publication productivity during the COVID-19 pandemic. Both COVID-19- and non-COVID-19 publication productivity correlates with epidemiologic, health care system-related and healtheconomic factors, and pre-COVID publication expertise. Countries with a stable scientific infrastructure appear to maintain non-COVID-19 publication productivity nearly at the pre-year level and at the same time use their resilience to produce COVID-19 publications at high rates.
1. Introduction
Despite massive measures taken worldwide, the consequences of the COVID-19 (i.e., SARS-CoV2 infection) pandemic are devastating. By the beginning of June 2020, the number of people infected had increased to more than 6.5 million and nearly 400,000 had died from this infection [1]. Not only clinicians focus on COVID-19 patients, but also the scientific medical community is making great efforts to identify effective treatment options and to disseminate new knowledge as urgently as possible for the benefit of all. This has resulted in an enormous increase in publication productivity with numerous new articles appearing daily in scientific journals, which is particularly surprising given the challenges faced by many health care workers in the partially overburdened national health care systems. We therefore sought to determine which factors could be decisive for the publication productivity during this crisis. Thus, we compared and correlated factors (Table 1) potentially influencing the COVID-19-related publication productivity between 1 January and 30 April 2020 amongst the 30 countries most severely affected by the pandemic. These factors were additionally correlated with the non-COVID-19 publication rate between 1 January and 30 April 2020 and the pre-COVID-19 publication rate for the same pre-year period to obtain information on potential changes in the general publication behaviour.

Table 1.
National factors potentially influencing COVID-19-related publication productivity.
2. Methods
Selection of the potentially relevant factors was based both on previous non-COVID-19 articles addressing publication productivity of nations [10,11] and on an educated guess. Only data of highly reliable sources were retrieved to address/quantify these factors (Table 1). The sample size of 30 countries was based on King [11], intended to result in a representative selection of countries with high, intermediate and low (preliminary) publication output. To allow data collection despite the dynamic evolution of the pandemic, the ranking of the countries was defined on April 23 2020; however, COVID-19-related numbers (except for the case fatality rates) were updated on May 2 2020. The number of PubMed-listed publications was determined with the search term “COVID-19 AND country [affiliation]” and normalized by 1 million inhabitants. When using “SARS-CoV2” instead of “COVID-19”, search hits were markedly lower and yielded various duplicates with “COVID-19” search hits, thus we considered it an inferior search term for our analysis. Additionally, Scopus, Web of Science and Embase were searched for “COVID-19” and categorized by the countries affiliated. However, due to considerably lower search hits (Scopus n = 3048; Web of Science n = 998, Embase n = 3349), these databases were not considered for our analysis. For factors impossible to quantify precisely including “Research tradition/infrastructure”, “Research funding”, “Health care quality” approximative surrogate markers have been used (Table 1 [2,3,4,5,6,7,8,9]). Due to the dynamic changes of the national level of COVID-19 control measures, the stringency scores [4] were retrieved on 31 March and 30 April 2020, as we hypothesized that all of these factors could positively correlate with the number of PubMed-listed COVID-19-related publications. In the case of publications involving authors from institutions in different countries, each country affiliated was counted once. Due to the lack of reliable information, the number of medical researchers, medical universities and medical research funding per country could not be (directly) assessed.
To assess the non-COVID-19 publication rate between 1 January and 30 April 2020, we selected the topics “Cancer”, “Diabetes” and “Stroke”, as they exhibit a high year-round publication rate worldwide. The mean of the publications pooled from these three topics was normalized by 1 mio inhabitants (= “non-COVID-19 publication rate 2020”) and correlated with the same 17 factors mentioned above. Likewise, publication rates for “Cancer, “Diabetes” and “Stroke” between 1 January and 30 April 2020 were calculated (= “pre-COVID-19 publication rate”) and correlated with the factors listed in Table 1 (excluding the COVID-19-related ones). Spearman’s rank correlations were performed using SPSS 21 software (IBM Corporation: Amonk, NY, USA).
3. Results
Approximately two thirds (65.0%) of the analysed publications were affiliated with China, the USA, Italy, the UK or France, while Australia, African and Central American countries were not represented amongst the 30 nations with the highest COVID-19 rates. The results of the factors analysed varied considerably between countries (Table 2); the corresponding correlation coefficients are shown in Figure 1.
Table 2.
Overview of the 30 countries most affected by COVID-19 by the end of April 2020. For each country, the COVID-19 publications and non-COVID-19 publications between January 1 and April 30 2020 are listed, including the factors analyzed.
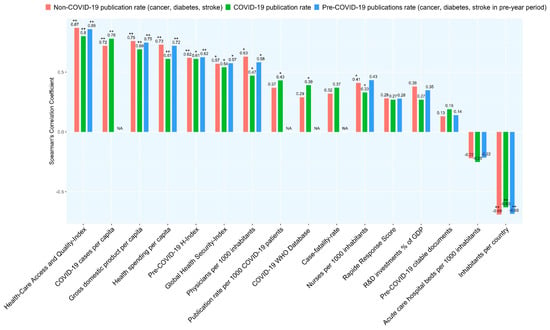
Figure 1.
Correlations between COVID-19 publication rates and factors analysed. * p-value < 0.05, ** p-value < 0.0001.
The Spearman’s correlation coefficients resulting from correlations between the COVID-19, nonCOVID-19 (i.e., publications on “Cancer”, “Diabetes” and “Stroke” published between 1 January and 30 April 2020 and pre-COVID-19 publication rates (i.e., publications on “Cancer”, “Diabetes” and “Stroke” published between 1 January and 30 April 2020) with the factors listed in Table 1 are shown in Figure 1 (exact p-values in Table A1). We found weak negative correlations between the non-COVID-19 publication rate and the national Stringency Index present on 31 March and 30 April 2020 (Rho (ρ) −0.344; p = 0.63 and ρ −0.314; p = 0.12). The COVID-19 publication rate neither correlated with these scores present on 31 March nor on 30 April 2020 (ρ −0.27; p = 0.13 and ρ −0.18; p = 0.37).
The COVID-19 and non-COVID-19 publication rate correlated positively (ρ 0.924; p < 0.001); the ratios of the publication rates for “Cancer”, “Diabetes” and “Stroke” 2020 vs. the pre-year period were 0.88 ± 0.06, 1.02 ± 0.18 and 0.9 ± 0.20 (Table A2), respectively, resulting in a pooled ratio of 0.93 ± 0.06 for non-COVID-19 publications.
4. Discussion
Our results indicate that the COVID-19 publication rate of the 30 countries most affected by the SARS-Cov2 pandemic by the end of April 2020 correlates positively with epidemiological factors (COVID-19 cases per capita, case fatality rate), health care system-relevant (number of physicians HAQ Index, Global Health Security Index) and economic factors (health care expenditure per capita, gross domestic product (GDP)), and, additionally, with the publication expertise (pre-COVID-19 H-index, COVID-19 trial database). In contrast, we have not detected a significant correlation between the COVID-19 publication productivity and the national level of stringency, number of acute care hospital beds and research and development (R&D) investment (as percentage of GDP). The correlation pattern we found for the COVID-19 publication rate was quite similar for the non-COVID-19-publication and, where applicable, also for the pre-COVID-19 publication rate, suggesting that it is not COVID-19 specific (Figure 1). This even held true when the two countries with the highest absolute (China, USA) and the highest normalized number (Singapore, Switzerland) of COVID-19 publications were excluded from the calculation.
It appears plausible that higher numbers of COVID-19 cases per capita and higher case fatality rates may drive publication productivity by (i) enlarging the pool of (severely ill) patients eligible for research, (ii) potentially increasing the number of contacts between COVID-19 patients and physicians and (iii) increasing the (social) pressure to help and thereby the motivation to publish COVID-19-related data. On the other hand, a higher burden on the health care system is likely to reduce resources for medical publications. The positive correlation between the number of physicians and publication productivity supports this assumption, as countries with very high (normalized) publication rates, such as Switzerland or Italy, have rather high numbers of physicians per 1000 inhabitants (no corresponding information was available for Singapore, which had the highest normalized publication rate). In this context, it would have been helpful to have information on the national proportion of (non-physician) researchers publishing on COVID-19, who are not directly involved in patient-care. Such a “division of labour” could explain why in some countries it was possible to “exploit” the pandemic for publications despite the high patient-related workload. Certainly, a well-established pre-COVID research and publication expertise may facilitate the latter. The high H-index (“pre-COVID-19 H-index”) from previous years we found for countries such as Italy, the Netherlands or UK supports the assumption that nations with a high COVID-19 publication rate have scientific infrastructures that enabled a high publication productivity despite high infection and case-fatality rates. The (weaker) positive correlation between registered COVID-19 trials and the current COVID-19 publication productivity may be rooted in the same pre-COVID publication and research expertise.
The extent of this utility of this pre-COVID expertise during the pandemic is presumably closely linked to health care-relevant and economic factors. The strongest correlation of the COVID-19 publication rate we found was with the HAQ-Index. This index is an approximation to assess health care access and quality based on 32 causes from which death should not occur in the presence of effective care. This “amenable mortality” [6] has been repeatedly used as an indicator for the overall performance of country’s health care system [6,12]. Except for Israel (HAQ-Index 85), all of the ten countries with the highest normalized publication rates had a very high HAQ-Index of ≥90 (with 100 being the maximum) indicating that higher quality of health care is associated with higher publication productivity. This obvious connection is further supported by the (weaker) correlation of the publication rate and the Global Health Security Index.
However, it remains speculative as to how the relationship between the quality of health care and the publication rate truly is, whether it is a coincidence or a causal association. This correlation may be confounded by economic factors, such as health spending per capita or GDP per capita, which also positively correlated with the publication rates. It is known from the Global Burden of Disease Study from 2016 that the HAQ-Index and the health spending per capita strongly correlate [6]. The differences in COVID-19 and non-COVID-19 publication rates between Italy and Spain are noticeable. Despite similarities in demographics, COVID-19 cases per capita, case-fatality rates, HAQ-Index and many other factors, the publication rate of Italy was more than 4 times higher for COVID-19 publications and approximately 1.5 times higher for non-COVID-19 publications. When considering the normalized factors, the major difference between these two countries may be the 32% higher health care spending per capita in Italy. It is, however, conceivable that the confinements established by Spain, which at that time were one of the strictest in the world, negatively affected scientific work and thus scientific output.
We also found a clear correlation between GDP and the publication rates for both COVID-19 and non-COVID-19 publications, but interestingly, only weak positive correlations between R&D investment (as percentage of GDP) and non-COVID-19 publication rate, but not with that of COVID-19 publications. The lack of correlation with the COVID-19 publication rate may be explained by the funding of non-medical investments irrelevant for health care-associated publications and possibly by the fact that the R&D figures used are from 2018 and thus from the period before the pandemic. This aspect may be of interest when analysing the publication rates in the next few years as Mendonca et al. [13] underlined the particular importance of the percentage of GDP spent on R&D for the publication rate by examining the impact of the financial crisis that started in 2008 on publication productivity. They were able to show that in countries severely affected by the financial crisis, publication output increased significantly slower in the subsequent years than in economically more stable nations. However, the influence of GDP on the number of scientific publications has been repeatedly studied with inconsistent results. While Cheng et al. [14] found clear correlations among publications in the field of rheumatology, and Liang et al. [15] when analysing arthroscopy publications, other authors were unable to demonstrate such a relationship [16,17].
Surprisingly, we found no correlation with the Rapid Response Score, a subcategory of the GHS-Index to assess the national emergency preparedness and response planning during an endemic [7]. It contains indicators of government responses overlapping with the ones present in the Stringency Index (e.g., structural/organizational preparedness, risk communication, travel restrictions), neither of which correlated with the publication rates in our analysis. This may possibly indicate that while the lockdown measures may be crucial to reduce COVID-19 transmissibility [18,19], they may not have a major influence on publication productivity by the timepoints of our assessments.
Likewise surprising was the fact that the publication rates of the three globally common diseases “Cancer”, “Diabetes” and “Stroke” between January 1 and April 30 2020 were unaffected for “Diabetes”, and decreased by only 10% compared to the same period in the previous year for the two other topics. Apparently, the level of productivity on these three non-COVID-19 topics could be nearly maintained despite the global predominance of the topic “COVID-19” and that many journals may have prioritized papers on COVID-19 to spread the scarce knowledge about this new virus rapidly. This further underlines the stability of the scientific infrastructure of scientifically very productive countries, in which, due to research units being shut down in many places, scientific work was only possible in home offices. However, these results must be interpreted cautiously because numerous of the non-COVID-19 publications had presumably been submitted before the pandemic. These results, together with our finding that most potential future studies have been registered with the WHO database by those nations that currently have the highest publication rates, make it likely that the majority of articles on COVID-19 will continue to originate from these countries.
Our study has some limitations: It is in the nature of exploratory studies using correlation analyses that they are not designed to detect confounding and cannot answer the type of relationship of the correlated factors. Thus, linear regression analyses might have produced somewhat different results. The factors we assessed and their corresponding rho-values may help to stratify this approach.
We noticed that many of the publications included in our analysis have international affiliations. Therefore, the focus on national publication rates we and others [10,11,14,17] have placed may be oversimplified as the globally connected research community cannot be adequately fitted into national terms. Furthermore, as the majority of Chinese medical publications are written in Chinese and are not listed in Pubmed, a presumably large number of publications on COVID-19 were not considered. Therefore, future analyses of COVID-19 publication productivity should ideally include publications in the Chinese language to obtain a more comprehensive view on this topic. Likewise, many future trials are not yet registered in the WHO database and it has been reported that up to 50% of registered studies are published with a latency of several years and some even remain unpublished [20,21]. Ultimately, our results cover just a four month period and 30 countries. In the two weeks following data analysis, the ranking of the countries most affected had already changed and countries not assessed by us are now amongst these top 30.
In conclusion, our analysis based on data from highly-trustful sources allowed us to rank 17 factors potentially influencing the national publication rates on COVID-19 and non-COVID-19 publications during the first 4 months of this pandemic. COVID-19 and non-COVID-19 publication rates correlated strongest with the access and quality of health care, the COVID-19 cases per capita, the GDP per capita, health spending per capita and the pre-COVID-19 H-Index. No correlations were found with the stringency of lock-down measures, the emergency preparedness for endemics, acute care hospital beds/1000 inhabitants, amongst others. Moreover, our results suggest that countries with a stable scientific infrastructure may be able to maintain non-COVID-19 publication productivity nearly at the pre-year level and at the same time use their resilience to produce COVID-19 publications at high rates.
Author Contributions
Conceptualization, S.M.M.; Data curation, G.F.M.; Formal analysis, O.B.; Methodology, S.M.M. and O.B.; Project administration, S.M.M.; Resources, G.F.M.; Writing—original draft, S.M.M., A.A.N. and O.B.; Writing—review and editing, A.N. and O.B. All authors have read and agreed to the published version of the manuscript.
Funding
This research received no external funding.
Acknowledgments
The authors are indebted to Andrea Wiencierz for his support in statistical analyses and Lars G. Hemkens for his valuable inputs on the study design.
Conflicts of Interest
The authors declare no conflict of interest.
Abbreviations
| GBDS | Global Burden of Disease Study |
| GHS-Index | Global Health Security Index |
| HAQ-Index | Health care Access and Quality |
| JHU | Johns Hopkins University |
| IMF | International Monetary Fund |
| NTI | Nuclear Threat Initiative |
| OECD | Organisation for Economic Co-operation and Development |
| SCR | SCImago Country Ranking by SCOPUS |
| UN | United Nations |
| WHO | Word Health Organization |
Appendix A
Table A1.
Correlations between COVID-19-, non-COVID-19- and pre-COVID-19-publication rate and factors analysed (rho (ρ)- and p-values).
Table A1.
Correlations between COVID-19-, non-COVID-19- and pre-COVID-19-publication rate and factors analysed (rho (ρ)- and p-values).
| Factors | Correlation with COVID-19 Publication Rate, rho | p-Values | Correlation with Non-COVID-19 Publication Rate (Cancer, Diabetes, Stroke), rho (ρ) | p-Values | Correlation with Pre-COVID-19 Publication Rate, rho (ρ) | p-Values |
|---|---|---|---|---|---|---|
| Health Care Access and Quality Index | 0.80 | <0.0001 | 0.87 | <0.0001 | 0.86 | <0.0001 |
| COVID-19 cases per capita | 0.78 | <0.0001 | 0.72 | <0.0001 | NA | NA |
| Gross domestic product per capita | 0.69 | <0.0001 | 0.76 | <0.0001 | 0.748 | <0.0001 |
| Health spending per capita | 0.61 | <0.0001 | 0.73 | <0.0001 | 0.72 | <0.0001 |
| Pre-COVID-19 H-index | 0.61 | 0.002 | 0.62 | <0.0001 | 0.625 | <0.0001 |
| Global Health Security Index | 0.54 | 0.002 | 0.57 | 0.001 | 0.575 | 0.001 |
| Physicians per 1000 inhabitants | 0.47 | 0.045 | 0.63 | 0.004 | 0.582 | 0.009 |
| Publication rate per 1000 COVID-19 patients | 0.43 | 0.032 | 0.37 | 0.124 | NA | NA |
| COVID-19 WHO Database | 0.39 | 0.042 | 0.29 | 0.082 | NA | NA |
| Case-fatality-rate | 0.37 | 0.154 | 0.32 | 0.071 | NA | NA |
| Nurses per 1000 inhabitants | 0.33 | 0.017 | 0.41 | 0.047 | 0.433 | 0.056 |
| Rapid Response score | 0.27 | 1.45 | 0.28 | 1.33 | 0.278 | 0.137 |
| R&D investments % of GDP | 0.27 | 0.241 | 0.38 | 0.089 | 0.348 | 0.122 |
| Pre-COVID-19 citable documents | 0.19 | 0.325 | 0.13 | 0.48 | 0.141 | 0.456 |
| Acute care hospital beds per 1000 inhabitants | −0.25 | 0.28 | −0.22 | 0.36 | −0.215 | 0.364 |
| Inhabitants per country | −0.63 | <0.0001 | −0.69 | <0.001 | −0.685 | <0.0001 |
Table A2.
The absolute numbers and percentage of the 2020/2019 ratio of the COVID-19- and the non-COVID-19-publication rates for Cancer, Diabetes and Stroke between January 1 and April 30 2020 and the pre-year period.
Table A2.
The absolute numbers and percentage of the 2020/2019 ratio of the COVID-19- and the non-COVID-19-publication rates for Cancer, Diabetes and Stroke between January 1 and April 30 2020 and the pre-year period.
| Cancer 1.1.–30.4.19 | Cancer 1.1.–30.4.20 | Cancer Percentage 2020/2019 | Diabetes 1.1.–30.4.19 | Diabetes 1.1.–30.4.20 | Diabetes Percentage 2020/2019 | Stroke 1.1.–30.4.19 | Stroke 1.1.–30.4.20 | Stroke Percentage 2020/2019 | |
|---|---|---|---|---|---|---|---|---|---|
| USA | 15,839 | 14,354 | 0.91 | 3503 | 3306 | 0.94 | 1776 | 1579 | 0.89 |
| Spain | 2529 | 2323 | 0.92 | 726 | 763 | 1.05 | 308 | 293 | 0.95 |
| Italy | 5218 | 4528 | 0.87 | 975 | 1153 | 1.18 | 609 | 553 | 0.91 |
| France | 4040 | 3551 | 0.88 | 675 | 688 | 1.02 | 482 | 412 | 0.85 |
| Germany | 5139 | 4570 | 0.89 | 1142 | 1160 | 1.02 | 767 | 713 | 0.93 |
| United Kingdom | 5023 | 4438 | 0.88 | 1516 | 1586 | 1.05 | 717 | 660 | 0.92 |
| Turkey | 1286 | 914 | 0.71 | 376 | 311 | 0.83 | 120 | 77 | 0.64 |
| Iran | 1533 | 1337 | 0.87 | 588 | 446 | 0.76 | 100 | 83 | 0.83 |
| China | 19,034 | 17,612 | 0.93 | 2999 | 3226 | 1.08 | 1483 | 1499 | 1.01 |
| Russia | 571 | 486 | 0.85 | 105 | 85 | 0.81 | 124 | 62 | 0.50 |
| Brazil | 1482 | 1369 | 0.92 | 443 | 465 | 1.05 | 183 | 146 | 0.80 |
| Belgium | 1267 | 1117 | 0.88 | 255 | 289 | 1.13 | 153 | 127 | 0.83 |
| Canada | 3686 | 3458 | 0.94 | 928 | 922 | 0.99 | 698 | 670 | 0.96 |
| Netherlands | 2698 | 2502 | 0.93 | 638 | 562 | 0.88 | 390 | 328 | 0.84 |
| Switzerland | 1603 | 1458 | 0.91 | 377 | 445 | 1.18 | 271 | 270 | 1.00 |
| Portugal | 659 | 618 | 0.94 | 164 | 194 | 1.18 | 106 | 83 | 0.78 |
| India | 2705 | 2008 | 0.74 | 922 | 778 | 0.84 | 206 | 164 | 0.80 |
| Peru | 76 | 59 | 0.78 | 21 | 34 | 1.62 | 7 | 12 | 1.71 |
| Ireland | 480 | 482 | 1.00 | 151 | 212 | 1.40 | 89 | 71 | 0.80 |
| Sweden | 1647 | 1459 | 0.89 | 619 | 590 | 0.95 | 254 | 264 | 1.04 |
| Austria | 908 | 888 | 0.98 | 219 | 224 | 1.02 | 139 | 134 | 0.96 |
| Israel | 1189 | 1047 | 0.88 | 364 | 355 | 0.98 | 164 | 166 | 1.01 |
| Saudi Arabia | 648 | 564 | 0.87 | 272 | 242 | 0.89 | 50 | 37 | 0.74 |
| Japan | 6128 | 5042 | 0.82 | 1166 | 1044 | 0.90 | 659 | 550 | 0.83 |
| Chile | 227 | 218 | 0.96 | 93 | 102 | 1.10 | 33 | 31 | 0.94 |
| South Korea | 702 | 583 | 0.83 | 141 | 145 | 1.03 | 102 | 82 | 0.80 |
| Ecuador | 35 | 27 | 0.77 | 13 | 12 | 0.92 | 8 | 10 | 1.25 |
| Singapore | 662 | 571 | 0.86 | 219 | 241 | 1.10 | 85 | 82 | 0.96 |
| Poland | 1276 | 1022 | 0.80 | 366 | 291 | 0.80 | 173 | 133 | 0.77 |
| Pakistan | 320 | 275 | 0.86 | 150 | 119 | 0.79 | 30 | 23 | 0.77 |
| Mean | 0.88 | 1.02 | 0.9 | ||||||
| SD | 0.06 | 0.18 | 0.20 |
References
- Coronavirus COVID-19 Global Cases by the Center for Systems Science and Engineering (CSSE) at Johns Hopkins University (JHU). 2020. Available online: https://gisanddata.maps.arcgis.com/apps/opsdashboard (accessed on 27 May 2020).
- United Nations DoEaSA. 2020. Available online: https://population.un.org/wpp/ (accessed on 22 April 2020).
- Consejo Superior de Investigaciones Científicas (CSIC) UoG, Extremadura, Carlos III (Madrid) and Alcalá de Henares SCImago Journal and Country Rank. 2018. Available online: https://www.scimagojr.com/countryrank.php (accessed on 22 April 2020).
- Coronavirus Government Response Tracker. 2020. Available online: https://www.bsg.ox.ac.uk/research/research-projects/coronavirus-government-response-tracker (accessed on 11 May 2020).
- (OECD) TOfEC-oaD. Health Data; The Organisation for Economic Co-Operation and Development (OECD): Paris, France, 2020. [Google Scholar]
- Fullman, N.; Yearwood, J.; Abay, S.M.; Abbafati, C.; Abd-Allah, F.; Abdela, J.; Abdelalim, A.; Abebe, Z.; Abebo, T.A.; Aboyans, V.; et al. Globbal Burden of Disease Study HA, Quality C. Measuring performance on the Health care Access and Quality Index for 195 countries and territories and selected subnational locations: A systematic analysis from the Global Burden of Disease Study 2016. Lancet 2018, 391, 2236–2271. [Google Scholar] [CrossRef]
- Nuclear Threat Initiative (NTI) JHCfHSJ; The Economist Intelligence Unit (EIU). Global Health Security Index, Buildung Collective Action and Accountability. 2019. Available online: https://www.ghsindex.org/ (accessed on 22 April 2020).
- Estimated Gross Domestic Product per Capita for 2020. Available online: https://www.imf.org/external/pubs/ft/weo/2019/02/weodata/weoselgr.aspx (accessed on 30 April 2020).
- ClinicalTrials. Gov; National Library of Medicine (NLM): Bethesda, MD, USA, 2020.
- Gonzalez-Brambila, C.N.; Reyes-Gonzalez, L.; Veloso, F.; Perez-Angon, M.A. The Scientific Impact of Developing Nations. PLoS ONE 2016, 11, e0151328. [Google Scholar] [CrossRef] [PubMed]
- King, D.A. The scientific impact of nations. Nature 2004, 430, 311–316. [Google Scholar] [CrossRef] [PubMed]
- Ramkissoon, F.E. Commentary on In Amenable Mortality-Deaths Avoidable through Health Care-Progress in the US Lags That of Three European Countries. Ann. Med. Surg. (Lond.) 2013, 2, 5–7. [Google Scholar] [CrossRef]
- Mendonca, L.; Castro-Lopes, J.M. Impact of the economic crisis on pain research: A bibliometric analysis of pain research publications from Ireland, Greece, and Portugal between 1997 and 2017. Scand. J. Pain 2018, 18, 629–637. [Google Scholar] [CrossRef] [PubMed]
- Cheng, T.; Zhang, G. Worldwide research productivity in the field of rheumatology from 1996 to 2010: A bibliometric analysis. Rheumatology (Oxford) 2013, 52, 1630–1634. [Google Scholar] [CrossRef] [PubMed]
- Liang, Z.; Luo, X.; Gong, F.; Bao, H.; Qian, H.; Jia, Z.; Li, G. Worldwide Research Productivity in the Field of Arthroscopy: A Bibliometric Analysis. Arthroscopy 2015, 31, 1452–1457. [Google Scholar] [CrossRef] [PubMed]
- Meo, S.A.; Al Masri, A.A.; Usmani, A.M.; Memon, A.N.; Zaidi, S.Z. Impact of GDP, spending on R&D, number of universities and scientific journals on research publications among Asian countries. PLoS ONE 2013, 8, e66449. [Google Scholar]
- Jamjoom, B.A.; Jamjoom, A.B. Impact of country-specific characteristics on scientific productivity in clinical neurology research. eNeurologicalSci 2016, 4, 1–3. [Google Scholar] [CrossRef] [PubMed]
- Gibney, E. Whose coronavirus strategy worked best? Scientists hunt most effective policies. Nature 2020, 581, 15–16. [Google Scholar] [CrossRef]
- Cowling, B.J.; Ali, S.T.; Ng, T.W.Y.; Tsang, T.K.; Li, J.C.M.; Fong, M.W.; Liao, Q.; Kwan, M.Y.; Lee, S.L.; Chiu, S.S.; et al. Impact assessment of non-pharmaceutical interventions against coronavirus disease 2019 and influenza in Hong Kong: An observational study. Lancet Public Health 2020, 5, e279–e288. [Google Scholar] [CrossRef]
- Strzebonska, K.; Wasylewski, M.T.; Zaborowska, L.; Riedel, N.; Wieschowski, S.; Strech, D.; Waligora, M. Results dissemination of registered clinical trials across Polish academic institutions: A cross-sectional analysis. BMJ Open 2020, 10, e034666. [Google Scholar] [CrossRef] [PubMed]
- Chen, R.; Desai, N.R.; Ross, J.S.; Zhang, W.; Chau, K.H.; Wayda, B.; Murugiah, K.; Lu, D.; Mittal, A.; Krumholz, H.M. Publication and reporting of clinical trial results: Cross sectional analysis across academic medical centers. BMJ 2016, 352, i637. [Google Scholar] [CrossRef] [PubMed]

© 2020 by the authors. Licensee MDPI, Basel, Switzerland. This article is an open access article distributed under the terms and conditions of the Creative Commons Attribution (CC BY) license (http://creativecommons.org/licenses/by/4.0/).