Novel Biomarkers of Mastitis in Goat Milk Revealed by MALDI-TOF-MS-Based Peptide Profiling

 , ,
, , 
Abstract
1. Introduction
2. Materials and Methods
2.1. Sample Collection and Preparation
2.2. Somatic Cell Count
2.3. Bacteriological Examination
2.4. Milk Amyloid A Titration
2.5. MALDI-TOF-MS-Based Peptide Profiling
2.6. NanoLC-ESI-Q-Orbitrap MS/MS Analysis
2.7. Database Search for Protein Identification
2.8. Bioinformatics for Function Prediction
3. Results and Discussion
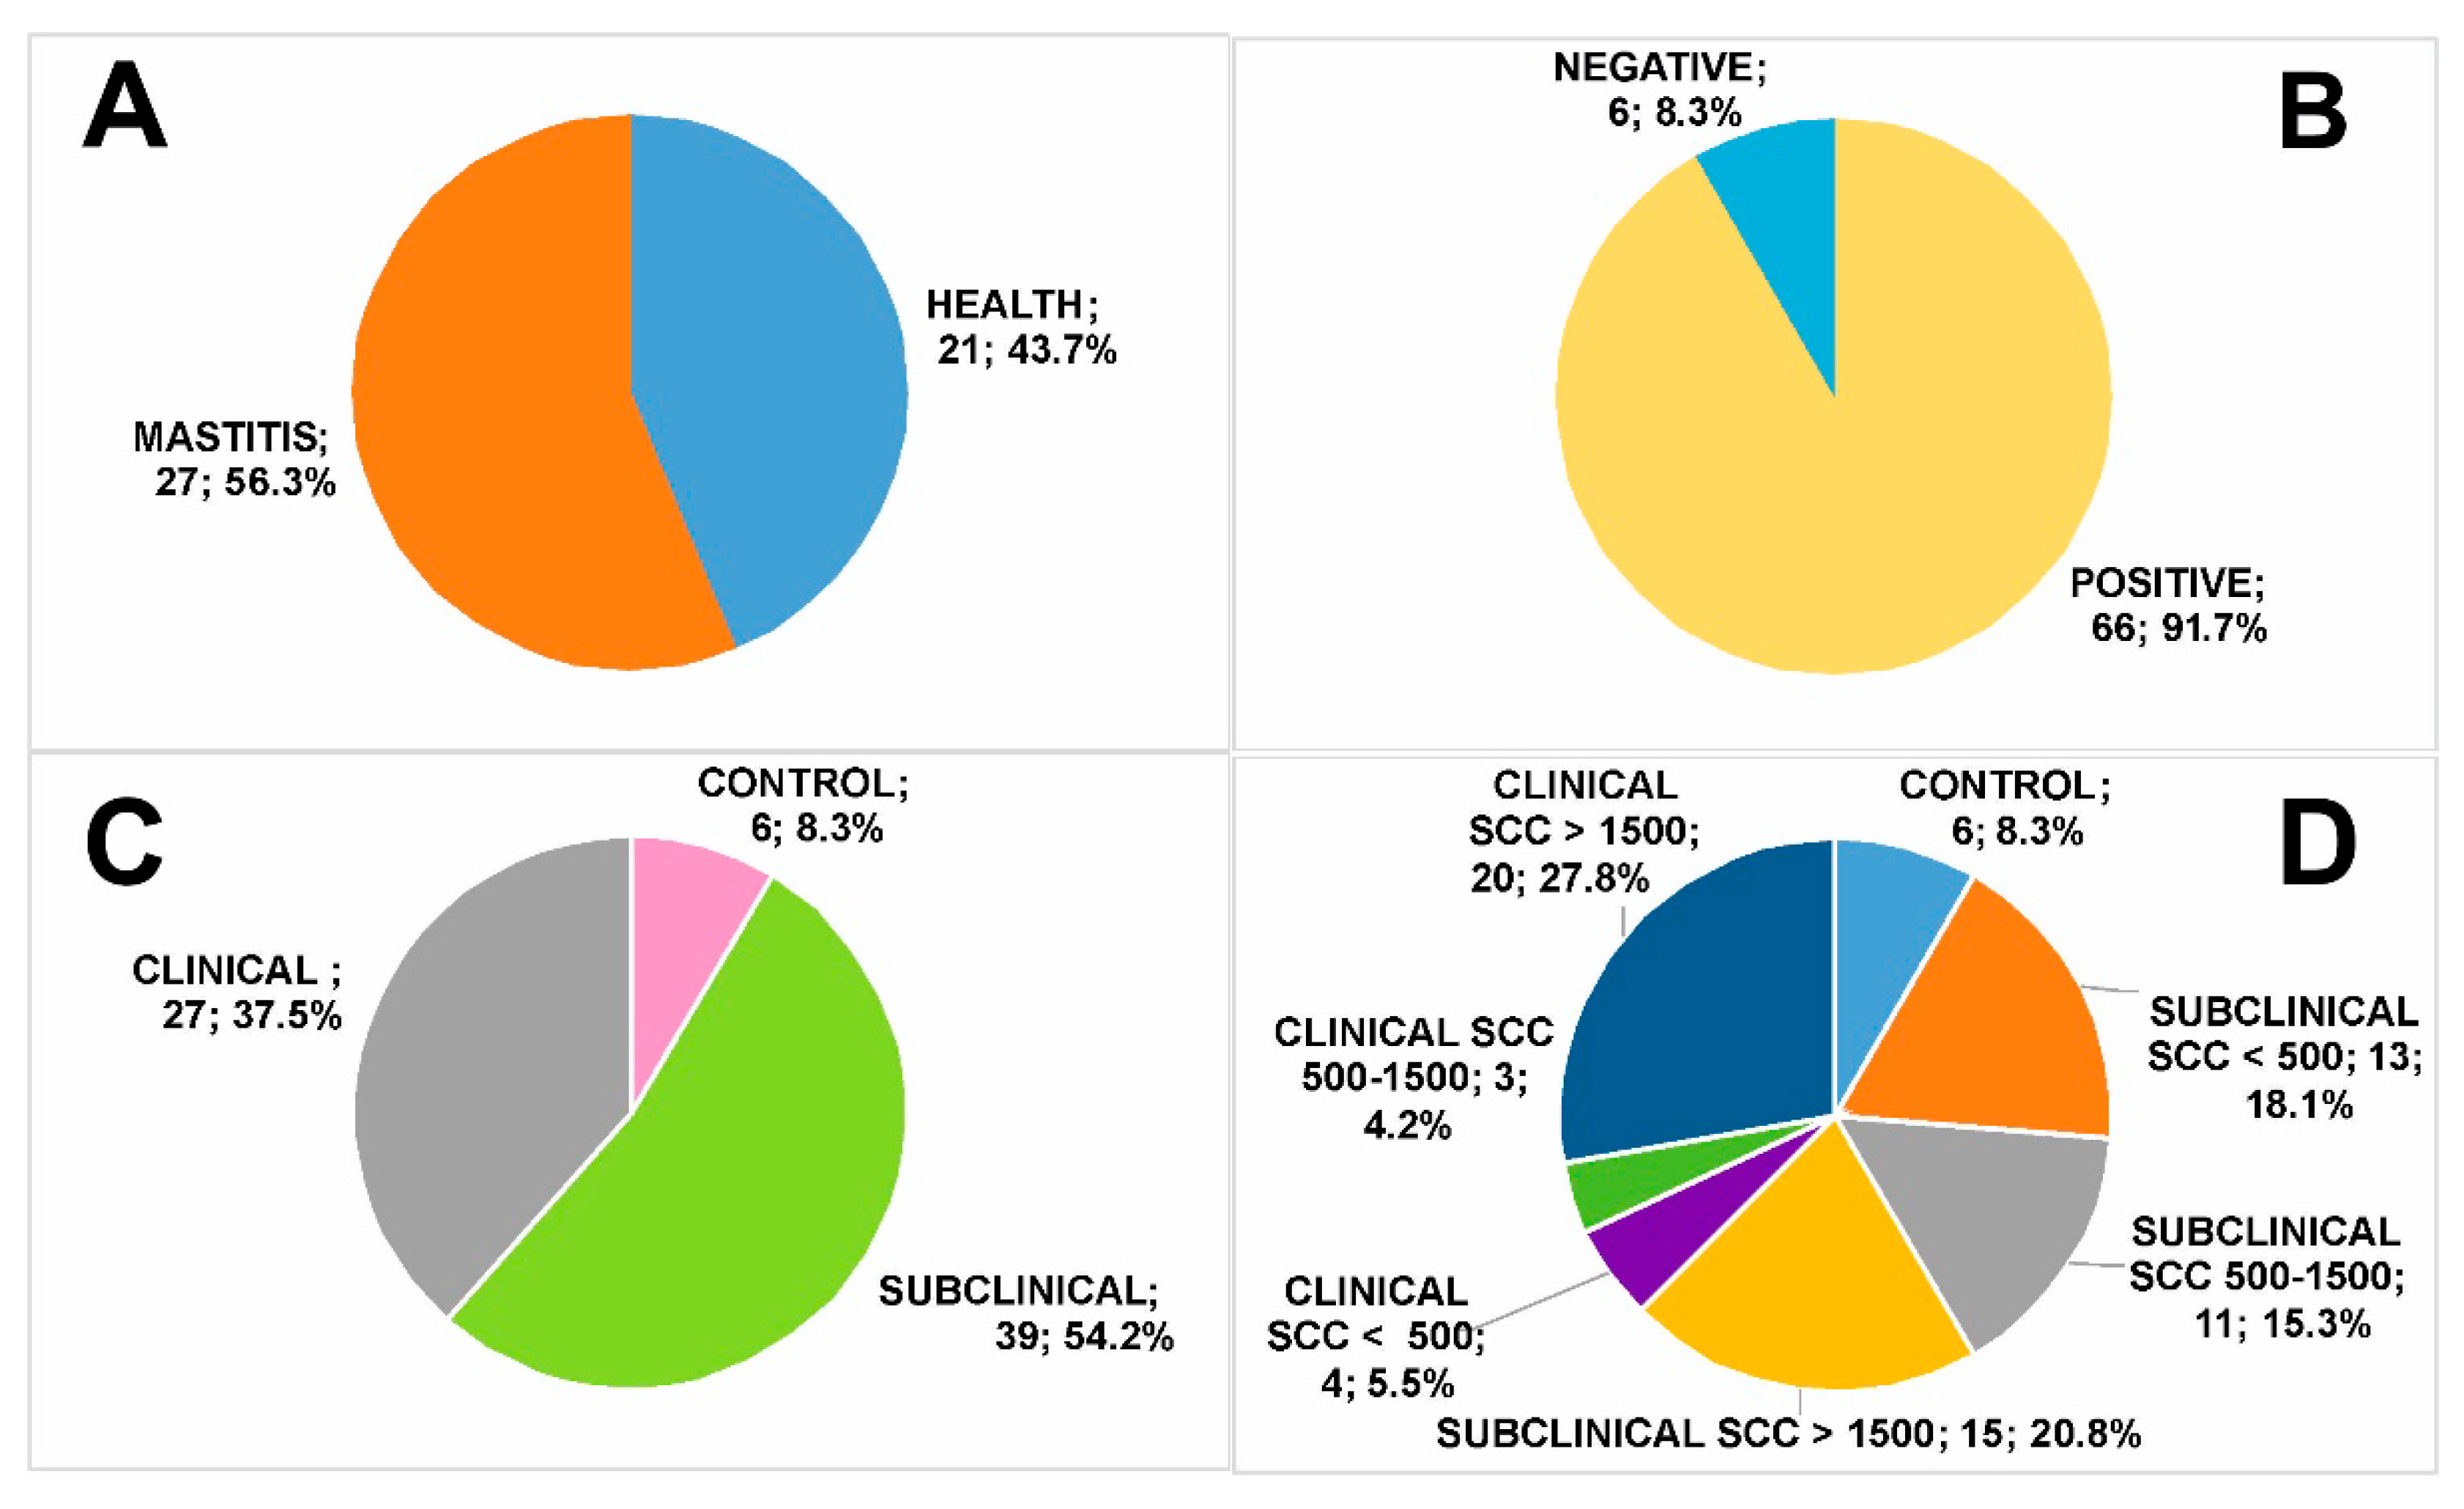
3.1. Milk Group Classification
- Healthy—no clinical signs, negative bacteriological tests and SCC < 500 × 103 cells/mL (control, n = 6, 8.3% of total);
- Subclinical mastitis—no clinical signs, positive bacteriological tests (low SCC, SCC < 500 × 103 cells/mL, n = 13, 18.1% of total; medium SCC, SCC = 500–1500 × 103 cells/mL, n = 11, 15.3% of total; high SCC, SCC > 1500 × 103 cells/mL, n = 15, 20.8% of total);
- Clinical mastitis—evident clinical signs and positive bacteriological tests (low SCC, SCC < 500 × 103 cells/mL, n = 4, 5.5% of total; medium SCC, SCC = 500–1500 × 103 cells/mL, n = 3, 4.2% of total; high SCC, SCC > 1500 × 103 cells/mL, n = 20, 27.8% of total).
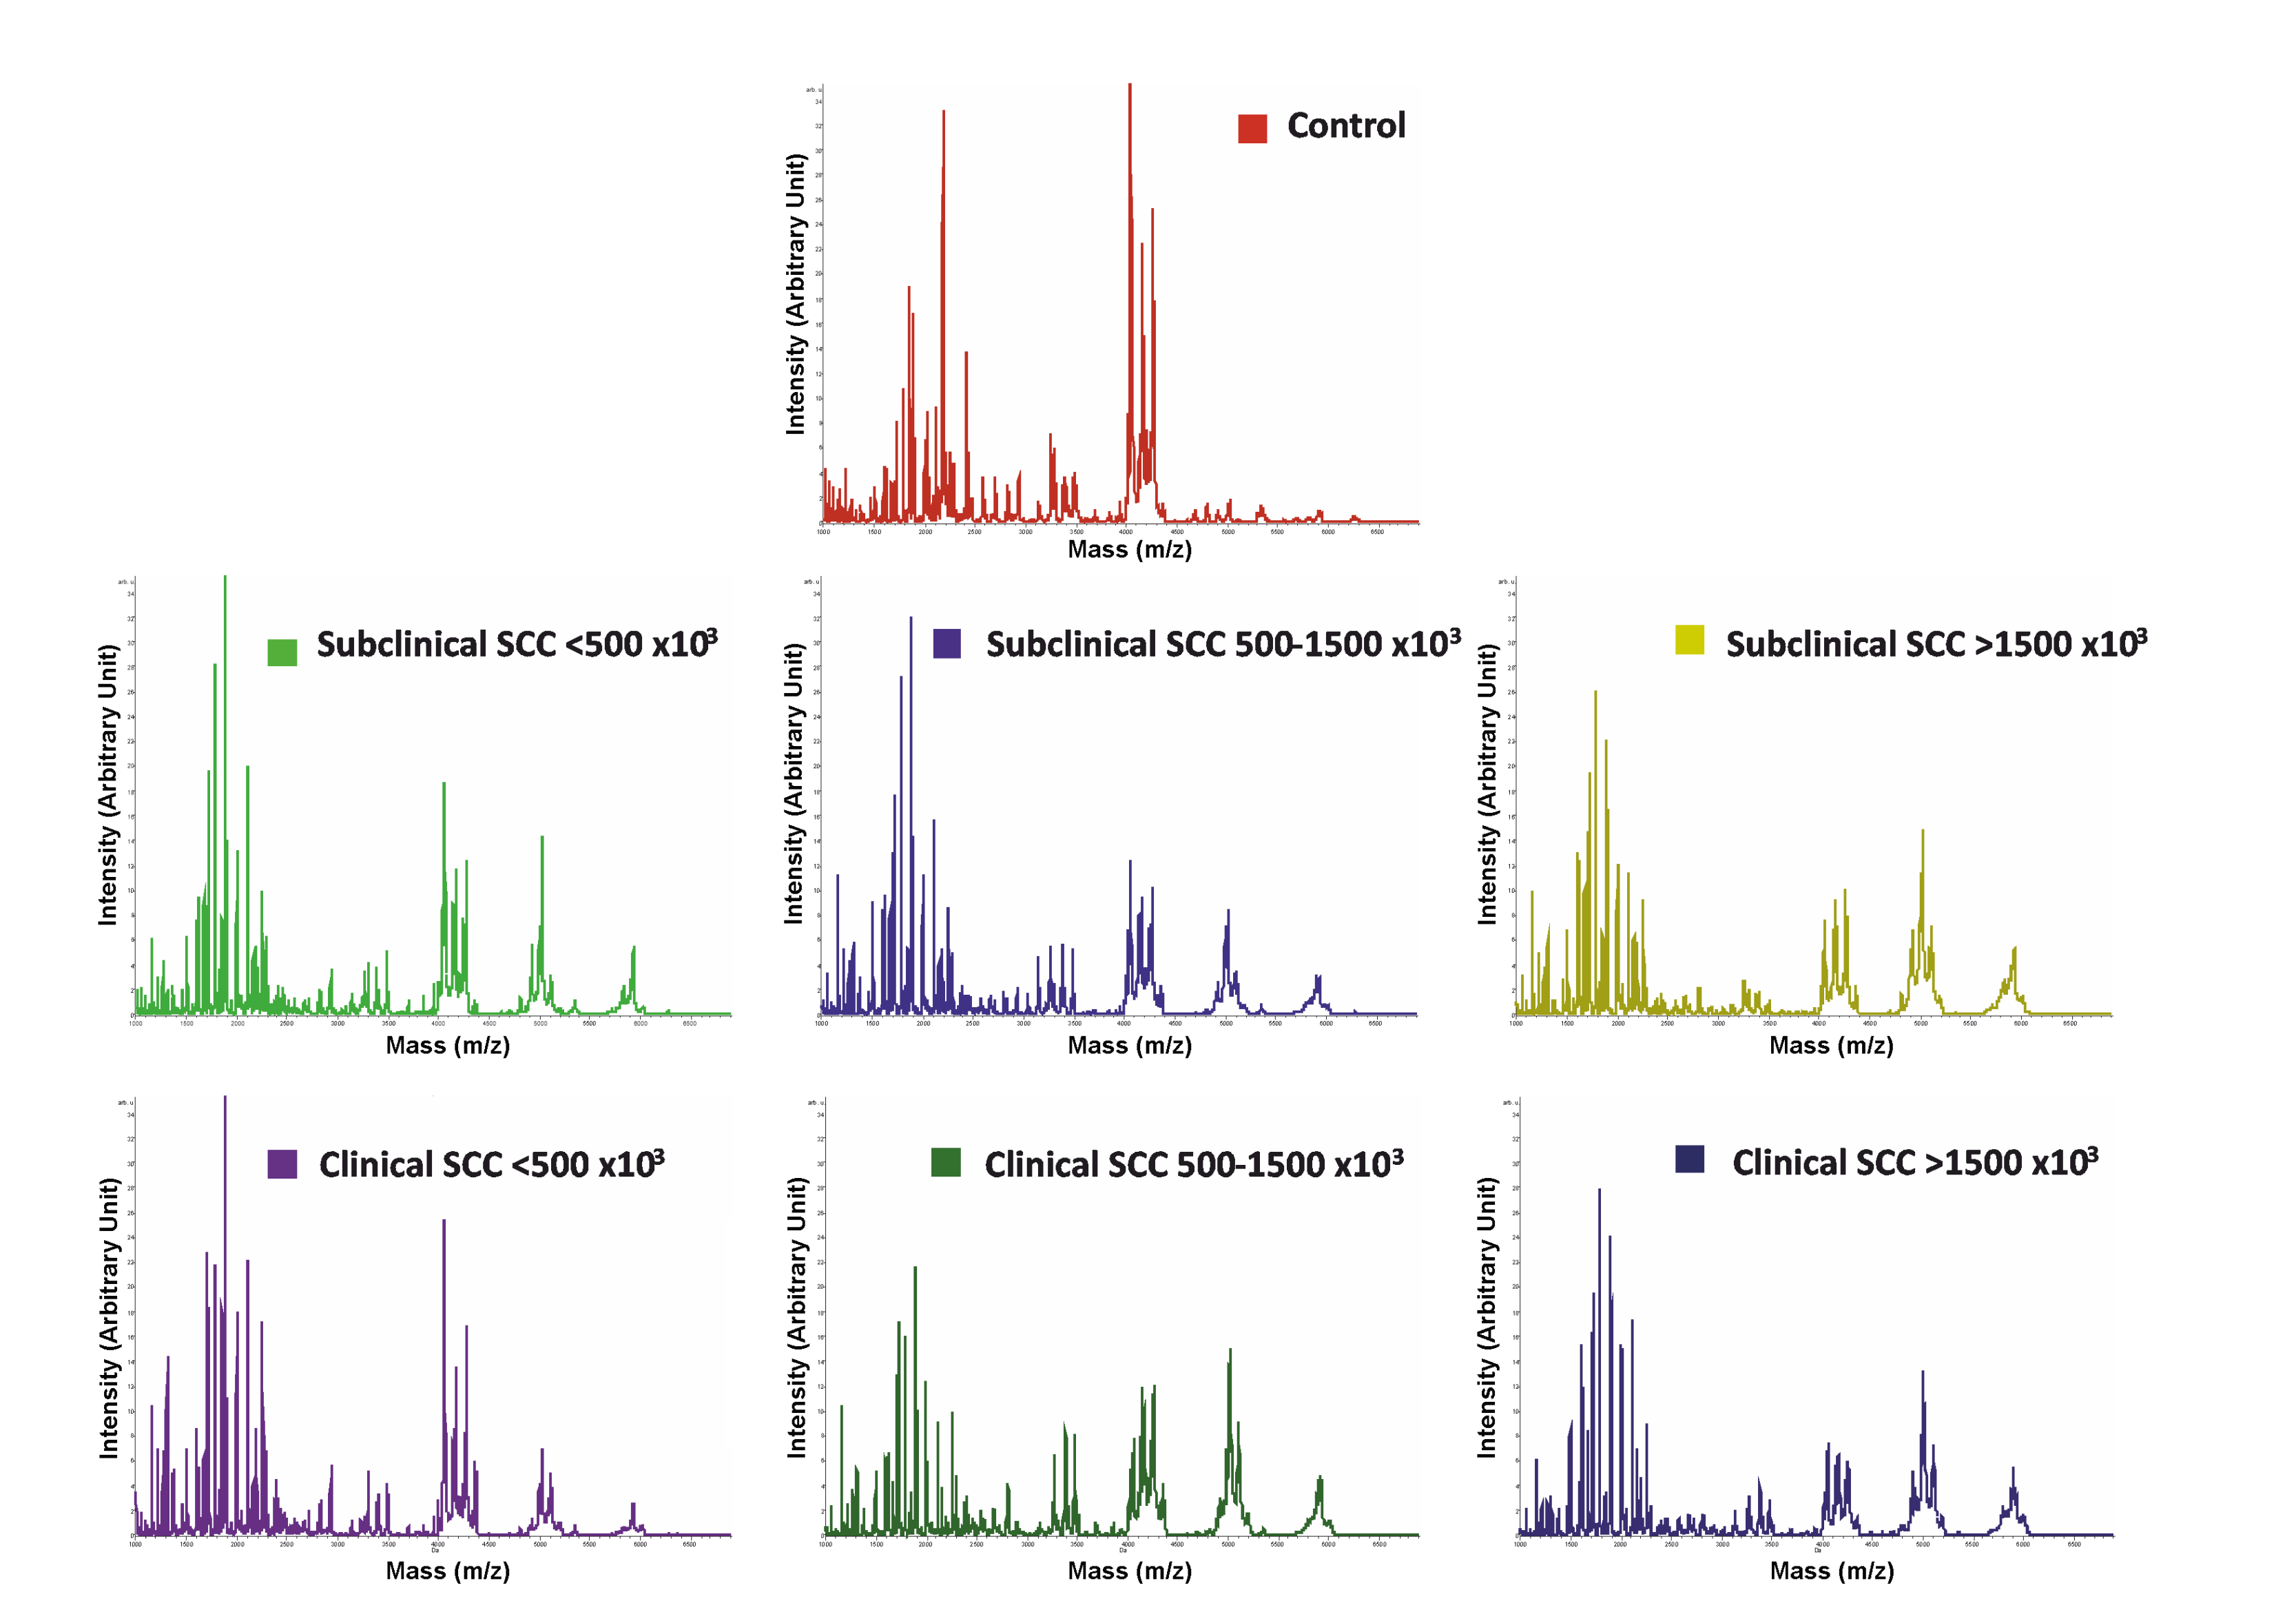
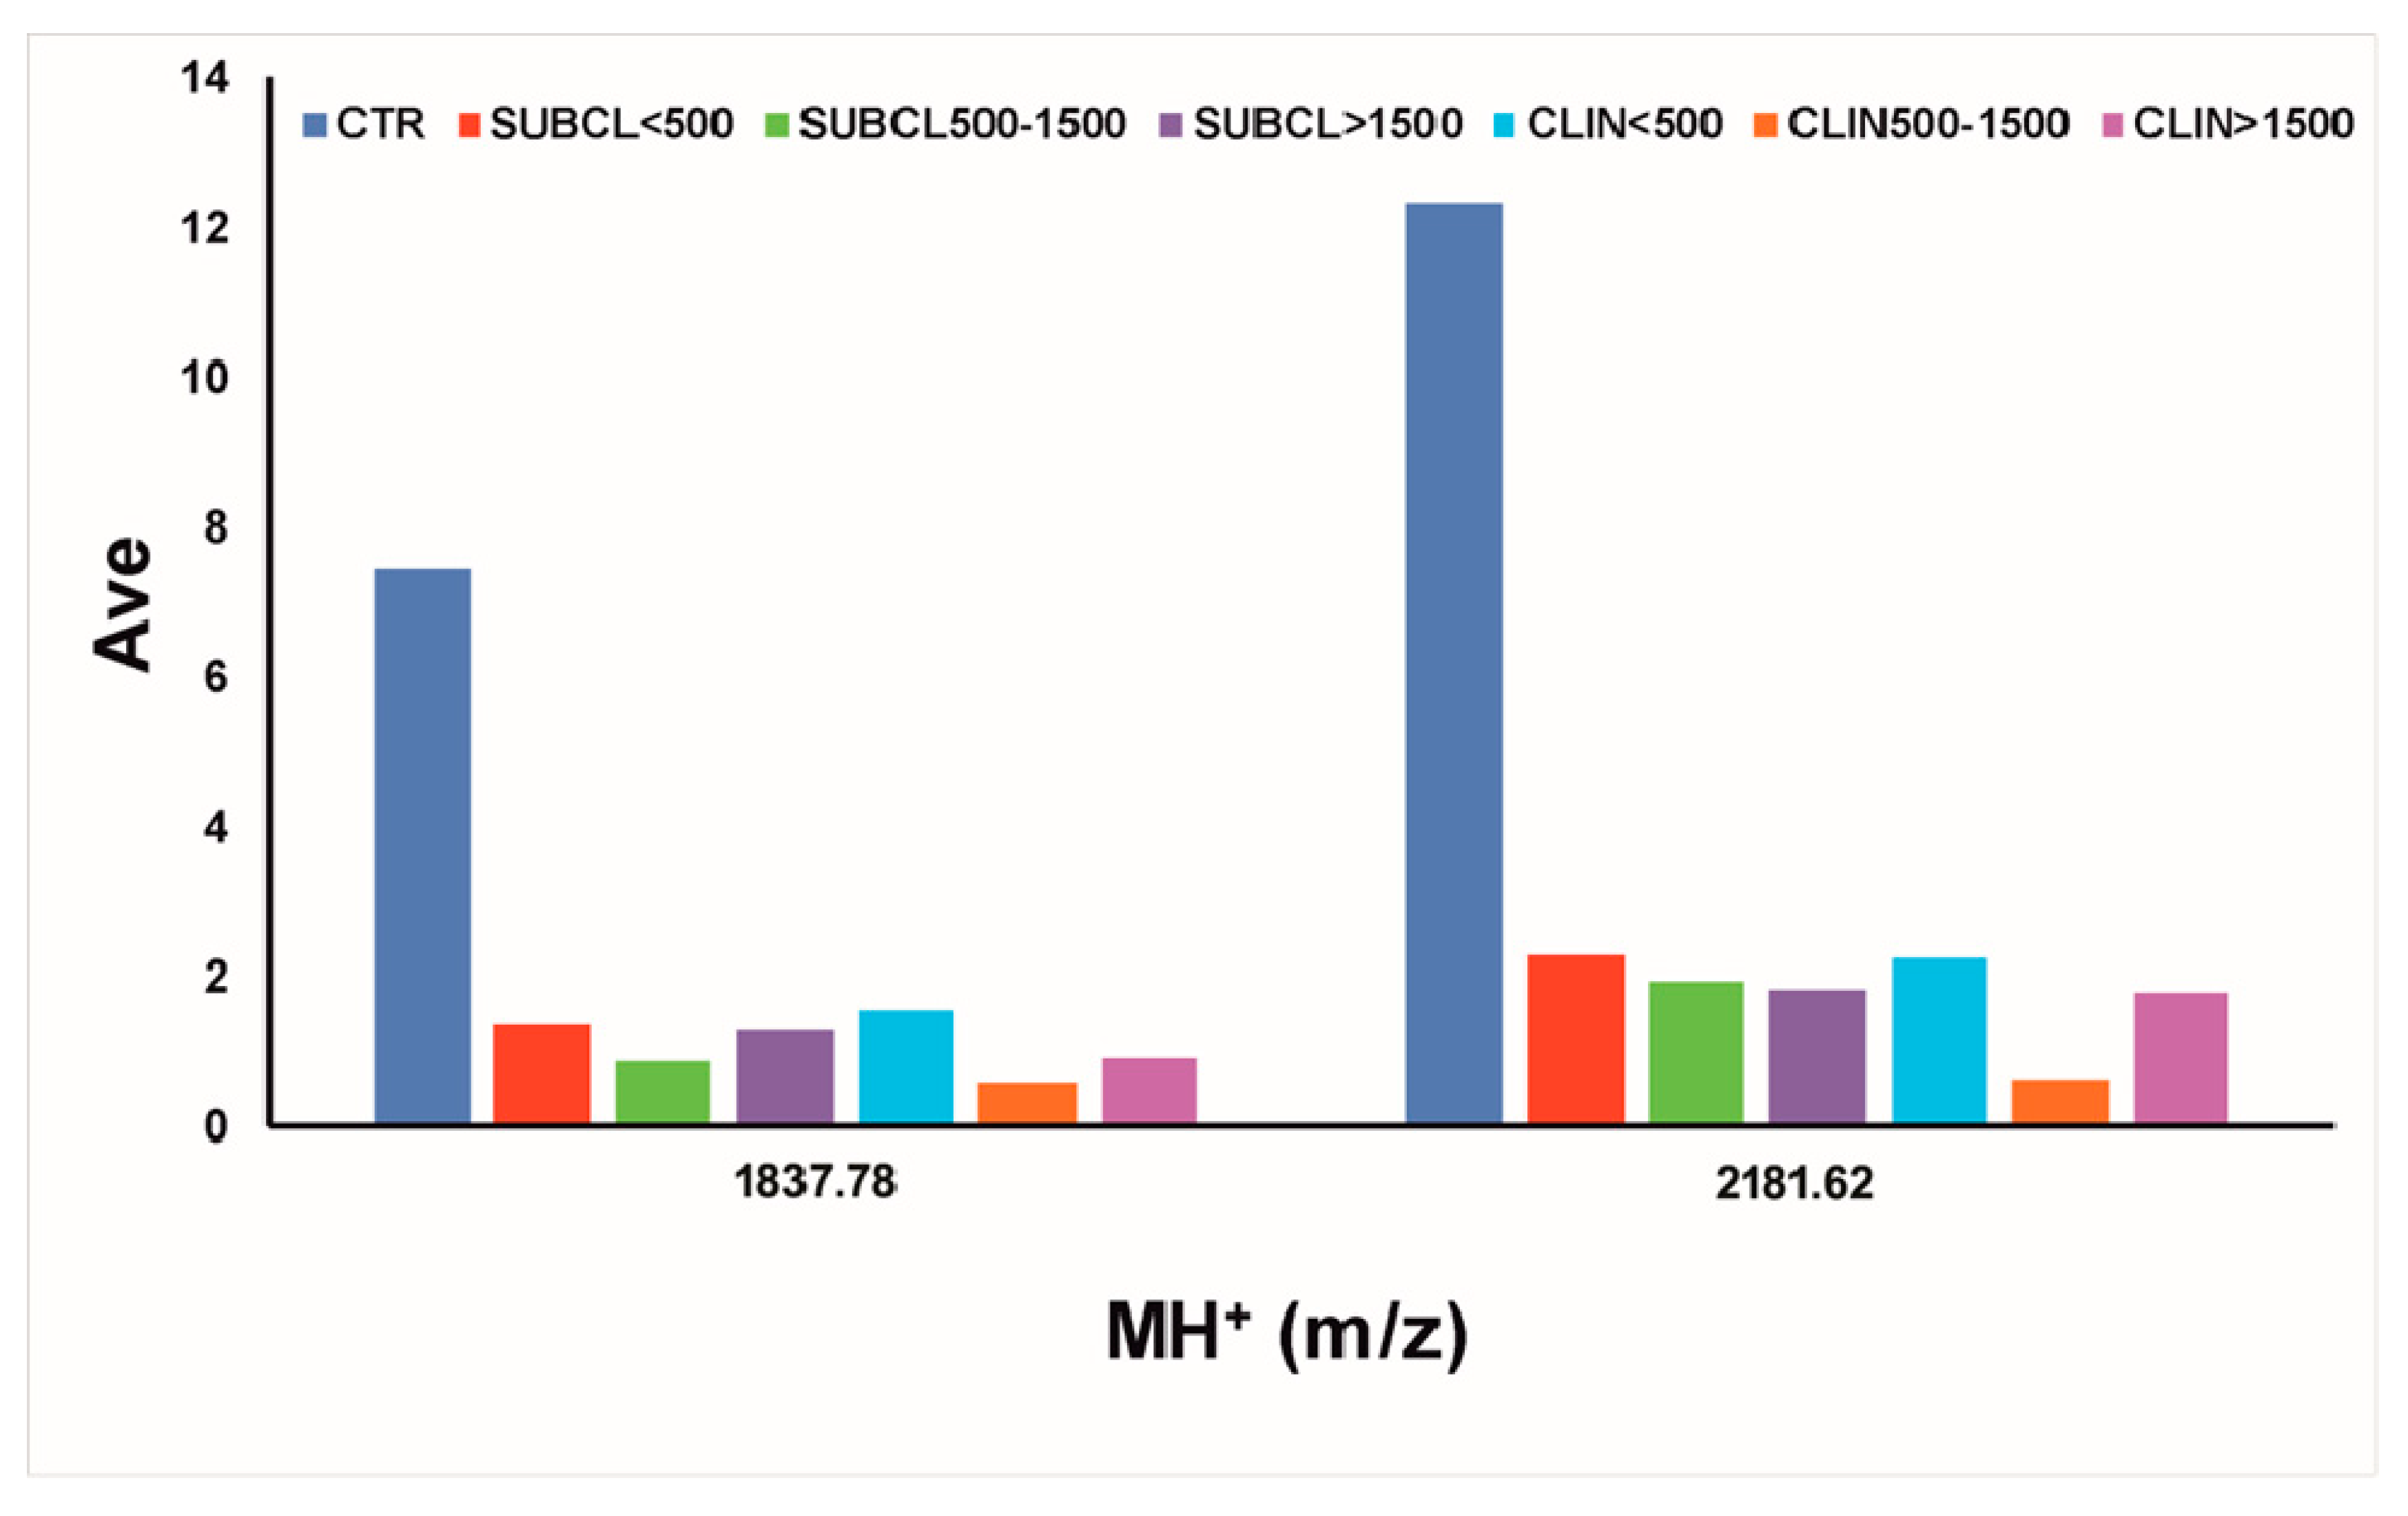
3.2. MALDI-TOF-MS Peptide Profiling
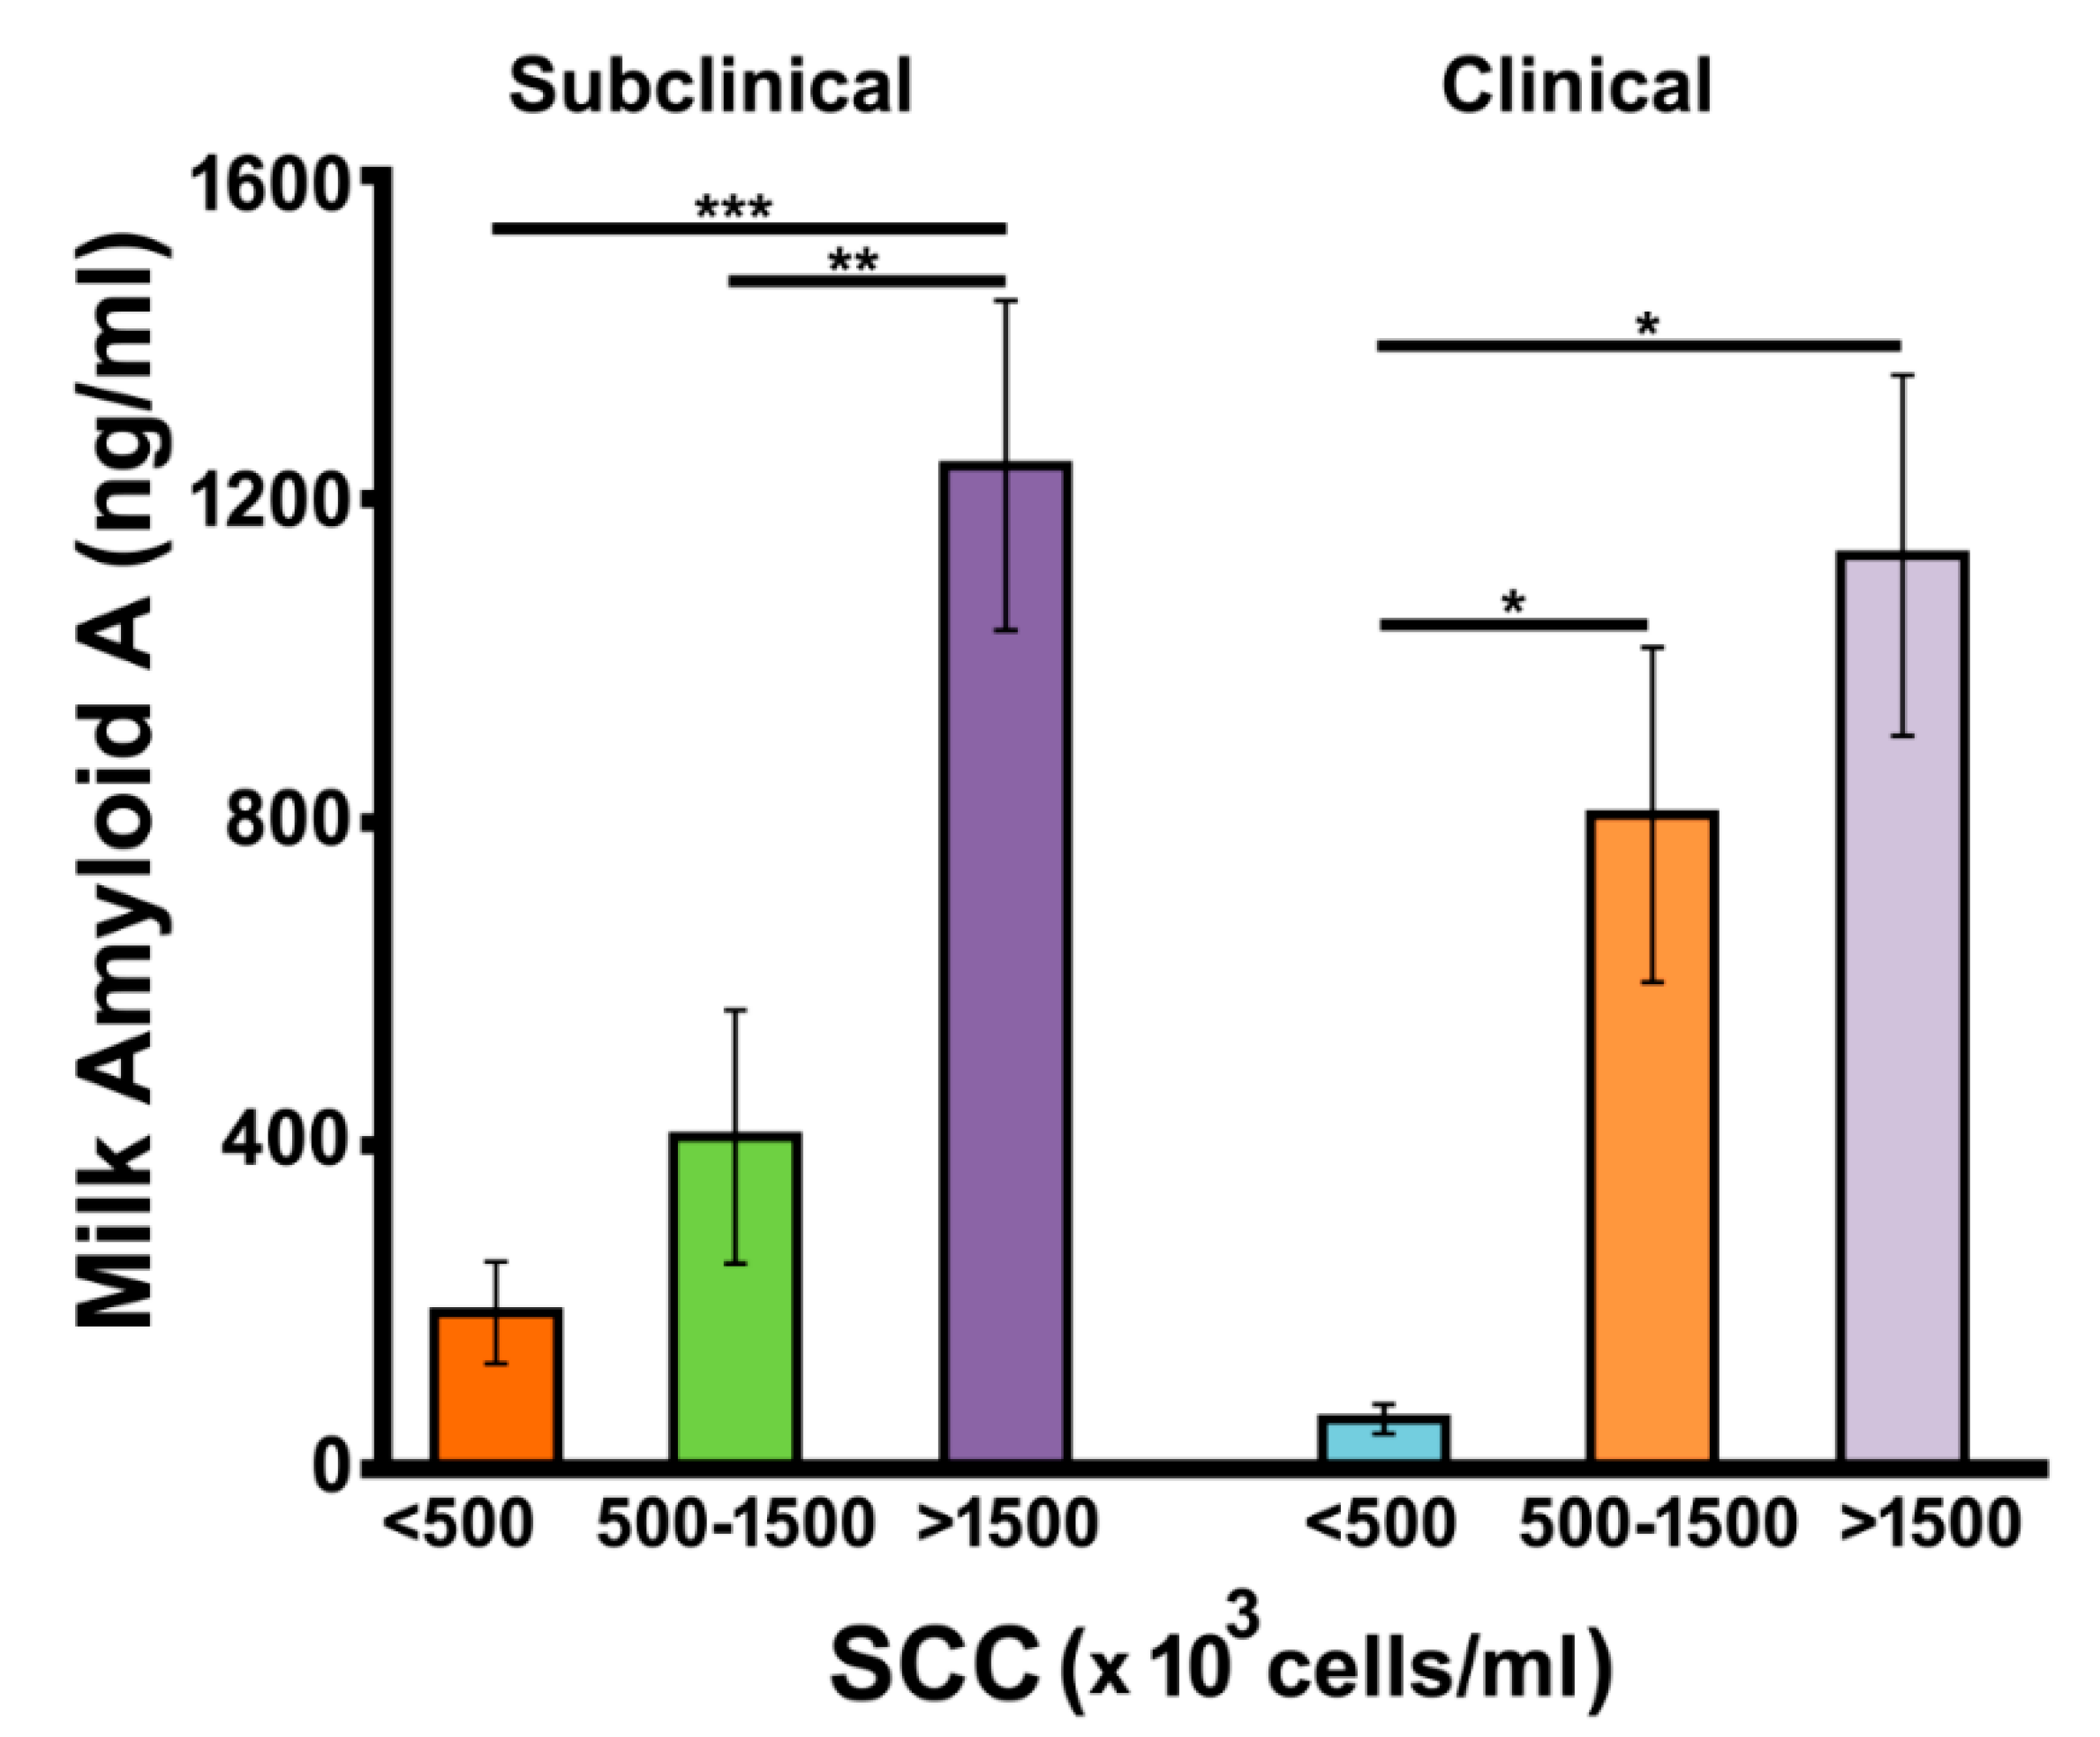
3.3. Determination of Milk Amyloid A
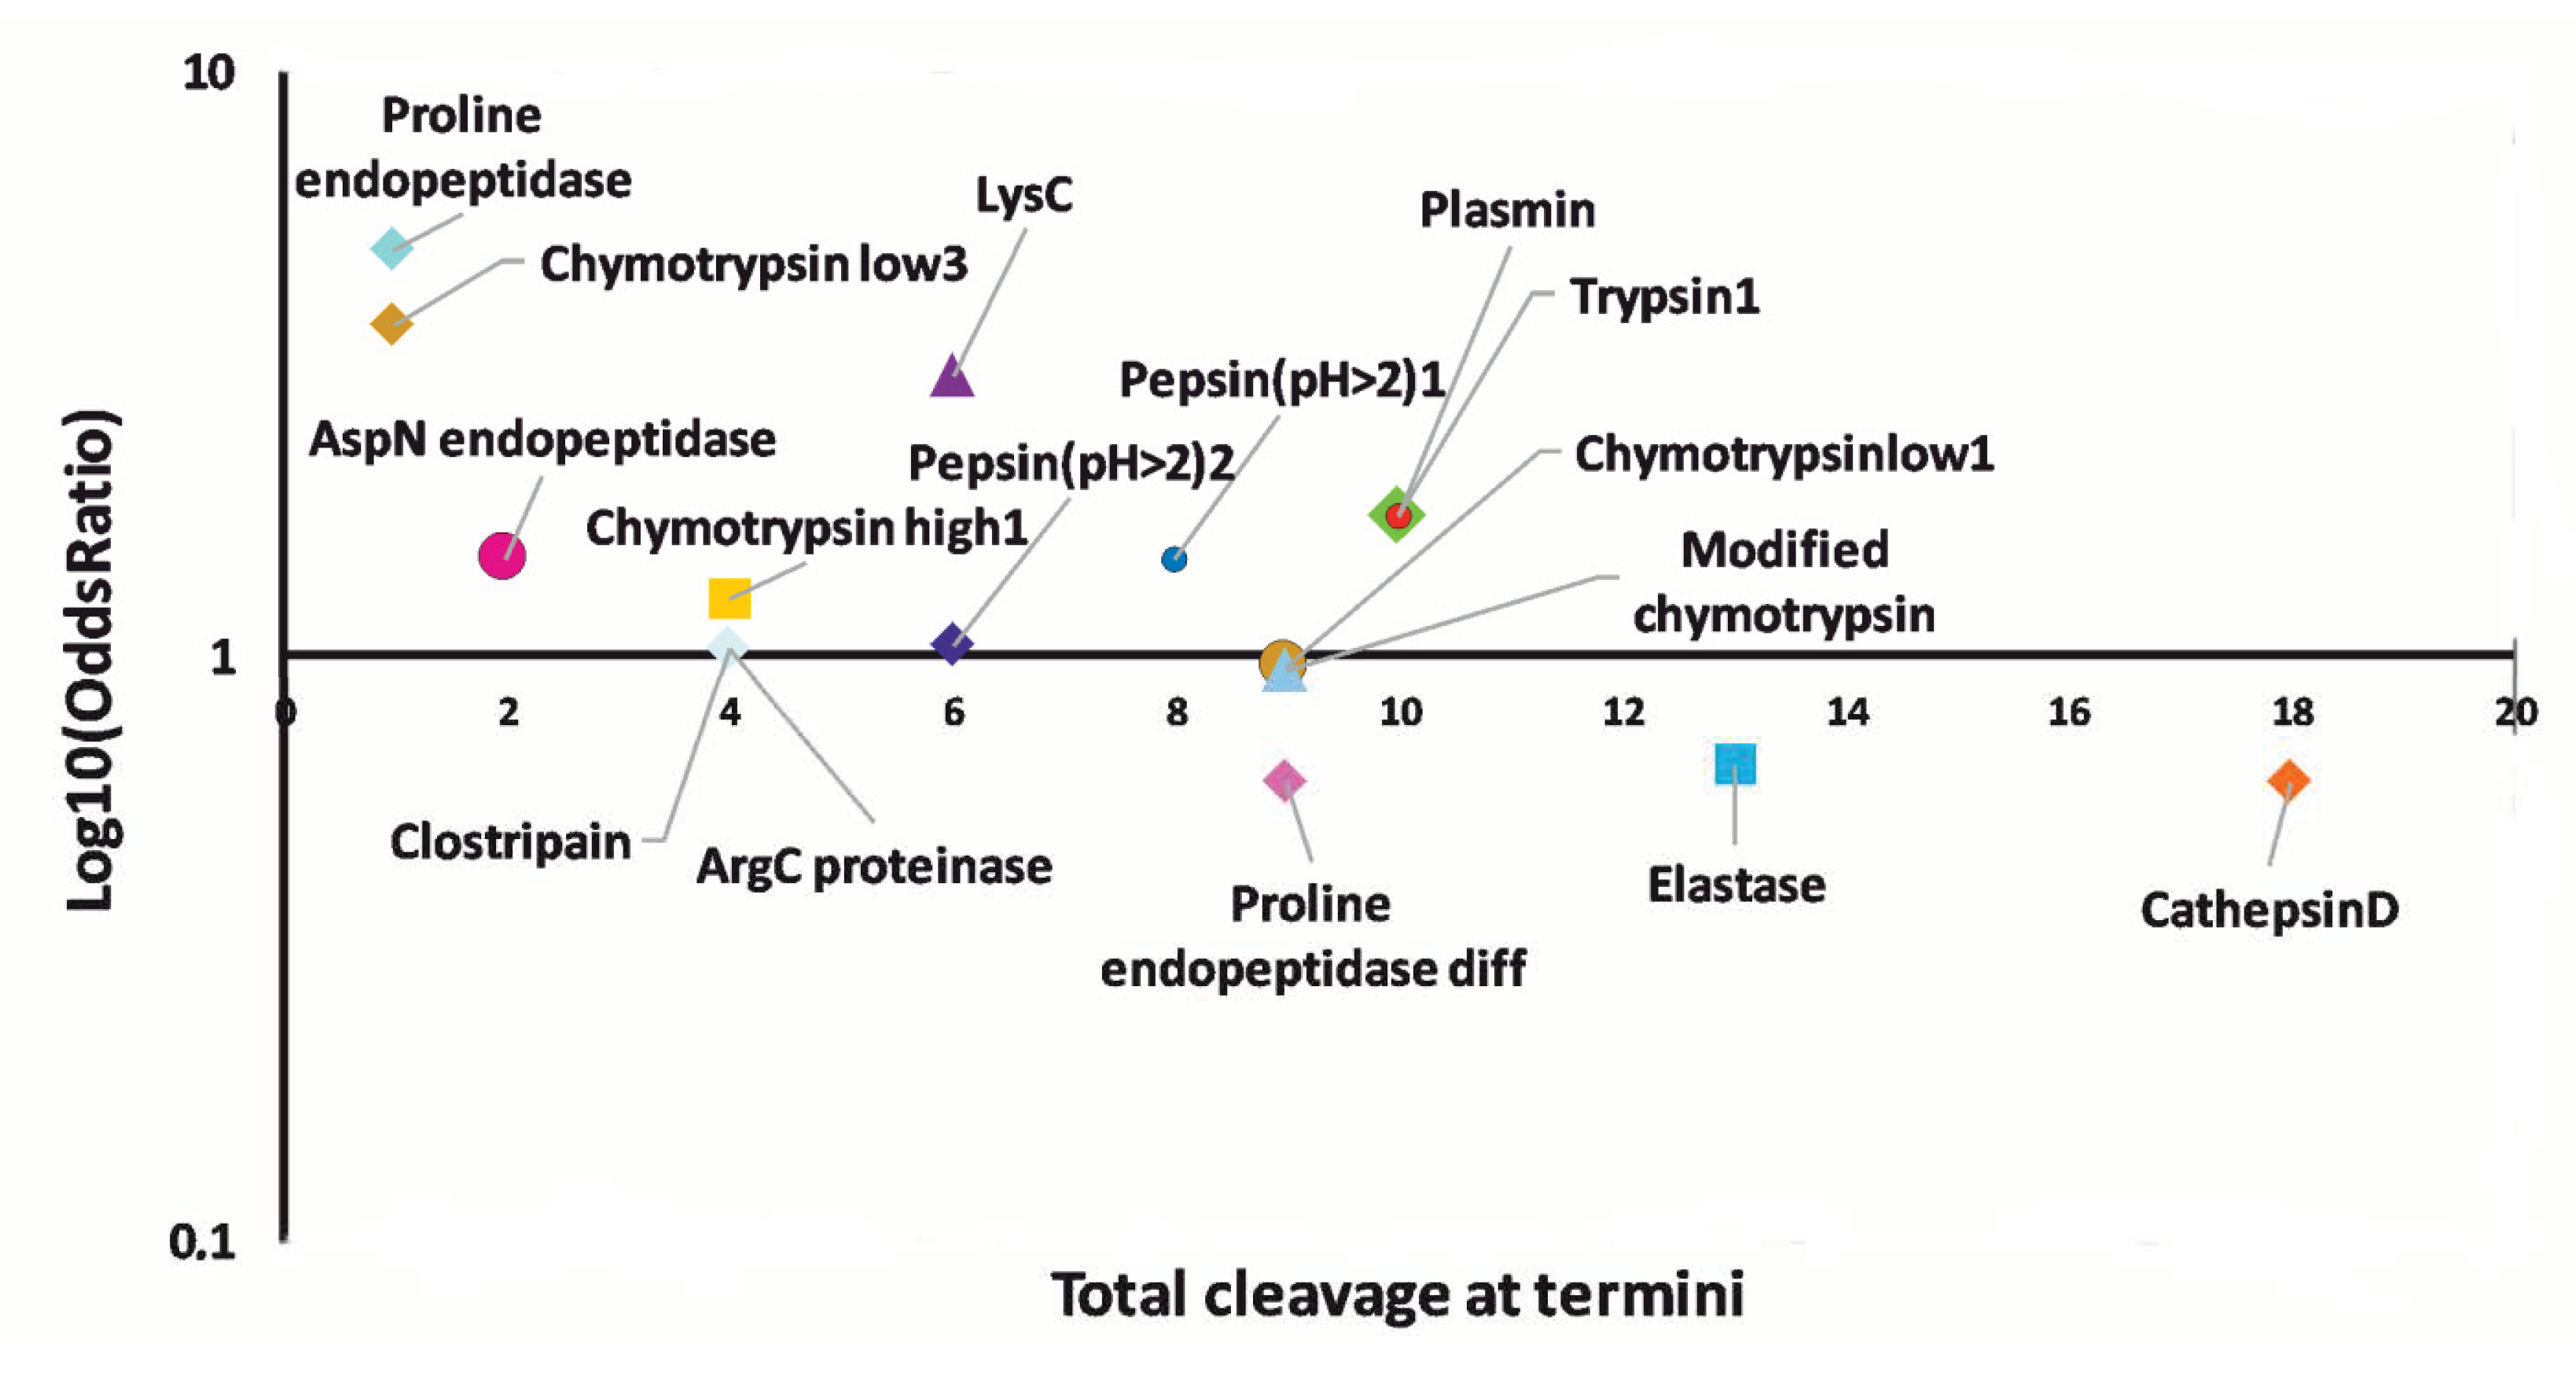
3.4. Prediction of Proteases Generating Milk Peptides Ascertained in Mastitis
3.5. Peptide Function Prediction
4. Conclusions
Supplementary Materials
Author Contributions
Funding
Conflicts of Interest
References
- Haenlein, G.F.H. Goat milk in human nutrition. Small Rumin. Res. 2004, 51, 155–163. [Google Scholar] [CrossRef]
- Kumar, H.; Yadav, D.; Kumar, N. Nutritional and nutraceutical proprieties of goat milk—A review. Indian J. Dairy Sci. 2016, 69, 513–518. [Google Scholar]
- Bernacka, H. Health-promoting properties of goat milk. Med. Wet. 2011, 67, 507–511. [Google Scholar]
- Tomotake, H.; Okuyama, R.; Katagiri, M.; Fuzita, M.; Yamato, M.; Ota, F. Comparsion between Holstein cow’s milk and Japanese Saanen goat’s milk in fatty acid composition, lipid digestibility and protein profile. Biosci. Biotechnol. Biochem. 2006, 70, 2771–2774. [Google Scholar] [CrossRef]
- Núñez-Sáncheza, N.; Martínez-Marín, A.L.; Polvillo, O.; Fernández-Cabanás, V.M.; Carrizosa, J.; Urrutia, B.; Serradilla, J.M. Near infrared spectroscopy (NIRS) for determination of milk fat fatty acid profile of goats. Food Chem. 2016, 190, 244–252. [Google Scholar] [CrossRef]
- Tripathi, M.K. Effect of nutrition on production, composition, fatty acids and nutraceutical properties of milk. J. Adv. Dairy Res. 2014, 2, 115. [Google Scholar] [CrossRef]
- Boutoidal, K.; Ferrandini, E.; Rovira, S.; Garcia, V.; Lopez, M.B. Effect of feeding goats with Rosemary (Rosmarinus officinalis spp.) by products on milk and cheese properties. Small Rumin. Res. 2013, 112, 147–153. [Google Scholar] [CrossRef]
- Durge, S.M.; Tripathi, M.K.; Prabhat, T.; Dutta, N.; Rout, P.K.; Chaudhary, U.B. Intake, nutrient utilization, rumen fermentation, microbial hydrolytic enzymes and hemato-biochemical attributes of lactating goats fed concentrates containing Brassica juncea oil meal. Small Rumin. Res. 2014, 121, 300–307. [Google Scholar] [CrossRef]
- Garcia, V.; Rovira, S.; Boutoial, K.; Lopez, M.B. Improvement in goat milk quality. Small Rumin. Res. 2014, 121, 51–57. [Google Scholar] [CrossRef]
- Barrón-Bravo, O.G.; Gutiérrez-Chàvez, A.J.; Angel-Sahagùn, C.A.; Montaldo, H.H.; Shepard, L.; Valencia-Posadas, M. Losses in milk yield, fat and protein contents according to different levels of somatic cell count in dairy goats. Small Rumin. Res. 2013, 113, 421–431. [Google Scholar] [CrossRef]
- Jiménez-Granado, R.; Sánchez-Rodríguez, M.; Arce, C.; Rodríguez-Estévez, V. Factors affecting somatic cell count in dairy goats: A review. Span. J. Agric. Res. 2014, 12, 133–150. [Google Scholar] [CrossRef]
- Ceniti, C.; Britti, D.; Santoro, A.M.L.; Musarella, R.; Ciambrone, L.; Casalinuovo, F.; Costanzo, N. Phenotypic antimicrobial resistance profile of isolates causing clinical mastitis in dairy animals. Ital. J. Food Saf. 2017, 6, 6612. [Google Scholar] [CrossRef]
- Contreras, A.; Sierra, D.; Sánchez, A.; Corrales, J.C.; Marco, J.C.; Paape, M.J.; Gonzalo, C. Mastitis in small ruminants. Small Rumin. Res. 2007, 68, 145–153. [Google Scholar] [CrossRef]
- Silanikove, N.; Merin, U.; Shapiro, F.; Leitner, G. Subclinical mastitis in goats is associated with upregulation of nitric oxide-derived oxidative stress that causes reduction of milk antioxidative properties and impairment of its quality. J. Dairy Sci. 2014, 97, 3449–3455. [Google Scholar] [CrossRef]
- Viguier, C.; Arora, S.; Gilmartin, N.; Welbeck, K.; O’Kennedy, R. Mastitis detection: Current trends and future perspectives. Trends Biotechnol. 2009, 27, 486–493. [Google Scholar] [CrossRef]
- Dulin, A.M.; Paape, M.J.; Schultze, W.D.; Weinland, B.T. Effect of parity, stage of lactation, and intramammary infection on concentration of somatic cells and cytoplasmic particles in goat milk. J. Dairy Sci. 1983, 66, 2426–2433. [Google Scholar] [CrossRef]
- Park, Y.W.; Humphrey, R.D. Bacterial cell counts in goat milk and their correlations with somatic cell counts, percent fat, and protein. J. Dairy Sci. 1986, 69, 32–37. [Google Scholar] [CrossRef]
- Koop, G.; van Werven, T.; Toft, N.; Nielen, M. Estimating test characteristics of somatic cell count to detect Staphylococcus aureus-infected dairy goats using latent class analysis. J. Dairy Sci. 2011, 94, 2902–2911. [Google Scholar] [CrossRef]
- Wooding, F.B.P.; Peaker, M.; Linzell, J.L. Theories of milk secretion: Evidence from the electron microscopic examination of milk. Nature 1970, 226, 762–764. [Google Scholar] [CrossRef]
- Wooding, F.B.P.; Morgan, G.; Craig, H. “Sunbursts” and “christiesomes”: Cellular fragments in normal cow and goat milk. Cell Tissue Res. 1977, 185, 535–545. [Google Scholar] [CrossRef]
- Bergonier, D.; De Crémoux, R.; Rupp, R.; Lagriffoul, G.; Berthelot, X. Mastitis of dairy small ruminants. Vet. Res. 2003, 34, 689–716. [Google Scholar] [CrossRef]
- Clark, S.; Mora García, M.B. A 100-Year Review: Advances in goat milk research. J. Dairy Sci. 2017, 100, 10026–10044. [Google Scholar] [CrossRef]
- Koop, G.; Nielen, M.; van Werven, T. Diagnostic tools to monitor udder health in dairy goats. Vet. Q. 2012, 32, 37–44. [Google Scholar] [CrossRef][Green Version]
- Kandeel, S.A.; Morin, D.E.; Calloway, C.D.; Constable, P.D. Association of California mastitis test scores with intramammary infection status in lactating dairy cows admitted to a veterinary teaching hospital. J. Vet. Intern. Med. 2018, 32, 497–505. [Google Scholar] [CrossRef]
- Rossi, R.S.; Amarante, A.F.; Correia, L.B.N.; Guerra, S.T.; Nobrega, D.B.; Latosinski, G.S.; Rossi, B.F.; Rall, V.L.M.; Pantoja, J. Diagnostic accuracy of Somaticell, California mastitis test, and microbiological examination of composite milk to detect Streptococcus agalactiae intramammary infections. J. Dairy Sci. 2018, 101, 10220–10229. [Google Scholar] [CrossRef]
- Cremonesi, P.; Ceccarani, C.; Curone, G.; Severgnini, M.; Pollera, C.; Bronzo, V.; Riva, F.; Addis, M.F.; Filipe, J.; Amadori, M.; et al. Milk microbiome diversity and bacterial group prevalence in a comparison between healthy Holstein Friesian and Rendena cows. PLoS ONE 2018, 13, e0205054. [Google Scholar] [CrossRef]
- Derakhshani, H.; Plaizier, J.C.; De Buck, J.; Barkema, H.W.; Khafipour, E. Composition of the teat canal and intramammary microbiota of dairy cows subjected to antimicrobial dry cow therapy and internal teat sealant. J. Dairy Sci. 2018, 101, 10191–10205. [Google Scholar] [CrossRef]
- El-Sayed, A.; Awad, W.; Abdou, N.E.; Vázquez, H.C. Molecular biological tools applied for identification of mastitis causing pathogens. Int. J. Vet. Sci. Med. 2017, 5, 89–97. [Google Scholar] [CrossRef]
- Lima, S.F.; de Souza Bicalho, M.L.; Bicalho, R.C. Evaluation of milk sample fractions for characterization of milk microbiota from healthy and clinical mastitis cows. PLoS ONE 2018, 13, e0193671. [Google Scholar] [CrossRef]
- Behera, S.; Rana, R.; Gupta, P.K.; Kumar, D.; Rekha, V.; Arun, T.R.; Jena, D. Development of real-time PCR assay for the detection of Mycoplasma bovis. Trop. Anim. Health Prod. 2018, 50, 875–882. [Google Scholar] [CrossRef]
- Tie, Z.; Chunguang, W.; Xiaoyuan, W.; Xinghua, Z.; Xiuhui, Z. Loop-mediated isothermal amplification for detection of Staphylococcus aureus in dairy cow suffering from mastitis. J. Biomed. Biotechnol. 2012, 2012, 435982. [Google Scholar] [CrossRef]
- Sheet, O.H.; Grabowski, N.T.; Klein, G.; Abdulmawjood, A. Development and validation of a loop mediated isothermal amplification (LAMP) assay for the detection of Staphylococcus aureus in bovine mastitis milk samples. Mol. Cell Probes 2016, 30, 320–325. [Google Scholar] [CrossRef]
- Oultram, J.W.; Ganda, E.K.; Boulding, S.C.; Bicalho, R.C.; Oikonomou, G. A metataxonomic approach could be considered for cattle clinical mastitis diagnostics. Front. Vet. Sci. 2017, 4, 36. [Google Scholar] [CrossRef]
- Cornelissen, J.B.W.J.; De Greeff, A.; Heuvelink, A.E.; Swarts, M.; Smith, H.E.; Van der Wal, F.J. Rapid detection of Streptococcus uberis in raw milk by loop-mediated isothermal amplification. J. Dairy Sci. 2016, 99, 4270–4281. [Google Scholar] [CrossRef]
- Ashraf, A.; Imran, M. Diagnosis of bovine mastitis: From laboratory to farm. Trop. Anim. Health Prod. 2018, 50, 1193–1202. [Google Scholar] [CrossRef]
- Smolenski, G.; Haines, S.; Kwan, F.Y.-S.; Bond, J.; Farr, V.; Davis, S.R.; Stelwagen, K.; Wheeler, T.T. Characterisation of host defence proteins in milk using a proteomic approach. J. Proteome Res. 2007, 6, 207–215. [Google Scholar] [CrossRef]
- Boehmer, J.L.; Bannerman, D.D.; Shefcheck, K.; Ward, J.L. Proteomic analysis of differentially expressed proteins in bovine milk during experimentally induced Escherichia coli mastitis. J. Dairy Sci. 2008, 91, 4206–4218. [Google Scholar] [CrossRef]
- Danielsen, M.; Codrea, M.C.; Ingvartsen, K.L.; Friggens, N.C.; Bendixen, E.; Røntved, C.M. Quantitative milk proteomics-host responses to lipopolysaccharide-mediated inflammation of bovine mammary gland. Proteomics 2010, 10, 2240–2249. [Google Scholar] [CrossRef]
- Ibeagha-Awemu, E.M.; Ibeagha, A.E.; Messier, S.; Zhao, X. Proteomics, genomics, and pathway analyses of Escherichia coli and Staphylococcus aureus infected milk whey reveal molecular pathways and networks involved in mastitis. J. Proteome Res. 2010, 9, 4604–4619. [Google Scholar] [CrossRef]
- Larsen, L.B.; Hinz, K.; Jørgensen, A.L.; Møller, H.S.; Wellnitz, O.; Bruckmaier, R.M.; Kelly, A.L. Proteomic and peptidomic study of proteolysis in quarter milk after infusion with lipoteichoic acid from Staphylococcus aureus. J. Dairy Sci. 2010, 93, 5613–5626. [Google Scholar] [CrossRef]
- Hinz, K.; Larsen, L.B.; Wellnitz, O.; Bruckmaier, R.M.; Kelly, A.L. Proteolytic and proteomic changes in milk at quarter level following infusion with Escherichia coli lipopolysaccharide. J. Dairy Sci. 2012, 95, 1655–1666. [Google Scholar] [CrossRef]
- Alonso-Fauste, I.; Andrés, M.; Iturralde, M.; Lampreave, F.; Gallart, J.; Álava, M.A. Proteomic characterization by 2-DE in bovine serum and whey from healthy and mastitis affected farm animals. J. Proteom. 2012, 75, 3015–3030. [Google Scholar] [CrossRef]
- Zhang, L.; Boeren, S.; van Hooijdonk, A.C.; Vervoort, J.M.; Hettinga, K.A. A proteomic perspective on the changes in milk proteins due to high somatic cell count. J. Dairy Sci. 2015, 98, 5339–5351. [Google Scholar] [CrossRef]
- Mudaliar, M.; Tassi, R.; Thomas, F.C.; McNeilly, T.N.; Weidt, S.K.; McLaughlin, M.; Wilson, D.; Burchmore, R.; Herzyk, P.; Eckersall, P.D.; et al. Mastitomics, the integrated omics of bovine milk in an experimental model of Streptococcus uberis mastitis: 2. Label-free relative quantitative proteomics. Mol. Biosyst. 2016, 12, 2748–2761. [Google Scholar] [CrossRef]
- Thomas, F.C.; Mullen, W.; Tassi, R.; Ramírez-Torres, A.; Mudaliar, M.; McNeilly, T.N.; Zadoks, R.N.; Burchmore, R.; David Eckersall, P. Mastitomics, the integrated omics of bovine milk in an experimental model of Streptococcus uberis mastitis: 1. High abundance proteins, acute phase proteins and peptidomics. Mol. Biosyst. 2016, 12, 2735–2747. [Google Scholar] [CrossRef]
- Abdelmegid, S.; Murugaiyan, J.; Abo-Ismail, M.; Caswell, J.L.; Kelton, D.; Kirby, G.M. Identification of Host Defense-Related Proteins Using Label-Free Quantitative Proteomic Analysis of Milk Whey from Cows with Staphylococcus aureus Subclinical Mastitis. Int. J. Mol. Sci. 2018, 19, 78. [Google Scholar] [CrossRef]
- Addis, M.F.; Pisanu, S.; Ghisaura, S.; Pagnozzi, D.; Marogna, G.; Tanca, A.; Biosa, G.; Cacciotto, C.; Alberti, A.; Pittau, M.; et al. Proteomics and pathway analyses of the milk fat globule in sheep naturally infected by Mycoplasma agalactiae provide indications of the in vivo response of the mammary epithelium to bacterial infection. Infect. Immun. 2011, 79, 3833–3845. [Google Scholar] [CrossRef]
- Chiaradia, E.; Valiani, A.; Tartaglia, M.; Scoppetta, F.; Renzone, G.; Arena, S.; Avellini, L.; Benda, S.; Gaiti, A.; Scaloni, A. Ovine subclinical mastitis: Proteomic analysis of whey and milk fat globules unveils putative diagnostic biomarkers in milk. J. Proteom. 2013, 83, 144–159. [Google Scholar] [CrossRef] [PubMed]
- Katsafadou, A.I.; Tsangaris, G.T.; Anagnostopoulos, A.K.; Billinis, C.; Barbagianni, M.S.; Vasileiou, N.G.C.; Spanos, S.A.; Mavrogianni, V.S.; Fthenakis, G.C. Differential quantitative proteomics study of experimental Mannheimia haemolytica mastitis in sheep. J. Proteom. 2019, 205, 103393. [Google Scholar] [CrossRef]
- Olumee-Shabon, Z.; Swain, T.; Smith, E.A.; Tall, E.; Boehmer, J.L. Proteomic analysis of differentially expressed proteins in caprine milk during experimentally induced endotoxin mastitis. J. Dairy Sci. 2013, 96, 2903–2912. [Google Scholar] [CrossRef] [PubMed]
- Pisanu, S.; Cacciotto, C.; Pagnozzi, D.; Uzzau, S.; Pollera, C.; Penati, M.; Bronzo, V.; Addis, M.F. Impact of Staphylococcus aureus infection on the late lactation goat milk proteome: New perspectives for monitoring and understanding mastitis in dairy goats. J. Proteom. 2020, 221, 103763. [Google Scholar] [CrossRef] [PubMed]
- Mansor, R.; Mullen, W.; Albalat, A.; Zerefos, P.; Mischak, H.; Barrett, D.C.; Biggs, A.; Eckersall, P.D. A peptidomic approach to biomarker discovery for bovine mastitis. J. Proteom. 2013, 85, 89–98. [Google Scholar] [CrossRef] [PubMed]
- Guerrero, A.; Dallas, D.C.; Contreras, S.; Bhandari, A.; Cánovas, A.; Islas-Trejo, A.; Medrano, J.F.; Parker, E.A.; Wang, M.; Hettinga, K.; et al. Peptidomic analysis of healthy and subclinically mastitic bovine milk. Int. Dairy J. 2015, 46, 46–52. [Google Scholar] [CrossRef]
- Magro, M.; Zaccarin, M.; Miotto, G.; Da-Dalt, L.; Baratella, D.; Fariselli, P.; Gabai, G.; Vianello, F. Analysis of hard protein corona composition on selective iron oxide nanoparticles by MALDI-TOF mass spectrometry: Identification and amplification of a hidden mastitis biomarker in milk proteome. Anal. Bioanal. Chem. 2018, 410, 2949–2959. [Google Scholar] [CrossRef]
- Sassi, M.; Arena, S.; Scaloni, A. MALDI-TOF-MS Platform for Integrated Proteomic and Peptidomic Profiling of Milk Samples Allows Rapid Detection of Food Adulterations. J. Agric. Food Chem. 2015, 63, 7093. [Google Scholar] [CrossRef]
- Arena, S.; Salzano, A.M.; Scaloni, A. Identification of protein markers for the occurrence of defrosted material in milk through a MALDI-TOF-MS profiling approach. J. Proteom. 2016, 147, 56–65. [Google Scholar] [CrossRef]
- D’Ambrosio, C.; Sarubbi, F.; Scaloni, A.; Rossetti, C.; Grazioli, G.; Auriemma, G.; Perucatti, A.; Spagnuolo, M.S. Effect of short-term water restriction on oxidative and inflammatory status of sheep (Ovis aries) reared in Southern Italy. Small Rumin. Res. 2018, 162, 77–84. [Google Scholar] [CrossRef]
- Kelly, W.G. Veterinary Clinical Diagnosis, 3rd ed.; Eastbourne: London, UK, 1984; p. 440. [Google Scholar]
- Malinowski, E.; Kłossowska, A. Diagnostyka Zakażeń Wymienia. Wyd. PIWet Puławy 2002, 46, 289–294. [Google Scholar]
- Hussein, H.A.; El-Razik, K.A.E.L.-H.A.; Gomaa, A.M.; Elbayoumy, M.K.; Abdelrahman, K.A.; Hosein, H.I. Milk amyloid A as a biomarker for diagnosis of subclinical mastitis in cattle. Vet. World 2018, 11, 34–41. [Google Scholar] [CrossRef] [PubMed]
- Edwards, P.R.; Ewing, W.H. Identification of Enterobacteriaceae, 4th ed.; Elsevier: New York, NY, USA, 1986; pp. 581–582. [Google Scholar]
- Quinn, P.J.; Markey, B.K.; Leonard, F.C.; Fitz Patrick, E.S.; Fanning, S.; Hartigan, P.J. Pasteurella species, Mannheimia haemolytica and Bibersteinia trehalosi. Veterinary Microbiology and Microbial Diseases, 2nd ed.; Wiley-Blackwell: Chichester, UK, 2011; pp. 299–308. [Google Scholar]
- Mishra, A.K.; Sharma, N.; Singh, D.D.; Gururaj, K.; Abhishek Kumar, V.; Sharma, D.K. Prevalence and bacterial etiology of subclinical mastitis in goats reared in organized farms. Vet. World 2018, 11, 20–24. [Google Scholar] [CrossRef]
- Raynal-Ljutovac, K.; Gaborit, P.; Lauret, A. The relationship between quality criteria of goat milk, its technological properties and the quality of the final products. Small Rumin. Res. 2005, 60, 167–177. [Google Scholar] [CrossRef]
- Paape, M.J.; Wiggans, G.R.; Bannerman, D.D.; Thomas, D.L.; Sanders, A.H.; Contreras, A.; Moroni, P.; Miller, R.H. Monitoring goat and sheep milk somatic cell counts. Small Rumin. Res. 2007, 68, 114–125. [Google Scholar] [CrossRef]
- International Dairy Federation. Bovine Mastitis: Definition and Guidelines for Diagnosis; International Dairy Federation: Brussels, Belgium, 1987. [Google Scholar]
- Moroni, P.; Pisoni, G.; Savoini, G.; van Lier, E.; Acuña, S.; Damián, J.P.; Meikle, A. Influence of Estrus of Dairy Goats on Somatic Cell Count, Milk Traits, and Sex Steroid Receptors in the Mammary Gland. J. Dairy Sci. 2007, 90, 790–797. [Google Scholar] [CrossRef]
- Gonzalo, C. Somatic cell of sheep and goat milks, analytical, sanitary, productive and technological aspects. Int. Dairy Fed. Spec. Issue 2005, 3, 128–133. [Google Scholar]
- Mavrogenis, A.P.; Koumas, A.; Kakoyiannis, C.K.; Taliotis, C.H. Use of somatic cell counts for the detection of subclinical mastitis in sheep. Small Rumin. Res. 1995, 17, 79–84. [Google Scholar] [CrossRef]
- De Cremoux, R.; Poutrel, B.; Berny, F. Use of milk somatic cell counts (SCC) for presumptive diagnosis of intramammary infections in goats. In Proceedings of the Third International Mastitis Seminar, Tel-Aviv, Israel, 28 May–1 June 1995; pp. 90–91. [Google Scholar]
- Paape, M.J.; Poutrel, B.; Contreras, A.; Marco, J.C.; Capuco, A.V. Milk somatic cells and lactation in small ruminants. J. Dairy Sci. 2001, 84, 237–244. [Google Scholar] [CrossRef]
- Contreras, A.; Sierra, D.; Corrales, J.C.; Sánchez, A.; Marco, J. Physiological threshold of somatic-cell count and California Mastitis Test for diagnosis of caprine subclinical mastitis. Small Rumin. Res. 1996, 21, 259–264. [Google Scholar] [CrossRef]
- Contreras, A.; Luengo, C.; Sánchez, A.; Corrales, J.C. The role of intramammary pathogens in dairy goats. Livest. Prod. Sci. 2003, 79, 273–283. [Google Scholar] [CrossRef]
- Souza, F.N.; Blagitz, M.G.; Penna, C.F.A.M.; Della Libera, A.M.M.P.; Heinemann, M.B.; Cerqueira, M.M.O.P. Somatic cell count in small ruminants: Friend or foe? Small Rumin. Res. 2012, 107, 65–75. [Google Scholar] [CrossRef]
- Fragkou, I.A.; Boscos, C.M.; Fthenakis, G.C. Diagnosis of clinical or subclinical mastitis in ewes. Small Rumin. Res. 2014, 118, 86–92. [Google Scholar] [CrossRef]
- Leitner, G.; Merin, U.; Silanikove, N. Effects of glandular bacterial infection and stage of lactation on milk clotting parameters: Comparison among cows, goats and sheep. Int. Dairy J. 2011, 21, 279–285. [Google Scholar] [CrossRef]
- O’Donnell, R.; Holland, J.W.; Deeth, H.C.; Alewood, P. Milk proteomics. Int. Dairy J. 2004, 14, 1013–1023. [Google Scholar] [CrossRef]
- Kelly, A.L.; O’Flaherty, F.; Fox, P.F. Indigenous proteolytic enzymes in milk: A brief overview of the present stage of knowledge. Int. Dairy J. 2006, 16, 563–572. [Google Scholar] [CrossRef]
- Fleminger, G.; Heftsi, R.; Uzi, M.; Nissim, S.; Gabriel, L. Chemical and structural characterization of bacterially-derived casein peptides that impair milk clotting. Int. Dairy J. 2011, 21, 914–920. [Google Scholar] [CrossRef]
- Birkemo, G.A.; O’Sullivan, O.; Ross, R.P.; Hill, C. Antimicrobial activity of two peptides casecidin 15 and 17, found naturally in bovine colostrum. J. Appl. Microbiol. 2009, 106, 233–240. [Google Scholar] [CrossRef] [PubMed]
- Sandré, C.; Gleizes, A.; Forestier, F.; Gorges-Kergot, R.; Chilmonczyk, S.; Léonil, J.; Moreau, M.C.; Labarre, C. A peptide derived from bovine beta-casein modulates functional properties of bone marrow-derived macrophages from germfree and human flora-associated mice. J. Nutr. 2001, 131, 2936–2942. [Google Scholar] [CrossRef] [PubMed]
- Eckersall, P.D. Acute phase proteins: From research laboratory to clinic. Vet. Clin. Pathol. 2010, 39, 1–2. [Google Scholar] [CrossRef]
- Tóthová, C.; Nagy, O.; Kovác, G. Acute phase proteins and their use in the diagnosis of diseases in ruminants: A review. Vet. Med. 2014, 59, 163–180. [Google Scholar] [CrossRef]
- Lahov, E.; Regelson, W. Antibacterial and immunostimulating casein-derived substances from milk: Casecidin, isracidin peptides. Food Chem. Toxicol. 1996, 34, 131–145. [Google Scholar] [CrossRef]
- Taghdiri, M.; Karim, G.; Safi, S.; Foroushani, A.R.; Motalebi, A. Study on the accuracy of milk amyloid A test and other diagnostic methods for identification of milk quality. Vet. Res. Forum 2018, 9, 179–185. [Google Scholar] [CrossRef]
- Miglio, A.; Moscati, L.; Fruganti, G.; Pela, M.; Scoccia, E.; Valiani, A.; Maresca, C. Use of milk amyloid A in the diagnosis of subclinical mastitis in dairy ewes. J. Dairy Res. 2013, 80, 496–502. [Google Scholar] [CrossRef] [PubMed]
- O’Mahony, M.; Healy, A.; Harte, D.; Walshe, K.G.; Torgerson, P.R.; Doherty, M.L. Milk amyloid A: Correlation with cellular indices of mammary inflammation in cows with normal and raised serum amyloid A. Res. Vet. Sci. 2006, 80, 155–161. [Google Scholar] [CrossRef] [PubMed]
- Safi, S.; Khoshvaghti, A.; Jafarzadeh, S.R.; Mahmoud, B.; Nowrouzian, I. Acute phase proteins in the diagnosis of bovine subclinical mastitis. Vet. Clin. Pathol. 2009, 38, 471–476. [Google Scholar] [CrossRef] [PubMed]
- Åkerstedt, M.; Waller, K.P.; Sternesjö, Å. Haptoglobin and serum amyloid A in relation to the somatic cell count in quarter, cow composite and bulk tank milk samples. J. Dairy Res. 2007, 74, 198–203. [Google Scholar] [CrossRef] [PubMed][Green Version]
- Åkerstedt, M.; Waller, K.P.; Sternesjö, Å. Haptoglobin and serum amyloid A in bulk tank milk in relation to raw milk quality. J. Dairy Res. 2009, 76, 483–489. [Google Scholar] [CrossRef][Green Version]
- Considine, T.; Healy, A.; Kelly, A.L.; McSweeney, P.L.H. Hydrolysis of bovine caseins by cathepsin B, a cysteine proteinase endogenous to milk. Int. Dairy J. 2004, 14, 117–124. [Google Scholar] [CrossRef]
- Albenzio, M.; Santillo, A.; Caroprese, M.; D’Angelo, F.; Marino, R.; Sevi, A. Role of endogenous enzymes in proteolysis of sheep milk. J. Dairy Sci. 2009, 92, 79–86. [Google Scholar] [CrossRef]
- Nielsen, S.D.; Beverly, R.L.; Qu, Y.; Dallas, Y. Milk bioactive peptide database: A comprehensive database of milk protein-derived bioactive peptides and novel visualization. Food Chem. 2017, 232, 673–682. [Google Scholar] [CrossRef]
- Sah, B.N.P.; Vasiljevic, T.; McKechnie, S.; Donkor, O.N. Antioxidative and antibacterial peptides derived from bovine milk proteins. Crit. Rev. Food Sci. Nutr. 2018, 58, 726–740. [Google Scholar] [CrossRef]


| Mass Value | DAve | PTTA | PWKW | PAD | Ave | Fold Change | |||||||||||
|---|---|---|---|---|---|---|---|---|---|---|---|---|---|---|---|---|---|
| CTR | S < 500 | S = 500–1500 | S > 1500 | CL < 500 | CL = 500–1500 | CL > 1500 | S < 500/C | S = 500–1500/C | S > 1500/C | CL < 500/C | CL = 500–1500/C | CL > 1500/C | |||||
| 1053.44 | 0.63 | 0.00252 | 0.000215 | <0.000001 | 1.52 | 1.23 | 1.59 | 1.44 | 0.97 | 1.24 | 1.11 | 0.81 | 1.05 | 0.95 | 0.64 | 0.82 | 0.73 |
| 1153.17 | 2.98 | <0.000001 | <0.000001 | <0.000001 | 1.62 | 2.64 | 4.6 | 3.85 | 3.89 | 4.11 | 2.53 | 1.63 | 2.84 | 2.38 | 2.40 | 2.54 | 1.56 |
| 1210.03 | 1.66 | 0.000035 | 0.000421 | <0.000001 | 2.32 | 1.57 | 2.94 | 2.67 | 3.18 | 1.51 | 1.55 | 0.68 | 1.27 | 1.15 | 1.37 | 0.65 | 0.67 |
| 1266.79 | 1.48 | 0.0000054 | 0.0000122 | <0.000001 | 1.15 | 2.03 | 2.04 | 1.58 | 2.63 | 1.54 | 1.25 | 1.77 | 1.77 | 1.37 | 2.29 | 1.34 | 1.09 |
| 1307.03 | 4.93 | <0.000001 | <0.000001 | <0.000001 | 0.83 | 1.52 | 2.87 | 2.61 | 5.76 | 2.41 | 1.51 | 1.83 | 3.46 | 3.14 | 6.94 | 2.90 | 1.82 |
| 1491.76 | 2.51 | 0.00000958 | 0.00478 | <0.000001 | 1.96 | 3 | 4.47 | 3.24 | 3.34 | 2.43 | 4.01 | 1.53 | 2.28 | 1.65 | 1.70 | 1.24 | 2.05 |
| 1602.67 | 3.83 | <0.000001 | <0.000001 | <0.000001 | 2.02 | 3.61 | 4.03 | 5.16 | 3.63 | 2.81 | 5.85 | 1.79 | 2.00 | 2.55 | 1.80 | 1.39 | 2.90 |
| 1621.69 | 2.47 | <0.000001 | <0.000001 | <0.000001 | 2.29 | 3.87 | 3.94 | 4.63 | 2.16 | 2.6 | 4.55 | 1.69 | 1.72 | 2.02 | 0.94 | 1.14 | 1.99 |
| 1703.72 | 6.07 | <0.000001 | <0.000001 | <0.000001 | 2.13 | 3.66 | 5.5 | 5.57 | 8.2 | 4.83 | 6.26 | 1.72 | 2.58 | 2.62 | 3.85 | 2.27 | 2.94 |
| 1720.73 | 3.99 | 0.0000617 | 0.0063 | <0.000001 | 4.01 | 8.01 | 7.25 | 7.64 | 6.8 | 6.3 | 7.52 | 2.00 | 1.81 | 1.91 | 1.70 | 1.57 | 1.88 |
| 1784.82 | 5.93 | <0.000001 | 0.0000715 | <0.000001 | 5.77 | 11.54 | 11.7 | 10.37 | 7.96 | 6.01 | 10.8 | 2.00 | 2.03 | 1.80 | 1.38 | 1.04 | 1.87 |
| 1837.78 | 6.87 | <0.000001 | <0.000001 | <0.000001 | 7.47 | 1.37 | 0.92 | 1.29 | 1.57 | 0.6 | 0.96 | 0.18 | 0.12 | 0.17 | 0.21 | 0.08 | 0.13 |
| 1853.38 | 5.2 | <0.000001 | <0.000001 | <0.000001 | 5.43 | 3.52 | 2.52 | 2.64 | 6.7 | 1.5 | 1.5 | 0.65 | 0.46 | 0.49 | 1.23 | 0.28 | 0.28 |
| 1884.73 | 9.36 | <0.000001 | 0.00129 | <0.000001 | 8.43 | 17.1 | 14.68 | 9.87 | 14.13 | 7.75 | 10.09 | 2.03 | 1.74 | 1.17 | 1.68 | 0.92 | 1.20 |
| 2000.24 | 3.07 | 0.0589 | 0.000779 | <0.000001 | 3.36 | 5.74 | 4.95 | 5.34 | 6.44 | 4.52 | 5.92 | 1.71 | 1.47 | 1.59 | 1.92 | 1.35 | 1.76 |
| 2110.71 | 5.18 | <0.000001 | 0.0168 | <0.000001 | 5.78 | 8.71 | 6.84 | 4.53 | 8.31 | 3.53 | 6.8 | 1.51 | 1.18 | 0.78 | 1.44 | 0.61 | 1.18 |
| 2181.62 | 11.74 | <0.000001 | <0.000001 | <0.000001 | 12.36 | 2.32 | 1.94 | 1.86 | 2.26 | 0.62 | 1.79 | 0.19 | 0.16 | 0.15 | 0.18 | 0.05 | 0.14 |
| 2195.89 | 7.58 | <0.000001 | <0.000001 | <0.000001 | 8.43 | 3.1 | 2.62 | 2.68 | 3.49 | 0.84 | 2.17 | 0.37 | 0.31 | 0.32 | 0.41 | 0.10 | 0.26 |
| 2257.88 | 2.7 | 0.123 | 0.201 | <0.000001 | 4.46 | 4.68 | 4.11 | 4.01 | 6.71 | 4.02 | 4.06 | 1.05 | 0.92 | 0.90 | 1.50 | 0.90 | 0.91 |
| 2295.14 | 2.64 | <0.000001 | <0.000001 | <0.000001 | 4.04 | 3.15 | 2.6 | 1.41 | 2.95 | 2.06 | 1.64 | 0.78 | 0.64 | 0.35 | 0.73 | 0.51 | 0.41 |
| 2670.72 | 1.06 | <0.000001 | 0.0000017 | <0.000001 | 0.98 | 1.17 | 1.48 | 1.44 | 1.15 | 2.04 | 1.64 | 1.19 | 1.51 | 1.47 | 1.17 | 2.08 | 1.67 |
| 2812.25 | 1.38 | 0.000173 | 0.00122 | <0.000001 | 1.69 | 1.54 | 1.49 | 1.85 | 1.59 | 2.87 | 1.64 | 0.91 | 0.88 | 1.09 | 0.94 | 1.70 | 0.97 |
| 2928.88 | 1.76 | <0.000001 | <0.000001 | <0.000001 | 2.52 | 2.03 | 1.3 | 0.76 | 2.3 | 0.75 | 0.91 | 0.81 | 0.52 | 0.30 | 0.91 | 0.30 | 0.36 |
| 3270.31 | 2.57 | 0.00393 | 0.000858 | <0.000001 | 4.48 | 2.17 | 3.01 | 2.41 | 1.91 | 3.41 | 2.62 | 0.48 | 0.67 | 0.54 | 0.43 | 0.76 | 0.58 |
| 3293.95 | 1.15 | 0.00048 | 0.0000715 | <0.000001 | 2.41 | 1.93 | 1.56 | 1.48 | 2.53 | 1.38 | 1.38 | 0.80 | 0.65 | 0.61 | 1.05 | 0.57 | 0.57 |
| 3382.47 | 2.47 | 0.00000102 | 0.0000715 | <0.000001 | 3.14 | 2.27 | 3.34 | 1.79 | 2.02 | 4.26 | 3.07 | 0.72 | 1.06 | 0.57 | 0.64 | 1.36 | 0.98 |
| 3407.2 | 0.96 | 0.0000111 | 0.00000944 | <0.000001 | 2.27 | 1.4 | 1.58 | 1.31 | 1.77 | 1.76 | 1.3 | 0.62 | 0.70 | 0.58 | 0.78 | 0.78 | 0.57 |
| 3481.56 | 2.92 | <0.000001 | <0.000001 | <0.000001 | 3.37 | 3 | 3.2 | 1.06 | 2.63 | 3.97 | 2.26 | 0.89 | 0.95 | 0.31 | 0.78 | 1.18 | 0.67 |
| 3693.69 | 0.49 | <0.000001 | <0.000001 | <0.000001 | 0.74 | 0.73 | 0.46 | 0.37 | 0.49 | 0.86 | 0.57 | 0.99 | 0.62 | 0.50 | 0.66 | 1.16 | 0.77 |
| 3849.31 | 0.5 | <0.000001 | <0.000001 | <0.000001 | 0.69 | 0.85 | 0.42 | 0.35 | 0.62 | 0.79 | 0.41 | 1.23 | 0.61 | 0.51 | 0.90 | 1.14 | 0.59 |
| 3944.68 | 0.88 | 0.0267 | 0.0798 | <0.000001 | 0.82 | 1.46 | 0.64 | 0.62 | 1.04 | 0.58 | 0.77 | 1.78 | 0.78 | 0.76 | 1.27 | 0.71 | 0.94 |
| 4054.94 | 12.51 | <0.000001 | <0.000001 | <0.000001 | 17.37 | 9.05 | 7.22 | 4.97 | 13.01 | 4.86 | 5.99 | 0.52 | 0.42 | 0.29 | 0.75 | 0.28 | 0.34 |
| 4162.48 | 6.99 | 0.00000828 | 0.0000379 | <0.000001 | 12.74 | 7.07 | 7.07 | 6.68 | 7.86 | 7.49 | 5.76 | 0.55 | 0.55 | 0.52 | 0.62 | 0.59 | 0.45 |
| 4264.35 | 9.27 | <0.000001 | <0.000001 | <0.000001 | 14.59 | 7.77 | 8.17 | 6.48 | 9.33 | 8.09 | 5.32 | 0.53 | 0.56 | 0.44 | 0.64 | 0.55 | 0.36 |
| 4356.77 | 2.89 | 0.000803 | 0.000175 | <0.000001 | 1.38 | 1.35 | 2.53 | 1.66 | 4.24 | 2.86 | 1.73 | 0.98 | 1.83 | 1.20 | 3.07 | 2.07 | 1.25 |
| 4810.2 | 0.94 | <0.000001 | 0.0000168 | <0.000001 | 0.88 | 0.95 | 0.49 | 1.32 | 0.38 | 0.55 | 0.97 | 1.08 | 0.56 | 1.50 | 0.43 | 0.63 | 1.10 |
| 4922.04 | 4.58 | <0.000001 | <0.000001 | <0.000001 | 0.81 | 3.73 | 2.32 | 5.39 | 0.9 | 2.34 | 4.35 | 4.60 | 2.86 | 6.65 | 1.11 | 2.89 | 5.37 |
| 5017.09 | 9.67 | <0.000001 | <0.000001 | <0.000001 | 1.53 | 8.77 | 7.38 | 11.09 | 3.84 | 9.88 | 11.2 | 5.73 | 4.82 | 7.25 | 2.51 | 6.46 | 7.32 |
| 5107.34 | 5.77 | <0.000001 | <0.000001 | <0.000001 | 0.35 | 2.63 | 3.56 | 5.88 | 3.34 | 6.08 | 6.12 | 7.51 | 10.17 | 16.80 | 9.54 | 17.37 | 17.49 |
| 5192.21 | 1.5 | <0.000001 | <0.000001 | <0.000001 | 0.15 | 0.63 | 0.91 | 1.65 | 0.88 | 1.47 | 1.59 | 4.20 | 6.07 | 11.00 | 5.87 | 9.80 | 10.60 |
| 5353.01 | 0.55 | <0.000001 | <0.000001 | <0.000001 | 0.86 | 0.83 | 0.66 | 0.31 | 0.59 | 0.51 | 0.31 | 0.97 | 0.77 | 0.36 | 0.69 | 0.59 | 0.36 |
| 5828.2 | 2.11 | <0.000001 | <0.000001 | <0.000001 | 0.42 | 1.8 | 1.34 | 2.53 | 0.52 | 1.48 | 2.24 | 4.29 | 3.19 | 6.02 | 1.24 | 3.52 | 5.33 |
| 5914.71 | 4.01 | <0.000001 | <0.000001 | <0.000001 | 0.76 | 3.98 | 3.31 | 4.77 | 1.6 | 3.95 | 4.74 | 5.24 | 4.36 | 6.28 | 2.11 | 5.20 | 6.24 |
| 6001.46 | 1.55 | <0.000001 | <0.000001 | <0.000001 | 0.17 | 0.72 | 0.94 | 1.66 | 0.68 | 1.15 | 1.72 | 4.24 | 5.53 | 9.76 | 4.00 | 6.76 | 10.12 |
| 6279.61 | 0.35 | <0.000001 | <0.000001 | <0.000001 | 0.48 | 0.36 | 0.25 | 0.13 | 0.18 | 0.2 | 0.15 | 0.75 | 0.52 | 0.27 | 0.38 | 0.42 | 0.31 |
| Exp. MALDI MH+ Value (Av) | Theor. MH+ Value (Av) | Theor. MH+ Value (Mi) | Exp. Nanolc-ESI-Q-Orbitrap m/z | Charge | Peptide Sequence | Parental Protein | Accession | Fragment |
|---|---|---|---|---|---|---|---|---|
| 1053.44 | 1053.28 | 1052.62 | 526.81 | 2 | LGPVRGPFPI | β-casein | P33048 | 196–205 |
| 1153.17 | 1152.42 | 1151.69 | 576.35 | 2 | GPVRGPFPILV | β-casein | P33048 | 197–207 |
| 1210.03 | 1210.41 | 1209.66 | 605.33 | 2 | TNAIPYVRYL | αs2-casein | P33049 | 199–208 |
| 1266.79 | 1265.58 | 1264.77 | 632.89 | 2 | VLGPVRGPFPIL | β-casein | P33048 | 195–206 |
| 1307.03 | 1305.43 | 1304.65 | 652.83 | 2 | INHQGLSPEVPN | αs1-casein | NP_001272624.1 | 21–32 |
| 1491.76 | 1491.81 | 1490.87 | 745.94 | 2 | EPVLGPVRGPFPIL | β-casein | P33048 | 193–206 |
| 1602.67 | 1602.91 | 1601.9 | 801.45 | 2 | QEPVLGPVRGPFPIL | β-casein | P33048 | 192–206 pGlu |
| 1621.69 | 1619.94 | 1618.92 | 809.46 | 2 | QEPVLGPVRGPFPIL | β-casein | P33048 | 192–206 |
| 1703.72 | 1702.04 | 1700.97 | 850.98 | 2 | QEPVLGPVRGPFPILV | β-casein | P33048 | 192–207 pGlu |
| 1720.73 | 1719.07 | 1717.99 | 859.5 | 2 | QEPVLGPVRGPFPILV | β-casein | P33048 | 192–207 |
| 1784.82 | 1783.12 | 1781.99 | 891.50 | 2 | LYQEPVLGPVRGPFPI | β-casein | P33048 | 190–205 |
| 1837.78 | 1836.03 | 1834.85 | 917.93 | 2 | QGWGTFLREAGQGAKDM | serum amyloid A3 | ABQ51197.1 | 19–35 pGlu |
| 1853.38 | 1852.03 | 1850.84 | 925.92 | 2 | QGWGTFLREAGQGAKDM | serum amyloid A3 | ABQ51197.1 | 19–35 Mox, pGlu |
| 1884.73 | 1882.25 | 1881.06 | 941.04 | 2 | YQEPVLGPVRGPFPILV | β-casein | P33048 | 191–207 |
| 2000.24 | 2001.42 | 2000.19 | 500.80 | 4 | SLSQPKVLPVPQKVVPQR | β-casein | P33048 | 164–181(A177→V) |
| 2110.71 | 2108.57 | 2107.22 | 1054.12 | 2 | LLYQEPVLGPVRGPFPILV | β-casein | P33048 | 189–207 |
| 2181.62 | 2178.43 | 2177.03 | 726.34 | 3 | QGWGTFLREAGQGAKDMWR | serum amyloid A3 | ABQ51197.1 | 19–37 pGlu |
| 2195.89 | 2194.43 | 2193.02 | 731.68 | 3 | QGWGTFLREAGQGAKDMWR | serum amyloid A3 | ABQ51197.1 | 19–37 Mox, pGlu |
| 2257.88 | 2255.74 | 2254.29 | 1127.66 | 2 | FLLYQEPVLGPVRGPFPILV | β-casein | P33048 | 188–207 |
| 2295.14 | 2294.72 | 2293.21 | 765.07 | 3 | AMKPWTQPKTNAIPYVRYL | αs2-casein | P33049 | 190–208 Mox |
| 2670.72 | 2665.23 | 2663.53 | 888.52 | 3 | PIQAFLLYQEPVLGPVRGPFPILV | β-casein | P33048 | 184–207 |
| 2812.25 | 2812.43 | 2810.56 | 1405.78 | 2 | MPIQAFLLYQEPVLGPVRGPFPILV | β-casein | P33048 | 183–207 Mox |
| 2928.88 | 2927.52 | 2925.59 | 975.87 | 3 | DMPIQAFLLYQEPVLGPVRGPFPIIV | β-casein | P33048 | 182–207 Mox |
| 3270.31 | 3266.87 | 3264.75 | 1088.92 | 3 | AVPQRDMPIQAFLLYQEPVLGPVRGPFPI | β-casein | P33048 | 177–205 Mox |
| 3293.95 | 3294.92 | 3292.78 | 1098.27 | 3 | VVPQRDMPIQAFLLYQEPVLGPVRGPFPI | β-casein | P33048 | 177–205(A177→V) Mox |
| 3382.47 | 3380.03 | 3377.84 | 1126.62 | 3 | AVPQRDMPIQAFLLYQEPVLGPVRGPFPIL | β-casein | P33048 | 177–206 Mox |
| 3407.2 | 3407.06 | 3404.85 | 1135.96 | 3 | VPQRDMPIQAFLLYQEPVLGPVRGPFPILN | β-casein | P33048 | 178–207(V207→N) |
| 3481.56 | 3479.16 | 3476.91 | 1159.64 | 3 | AVPQRDMPIQAFLLYQEPVLGPVRGPFPIL | β-casein | P33048 | 177–207 Mox |
| 3693.69 | 3696.28 | 3693.99 | 1232.01 | 3 | RPKHPINHQGLSPEVLNENLLRFVVAPFPEVF | αs1-casein | NP_001272624.1 | 16–47(P31→L) |
| 3849.31 | 3852.47 | 3850.10 | 642.52 | 6 | RPKHPINHQGLSPEVLNENLLRFVVAPFPEVFR | αs1-casein | NP_001272624.1 | 16–48(P31→L) |
| 3944.68 | 3943.73 | 3941.18 | 1314.4 | 3 | VLPVPQKVVPQRDMPIQAFLLYQEPVLGPVRGPFP | β-casein | P33048 | 170–204(A177→V) Mox |
| 4054.94 | 4054.91 | 4052.28 | 1013.82 | 4 | LPVPQKVVPQRDMPIQAFLLYQEPVLGPVRGPFPIL | β-casein | P33048 | 171–206(A177→V) |
| 4162.48 | 4154.05 | 4151.35 | 1384.45 | 3 | VLPVPQKVVPQRDMPIQAFLLYQEPVLGPVRGPFPIL | β-casein | P33048 | 170–206(A177→V) |
| 4264.35 | 4269.18 | 4266.42 | 1422.81 | 3 | VLPVPQKVVPQRDMPIQAFLLYQEPVLGPVRGPFPILV | β-casein | P33048 | 170–207(A177→V) Mox |
| 4356.77 | 4353.3 | 4350.49 | 1088.37 | 4 | KVLPVPQKAVPQRDMPIQAFLLYQEPVLGPVRGPFPILV | β-casein | P33048 | 169–207 |
| 4810.2 | 4810.78 | 4807.70 | 1202.68 | 4 | SLSQPKVLPVPQKVVPQRDMPIQAFLLYQEPVLGPVRGPFPIL | β-casein | P33048 | 164–206(A177→V) Mox; |
| 163–205(A177→V) Mox | ||||||||
| 4922.04 | 4923.94 | 4920.79 | 1230.96 | 4 | LSLSQPKVLPVPQKVVPQRDMPIQAFLLYQEPVLGPVRGPFPIL | β-casein | P33048 | 163–206(A177→V) Mox |
| 5017.09 | 5023.08 | 5019.86 | 1004.77 | 5 | VLSLSQPKVLPVPQKVVPQRDMPIQAFLLYQEPVLGPVRGPFPIL | β-casein | P33048 | 162–206(A177→V) Mox |
| 5107.34 | 5109.13 | 5105.87 | 1021.98 | 5 | QSVLSLSQPKVLPVPQKVVPQRDMPIQAFLLYQEPVLGPVRGPFPI | β-casein | P33048 | 160–205(A177→V); |
| 5192.21 | 5181.23 | 5177.92 | 1036.37 | 5 | SVLSLSQPKVLPVPQKAVPQRDMPIQAFLLYQEPVLGPVRGPFPILV | β-casein | P33048 | 161–207 Mox |
| 5353.01 | 5352.39 | 5348.99 | 1070.58 | 5 | QSVLSLSQPKVLPVPQKVVPQRDMPIQAFLLYQEPVLGPVRGPFPILN | β-casein | P33048 | 160–207(A177→V, V207→N) Mox |
| 5828.2 | 5829.95 | 5826.10 | 1166.07 | 5 | LVQSWMHQPPQPLSPTVMFPPQSVLSLSQPKVLPVPQKAVPQRDMPIQAFL | β-casein | P33048 | 138–189 Mox |
| 5914.71 | 5911.13 | 5907.28 | 1182.30 | 5 | TVMFPPQSVLSLSQPKVLPVPQKVVPQRDMPIQAFLLYQEPVLGPVRGPFPIL | β-casein | P33048 | 154–206(A177→V) Mox |
| 6001.46 | 5998.21 | 5994.31 | 1199.74 | 5 | TVMFPPQSVLSLSQPKVLPVPQKAVPQRDMPIQAFLLYQEPVLGPVRGPFPILV | β-casein | P33048 | 154–207 2Mox |
| 6279.61 | 6279.56 | 6275.48 | 1255.88 | 5 | LSPTVMFPPQSVLSLSQPKVLPVPQKAVPQRDMPIQAFLLYQEPVLGPVRGPFPILV | β-casein | P33048 | 151–207 Mox |
| Peptide | CAMPR3 Score | AMP Scanner Score | dPABBs Score | AntiInflam Score | AVPPRED Score (CM; PM) | |
|---|---|---|---|---|---|---|
| LGPVRGPFPI | 0.44 | 0.78 | −1.23 | −0.70 | 40.27 | 19.52 |
| GPVRGPFPILV | 0.42 | 0.79 | −0.83 | 0.90 | 41.47 | 18.95 |
| TNAIPYVRYL | 0.04 | 0.75 | 0.39 | 2.21 | 18.16 | 27.06 |
| VLGPVRGPFPIL | 0.53 | 0.87 | −0.76 | 0.70 | 43.15 | 27.98 |
| INHQGLSPEVPN | 0.07 | 0.05 | −0.44 | −0.17 | 30.22 | 9.73 |
| EPVLGPVRGPFPIL | 0.07 | 0.91 | −0.95 | 0.42 | 42.42 | 30.30 |
| QEPVLGPVRGPFPIL | 0.06 | 0.88 | −0.84 | 0.31 | 41.60 | 28.64 |
| QEPVLGPVRGPFPIL | 0.06 | 0.88 | −0.84 | 0.31 | 41.60 | 28.64 |
| QEPVLGPVRGPFPILV | 0.06 | 0.92 | −0.56 | 0.22 | 42.16 | 34.05 |
| QEPVLGPVRGPFPILV | 0.06 | 0.92 | −0.56 | 0.22 | 42.16 | 34.05 |
| LYQEPVLGPVRGPFPI | 0.10 | 0.68 | −0.86 | 0.29 | 41.41 | 28.72 |
| QGWGTFLREAGQGAKDM | 0.19 | 0.73 | −0.58 | −1.02 | 45.02 | 32.29 |
| QGWGTFLREAGQGAKDM | 0.19 | 0.73 | −0.58 | −1.02 | 45.02 | 32.29 |
| YQEPVLGPVRGPFPILV | 0.09 | 0.92 | −0.58 | 0.15 | 42.09 | 33.71 |
| LSQPKVLPVPQKVVPQR | 0.49 | 0.08 | −0.18 | −0.81 | 42.40 | 47.45 |
| LLYQEPVLGPVRGPFPILV | 0.18 | 0.61 | −0.62 | 0.76 | 45.61 | 47.43 |
| QGWGTFLREAGQGAKDMWR | 0.24 | 1.00 | −0.35 | −1.01 | 48.07 | 46.73 |
| QGWGTFLREAGQGAKDMWR | 0.24 | 1.00 | −0.35 | −1.01 | 48.07 | 46.73 |
| FLLYQEPVLGPVRGPFPILV | 0.25 | 0.76 | −0.72 | 0.67 | 47.05 | 49.88 |
| AMKPWTQPKTNAIPYVRYL | 0.38 | 0.98 | 0.35 | 0.56 | 34.79 | 33.59 |
| PIQAFLLYQEPVLGPVRGPFPILV | 0.19 | 0.65 | −0.54 | 0.39 | 47.90 | 63.06 |
| MPIQAFLLYQEPVLGPVRGPFPILV | 0.04 | 0.46 | −0.59 | 0.33 | 49.54 | 63.82 |
| DMPIQAFLLYQEPVLGPVRGPFPILN | 0.05 | 0.12 | −0.95 | 0.28 | 45.14 | 48.97 |
| AVPQRDMPIQAFLLYQEPVLGPVRGPFPI | 0.08 | 0.01 | −0.59 | 0.30 | 42.37 | 63.42 |
| VVPQRDMPIQAFLLYQEPVLGPVRGPFPI | 0.08 | 0.01 | −0.44 | 0.30 | 42.18 | 63.75 |
| AVPQRDMPIQAFLLYQEPVLGPVRGPFPIL | 0.09 | 0.01 | −0.60 | 0.65 | 45.52 | 63.90 |
| VPQRDMPIQAFLLYQEPVLGPVRGPFPILN | 0.07 | 0.03 | −0.66 | 0.65 | 44.77 | 63.89 |
| AVPQRDMPIQAFLLYQEPVLGPVRGPFPIL | 0.09 | 0.01 | −0.60 | 0.65 | 45.52 | 63.90 |
| RPKHPINHQGLSPEVLNENLLRFVVAPFPEVF | 0.05 | 0.20 | 0.06 | −0.84 | 47.89 | 65.47 |
| RPKHPINHQGLSPEVLNENLLRFVVAPFPEVFR | 0.08 | 0.76 | 0.17 | −0.84 | 47.52 | 65.33 |
| PVPQKVVPQRDMPIQAFLLYQEPVLGPVRGPFPILN | 0.07 | 0.01 | −0.38 | 0.39 | 43.43 | 64.09 |
| LPVPQKVVPQRDMPIQAFLLYQEPVLGPVRGPFPIL | 0.07 | 0.01 | −0.42 | 0.39 | 44.96 | 64.07 |
| VLPVPQKVVPQRDMPIQAFLLYQEPVLGPVRGPFPIL | 0.08 | 0.01 | −0.28 | 0.35 | 44.82 | 64.07 |
| VLPVPQKVVPQRDMPIQAFLLYQEPVLGPVRGPFPILN | 0.08 | 0.01 | −0.25 | 0.32 | 44.97 | 64.07 |
| KVLPVPQKAVPQRDMPIQAFLLYQEPVLGPVRGPFPILV | 0.11 | 0.02 | −0.13 | 0.29 | 46.59 | 64.06 |
| SLSQPKVLPVPQKVVPQRDMPIQAFLLYQEPVLGPVRGPFPIL | 0.06 | 0.01 | −0.48 | 0.09 | 45.52 | 64.07 |
| LSLSQPKVLPVPQKVVPQRDMPIQAFLLYQEPVLGPVRGPFPIL | 0.06 | 0.01 | −0.50 | 0.07 | 46.52 | 64.08 |
| VLSLSQPKVLPVPQKVVPQRDMPIQAFLLYQEPVLGPVRGPFPIL | 0.08 | 0.01 | −0.38 | 0.05 | 46.27 | 64.08 |
| QSVLSLSQPKVLPVPQKVVPQRDMPIQAFLLYQEPVLGPVRGPFPI | 0.05 | 0.01 | −0.46 | −0.21 | 44.37 | 64.08 |
| SVLSLSQPKVLPVPQKAVPQRDMPIQAFLLYQEPVLGPVRGPFPILV | 0.07 | 0.01 | −0.43 | 0.01 | 46.80 | 64.08 |
| QSVLSLSQPKVLPVPQKVVPQRDMPIQAFLLYQEPVLGPVRGPFPILN | 0.05 | 0.02 | −0.47 | −0.01 | 45.88 | 64.08 |
| LVQSWMHQPPQPLSPTVMFPPQSVLSLSQPKVLPVPQKAVPQRDMPIQAFL | 0.00 | 0.00 | −0.78 | −0.49 | 43.42 | 64.08 |
| TVMFPPQSVLSLSQPKVLPVPQKVVPQRDMPIQAFLLYQEPVLGPVRGPFPIL | 0.01 | 0.01 | −0.57 | −0.08 | 44.99 | 64.08 |
| TVMFPPQSVLSLSQPKVLPVPQKAVPQRDMPIQAFLLYQEPVLGPVRGPFPILV | 0.02 | 0.01 | −0.52 | −0.10 | 45.57 | 64.08 |
| LSPTVMFPPQSVLSLSQPKVLPVPQKAVPQRDMPIQAFLLYQEPVLGPVRGPFPILV | 0.01 | 0.01 | −0.66 | −0.13 | 45.45 | 64.08 |
© 2020 by the authors. Licensee MDPI, Basel, Switzerland. This article is an open access article distributed under the terms and conditions of the Creative Commons Attribution (CC BY) license (http://creativecommons.org/licenses/by/4.0/).
Share and Cite
Matuozzo, M.; Spagnuolo, M.S.; Hussein, H.A.; Gomaa, A.M.; Scaloni, A.; D’Ambrosio, C. Novel Biomarkers of Mastitis in Goat Milk Revealed by MALDI-TOF-MS-Based Peptide Profiling. Biology 2020, 9, 193. https://doi.org/10.3390/biology9080193
Matuozzo M, Spagnuolo MS, Hussein HA, Gomaa AM, Scaloni A, D’Ambrosio C. Novel Biomarkers of Mastitis in Goat Milk Revealed by MALDI-TOF-MS-Based Peptide Profiling. Biology. 2020; 9(8):193. https://doi.org/10.3390/biology9080193
Chicago/Turabian StyleMatuozzo, Monica, Maria Stefania Spagnuolo, Hany A. Hussein, A. M. Gomaa, Andrea Scaloni, and Chiara D’Ambrosio. 2020. "Novel Biomarkers of Mastitis in Goat Milk Revealed by MALDI-TOF-MS-Based Peptide Profiling" Biology 9, no. 8: 193. https://doi.org/10.3390/biology9080193
APA StyleMatuozzo, M., Spagnuolo, M. S., Hussein, H. A., Gomaa, A. M., Scaloni, A., & D’Ambrosio, C. (2020). Novel Biomarkers of Mastitis in Goat Milk Revealed by MALDI-TOF-MS-Based Peptide Profiling. Biology, 9(8), 193. https://doi.org/10.3390/biology9080193