Deficiency of Splicing Factor 1 (SF1) Reduces Intestinal Polyp Incidence in ApcMin/+ Mice

 ,
,  and
and
Abstract
Simple Summary
Abstract
1. Introduction
2. Materials and Methods
2.1. Mouse Strains
2.2. Generation of ApcMin/+;Sf1+/− Mice
2.3. Assessment of Intestinal Polyp Numbers and Size
2.4. Immunoblotting
2.5. Immunohistochemistry
2.6. Statistical Analysis
3. Results
3.1. SF1 Expression in Nuclei of Intestinal Cells and Polyps
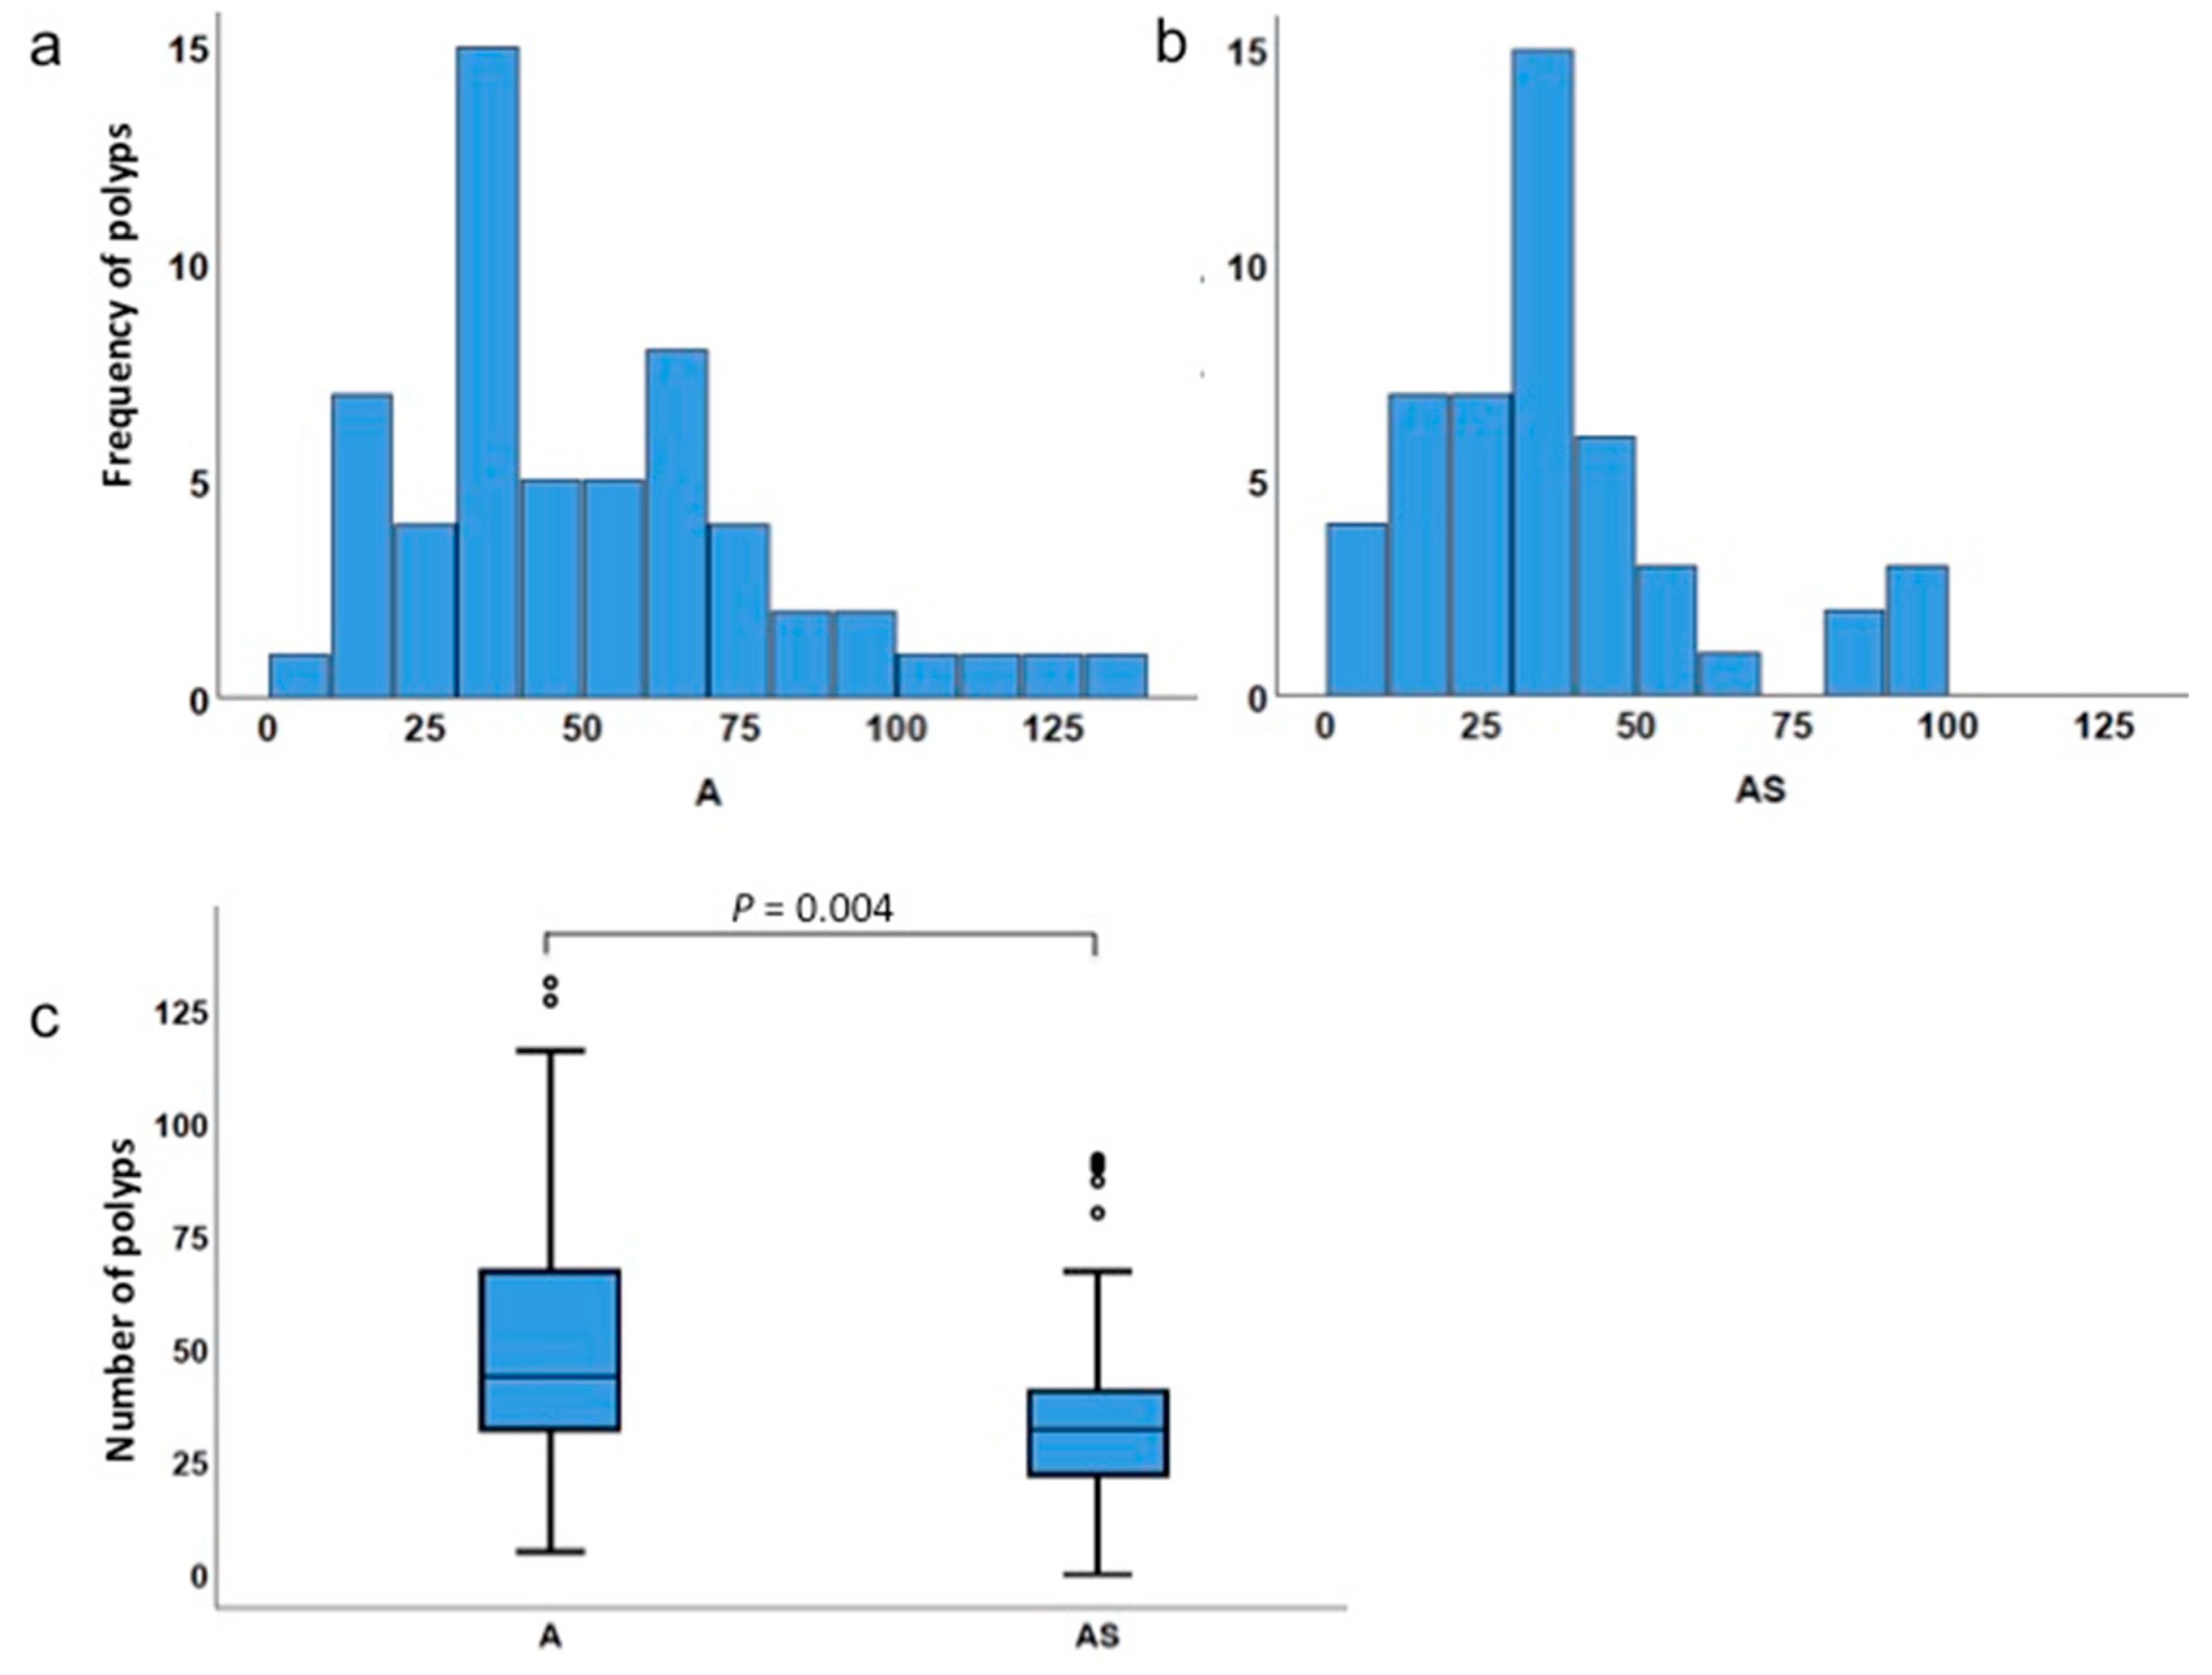
3.2. Haploinsufficiency of Sf1 Reduces Intestinal Polyp Formation
3.3. Low Incidence of Polyps in Sf1+/− Mice
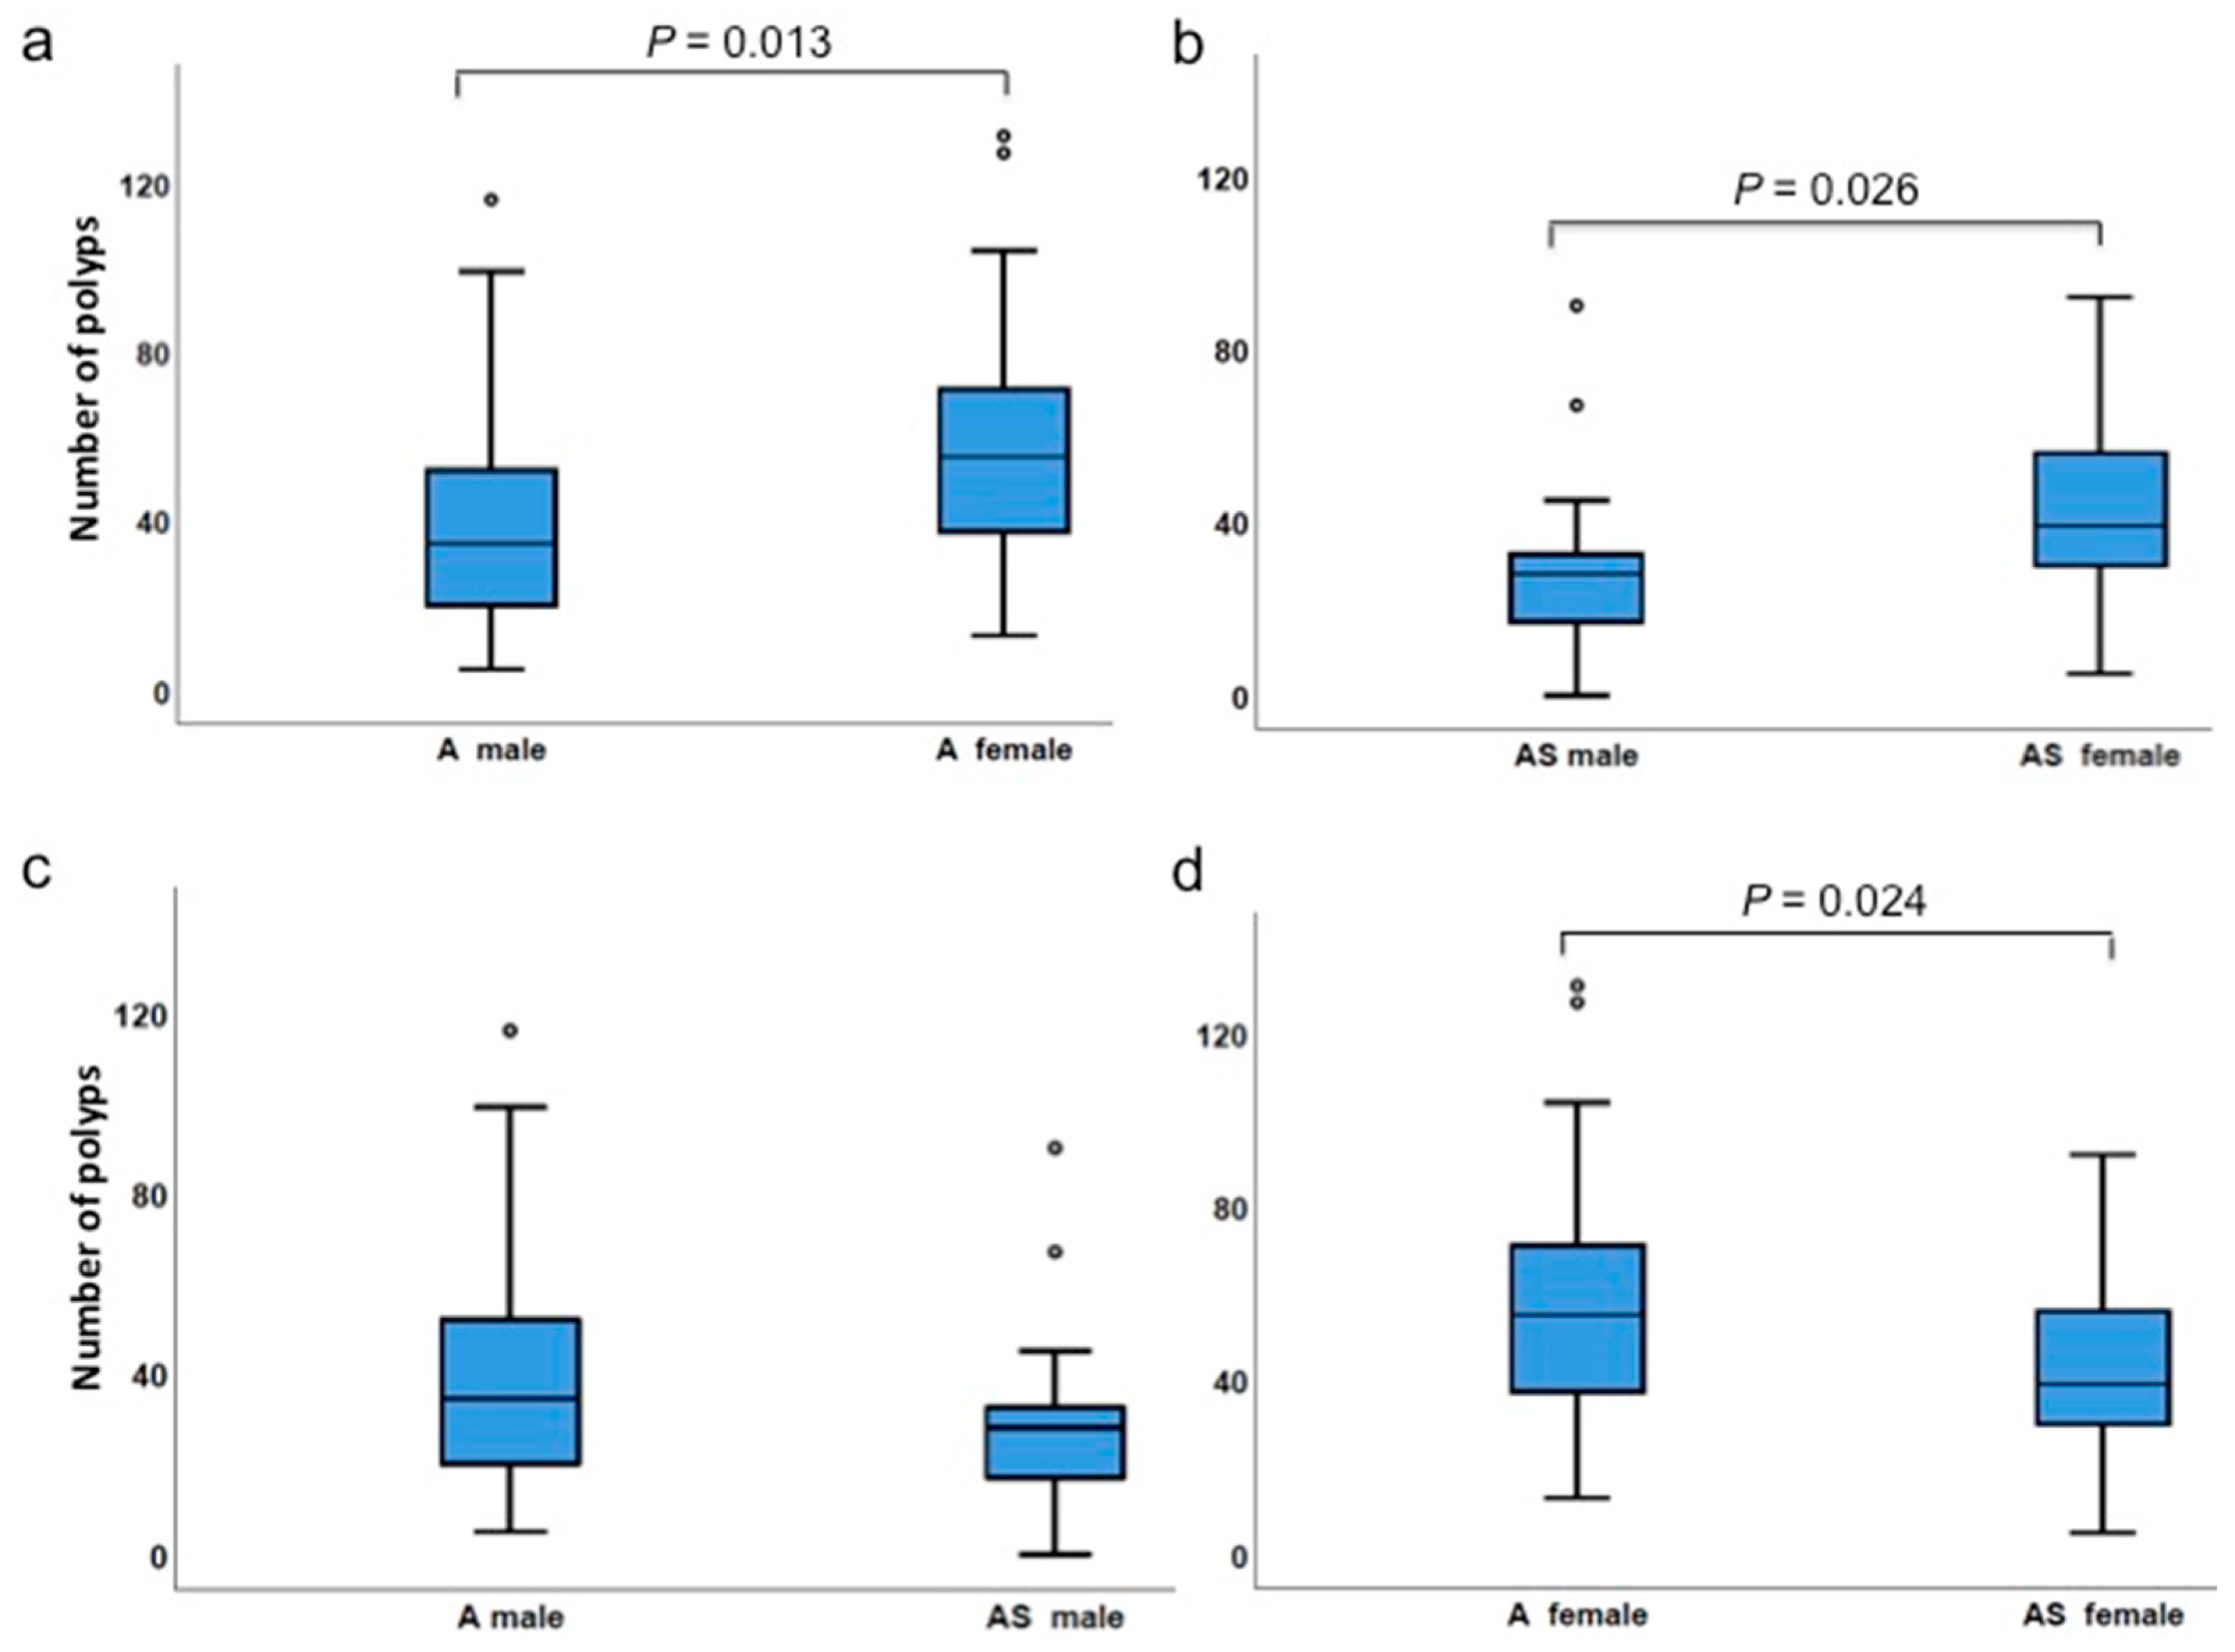
3.4. Gender Differences Affect Polyp Incidences
4. Discussion
5. Conclusions
Supplementary Materials
Author Contributions
Funding
Acknowledgments
Conflicts of Interest
References
- Centers for Disease Control and Prevention. CDC 24/7: Saving Lives, Protecting People. Colorectal Cancer Statistics. Available online: https://www.cdc.gov/cancer/colorectal/statistics/index.htm (accessed on 3 October 2020).
- Augustus, G.J.; Ellis, N.A. Colorectal Cancer Disparity in African Americans. Am. J. Pathol. 2018, 188, 291–303. [Google Scholar] [CrossRef]
- Chen, M.; Manley, J.L. Mechanisms of alternative splicing regulation: Insights from molecular and genomics approaches. Nat. Rev. Mol. Cell Biol. 2009, 10, 741–754. [Google Scholar] [CrossRef]
- Tanackovic, G.; Krämer, A. Human Splicing Factor SF3a, but Not SF1, Is Essential for Pre-mRNA Splicing In Vivo. Mol. Biol. Cell 2005, 16, 1366–1377. [Google Scholar] [CrossRef]
- Arning, S.; Grüter, P.; Bilbe, G.; Krämer, A. Mammalian splicing factor SF1 is encoded by variant cDNAs and binds to RNA. RNA 1996, 2, 794–810. [Google Scholar] [PubMed]
- Rain, J.-C.; Rafi, Z.; Rhani, Z.; Legrain, P.; Krämer, A. Conservation of functional domains involved in RNA binding and protein–protein interactions in human and Saccharomyces cerevisiae pre-mRNA splicing factor SF1. RNA 1998, 4, 551–565. [Google Scholar] [CrossRef] [PubMed][Green Version]
- Abovich, N.; Rosbash, M. Cross-Intron Bridging Interactions in the Yeast Commitment Complex Are Conserved in Mammals. Cell 1997, 89, 403–412. [Google Scholar] [CrossRef]
- Corioni, M.; Antih, N.; Tanackovic, G.; Zavolan, M.; Krämer, A. Analysis of in situ pre-mRNA targets of human splicing factor SF1 reveals a function in alternative splicing. Nucleic Acids Res. 2011, 39, 1868–1879. [Google Scholar] [CrossRef]
- Heintz, C.; Doktor, T.K.; Lanjuin, A.; Escoubas, C.C.; Zhang, Y.; Weir, H.J.; Dutta, S.; Silva-García, C.G.; Bruun, G.H.; Morantte, I.; et al. Splicing factor 1 modulates dietary restriction and TORC1 pathway longevity in C. elegans. Nat. Cell Biol. 2017, 541, 102–106. [Google Scholar] [CrossRef]
- Liu, Z.; Luyten, I.; Bottomley, M.J.; Messias, A.C.; Houngninou-Molango, S.; Sprangers, R.; Zanier, K.; Krämer, A.; Sattler, M. Structural Basis for Recognition of the Intron Branch Site RNA by Splicing Factor 1. Science 2001, 294, 1098–1102. [Google Scholar] [CrossRef]
- Selenko, P.; Gregorovic, G.; Sprangers, R.; Stier, G.; Rhani, Z.; Kraemer, A.; Sattler, M. Structural basis for the molecular recognition between human splicing factors U2AF65 and SF1/mBBP. Mol. Cell 2003, 11, 965–976. [Google Scholar] [CrossRef]
- Jamison, S.F.; Crow, A.; A Garcia-Blanco, M. The spliceosome assembly pathway in mammalian extracts. Mol. Cell. Biol. 1992, 12, 4279–4287. [Google Scholar] [CrossRef] [PubMed][Green Version]
- Kent, O.A.; Ritchie, D.B.; Macmillan, A.M. Characterization of a U2AF-Independent Commitment Complex (E′) in the Mammalian Spliceosome Assembly Pathway. Mol. Cell. Biol. 2005, 25, 233–240. [Google Scholar] [CrossRef] [PubMed]
- Das, R.; Reed, R. Resolution of the mammalian E complex and the ATP-dependent spliceosomal complexes on native agarose mini-gels. RNA 1999, 5, 1504–1508. [Google Scholar] [CrossRef] [PubMed]
- Michaud, S.; Reed, R. An ATP-independent complex commits pre-mRNA to the mammalian spliceosome assembly pathway. Genes Dev. 1991, 5, 2534–2546. [Google Scholar] [CrossRef] [PubMed]
- Berglund, J.; Chua, K.; Abovich, N.; Reed, R.; Rosbash, M. The Splicing Factor BBP Interacts Specifically with the Pre-mRNA Branchpoint Sequence UACUAAC. Cell 1997, 89, 781–787. [Google Scholar] [CrossRef]
- Kramer, A. Purification of splicing factor SF1, a heat-stable protein that functions in the assembly of a presplicing complex. Mol. Cell. Biol. 1992, 12, 4545–4552. [Google Scholar] [CrossRef] [PubMed][Green Version]
- Berglund, J.A.; Abovich, N.; Rosbash, M. A cooperative interaction between U2AF65 and mBBP/SF1 facilitates branchpoint region recognition. Genes Dev. 1998, 12, 858–867. [Google Scholar] [CrossRef]
- Wang, G.-S.; Cooper, T.A. Splicing in disease: Disruption of the splicing code and the decoding machinery. Nat. Rev. Genet. 2007, 8, 749–761. [Google Scholar] [CrossRef]
- Deschênes, M.; Chabot, B. The emerging role of alternative splicing in senescence and aging. Aging Cell 2017, 16, 918–933. [Google Scholar] [CrossRef]
- Lee, B.P.; Pilling, L.C.; Emond, F.; Flurkey, K.; Harrison, D.E.; Yuan, R.; Peters, L.L.; Kuchel, G.A.; Ferrucci, L.; Melzer, D.; et al. Changes in the expression of splicing factor transcripts and variations in alternative splicing are associated with lifespan in mice and humans. Aging Cell 2016, 15, 903–913. [Google Scholar] [CrossRef] [PubMed]
- Srebrow, A. The connection between splicing and cancer. J. Cell Sci. 2006, 119, 2635–2641. [Google Scholar] [CrossRef] [PubMed]
- Skotheim, R.I.; Nees, M. Alternative splicing in cancer: Noise, functional, or systematic? Int. J. Biochem. Cell Biol. 2007, 39, 1432–1449. [Google Scholar] [CrossRef] [PubMed]
- Kalnina, Z.; Zayakin, P.; Silina, K.; Linē, A. Alterations of pre-mRNA splicing in cancer. Genes Chromosom. Cancer 2005, 42, 342–357. [Google Scholar] [CrossRef] [PubMed]
- Venables, J.P. Aberrant and Alternative Splicing in Cancer. Cancer Res. 2004, 64, 7647–7654. [Google Scholar] [CrossRef] [PubMed]
- Kim, E.; Goren, A.; Ast, G. Insights into the connection between cancer and alternative splicing. Trends Genet. 2008, 24, 7–10. [Google Scholar] [CrossRef] [PubMed]
- Ritchie, W.; Granjeaud, S.; Puthier, D.; Gautheret, D. Entropy Measures Quantify Global Splicing Disorders in Cancer. PLoS Comput. Biol. 2008, 4, e1000011. [Google Scholar] [CrossRef]
- Shitashige, M.; Satow, R.; Honda, K.; Ono, M.; Hirohashi, S.; Yamada, T. Increased susceptibility of Sf1+/- mice to azoxymethane-induced colon tumorigenesis. Cancer Sci. 2007, 98, 1862–1867. [Google Scholar] [CrossRef]
- Zhu, R.; Heaney, J.; Nadeau, J.H.; Ali, S.; Matin, A. Deficiency of Splicing Factor 1 Suppresses the Occurrence of Testicular Germ Cell Tumors. Cancer Res. 2010, 70, 7264–7272. [Google Scholar] [CrossRef]
- Groden, J.; Thliveris, A.; Samowitz, W.; Carlson, M.; Gelbert, L.; Albertsen, H.; Joslyn, G.; Stevens, J.; Spirio, L.; Robertson, M.; et al. Identification and characterization of the familial adenomatous polyposis coli gene. Cell 1991, 66, 589–600. [Google Scholar] [CrossRef]
- Kinzler, K.W.; Nilbert, M.C.; Su, L.K.; Vogelstein, B.; Bryan, T.M.; Levy, D.B.; Smith, K.J.; Preisinger, A.C.; Hedge, P.; McKechnie, D.; et al. Identification of FAP locus genes from chromosome 5q21. Science 1991, 253, 661–665. [Google Scholar] [CrossRef]
- Kinzler, K.W.; Vogelstein, B. Lessons from Hereditary Colorectal Cancer. Cell 1996, 87, 159–170. [Google Scholar] [CrossRef]
- Moser, A.R.; Pitot, H.C.; Dove, W.F. A dominant mutation that predisposes to multiple intestinal neoplasia in the mouse. Science 1990, 247, 322–324. [Google Scholar] [CrossRef] [PubMed]
- Halberg, R.; Katzung, D.; Hoff, P.; Moser, A.; Cole, C.; Lubet, R.; Donehower, L.; Jacoby, R.; Dove, W. Tumorigenesis in the multiple intestinal neoplasia mouse: Redundancy of negative regulators and specificity of modifiers. Proc. Natl. Acad. Sci. USA 2000, 97, 3461–3466. [Google Scholar] [CrossRef] [PubMed]
- Cho, N.; Javid, S.; Carothers, A.; Redston, M.; Bertagnolli, M. Estrogen receptors alpha and beta are inhibitory modifiers of Apc dependent tumorigenesis in the proximal colon of Min/+ mice. Cancer Res. 2007, 67, 2366–2372. [Google Scholar] [CrossRef] [PubMed]
- Cormier, R.; Dove, W.F. Dnmt1 Reduces the Net Growth Rate and Multiplicity of Intestinal Adenomas in C57BL/6-Multiple Intestinal Neoplasia (Min)/+ Mice Independently of p53 but Demonstrates Strong Synergy with the Modifier of Min 1 Resistance Allele. Cancer Res. 2000, 60, 3965–3970. [Google Scholar]
- McCart, A.E.; Vickaryous, N.K.; Silver, A. Apc mice: Models, modifiers and mutants. Pathol. Res. Pract. 2008, 204, 479–490. [Google Scholar] [CrossRef]
- Dietrich, W. Genetic identification of Mom-1, a major modifier locus affecting Min-induced intestinal neoplasia in the mouse. Cell 1993, 75, 631–639. [Google Scholar] [CrossRef]
- Nnadi, S.C.; Watson, R.; Innocent, J.; Gonye, G.E.; Buchberg, A.M.; Siracusa, L.D. Identification of five novel modifier loci of ApcMin harbored in the BXH14 recombinant inbred strain. Carcinogenesis 2012, 33, 1589–1597. [Google Scholar] [CrossRef]
- Ju, J.; Hong, J.; Zhou, J.-N.; Pan, Z.; Bose, M.; Liao, J.; Yang, G.-Y.; Liu, Y.Y.; Hou, Z.; Lin, Y.; et al. Inhibition of Intestinal Tumorigenesis in Apcmin/+ Mice by (−)-Epigallocatechin-3-Gallate, the Major Catechin in Green Tea. Cancer Res. 2005, 65, 10623–10631. [Google Scholar] [CrossRef]
- Nalbantoglu, I.; Blanc, V.; Davidson, N.O. Characterization of Colorectal Cancer Development in Apcmin/+ Mice. Antiviral RNAi 2016, 1422, 309–327. [Google Scholar]
- Gibbons, J.; Chakraborti, S. Nonparametric Statistical Inference, Fourth Edition, Revised and Expanded; Marcel Dekker, Inc.: New York, NY, USA, 2003. [Google Scholar]
- Shitashige, M.; Naishiro, Y.; Idogawa, M.; Honda, K.; Ono, M.; Hirohashi, S.; Yamada, T. Involvement of Splicing Factor-1 in β-Catenin/T-cell factor-4-mediated gene transactivation and pre-mRNA splicing. Gastroenterology 2007, 132, 1039–1054. [Google Scholar] [CrossRef] [PubMed]
- Gould, K.A.; Dove, W.F. Analysis of the Mom1 modifier of intestinal neoplasia in mice. Exp. Lung Res. 1998, 24, 437–453. [Google Scholar] [CrossRef] [PubMed]
- Bilger, A.; Shoemaker, A.R.; Gould, K.A.; Dove, W.F. Manipulation of the mouse germline in the study ofMin-induced neoplasia. Semin. Cancer Biol. 1996, 7, 249–260. [Google Scholar] [CrossRef] [PubMed][Green Version]
- Amos-Landgraf, J.M.; Heijmans, J.; Wielenga, M.C.B.; Dunkin, E.; Krentz, K.J.; Clipson, L.; Ederveen, A.G.; Groothuis, P.G.; Mosselman, S.; Muncan, V.; et al. Sex disparity in colonic adenomagenesis involves promotion by male hormones, not protection by female hormones. Proc. Natl. Acad. Sci. USA 2014, 111, 16514–16519. [Google Scholar] [CrossRef]


| Cohort Genotype | n | No. of Males | No. of Females |
|---|---|---|---|
| ApcMin/+ | 57 | 26 | 31 |
| ApcMin/+;Sf1+/− | 48 | 23 | 25 |
| Sf1+/− | 22 | 13 | 9 |
| WT (Sf1+/+) | 17 | 8 | 9 |
| Type of Comparison | Genotype | Minimum No. of Polyps | Maximum No. of Polyps | Mean No. of Polyps | Median No. of Polyps | p Value |
|---|---|---|---|---|---|---|
| Total polyps | ApcMin/+ | 5 | 131 | 50.7 | 44.0 | 0.004 |
| ApcMin/+;Sf1+/− | 0 | 92 | 35.6 | 32.0 | ||
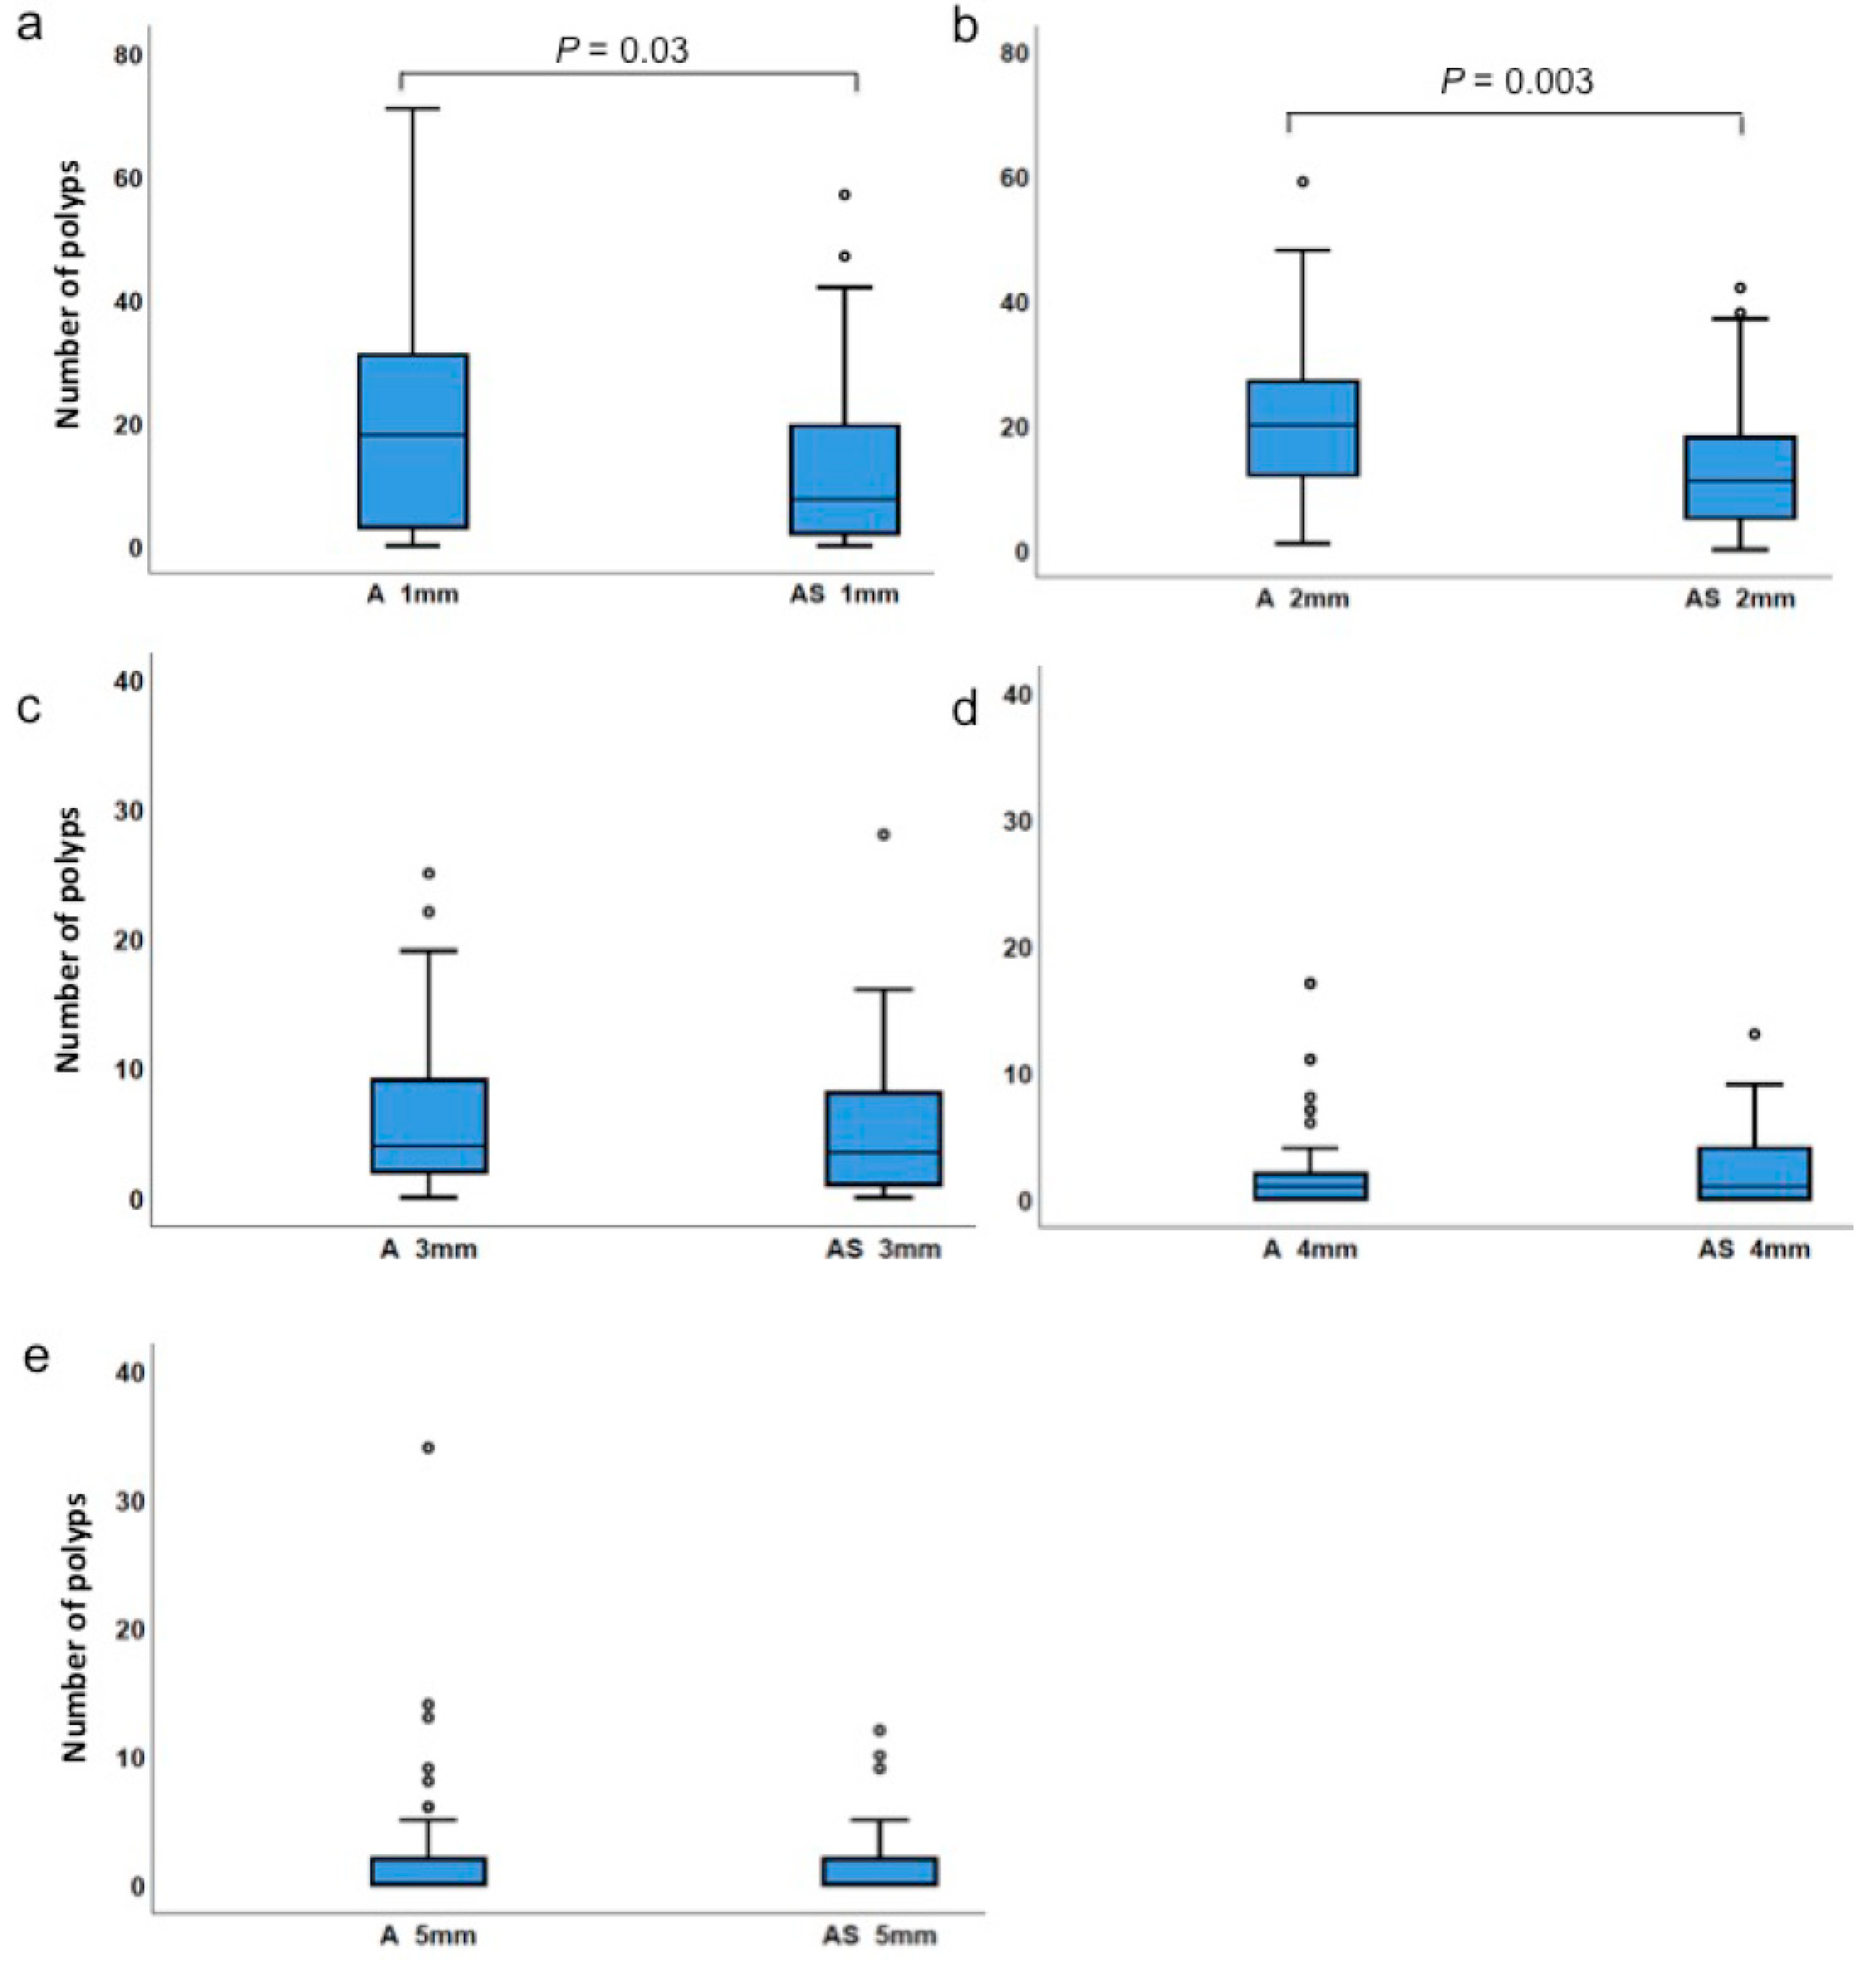
| 1 mm-sized polyps | ApcMin/+ | 0 | 71 | 20.0 | 18.0 | 0.029 |
| ApcMin/+;Sf1+/− | 0 | 57 | 12.5 | 7.5 | ||
| 2 mm-sized polyps | ApcMin/+ | 1 | 59 | 20.4 | 20.0 | 0.003 |
| ApcMin/+;Sf1+/− | 0 | 42 | 13.7 | 11.0 | ||
| 3 mm-sized polyps | ApcMin/+ | 0 | 25 | 5.9 | 4.0 | 0.487 |
| ApcMin/+;Sf1+/− | 0 | 28 | 5.4 | 3.5 | ||
| 4 mm-sized polyps | ApcMin/+ | 0 | 17 | 2.3 | 1.0 | 0.448 |
| ApcMin/+;Sf1+/− | 0 | 13 | 2.6 | 1.0 | ||
| 5 mm-sized polyps | ApcMin/+ | 0 | 34 | 2.1 | 0 | 0.729 |
| ApcMin/+;Sf1+/− | 0 | 12 | 1.4 | 0 | ||
| Number of polyps | ApcMin/+ female | 13 | 131 | 58.2 | 55.0 | 0.024 |
| ApcMin/+;Sf1+/−female | 5 | 92 | 41.7 | 39.0 | ||
| Number of polyps | ApcMin/+ male | 5 | 116 | 41.7 | 34.5 | 0.076 |
| ApcMin/+;Sf1+/−male | 0 | 90 | 29.0 | 28.0 | ||
| Number of polyps | ApcMin/+ male | 5 | 116 | 41.7 | 34.5 | 0.013 |
| ApcMin/+ female | 13 | 131 | 58.2 | 55.0 | ||
| Number of polyps | ApcMin/+;Sf1+/−male | 0 | 90 | 29.0 | 28.0 | 0.026 |
| ApcMin/+;Sf1+/−female | 5 | 92 | 41.7 | 39.0 | ||
| Number of polyps | WT (Sf1+/+) | 0 | 7 | 1.0 | 0 | 0.974 |
| Sf1+/− | 0 | 7 | 0.9 | 0 | ||
| Number of polyps | ApcMin/+ | 5 | 131 | 50.7 | 44.0 | 0 |
| 1 Control | 0 | 7 | 1.0 | 0 | ||
| Number of polyps | ApcMin/+;Sf1+/− | 0 | 92 | 35.6 | 32.0 | 0 |
| 1 Control | 0 | 7 | 1.0 | 0 |
| Cohort Genotype | N | No. with 0 Polyps | No. with 1 to 7 Polyps |
|---|---|---|---|
| Sf1+/− | 22 | 14 | 8 |
| WT (Sf1+/+) | 17 | 11 | 6 |
| (a) | |||||||||||||
| Percentile | A | AS | A 1 | AS 1 | A 2 | AS 2 | A 3 | AS 3 | A 4 | AS 4 | A 5 | AS 5 | |
| Min | 5.0 | 0 | 0 | 0 | 1 | 0 | 0 | 0 | 0 | 0 | 0 | 0 | |
| 25 | 31.0 | 22.0 | 3.0 | 2.0 | 11.5 | 5.0 | 2.0 | 1.0 | 0 | 0 | 0 | 0 | |
| 50 | 44.0 | 32.0 | 18.0 | 7.5 | 20.0 | 11.0 | 4.0 | 3.5 | 1.0 | 1.0 | 0 | 0 | |
| 75 | 67.5 | 40.8 | 31.5 | 19.8 | 27.5 | 18.5 | 9.0 | 8.0 | 2.5 | 4.0 | 2.0 | 2.5 | |
| Max | 131.0 | 92.0 | 71.0 | 57.0 | 59.0 | 42.0 | 25.0 | 28.0 | 17.0 | 13.0 | 34.0 | 12.0 | |
| (b) | |||||||||||||
| Percentile | A F | AS F | A M | AS M | A M | A F | AS M | AS F | WT | Sf1+/- | A | AS | C |
| Min | 13.0 | 5 | 5 | 0 | 5 | 13.0 | 0 | 5 | 0 | 0 | 5.0 | 0 | 0 |
| 25 | 37.0 | 30.0 | 19.8 | 17.0 | 19.8 | 37.0 | 17.0 | 30.0 | 0 | 0 | 31.0 | 22.0 | 0 |
| 50 | 55.0 | 39.0 | 34.5 | 28.0 | 34.5 | 55.0 | 28.0 | 39.0 | 0 | 0 | 44.0 | 32.0 | 0 |
| 75 | 74.0 | 56.5 | 54.8 | 33.0 | 54.8 | 74.0 | 33.0 | 56.5 | 2.0 | 1.0 | 67.5 | 40.8 | 1.0 |
| Max | 131.0 | 92.0 | 116.0 | 90.0 | 116.0 | 131.0 | 90.0 | 92.0 | 7.0 | 7.0 | 131.0 | 92.0 | 7.0 |
Publisher’s Note: MDPI stays neutral with regard to jurisdictional claims in published maps and institutional affiliations. |
© 2020 by the authors. Licensee MDPI, Basel, Switzerland. This article is an open access article distributed under the terms and conditions of the Creative Commons Attribution (CC BY) license (http://creativecommons.org/licenses/by/4.0/).
Share and Cite
Godavarthi, J.D.; Polk, S.; Nunez, L.; Shivachar, A.; Glenn Griesinger, N.L.; Matin, A. Deficiency of Splicing Factor 1 (SF1) Reduces Intestinal Polyp Incidence in ApcMin/+ Mice. Biology 2020, 9, 398. https://doi.org/10.3390/biology9110398
Godavarthi JD, Polk S, Nunez L, Shivachar A, Glenn Griesinger NL, Matin A. Deficiency of Splicing Factor 1 (SF1) Reduces Intestinal Polyp Incidence in ApcMin/+ Mice. Biology. 2020; 9(11):398. https://doi.org/10.3390/biology9110398
Chicago/Turabian StyleGodavarthi, Jyotsna D., Shahrazad Polk, Lisa Nunez, Amruthesh Shivachar, Nancy L. Glenn Griesinger, and Angabin Matin. 2020. "Deficiency of Splicing Factor 1 (SF1) Reduces Intestinal Polyp Incidence in ApcMin/+ Mice" Biology 9, no. 11: 398. https://doi.org/10.3390/biology9110398
APA StyleGodavarthi, J. D., Polk, S., Nunez, L., Shivachar, A., Glenn Griesinger, N. L., & Matin, A. (2020). Deficiency of Splicing Factor 1 (SF1) Reduces Intestinal Polyp Incidence in ApcMin/+ Mice. Biology, 9(11), 398. https://doi.org/10.3390/biology9110398